expendable countermeasure effectivemess against...
TRANSCRIPT

Expendable Countermeasure Effectiveness against
Imaging Infrared Guided Threats
C. R. Viau
Tactical Technologies Inc., 356 Woodroffe Ave., Ottawa, ON Canada
ABSTRACT
The following investigation evaluated the effectiveness of expendable infrared countermeasures (flares) in the protection
of a fast jet against imaging infrared seekers. The report presents an effectiveness evaluation process and analyzes the
results of Monte Carlo simulation runs. The goal of the investigation was to determine if expendable countermeasures
(specifically spatially distributed flares) could be effective against imaging IR-guided threats.
Keywords: distributed flares, imaging infrared seeker, physics-based simulation, countermeasure effectiveness, missile
1. INTRODUCTION
The use of the infrared (IR) flare has long been the primary countermeasure to protect aircraft and helicopters from IR air
defense systems. The evolution of the IR seeker and its ability to reject flares continually drives the development of
expendable countermeasures and their tactical use. There are currently four generations of IR seekers found in
MANPADS, surface-to-air (SAM) and air-to-air (AAM) IR-guided missiles.
The first two generations of IR seekers (spin-scan, con-scan) generate error control signals using spinning and stationary
reticle principles. These types of seekers are designed to detect and track point-targets. The third generation uses
scanning patterns (typically a rosette pattern) and perhaps multiple detectors to produce a quasi-image of the target and
background. The fourth and latest generation of IR trackers employs a focal plane array of detectors to produce a
complete image of the scene and provides a significant leap-forward in capability over the previous generations. The
imaging seekers are not as commonly found in current conflict areas as the first three generations. However with the
technological advancements of the last decade, they are expected to find their way onto the battlefield in future conflicts.
As a result of the evolving threat, the expendable countermeasure has also seen significant improvements in the type of
material used, spectral coverage, kinematic behavior and deployment tactics. The open-literature1 suggests that the
imaging seeker has made nearly, if not all types of point target flares unsuitable for aerial platform protection. Major
government programs in the field of aerial platform protection discussed in the open-literature favor research and
development of activities related to directional infrared countermeasures (DIRCM) technologies. It is unclear how
countermeasure developers will evolve the flare technology to continue to be effective against the next generation of
(imaging) seekers.
The following report provides a brief description of the evolution of the expendable countermeasure and establishes,
through physics-based simulation, an effectiveness evaluation process for various types of flares (specifically spatially
distributed) in the protection of fast jets from surface-based imaging IR-guided threats. The report presents and
discusses the results of the Monte Carlo simulation runs.
2. BACKGROUND
2.1 Imaging Trackers
The latest generation of IR trackers differentiates itself from previous generations by producing a two-dimensional
representation of an IR scene onto a focal plane array (FPA) of detectors. The arrangement of the detectors is typically in

a 2D array of various sizes (128x128, 256x256), but can be also be found in a column or row setting. The latter requires
a scanning mechanism to produce a comparable image to a staring array system. The irradiance of the scene is collected
by the optical aperture and focused onto the detector array, which in turn converts the IR energy into electrical signals.
The variation in the detected power from each of the elements of the FPA produces the equivalent of a grey-scale image.
The introduction of the imaging sensor into the missile system has significantly improved the capability and lethality of
the weapon. System designers have integrated into their weapons the research and development efforts from other
industries in the fields of target tracking, image processing and embedded technologies. Available information in the
open-literature identifies two primary types of imaging trackers, the Gated-Video Tracker (GVT) and the Correlation
Tracker2,3,4,5
.
2.1.1 Gated-Video Tracker
GVTs establish a perimeter around a detected target from the observed scene and ignore all changes in the scene outside
of that perimeter. Error signals are generated based on the position of the center of the gate with respect to some point of
reference in the image (i.e. any corner or center of the scene). The gate generator attempts to align the center of the gate
with the center of the sensor's field of view. The generated error signals are proportional to the offset between the gate's
centroid and the sensor's field of view. The shape of the gate can be as simple as a rectangle or it can closely match the
target's contour. The size of the gate is typically determined by locating the outer edges of the target and adding a small
buffer. Numerous algorithms and concepts have been discussed in the open-literature about adaptive gate sizing and
error signal generation. This type of imaging tracker is suitable for low-clutter environments2.
2.1.2 Correlation Tracker
Correlation trackers compare all, or part of a reference image to the presented scene and establish a correlation surface
where the global maximum indicates the location of the best match. An intensity centroid tracker can then be used to
generate error signals with respect to the center of the sensor's field of view. The correlation process can be performed
either in the spatial domain or the frequency domain. There are numerous correlation processes described in the open-
literature each with its best suited applications and short-comings6,7
. The reference image in the correlation process can
be static or dynamically adapted as the sensor approaches its target. This feature of the correlation tracker often makes it
more suitable for terminal homing guidance in missiles and tracking maneuvering land targets in high clutter
environments.
2.2 Flares
The first experiments with pyrotechnic flares to protect aerial platforms from heat seeking missiles were conducted in the
late 1950's1. Flare technology has significantly evolved to keep pace with the ever changing threat. Flares can be
grouped into four application categories.
2.2.1 MTV Flares
Magnesium/Teflon/Viton (MTV) flares have the distinction of burning at very high temperature and reaching their peak
intensity very rapidly. There are two major drawbacks to MTV flares. The first is that upon release they quickly
decelerate and travel in ballistic trajectory away from the aircraft. The second is that in its traditional composition, the
MTV flare's spectral distribution does not match that of a typical aerial target.
2.2.2 Aerodynamic and Propelled Flares
To address the short-comings of the initial MTV flare, manufacturers developed aerodynamic flares which are stabilized
in flight by spring-loaded fins and an aerodynamically shaped cartridge to reduce the drag. The aerodynamic flare
reduced the separation rates of the flare from the aircraft and improved the effectiveness of the countermeasure.
However, advanced seekers could still discriminate aerodynamic flares based on their trajectory. To overcome this,
propelled or thrusted flares were proposed and subsequently developed. Propelled flares generate thrust from the same
chemical process that produces their radiant intensity. Unlike a standard MTV flare, the energy produced by the
chemical process is contained in a burning chamber and released through a nozzle attached to the ejected cartridge.
Similar to a rocket, the propelled flare accelerates after ejection and travels along a trajectory which closely matches that
of the aircraft it is intended to protect.

2.2.3 Spectrally-Matched Flares
Another significant advancement in flare technology has been the ability to tailor the spectral distribution of the burning
flare to match that of the target it is intended to protect. This has been achieved by modifying the chemical composition
of the classical MTV with the main drawback of reducing the total generated radiant intensity1. Another approach to
generating a spectrally matched flare has been the introduction of pyrophoric material. Pyrophoric flares are either
liquid8 or solid based materials and ignite instantly upon contact with air. The radiant intensity produced by pyrophoric-
based flares is generally less than pyrotechnic flares and was originally dependent on the deployment altitude1. The
altitude dependence of the pyrophoric flare has been addressed by combining an oxidizer to the chemical composition.
Liquid pyrophoric flares also have the advantage of generating a much larger radiating area as compared to MTV flares1.
2.2.4 Spatially Distributed Flares
Liquid pyrophoric-based flares inherently produce a distributed or large area flare in the general shape of flame or
plume. Advancements in solid pyrophoric materials have resulted in the production of wafers or packets which are
released in the vortex field behind the aircraft9. As the payload is released, the air-stream builds up a large radiating
cloud. Because of the large surface to volume ratio, these flares decelerate even faster than MTV flares and become
nearly static radiating sources (do not follow ballistic trajectory)7. SAAB Group
9, Raytheon
10 and Rheinmetall
Defence11,12
have spatially distributed IR flare dispensers either fielded or in production.
Figure 1 MJU-52/B BOL IR9
2.3 Counter-Countermeasures
Imaging systems can extract much more information from a scene than previous generations of seekers. This inherent
capability has made nearly all existing flare types unsuitable for aerial platform protection against imaging threats. An
imaging seeker using a gated-video tracker ignores the presence of point source flares as they are most-likely deployed
outside of the gated perimeter. A correlation tracker is also immune to point source flares by discriminating its size,
shape and aspect ratio4. Most 2
nd and 3
rd generations seekers (and likely 4
th generation imaging sensors) are equipped
with IR Counter-Countermeasures (IRCCMs) that discriminate between the target and the flares based on their relative
motion, spectral signature and intensity rise-time. Several IRCCM techniques discussed in the open-literature13,14
are
summarized below.
2.3.1 Intensity Rise-Time
The appearance of a flare in the sensor's field of view may cause a sharp intensity change and can be used to identify the
presence of a flare. The intensity of a target gradually increases by a factor of 1/R2 where R is the distance separating the
heat source from the sensor. Flares were originally designed to reach their peak intensity very rapidly in order to
effectively protect aerial targets. Seeker designers have exploited this inherent characteristic of the flare and used it as a
discrimination technique. If a seeker detects a rapid change in intensity, it can trigger the flare-detected flag and respond
appropriately.

2.3.2 Line-of-Sight Rate Change
LOS Rate Change discriminates flares from the target platform based on its motion in the field of view. Standard (non-
propelled) and distributed flares decelerate very rapidly upon deployment. If a seeker locks onto a flare, a rapid change
in the commanded LOS rates occurs. If the change exceeds a certain threshold, the flare-detected flag is triggered and an
appropriate response is applied to reacquire the true target.
2.3.3 Spectral Distribution Discrimination
Spectral distribution discrimination is commonly referred to as two-color discrimination. Seekers equipped with dual
mode detectors can view a scene in two separate bands of the spectrum. The seeker compares the spectral distribution
ratio of the various targets in the field of view to a predefined threshold. If a target does not meet the two-color ratio
criteria, it is classified as a flare and rejected as the true target. Early generations of flares produced a much different
signature ratio than aircraft plumes and as a result were susceptible to two-color discrimination.
Table 1 illustrates how each flare type could potentially be rejected by one or more forms of IRCCM.
Table 1. Potential IRCCMs used to Reject Existing Flare Types
Flare Type IRCCM
MTV IRC, LRC, 2-Color
Kinetic/aerodynamic IRC, 2-Color
Propelled/thrusted IRC, 2-Color
Spectrally Adapted IRC, LRC
Spatially Distributed LRC
Legend: Intensity Ratio Change (IRC), LOS Rate
Change (LRC), Two-color Discrimination (2-Color).
Flare manufacturers have continuously improved the characteristics of the flares to keep up with the advancements of the
IR-guided threat. The Table 2 illustrates the flare developments as a result of the threat evolution.
Table 2. Threat-Countermeasure Evolution
Threat Countermeasure
Seeker Type Example4,16,17
Flare Type Example15
Spinscan (AM) SA-7, AIM-9B MTV
Pyrotechnic
M206, ARM-001
ConScan (FM) SA-14, AIM-9L, SA-16 Kinematic,
Propelled
ARM-031, MJU-47/B, MJU-71/B
Rosette, Cross Array SA-18, AA-11 Spectrally
Adapted,
Spatially
Distributed
MJU-59/B, M212, BIRDIE 118-
218, Commet, MJU-52/B BOL IR,
MJU-5130/B, Irradon, Cirrus 118
Imaging Tracker Mistral 2, IR MICA,
AIM-9X
No information available
2.4 Flare Effectiveness Analysis
The following image sequences were generated using TTI's TESS physics-based simulator and illustrate the deployment
and rejection process for point target and spatially distributed flares.
2.4.1 Point Target
The following image sequence illustrates a typical point target flare deployment from a fast jet as seen from an
approaching threat. It can be observed that the shape, size and motion of the flare are easily differentiated from the target
aircraft.
Figure 2 Point Target Flare Deployment
In this engagement, the Intensity Ratio Change IRCCM technique described above was applied and resulted in the
identification and rejection of the flares. The figure below shows the sensor view after processing by the target tracker
and the IRCCM algorithm. The red box represents the current tracked object. The green boxes represent all the detected
objects. The blue boxes represent objects identified as a possible flare. In this sequence, it can observed that as the flares
are ejected, new objects appear in the sensor's field of view and when the intensity ratio between the new object and the
main target exceeds the user-defined threshold, the algorithm classifies that object as a potential flare. In the last image,
all flares have been rejected and the tracking point is returned to the target platform.
Figure 3 Intensity Ratio Change Processing
The flare rejection process can also be observed in the Intensity Ratio Change Scope in Figure 4. The flares were
rejected as they crossed the user-defined threshold (yellow trace) of 3. Note the threshold could have been set possibly as
high as 6 and still successfully rejected all the flares. The Seeker Elevation and Azimuth scope show that each flare (blue
trace) initially captured the seeker's track point (red trace) before the IRCCM algorithm rejected it and returned it to the
Target Platform (yellow trace).
Figure 4 IRCCM and Seeker Az/El Rates Scopes
2.4.2 Spatially Distributed Flares
The following image sequence illustrates the deployment of spatially distributed flare as seen by an approaching imaging
sensor. Similar to the point target flare, the distributed flare decelerates and moves out of the sensor's field of view very
rapidly.
Figure 5 Spatially Distributed Flare Deployment
In this engagement, an imaging seeker could potentially reject the distributed flare based on the LOS Rate Change
IRCCM discussed in the previous section. The rejection sequence is illustrated in the figure below. It can be observed in
image sequence #2 of Figure 6 that when the flare is deployed, the tracker cannot distinguish between the two objects as
they are slightly overlaid on top of each other. This results in a change in size and aspect ratio of the tracked object.
When the flare separates from the main target, the IRCCM processor evaluates the azimuth and elevation separation
rates. In Figure 7, the azimuth and elevation rate thresholds were set to 0.2 deg/s (yellow trace) and the flare reached an
azimuth separation rate of nearly 1.6 deg/s while the elevation rate did not reach the threshold. In image sequence #3 of
Figure 6, the flare was identified (blue trace), the track point returned to the target platform (red trace).
Figure 6 LOS Rate Change Processing
Figure 7 LOS Rate Change IRCCM Scopes

3. PROBLEM STATEMENT
The introduction of the imaging seeker has facilitated the rejection and discrimination traditional flares using advanced
image processing, pattern recognition and target tracking algorithms. Although spatially distributed flares decelerate
very rapidly, do not follow a typical aircraft trajectory and generate a radiant intensity of much shorter duration than
point target flares, it is believed that they demonstrate the best potential in protecting fast jets from imaging based
trackers in the late stages of an engagement.
The goal of this investigation was to determine if a series of spatially distributed flares could effectively protect fast jets
from surface-based imaging missiles.
From the Flare Effectiveness Analysis above, it can be observed that a flare deployment at nearly all bore-sight angles
results in the discrimination of the flare from the main target due to its size, motion and/or intensity. In order to interfere
with the tracking process of the imaging seeker, a flare should either (1) change the size and/or the aspect ratio of the
tracking gate set on the outer perimeter of the target, or (2) change or mask the appearance of the target long enough to
introduce tracking errors. The deployment of distributed flares in conjunction with a series of maneuvers could be used
to create a partial obstruction in the imaging sensor's field of view and allow the target to perform evasive maneuvers
while concealed behind the distributed flares.
This approach is analogous to naval and land platform protection where the fire control computer attempts to position the
IR flares or obscurant clouds in the field of view of the approaching threat to conceal the target's exact position and
motion. However, this is much more difficult to achieve in a surface-to-air (SAM) engagement than in a naval or land
engagement. The aircraft does not have the ability to strategically position the flares due to its high velocity. Distributed
flares are typically released in the air-stream directly behind the aircraft.
The ideal scenario would involve a tail-chase engagement geometry where a series of distributed flares were deployed to
obstruct the view of the incoming threat and allowed the aircraft to safely maneuver away while concealed behind the
flare curtain.
Figure 8 Ideal Engagement Geometry
It is well understood that achieving the ideal engagement geometry is nearly impossible due to numerous factors such as
availability and accuracy of a missile approach warning systems (MAWS), threat angle of arrival, limited threat ranging
information and the typical short duration of SAM engagements.
Timing of the flare deployment is also of importance. Distributed flares deployed very early in an engagement may hide
the target for some short period of time. While still in the field of view of the imaging sensor, the aircraft will most-likely
emerge from behind the flare and be reacquired by the seeker. Conversely, if a series of flares are deployed too late in an
engagement, the aircraft may not be able to maneuver out of the imaging sensor's field of view.
The following section describes the analysis process used to establish an effectiveness region where distributed flares
could be deployed to maximize the survivability of the target aircraft.

4. ENGAGEMENT SETUP
4.1 Simulation Assumptions
It is understood that an attack on a fast jet from a SAM threat can occur from 360° around an aircraft flying at various
altitudes. The analysis focuses on the end-game portion of the engagement, and makes the following assumptions:
the Target is a generic fast jet flying at a constant velocity of 250 m/s;
the Threat is modeled as a next generation man-portable shoulder launched missile equipped with an imaging
seeker flying at a constant velocity of 550 m/s;
the simulation focuses on the last kilometer of an engagement;
the aircraft successfully oriented itself in a tail-chase geometry during the initial part of the engagement (not
simulated);
the Threat orientation and range with respect to the Target is randomly generated using a uniform distribution;
the imaging seeker is locked-on to the Target at the start of each engagement;
the imaging seeker has the ability to reacquire the Target if it emerges from behind a “curtain” of flares; and
the flares are used to obstruct the view of the imaging seeker and not lure the Threat away from the Target.
The IR signature of the Target was significantly greater than the spatially distributed flares. This assumption was made
to give the advantage to the imaging seeker such that if the Target emerged from behind a series of flares, it would be
identified and tracked. This assumption was made to emulate a correlation tracker in the simulation.
4.2 Parameter Variation
The Monte Carlo analysis simulated nearly 1000 runs. Each engagement started with the Threat missile initially located
within the 3D cone defined by a 45° spread in both azimuth and elevation. The flare deployment range was varied from
200 to 950 m from the Threat. It was assumed the symmetry of the engagement in the horizontal plane would produce
the same results; therefore the azimuth variation was limited to 135°-180° with respect to the aircraft heading.
Figure 9 Engagement Geometry Variation
In the first batch run, the aircraft did not perform any evasive maneuvers. In the second batch run, the aircraft performs a
9 g maneuver in the vertical. The results of the two batch runs were compared to determine if an evasive maneuver
increased the survivability of the platform.
4.2.1 Target Platform
There are over 30 parameters and lookup tables characterizing the size, shape, position, motion and IR signature of the
Target Platform and the Engine Plume. Table 3 summarizes the relevant parameters for the study:

Table 3. Target Platform Parameters
Parameter Value
Platform Type Fast Jet
Length 14 m
Wing span 9 m
Velocity 250 m/s
Maneuver Time 0.1 sec after the depl. of the last flare
Normal Acceleration 9 g
4.2.2 Spatially Distributed Flares
There are over 30 parameters describing the shape, size, motion and IR signature of the Distributed Flare. Table 4
summarizes the relevant IR Flare parameters:
Table 4. Flare Parameters
Parameter Value
[Width Length Height] [6 15 3] m
Growth Time Constant 0.1 sec
Sustain Time 2 sec
Decay Time Constant 0.1 sec
Deceleration Time Constant 0.1 m/s
Decent Rate 0.1 m/s
Deployment Timing [0 0.1 0.2 0.3] sec after the threat reaches the deploy range
4.2.3 Threat System
There are over 60 parameters and lookup tables characterizing the Threat System (Launch Platform, Airframe and
Imaging Seeker). Table 4 summarizes the relevant Threat parameters:
Table 4. Threat Parameters
Parameter Value
Servo Bandwidths 5 Hz
Gimbal Limits 60 deg
Field of View 4 deg
Detector Array 128x128
Detector Sampling Rate 200 Hz
IRCCMs None – disabled
Length 1.45 m
Diameter 0.1 m
Wing Span 0.17 m
Mass 9.2 kg
Prop. Nav. Coef. 3
Max. Acceleration 30 g

The Imaging Seeker model used for this analysis is a variant of a GVT. The Seeker model processes the output of an IR
Scene Generator and produces line-of-sight (LOS) error signals for further processing by the other Missile subsystems.
1
Airfram eM ode
Contro l ler
Angle
Contro l ler
T arget
Discrim inator
T hreshold &
Norm al ize
Autom atic
Gain
Contro l
Angle
Errors
1
IR Scene
Generator
Figure 10 Seeker Model
An Automatic Gain Control subsystem prevents pixel saturation and increases the contrast of the scene. The
Normalize and Threshold subsystem converts the pixel array values from 0 to 255 into intensity values between 0 and 1.
The subsystem computes the average intensity in each frame and uses this value as a threshold to convert the IR scene
into a binary image.
The binary pixel map is then passed to a “blob” analyzer function in the Target Discriminator subsystem. This function
groups all adjacent lit pixels into blobs or potential targets. It provides several key parameters for each target such as the
centroid location, total area, the coordinates of the four corners outlining the perimeter, a label map correlating each
pixel in the image to a specific target and the total number of targets detected. These four target parameters are used in a
target discrimination algorithm to establish a track database. The track database contains historical data of the peak
intensity, the total intensity, vertical and horizontal position and velocity, estimates of next position and velocity and
target size. From the track database and the user-defined Target Discrimination technique, the algorithm identifies and
tracks the best-matched target. If one or more the IRCCMs are activated, the algorithm looks at the historical behavior of
individual tracks and rejects targets which exceed the associated user-defined thresholds.
Once the Target Discriminator function has identified a target, the location of the target's centroid is passed to the Angle
Error subsystem to generate an error signal proportional to the offset between the centroid of the target and the center of
the sensor's field of view. Finally the error signal is sent to the Angle Controller where a servo subsystem converts the
error signal into line-of-sight rates for the Missile Guidance subsystem.
4.2.4 Measures of Effectiveness
The simulation computes a point of closest approach (miss distance) for every engagement. Based on user-defined
parameters, a probability of kill and survival are also generated. The Monte Carlo results analyzed in the next section
were generated using the flare deployment range, threat position at the time of deployment, and the miss distance. The
goal of the simulation analysis was to generate the largest possible miss distance for every engagement.
5. SIMULATION RESULTS
5.1 Monte Carlo Simulation Results – No Evasive Maneuver
Figure 11 and Figure 12 illustrate the miss distance as a function of the deployment range and threat angle of arrival with
respect to the aircraft’s heading in the horizontal and vertical planes. Each point represents the threat’s position with
respect to the aircraft at the time the deployment sequence was initiated. The miss distance is color coded. The smaller
miss distances are in the warmer (red) portion of the spectrum and the larger miss distances are in the cooler (blue)
portion of the spectrum. The azimuth angle of arrival was varied between 135° and 180° from run to run. The results
were mirrored about the 180° axis to obtain Figure 11.
Figure 11 Miss Distance Horizontal Plane - No Maneuver
Figure 12 Miss Distance Vertical Plan - No Maneuver
There appears to be a conic region with a 30° (±15° around the 180° axis) spread in the horizontal plane and a 20° spread
below the longitudinal axis of the aircraft where the deployment of distributed flares generated miss distances over 50 m.
The results suggest that the further outside (in angle and in range) of this cone region the threat is located when the
deployment sequence is initiated, the less effective the distributed flares are. Section 5.3 describes the tracking events of
individual runs located inside and outside of the effectiveness cone.
5.2 Monte Carlo Simulation Results – With Evasive Maneuvers
A second batch of simulation runs were performed under the exact same conditions with the addition of an evasive pull-
up maneuver of 9 g for 2 seconds. The evasive maneuver was automatically initiated once the last flare in the sequence
was dispensed. Figure 13 and Figure 14 illustrate the results of the Monte Carlo runs. The result of the first batch run
(without evasive maneuvers section 5.1) showed an effectiveness region bounded by ±15° in azimuth and 0 to -20° in
elevation. The emphasis of the second batch was on this effectiveness region and can be observed by the high density of
points in the region.
Figure 13 Miss Distance Horizontal Plane - With Pull-up Maneuver
Figure 14 Miss Distance Vertical Plan - With Pull-up Maneuver
The results differ when a pull-up maneuver is performed. Unlike the results of the first batch run, the maneuver appears
to shift the effectiveness region over in azimuth and elevation by approximately ±5°. The extent of the effectiveness

cone is unknown at this time as additional runs are required. It is believed that the addition of an evasive maneuver
following the flare deployment sequence could add another 5° to 10° to the overall effectiveness region.
5.3 Individual Simulation Results
Figure 15 illustrates the flare deployment sequence without an evasive maneuver when the threat is located inside the
effectiveness region. As previously stated in section 4.1, it is assumed that the aircraft re-oriented itself into tail-chase
engagement geometry with the incoming threat. As can be seen in this sequence, as the missile approached the target,
the blooming distributed flares took up a larger portion of the sensor’s field of view. Eventually the flares took all of the
field of view, temporarily hiding the position of the target. Depending on the angle of arrival, the missile may fly
through the flare and when it emerges on the other side, the aircraft was no longer in the field of view. However, if the
angle of arrival was too close to the longitudinal axis of the aircraft (i.e. the 180° axis in the horizontal plane and the 0°
axis in the vertical plane), the missile reacquired the target once it emerged on the other side of the flare. This is
illustrated in Figure 11 and Figure 12 by the red points located within a few degrees of the 180°/0° axis.
Figure 15 Typical Flare Deployment within the Effectiveness Region
Figure 16 demonstrates an engagement outside (in range) of the effectiveness region (approx. 1300 m). As can be seen
in this sequence, the flares were deployed too early and the aircraft emerged from behind the cover of the flares. In this
engagement, the missile successfully re-acquired and tracked the aircraft until end game.
Figure 16 Typical Flare Deployment Outside (in Range) of the Effectiveness Region
Figure 17 demonstrates a binary processor view of a typical deployment sequence outside of the effectiveness region.
The deployment range was approximately 700 m and the angle of arrival of the threat at the time of deployment was
approximately 160° with respect to the aircraft’s heading. As can be seen in the sequence, the blooming flare widens the
tracking gate but eventually separates itself from the platform. This results in two distinct objects in the field of view.
At that point the tracking algorithm reacquires the true target and tracks it until end game. It can be argued that the gate-
widening in this scenario may have resulted in a break lock in certain types of gated-video trackers. Conversely, a
correlation tracker probably would not have had any difficulties reacquiring based on the distinct available target
features.

Figure 17 Typical Flare Deployment Outside (in Azimuth) of the Effectiveness Range
Figure 18 demonstrates a binary processor view of a typical deployment sequence outside of the effectiveness region.
The deployment range was approximately 700 m and the angle of arrival of the threat at the time of deployment was
approximately -30° with respect to the aircraft’s longitudinal axis. Similar to the previous engagement, the distributed
flares are released and create an elongated cloud which nearly stretches out the gated area to the limits of the field of
view. When the separation distance between the flares and the target is large enough, two distinct objects appear in the
field of view. The tracking algorithm reacquires the target and tracks it until end game.
Figure 18 Typical Flare Deployment Outside (in Elevation) of the Effectiveness Range
In the previous two described scenarios, the deployment of distributed flares in four rapid bursts resulted in an elongate
radiating cloud. As seen in the previous sequences, the cloud appeared as a single entity attached to the aircraft. Figure
19 shows an engagement where the flares stretched out the gated area (red perimeter) to the limits of the field of view
and caused a break lock. The centroid of the tracking gate was no longer over the aircraft but instead over some
arbitrary location behind the aircraft. Again, it can be argued that this may or may not have caused a break lock in a
correlation tracker since the appearance of the target aircraft changed significantly during the last part of the engagement.
Figure 19 Disruption of the Tracking Gate
Figure 20 demonstrates a deployment sequence performed inside the effectiveness region followed by a pull-up evasive
maneuver. The threat was located at the time of deployment 450 m behind the target with an angle of arrival of 180° in
azimuth with respect to the target’s heading and -5° in elevation with respect to the target’s longitudinal axis. This
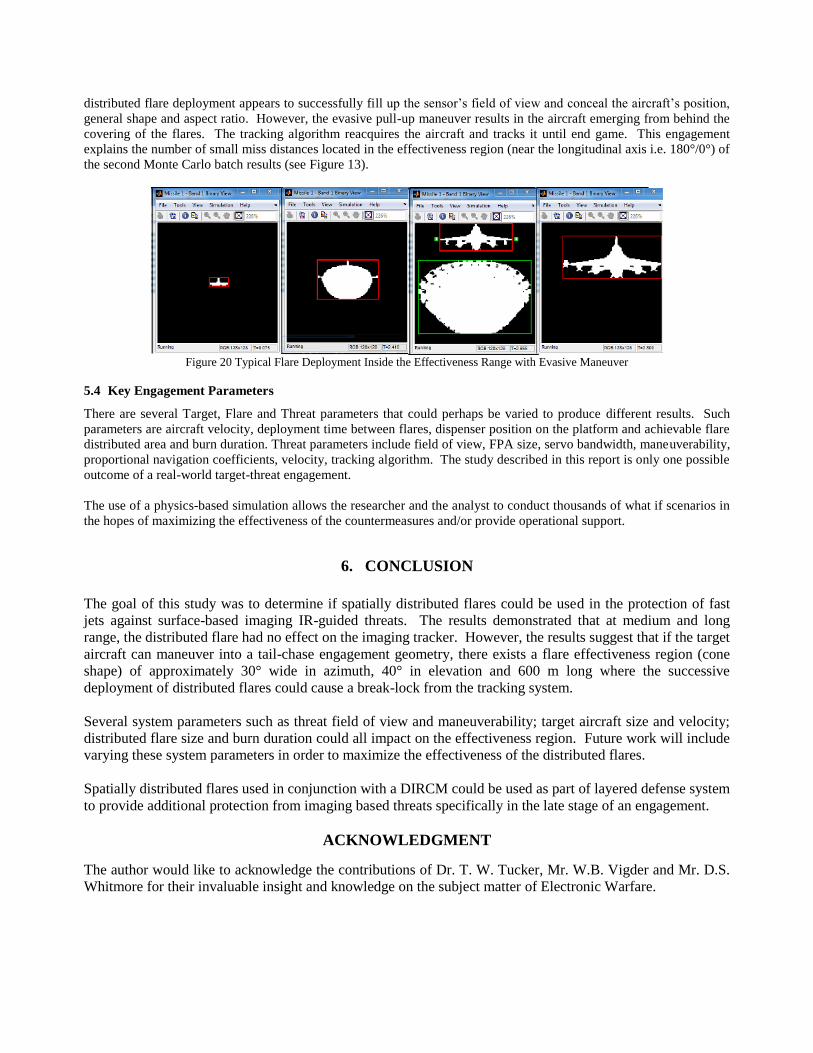
distributed flare deployment appears to successfully fill up the sensor’s field of view and conceal the aircraft’s position,
general shape and aspect ratio. However, the evasive pull-up maneuver results in the aircraft emerging from behind the
covering of the flares. The tracking algorithm reacquires the aircraft and tracks it until end game. This engagement
explains the number of small miss distances located in the effectiveness region (near the longitudinal axis i.e. 180°/0°) of
the second Monte Carlo batch results (see Figure 13).
Figure 20 Typical Flare Deployment Inside the Effectiveness Range with Evasive Maneuver
5.4 Key Engagement Parameters
There are several Target, Flare and Threat parameters that could perhaps be varied to produce different results. Such
parameters are aircraft velocity, deployment time between flares, dispenser position on the platform and achievable flare
distributed area and burn duration. Threat parameters include field of view, FPA size, servo bandwidth, maneuverability,
proportional navigation coefficients, velocity, tracking algorithm. The study described in this report is only one possible
outcome of a real-world target-threat engagement.
The use of a physics-based simulation allows the researcher and the analyst to conduct thousands of what if scenarios in
the hopes of maximizing the effectiveness of the countermeasures and/or provide operational support.
6. CONCLUSION
The goal of this study was to determine if spatially distributed flares could be used in the protection of fast
jets against surface-based imaging IR-guided threats. The results demonstrated that at medium and long
range, the distributed flare had no effect on the imaging tracker. However, the results suggest that if the target
aircraft can maneuver into a tail-chase engagement geometry, there exists a flare effectiveness region (cone
shape) of approximately 30° wide in azimuth, 40° in elevation and 600 m long where the successive
deployment of distributed flares could cause a break-lock from the tracking system.
Several system parameters such as threat field of view and maneuverability; target aircraft size and velocity;
distributed flare size and burn duration could all impact on the effectiveness region. Future work will include
varying these system parameters in order to maximize the effectiveness of the distributed flares.
Spatially distributed flares used in conjunction with a DIRCM could be used as part of layered defense system
to provide additional protection from imaging based threats specifically in the late stage of an engagement.
ACKNOWLEDGMENT
The author would like to acknowledge the contributions of Dr. T. W. Tucker, Mr. W.B. Vigder and Mr. D.S.
Whitmore for their invaluable insight and knowledge on the subject matter of Electronic Warfare.

REFERENCES
[1] E.-C. Koch, “Review on Pyrotechnic Aerial Infrared Flares”, Propellants, Explosives, Pyrotechnics 26, 3- 11,
WILEY-VCH, 2001
[2] W. L. Wolfe, G. J. Zissis, The Infrared Handbook, ERIM, 1989
[3] M. C. Dudzik, The Infrared & Electro-Optical Systems Handbook, Volume 4 Electro-Optical Systems Design,
Analysis, and Testing, ERIM-SPIE Press, 1993
[4] G. Labonté, W.C. Deck, “Infrared Target-Flare Discrimination using a ZISC Hardware Neural Network”, Dept.
Of Mathematics and Computer Science, Royal Military College of Canada
[5] S. Baqar, “Low-Cost PC-Based High-Fidelity Infrared Signature Modelling and Simulation”, Dept. of Aerospace,
Power and Sensors, Defence College of Management and Technology Cranfield Universtiy, 2007
[6] S. Wong, “Advanced Correlation Tracking of Objects in Cluttered Imagery”, Acquisition, Tracking, and Pointing
XIX, SPIE 2005
[7] T.L.P. Olson, C.W. Sanford, “A Real-Time Multistage IR Image-Based Tracker”, Acquisition, Tracking, and
Pointing XIII, SPIE 1999
[8] Pyrophoric IR Flare Flares, DRDC Valcartier, Canada, www.valcartier.drdc-rddc.gc.ca/sciences/pyrophor ft-fs-
eng.pdf, (last visit on 29 November 2011).
[9] BOL Ensuring Mission Success for F/A-18, SAAB Group, www.saabgroup.com/Global/Documents%20and
%20Images/Air/Electronic%20Warfare%20Solutions/BOL/BOL%20F-18%20product%20sheet.pdf, (last visit on
29 November 2011)
[10] Comet Infrared Countermeasure Pod, Raytheon, www.raytheon.com/capabilities/products/comet/ (last visit on 29
November 2011)
[11] Irradon, Rheinmetall Defence, www.rheinmetall-defence.com/index.php?fid=1621&lang=3 (last visit on 29
November 2011)
[12] Cirrus 118, Rheinmetall Defence, www.rheinmetall-defence.com/index.php?fid=1621&lang=3 (last visit on 29
November 2011)
[13] E.-C. Koch, “Pyrotechnic Countermeasures: II. Advanced Aerial Infrared Countermeasures”, Propellants,
Explosives, Pyrotechnics 31, No. 1, WILEY-VCH, 2006
[14] D.P. Forrai, J.J. Maier, “Generic Models in the Advanced IRCM Assessment Model”, Winter Simulation
Conference, 2001
[15] Technology Survey – Airborne Dispensers and IR Expendables, Journal of Electronic Defense, June 2011
[16] VL MICA Datasheet, MBDA Missile Systems, www.mbda-systems.com/ products/gbad/vl-mica/8-4/ (last visit 29
Nov 11)
[17] Mistral Datasheet, MBDA Missile Systems, www.mbda-systems.com/ mediagallery/files/vl_mica_land_ds.pdf
(last visit 29 Nov 11)