expenditure patterns of cash-for-work versus non cash-for-work
TRANSCRIPT

Expenditure Patterns of Cash-for-Work versus Non Cash-for-Work
Households within a Food Security Context
Document: June 2011
Data Collection: March 2011
ACTED Sri Lanka Country Office: 146, Reid Avenue, Colombo 04, Sri Lanka
Phone : + 94 11 2502743 Fax: +94 11 4512976 Email: [email protected] Web site: www.acted.org
Page | 2
Expenditure Patterns of Cash-for-Work versus Non Cash-for-Work Households within a Food Security Context June 2011
TABLE OF CONTENTS
TABLE OF CONTENTS ............................................................................................................................... 2
1. SUMMARY ........................................................................................................................................... 3
2. BACKGROUND ..................................................................................................................................... 4
2.1 Project Overview ........................................................................................................................... 4
2.2 Background to the Study ............................................................................................................... 4
2.3 Assessment Objectives.................................................................................................................. 4
2.4 Methodology ................................................................................................................................. 5
2.4.1. Survey .................................................................................................................................... 5
2.4.2 Qualitative Methods .............................................................................................................. 6
2.5. Limitations.................................................................................................................................... 6
3. KEY FINDINGS ...................................................................................................................................... 7
3.1 Source of Family Income ............................................................................................................... 7
3.2 Children in Respondent Families – Basic Facts ............................................................................. 8
3.3 Expenditure and Food Consumption Patterns .............................................................................. 8
3.3.1 Expenditure Patterns among the recipients of CFW assistance ............................................ 8
3.3.2 Comparison of Expenditures patterns between CFW Recipient and Non-Recipient Families
...................................................................................................................................................... 11
3.3.3. Influence of WFP Rations on Family Food Expenditures ................................................... 15
4. CONCLUSIONS ................................................................................................................................... 18

Page | 3
Expenditure Patterns of Cash-for-Work versus Non Cash-for-Work Households within a Food Security Context June 2011
1. SUMMARY
This report is the result of a household spending survey conducted within the framework of a USAID-
funded Cash-for-Work (CFW) project.1 The project was implemented by the Agency for Technical
Cooperation and Development (ACTED) and People in Need (PIN) between July 2010 and March
2011 in Madhu, Mannar Town, Musali DS Divisions (Mannar District), Maritimepattu DS Division
(Mullaitivu District) and Karachchi DS Division (Kilinochchi District). The project targeted 7,000
households with cash transfers of 30,000 LKR.
The assessment focused on identifying the expenditure patterns as well as food consumption patterns
of CFW and non-CFW households. Furthermore, the assessment aimed to establish how households
have used their additional income from CFW. Finally, the assessment looked at whether and how
spending patterns on food were influenced by WFP rations.
The results of the survey clearly indicate that the majority of participants used a significant part of their
earned cash for purchasing food items. Nearly 70% of the beneficiaries have spent in total 16,000-
28,000 LKR of the CFW earnings on purchasing food. This sum represents one half or more of the
income earned through CFW. One of the key assessment findings is that apart from food
consumption, people use the CFW money on basic items that are needed to survive and protect
livelihoods.
The timing of the CFW intervention is crucial for maximizing its effectiveness. Attention must be given
to the agricultural calendar. Cash is most effective when payments coincide with the two harvest
seasons
The findings further suggest that the WFP rations helped to reduce household’s spending on essential
food items. It also appears that the combination of CFW and WFP rations enables households
to invest more into their medium term food security and reduce indebtedness than if each of
these assistance measures is used alone, or if none is available.
In order to understand the longer term impact of the CFW program on asset formation in beneficiary
households and its effects on household food security, it would be useful to conduct a follow-up
assessment in one year time.
1 Disclaimer: This study was made possible by the generous support of the American people through the United
States Agency for International Development (USAID). The contents are the responsibility of ACTED and PIN and do not necessarily reflect the views of USAID or the United States Government.
Page | 4
Expenditure Patterns of Cash-for-Work versus Non Cash-for-Work Households within a Food Security Context June 2011
2. BACKGROUND
2.1 Project Overview
This report is the result of a household spending survey conducted within the framework of a USAID-
funded Cash-for-Work (CFW) project. The project was implemented by the Agency for Technical
Cooperation and Development (ACTED) and People in Need (PIN) between July 2010 and March
2011 in Mannar, Kilinochchi and Mullaitivu Districts. The project targeted 7,000 households with cash
transfers of 30,000 LKR. CFW was used as it offers beneficiaries the most flexibility in the usage of
their earnings, and empowers them to identify and meet their most pressing needs, including the
purchase of livelihood assets which will pave the way for sustainable recovery. And, by directly
injecting cash into return areas, CFW is an effective way to strengthen the recovery of free local
market mechanisms, thus jumpstarting the local economy. Traditional commodity distributions often
bypass local markets, thereby marginalizing area merchants and significantly distorting local
economies. However, this project was designed to increase the purchasing power of returnees, who
can then utilize local markets for needed goods. CFW was also a methodology through which a
variety of other objectives were achieved. For example, the rehabilitation of productive assets and
infrastructure, such as paddy fields, irrigation canals, water tanks and agricultural roads will pave the
way for the recovery of sustainable food security in the area. The clearing operations will increase the
available agriculture land, providing livelihood means for additional farming families and raising overall
food production in the region. Likewise, the rehabilitation of irrigation infrastructure will increase
agriculture productivity, in particular that of paddy, and possibly allow for a second harvest each year.
As such CFW was intended not only to increase the purchasing power of beneficiaries which will allow
them to respond to their households’ immediate but also longer-term needs and jumpstart economic
activity in the target area, but will also provide long term food security as a food security supportive
framework of productive infrastructure and assets was created through the rehabilitation of agricultural
land, irrigation canals, water tanks and agricultural roads.
2.2 Background to the Study All ACTED countries comprise of an independent Appraisal, Monitoring and Evaluation Unit (AMEU),
which reports directly to the Country Director. The AMEU is responsible for pre-project assessments,
monitoring (input, process and output) and qualitative evaluation of completed projects. Accordingly,
this assessment was designed and conducted by ACTED AMEU together with the project partner,
People in Need (PIN).
The main purpose of the assessment is to encourage critical thinking about program design and
delivery, and to enable continuous organizational learning. This brief study strives to reflect on key
issues inherent to program design—whether the action taken has been effective and efficient, and
whether it had any adverse impact on the population that it aimed to serve and/or the larger
community. As such, it contributes towards accountability and transparency of ACTED’s and PIN’s
actions and results.
2.3 Assessment Objectives
The objective of the study has been four-fold:
First, the study aims to explore what are the consumption patterns of families receiving CFW
assistance. In this section, the study attempts to establish whether the income earned through CFW
was utilized in the way the project anticipated—to cover food and other essential items.
Next, the study attempts to compare the consumption patterns of families that received CFW
assistance and those who did not. In this section, the study aims to explore whether the income
earned through CFW did affected household consumption patterns.

Page | 5
Expenditure Patterns of Cash-for-Work versus Non Cash-for-Work Households within a Food Security Context June 2011
Third, it seeks to understand whether the combinations of various interventions (CFW and WFP
rations) had an impact on food and other essential items consumption.
Finally, the study aims to explore whether the food is available and accessible to people of the areas
of intervention. That is, it seeks to understand whether the cash-based intervention was appropriate in
the local context.
2.4 Methodology The assessment utilized both qualitative and quantitative techniques. The key quantitative data were
collected through household survey. These were further complemented with information from
monitoring visits, in depth interviews with the beneficiaries and other stakeholders, and information
arising from focus groups discussions conducted in the area of project implementation.
2.4.1. Survey
The primary quantitative data were collected from respondents using a standardized survey
questionnaire. (Annex 2). The respondents answered the questionnaire in an oral form, and their
responses were recorded by ACTED and PIN monitors and trained temporary enumerators. The data
collection was carried out during the first week of March 2011 in all three districts of project
intervention (Mannar, Mullativu and Kilinochchi).
In order to answer the above discussed research questions, following 5 key sets of variables were
observed:
Household profile and demographic composition of the family
Key economic indicators of the family
The expenditure pattern of families receiving the WFP rations
The expenditure pattern of families enrolled in CFW program
The food expenditure, consumption and availability
In order to be able to explore the difference that CFW made, the sample comprises of CFW recipients
and a control group of non-recipients from the same geographical area. That is, 51% among the total
number of respondents (371) were Cash-for-Work recipients while the other 49% were the control
group, not involved in CFW. Out of the CFW recipients, 92% had received from WFP food rations,
while, for one reason or another, 8% had not received any WFP rations. From the sampled non CFW
respondents, 90% had received WFP food rations. In total, 91% of the respondents had received the
WFP rations.
The following criteria have been considered in deciding the sample size:
Size of the population
Variability of the population
Time feasibility
How precise we want the final estimates to be (margin of error)
The sample size was calculated as follows:
And
Where: Alpha error (α) = 0.05, t statistical value for selected alpha level (t) = 1.96, Margin of error (d)
= 0.05, Maximum possible proportion (p) = 0.5, Minimum sample size (n1) and Population (N) = 11403
n1 = n0 / (1 + n0 / N) n0 = (t)
2 * (p) (1-p) / (d)
2

Page | 6
Expenditure Patterns of Cash-for-Work versus Non Cash-for-Work Households within a Food Security Context June 2011
Taking into account the above cited criteria, the minimum sample size (n1) was computed and taken
as 371. Therefore the sample has been selected as:2
USAID CFW
Recipients
Non-CFW
Recipients Total
ACTED’s area of Intervention
(Mullaitivu, Mannar Districts) 93 92 185
PIN’s area of Intervention
(Kilinochchi District) 93 93 186
Total 371
2.4.2 Qualitative Methods
In order to contextualize the analysis and to understand the views of the respondents, supplementary
information was collected during field monitoring visits, through interviews with beneficiaries and
several focus group discussions. These monitoring missions were undertaken based on a pre-defined
terms-of-reference and a guideline document and it were carried out during as well as after the project
implementation stage. The interviews and focus groups were used to understand how the
respondents understand and interpret certain issues explored as a part of this report.
2.5. Limitations The following limitations need to be considered for this study which may have an impact on the results
and interpretation of the findings:
Small sample part of respondents who did not receive WFP rations.
Income is very sensitive topic and some respondents were hesitant to answer questions
related to money, and their household’s income and expenditure.
Some respondents could not well remember time periods, when CFW payments were made
or WFP rations received, and they found it difficult to recall the exact sums and amounts
received.
2 Alpha error (α) tells us the chance of getting a false positive. An alpha level of 0.05 (5%) has been used since the
survey is more focused in identifying marginal relationships and differences in the population. Also, the margins
of error used for the survey is 0.05 (5%).

Page | 7
Expenditure Patterns of Cash-for-Work versus Non Cash-for-Work Households within a Food Security Context June 2011
3. KEY FINDINGS
3.1 Source of Family Income
More than half of all respondents (60%) were female. Majority of respondents (95%) further reported
to have had at least some primary education.
However, regardless of education of household heads, majority of the respondent families relied on
low and erratic income. In the sample, 89% of respondent families did not have any family member
engaged in a type of work for which a salary or a regular wage was paid. The distribution of reported
main source of family income in the past 3 months reflects the lack of labour market opportunities in
the areas where the CFW was implemented: The largest segment of respondent families (42.8%)
was engaging in irregular, non-skilled labor work. Irregular skilled labor (6.91%), home gardening
(7.18%), small business/self employments (7.73%) and paddy cultivation (6.91%) are the other most
common categories from which families earned some form of income. Notably, 7.73% of the surveyed
families reported to have no source of income at all. Only 3% of respondent families had a family
member engaged in regular salaried employment.
Figure 1: Main source of family income in the 3 months prior to the survey
In covering their essential needs, majority of all respondents benefitted from the WFP assistance. In
total, 91% of the respondents had received the WFP rations. Out of the CFW recipients, 92% had
received from WFP food rations, among the non-CFW respondents, 90% had received WFP food
rations.
Figure 2: Respondent's sex and category

Page | 8
Expenditure Patterns of Cash-for-Work versus Non Cash-for-Work Households within a Food Security Context June 2011
3.2 Children in Respondent Families – Basic Facts In our sample, 59.3% of the surveyed families include at least one child (between age 2-17 years) and
15.6% of families include at least one infant (age less than 2 years). 14.3% of the surveyed families
included a pregnant or lactating mother, and 6.5% of the total surveyed families had a baby born after
the resettlement. Out of them, 16% revealed that the baby was suffering from some complications or
health problem. The common problems mentioned were diarrhea, fever and low weight. At the time of
birth, 17.4% of newborns were found to be underweight, i.e. born with a weight of below 2.5 kilograms
which has been defined by the Ministry of Health as cut off point for being considered underweight.
This figure does not show any significant difference to other parts of Sri Lanka as according to
the Census and Statistics Department, 17% of all newborns in Sri Lanka are found to be born
with a weight of below 2.5 kilograms. Thus, the weight of newborns in the target area is in line
with the national average.
Figure 1: Weight in kg of a newborn
Out of the families who had a baby born after resettlement, 32% of had received assistance like CFW
or food rations at some point during the pregnancy of the mother. However, both CFW and/or WFP
food rations do not seem to have a significant effect on the weight of newborn babies. It seems
that during pregnancy women receive traditionally more food than other household members.
Respondent’s Category Average Weight
of a Newborn (kg)
CFW and Food Ration Recipients 3.1
Only CFW Recipients 3.25
Only Food Ration Recipients 3.3
Non-Food Rations and Non-CFW Recipients 3
Mean Average 3.07
Table 1: Average Weight of a Newborn
3.3 Expenditure and Food Consumption Patterns
3.3.1 Expenditure Patterns among the recipients of CFW assistance
Among the CFW recipients, 75.6% were able to recall how much money they had received under the
USAID-funded program. According to their answers, the families\have received a maximum of 30,000
LKR through the CFW program. The amount varied from family to family since it depended on the
2.5
kg
= c
ut-
off
poin
t
Page | 9
Expenditure Patterns of Cash-for-Work versus Non Cash-for-Work Households within a Food Security Context June 2011
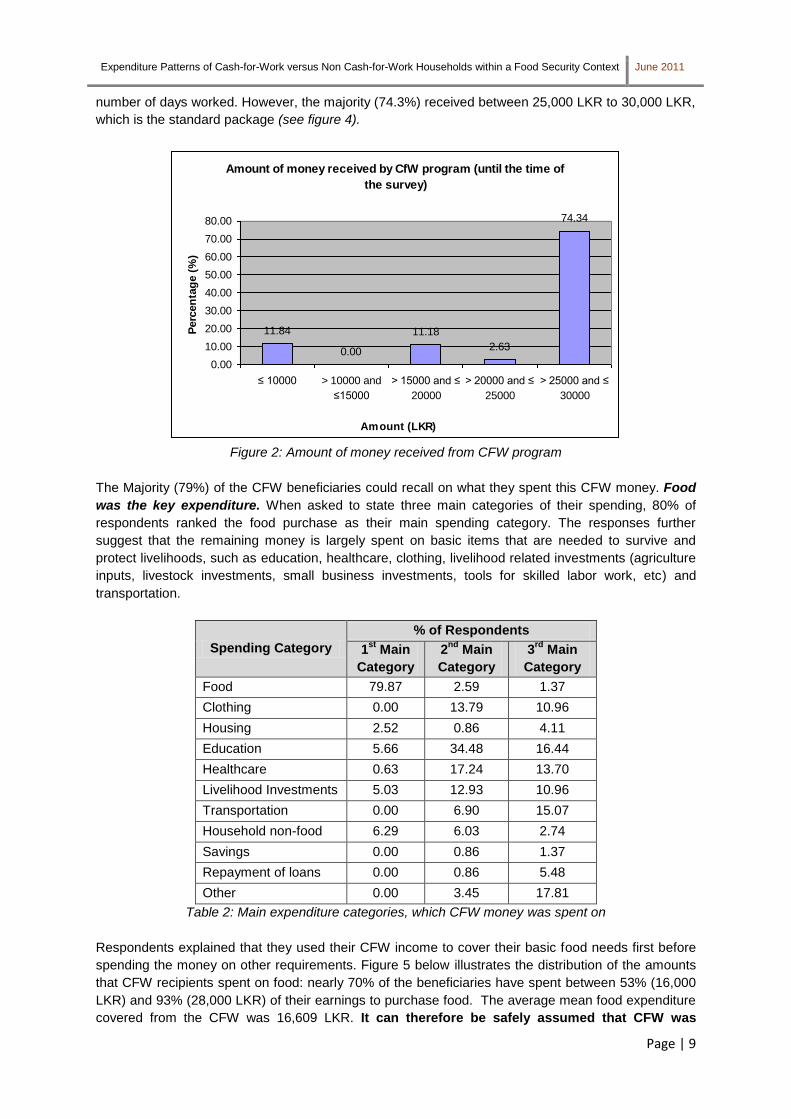
number of days worked. However, the majority (74.3%) received between 25,000 LKR to 30,000 LKR,
which is the standard package (see figure 4).
Figure 2: Amount of money received from CFW program
The Majority (79%) of the CFW beneficiaries could recall on what they spent this CFW money. Food
was the key expenditure. When asked to state three main categories of their spending, 80% of
respondents ranked the food purchase as their main spending category. The responses further
suggest that the remaining money is largely spent on basic items that are needed to survive and
protect livelihoods, such as education, healthcare, clothing, livelihood related investments (agriculture
inputs, livestock investments, small business investments, tools for skilled labor work, etc) and
transportation.
Spending Category
% of Respondents
1st
Main
Category
2nd
Main
Category
3rd
Main
Category
Food 79.87 2.59 1.37
Clothing 0.00 13.79 10.96
Housing 2.52 0.86 4.11
Education 5.66 34.48 16.44
Healthcare 0.63 17.24 13.70
Livelihood Investments 5.03 12.93 10.96
Transportation 0.00 6.90 15.07
Household non-food 6.29 6.03 2.74
Savings 0.00 0.86 1.37
Repayment of loans 0.00 0.86 5.48
Other 0.00 3.45 17.81
Table 2: Main expenditure categories, which CFW money was spent on
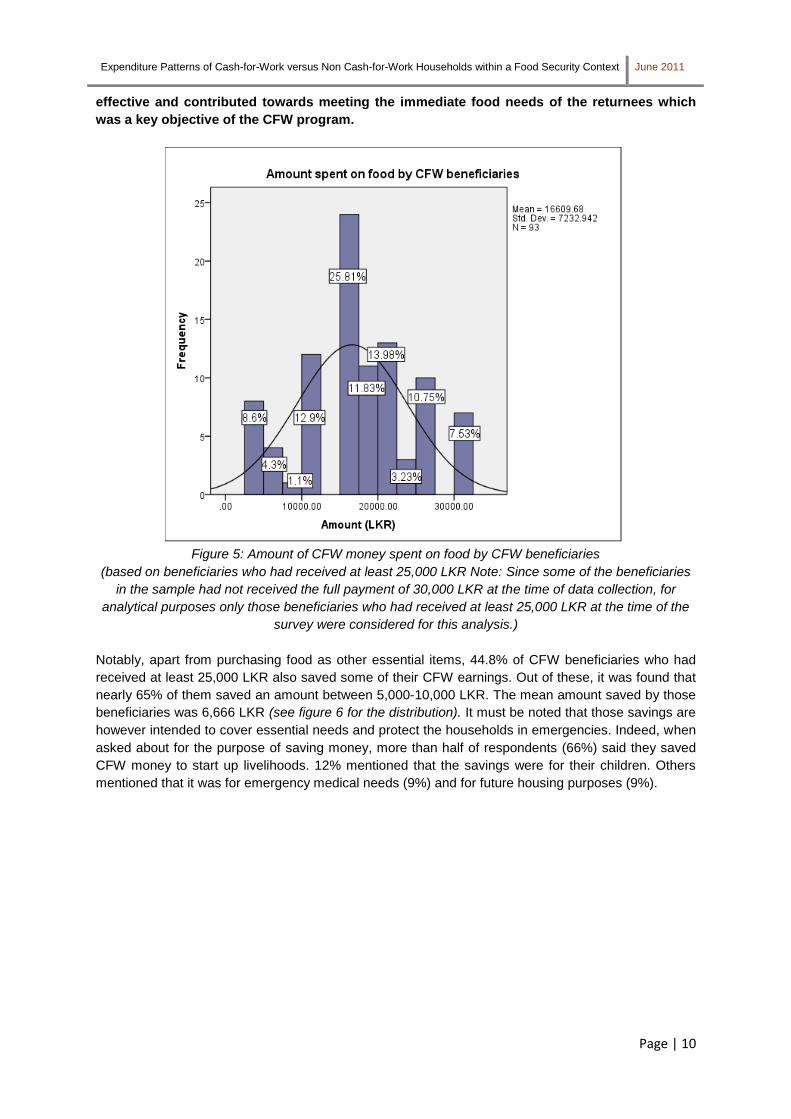
Respondents explained that they used their CFW income to cover their basic food needs first before
spending the money on other requirements. Figure 5 below illustrates the distribution of the amounts
that CFW recipients spent on food: nearly 70% of the beneficiaries have spent between 53% (16,000
LKR) and 93% (28,000 LKR) of their earnings to purchase food. The average mean food expenditure
covered from the CFW was 16,609 LKR. It can therefore be safely assumed that CFW was
Amount of money received by CfW program (until the time of
the survey)
11.84 11.18
2.63
74.34
0.00
0.00
10.00
20.00
30.00
40.00
50.00
60.00
70.00
80.00
≤ 10000 > 10000 and
≤15000
> 15000 and ≤
20000
> 20000 and ≤
25000
> 25000 and ≤
30000
Amount (LKR)
Perc
en
tag
e (
%)
Page | 10
Expenditure Patterns of Cash-for-Work versus Non Cash-for-Work Households within a Food Security Context June 2011
effective and contributed towards meeting the immediate food needs of the returnees which
was a key objective of the CFW program.
Figure 5: Amount of CFW money spent on food by CFW beneficiaries
(based on beneficiaries who had received at least 25,000 LKR Note: Since some of the beneficiaries
in the sample had not received the full payment of 30,000 LKR at the time of data collection, for
analytical purposes only those beneficiaries who had received at least 25,000 LKR at the time of the
survey were considered for this analysis.)
Notably, apart from purchasing food as other essential items, 44.8% of CFW beneficiaries who had
received at least 25,000 LKR also saved some of their CFW earnings. Out of these, it was found that
nearly 65% of them saved an amount between 5,000-10,000 LKR. The mean amount saved by those
beneficiaries was 6,666 LKR (see figure 6 for the distribution). It must be noted that those savings are
however intended to cover essential needs and protect the households in emergencies. Indeed, when
asked about for the purpose of saving money, more than half of respondents (66%) said they saved
CFW money to start up livelihoods. 12% mentioned that the savings were for their children. Others
mentioned that it was for emergency medical needs (9%) and for future housing purposes (9%).

Page | 11
Expenditure Patterns of Cash-for-Work versus Non Cash-for-Work Households within a Food Security Context June 2011
Figure 6: Amount of CFW money saved by CFW beneficiaries
3.3.2 Comparison of Expenditures patterns between CFW Recipient and Non-
Recipient Families
Unsurprisingly, it is not only the CFW families that spend an important part of their family income on
food items. Indeed, 96% of all surveyed families (CFW & non-CFW recipients) stated that their main
monthly expenditure is for food items.
Figure 7: Main monthly family expenditure (inclusive CFW & non-CFW recipients)
A closer look reveals further similarities: The proportion of families that spend on certain items such
as housing, education, healthcare or agriculture is not substantially different between the CFW and
the control group. For example, 75% of CFW families and 74% of families in control group make
monthly expenditure on healthcare. Similarly, 62% families in both groups reported monthly spending
on household non-food items. The majority further cited transportation and clothing as their monthly
expenditure. Also, the type of items that families regularly spend their money on is broadly similar
between the CFW recipients and those families that did not receive CFW assistance. This would
suggest that the families share similar patterns of spending priorities, regardless of the source
and size of the household’s actual income.

Page | 12
Expenditure Patterns of Cash-for-Work versus Non Cash-for-Work Households within a Food Security Context June 2011
Figure 8 : Percentage of Families Spending on Main Expenditure Category
Comparison CFW and Non-CFW
In absolute terms, however, significant differences between CFW recipients and control group arise.
On average, the CFW beneficiary families were able to spend 26 % more on food that the
control group. Importantly, those CFW beneficiary families that reported purchase of clothing
were able to spend on average 58 % more on it than the control group. That means that although
the composition of essential items (i.e. the ―what‖ the families buy) does not differ substantially
between the groups, the volume and perhaps the quality of what they are able to afford (i.e. the
“how much” and “how good” are the consumed goods and services ) has likely substantially
increased with the additional family income from CFW.
Interestingly, of those who managed to make regular monthly savings, the CFW recipient families
reported lesser amount of regular monthly savings than the control group—the control group families
reported 44% higher average monthly saving than the CFW recipients. Further, the non-CFW
families have invested more on small business and agriculture. Possible interpretation is that
the families without CFW assistance spend more to strengthen their sources of future income.
It is important to mention that out of those who undertook to repay their loans in the period covered by
the survey, the CFW recipient families spent on average 46% more than the control group on
repayment of their loans. The issue of loan-taking was not the focus on the current assessment.
However, over the course of data collection, and through qualitative interviews, the problem of re-
payment of loans did surface as a matter of concern that would merit further exploration. The
qualitative interviews and focus groups conducted in Kilinochchi and Mullaitivu reveal that after
depleting their remaining assets, people increasingly resort to measures such as selling most
treasured personal items (jewelry etc) and also buy food and essential items on credit. That would
perhaps partially explain the assessment finding that although the respondents claimed that they have
no regular income, the reported estimates of average monthly spending of families without CFW
assistance add up to a sum upwards of 13,000 LKR per family/month. This might be a serious
indicator that the debts of the families are growing, while the opportunities to re-pay the loans
(from job earnings) are not necessarily arising. The inability to re-pay the loans might cause
severe constraints to the families in the near future. Although sufficient data about loan-taking
patterns and coping with indebtedness is not available at the moment, the anecdotal evidence of
growing concern among communities suggests that the issue is worth consideration for further
research.
Page | 13
Expenditure Patterns of Cash-for-Work versus Non Cash-for-Work Households within a Food Security Context June 2011
Category
% of Families Spending on each
Category per Month
Average Monthly Spending on Particular Category by
Respondent Families (LKR) Mostly Used per
Respective Item/categories
CFW Recipients
Non-CFW Recipients
CFW Recipients
Non-CFW Recipients
%
Food 100% 100% 7822.22 6211.05 26 Rice, Wheat Flour, Sugar
Clothing 79% 69% 1884.92 1195.30 58
Housing 11% 14% 392.59 384.62
Education 57% 57% 1240.48 1101.10 Stationary, Tuition fees
Healthcare 75% 74% 1019.84 1022.53 Clinic/consultation fees
Agriculture 24% 22% 685.19 735.71 Fertilizer, Seeds
Livelihood Investments
24% 30% 304.50 308.06 Cattle, poultry, and Capitol for Investments
Transportation 78% 76% 847.88 854.89 Transport for school kids
Household Non-food 62% 62% 866.14 786.10 soap, fuel-kerosene
Savings 16% 21% 116.40 262.09 44 At banks
Repayment of Loans 12% 10% 412.96 282.42 46 Bank loans, loans to buy agriculture inputs loans
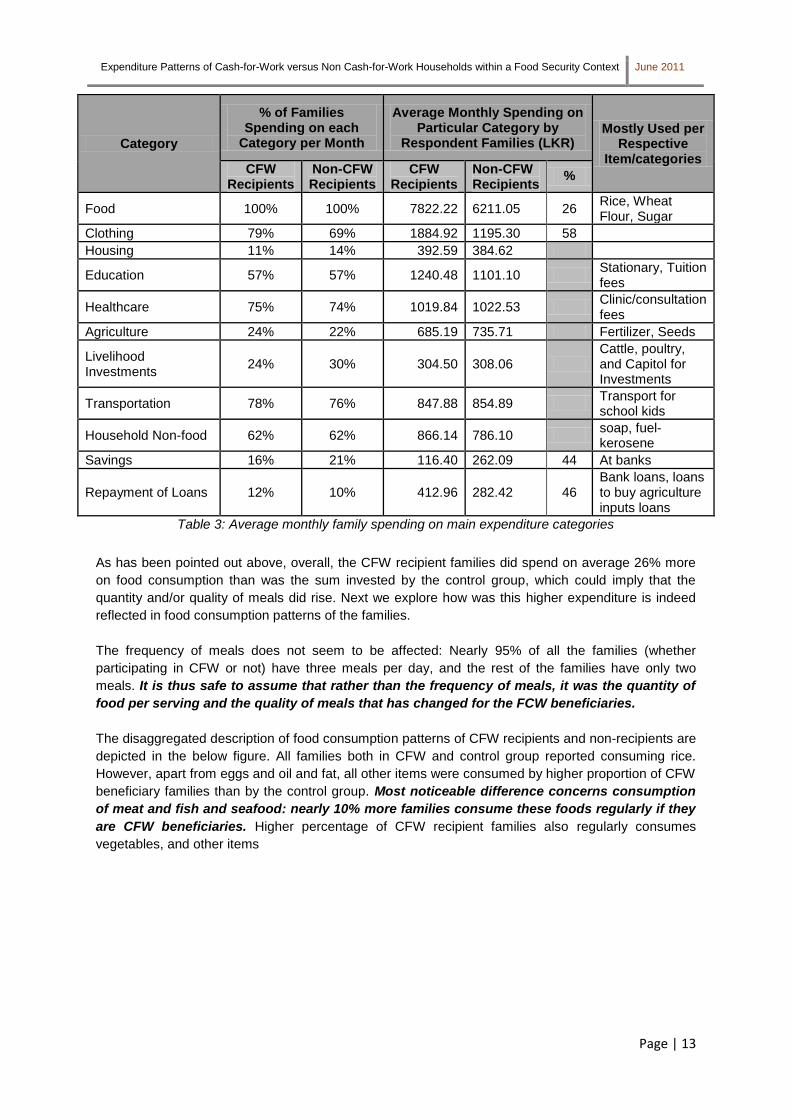
Table 3: Average monthly family spending on main expenditure categories
As has been pointed out above, overall, the CFW recipient families did spend on average 26% more
on food consumption than was the sum invested by the control group, which could imply that the
quantity and/or quality of meals did rise. Next we explore how was this higher expenditure is indeed
reflected in food consumption patterns of the families.
The frequency of meals does not seem to be affected: Nearly 95% of all the families (whether
participating in CFW or not) have three meals per day, and the rest of the families have only two
meals. It is thus safe to assume that rather than the frequency of meals, it was the quantity of
food per serving and the quality of meals that has changed for the FCW beneficiaries.
The disaggregated description of food consumption patterns of CFW recipients and non-recipients are
depicted in the below figure. All families both in CFW and control group reported consuming rice.
However, apart from eggs and oil and fat, all other items were consumed by higher proportion of CFW
beneficiary families than by the control group. Most noticeable difference concerns consumption
of meat and fish and seafood: nearly 10% more families consume these foods regularly if they
are CFW beneficiaries. Higher percentage of CFW recipient families also regularly consumes
vegetables, and other items

Page | 14
Expenditure Patterns of Cash-for-Work versus Non Cash-for-Work Households within a Food Security Context June 2011
Figure 9: Percentage of families consuming each item per week
The above main consumption items seem to be mostly available on the local markets in the targeted
areas. Figure 10 shows the level of availability. Except for commodities which are usually not widely
consumed in the North (e.g.: raw white rice and cowpeas), most of the items could be purchased on
the local markets.3 However, a caution must be exercised when estimating the food availability. As the
figure below shows, almost none of the items surveyed was available in all local markets. In order to
purchase some of the items, families would need to travel. That might have serious implications for
the composition of food basket of families with low mobility, which are likely the most vulnerable
families: i.e. female headed households with small children and other dependants, single living elderly
persons, the disabled, etc. This theme has not been explored in depth during the data collection of
this assessment, and it is advisable to include this consideration into the design of future food security
studies.
Figure 10: Availability of essential food items in local markets
3 Also, green leaves are usually not available in shops since there are door-to-door sellers who sell them at
cheaper prices.

Page | 15
Expenditure Patterns of Cash-for-Work versus Non Cash-for-Work Households within a Food Security Context June 2011
3.3.3. Influence of WFP Rations on Family Food Expenditures
Finally, the assessment also aims to explore whether and how the combination of various food
security assistance measures – that is the CFW and WFP food rations—affects food expenditure and
consumption of families in the target areas. As already mentioned, 91% of the respondent families
have received or are currently receiving WFP rations. Out of them, only 27% were able to recall the
time for which they had been receiving the rations. Out of the people who could recall the period,
94.6% had received rations for 4-9 months or they were receiving it during the time of the survey in
addition to receiving it for 4-9 months.
While receiving the rations, the majority of respondents (80.5%) have bought some additional food
from village shops or other market places. However, respondents who received WFP rations for
more than 3 months and at least once within the survey period, reported spending on average
32% less money on purchasing food than those who have not received WFP rations.
Figure 11: Average amount of money spent on food monthly by WFP rations recipients and non-
recipients
In fact, the effects of the interplay between the various types of assistance would merit a detailed
study on its own. The data collected during this assessment suggest that consumption pattern
of essential items changes in relation to whether families receive in kind or cash assistance
and/or combination of these.
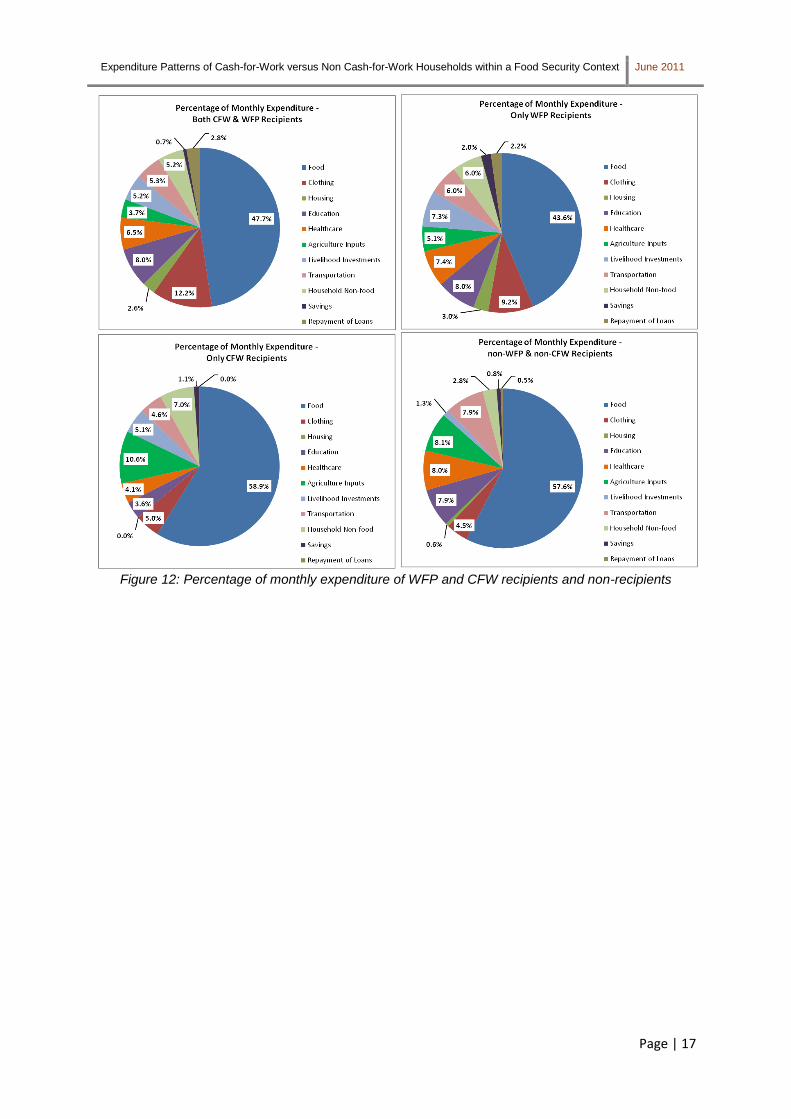
If compared, those who received both types of assistance and those who received neither kind
of help have similar spending priority: the major part of total household income was spent on
food. Similar average amounts were spent also on education and healthcare, suggesting that these
have both high value and priority for the households and at the same time inflexible price.
If families were not receiving WFP rations, they spent on average more on food, regardless of
whether they received CFW assistance or not. On the other hand, the families did tend to
economize on other essentials: Without the WFP rations, regardless of having CFW income or not,
they spent substantially less money on clothing and housing.
Families without the WFP rations also seem to have invested substantially more into
agriculture inputs, presumably in an attempt to secure future food from subsistence farming.
However, these families do seem to have less capacity to make an investment into a livelihood that
would provide an income. Also, the capacity of families without the WFP food rations to repay their
loans is minimal.

Page | 16
Expenditure Patterns of Cash-for-Work versus Non Cash-for-Work Households within a Food Security Context June 2011
Generally, it appears that apart from increased food consumption and improved diet, the
combination of the two types of assistance might deliver also more medium-term progress in
three areas critical for well-being of the resettled population:
Starting-up livelihoods (and thus ensuring medium-long term food security and income): If
compared, those who received both cash-for-work and WFP food rations could afford to
invest 4.8 times more into their livelihoods than those who had neither kind of assistance.
That is, the combination of those two types of assistance is likely to enable people to invest
into ensuring longer term food security and income-generating.
Reducing the level of debts of households: As suggested earlier in this assessment
report, the level of debts and the inability to repay them is a matter of growing concern. If
compared, the beneficiaries of the combined kind of assistance were able to repay 6,2 more
in debts than those who did receive neither kind of help.
Enabling households to purchase non-food essentials: While food is the key survival
priority, the basic needs to ensure well-being go being food consumption. In this sense, the
combination of the two kinds of assistance meant improvement for the recipients as they were
able to spend 1,8 times more on household essentials than those who did not receive either
kind of help.
Naturally, these are only tentative suggestions since the part of sample that were non-recipients of
WFP is too small to enable firm conclusion. However, the possibility that a combination of these two
types of assistance might help to address the immediate needs as well as some of the medium term
key challenges that the population of Kilinochchi and Mullaitivu faces is worth serious consideration
and further exploration.
Category
Average Monthly Expenditure (LKR)
WFP Food Ration Recipients
Non-WFP Food Recipients
CFW recipients
non-CFW recipients
CFW recipients
non-CFW recipients
Food 7730.00 5984.00 8887.00 7933.00
Clothing 1982.00 1258.00 760.00 622.00
Housing 426.00 418.00 0.00 83.00
Education 1301.00 1103.00 540.00 1083.00
Healthcare 1055.00 1014.00 613.00 1097.00
Agriculture Inputs 606.00 695.00 1600.00 1111.00
Livelihood Investments 849.00 1006.00 767.00 178.00
Transportation 861.00 829.00 700.00 1094.00
Household Non-food 850.00 830.00 1053.00 389.00
Savings 111.00 279.00 173.00 111.00
Repayment of Loans 449.00 305.00 0.00 72.00
Total 16,220.00 13,721.00 15,093.00 13,701.00
Table 4: Monthly spending of WFP & CFW recipients & non-recipients
Page | 17
Expenditure Patterns of Cash-for-Work versus Non Cash-for-Work Households within a Food Security Context June 2011
Figure 12: Percentage of monthly expenditure of WFP and CFW recipients and non-recipients

Page | 18
Expenditure Patterns of Cash-for-Work versus Non Cash-for-Work Households within a Food Security Context June 2011
4. CONCLUSIONS
The findings of this survey suggest that the combination of WFP food rations and CFW ensures
immediate food security for returnees while at the same time this combination enables households to
invest more into their medium term food security and possible reduce indebtedness than if each of
these assistance measures are used alone, or if none is available.
Further findings are:
Almost all returnees (whether recipients of food rations, and/or CFW or neither) main monthly
expenditure is for food items.
Families who received WFP rations for more than 3 months and at least once within the
survey period, reported spending on average 32% less money on purchasing food than those
who have not received WFP rations.
Income from CFW was mainly used to purchase food. Nearly 70% of the beneficiaries have
spent between 53% (16,000 LKR) and 93% (28,000 LKR) of their earnings to purchase food.
It can therefore be safely assumed that CFW was effective and contributed towards meeting
the immediate food needs of the returnees.
Households share similar patterns of spending priorities, regardless of the source and size of
the household’s actual income. However, in absolute terms, some significant differences
between CFW recipients and non-recipient household arise which means that although the
composition of essential items (i.e. the ―what‖ the families buy) does not differ substantially
between the groups, the volume and perhaps the quality of what they are able to afford (i.e.
the ―how much‖ and ―how good‖ are the consumed goods and services) has likely
substantially increased with the additional family income from CFW.
CFW beneficiary families were able to spend 26 % more on food than non CFW
families. These families eat also more meat and fish and though the number of meals
did not increase, probably did the quantity and quality per meal.
CFW beneficiaries spent significantly more on clothing than non CFW families.
CFW recipient families spent on average 46% more than non CFW families on
repayment of their loans.
Non-CFW families and also families who did not receive the WFP food rations have invested
more on small business and agriculture. A possible interpretation is that the families without
CFW and WFP food rations assistance spend more to strengthen their sources of future
income. However, these families do seem to have less capacity to make an investment into a
livelihood that would provide an income. Also, the capacity of families without the WFP food
rations to repay their loans is minimal.
When comparing families who received both types of assistance (CFW and WFP food
rations) and those who received neither kind of help have similar spending priority: the major
part of total household income was spent on food. Similar average amounts were spent also
on education and healthcare, suggesting that these have both high value and priority for the
households and at the same time inflexible price.
Although most households claimed that they have no regular income, the reported estimates
of average monthly spending of families without CFW assistance add up to a sum upwards of
13,000 LKR per family/month. This might be a serious indicator that the debts of the families
are growing, while the opportunities to re-pay the loans (from job earnings) are not
necessarily arising. The inability to re-pay the loans might cause severe constraints to the
families in the near future.

Page | 19
Expenditure Patterns of Cash-for-Work versus Non Cash-for-Work Households within a Food Security Context June 2011
17.4% of newborns in the areas surveyed were found to be underweight, i.e. born with a
weight of below 2.5 kilograms. This figure does not show any significant difference to other
parts of Sri Lanka as island wide 17% of all newborns in Sri Lanka are found to be born with a
weight of below 2.5 kilograms. Thus, the weight of newborns in the surveyed areas of the
Northern Province is in line with the national average. CFW and/or WFP food rations do not
seem to have significant effect on the weight of newborn babies.