experience curves for modern low-head hydroelectric turbines · experience curves for modern ·...
TRANSCRIPT
t
. ) -:;'
•
i ~ A P r.-> LA 5 1 ~ · ' ~ ··I ~ ~ l 1 Rlesearch Technical Completion Report
EXPERIENCE CURVES FOR MODERN · LOW-HEAD HYDROELECTRIC TURBINES
by C.S.K. Kpordze C.C. Warnick Civil Engineering Department
Bureau of Reclamation HYDRAULICS BRANCH
OfFICE \ -~ ~\lE COPY
'iTREN BOf'.FO\'iED RETURN PROMPTLY
for Bureau of Reclamation
United States Department of the Interior
Contract NO. 81-VOlSS
Idaho Water and Energy Resources Research Institute University of Idaho
Moscow, Idaho May, 1983
Contents of this publication do not necessarily reflect the views and policies of the U.S. Department of the Interior, nor does mention of trade names or commercial products constitute their endorsement or recommendation for use by the U.S. Government.
•
Correction:
The 11 Correlation Coefficient 11 used in this report is r 2 instead of r
which is shown on the nomographs and tables. r2 as used measures how
much variation in the dependent variable can be explained by the model. 2 r can range from 0 to 1, see page 11 .
FOREWARD
This study of the characteristics of manufactured hydroelectric
turbine equipment in the form of experience curves is presented to make
available information and experience that can be used in planning and
preliminary design of hydropower developments. It is intended to
supplement material already available for the more conventional hydrau
lic turbines and therefore concentrates on information about low-head
type turbines. In the tradition of the Idaho Water and Energy
Resources Research Institute the report has been prepared to meet a
need and desire of government agencies and practicing professional
engineers involved in hydropower engineering.
i
ACKNOWLEDGEMENTS
The authors wish to recognize the support of the Bureau of Recla
mation, U.S. Department of the Interior through Contract No. 81-V0255
and earlier support to initiate work by the Office of Water Research
and Technology. The counsel and advice of Clifford A. Pugh as techni
cal monitor of the project from the Bureau of Reclamation has been
especially helpful.
Most of the data used in this report came from a number of manu
facturers of hydroelectric equipment. To name all who contributed data
in this acknowledgement is not possible, however, a listing in the
Appendix does give the names and addresses of all the manufacturers
contacted in connection with the study. A very special thanks goes to
all the firms that contributed, especially to representatives of
several of the firms that took time to explain to the authors their
approaches to selection of turbines.
Thanks is given to the secretarial staff of the Institute and the
Civil Engineering Department for their help in typing and preparing
manuscripts, tables, and processinq needed paper work. A special
thanks is extended to Don Schutt for this work in drafting and aiding
in the preparation of all figures.
The report has been prepared under supervision of Dr. James H.
Milligan as Chairman of the Department of Civil En~ineering and Dr.
John R. Busch as Director of the Idaho Water and Energy Resources
Research Institute.
i i
TABLE OF CONTENTS
Page
LIST OF FIGURES iv
LIST OF TABLES ix
ABSTRACT xi
SUMMARY . Xi i
INTRODUCTION 1
COLLECTION AND ORGANIZATION OF DATA 5
METHODS OF ANALYSIS 8
RESULTS ...... . 15
ANALYSIS AND USE OF RESULTS 113
COMPARISONS ....... . 123
CONCLUSIONS AND RECOMMENDATIONS 134
REFERENCES 139
APPENDIX
SAMPLE CALCULATIONS FOR TURBINE CONSTANT CONVERSIONS . . . 144
SAMPLE CALCULATIONS FOR DETERMINING TURBINE DIAMETER AND TURBINE SPEED BY DIFFERENT METHODS
COMPLETE TABLE OF DATA
COMPUTER PROGRAMS . .
LIST OF TURBINE MANUFACTURERS
i i;
147
157
175
180
Figure No.
1.
2.
3.
4.
5.
6.
7.
8.
9.
10.
11.
12.
13.
14.
15.
16.
LIST OF FIGURES
Caption Page
Schematic drawings of three types of low-head turbines of the reaction type . . . . . . . 4
Schematic drawing of cross-flow turbines of the low-head impulse type . . . . . 6
Specific speed versus rated head for bulb turbines . . . . . . . ..... .
Specific speed versus rated head for bulb turbines for different manufacturers
Specific speed versus unit power for bulb turbines ............... .
Specific speed versus unit discharge for bulb turbines . . . ........ .
Unit speed versus specific speed for bulb turbines . . . . . . . . . . . . . . . .
Unit power versus unit discharge for bulb turbines ............. .
Unit speed versus unit power for bulb turbines . . . . . . . . . . . . . .
Unit speed versus unit discharge for bulb turbines ...... .
Speed ratio versus specific speed for bulb turbines .....
Speed ratio versus unit power for bulb turbines ...... .
Turbine diameter versus speed ratio for
17
18
19
21
22
23
24
26
28
29
bulb turbines . . . . . . . . . . . 30
Turbine diameter versus P/H ratio for bulb turbines .....
Turbine diameter versus Q/N ratio for bulb turbines ..
Turbine speed, N, versus P/H for bulb turbines ............. .
iv
31
32
34
LIST OF FIGURES (continued)
Figure No. Caption Page
17. Turbine speed versus /HID ratio for bulb turbines . . . . . . . . . . . . . . . 35
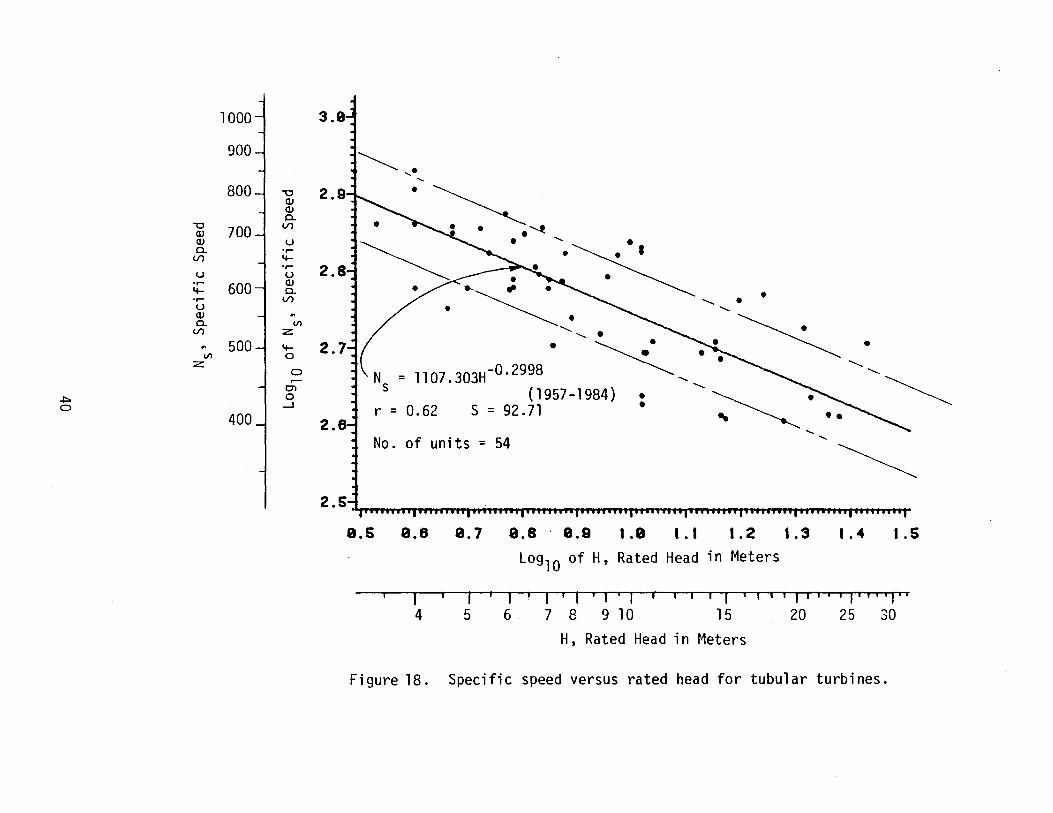
18. Specific speed versus rated head for tubular turbines . . . . . . . . . . 40
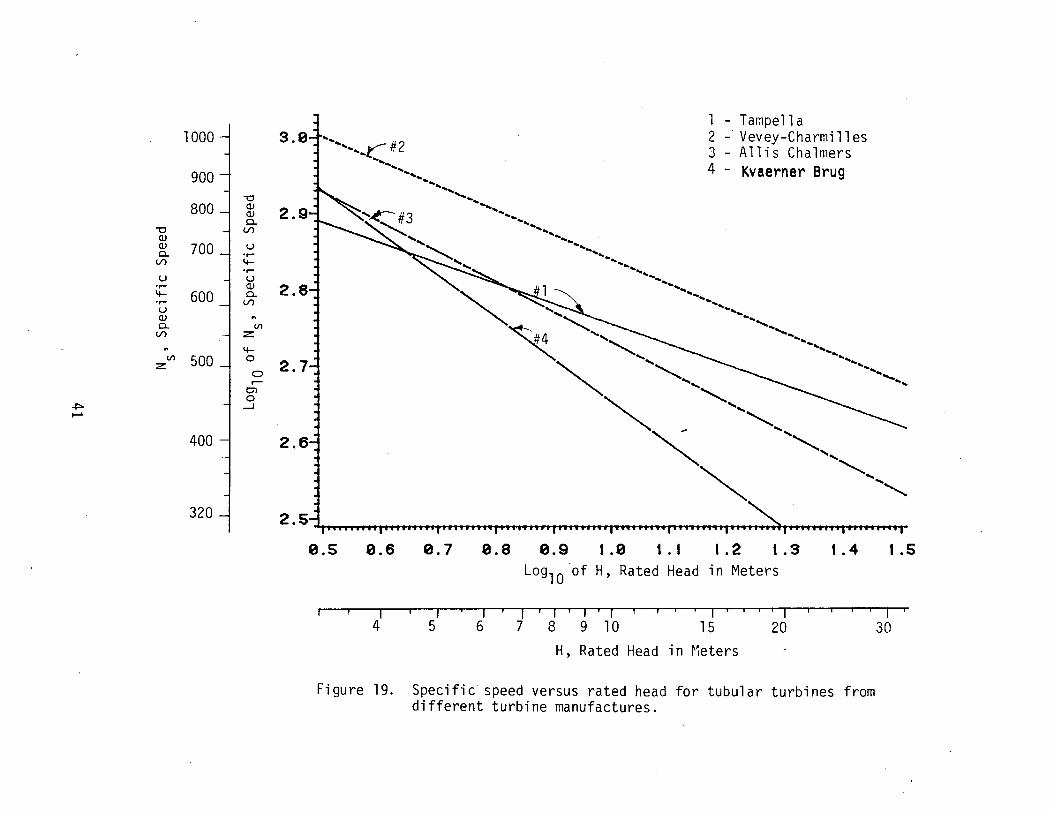
19. Specific speed versus rated head for tubular turbines from different turbine manufacturers . . . . . . . . . . . . . . . . . . 41
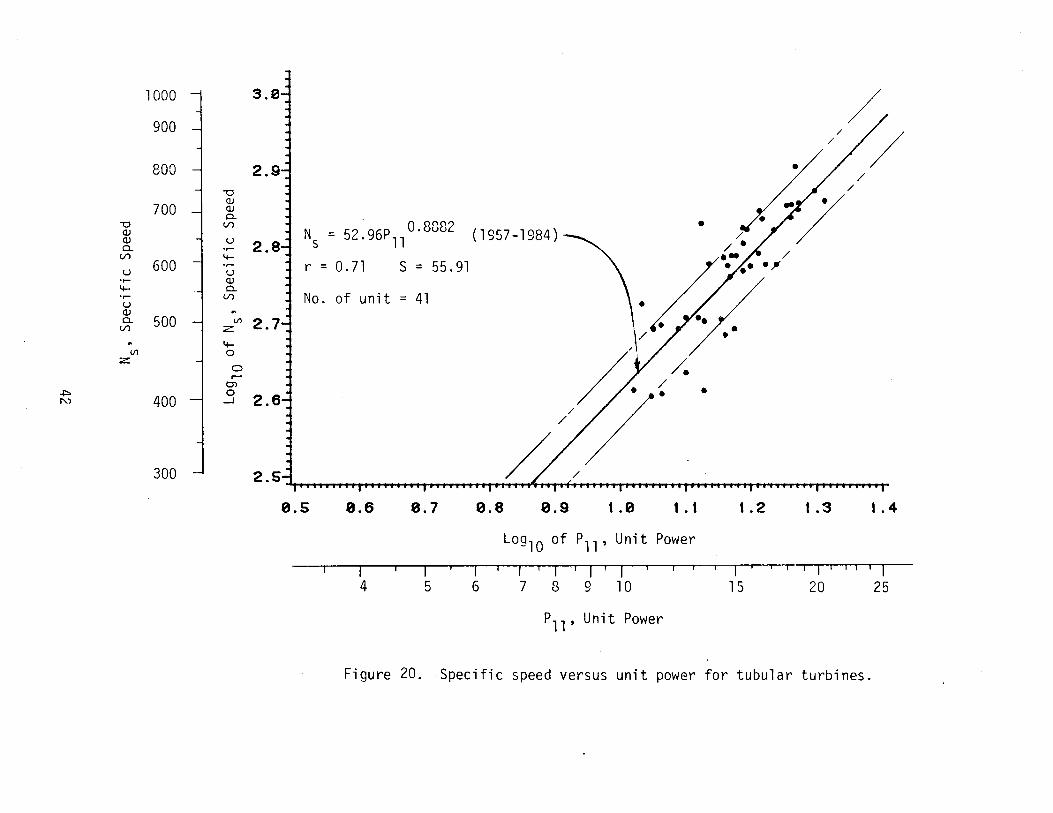
20. Specific speed versus unit power for tubular turbines . . . . . . . . . . . . 42
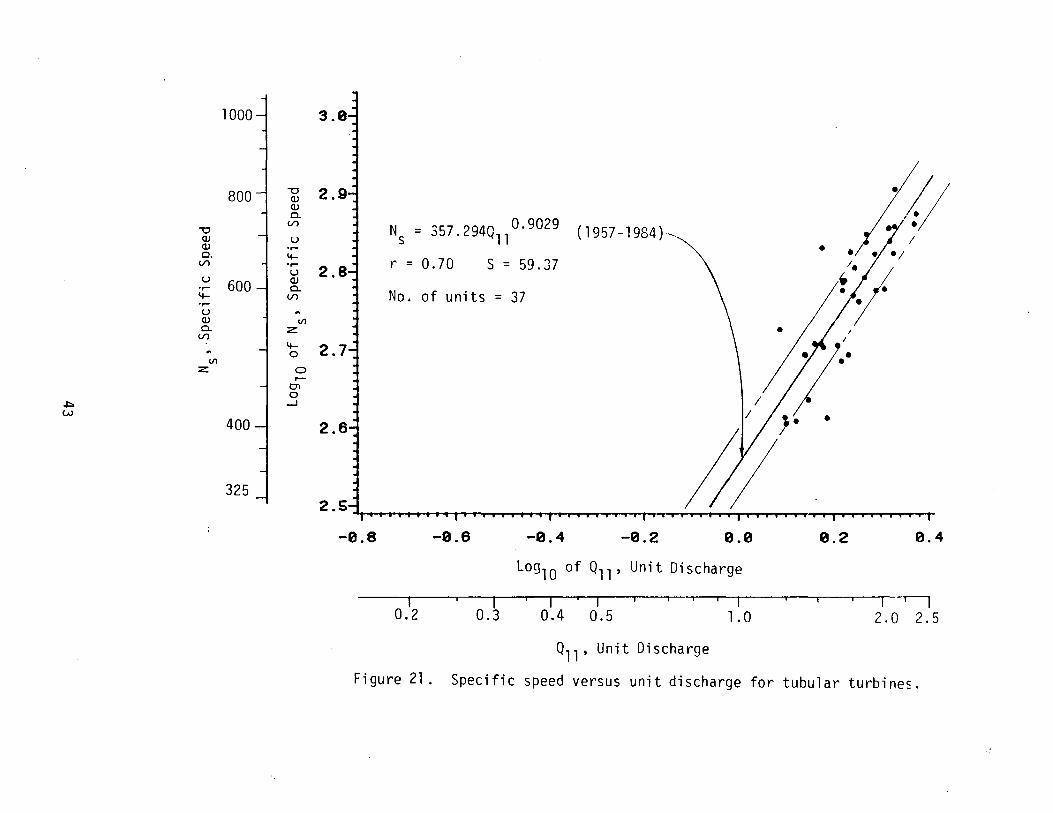
21. Specific speed versus unit discharge for tubular turbines . . . . . . . . . . . . 43
22. Specific speed versus unit speed for tubular turbines . . . . . . . . . . . . . . 44
23. Unit power versus unit discharge for tubular turbines . . . . . . . . . . . . . . 45
24. Unit speed versus unit power for tubular turbines . . . . . . . . . . . . . . . . . . 47
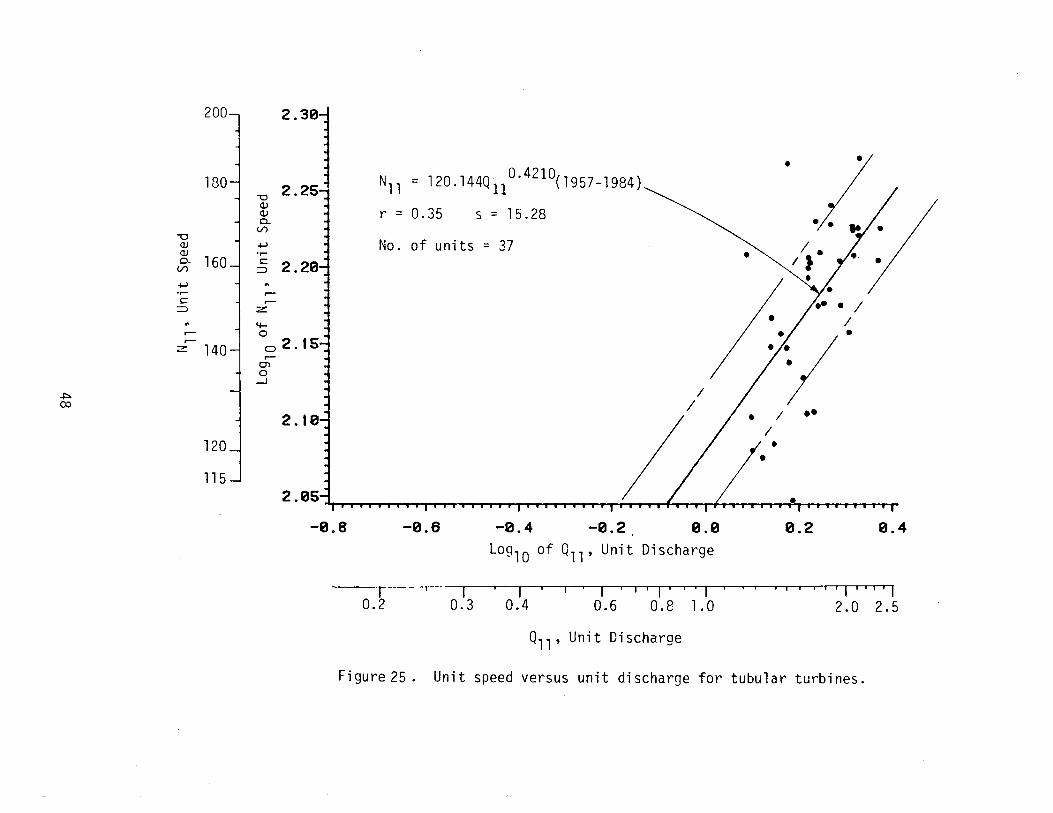
25. Unit speed versus unit discharge for tubular turbines . . . . . . . . . . . 48
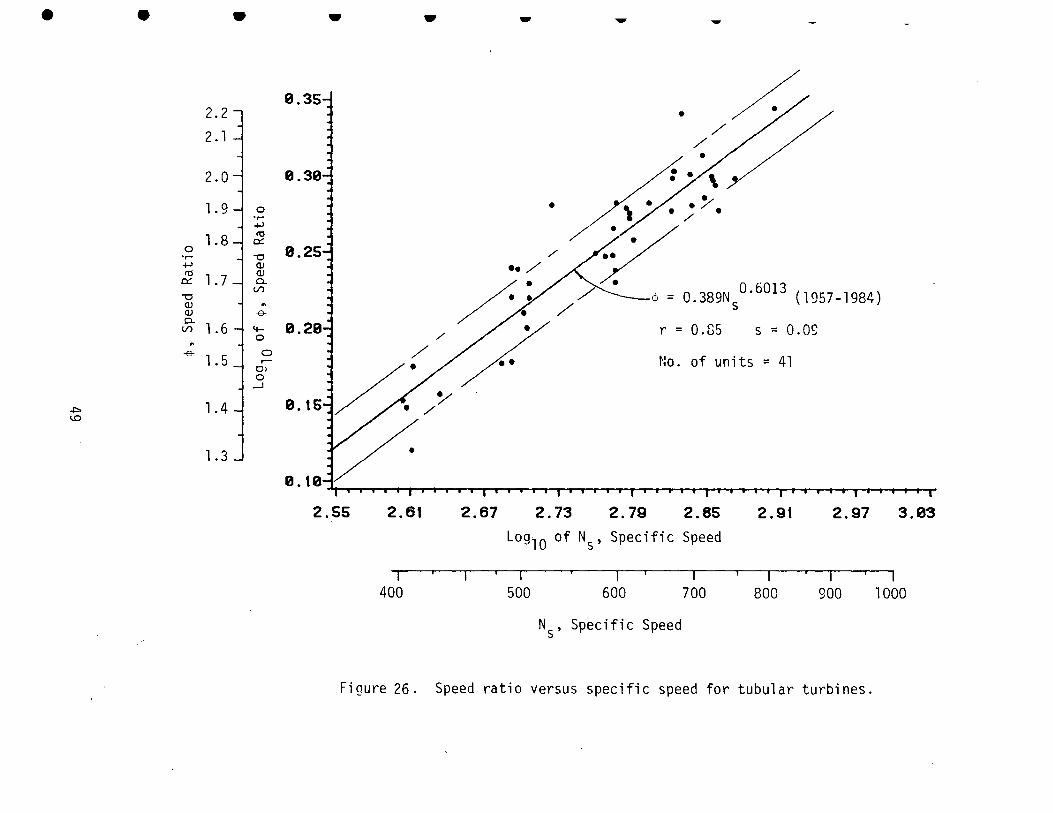
26. Speed ratio versus specific speed for tubular turbines . . . . . . 49
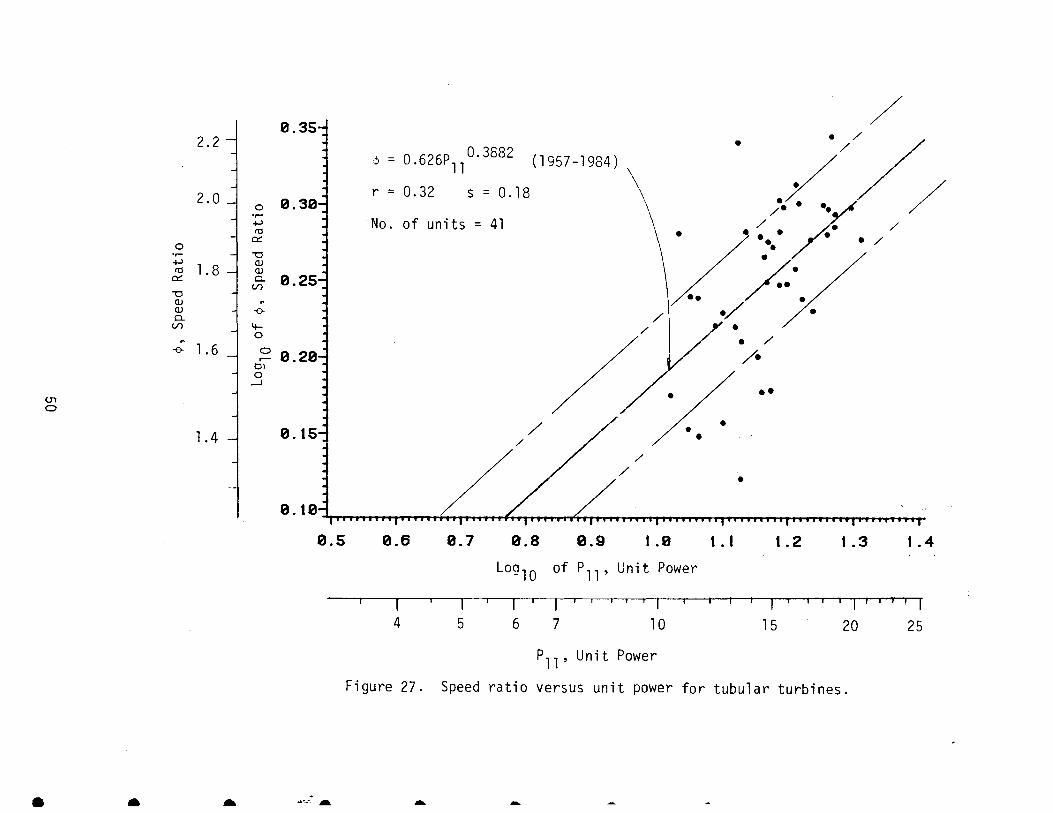
27. Speed ratio versus unit power for tubular turbines . .. . . . . . 50
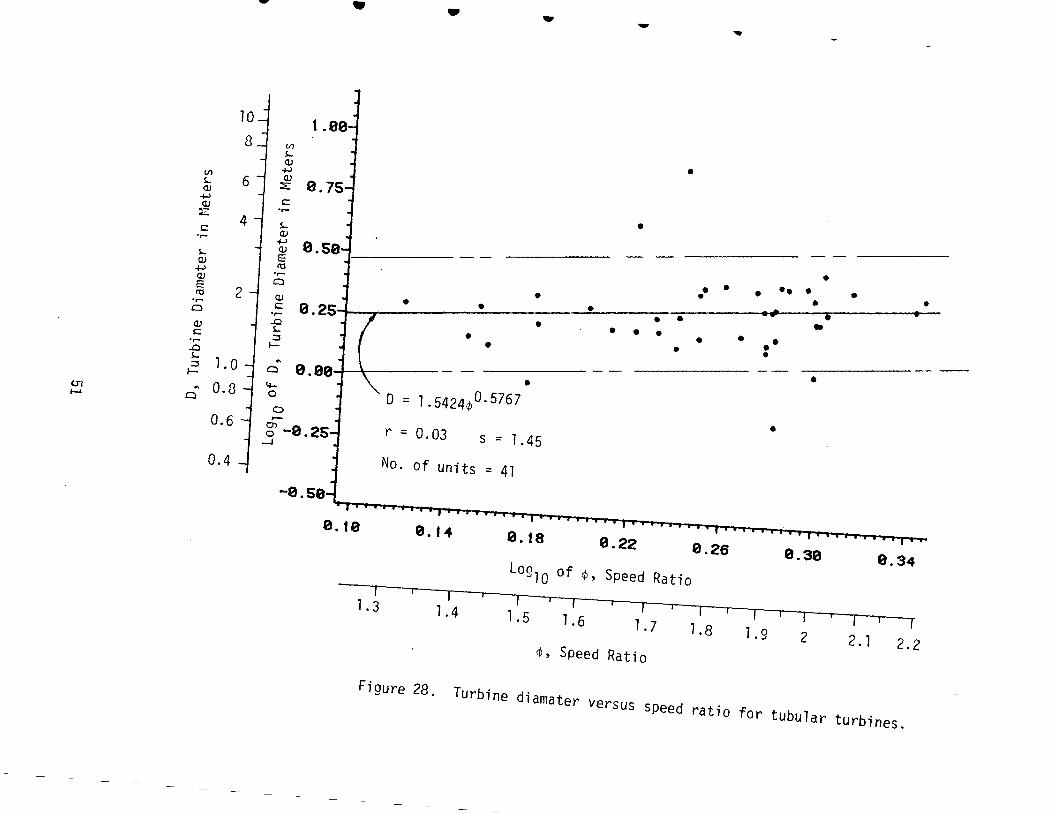
28. Turbine diameter versus speed ratio for tubular turbines . . . . . . . . . 51
29. Turbine diameter versus P/H ratio for tubular turbines . . . . . . 52
30. Turbine diameter versus Q/N ratio for tubular turbines . . . . . . 53
31. Turbine speed versus P/H ratio for tubular turbines . . . . . . . . . . . . . . 57
32. Turbine speed versus IH/o ratio for tubular turbines . . . . . . . . . . . . 58
v
LIST OF FIGURES (continued)
Figure No. Caption Page
33. Specific speed versus rated head for cross-flow turbines . . .... 59
34. Specific speed versus unit power for cross-flow turbines . . . . . . . . . . . . . 61
35. Specific speed versus unit discharge for cross-flow turbines . . . . . . . . . . . . . 62
36. Specific speed versus unit speed for cross-flow turbines . . . . . . . . . . . . . . . 63
37. Unit power versus unit discharge for cross-flow turbines . . . . . . . . . . . . . 64
38. Unit speed versus unit power for cross-flow turbines . . . . . . . . . . . . . 65
39. Unit speed versus unit discharqe for cross-flow turbines . . . . . . . . . . 66
40. Speed ratio versus specific speed for cross-flow turbines . . . . . . . . 68
41. Speed ratio versus unit power for cross-flow turbines . . . . . . . . . 69
42. Turbine diameter versus speed ratio for cross-flow turbines . . . . . . . . . . 70
43. Turbine diameter versus P/H ratio for cross-flow turbines . . . . . . . . 71
44. Turbine diameter versus Q/N ratio for cross-flow turbines . . . . . . 72
45. Definition diagram for suction head and draft head for different types of turbines . . . . 76
46. Stratification of relation between plant sigma and specific speed for different manufacturers. . 78
47. Specific speed versus cavitation coefficient for tubular turbines . . . . . . . . . . .82
48. Simplified dimensioning sketch for water passages of bulb turbines . . . . . . . . . . . . 85
vi
Figure No.
49
50.
51.
LIST OF FIGURES (continued)
Caption
Distance from turbine entrance to draft tube outlet versus rated power output for bulb turbines . . . . . . . . . . . ....
Distance from turbine entrance to draft tube outlet versus turbine diameter for bulb turbines .... · ..... .
Length of bulb versus rated power for bulb turbines ....
52. Length of bulb turbine versus turbine
53.
54.
55.
56.
57.
58.
59.
60.
61.
62.
63.
64.
diameter
Turbine entrance area versus rated power output for bulb turbines ..... .
Turbine entrance area versus turbine diameter for bulb turbines .....
Bulb diameter versus rated power for bulb turbines ........... .
Bulb diameter versus turbine diameter
Draft tube exit area versus rated power for bulb turbines ........ .
Draft tube exit area versus turbine diameter for bulb turbines
K/Ae ratio versus rated power output for bulb turbines . . . ....
Turbine entrance velocity versus rated power for bulb turbines ....... .
Turbine entrance velocity versus turbine diameter for bulb turbines ...... .
Turbine entrance area versus rated turbine discharge for bulb turbines ....
Draft tube exit area versus rated turbine discharge for bulb turbines ....
Dimensioning recommendations for low-head reaction turbines ........... .
vii
Page
87
88
89
90
91
92
94
95
96
97
98
99
101
102
103
106
Figure No.
65.
66.
67.
68.
69.'
70.
71.
72.
73.
74.
75.
76.
77.
LIST OF FIGURES (continued)
Caption
Schematic drawing defining dimensions used in study of standard tubular turbines
Turbine entrance area versus turbine diameter for standard tubular turbines ....... .
Draft tube exit area versus turbine diameter for standard tubular turbines ....... .
Length from runner blade centerline to turbine entrance versus turbine diameter for tubular turbines ............. .
Length from runner blade centerline to draft tube exit versus turbine diameter for standard tubular turbines . . • . . . . ...•
Reproduction of KMW nomograph for selection of turbine diameter and turbine speed for bulb turbines . . . . . . . . . . . . . . .
Nomograph for estimating turbine diameter from rated head and rated power output for bulb turbines ................. .
Nomograph for estimating turbine diameter from rated head and rated power output for tubular turbines . . . . . . . . . . . . . . . . . .
Nomograph for estimating turbine diameter from rated head and rated power output for cross-flow turbines ........... .
Comparison of experience curves of specific speed versus rated head for different types of low-head turbines ............ .
Comparison of experience curves of speed ratio versus specific speed for different types of axial-flow turbines . . . . . . . . . ...
Comparative of experience curves of plant sigma versus specific speed for different low-head turbines ...... .
Comparison of experience curves of plant sigma versus unit discharge for different low-head turbines . . . . . . . . . . . . . . . . . . . .
viii
Page
109
110
111
112
114
116
119
120
121
124
126
128
130
Table No.
1.
2.
3.
4.
5.
6.
7.
8.
9.
10.
11.
12.
LIST OF TABLES
Caption
Comparison of turbine constants in different systems of units and forms of equations
Summary listing of regression information and equations relating turbine characteristics to various turbine constants for bulb turbines ................ .
Summary listing of regression information and equations relating turbine characteristics to various turbine constants for tubular turbines ............ .
Summary listing of regression information and equations relating turbine characteristics to various turbine constants for cross-flow turbine ............... .
Summary listing of regression information relating to turbine setting for bulb and tubular turbines ............ .
Summary listing of regressionn information and equations relating to water passage dimensions for bulb turbines ..
Reference information and source for standard tubular turbine water passage dimensions .
Summary listing of regression information and equations relating to water passage dimensions for standard tubular turbines .
Summary listing of regression information and equations for special case of manufactured KMW bulb turbines ........... .
Comparison information of regression equations for Ns versus H for different types of low-head type turbines ............. .
Comparison of draft tube exit velocity with Purdy•s recommended limit for manufactured bulb turbines . . . . . . . . . . . . . . . .
Comparative results of different methods of estimating turbine diameter and turbine speed
ix
Page
13
36
55
74
80
104
108
115
117
125
132
133
Table No.
13.
14.
LIST OF TABLES
Caption Page
Comparison of value of correlation coefficients for the important regression equations . . . . . 135
Summary listing of regression information and equations relating turbine specific speed to rated head for bulb and tubular turbines from different turbine manufacturers . . . . . . . . . . . . . 141
X
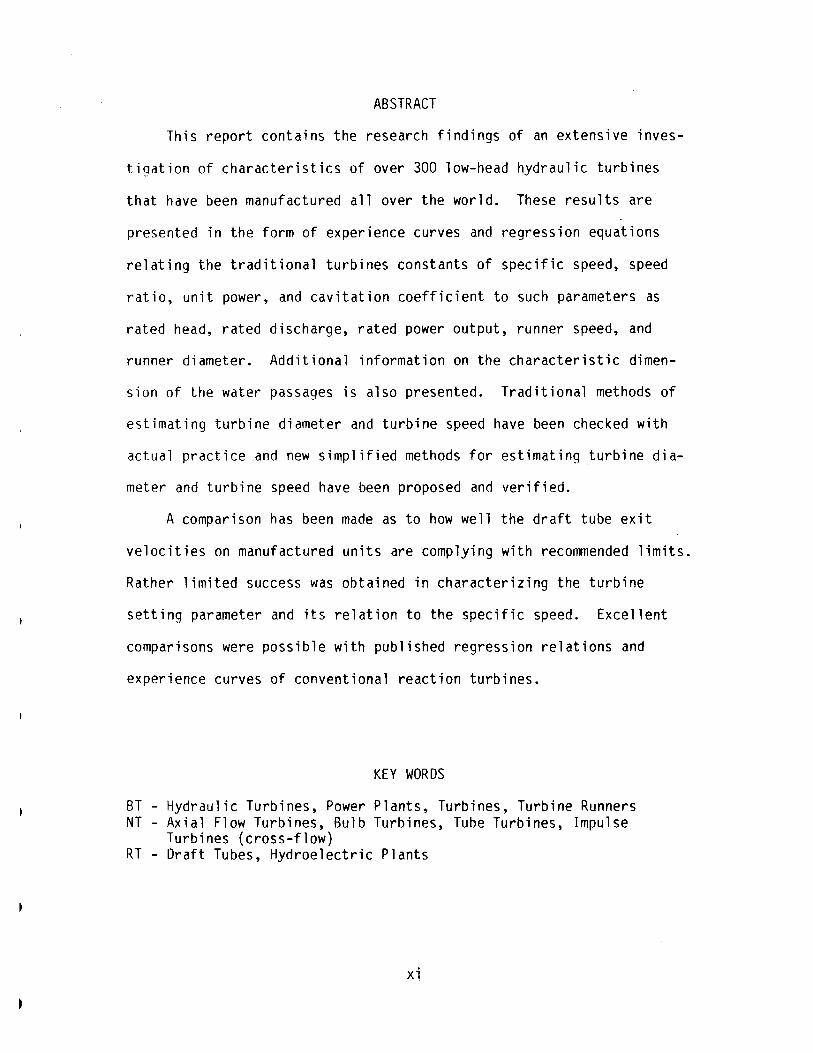
ABSTRACT
This report contains the research findings of an extensive inves-
tigation of characteristics of over 300 low-head hydraulic turbines
that have been manufactured all over the world. These results are
presented in the form of experience curves and regression equations
relating the traditional turbines constants of specific speed, speed
ratio, unit power, and cavitation coefficient to such parameters as
rated head, rated discharge, rated power output, runner speed, and
runner diameter. Additional information on the characteristic dimen-
sion of the water passages is also presented. Traditional methods of
estimating turbine diameter and turbine speed have been checked with
actual practice and new simplified methods for estimating turbine dia-
meter and turbine speed have been proposed and verified.
A comparison has been made as to how well the draft tube exit
velocities on manufactured units are complying with recommended limits.
Rather limited success was obtained in characterizing the turbine
setting parameter and its relation to the specific speed. Excellent
comparisons were possible with published regression relations and
experience curves of conventional reaction turbines.
KEY WORDS
BT -Hydraulic Turbines, Power Plants, Turbines, Turbine Runners NT - Axial Flow Turbines, Bulb Turbines, Tube Turbines, Impulse
Turbines (cross-flow) RT - Draft Tubes, Hydroelectric Plants
xi
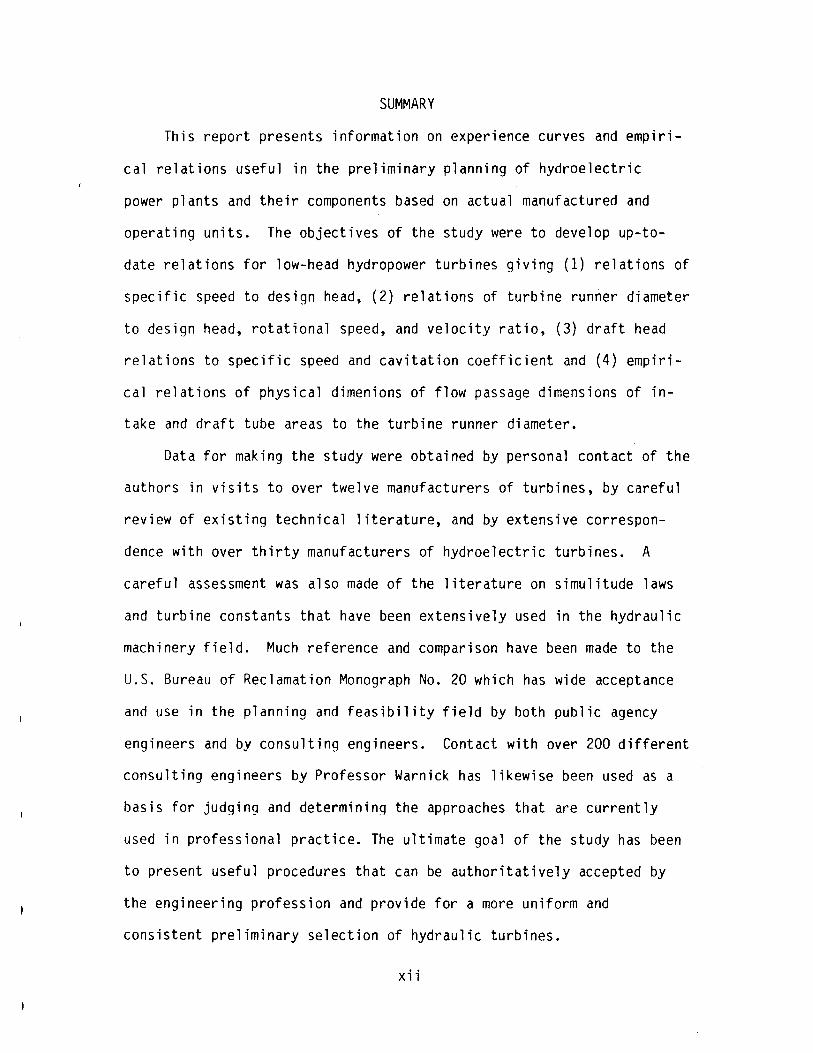
SUMMARY
This report presents information on experience curves and empiri
cal relations useful in the preliminary planning of hydroelectric
power plants and their components based on actual manufactured and
operating units. The objectives of the study were to develop up-to
date relations for low-head hydropower turbines giving (1) relations of
specific speed to design head, (2) relations of turbine runner diameter
to design head, rotational speed, and velocity ratio, (3) draft head
relations to specific speed and cavitation coefficient and (4) empiri
cal relations of physical dimenions of flow passage dimensions of in
take and draft tube areas to the turbine runner diameter.
Data for making the study were obtained by personal contact of the
authors in visits to over twelve manufacturers of turbines, by careful
review of existing technical literature, and by extensive correspon
dence with over thirty manufacturers of hydroelectric turbines. A
careful assessment was also made of the literature on simulitude laws
and turbine constants that have been extensively used in the hydraulic
machinery field. Much reference and comparison have been made to the
U.S. Bureau of Reclamation Monograph No. 20 which has wide acceptance
and use in the planning and feasibility field by both public agency
engineers and by consulting engineers. Contact with over 200 different
consulting engineers by Professor Warnick has likewise been used as a
basis for judging and determining the approaches that are currently
used in professional practice. The ultimate goal of the study has been
to present useful procedures that can be authoritatively accepted by
the engineering profession and provide for a more uniform and
consistent preliminary selection of hydraulic turbines.
xii
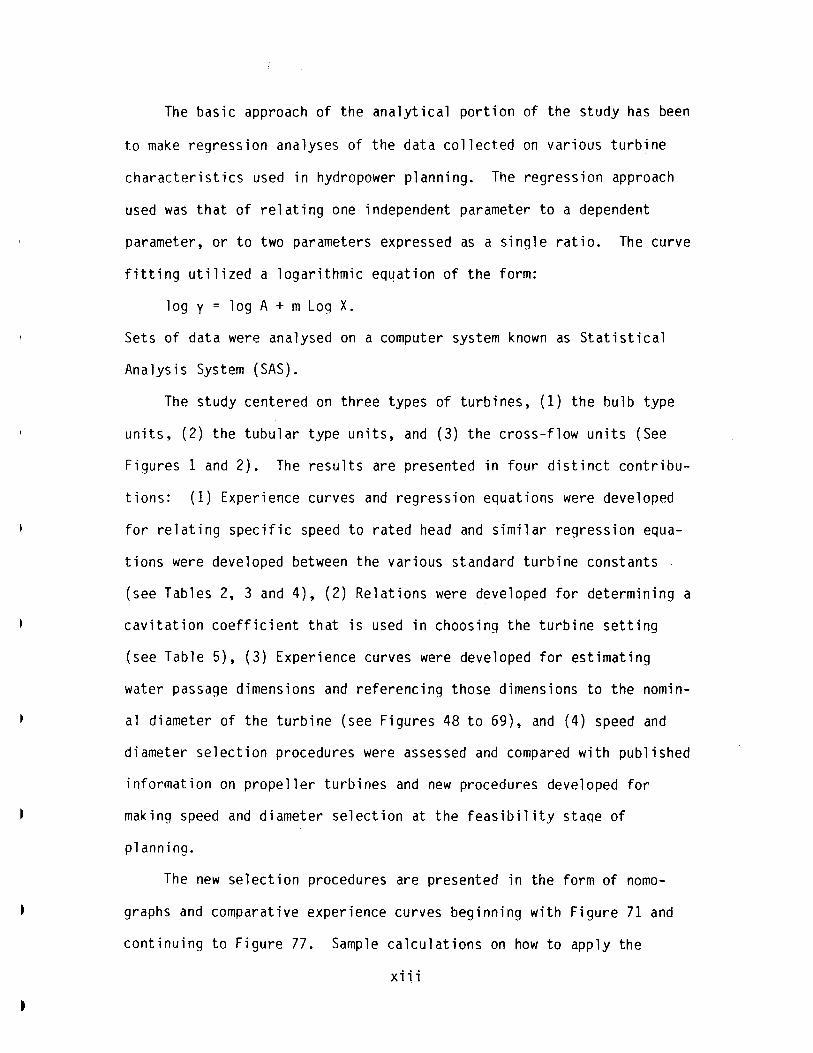
The basic approach of the analytical portion of the study has been
to make regression analyses of the data collected on various turbine
characteristics used in hydropower planning. The regression approach
used was that of relating one independent parameter to a dependent
parameter, or to two parameters expressed as a single ratio. The curve
fitting utilized a logarithmic eqyation of the form:
log y = log A + m Log X.
Sets of data were analysed on a computer system known as Statistical
Analysis System (SAS).
The study centered on three types of turbines, (1) the bulb type
units, (2) the tubular type units, and (3) the cross-flow units (See
Figures 1 and 2). The results are presented in four distinct contribu
tions: (1) Experience curves and regression equations were developed
for relating specific speed to rated head and similar regression equa
tions were developed between the various standard turbine constants .
(see Tables 2, 3 and 4), (2) Relations were developed for determining a
cavitation coefficient that is used in choosing the turbine setting
(see Table 5), (3) Experience curves were developed for estimating
water passage dimensions and referencing those dimensions to the nomin
al diameter of the turbine (see Figures 48 to 69), and (4) speed and
diameter selection procedures were assessed and compared with published
information on propeller turbines and new procedures developed for
making speed and diameter selection at the feasibility staqe of
planning.
The new selection procedures are presented in the form of noma
graphs and comparative experience curves beginning with Figure 71 and
continuing to Figure 77. Sample calculations on how to apply the
xiii
experience curves are presented in Appendix 2. The conclusion is made
that these procedures are simpler and more direct than conventional
procedures now in use and appear to offer more consistent results. The
compilation of data on manufactured low-head turbines should offer an
excellent reference in itself for designers and planners to use in
preliminary design and feasibility studies.
Because this study applied to only low-head turbines and also
because new data on manufactured units are now available on convention
al Kaplan, Francis and Pelton type turbines, it is recommended that the
new methodology developed on this study be used to update experience
curves and selection procedures for those types of turbines used in
higher head applications.
xiv
INTRODUCTION
In planning and design of hydroelectric plants much advantage is
gained by utilizing the experience gained from the various installa
tions that have already been made. Publications like Engineering Mono
graph No. 20 of the U.S. Bureau of Reclamation (1976) entitled,
"Selecting Hydraulic Reaction Turbines" have been developed for this
purpose. Records of experience have been analysed and various exper
ience curves and empirical equations developed that provide a conven
ient way to proceed in plannin9 for new hydropower developments.
Experience curves provide a way of making visual comparison easily and
with engineering judgement help the engineer in proceeding through the
complex task of planning and designing a hydropower development. These
do not substitute for the design selection that a turbine manufacturer
must make to proceed to final design. Experience curves however, do
provide the planning engineer with useful information to proceed with
feasibility and preliminary design studies.
Modern low-head hydroelectric turbines such as tubular turbines,
bulb type installations, and cross-flow turbines have now been in
production long enough to provide enough operating units from which
experience curves can be generated. The work of de Siervo and de Leva
(1976 and 1977) and de Siervo and Lugaresi (1978) treating conventional
Francis turbines, vertical Kaplan turbines, and Pelton turbines did not
consider the more modern low-head type turbines, neither did the
Engineering Monograph No. 20.
OBJECTIVE
The objective of this report is to provide experience curves and
practical empirical equations useful in planning and preliminary design
1
of hydroelectric developments for modern low-head type turbines. Spec
ifically, to provide information on bulb type turbines, tubular type
turbines, and cross-flow turbines that have been manufactured in the
past thirty years. Particular relationships to be developed would
provide information on the following:
1. Specific speed relation to design head.
2. Turbine runner diameter relation to design head, rotational
speed, and velocity ratio.
3. Draft head relation to specific speed and cavitation coeffi
cient.
4. Physical dimensions of flow passages (intake and draft tube)
relations to turbine runner diameter.
EXPERIENCE CURVES AND TURBINE CONSTANTS
Historically a series of turbine constants have been developed by
using similarity laws of hydraulics and fundamental hydraulic equations
to characterize the performance of hydraulic turbines. Mathematical
development of the various constants is covered in texts by Barrows
{1927), Doland (1954), Csanady {1964), Warnick (in press), and in an
M.S. thesis by Kpordze (1982). A worthwhile discussion on different
expressions for turbine constants is presented by Barr {1966). Recent
ly international manufacturers have suggested an approach that reports
the various constants in dimensionless form (Allis Chalmers, no date).
Table 1 presents expressions for different forms of the various turbine
constants in use and the new dimensionless system of expressing the
turbine constants. This table contains a list of terms used in the
report along with appropriate units in which the terms are expressed.
The American system reports the constants in units of power output as
2
horsepower, diameter of runner in inches, turbine discharge in
ft3fsec, head in feet, and rotational speed in rpm. The European
system reports the constants in units of power output in kilowatts,
diameter of runner in millimeters, turbine discharge in cubic meters
per second, head in meters, and rotational speed in rpm. The European
system has been used throughout this report because so much of the
manufacturer's literature and experience curves that have been reported
have been published in the European system. Conversions and relation
ships between the different forms of the turbine constants are provided
in Table 1 and in an example in the Appendix demonstrating the use of
the conversions.
Manufacturers who have worked with these constants and model tests
have further utilized the' constants to develop multiparameter relations
termed ''Hill Curves." These hill curves are proprietary information
and therefore are not available to practicing engineers for use in
selection and design. In practice many engineering firms develop their
own experience curves and once developed the curves are made proprie
tary information of the firm. In this effort the experience curves and
empirical equations are being proposed as a way to achieve more consis
tency in the planning studies and to provide a better and more uniform
base for proceeding with engineering design. In a sense it does pro
vide a check as to the recommendations and quotations of performance
that are put forth by the manufacturers who may be asked to bid on and
supply hydraulic turbines.
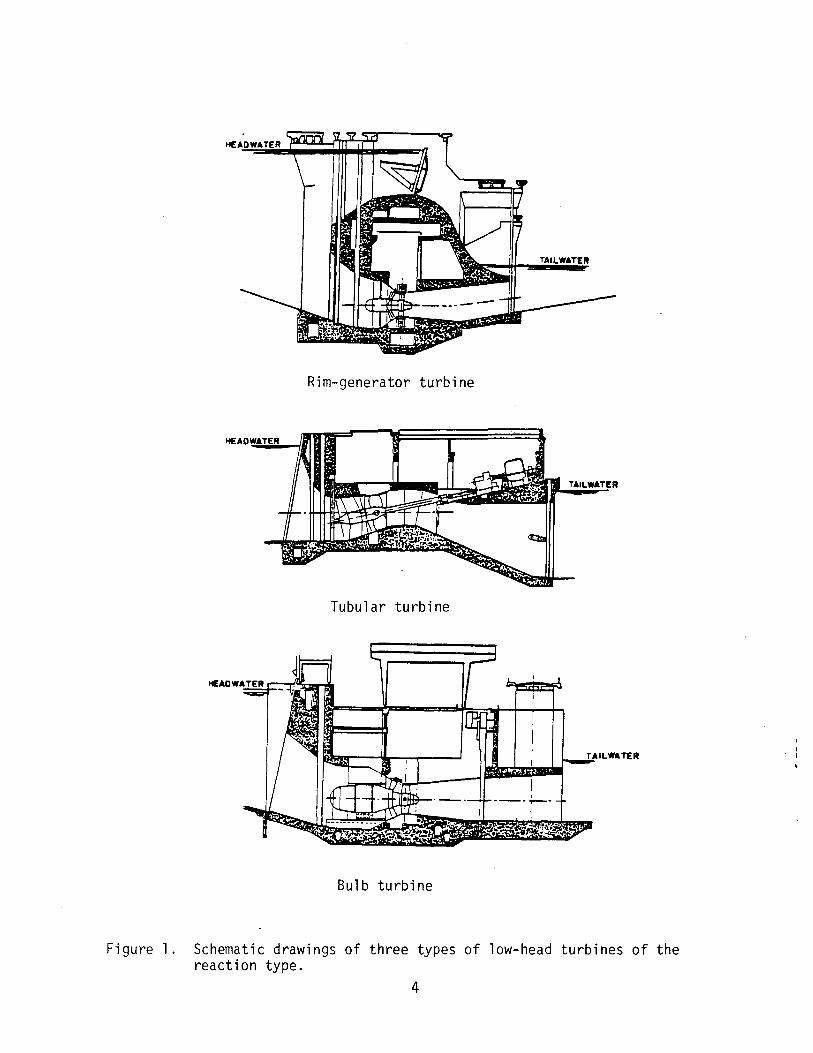
The types of turbines studied are of two general types, reaction
turbines and impulse turbines. Three reaction type turbines were
studied: bulb type units, tubular type units and rim-generator units.
Typical representation of these units are shown in Figure 1. The
3
Rim-generator turbine
Tubular turbine
ILWATER
Bulb turbine
Figure 1. Schematic drawings of three types of low-head turbines of the reaction type.
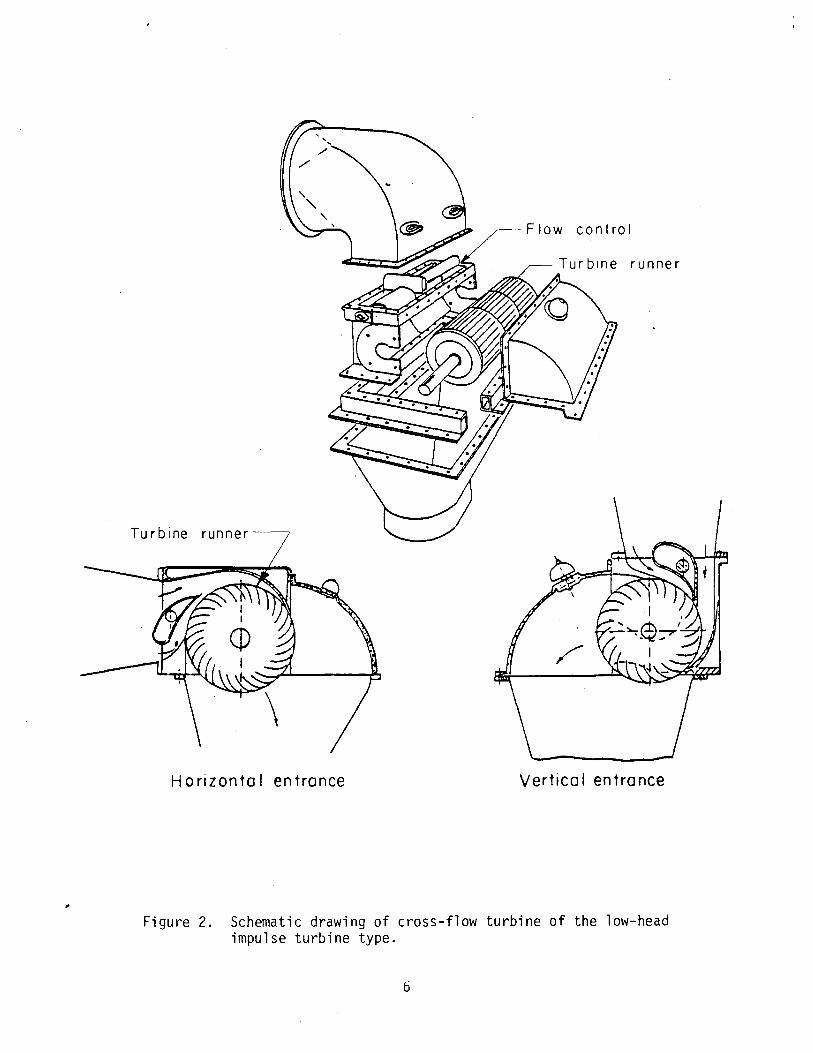
4
impulse turbine studied was a cross-flow turbine. Figure 2 is a line
drawing representation of the cross-flow type turbine.
COLLECTION AND ORGANIZATION OF DATA
DATA COLLECTION
Collection of data was initiated first on this project when one of
the authors, Professor Warnick, contacted numerous turbine manufactur
ers in connection with preparation of a new textbook on hydropower
engineering. This included reference lists and characteristics of tur
bines manufactured by various turbine manufacturers. These personal
contacts have continued since that time and during the course of the
present research contract, several manufacturers were visited. A table
in the Appendix gives the list of manufacturers visited, a contact
name, and the address and the then active telephone number. On these
visits company literature particularly concerned with selection of tur
bines was collected. A complete set of this manufacturer's information
has been assembled for the Bureau of Reclamation as a reference docu
ment. Much of this document includes nomographs published by the com
panies for use in selecting turbines and for providing preliminary data
on dimensions of standard turbines and water passages of the civil
works portion of hydropower installations.
The technical literature was searched for data on turbines and
representative of this is the technical articles like that of de Siervo
and de Leva (1977 and 1978) and also a listing of information prepared
by Cottillon (1977, 1979, and 1981).
Subsequent to the literature search and the initial personal
visits of Professor Warnick, considerable correspondence was carried on
to complete the collection of data. In some cases there were no
5
,
--Flow control
runner
Turbine runner-·--
Horizontal entrance Vertica I entrance
Figure 2. Schematic drawing of cross-flow turbine of the low-head impulse turbine type.
6
replies but in general good response was obtained in acquiring missing .
data and clarifying information that was obtained in personal contacts
or from published reference lists.
ORGANIZATION OF DATA
All information that was received was first checked to verify con-
sistency and identify appropriate measurement units. Transformation of
all units were made to make all units compatible with the European sys-
tern of reporting turbine constants. Data were then entered in a com-
puter file that would permit easy access for analysis. This informa-
tion included type of turbine, name of manufacturer, name of power sta-
tion, date of commissioning, rated head, rated flow, rate capacity per
unit, runner diameter, unit rotational or running speed and specific
water passage dimensions designated by letters of identification. A
complete list of all the data used or obtained during the study is
reproduced as tabular material in the Appendix 3.
Once a standardized file of the various data was prepared then
computer programs were developed to extract the data in various strati-
fications as to a particular type of turbine, a particular manufactur-
er, or a particular year of commissioning. These computer programs are
filed in the Appendix 4 to permit future researchers to proceed with
analyses of additional data.
7
METHODS OF ANALYSIS
The study basically entailed classifying and analysing different
sets of data from various manufacturers and data reported by the numer
ous companies. Different statistical procedures were used in proceed
ing with the analysis. One such statistical procedure is cluster
analysis.
The cluster analysis is a means of classifying observation (in
this case turbine characteristics) on the basis of similarity
(Anderberg, 1973). Cluster analysis in this research was used to group
the turbine data into periods of similar turbine design characteris
tics. This method was considered a valid statistical technique for
classifying the turbine data into periods of similar turbine design
characteristics. In this study, the type of cluster analysis technique
used is similar to the weighted pair-group method used by Davis (Davis,
1973). The data base of four turbine characteristics on 221 bulb tur
bines manufactured all over the world, was treated as a 4 x 221 matrix.
The four turbine characteristics used were: specific speed, rated
head, unit discharge and unit power. Using a computer, the 4 x 221
matrix was partitioned into a 4 x n1 and 4 x n2 submatrices based
on the date of commissioning of the turbines. Where n1 denotes num
ber of bulb turbines put into service during the periods of time under
consideration and n2 denotes 221 - n1. The only restriction placed
on the value of n1 was that n1 be greater than 15 (n1 > 15}. The
analysis procedure was started from the earliest date among the turbine
commissioning dates, 1953 to the next date, say, 196a such that n1
was greater than 15. Then linear regression analysis was performed on
the resulting 4 x n1 and 4 x n2 matrices and the corresponding
8
correlation coefficients noted for each of the four groups of charac
teristics. The value of n1 was then increased by increasing the per
iod of analysis and the correlation coefficients recomputed and compar
ed with the previously computed values. This process was repeated
until the resulting correlation coefficients were less than the nearest
previously computed values. Then the first period of analysis was
taken as the sample period corresponding to the highest value of corre
lation coefficient. The procedure was repeated to determine the next
period of turbine design characteristics. The second trial period was
selected to include one year after the first period up to the year such
that n1 for the second time interval exceeded 15 turbine characteris
tics. Two such periods identified for the 221 bulb turbines were:
1953 to 1965, constituting the first sample period, and 1966 to 1984,
the second sample period. The two above mentioned periods were then
used to group all the turbine characteristics throughout the rest of
the analysis to determine experience curves for low-head hydroelectric
tu-rbines. The only modifications made were in the cases where the
characteristics curves resulting from the regression analysis for the
two periods were so close as to justify representation by a single
regression curve or the number of turbine characteristics in each time
period were too few to justify the group classification. In all such
cases the period of analysis was taken to include 1953 to 1984.
STATISTICAL METHOD OF DATA ANALYSIS
The data used in developing the experience curves resulted from
the measurement of a number of variables and came from different
sources and were collected under a variety of conditions. In order to
describe the relationship existing between such variables, the standard
9
procedure is to formulate a statistical hypothesis setting forth the
explicit mathematical form of the relationship between the variables.
A common assumption is that the relationship between two variables, for
example, X and Y or the transformations of X and Y is linear. Having
assumed linearity, our objective then is to specify a rule by which the
11 best 11 straight line fitting X andY is to be determined. The 11 line of
best fit 11 is said to be that which minimizes the sum of the squared
deviations of the points of the graph from the points of the straight
line (with distances measured vertically). The general method of find
ing equations for approximating curves which fit given sets of data
points plotted on a rectangular coordinate is known as curve fitting.
One of the main purposes of curve fitting is regression which is the
process of estimating the variable Y (dependent variable) from the
variable X (independent variable). If Y is to be estimated from X by
means of some equation, the equation is called the regression curve of
Yon X. The degree of relationship between variables is known as
correlation. When only two variables are involved, the relationship is
called simple regression and simple correlation. When more than two
variables are involved, the relationship is known as multiple regres
sion and multiple correlation (Spiegel, 1961) and (Pindyck and
Rubinfeld 1981). Sometimes it helps to plot the scatter diagrams in
terms of transformed variables. For example if Log Y leads to a
straight line, log Y = a + bX will be used as an equation for the
approximation curve. The type of equations used in this study are:
Linear regression: y = a + bX
Exponential curve fit: y = aebx
Power curve fit: y = axb
10
',
Logarithmic curve fit: Y = a + log X 10
Where a, b and e are constants.
The degree to which numerical data tend to spread about an average
value is called the variation or dispersion of the data. One of the
most common measures of dispersion is the standard deviation, s. The
standard deviation of a set of N numbers x1, x2,
by the expression:
s = ( ~ (x - x)2 I N)0.50 j=l j
• • • • • • • X j is defined
which is the root square mean deviation and x is the arithmetic mean.
In the graphical representation of the curve, if parallel lines to the
regression line of Y on X are constructed at respective vertical dis-
tances s, 2s, and 3s from the regression line, statistical theory
states that there would be included between these lines 68%, 95% and
99.7% of the sample points, respectively. This is true only if the
numbers of data points, N, is large enough. The symbols with the s,
2s, and 3s lines are referred to as one-, two-, and three standard
deviations respectively.
The measure of how well a straight line explains the relationship
between two variables X and Y is the correlation coefficient, r and it
is expressed as the square root of the ratio of the explained variation
to the total variation. ( E(Y - Y) 2 I L: (Y - Y) 2 )0·50 where Y is the
estimated value of Y from the regression equation and Y is the
arithemetic mean value. Values of r = 1 or r = -1 denote perfect
correlation. The above defined statistical concepts have been used in
the data analysis and were embodied in the computer system used in the
studies and plotting the resulting experience curves.
11
The data used in the analysis were screened to include only tur
bines having complete information; those having incomplete information
or unusual operating characteristics were eliminated. The resulting
sets of data were analyzed using a computer system known as .. Statis
tical Analysis System .. (SAS), developed by SAS Institute, Inc. of North
Carolina, USA. The above named group of programs was run on IBM
Virtual Machine Facility/370 (CMS). The SAS computer system is set up
to perform linear regression analysis, to plot data values and to print
out any desired input or computed values. In order to use the trans
formed variable models, the data must be transformed and arranged in
the appropriate linear model form. The selection of turbine constants
used in the linear regression models was based on the turbine constants
currently used in practice and the type of information needed for pre
liminary investigation or feasibility studies of hydroelectric pro
jects.
Traditionally the turbine constants specific speed, Ns, and the
speed ratio, 0, are used to select the appropriate type of turbine and
with developed empirical equations estimates are made of turbine runner
diameter and turbine speed. These turbine constant terms of Ns and
0 are defined mathematically in Table 1 and procedures for using the
constants in preliminary design and feasibility studies are illustrated
in sample calculations in Appendix 2. Among the procedures illustrated
in the sample calculations is the method used in the U.S.B.R. Monograph
No. 20 for estimating turbine runner diameter and turbine speed. Other
turbine constants such as unit speed, unit power, and unit discharge,
that are used to report turbine test data were also calculated for the
manufactured units and analyses were made to develop regression
12
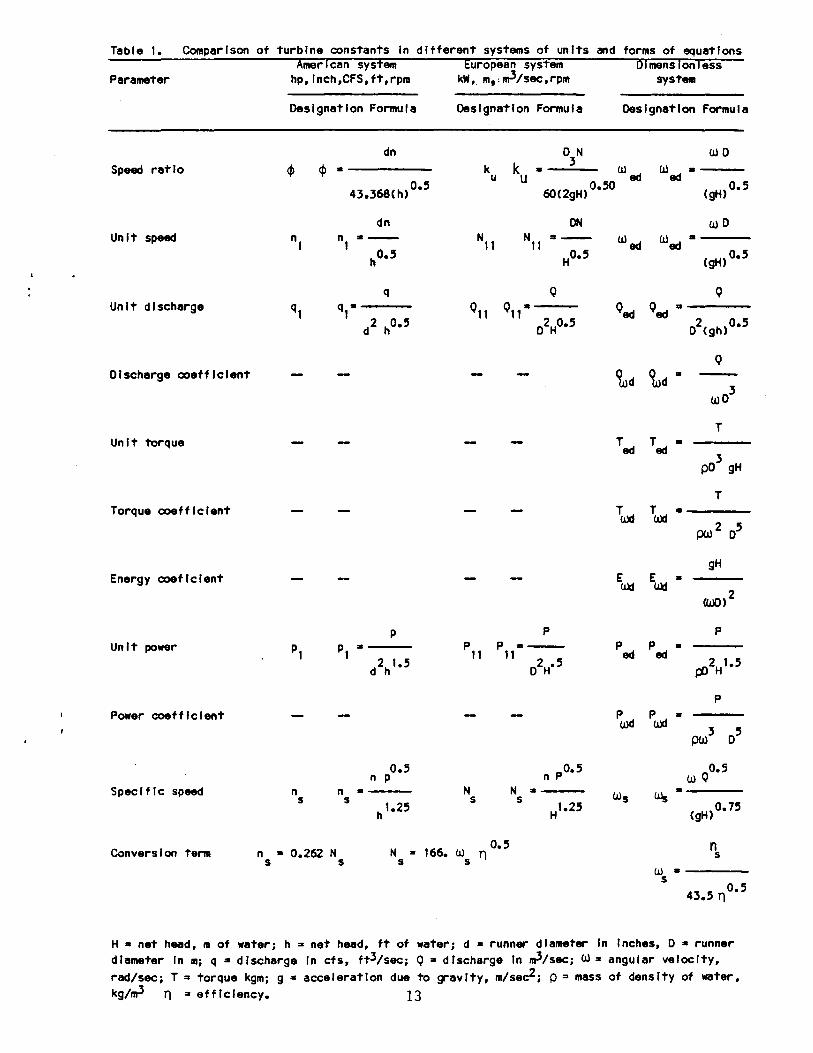
Table 1. Comparison of turbine constants In different systems of units and forms of equations American system European system Dimensionless
Parameter hp,lnch,CFS,ft,rpm kW, m,:m3/sec,rpm system
Designation Formula Designation Formula Designation Formula
Speed ratio
Unit speed
Unit discharge
Discharge coefficient
Unit torque
Torque coefficient
Energy coeflclent
UnIt power
Power coefficient
SpecIfIc speed
ConversIon term
dn
<P ·----
n1
n 5
n • 0.262 N
43.368(h) 0"5
dn
q q., __ _
1 d2 ho.s
p
p ·---1
0.5 n p
n •---s N s
N .. 166. Ul s s s s
WO k
u
0 N 3
ku • wad
60C2gH)0.50
(1) • ---ad
CgH>o.s
ON =--
Q
p
p ·-11
N •---
0.5 T)
s
(1)0
(.\)ad.--
(gH)o.s
Q
Qed Qed .. ----
02Cgh)o.s
Q
~d ~d.
TUld
T • ad
T
3 pO gH
T
T •----Uld pw2 o'
gH
p
p p • Uld
Uls ·----(gH)0.75
n s
(1) • ----s
H • net head, m of water; h "' net head, ft of water; d • runner diameter In Inches, 0 .. runner diameter In m; q .. discharge In cfs, ft3/sec; Q • discharge In m3/sec; Ul z angular velocity, rad/sec; T • torque kgm; g • acceleration due to gravity, m/sec2; p =mass of density of ~ter, kg/m3 n "'efficiency. 13
relations between the different constants and the basic parameters of
rated head, rated power output, rated discharge, turbine speed, and
turbine diameter.
In this study emphasis was directed toward relations of specific
speed to rated head, speed ratio to specific speed, and the relation of
these constants to actual runner diameter and actual runner speed the
same as was used in the approach defined in the U.S.S.R. Monograph No.
20.
14
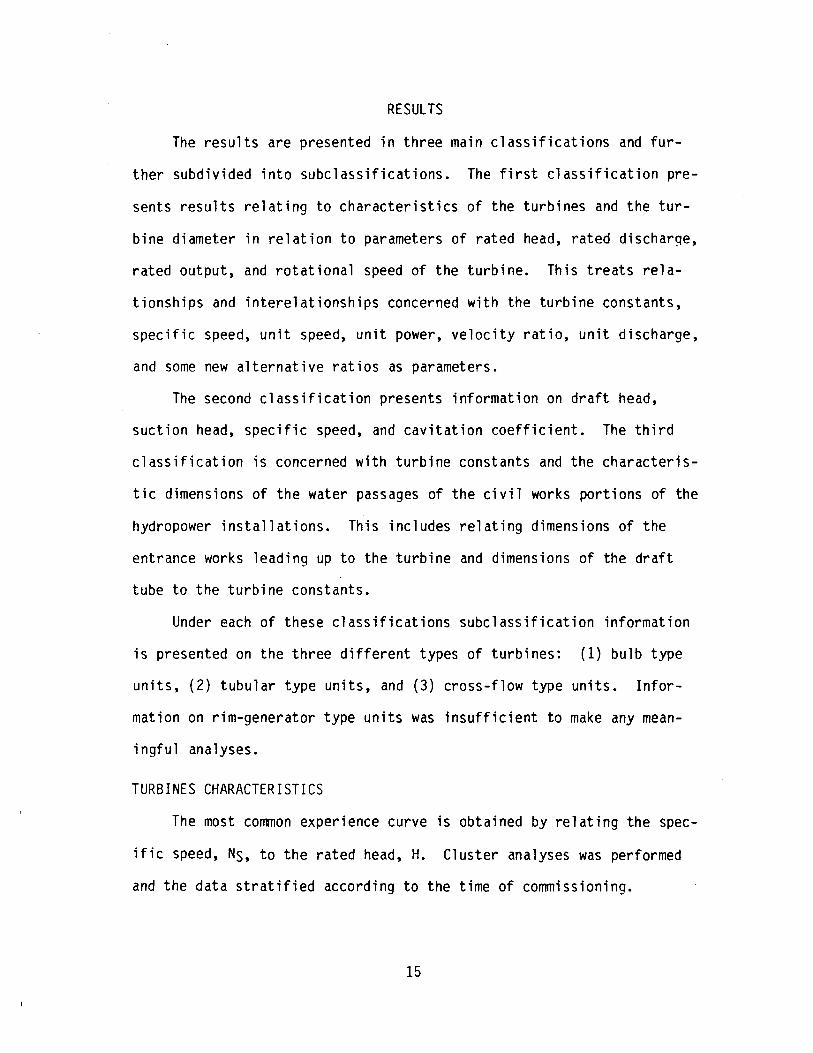
RESULTS
The results are presented in three main classifications and fur
ther subdivided into subclassifications. The first classification pre
sents results relating to characteristics of the turbines and the tur
bine diameter in relation to parameters of rated head, rated discharge,
rated output, and rotational speed of the turbine. This treats rela
tionships and interelationships concerned with the turbine constants,
specific speed, unit speed, unit power, velocity ratio, unit discharge,
and some new alternative ratios as parameters.
The second classification presents information on draft head,
suction head, specific speed, and cavitation coefficient. The third
classification is concerned with turbine constants and the characteris
tic dimensions of the water passages of the civil works portions of the
hydropower installations. This includes relating dimensions of the
entrance works leading up to the turbine and dimensions of the draft
tube to the turbine constants.
Under each of these classifications subclassification information
is presented on the three different types of turbines: {l} bulb type
units, {2) tubular type units, and (3) cross-flow type units. Infor
mation on rim-generator type units was insufficient to make any mean
ingful analyses.
TURBINES CHARACTERISTICS
The most common experience curve is obtained by relating the spec
ific speed, Ns, to the rated head, H. Cluster analyses was performed
and the data stratified according to the time of commissioning.
15
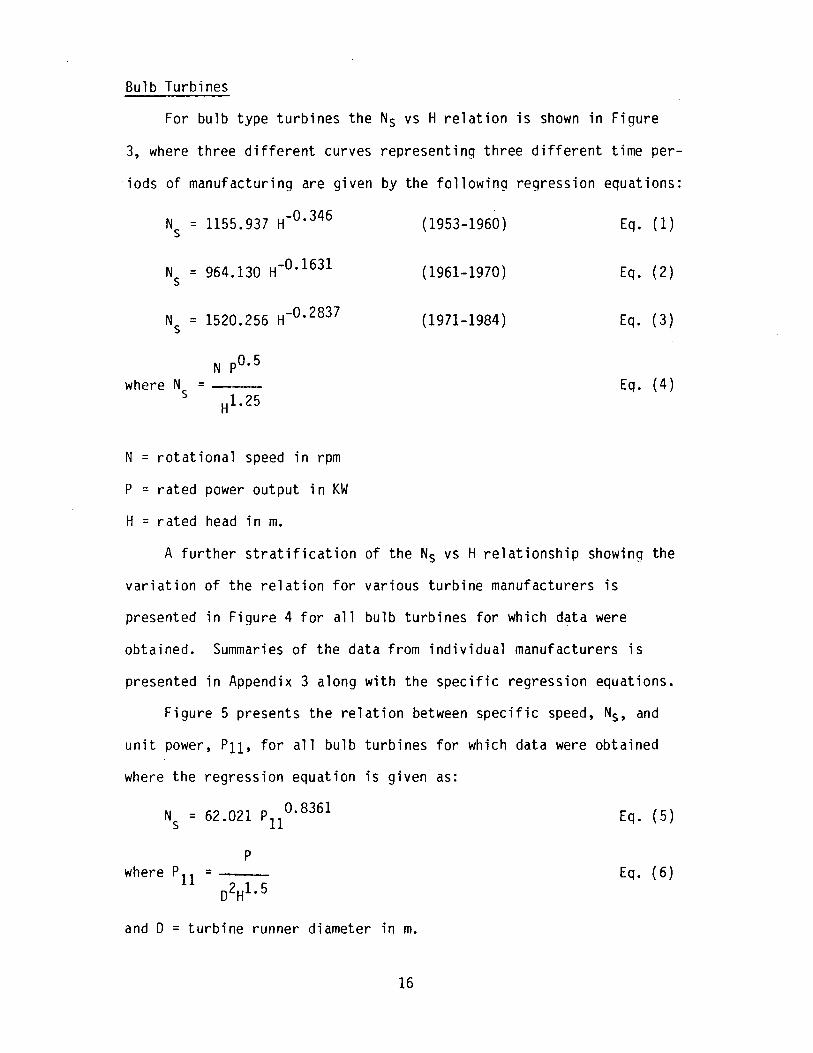
Bulb Turbines
For bulb type turbines the
3, where three different curves
iods of manufacturing are given
N = 1155.937 H-0· 346 s
Ns = 964.130 H-0· 1631
Ns = 1520.256 H-0· 2837
N P0.5 where N = s H1.25
N = rotational speed in rpm
P = rated power output in KW
H = rated head in m.
Ns vs H relation is shown in Figure
representing three different time per-
by the following regression equations:
(1953-1960) Eq. ( 1)
(1961-1970) Eq. (2}
(1971-1984) Eq. (3~
Eq. (4)
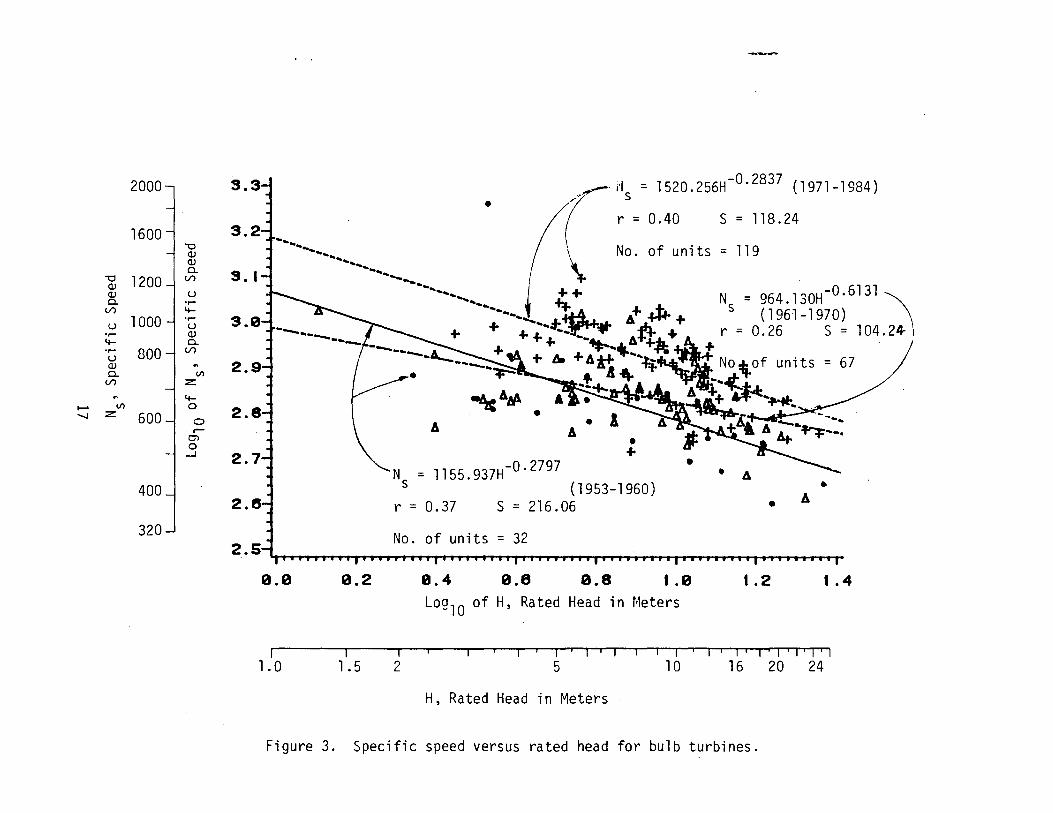
A further stratification of the Ns vs H relationship showing the
variation of the relation for various turbine manufacturers is
presented in Figure 4 for all bulb turbines for which data were
obtained. Summaries of the data from individual manufacturers is
presented in Appendix 3 along with the specific regression equations.
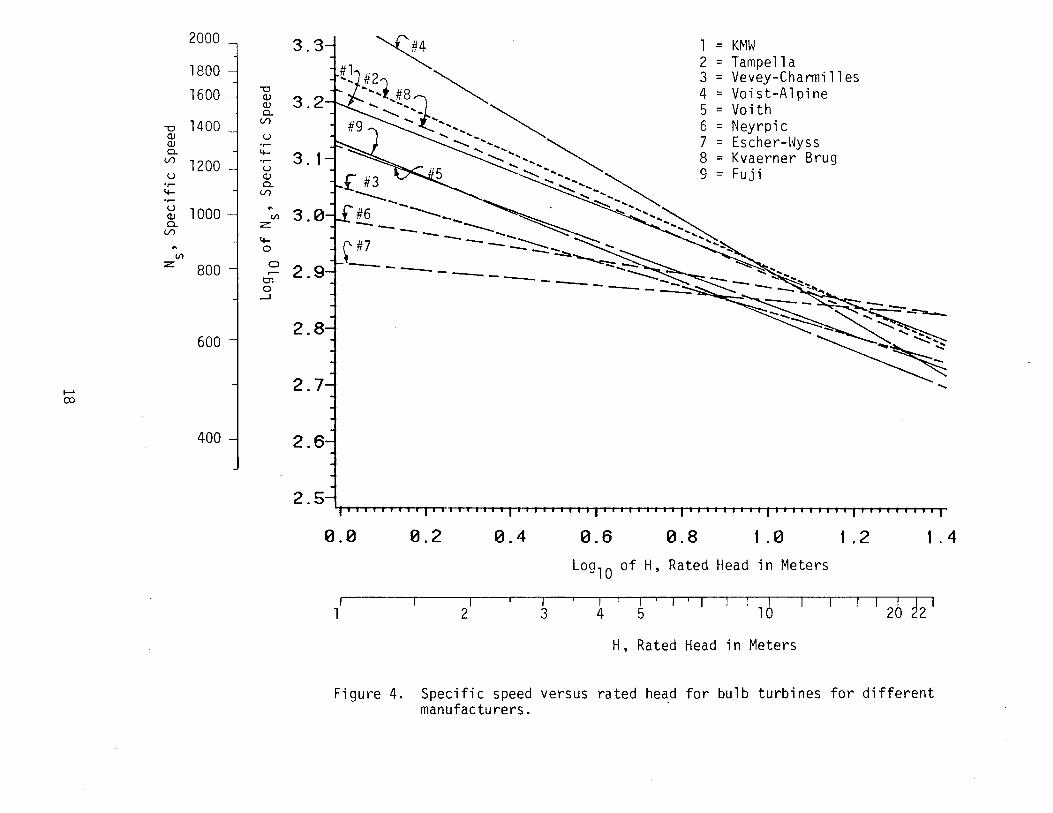
Figure 5 presents the relation between specific speed, Ns, and
unit power, P11, for all bulb turbines for which data were obtained
where the regression equation is given as:
p where P 11 = ---
02Hl. 5
and 0 = turbine runner diameter in m.
16
Eq. ( 5)
Eq. ( 6)
2000
1600 "'0 Q) Q) 0..
"'0 1200 Q) ll)
Q) u 0.. .,.... ll) 4-
u 1000 .,.... u .,.... Q)
4- 0.. .,.... 800 u ll)
Q) .. 0.. (/)
ll) z .. 4-...... (/) 0 ........ z 600 0 .--
Ol 0
....J
400
320
3.3
3.2
S. I
3.0
2.9
2.8
2.7
2.6
2.5 1'''''''''1''
0.0 0.2
• ro_,-- ds = 1520.256H-0· 2837 (1971-1984)
r = 0.40 S = 118.24
~ No. of units = 119
~AI/A •
A • A
= 1155.937H-0.2797
r = 0.37 (1953-1960)
s = 216.06
No. of units = 32
0.4 0.8 0.8 1.0 Log 10 of H, Rated Head in Meters
Ns 964.130H-o ·6131 ~ (1961-1970) "" \
0.26 S = 104.24- I
units = 67
• • A
1.2 1.4
I I I I' I' I I I' I' I 1. 0 1. 5 2 5 10 16 20 24
H, Rated Head in Meters
Figure 3. Specific speed versus rated head for bulb turbines.
2000 -
1800 j 1600 -o
QJ QJ Cl..
1400 Vl -o QJ u QJ .,... Cl.. 4-Vl 1200
.,... u
u QJ .,... Cl.. 4- Vl r-
u 1000 "' QJ Vl Cl.. :z:: Vl
4-"' 0 Vl
:z:: 800 0 .--
Ol 0
....J
......
600 1 co
400 -l
3.3
3.2
3. 1
3.0
2.9
2.8
2.7
2.6
2.5
1 = K~1W 2 = Tampella 3 = Vevey-Charmilles 4 = Voist-Alpine 5 = Voith 6 = Neyrpic 7 = Escher-\~yss 8 = Kvaerner Brug 9 = Fuji
',-,·-·~·-·I I I I I I I I I I I' I I I I I I I I I I I I I' I I I I I' I I I I I I I I I I I I iII 1
0.0 0.2 0.4 0.6 0.8 1 . 0 1 . 2 1 . 4 Log 10 of H, Rated Head in Meters
l r- ---~ 2 r-- - r 4 5 -l ~ 16 I I r I 2 b ~ 2 I
H, Rated Head in Meters
Figure 4. Specific speed versus rated head for bulb turbines for different manufacturers.
...... w
-o Q) Q) c..
V')
u .,.... 4-.,.... u Q) c..
V')
ft
Ul z
2000
1800
1600
1400
1200
1000
800
600
400
3.3
3.2
-o Q)
~ 3.1 V')
u .,.... 4-. ,.... u ~ 3.0
V')
ft
Ul z
6 2.9 0 r-
O'l 0
_J
2.8
2.7
• •
•
• •
•
~/ . ,/• / . ~ . /.-. ··/../..- .
• . /r::,:i../7 .. .,/' J.•'~ . /~ .~ •. •
.~.·!'·~~~ :_;:: •" '.~~,_ N • • s
• r =
= 62.021P11 °·8361
(1953-1984) 0.87 s = 63.41
No. of units = 213
• 2 • 6'i I I I 1.-; : I I ~I I (I~ I I I I I I I I I I I I I I I I I I I I I I I I I I I I I I I I I 1 I 1 1 I 1 1 I I I I I I I I I I I I 1 I I 1 I I I I I
0.9 1.0 I . I I . 2 I . 3 t . 4 1 . 5 1 . 6 Log 10 of P11 , Unit Power
r-·-r --,r -- ,-- a- T ~r- ,- ,1 I ,'a I 2b I I I I I I I I 13b I I I I I I I I 46
P11 , Unit Power
Figure 5 . Specific speed versus unit power for bulb turbines.
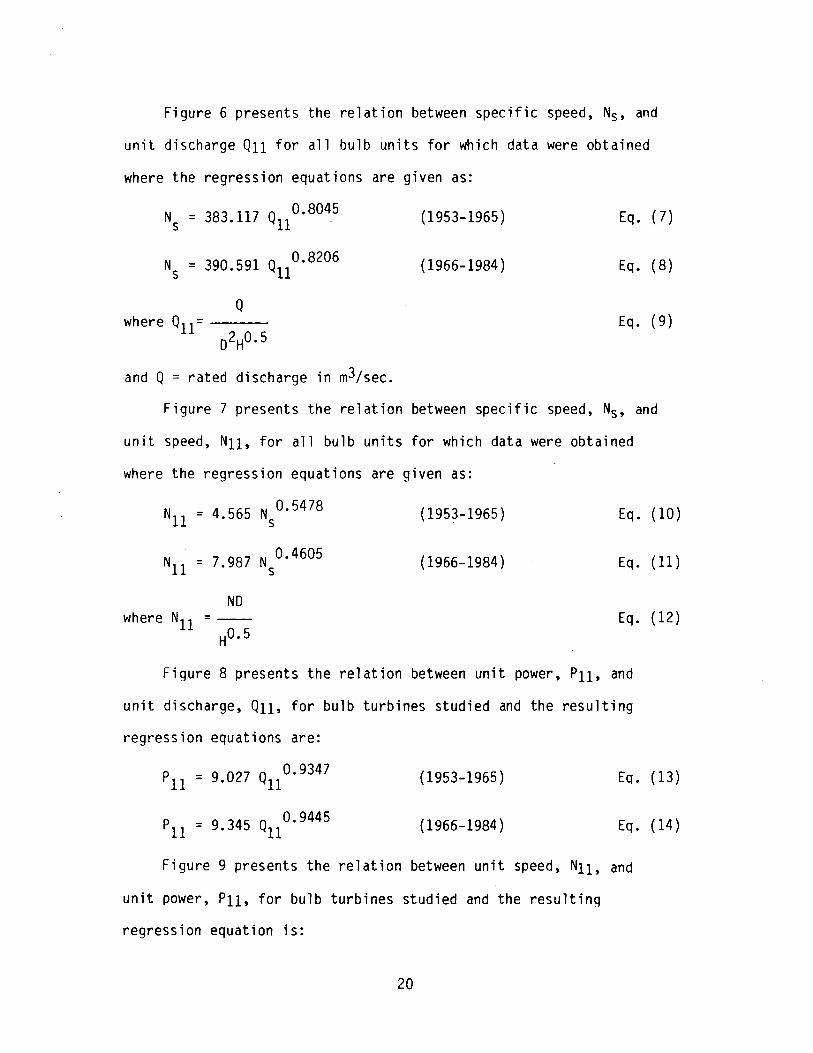
Figure 6 presents the relation between specific speed, Ns, and
unit discharge 011 for all bulb units for which data were obtained
where the regression equations are given as:
N = 383.117 On 0.8045 (1953-1965) Eq. (7) s
Ns 390.591 o11 0.8206 (1966-1984) Eq. ( 8) =
0 where 011 = Eq. ( 9)
D2H0.5
and 0 = rated discharge in m3Jsec.
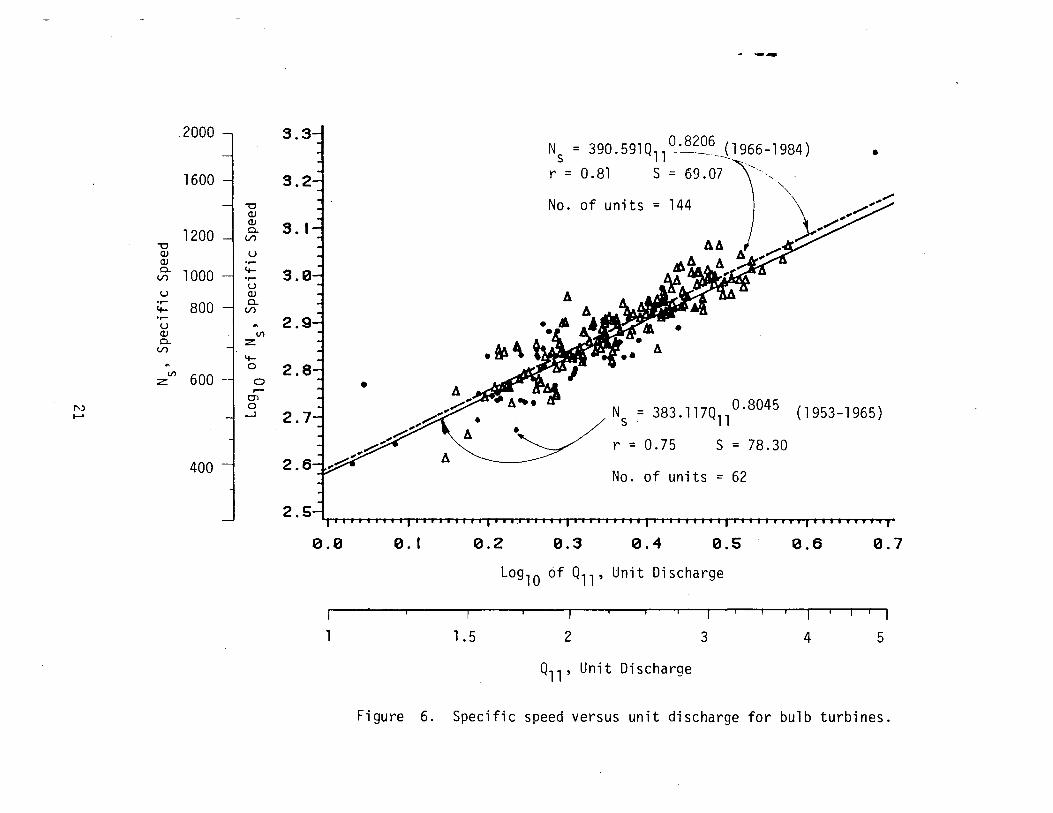
Figure 7 presents the relation between specific speed, Ns, and
unit speed, N11, for all bulb units for which data were obtained
where the regression equations are given as:
Nll = 4.565 Ns0.5478
Nll = 7.987 Ns0.4605
NO where N11 = --
H0.5
(1953-1965)
(1966-1984)
Eq. (10)
Eq. ( 11)
Eq. (12)
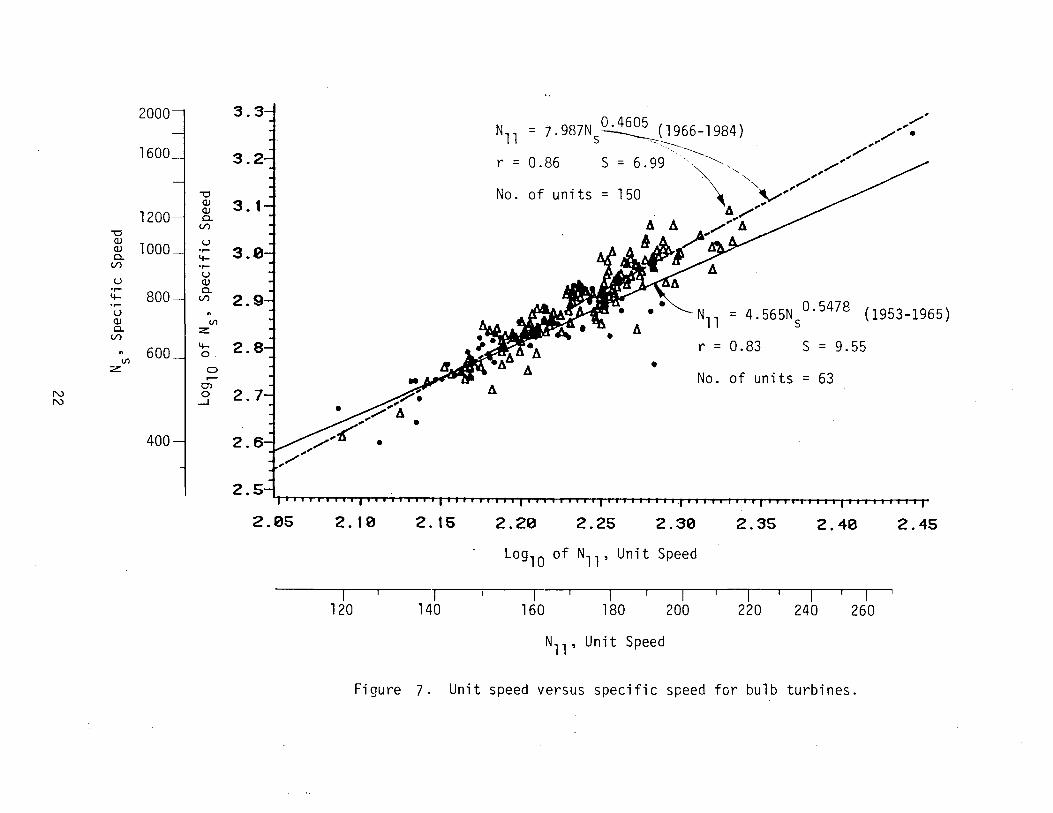
Figure 8 presents the relation between unit power, P11, and
unit discharge, 011, for bulb turbines studied and the resulting
regression equations are:
pll = 9.027 0110.9347
pll = 9.345 0110.9445
(1953-1965) Eq. (13)
(1966-1984) Eq. (14)
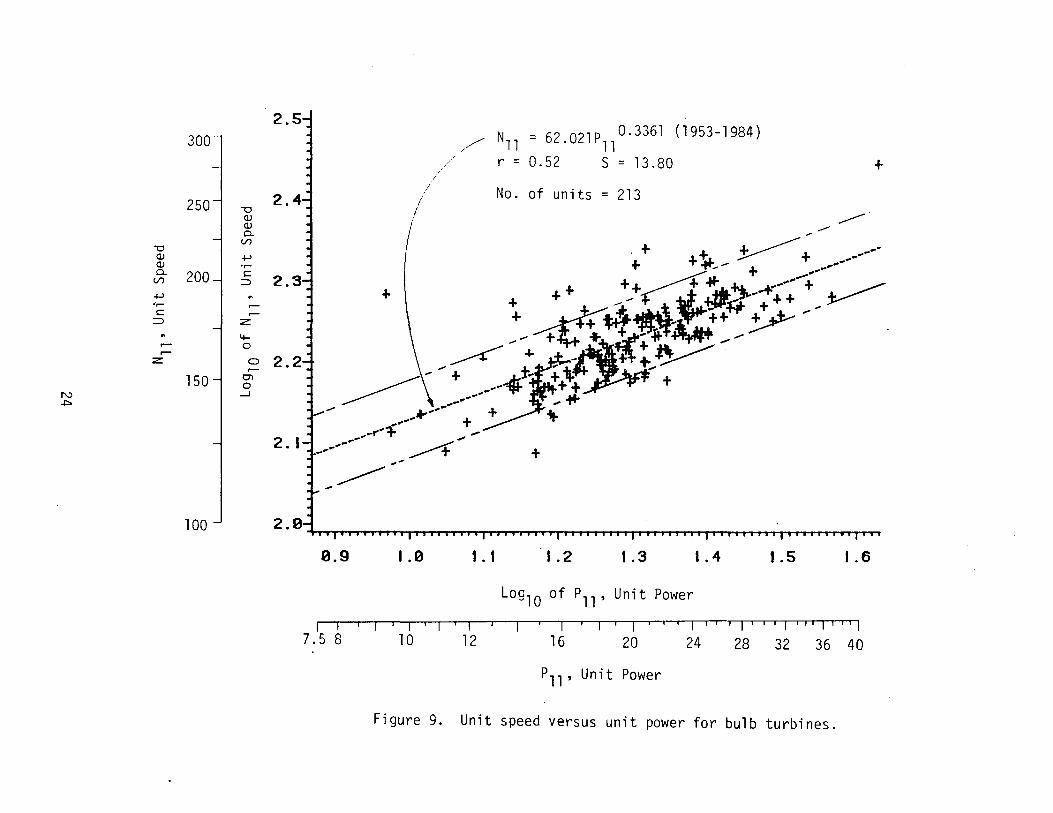
Figure 9 presents the relation between unit speed, N11, and
unit power, P11, for bulb turbines studied and the resultinq
regression equation is:
20
~ --2000 --, 3.3 I
N = 390.591Q11 °·82~?-11966-1984) • s ';.-,
3.21-r = 0.81 S = 69.07 1600 -l
-o No. of units = 144 (1) (1)
3. I 1200 0.. (/)
-o (1) u (1) .... ~ 1000 4- 3.0 ....
u i A u (1) ....
800 0.. 4- (/) .- 2.9 u "' (1) V')
0.. z (/)
4-"' 0 V') 600 -z 0
? 7j • A ,......
0.8045 01 ~-.,A-.• a-
Ns ~ 383. 117Q11 (1953-1965) J _3 .. I') _,.. ......
r = 0.75 s = 78.30 400 ~ 2.6~ A ~
No. of units = 62
0.0 0. I 0.2 0.3 0.4 0.5 0.6 0.7
Log 10 of Qll, Unit Discharge
I I -,
1 1.5 2 3 4 5
Q11 , Unit Discharge
Figure 6. Specific speed versus unit discharge for bulb turbines.
2000
1600 __ N = ].987N °· 4605 (1966-1984) 11 S~:--:---------__
---- -------r = 0. 86 S = 6. 99 -- -~
"'0 Q)
No. of units = 150 Q) Cl.
(,/') "'0 Q) Q)
u .,.... Cl. 4-
(,/') .,.... u
u Q) .,.... 4- 800 Cl.
.,.... (,/') 2. u Q)
~
Cl. Vl
(,/') z:
~ 600 4-
Vl 0
:z: 0 r-
r::n
• N11 = 4.565Ns 0· 5478 (1953-1965) A
r = 0.83 s = 9.55 •
No. of units = 63 N N
40J 0
...J
~ ~rA 2.
•
2.05 2. 10 2. 15 2.20 2.25 2.30 2.35 2.40 2.45
Log10 of N11 , Unit Speed
I I I -~-
120 140 160 180 200 220 240 260
N11 , Unit Speed
Figure 7. Unit speed versus specific speed for bulb turbines.
·.-
40--, 1.6-l p = 9 345Q 0·9445 (1966-1984) (11. 11 d
r = 0.84 S = 2.17 30 -I t.Si ( 11
s.. No. of units = 144 Q)
3: 0 1.41 \ A 11
~ 201
0...
+> •r- A c: ::J 1.3 .. r-r-
0...
r-
l 4- 1.2 r- 0
0... 0 r-
1.1 en 0
1.0j .,/' A 0. 9347 I'.'
lOJ ...J
, ......... ~ pll = 9.027Qll (1953-1965) w ,........: - .
~, ~- 0.93 s = 1.18
8-4 0.9 I No. of units = 62
6
0.0 0. I 0.2 0.3 0.4 0.5 0.6 0.7 Log10 of Q11 , Unit Discharge
---- -~---------T I I I I I
1 1.25 1.5 2 3 4 5
Q11 , Unit Discharge
Figure 8. Unit power versus unit discharge for bulb turbines.
2.5 /__,_. N
11 = 62.021Pll0.3361 (1953-1984)
r = 0.52 S = 13.80 +
2.4 No. of units = 213 -o (lJ (lJ Q_ (/)
-o
2001 (lJ +> (lJ •r-Q_ c (/) ::::>
+> . ....... ..-c ..-
::::> z 4-0 ..- I z 0 ..-
Ol 0
1\.J I _J
~
. + ~ _.---· + +~ ~ ...
+ + + ++~~- + + .................. --·
+ ~-- fl_.+.£. .. --t ~ ._,. ............. +
~~~< .. + ~t~~. ~..}+~ ;:::-~-v-------\ + ~--- ;'.A-+~~/ . ~ ----- ----~ + ij: +~ ;..:.---
... ----- ++ t ........ + .... -tf-........ ,.. .. ':Jo + .... ----~--- -- __..---:t /
+
+
100 2.~
~.9 1.~ 1.1 1.3 1.4 1.5 I .6
Log1 0 of P 11 , Unit Power
I I I I I I I I I I ' I I I I I I I I I I I I I I I I I I I If I I I II I
7.5 8 10 12 16 20 24 28 32 36 40
P11 , Unit Power
Figure 9. Unit speed versus unit power for bulb turbines.
0.3361 N11 = 62.021 P11
(1953-1984) Eq. (15)
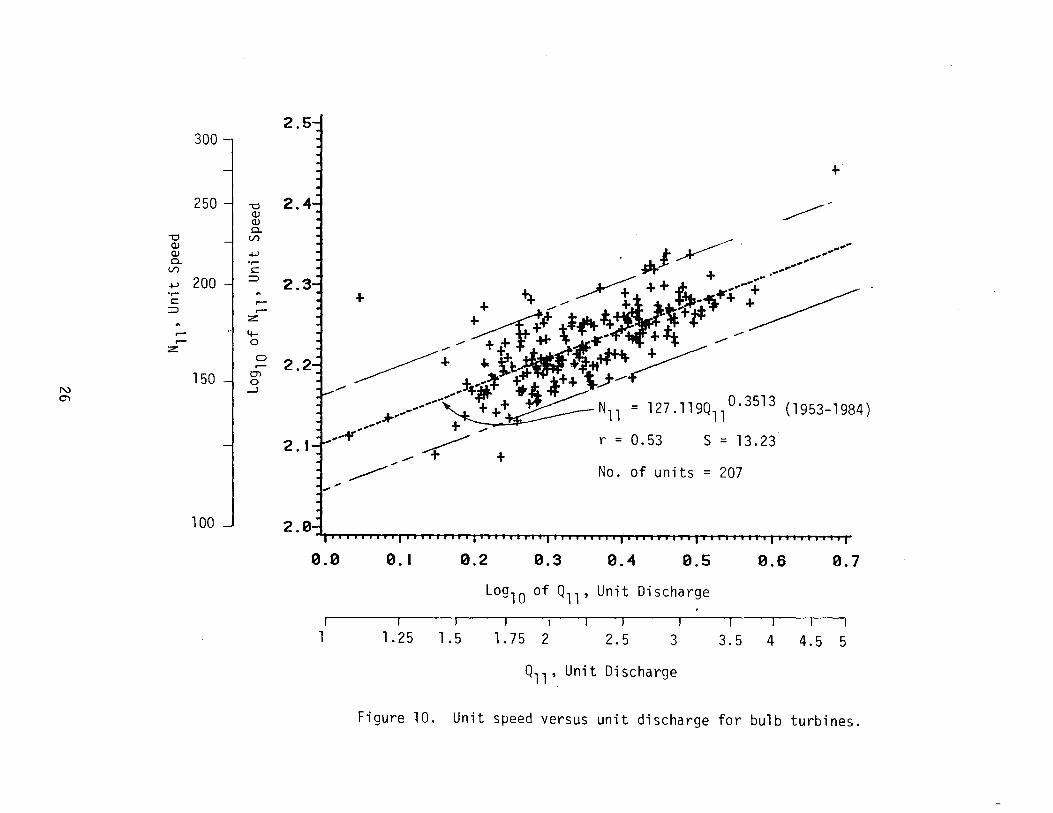
Figure 10 presents the relation between unit speed, N11, and
unit discharge Qll for bulb turbines studied and the resulting
regression equation is:
(1953-1984) Eq. (16)
In many engineering offices and in some manufacturer's compari-
sons, the speed ratio or velocity ratio is used instead of the term
unit speed, N11' by practice and mathematically speed ratio is:
0 ~ N -3 0 = = 11.82086 x 10 Nll * Eq. (17) 60 ffgH
where g = acceleration of gravity in m/sec2
0 = turbine diameter in m.
Using the speed ratio, 0, as a characteristic turbine parameter rela-
tions were developed for manufactured bulb type turbines as follows:
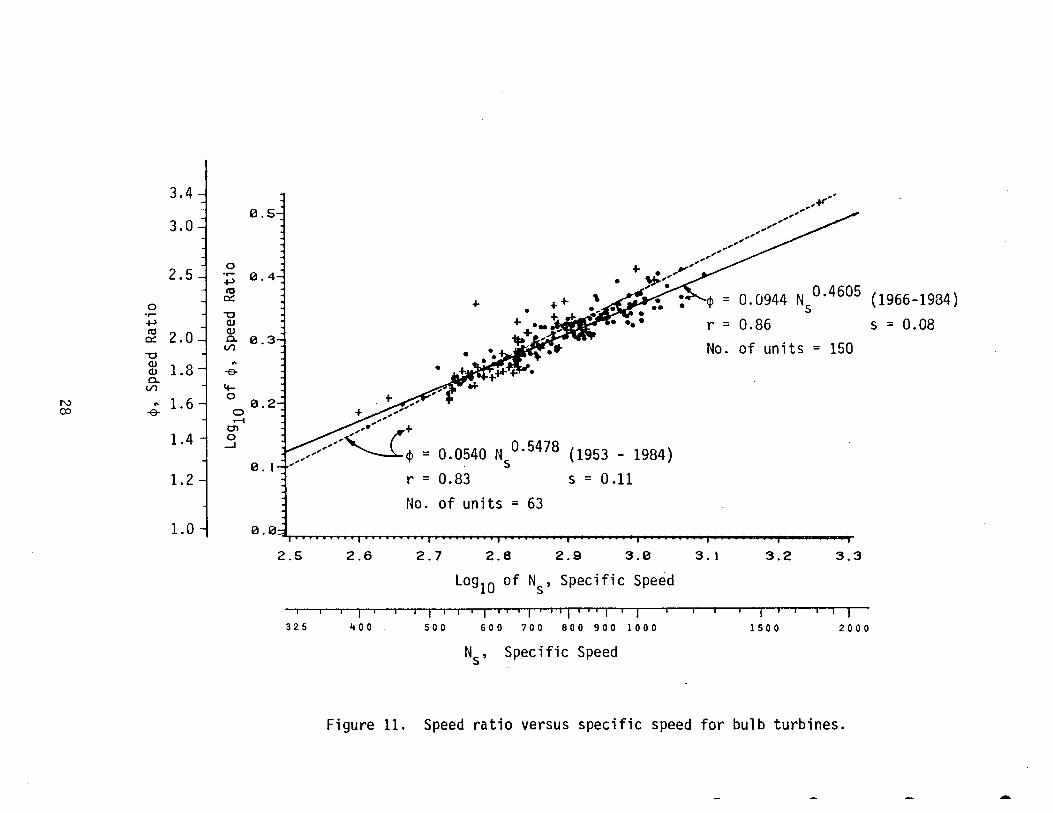
0 = 0.0540 Ns 0· 5478 (1953-1965) Eq.
0 = 0.0944 Ns 0· 4605 (1966-1984) Eq.
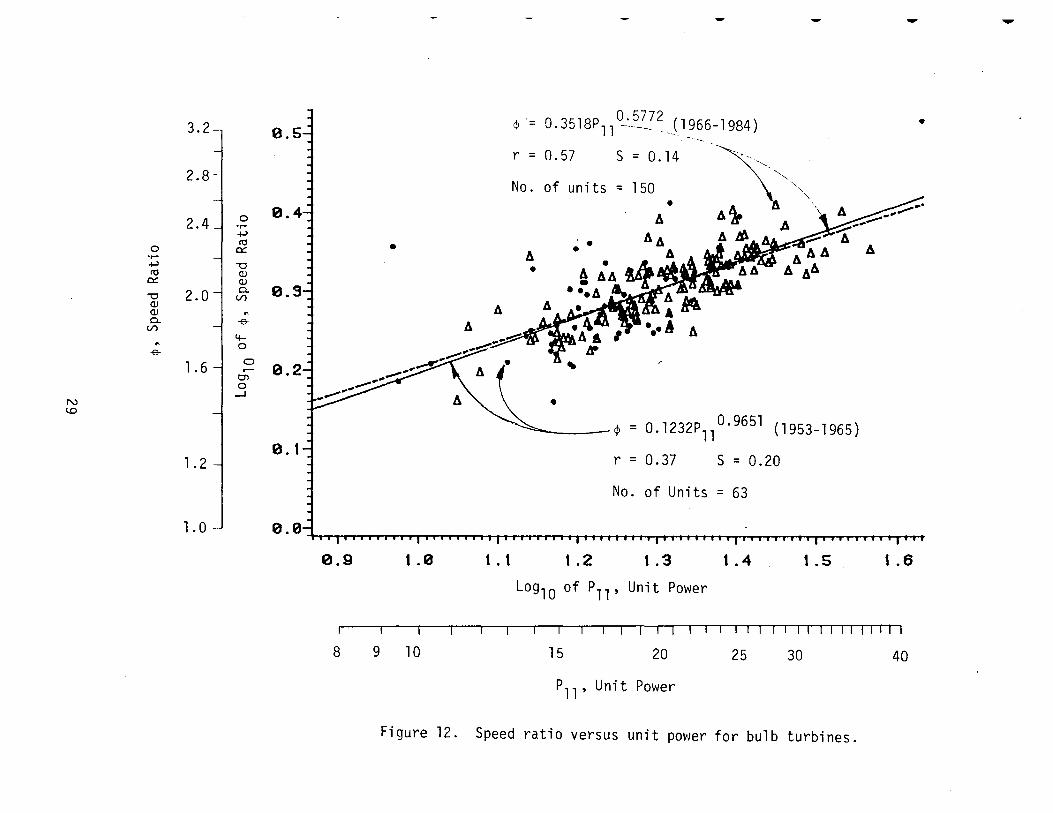
0 = 0.1232 pll 0.9615 (1953-1965) Eq.
0 = 0.3518 pll 0.5772 (1966-1984) Eq.
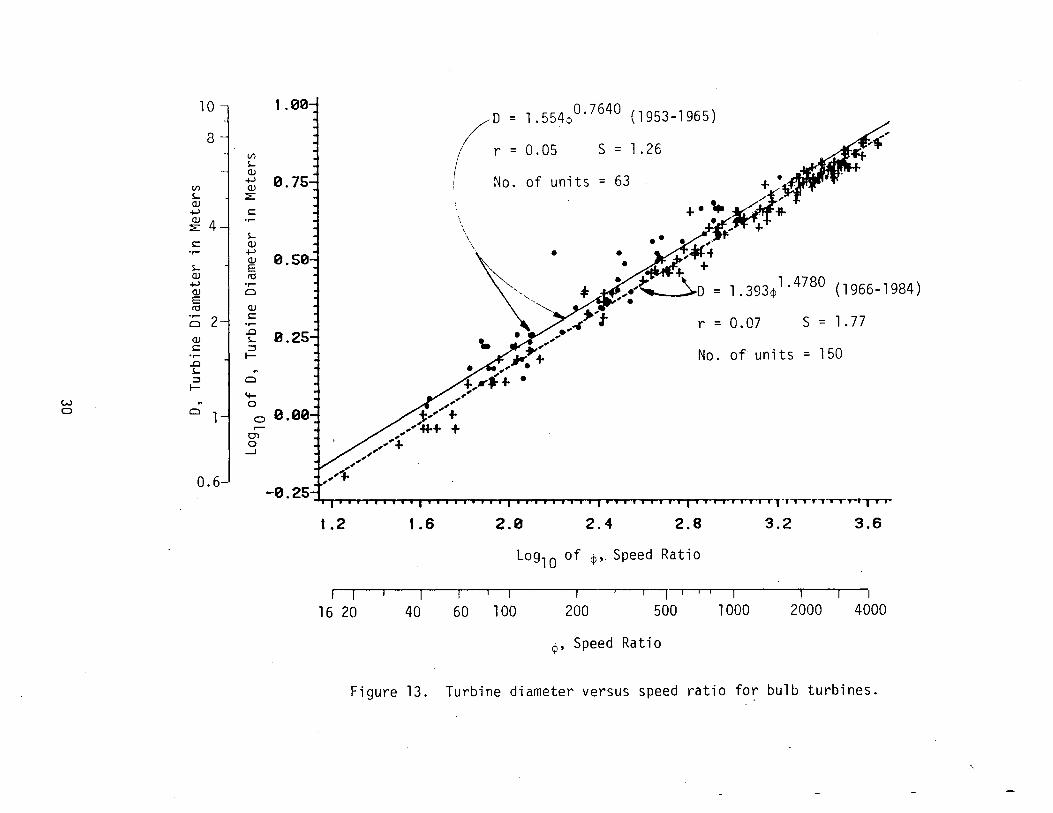
0 = 1. 554 00.7640 (1953-1965) Eq.
0 = 1. 393 01.4780 (1966-1984) Eq.
* Sometimes the speed ratio is expressed in the American system of units and the 0 is expressed in inches and the H in feet.
25
(18)
(19)
(20)
(21)
(22)
(23)
N C'l
-o (l) (l) 0.
(/')
300
250
+> 200 I::
:::J
...
...-z:
150
-o (l) (l) 0.
(/')
+-' ...... I::
:::J
.-z:
_I 4-o
0 .-
en 0 _l
2.5
2. I
+
_,---
. j~ . -------""" / + ""'" -~ +- + + ~ + -- .------------\;(,{ t*~ ~j;lj\~.t*~~+-:+ -------
~ + ~ Pc T ~#oF '1:"'...(+ .1i --------- ~,..~ ~1;.it4Ht . + _:..-..-- ~
....................... ~ .... :t+"'~ \..t_ .j++ \J--..----......... * +++ ~ ,-...Y + N -
....---- 11- 127.119Q 0.3513 - + + r = 0. 53 11 ( 1953-1984)
+
s = 13.23
~ No. of units = 207 ,..
. iII I I I I I I I I I Iii I I I I I 1 00 _j 2 , 0--:J I I I I I I I I I I 1 1 1 1 1 1 1 1 1 I 1 1 I I I I I I I I I I I I I • ' ' ' I I I I' I IiI I I I
0.0 0. I 0.2 0.3 0.4 0.5 0.6 0.7
Log10 of 011 , Unit Discharge
r --- --,----~--~---, ---.-------,---,-- --T
1 1.25 1.5 1.75 2 2.5 3 3.5 4 4.5 5
011 , Unit Discharge
Figure 10. Unit speed versus unit discharge for bulb turbines.
The graphical relations for these three regression equations are shown
in Figures 11, 12, and 13. In seeking a simplification for use of
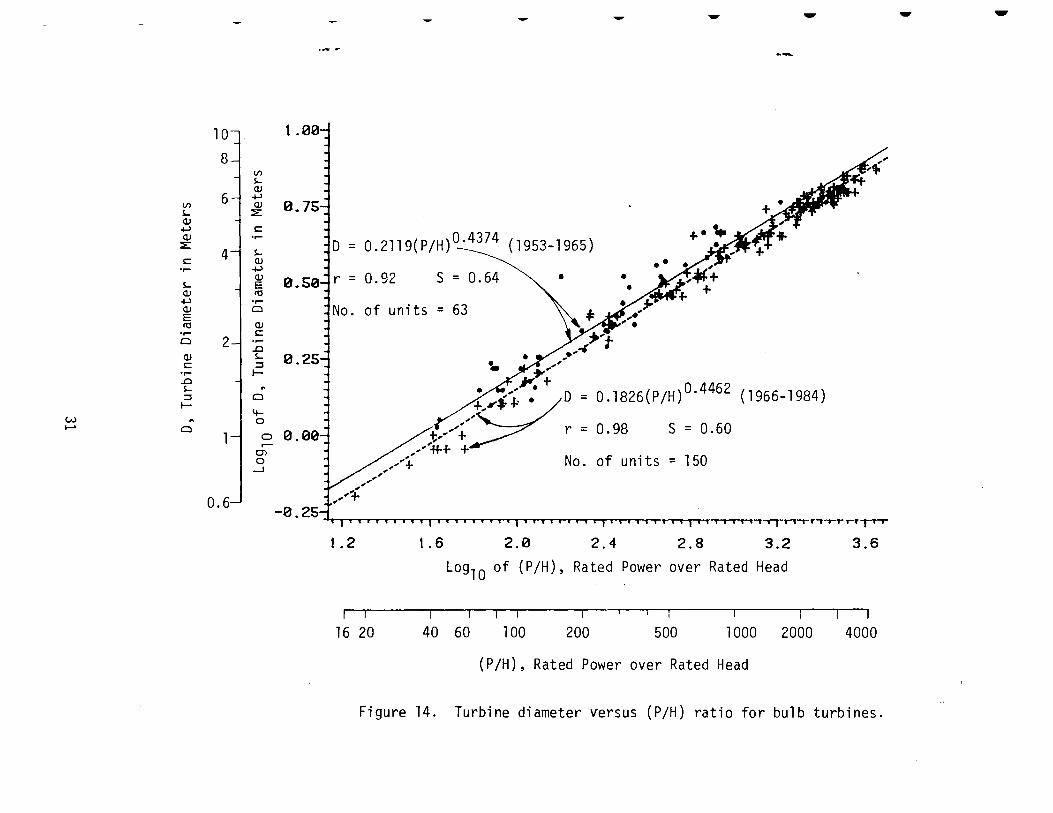
experience curves it was recognized that relating diameter to the basic
well known parameters of rated head and rated power would be most use
ful because in preliminary planning the parameters of rated head and
rated power are most generally estimated early in the planning of pro
jects based on the physical elevation situation of the water and the
power available from the estimated flows. On this basis a new regres
sion analysis was made relating turbine diameter to the ratio of P/H
where P is the rated power output and H is the design head or rated
head. Figure 14 presents for manufactured bulb type turbines the rela-
. tion between turbine diameter and the ratio of rated power to rated
head and the resulting regression equations are:
D = 0.2119(P/H)0· 4374
0 = 0.1826(P/H) 0· 4462
(1953-1965)
(1966-1984)
Eq. (24)
Eq. (25)
A similar new relation was developed relating turbine diameter to the
ratio of rated discharge, Q, to the operating speed, N. This relation
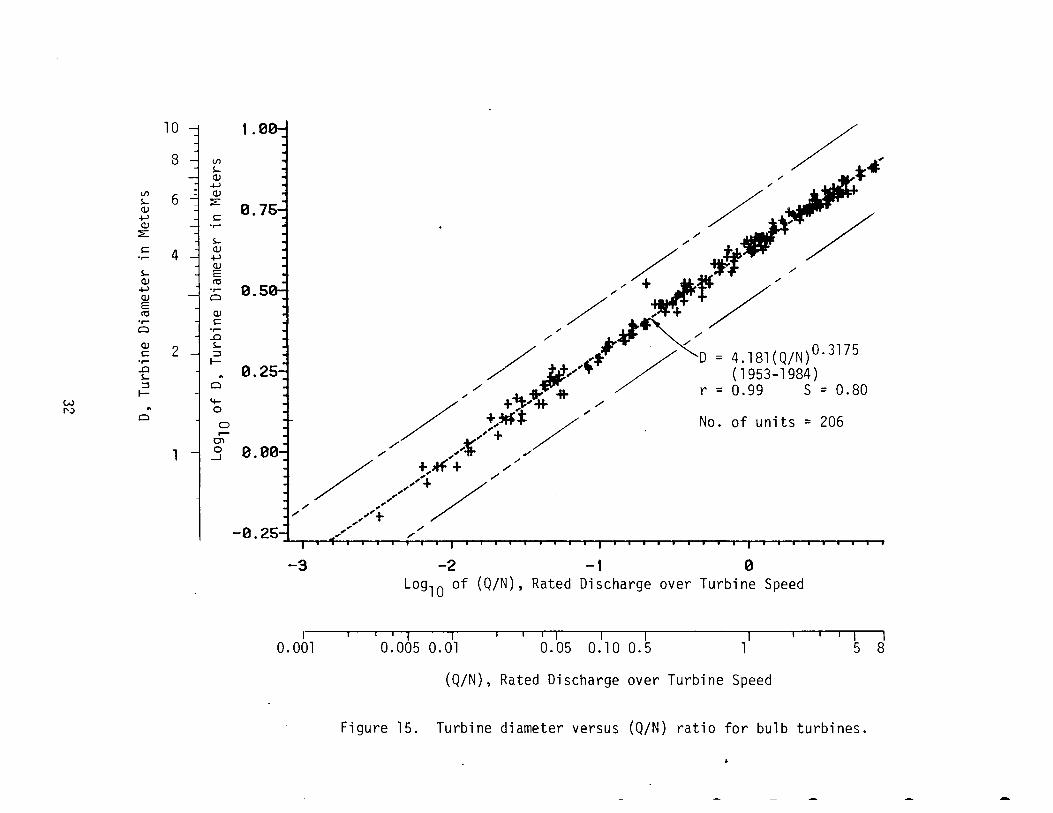
ship is shown in Figure 15 and the resulting regression equation is:
D = 4.181 (Q/N) 0· 3175 Eq. (26)
This again recogniz~s that in early planning stages the rated discharge
is known from the hydrologic analysis of power or energy potential at a
site and the choices of operating speeds are rather limited because
there are a limited number of available synchronous speeds at which
bulb turbines can operate if directly connected to the generator.
27
3.4
3.0
2.5
0 .,.... +-'
~ 2.0 "'0
~ 1.8 0.
(./)
N .. 1.6 co -e-
1.4
1.2
1.0
.,..~· ~' e .5-I ,,. ,,. ,., ,.,. ,.,
,.,.' ,.,. ,., ,.,. ,, 0 + • ,Y .,.... e.4 ~,, +-'
~,. • ¢ = 0.0944 Ns0·4605 {1966-1984) 10 0:: + "'0 <LI <LI {]; 0.3
.. -e-4-0
0.2 0 r-t
en 0
---I
0. I ,,,''
+~, /''-
<Z__{_,•'' + ,
,~,,' <P =
A •
0.0540 N °· 5478 {1953 - 1984) . s r = 0.83 s = 0.11 No. of units = 63
r = 0.86 No. of units = 150
B .ia_.~,i~•~•,•~•~•,•~•~•~•~i,'~'rTo~o~•~•~•~•~•ii~•~•~orTo~•~•~•~•~•Ti~•~•~•~orT~~~rl~~~~.-~~~~~ .. ~.-~~~~~ .. ~~~~~~~--~--~.-•ir 2.5 2.6 2.7 2.8 2.9 3.e 3.1 3.2 3.3
Log 10 of Ns' Specific Speed
I I I I I I I I I I I I I I I I I I I I I I I I I J I I I I I -r--.--,-nl 1 325 400 500 600 700 800 900 1000 1 50 0 2000
N5
, Specific Speed
Figure 11. Speed ratio versus specific speed for bulb turbines.
s = 0.08
-
3. 2-, 0.5~ - 0.5772
¢ - 0.3518P 11 ------ ___ (1_966-1984) • --
r = 0.57 S = 0.14 \ 2.8--l j
No. of units = 1 50 '"'---- ~",, • A ,
2.4 J .~ --~I A 4~ ,
A +->
0 AA~ 0 l1:l • 0::: 11 • 4 4 A4 4
•r-+-> -o
• A A\ ~~ 44 4 AA l1:l (!) 0::: (!)
2.0 0. -o V) (!)
~ 4 (!) ~
0. -& 4 V)
4-~ 0
-&
1.6 0 no ,_j -~ ~· ~,
r- . Ol 0
_J
N J ~ a""-\ • ~
¢ = O.l232P11 °· 9651 (1953-1965)
1.21 0.11 r = 0.37 s = 0.20
No. of Units = 63 I ~
1.0 ..., I I I I I I' I I I I I I I I I I I I I I I
0.9 1.0 t.t 1.2 t.3 1.4 t.S t . 6
Log 10 of P11 , Unit Power
I IIIITI IITTll lllfl
8 9 10 15 20 25 30 40
P 11 , Unit Power
Figure 12. Speed ratio versus unit power for bulb turbines.
10 I 1 . 00"'1 ~D = 1.554·0·7640 (1953-1965)
8-l
0.7J (/) 1 r = 0. 05 S = 1 . 26 s.... ( QJ
No. of units = 63 .j..) (/) QJ s.... ::E: QJ
.j..) 1:::
~ 4 ......
s.... 1::: QJ ...... .j..)
0.50 QJ s.... E QJ ro
~ ~-'-, 4: ~~~-- -~0 = 1. 393¢1. 4780 ( 1966-1984) .j..) ...... QJ 0 E ro QJ
;; 2 1::: ~ "- /..~'t r = 0.07 s = 1.77 ......
.0 0.25 QJ s.... 1::: ::I 1 - ~*'- No. of units = 150 ...... 1- ,.. .a. .0 s.... ~
::I 0 1-
4-w ~ 0 0 0 1 0 0.00
r-en 0
.....J
0.6 -0 • 25 I I I I I I I I f I I I I t j I i I I I I I I I I I I i I I I I t I l"f-y....,..-rooy·r-rrrrrr i i I I t I I I t I I I t I • • • •
1.2 1.6 z.0 2.4 2.8 3.2 3.6
Log10 of ¢• Speed Ratio
---r- I
16 20 40 60 100 200 500 1000 2000 4000
<P• Speed Ratio
Figure 13. Turbine diameter versus speed ratio for bulb turbines.
'"\
- - - -
1 O• 1.00
8 I
V')
s.... ClJ
6 .j..J V') ClJ 0.75 s.... :a: ClJ
.j..J c::
jo = 0.2119(P/H) 0~74 (1953-1965) ClJ .,....
:a: 4 s....
c:: ClJ .,.... .j..J
0. 50j r = 0. 92 ClJ s = 0.64 "" • • s.... E ClJ 1'0
.j..J .,.... lNo. of units = 63 ClJ a
E 1'0 ClJ .,.... c:: a 2 .,....
..0 ClJ s.... 0.25 c:: :::::1 .,.... I-
..0
3 n;,r.· · /D = o.l826(P/H) 0·4462 (1966-1984) s.... .. :::::1 a I-
4-w .. 0 ...... a
0 0. 00 -1 /,'f ~"< ~ r = 0.98 s = 0.60 ,......
Ol :i / .,, 0 _ _,, J. No. of units = 150
_J
0.6 -0 • 25 I I I I I I I I I I I I I I I I I I I 1 1 1 1 1 1 1 I I I I I I I I I I I I T'"T"'rY"T"T""rrr-y--r"T" i I IiI 1 iiI iII i • i
1.2 1.6 2.0 2.4 2.8 3.2 3.6
Log10 of {P/H), Rated Power over Rated Head
,-,-, 16 20 40 60 100 200 500 1000 2000 4000
{P/H), Rated Power over Rated Head
Figure 14. Turbine diameter versus {P/H) ratio for bulb turbines.
10 __, '. 00--i
8 -l Vl s... aJ
Vl - .j..l ~ 6- ~ / " ~ / . j 4 i . //~/;;~· ·- " / p i 2 " _- + ~r-~lt __ ; //Jj~+/
kl : // _i' ~ ~ // ..._ ._JJ!: ~ / D ~4 (.181 (Q/N)0.3175
"' +-.-'11- ~ / 1953 1 1 -j .3 0.00 ~,l!J"l: / r = 0.99 - 984) /. A(+ /
5 = o.8o
/ + ./ // No. of u . / /" + / m ts = 206
.--"' ,,,,,'+/""/' ,"'
-0.25~ ///'+ I I ~ I .--"' I I I i I I -3 I I I I I I
I i I I -2 I 1--,~~~~~~--l ' ' og10 of (Q/N) -1 . ' ' ' '
' Rated Dischar e 0 g over Turb· lne Speed
~~----~~~--~--~--~~--~--~--------~--~-.-..--.
0.001 0.005 0.01 0.05 0.10 0.5 1 5 8
(Q/N), Rated Discharge over Turbine Speed
Figure 15. Turbine diameter versus (Q/N) ratio for bulb turbines.
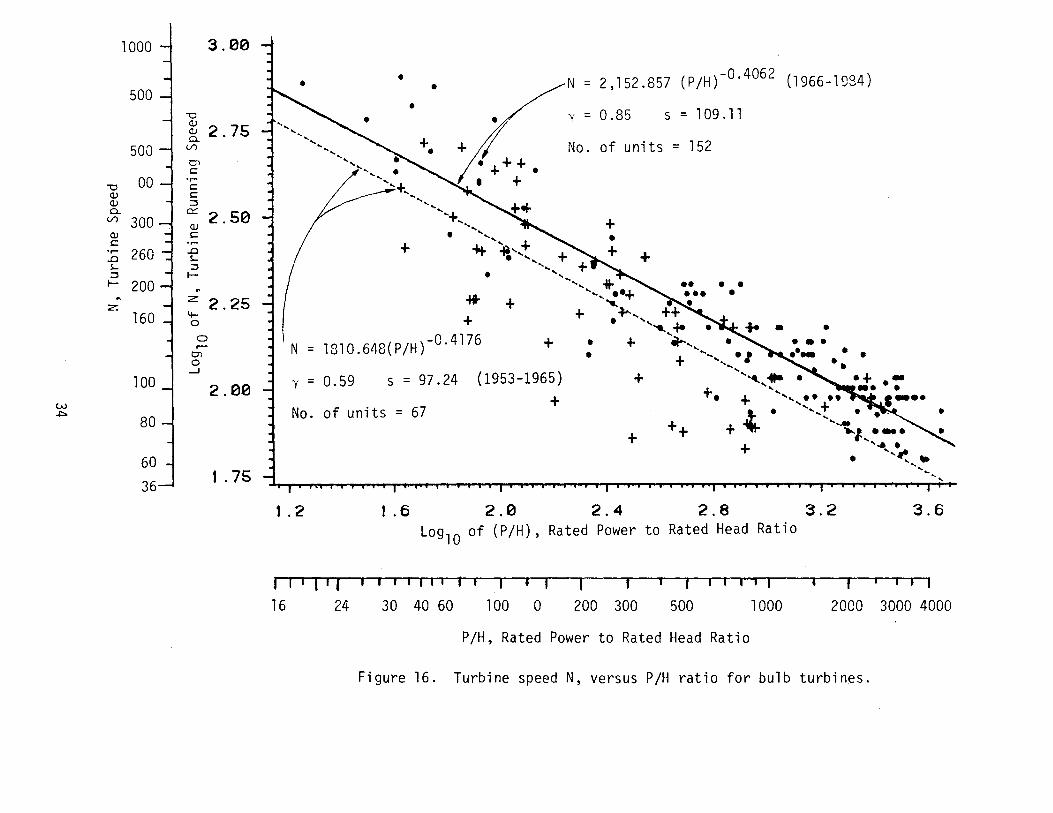
An additional regression was developed between the turbine speed
and the ratio of rated power to rated head and the resulting regression
equations are
N = 1810.648 (P/H)-0.4176 (1953 1965) Eq. (27)
N = 2152.857 (P/H)-0.4062 (1966 1984) Eq. (28)
Figure 16 presents the graphical representation of N vs P/H.
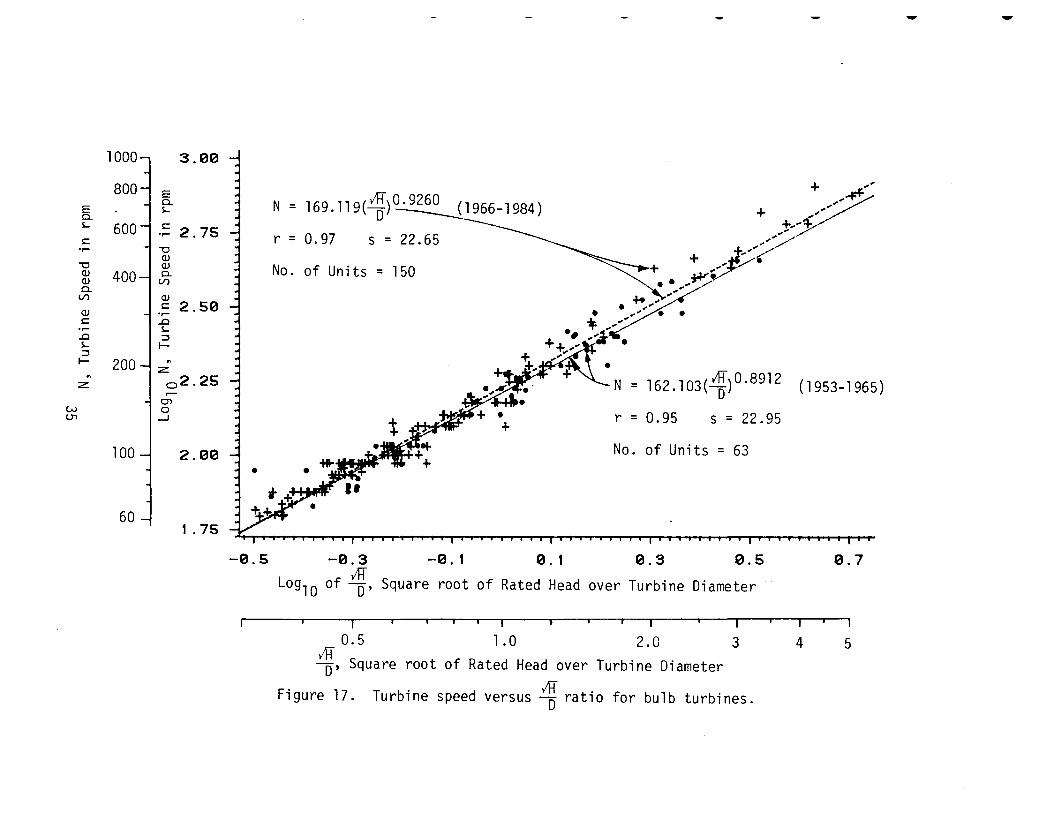
As a result of inspection of an Escher Wyss nomograph for standard
tubular turbines a regression relation ~as developed between turbine
speed and the ratio, /H7D. The regression equations for bulb turbines
for that relation between turbine speed, N, and the ratio /HID are as
follows:
N = 162.103 ( /ff/0) 0·8912
N = 169.119 ( IH/0)0· 9260
(1953-1965)
(1966-1984)
Figure 17 presents the graphical representation of N vs IH?D.
Eq. (29)
Eq. (30)
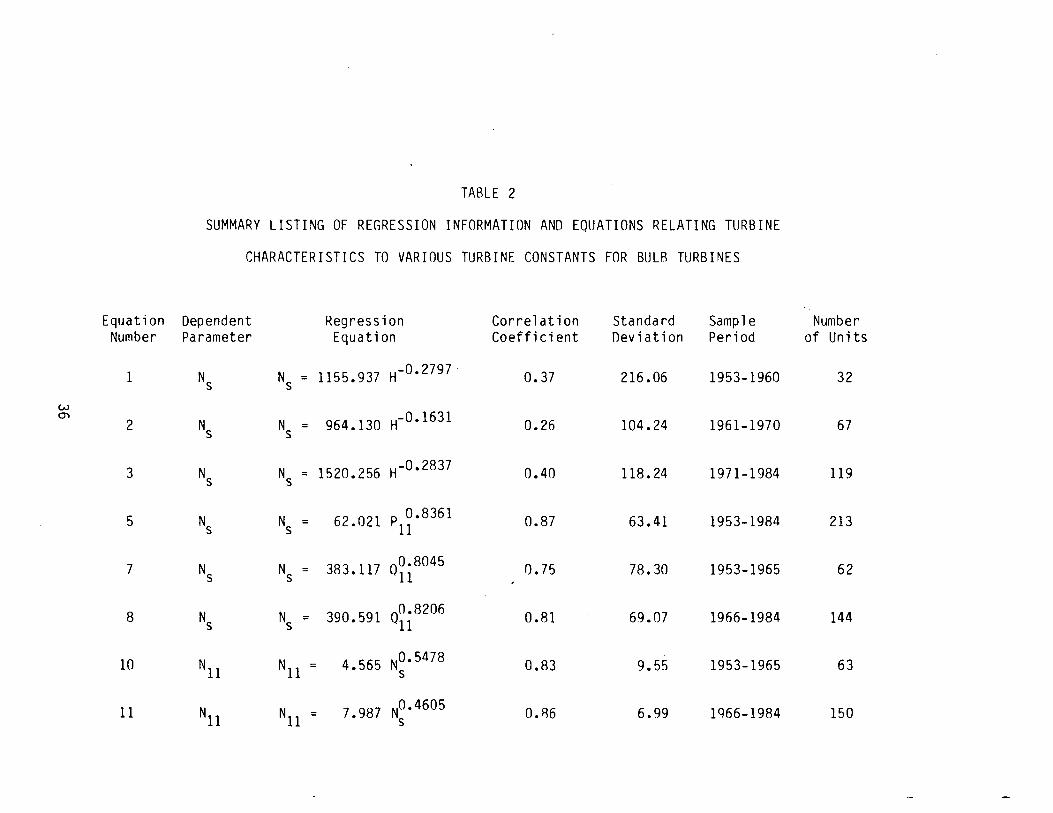
Table 2 summarizes all the regression relations that were devel
oped for manufactured bulb type turbines. In the table are shown all
the equations that were developed, the regression correlation coeffi
cient for each particular regression, the corresponding standard devia
tion, the sample period and the number of different units used in
developing a particular relation.
In the Appendix an example is given showing how these turbine con
stants and regression equations can be used to make a diameter selec
tion utilizing the analysis system used in Monograph No. 20 of the U.S.
Bureau of Reclamation and parallel calculations show selection of tur
bine diameter using newly developed experience curves involving dir
ectly a P/H ratio and a Q/N ratio and the resulting regression equa-
tions. 33
w ~
"'0 QJ QJ 0.
(./)
QJ s::: .,.... .0
s.... :::J 1-
~
z
1ooo -1 3. 00
500
50()
00
300
260
200
160
100
80
60
36
"'0 QJ
~ 2. 75 (./)
0"> s::: .,.... s::: s::: :::J
0::: 2.50 QJ s::: .,.... .0 s.... :::J
1-~
:z: 2.25 ~ 0
0 r-
0"> 0 _J
2.00
1. 75
....
•
....... ....... ...... ...... ... , ..... .....
•
•
' ... + .....
+
......
•
I • + + + • • +
.......... + ........ ....
• ........ '+--1+ i' ........
N = 2,152.857 (P/H)- 0·4062 (1966-1~34)
y = 0.85 s = 109.11
No. of units = 152
+ •
+ ...... • .... .JL
......... "1r ._L • • • ... + +
N = 1810.648(P/H)-0. 4176 +
y = 0.59 s = 97.24 (1953-1965)
+ No. of units = 67
"', • T
...... ++ + +-...... _t.. • . .. ..... ,... • • + .................... ,
+ ................ . +
• • • •• ......
........ . .. . +. '+- ............ + . .... .. • .... ..~ .... . ~ ......... .
+ ...... -. .. .. + ++
+ ...... ......
1 . 2 I .6 2.0 2.4 2.8 3.2 3.6 Log
10 of (P/H), Rated Power to Rated Head Ratio
I I I I I I I I I I I I I I t I ,,---T-- I 1 I I I ----.---.----.-- • I I I ' I
16 24 30 40 60 100 0 200 300 500 1000 2000 3000 4000
P/H, Rated Power to Rated Head Ratio
Figure 16. Turbine speed N, versus P/H ratio for bulb turbines.
1000 3.00
800
.L.75 ~ N = 169.119(1j)0.9260 E 0.. s.. 600 s:: r = 0.97 s = 22.65 .,.... "'0
Q) "'0 Q)
::1 No. of Units = 150 Q) 400 0.. Q) V) 0..
V) Q)
Q) s:: 2.50 .,....
s:: ..0 .,.... s.. ..0 :::::5 s.. I-:::::5 I- 200 ..
.. ~2.251 +~N = 162.103(~) 0 · 8912 z: (1953-1965) w 1..3 U"i . r = 0.95 s = 22.95
100 ~ 2.00 ...:J .~..:" .liiEI.i..,. No. of Units = 63
60 1 . 75
-0.5 -0.3 -0.1 0.1 0.3 0.5 0.7
Log10 of ~' Square root of Rated Head over Turbine Diameter
r------r----.----y---,-----,r-..-----r---,----y---r--,--___,....--.-----.----, I J
0.5 1.0 2.0 3 4 5
~' Square root of Rated Head over Turbine Diameter
Figure 17. Turbine speed versus ~ratio for bulb turbines.
Equation Number
1
w 0"'1
2
3
5
7
8
10
11
TABLE 2
SUMMARY LISTING OF REGRESSION INFORMATION AND EQlJATIONS RELATING TURBINE
CHARACTERISTICS TO VARIOUS TURBINE CONSTANTS FOR BULB TURBINES
Dependent Regression Correlation Standard Sample Parameter Equation Coefficient Deviation Period
Ns N = 1155.937 H-0•2797 s 0. 37 216.06 1953-1960
Ns N = s 964.130 H- 0•1631 0.26 104.24 1961-1970
Ns N = 1520.256 H-0•2837 s 0.40 118.24 1971-1984
Ns N = s 62.021 p1~.8361 0.87 63.41 1953-1984
Ns N = s 383.117 0~i8045 0.75 78.30 1953-1965
Ns N = s 390.591 0~i 8206 0.81 69.07 1966-1984
N11 Nll = 4 565 N0.5478 • s 0.83 9.55 1953-1965
Nll Nll = 7 987 N0.4605 • s O.R6 6.99 1966-1984
Number of Units
32
67
119
213
62
144
63
150
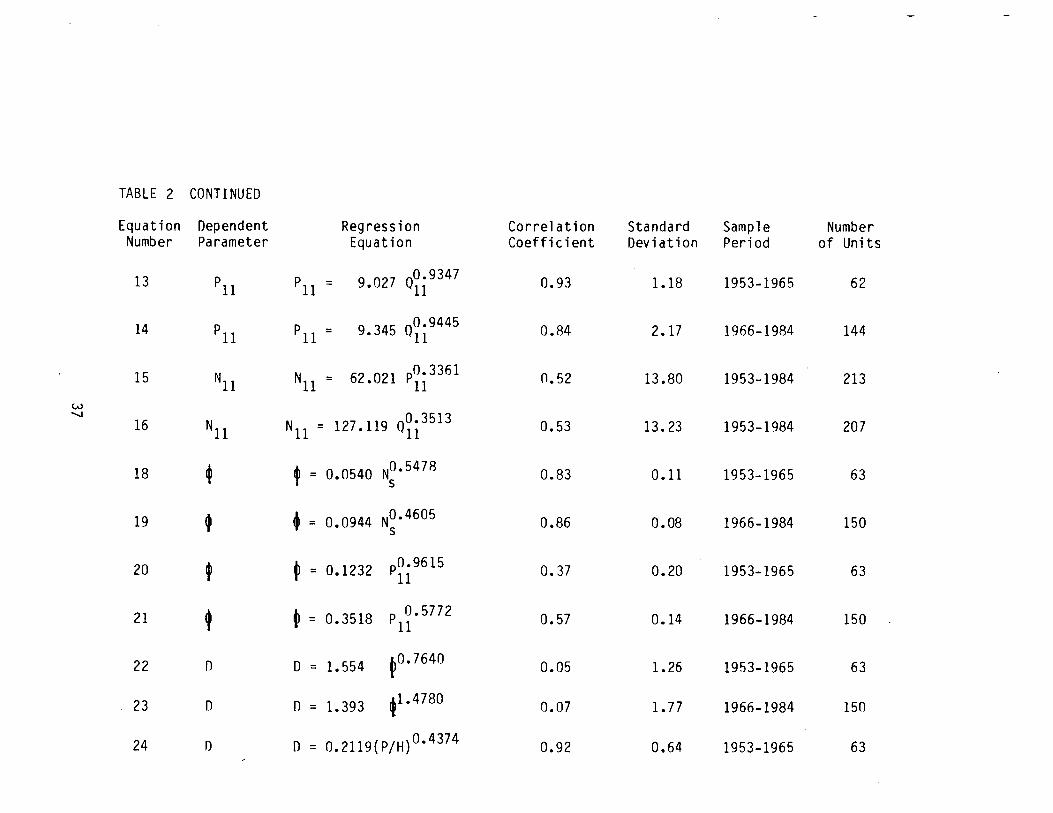
TABLE 2 CONTINUED
Equation Dependent Regression Correlation Standard Sample Number Number Parameter Equation Coefficient Deviation Period of Units
13 p11 p11 = 9.027 0~i9347 0.93 1.18 1953-1965 62
14 p11 p11 = 9.345 0~i9445 0.84 2.17 1966-1984 144
15 N11 Nll = 62.021 Pii3361 0.52 13.80 1953-1984 213
w -.....!
N = 127 119 o0•3513 16 N11 0.53 13.23 1953-1984 207 11 • 11
18 ' ~ = 0.0540 N~· 5478 0.83 0.11 1953-1965 63
19 t • = 0.0944 N°· 4605 0.86 0.08 1966-1984 150 s
20 ~ t = 0.1232 P0.9615 11
0.37 0.20 1953-1965 63
21 t ~ = 0.3518 p 0.5772 11 0.57 0.14 1966-1984 150
22 n D = 1.554 ~0.7640 0.05 1.26 1953-1965 63
23 n 0 = 1.393 ~1.4780 0.07 1.77 1966-1984 150
24 f) D = 0.2119{P/H) 0•4374 0.92 0.64 1953-1965 63
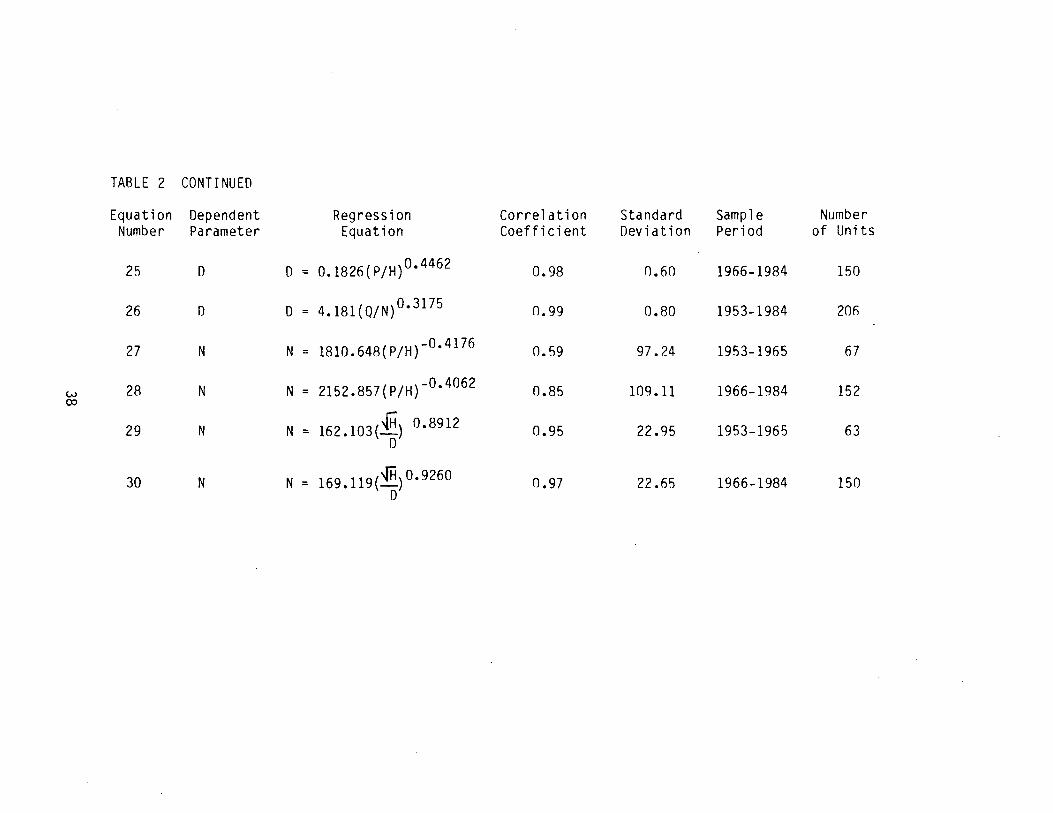
TABLE 2 CONTINUED
Equation Dependent Regression Correlation Standard Sample Number Number Parameter Equation Coefficient Deviation Period of Units
25 D D = 0.1826(P/H) 0•4462 0.98 0.60 1966-1984 150
26 0 D = 4.181(Q/N) 0•3175 0.99 0.80 1953-1984 20fi
27 N N = 1810.648(P/H)-0•4176 0.59 97.24 1953-1965 67
w 28 N N = 2152.857(P/H)-0•4062 0.85 109.11 1966-1984 152 00
29 N N = 162.103({H) 0•8912 0.95 22.95 1953-1965 63 0
30 N N = 169.119(~) 0 • 9260 0.97 22.65 1966-1984 150 0
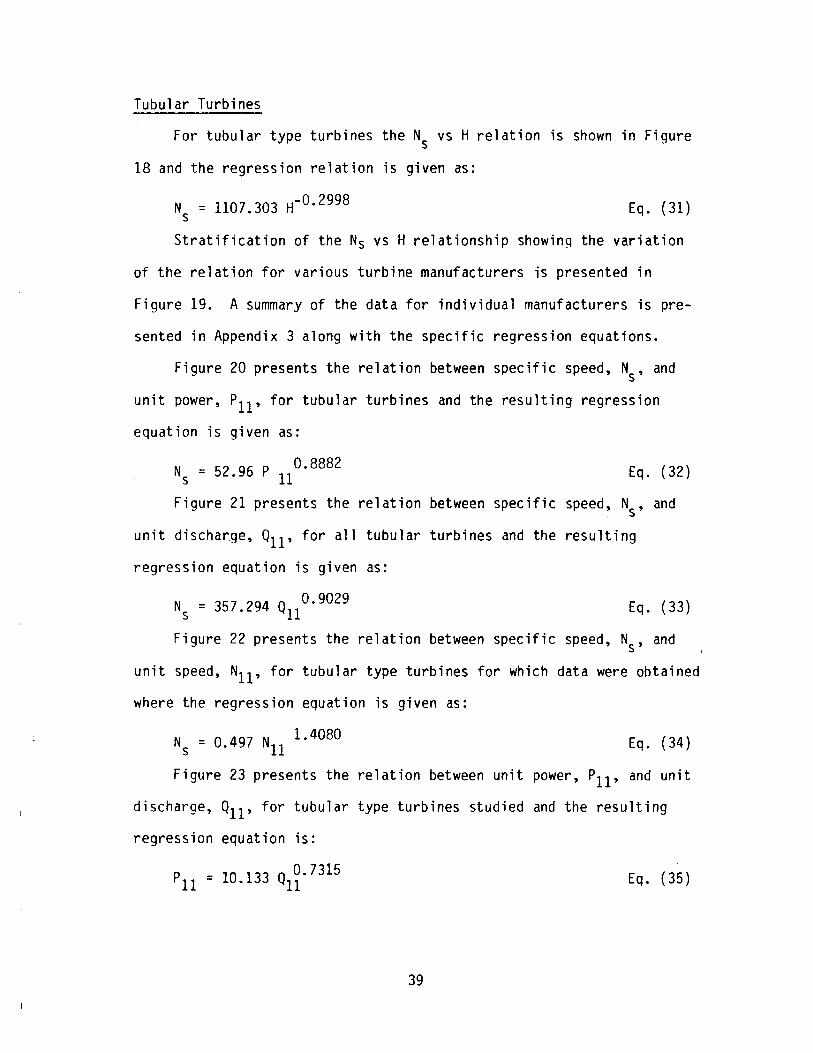
Tubular Turbines
For tubular type turbines the Ns vs H relation is shown in Figure
18 and the regression relation is given as:
N = 1107 303 H- 0· 2998 s . Eq. (31)
Stratification of the Ns vs H relationship showin~ the variation
of the relation for various turbine manufacturers is presented in
Figure 19. A summary of the data for individual manufacturers is pre-
sented in Appendix 3 along with the specific regression equations.
Figure 20 presents the relation between specific speed, Ns, and
unit power, P11 , for tubular turbines and the resulting regression
equation is given as:
Ns = 52.96 p 110.8882 Eq. (32)
Figure 21 presents the relation between specific speed, Ns, and
unit discharge, o11 , for all tubular turbines and the resulting
regression equation is given as:
Ns = 357.294 0110.9029 Eq. (33)
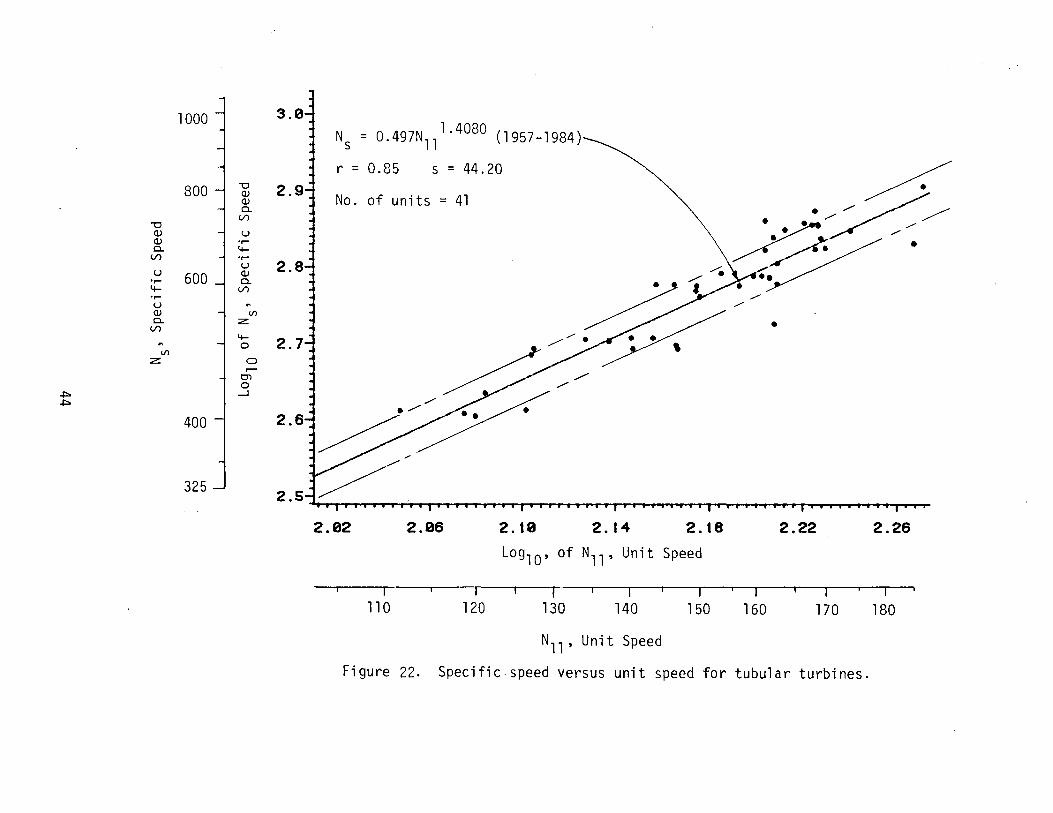
Figure 22 presents the relation between specific speed, Ns, and
unit speed, N11 , for tubular type turbines for which data were obtained
where the regression equation is given as:
Ns = 0.497 N11 1.4080 Eq. (34)
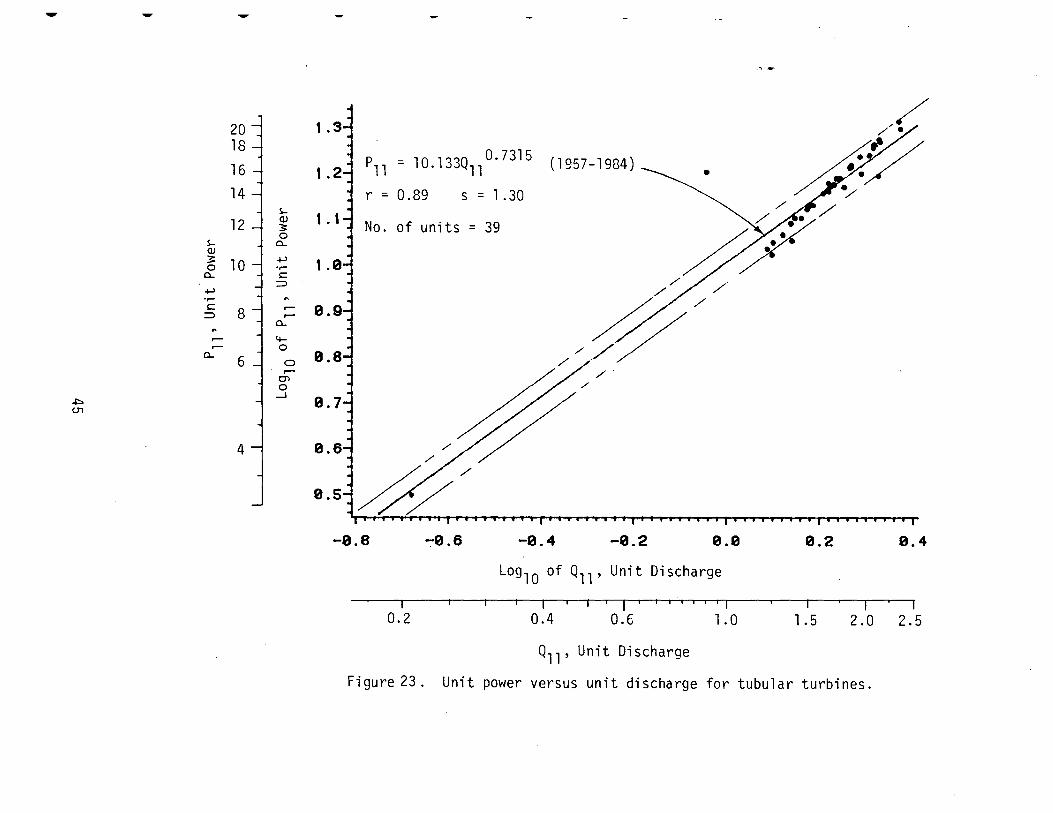
Figure 23 presents the relation between unit power, P11 , and unit
discharge, 011 , for tubular type turbines studied and the resulting
regression equation is:
pll = 10.133 Q1~.7315 Eq. (35)
39
1000
900
BOO
"'0 700 <V <V 0..
(./')
u .,... 600 '+-. ,...
u <V 0..
(./')
500 Ill
z
~ 0
400
3.8
~ 2.9 <V 0..
(./')
u .,... '+-.,... u <V 0..
(./')
Ill z '+-0
0 ....-
C'l 0 _J
2.8
2.7
2.6
= ll07.303H-0.2998
r = 0 62 5
(1957-1984) • = 92.71
No. of units = 54
• •
- • •
-~~
......
~ 2,!) ~·~i~!~l~!,l~l~l~!~l,!,i,l~l~l~l~i~l~l~!,l,i,l,!,l,l,l,l,!,i,i·i·I·!·I·I·I·I•J•I•I•I•I•J•J•J•J•I•J•J•I•I•J•J•I•I•I•J•J•J•t•l•l,!,l~l~l~l~!~l,l~i~l~l~i~!~i~l~!~l~!~i~!~I~I~!~I~!~I~I~!~IMI~!MIM!M!M!M!MIM!Mi~
0.s 9.6 0.1 0.8 . 8.9 1.0 1.1 1.2 1.3 1.4 l.!i
Log10 of H, Rated Head in Meters
I I I I -, I ' I I ~ -,- I I I .-- I I I I I I I I I I I I I I I I I' I
4 5 6 7 8 9 10 15 20 25 30
H, Rated Head in Meters
Figure 18. Specific speed versus rated head for tubular turbines.
"'0 Q) Q) 0.
(./)
u .,... 4-.,... u Q) 0.
(./)
" (/) z
~ ......
1000
900
800
700
600
500
400
320
"'0 Q) Q) 0.
(./)
u •r-4-•r-u Q) 0.
(./)
(/)
z 4-0
0 r-
01 0
_J
3.0
2.9
2.8
2.7
2.6
.............. ~#2 .... .... .... .... .... .......... .... ...... ...... .... .... .... .... ..... .... ..... ..... ..... .... ..... .... ...... .....
1 - Tar.~pell a 2 -· Vevey-Charmi 11 es 3 - Allis Chalmers 4 - Kvaerner Brug
..... ..... ...... .... ...... ...... .... ......
~ ~~4''~,, ..........
" ....... " ...... ..... .. .. ..... .... ...... ..... "-.... -........,,........_
~~~ '"-..,,........_,,,
2 • 5J f I I J iII I I I I I I I I I I I I IiI I I I I I I I I I I I I I I I I I I I I I I I I I I I I I I I I I I I I I I I;) I I I I I I I I I I I I I I I I I I I I I ,,,,,,,,,,,,,,,,, 0.5 0.6 0.7 0.8 0.9 1.0 1.1 1.2 1.3 1.4 1.5
Log 10 ·of H, Rated Head in Meters
I I ' J
4 5 6 7 8 9 10 15 20 30
H, Rated Head in Meters
Figure 19. Specific speed versus rated head for tubular turbines from different turbine manufactures.
1000 --1 3.0
900
800 j 2) • -a
700 QJ QJ 0.
-a (./) i Ns = 52.96P11 °· 8882 (1957-1984)
• QJ QJ u 0. ...... 2.8
(./) 4-600 ...... r = 0.71 S = 55.91 u u ...... QJ
4- 0. ...... (./) ~ No. of unit = 41 u QJ ~
0. 500 .::...(/') 2.7 (./)
4-(/') J 0
z 0 ......-
en ~
400 -i 0 2.6 I'.) _J
/ /
300 2 • s 11 I U I I I I I I I I I I I I I I I I I I I I I I I I I I I I I I I I I I" I I I I (a I I I IiI I I I I I I I I I I I I I I I I I I I I I I I I I I I I I I I I IiI IiI I I I
0.5 0.6 0.7 0.8 0.9 t.0 t.l t.2 1.3 1.4
Log 10 of P11 , Unit Power
I I I I I I I I I I I I I I I I I I I I -.-,---,TT I 1 I I 4 5 6 7 8 9 10 15 20 25
P11 , Unit Power
Figure 20. Specific speed versus unit power for tubular turbines.
1000
8001 "'0 Q) Q)
0-
f 600~ (/} .hf u
N s = 357.294Q 0.9029 •r-
(1957-1984)-... '+-
11 •r-u 2.8 r = 0.70 s = 59.37
~ Q) c..
•
(/} :1 No. of units = 37 u Q)
l c.. 111
(/} z , \ • '+- 2.7
111 I 0
z 0 r-
O'l 0
~ I __J
w 400 -I 2.6
325 2 · 5.,~Tj~i~i~i~i~i~i~i~i~i~jTI~I~i~i~i~i~ITI~ilj~l~i~i~ITI~i~i~i~i,j~tt-ri~i~i~ITi~l~i~i,j~l~iTi~I~ITI~I~i~l,j~l~i~l~i~iTI~i~irTI-rj
-0.8 -0.6 -0.4 -0.2 0.0 0.2 0.4
Log10 of 011 , Unit Discharge
...----r---r-----r-----r---,.---y---T I -- I I 0.2 0.3 0.4 0.5 1.0 2.0 2.5
011 , Unit Discharge
Figure 21. Specific speed versus unit discharge for tubular turbines.
1000 l 3.0
Ns = 0.497N 11 1·4080 (1957-1984)
..
~ r = 0.85 s = 44.20
"'0 2.9 800 -j (1)
No. of units = 41 . .,.,..... ~ (1) c..
(./) "'0 (1) u (1) .... c.. 4-
(./) .... u
u 600 (1) .... c.. 4- (./) .... u "' (1) (/)
• c.. :z:: (./)
4-~ ~ ' "' 0 2. 7-:I .... ~
(/)
:z:: 0 ....--
C'l 0
~
400 ~ _J
~
2.6
325 2.5 '• '
I I I I ' I I I I I I I I I I I f ' ' I I I ' I I I ' I ' I ' I ' I I I I ' • ' I I ' • I I I ' I I ' I ' ' I I I I I I ' I I I '
2.02 2.06 2.10 2. 14 2.18 2.22 2.26
Log10 , of N11 , Unit Speed
' r 11 0 120 130 140 150 160 170 180
N11 , Unit Speed
Figure 22. Specific speed versus unit speed for tubular turbines.
-
20-; 1.3
18 j i p = 10 133Q 0.7315 16 t.2 11 . 11
14 r = 0.89 s = 1 .30
(1957-1984) •
~
1 · 1 ·~ No. of units = 39 12 ~ ~ ~
10 i ClJ 3 0
0...
+-' •r-s::: 8 ::> I ,.....
0...
4-,..... 6 j
0 0...
0 ,..... 01 / 0 _I
.+::> (.]1
4
-0.8 "':"0.6 -0.4 -0.2 0.0 0.2 0.4
Log 10 of 011 , Unit Discharge
.---,-~r·-.- -.-----.---, -·, J---,--·,--,--,··m·r---·----.---~ ~·r-·~
0.2 0.4 0.6 1.0 1.5 2.0 2.5
011 , Unit Discharge
Figure 23. Unit power versus unit discharge for tubular turbines.
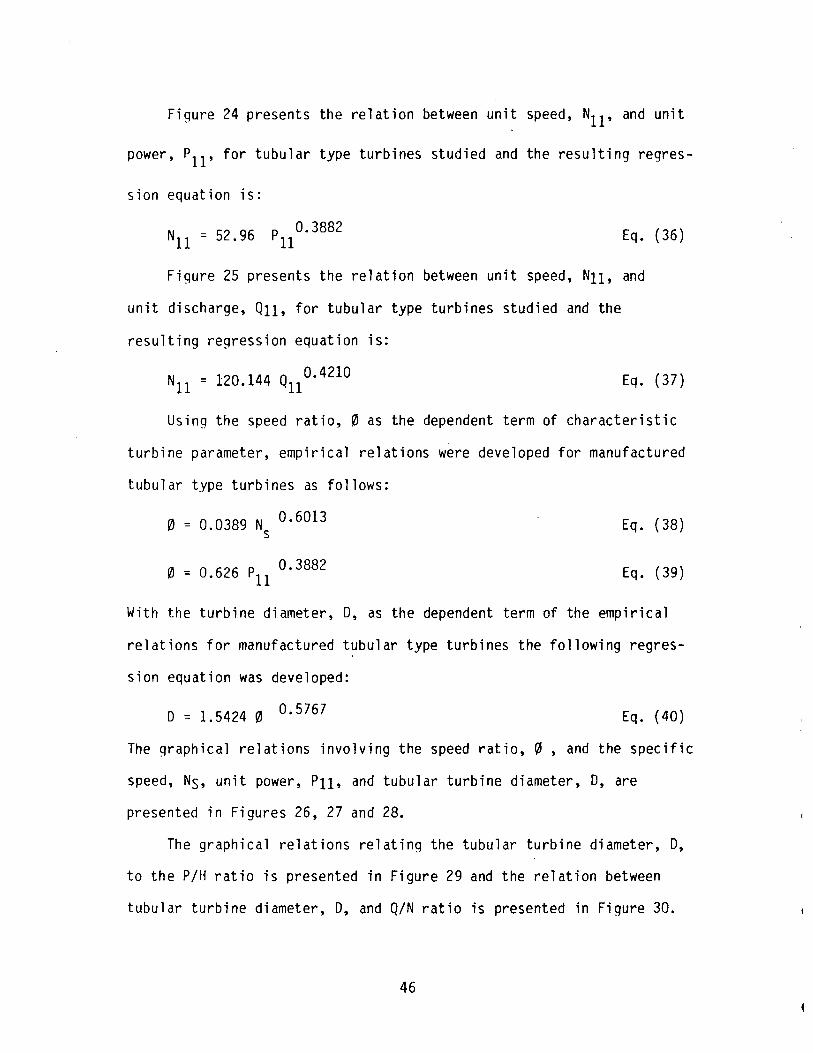
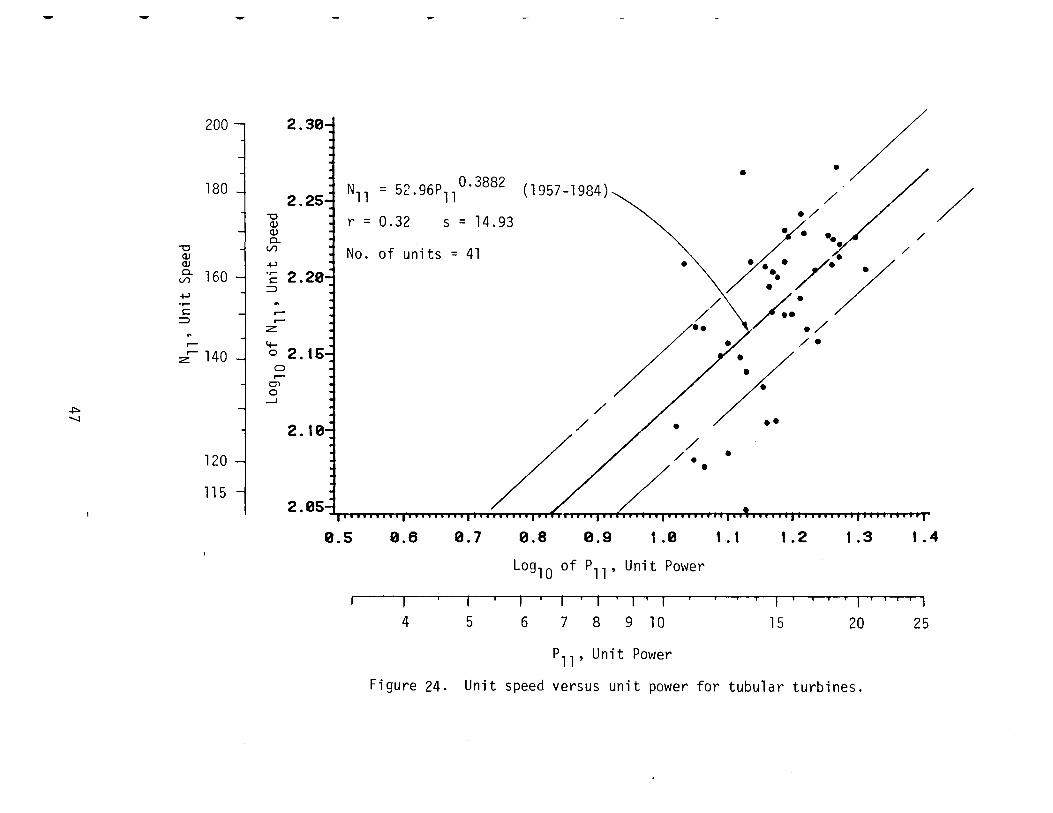
Figure 24 presents the relation between unit speed, N11 , and unit
power, r11 , for tubular type turbines studied and the resulting regres-
sion equation is:
N = 52 96 p 0.3882 11 . 11 Eq. {36)
Figure 25 presents the relation between unit speed, N11, and
unit discharge, 011, for tubular type turbines studied and the
resulting regression equation is:
N = 120 144 Q 0· 4210 11 . 11 Eq. {37)
Using the speed ratio, 0 as the dependent term of characteristic
turbine parameter, empirical relations were developed for manufactured
tubular type turbines as follows:
0 0.0389 Ns 0· 6013
Eq. {38)
0 = 0.626 pll 0.3882 Eq. ( 39)
With the turbine diameter, D, as the dependent term of the empirical
relations for manufactured tubular type turbines the following regres-
sian equation was developed:
D = 1.5424 0 0.5767 Eq. (40)
The graphical relations involving the speed ratio, 0 , and the specific
speed, Ns, unit power, P11, and tubular turbine diameter, D, are
presented in Figures 26, 27 and 28.
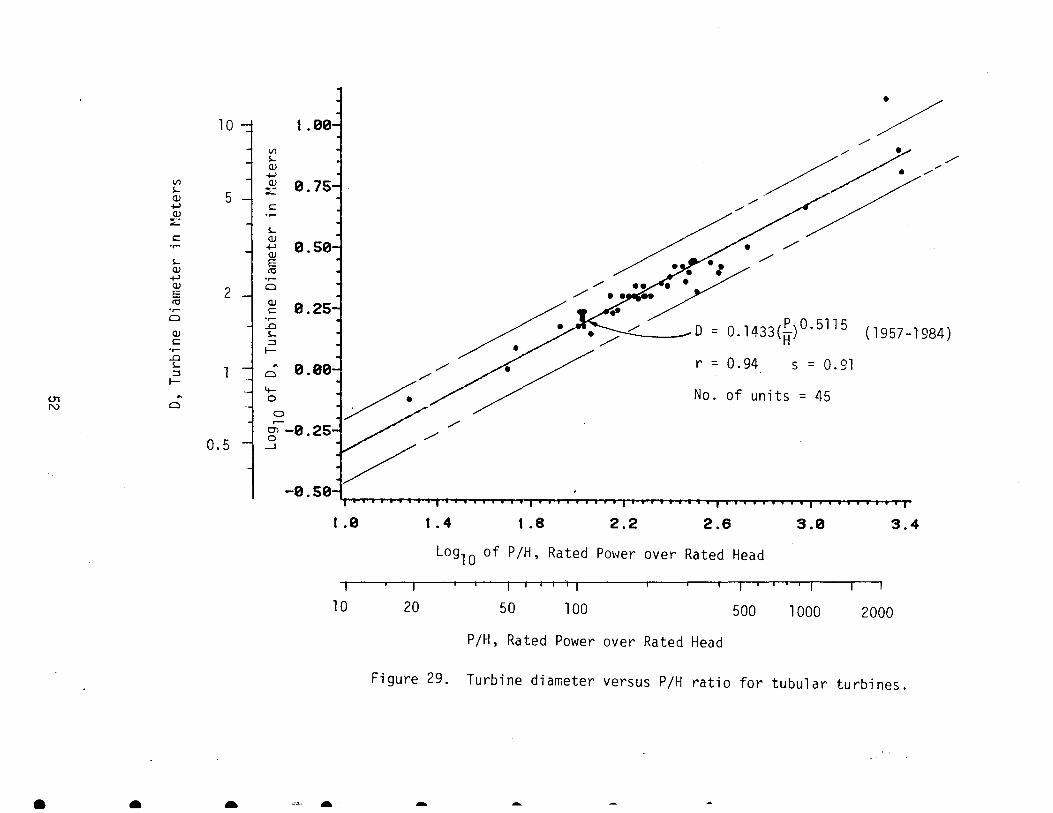
The graphical relations relating the tubular turbine diameter, D,
to the P/H ratio is presented in Figure 29 and the relation between
tubular turbine diameter, D, and Q/N ratio is presented in Figure 30.
46
-+'> ........
\j Q) Q)
200
180
~ 160 ~ .,... c::
::>
r-
£140
120
115
\j Q) Q) c..
(,/')
::>
rr-
z:
0 r-
01 0
....J
2.30
2.25 N = 50 g6p 0.3882 11 Lo 11
r = 0.32 s = 14.93
No. of units = 41
0.s 0.6 0.7
(1957-1984)
•
• /
• ./ •/
/. /
//:/// • ~··/ /-..
./ /•
//· ... m-TT] 1 1 1 1 • • • 1 1 1 w 1 1 1 1 • • .-.I 1 1 1 1 1 1 1 • 'I-. • 1 1 1 1 • 1 • 1-.----rrT·m..--..--T
0.8 0.9 1.0 t . I t.2 1.3 1.4
Log10 of P11 , Unit Power
1 -- 1 --. r I 1 I 1 I 1 • 1 I 1 • • • I 1
I I I I 1
I I I I 1
4 5 6 7 8 9 10 15 20 25
P11 , Unit Power
Figure 24. Unit speed versus unit power for tubular turbines.
+::> (X)
200-., 2. 30
"'0 Q)
130
~ 160 (/")
.j-) .,... s::
:::>
r-
£ 140
120
115
"'0 2. 25 Q) Q) c..
(/")
.j-) .,... s::
:::> 2.20
r-z 4-0
0 2.15 r-
O'l 0 _j
2. 10
• N = 120 144Q 0·4210(1957-1984) 11 . 11
r = 0.35 s = 15.28
No. of units = 37
2 . 05 I I I I I I I I I I I I I i I I I I ( I I I I {I I I i I I I 1.1 I I I I I I I I I I I' I I I I I''' I I •• ' ••••
-0.8 -0.6 -0.4 -0.2 0.0 0.2 0.4 Log10 of Q11 , Unit Discharge
----~--~--~~~~~~--~~~~.-~~~~~~~~T~
0.2 0.3 0.4 0.6 0.8 1.0 2.0 2.5
011 , Unit Discharge
Figure 25 . Unit speed versus unit discharge for tubu1 ar turbines.
• • • • .. - - .....
0.35 2. 2-, ... • 2.1
2.0 J 0.30
1. 9 0 j • .,....
+'
1.8 ~ 0::
0 0.251 / •r- -o +' Q) ••/ ~ Q)
0:: 1.7 0.. (/)
-o Q) ~
Q) -& 0..
0.20-:f / •/ (/) 1.6 4- r = 0.85 s = o.os 0 /
-& 1. 5 I ~ :1 / / /.• No. of units = 41 Ol
/A
0 _l
..j:>. 1.4_1 0. t5 \.0
1.3
0 • t0 1 ~~~~~;-r;-r;-r;~~~i~l~i_,i_,l-,l~l~i-TI~i-rl-rt-rl~i~l~i~f~l_,l_,i_,i~i~f-,1-TI-rt-ri-ri-fr-l~f~ir<ir<lr;i~l_,i_,i_,i_,i_,i_,-1
2.55 2.6t 2.67 2.73 2.79 2.85 2.91 2.97 3.03
Log 10 of Ns, Specific Speed
-.--r--~ -- - r- ----. ----.-- ---, I ' I ' I
400 500 600 700 800 900 1000
Ns, Specific Speed
Figure 26. Speed ratio versus specific speed for tubular turbines.
•
(Jl
0
•
2.2
2.0
0 ·r-
~ 1.8 0:::
""0 (!) (!)
0.. (/}
_; 1.6
1.4
..
0.35
0 0.30 •r-....... tO
0:::
""0 (!) (!)
~ 0.25
" -€7-
4-0
0 r-
0) 0
...J
0.5
....! ___ .A
Q = 0.626P 0.3882 11
r = 0.32 s = 0.18
(1957-1984) \
\
. / )//
. . //· .. ··~ / No. of units = 41
/
0.6 0.7 0.8 0.9
. . /. /1 ·/ •
/ " . . . /
Y/o ••
• •
•
t.0 t.t 1.2
Log 10 of P11 , Unit Power
t.3 t.4
1 I - -.-~, - I 1 I 1 1 1 1 --. 1 1 1 1 r 1 1
4 5 6 7 10 15 20 25
P11 , Unit Po\'/er
Figure 27. Speed ratio versus unit power for tubular turbines .
-
• • • • • .. - ..
1~3 t.ee (/)
s... <lJ
• I -1-l (/)
6 <lJ 0.75
s... :E: <lJ
-1-l c
• ,9:! .,_ ""'- 4 .. s... c
<lJ .,.... -1-l <lJ s... E <lJ ro +..>
• • •• • • • • • • •
.,_
•
<lJ a •
-~ • E
• • •
ro 2 <lJ • • •
.,.... s:::: 0.25
• • • • • •
Cl . ,_
• • ..0
• • •
<lJ s...
• c
:::J . ,.... I-..0
s... 1.0 .. :::J a I-
• • ---~ 0 = 1 .5424¢0· 5767
0.8 If-01 .. 0
•
....... Cl
0 0.6 -l ......
r = 0.03 s = 1.45 ~ -0.25 -I
0.4 j No. of units = 41
0. 19 e. t 4 0.18 0.22 9.26 0.30 9.34 Log10 of ¢, Speed Ratio
I ' I ' I ' I ' I ' I ' I ' I ' I ' 1 ' 1.4 1.5 1.6 1.7 1.8 )_q ? " • 2
¢, Speed Ratio
Figure 28. Turbine diamater versus speed ratio for tubular turbines.
1 0 -=1 1.00
~ /
Vl / s... / /. / <lJ /
;...> /
Vl <lJ 0.75 s... ~-
<lJ 5 ..,_
;...> s:: ~
.,..... s...
s:: <lJ .,..... ;...> <lJ s... E
<lJ tU ;...> .,..... <lJ 2 0 E tU <lJ .,..... s::
0 .,..... ..c
~ / _/-.~o = 0.1433(if)V.;.JII;) (1957-1984) <lJ s... s:: ::::::1 .,..... 1-..c
Clll CIIICIII_] _/. / r = 0.94 s = 0. 91 s... 1
~ / ::::::1 0
1-4-
1// / / No. of units = 45 U1 ~ 0 1'\.) 0
0 /
0.5 ~ - /
1.0 1.4 1.8 2.2 2.6 3.0 3.4
Log10 of P/H, Rated Power over Rated Head
10 20 50 100 500 1000 2000
P/H, Rated Power over Rated Head
Figure 29. Turbine diameter versus P/H ratio for tubular turbines .
• • a ... -
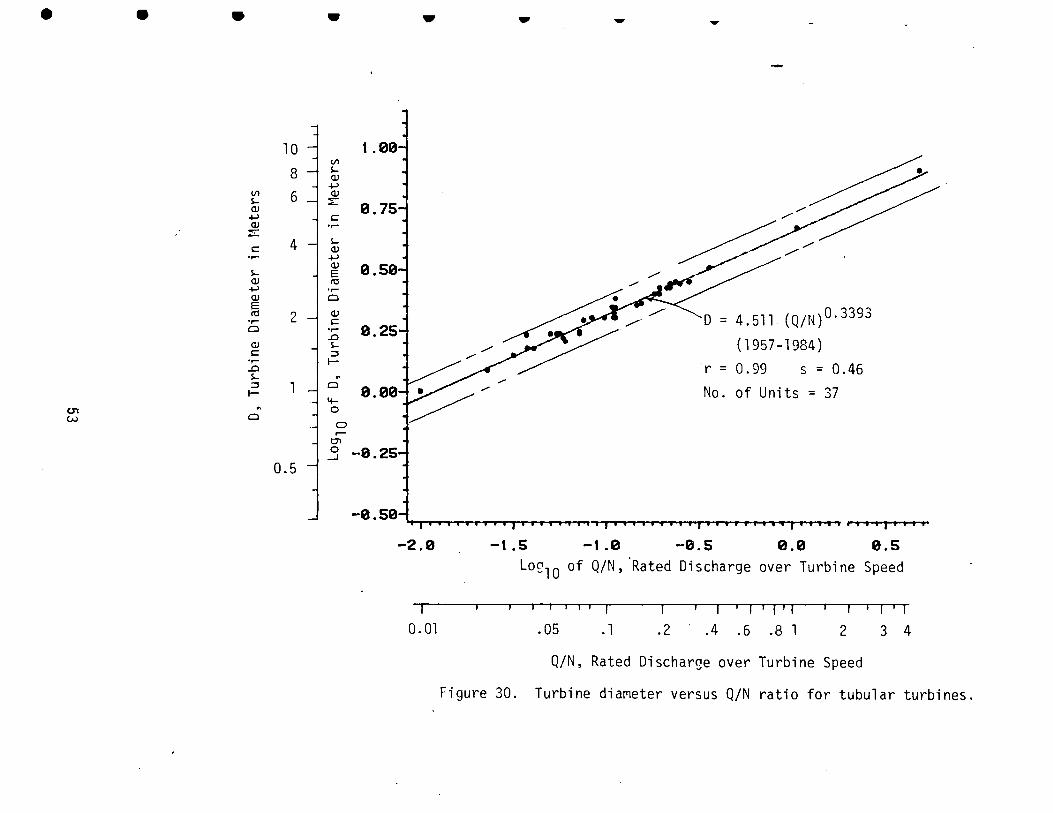
• • • • • - - .._
10 1.00 Vl
8 s... Q) +J
Vl 6 .$ s... ..,__ 0.75 Q)
+J s:: Q) .,....
:::::: 4 s...
s:: Q) .,.... +J Q) 0.50 s... E
Q) ro +J .,.... Q) Cl E
~D = 4.511 (Q/N)0.3393 ro 2 Q) .,.... s:: Cl .,.... 0.25 ..0
(1957-1984) Q) s... s:: ::I .,.... 1- r = 0.99 s = 0.46 ..0 s... .. ::I 1 Cl
0.00 No. of Units = 37 1-4--
U'1 .. 0
w Cl 0 .---
en 0
......1
0.5
-.-, ......... , ......... , ..... .....----.-----., ... . -2.0 -1.5 -1.0 -0.5 0.0 0.5
Log1 0 of Q/N, 'Rated Discharge over Turbine Speed
r • • • ' • • • 1 1 • 1 • 1 • r '1 • r • 1 ' 1
0.01 .05 .1 .2 .4 .6 .8 1 2 3 4
Q/N, Rated Discharge over Turbine Speed
Figure 30. Turbine dia~eter versus Q/N ratio for tubular turbines.
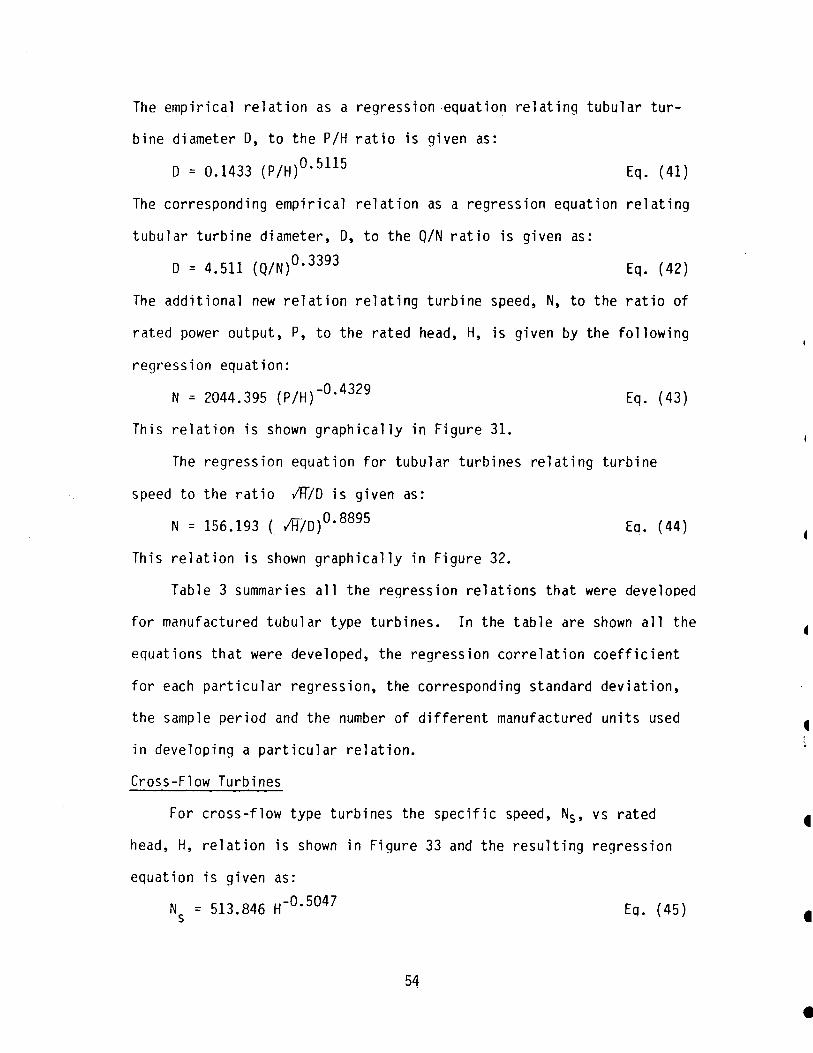
The empirical relation as a regression -equation relating tubular tur
bine diameter D, to the P/H ratio is given as:
D = 0.1433 {P/H) 0· 5115 Eq. (41)
The corresponding empirical relation as a regression equation relating
tubular turbine diameter, D, to the Q/N ratio is given as:
D = 4.511 {Q/N) 0· 3393 Eq. ( 42)
The additional new relation relating turbine speed, N, to the ratio of
rated power output, P, to the rated head, H, is given by the following
regression equation:
N = 2044.395 {P/H)-0·4329 Eq. ( 43)
This relation is shown graphically in Figure 31.
The regression equation for tubular turbines relating turbine
speed to the ratio /[/D is given as:
N = 156.193 ( IH/0) 0· 8895 Eo. ( 44)
This relation is shown graphically in Figure 32.
Table 3 summaries all the regression relations that were developed
for manufactured tubular type turbines. In the table are shown all the
equations that were developed, the regression correlation coefficient
for each particular regression, the corresponding standard deviation,
the sample period and the number of different manufactured units used
in developing a particular relation.
Cross-Flow Turbines
For cross-flow type turbines the specific speed, Ns, vs rated
head, H, relation is shown in Figure 33 and the resulting regression
equation is given as:
N = 513 846 H-0· 5047 s . Eq. ( 45)
54
•
•
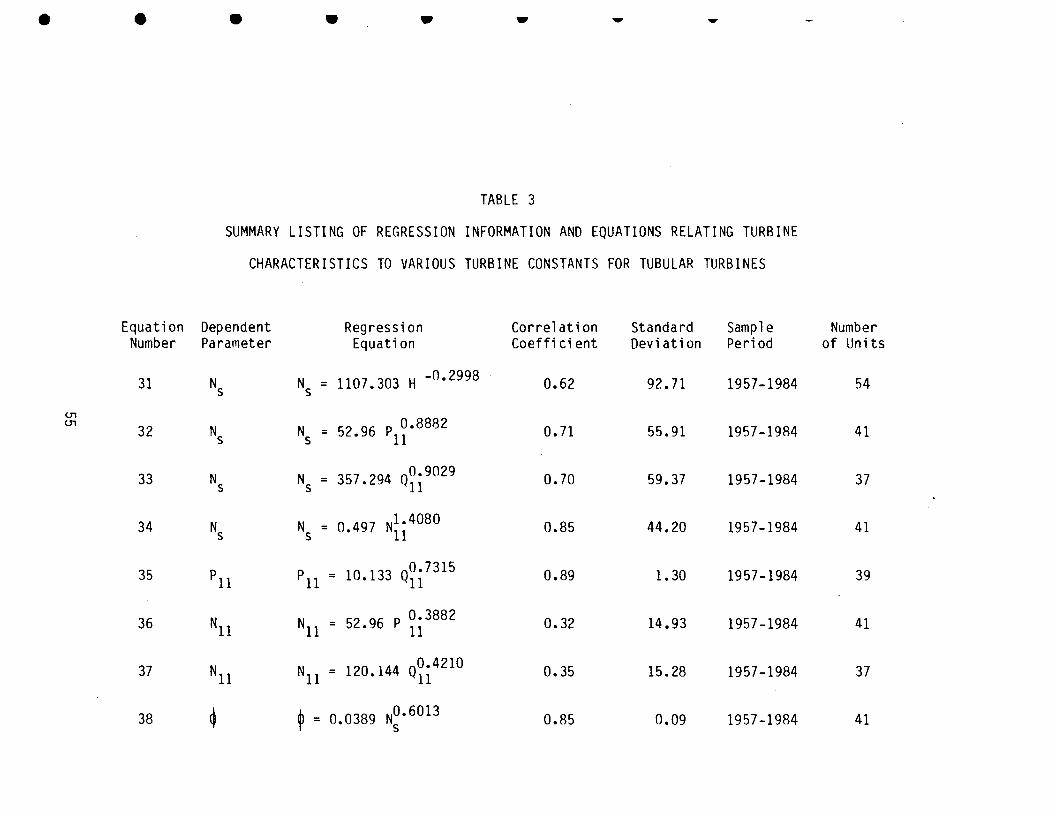
• •
Equation Number
31
(.]1 (.]1
32
33
34
35
36
37
38
• • • ... - .....
TABLE 3
SUMMARY LISTING OF REGRESSION INFORMATION AND EQUATIONS RELATING TURBINE
CHARACTERISTICS TO VARIOUS TURBINE CONSTANTS FOR TUBULAR TURBINES
Dependent Regression Correlation Standard Sample Parameter Equation Coefficient Deviation Period
Ns Ns = 1107.303 H -0•2998 0.62 92.71 1957-1984
Ns N = 52 96 p 0.8882 s • 11 0.71 55.91 1957-1984
Ns Ns = 357.294 Q~i 9029 0.70 59.37 1957-1984
Ns N = 0 497 N1•4080 s • 11 0.85 44.20 1957-1984
pll p = 10 133 00.7315 11 • 11 0.89 1.30 1957-1984
N11 N = 52 96 P 0.3882 11 • 11 0. 32 14.93 1957-1984
N11 N = 120 144 q0•4210 11 • 11 0.35 15.28 1957-1984
~ ~ = 0.0389 N~· 6013 0.85 0.09 1957-1984
Number of Units
54
41
37
41
39
41
37
41

TABLE 3 CONTINUED
Equation Dependent Regression Correlation Standard Sample Number Number Parameter Equation Coefficient Deviation Period of Units
39 t $ = O.n26 P~i3882 0.32 0.18 1957-1984 41
40 [) 0 = 1.5424 ~ 0 • 5767 0.03 1.45 1957-1984 41
41 D [) = 0.1433(~)0.5115 0.94 0.91 1957-1984 45 H
<J'1 0 = 4.511(0/N)0.3393 C) 42 D 0.99 0.46 1957-1984 37
43 N N = 2044.395(P/H)-0•4329 0.69 114.60 1957-1984 54
44 N N = 15n.193({1H) 0•8895 0.95 29.47 1957-1g84 41 f)
• • - - -
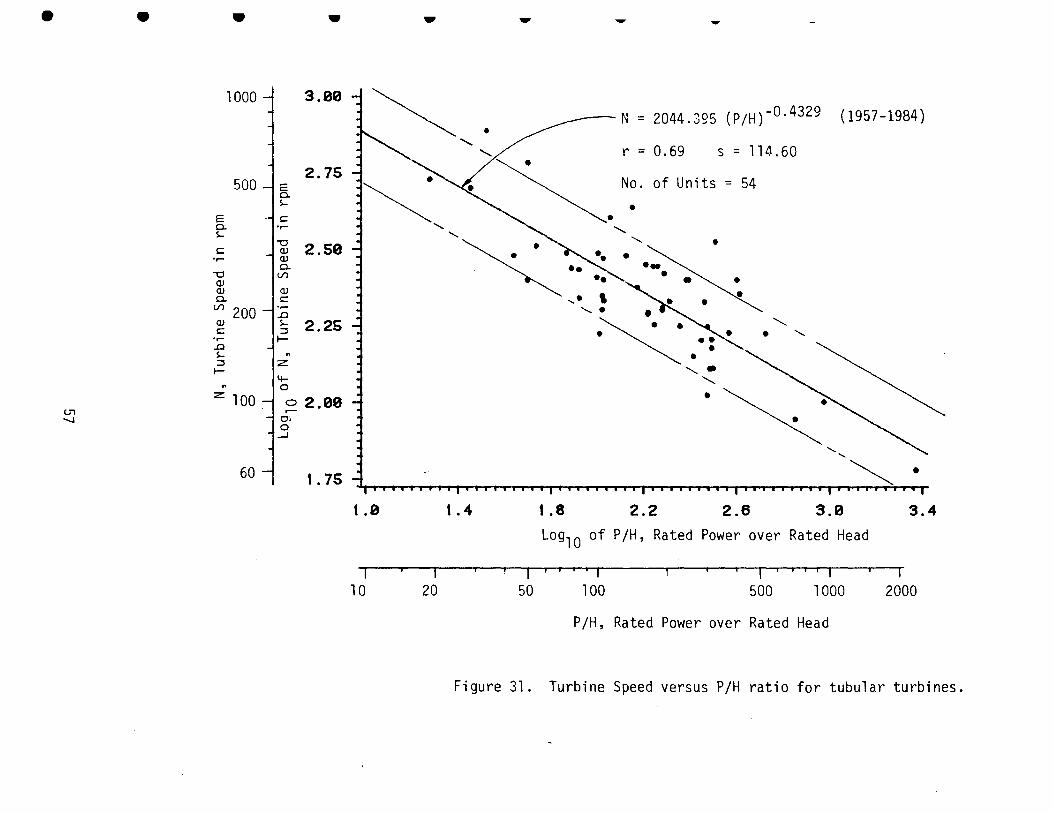
• • • • .. -1000 -1 3.00
N = 2044.395 (P/H)-0· 4329 (1957 -1984)
r = 0.69 s = 114.60
500 -IE 2. 75 1, -~~ No. of Units = 54
c.. s...
~ ~ ~ ~. •
E c c.. .,.... ' '-s... ' '"0
..._ ' c Q) 2.50 .,.... Q) c..
'"0 (/)
2.25 J ~
.... ,_ . ........_ • Q) Q) Q)
' c.. c ..._. (/) 200 .,.... , .
..0
~ ·~. ......._
Q) s... • c ::::::1 • ' .,.... 1-..0 s... "' ::::::1 z: 1-
4-"' 0
z: 100 0 2.00 (.,., ....---.....1 c;
0 _J
60 ~ t. 75 i . ........._ • 1111 t a 111 a 1 at t 1 t a 1 a 'I at r; a; at; 11 a a 1; t t; a 1 a 111 at u 1 a
1.0 1.4 t.8 2.2 2.6 3.0 3.4
Log10 of P/H, Rated Power over Rated Head
-, 10 20 50 100 500 1000 2000
P/H, Rated Power over Rated Head
Figure 31. Turbine Speed versus P/H ratio for tubular turbines.
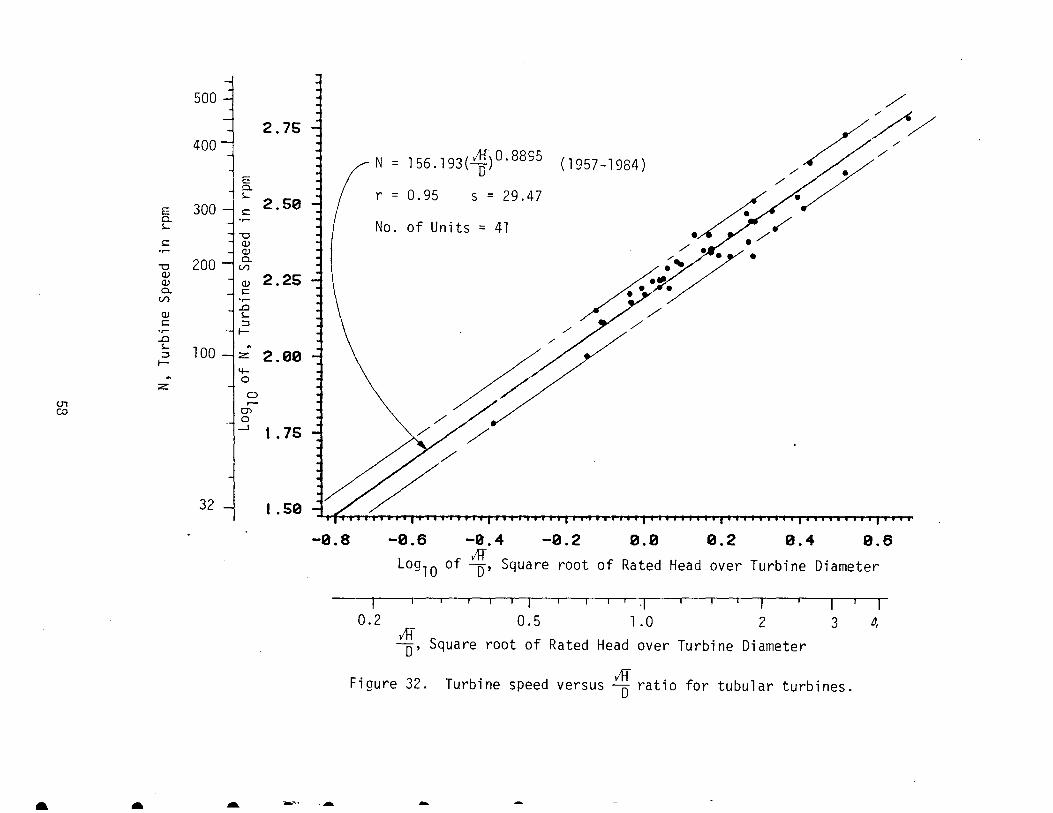
500 -1 1
400 "-1 2.751
E
N " 1
56.193(,11)0.88S5 //
0.
E
~
0. s:::
r" 0.95 D (1957-1984) ~/ / ~
......
s:::
s "29.47 //
......
No. of Units " 41 ~ /:/ "0 (l) (l) 0.
2.25 (/)
. ~
(l)
d~·/ s::: .....
/ ;;;;} . ..0 ~ ::::1 100
1- 2.00 4-
en
z:
l~ co 0
...J t . 75 -t ',_/ //
32 -1 t . 50
-0.8 -0.6 -0.4 -0.2 0.0 0.2 0.4 0.6
Log 10 of ~' Square root of Rated Head over Turbine Diameter
I I ---.- ---,- -r r ,- --,- ----,- ----.--.---- r ---, -- 1- 1- T-------, I I I 0.2 0.5 1 .o 2 3 4
~, Square root of Rated Head over Turbine Diameter
Figure 32. Turbine speed versus ~ratio for tubular turbines .
• A - ----~ ... - ....
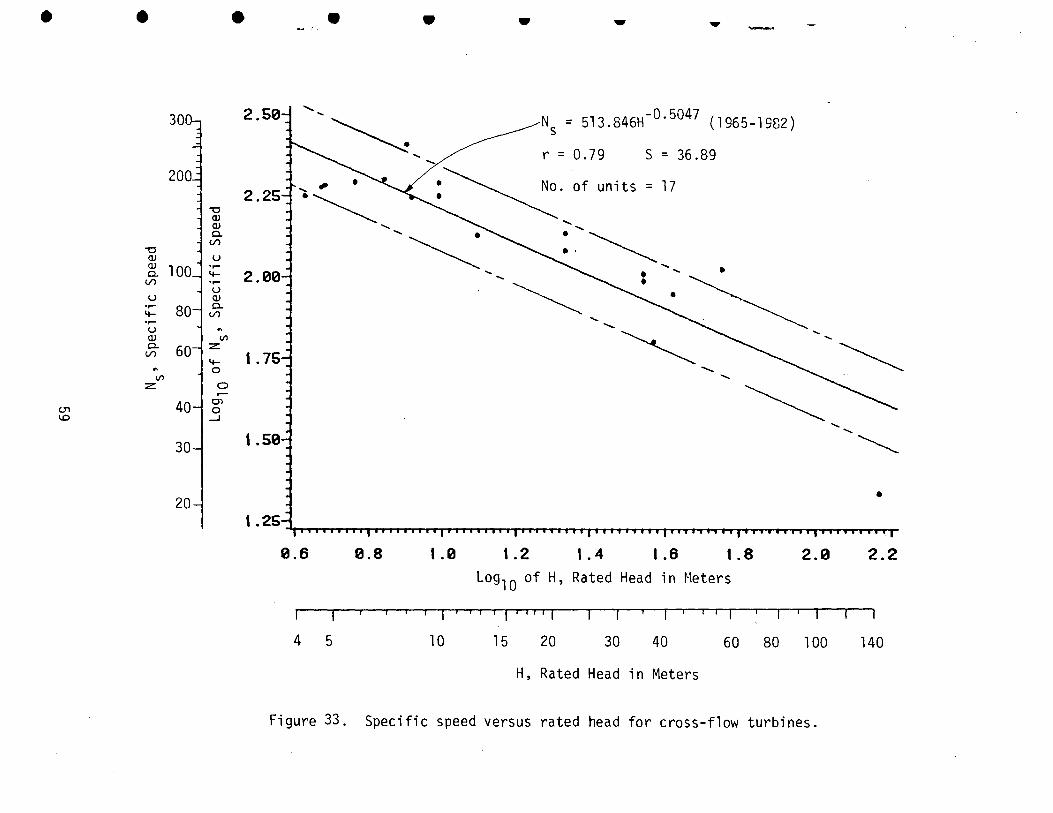
• • • • • • - ....
300--, 2.50-:j '-~ Ns = 513.846H-0· 5047 (1965-1982)
-~r = 0.79 S = 36.89
2.25 ...... - :~·of units= 17
·~ "0 Q) ..... Q) ..... ...... 0. ......
~ :.~ V) "0 Q) u ~ 100 ·..- .....
4- 2.00 ..... • ..... V) ·..-
~ • u
u Q) .,..- 80 0. 4- V) ...... ·..- ........ u .. Q) Ill 0. 60 :z:
V) 1. 76 4-0
~ ~ :z: 0
(.]"1 40 f 1.0
1.501 ...... .....
30~ ...............
• 201 '.25~ I' I I I I I I I I I I' I I I I I I I I I I I IiI I' I I I
0.6 0.8 1.0 1.2 1.4 1.6 1.8 2.0 2.2 Log10 of H, Rated Head in Meters
1 1 1 1 1 1 1 1 1 1 1 1 1 1 1 1 1 1 1 1 1 1 1 1 1 ------T - 1 - 1
4 5 10 15 20 30 40 60 80 100 140
H, Rated Head in Meters
Figure 33. Specific speed versus rated head for cross-flow turbines.
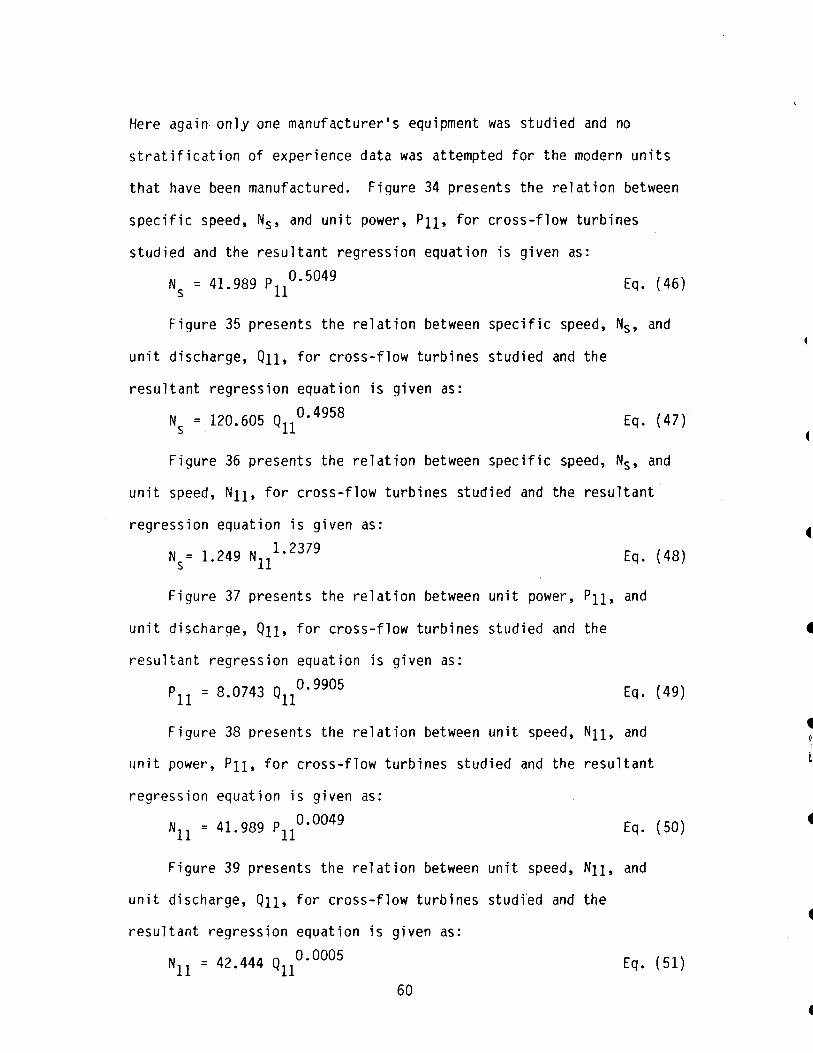
Here again· only one manufacturer's equipment was studied and no
stratification of experience data was attempted for the modern units
that have been manufactured. Figure 34 presents the relation between
specific speed, Ns, and unit power, P11, for cross-flow turbines
studied and the resultant regression equation is given as:
Eq. ( 46)
Figure 35 presents the relation between specific speed, Ns, and
unit discharge, 011, for cross-flow turbines studied and the
resultant regression equation is given as:
Ns = 120.605 0110.4958 Eq. {47)
Figure 36 presents the relation between specific speed, Ns, and
unit speed, N11, for cross-flow turbines studied and the resultant
regression equation is given as:
N = 1 249 N 1· 2379 s . 11 Eq. { 48)
Figure 37 presents the relation between unit power, P11, and
unit discharge, 011, for cross-flow turbines studied and the
resultant regression equation is given as:
pll = 8.0743 0110.9905 Eq. {49)
Figure 38 presents the relation between unit speed, N11, and
unit power, P11, for cross-flow turbines studied and the resultant
regression equation is given as:
Nll = 41.989 p110.0049 Eq. (50)
Figure 39 presents the relation between unit speed, N11, and
unit discharge, 011, for cross-flow turbines studfed and the
resultant regression equation is given as:
Nll = 42.444 Q110.0005 Eq. (51)
60
•
•
•
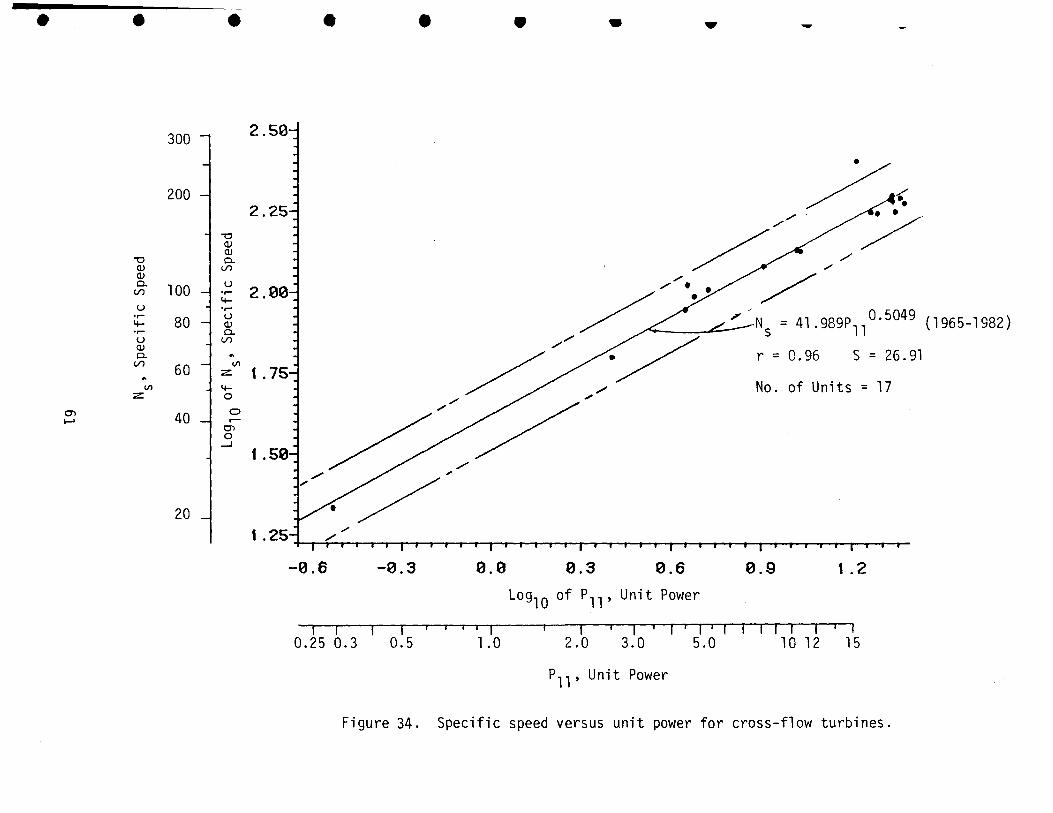
• • •
300
200
I -o Q) Q)
u 0. 100 (./')
u .,.... u .,....
80 Q) 4--.,.... 0. u (./') Q) 0. ..
Vl (./')
60 z: " Vl 4--
z: 0
0 40 ..-0"1 ._. 01 0
...J
20
2.50
2.25
2.00
1. 75
1.50
• • •
//
~ / // ~/ /
• ..
/ /
', N = 41 .989P 0· 5049 (1965-1982) .... ,____. s 11
r = 0.96 s = 26.91
No. of Units = 17
t · 25 I 1 I , a a a 1 r ; r r 1 r a 1 1 a a 1 1 1 1 t 1 r 1 a 1 a 1 1 a a 1 t a 1 1 a t
-0.6 -0.3 0.0 0.3 0.6 0.9 1.2
Log10 of P11 , Unit Power
I I I I I I I I I I I I I I I I I I I I I I I I I I 0.25 0.3 0.5 1.0 2.0 3.0 5.0 10 12 15
P11 , Unit Power
Figure 34. Specific speed versus unit power for cross-flow turbines.
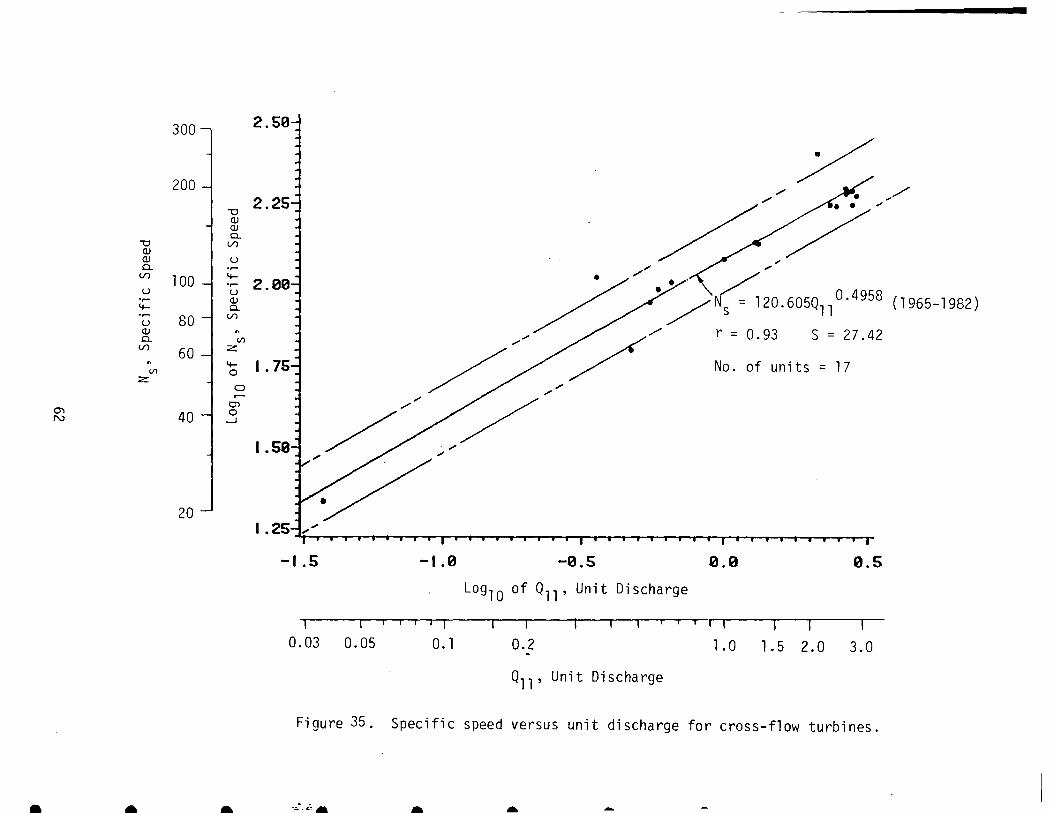
300 2.50
200 I
"0 (l.J (l.J
0.. "0 (./)
(l.J (l.J u 0.. ......
(./) 100 4-.,.... 2.00 u u .,.... (l.J j / / /.Nc = l20.605Q,,v.'+:?:Jo (1965-1982) 4- 0.. ..... 80 (./) u (l.J .. 0.. Vl
(./) 60 z '
i;o I. 751 //,, / No. of units = 17 Vl z
...... 01
O'l 40 ~ .3 N
1.50
20
-1.5 -1.0 -0.5 0.0 0.5
Log1 0 of 011 , Unit Discharge
J -- -- - - ~- -, "0 ., -.-. --- -T- T T T I I I ,-----l
0.03 0.05 0.1 0.2 1.0 1.5 2.0 3.0
011 , Unit Discharge
Figure 35. Specific speed versus unit discharge for cross-flow turbines.
• • • -~·.~, . ... ...
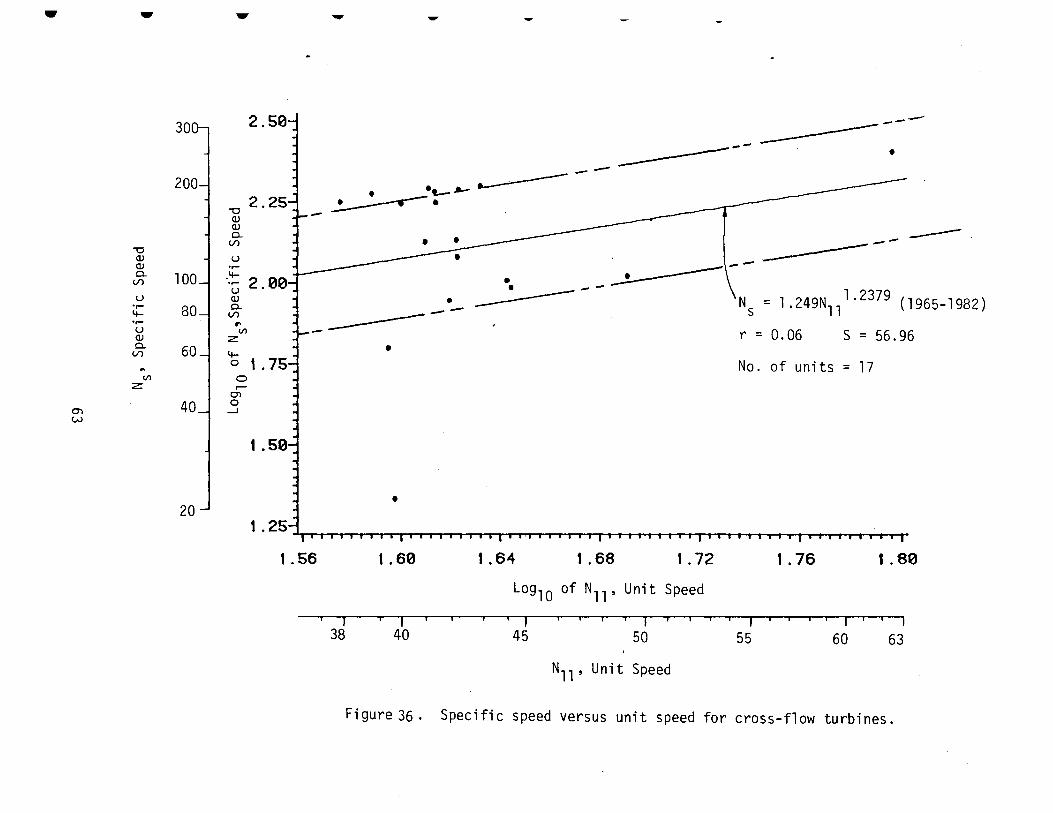
- ..
"'0 Q) Q) 0.. Vl
u •r-'+-•r-u Q) 0.. Vl
~
Vl z
0'\ w
30
100
80
60
40
20
..
"'0 Q) Q) 0.. Vl
u •r-
rVl
z
0 ,_. 0'\ 0 _J
2.se
1.56
- -
------------• ~·:-.a---------
------------• ------- N = 1 249N 1· 2379 (1965-1982) s . 11
r = 0.06 s = 56.96 •
No. of units = 17
•
1.60 1.64 1.68 1. 72 t. 76 1.80
Log 10 of N11 , Unit Speed
..--~--r---,- -----.---,---.---------.- T .-----I f I I ' I I I I I I I I I I
38 40 45 50 55 60 63
N11 , Unit Speed
Figure 36. Specific speed versus unit speed for cross-flow turbines.
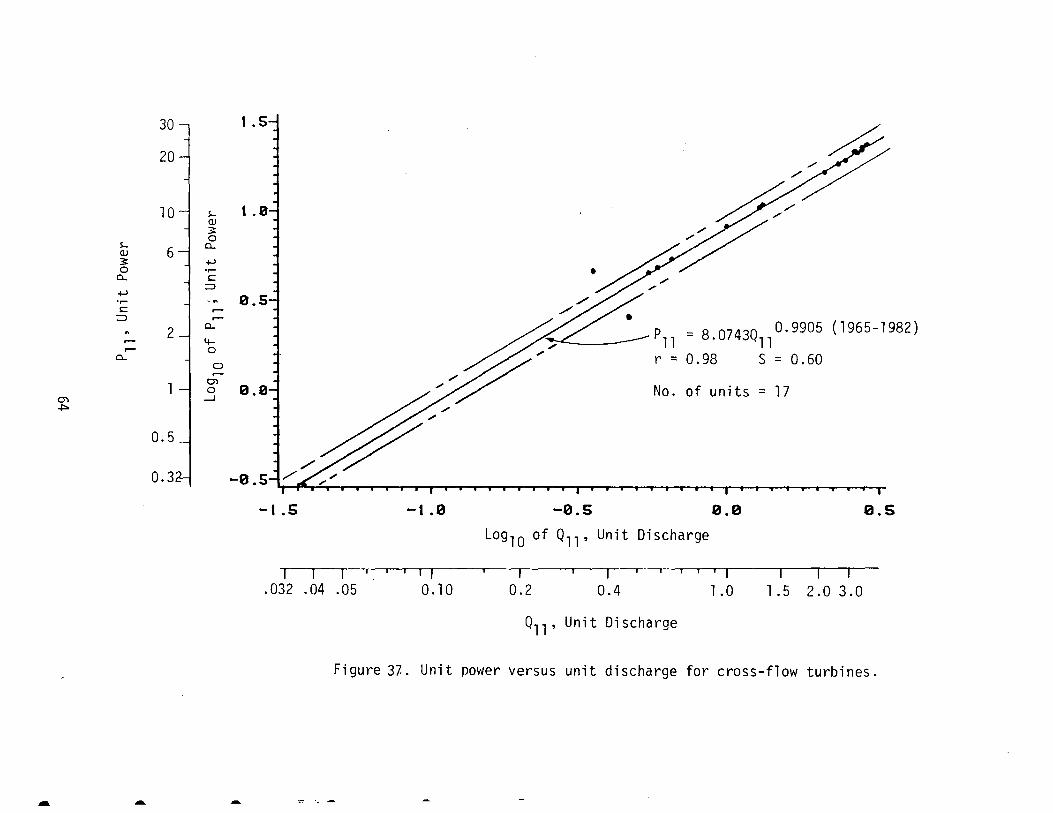
30-, t . 5 J
20-1 i
10 --1 s.... t . 0
~
<lJ
s.... 3
d;P 0
<lJ c...
3: 0
+J
c... .,....
+J
s:::::
,.... ::::>
. p s:::::
-~
::::> ,...... ,...... df_
2 c...
c... 4-
_j 0
0 ,......
/~ 11 - 8.074301 0.9905 (1965-19
m Ol
+=-0 0.0 I_J
g./ r=0. 98 1 82)
0.5 J
s = 0.60
1
p/ No. of units = 17
o. 32-l -0.5- -
I I I I I I I I I
- t 5 . I I I I • I I I
-t .0 -0.5 Log of Q 0.0
10 11' Unit o· 0.5
1scharge
I I I I I I II I I I I I I I I 'I ,-,-, . 032 . 04 . 05 0.10 0. 2 0. 4 1 . 0 1 . 5 2. 0 3. 0
Q11 , Unit Discharge
Figure 37.. Unit power versus unit discharge for cross-flow turbines .
- .-.
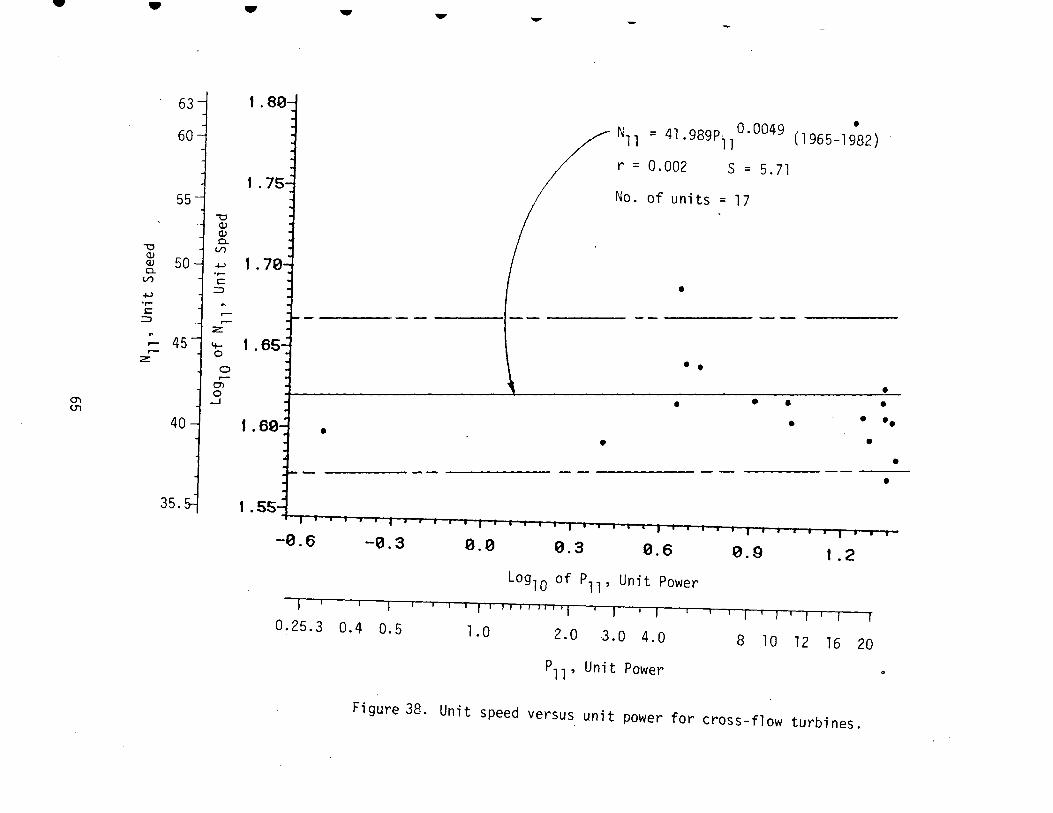
• •
63 --1
60
j
55~ "'0 Q) Q) 0.
"'0
50i i Q) Q) 0.
(/)
~ •r-c
::::>
451 ~ ,..... ,..... z:
0 ,..... O'l
0'\ r3 (J1
40 -l
35.
- - -1.ae
1. 75
1. 70
1.65
I .60---, •
-0.6 -0.3 0.0
0.25.3 0.4 0.5 l.O
-
• N = 41 989P· 0 · 0049 (1965-1982) 11 . 11
r = 0.002 s = 5.71
No. of units = 17
•
• •
• • • ..! •
• • •• • •
• •
0.3 0.6 0.9 1.2
Log10 of P11 , Unit Power
2.0 3.0 4.0 8 10 12 16 20
P11 , Unit Power
Figure 38. Unit speed versus unit power for cross-flow turbines.
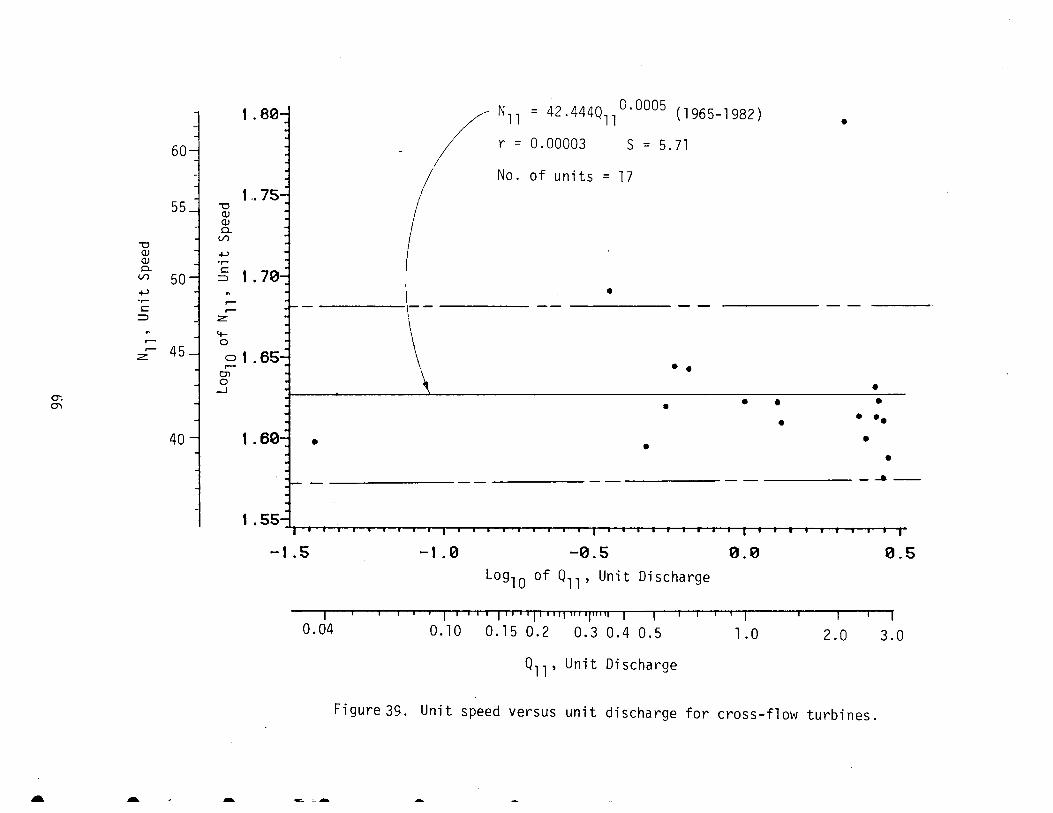
... - -
-1.5 -1.0
= 42.444011 °· 0005 (1965-1982)
0.00003 s = 5.71
of units = 17
•
• •
• • • •
•
-0.5 0.0 Log1 0 of 011 , Unit Discharge
•
• •
• •• •
• _ _. __
0.5
I , , ' ,-T--rT•T~ I"''T'"II'"II""' I I I I I ' I --~---~
0.04 0.10 0.15 0.2 0.3 0.4 0.5 1.0 2.0 3.0
011 , Unit Discharge
Figure 39-. Unit speed versus unit discharge for cross-flow turbines .
~ =-..-.
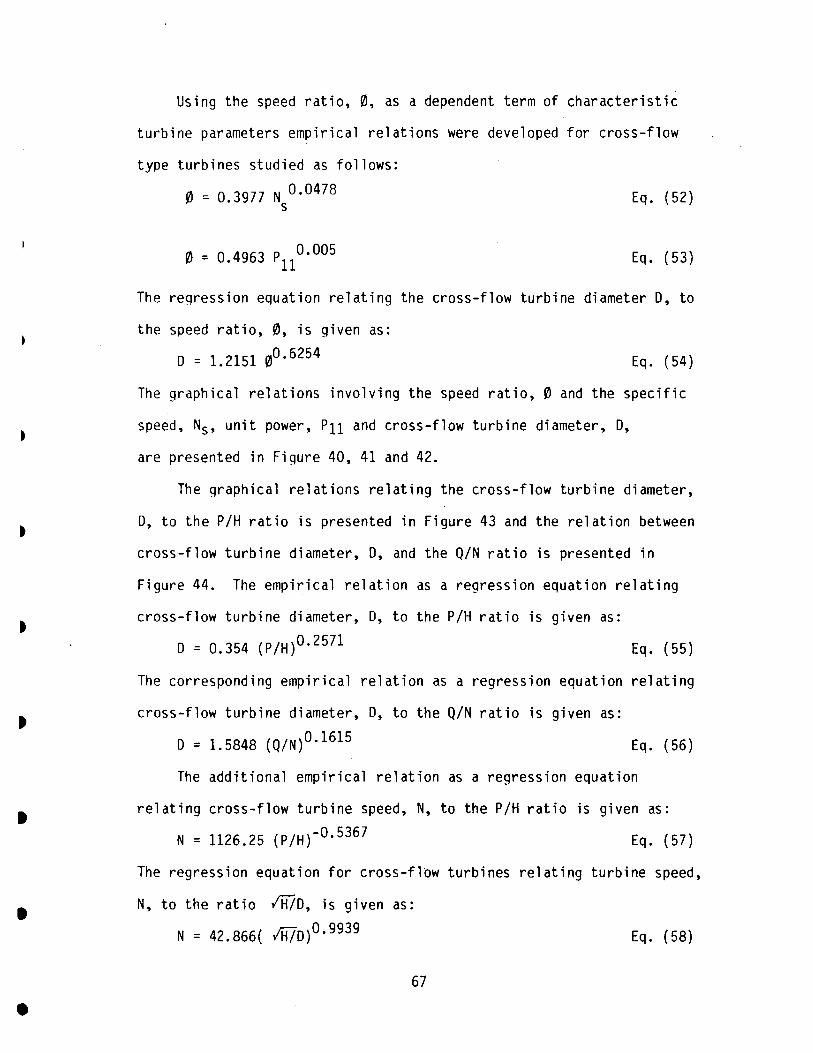
•
•
•
Using the speed ratio, 0, as a dependent term of characteristic
turbine parameters empirical relations were developed for cross-flow
type turbines studied as follows:
0 = 0 3977 N 0.0478 . s
0 = 0.4963 p110.005
Eq. (52}
Eq. (53}
The reqression equation relating the cross-flow turbine diameter D, to
the speed ratio, 0, is given as:
D = 1.2151 0°· 6254 Eq. (54}
The graphical relations involving the speed ratio, 0 and the specific
speed, Ns, unit power, P11 and cross-flow turbine diameter, D,
are presented in Figure 40, 41 and 42.
The graphical relations relating the cross-flow turbine diameter,
D, to the P/H ratio is presented in Figure 43 and the relation between
cross-flow turbine diameter, D, and the Q/N ratio is presented in
Figure 44. The empirical relation as a regression equation relating
cross-flow turbine diameter, D, to the P/H ratio is given as:
D = 0.354 (P/H} 0· 2571 Eq. (55}
The corresponding empirical relation as a regression equation relating
cross-flow turbine diameter, D, to the Q/N ratio is given as:
D = 1.5848 (Q/N} 0· 1615 Eq. (56}
The additional empirical relation as a regression equation
relating cross-flow turbine speed, N, to the P/H ratio is given as:
N = 1126.25 (P/H}- 0· 5367 Eq. (57}
The regression equation for cross-flow turbines relating turbine speed,
N, to the ratio IH/D, is given as:
N = 42.866( IH/0} 0· 9939 Eq. (58}
67
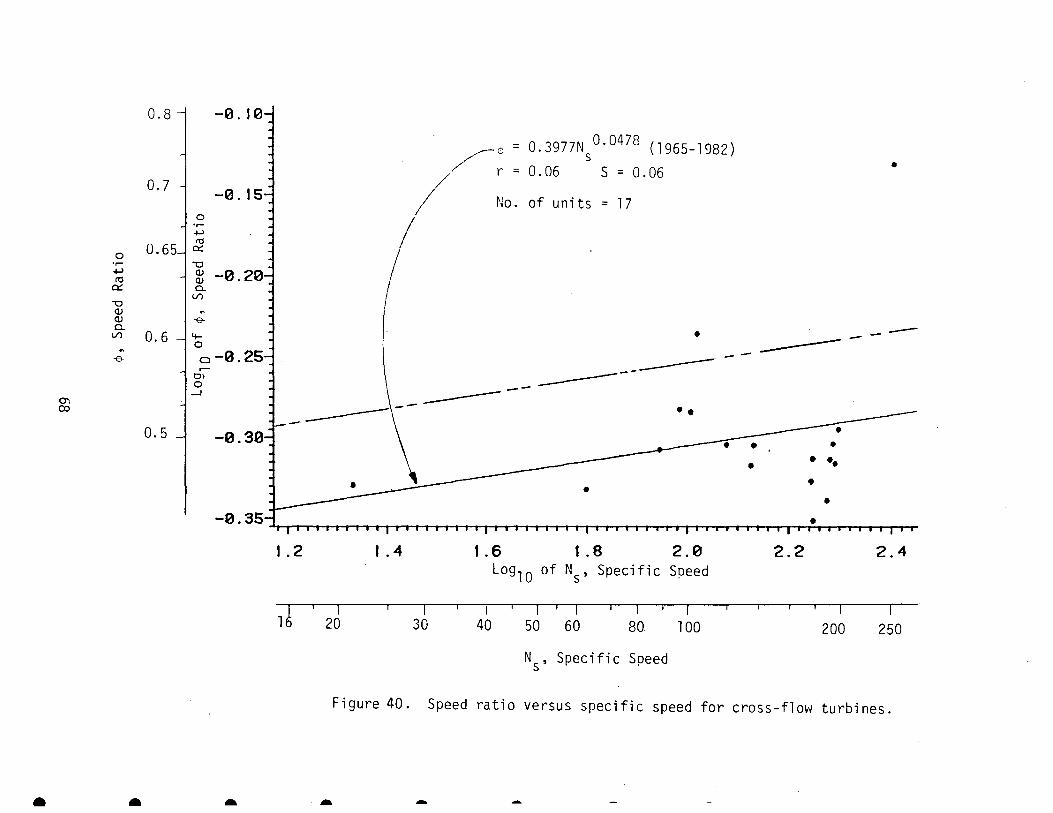
• A
o. 8 --i -e . t e
/-o / r
= 0.3977N °· 0478 (1965-1982) s = 0.06 s = 0.06
I II
No. of units = 17
I •
----------------- ••
• •
----· •
••• •
•
•
-
-0.35j • I I I I I I I i I I I I I I I I I I I I I I I I I I I I I I I I I' I I I ' I I I I i I I I ' I t I I I I I 'I I I I I I I I '
1.2 1.4 1.6 1.8 2.0 2.2 2.4 Log10 of Ns, Specific Speed
~ --,---- ~--, -,-,--~-~----,-- T I -,
1~ 20 30 40 50 60 80 100 200 250
Ns, Specific Speed
Figure 40. Speed ratio versus specific speed for cross-flow turbines .
- - -
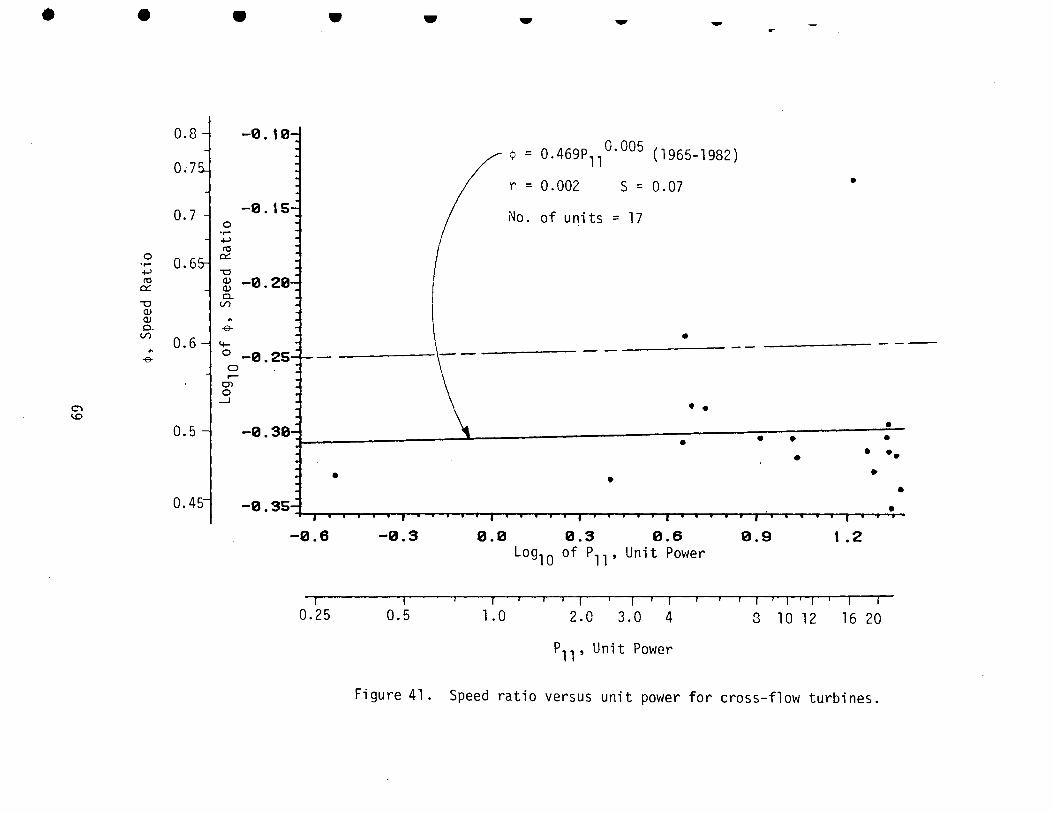
• • • • • ... -
¢ = 0.469P 11 °· 005 (1965-1982)
r = 0.002 s = 0.07 •
No. of u~its = 17
• -----
• • •
• • • • • • ••
• • • •
0.0 0.3 0.6 0.9 t • 2 Log10 of P11 , Unit Power
.......----....,..----r---r--r---:r-r---r-.---r--,.-,~-.-....,..--,-,....,.-,--r-r--r--T - I
0.25 0.5 1.0 2.0 3.0 4 3 10 12 16 20
P11 , Unit Power
Figure 41. Speed ratio versus unit power for cross-flow turbines.
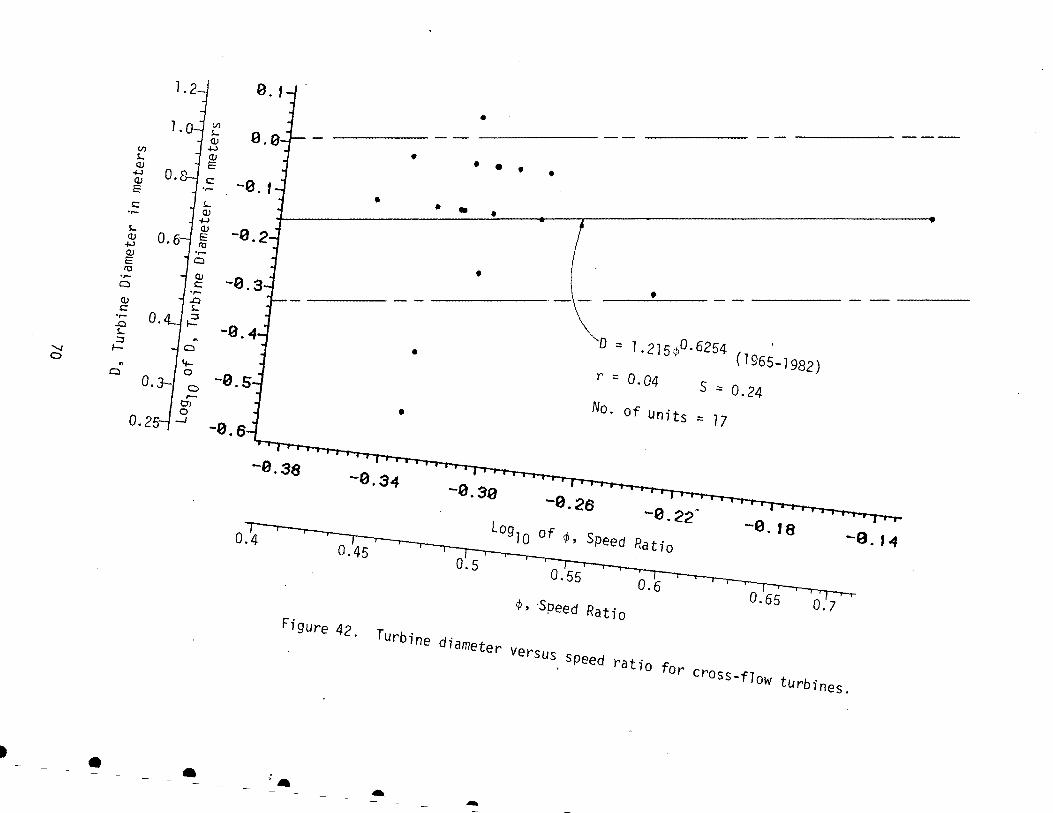
9.11 • 7. Vl
s.... <lJ
V) ~
• • • • • t <lJ s.. E <lJ
0. -a. 1 ~
~
c
• • •
<lJ ...... E s.. c <lJ .,.. ~ s.. <lJ E <lJ tO ~
<lJ ...... E q
• • \
-a. s-j tO
<lJ ,.. c q ......
.a <lJ c s....
'D : 1 .215¢0
·6254 (1965-1982)
0. ::J ..... 1-- -a.4
• r : 0.04 s ; 0.24
.a s.. "' ::J
q 1--'-1
4-0
"' 0 -a.s q
0.3- a ,_
No. of units : 17 • O'J 0
0. 25-/-J .... -
-9.38 -9.34
-9.39 -9.26 -e. 22~
-e. 1a -9. f 4 0.4
0.45 Log 10 of ¢, Speed Ratio
o.s 0.55
0.6 0.65
Figure 42. Turbine diameter versus speed ratio for cross-flow turbines .
¢, ·Speed Ratio 0.7
• • • ; ... .... -
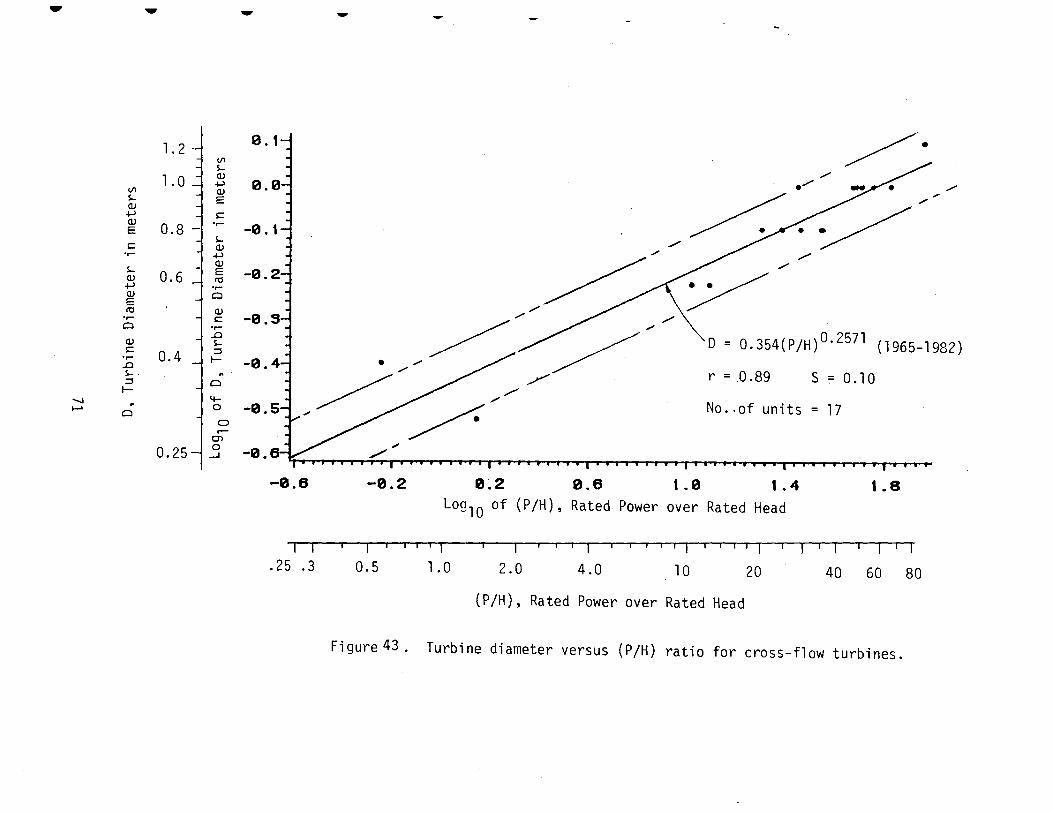
.. - -
1.2 Vl s....
1.0 Q) ....., Vl Q) s.... E Q)
/'
/' ........
....., s::: Q)
0.8 -.,....
E • s.... s::: Q) .,.... ....., / Q)
s.... 0.6 E
Q) ttl ....., .,.... /'
Q) Cl E ttl Q) .,.... s:::
Cl .,.... ...-..0
Q) s.... s::: 0.4 ::J .,.... I-..0 s.... ::J
j~ I--.....! .. .....
Cl
/ D = 0.354(P/H) 0· 2571 (1965-1982)
r = .0.89 5=0.10
No .. of units= 17 0 .--
01
0.25--i _g -0.
-0.6 -0.2 0~2 0.6 1.0 1.4 1.8 Log 10 of (P/H), Rated Power over Rated Head
1-T-.------r-,---,-.--, T---. 'T-,--,--.--.,---,- T ,- r -,- 1 -,-I
.25 .3 0.5 1.0 2.0 4.0 10 20 40 60 80
(P/H), Rated Power over Rated Head
Figure 43. Turbine diameter versus (P/H) ratio for cross-flow turbines.
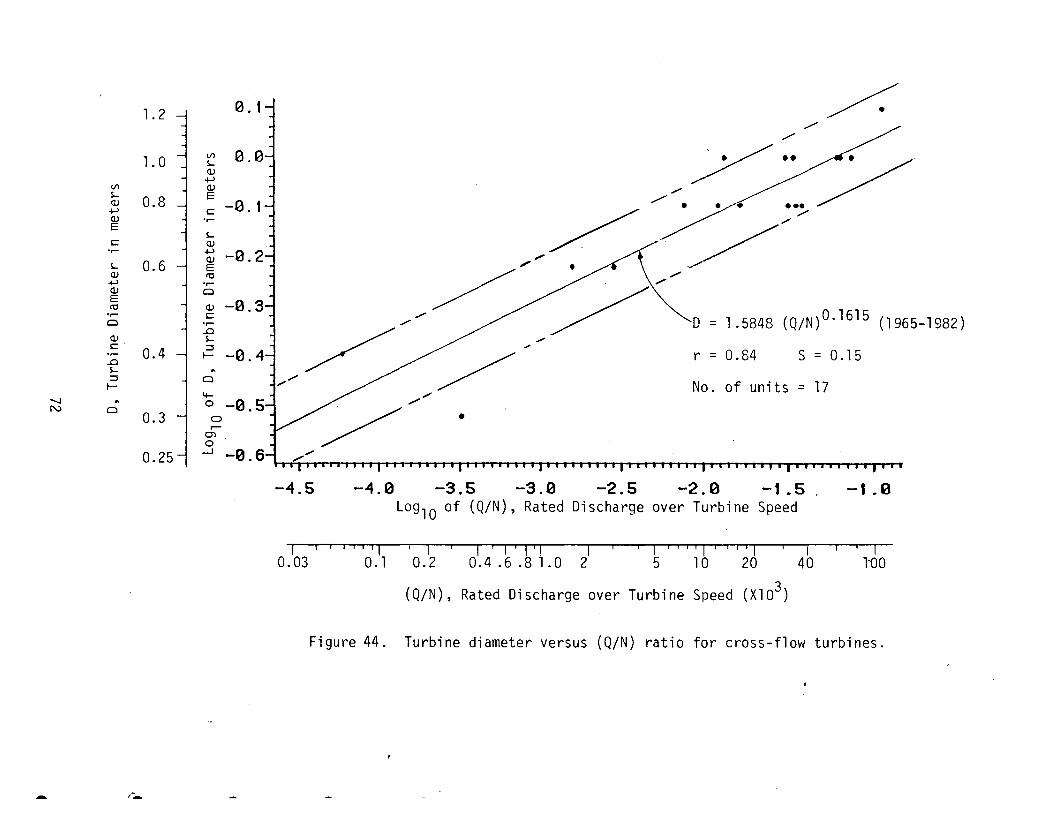
1.2 ~ ~.'
1.0 Vl ~-~ !-
/. /
Cl)
+-' Vl Cl) !- 0.8 E Cl)
s::: -~.' +-' Cl) .,.... E
!-s::: Cl) .,....
't:: -~.2 !- 0.6 E Cl) "' +-' .,.... Cl) Cl E
Cl) -~.3 "' .,.... s::: Cl .,....
..0 = 1.5848 (Q/N) 0· 1615 (1965-1982)
Cl) !- ~ ~ ~ ..,.,.
s::: 0.4 ::I ... .- I- -~.4 ..0
r = 0.84 S = 0.15 !- ~
::I Cl I-
60 -~.51 / / -....s ~ / N Cl ./ 0.3 •
No. of units = 17
0.25
-4.5 -4.0 -3.5 -3.0 -2.5 -2.B -t.5 -1 .B Log 10 of (Q/N), Rated Discharge over Turbine Speed
l - 1 1 1 TTTr- , l ---------r 1 I 1 l 1 1 I 1 1 1 1 1 1 1 I 1 1-r---. I 1 I - r -.---I 0. 03 0.1 0. 2 0. 4 . 6 . 8 1 . 0 2 5 10 20 40 lOO
(Q/N), Rated Discharge over Turbine Speed (Xlo3)
Figure 44. Turbine diameter versus (Q/N) ratio for cross-flow turbines.
''-
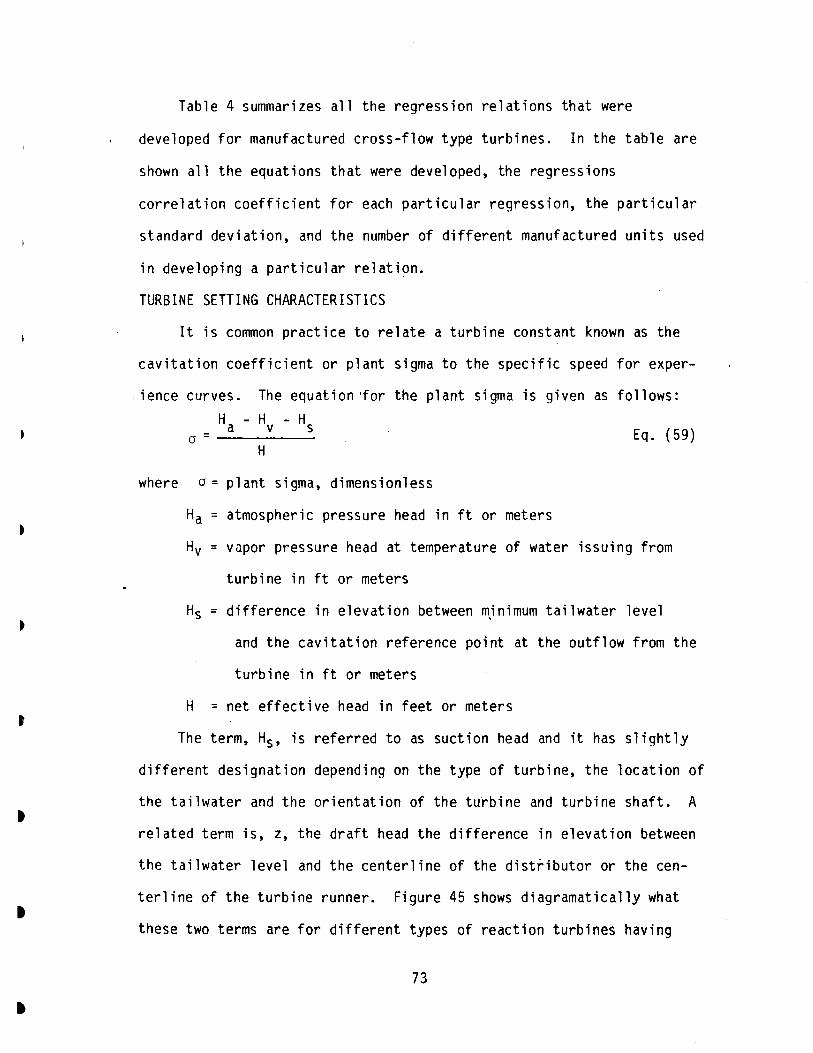
•
•
Table 4 summarizes all the regression relations that were
developed for manufactured cross-flow type turbines. In the table are
shown all the equations that were developed, the regressions
correlation coefficient for each particular regression, the particular
standard deviation, and the number of different manufactured units used
in developing a particular relation.
TURBINE SETTING CHARACTERISTICS
It is common practice to relate a turbine constant known as the
cavitation coefficient or plant sigma to the specific speed for exper-
ience curves. The equation ·for the plant sigma is given as follows:
H - H - H a v s o=------ Eq. (59} H
where o = plant sigma, dimensionless
Ha = atmospheric pressure head in ft or meters
Hv = vupor pressure head at temperature of water issuing from
turbine in ft or meters
Hs = difference in elevation between m)nimum tailwater level
and the cavitation reference point at the outflow from the
turbine in ft or meters
H = net effective head in feet or meters
The term, Hs, is referred to as suction head and it has slightly
different designation depending on the type of turbine, the location of
the tailwater and the orientation of the turbine and turbine shaft. A
related term is, z, the draft head the difference in elevation between
the tailwater level and the centerline of the distributor or the cen-
terline of the turbine runner. Figure 45 shows diagramatically what
these two terms are for different types of reaction turbines having
73
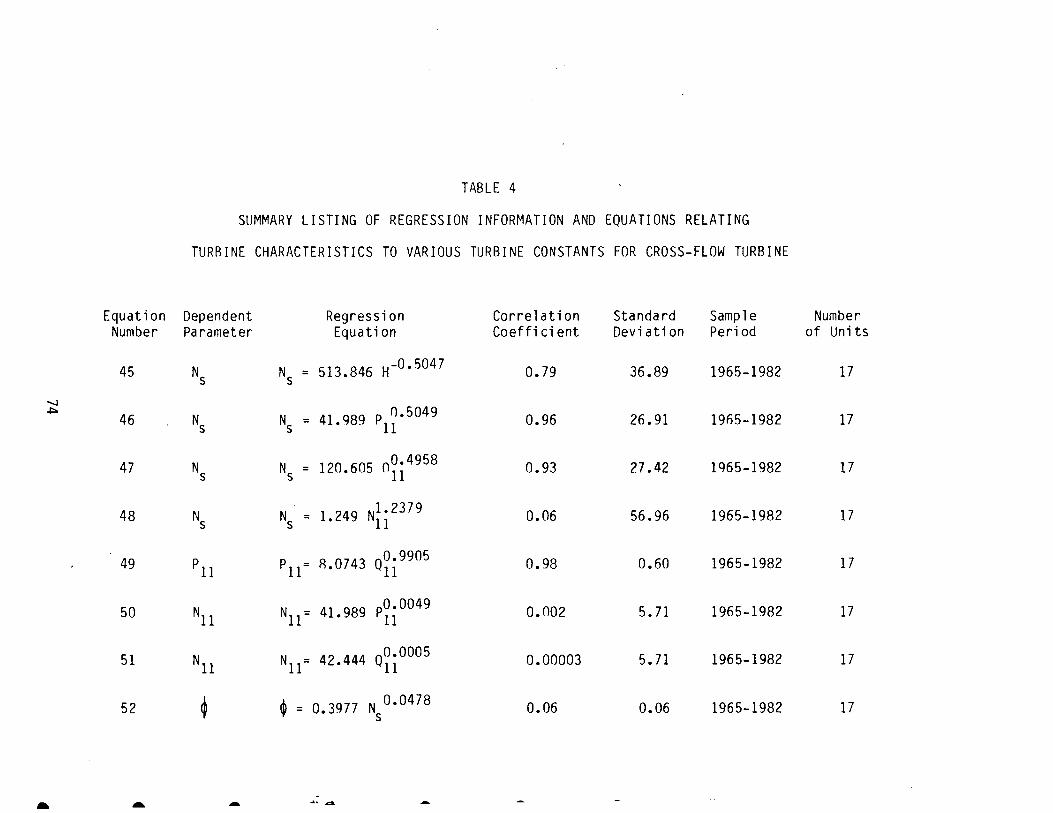
Equation Number
45
""-J ~
46
47
48
49
50
51
52
- -
TABLE 4
SUMMARY LISTING OF REGRESSION INFORMATION AND EQUATIONS RELATING
TURRINE CHARACTERISTICS TO VARIOUS TURBINE CONSTANTS FOR CROSS-FLOW TURBINE
Dependent Regression Correlation Standard Sample Parameter Equation Coefficient Deviation Period
Ns N = 513.846 H-0•5047 s 0.79 36.89 1965-1982
Ns Ns = 41.989 P1i.5049 0.96 26.91 1965-1982
Ns Ns = 120.605 o~i 4958 0.93 27.42 1965-1982
Ns N = 1 249 N1•2379 s • 11 0.06 56.96 1965-1982
p11 p = R 0743 00.9905 11 • 11 0.98 0.60 1965-1982
N11 N = 41 989 P0•0049 11 • 11 0.002 5.71 1965-1982
N11 N = 42 444 00.0005 11 • 11 0.00003 5. 71 1965-1982
~ $ = 0.3977 Ns0.0478 0.06 0.06 1965-1982
. - ~· """
Number of Units
17
17
17
17
17
17
17
17
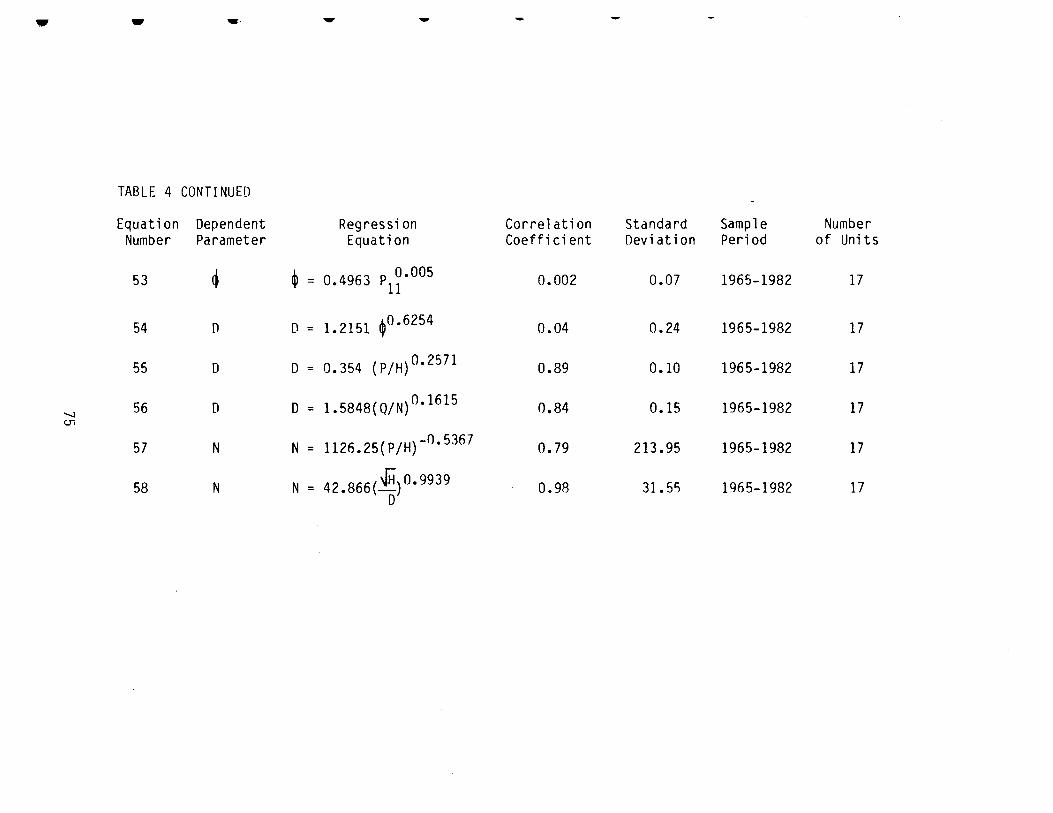
• - ... - -
TABLE 4 CONTINUED
Equation Dependent Regression Correlation Standard Sample Number Number Parameter Equation Coefficient Deviation Period of Units
53 ~ ~ = 0.4963 p1~· 005 0.002 0.07 1965-1982 17
54 [) D = 1.2151 ~0 • 6254 0.04 0.24 1965-1982 17
55 D D = 0.354 (P/H) 0•2571 0.89 0.10 1965-1982 17
'-.1 56 D D = 1.5848(Q/N) 0"1615 0.84 0.15 1965-1982 17
c.n
57 N N = 1126.25(P/H)-0•5367 0.79 213.95 1965-1982 17
58 N N = 42.866(~) 0 • 9939 0.98 31.5S 1965-1982 17 0
HW
Francis Turbine
Inclined Tubular Turbine
Vertical Tubular Turbine
Bulb 8 Horizontal Tubular Turbine
Figure 45. Definition diagram for suction head, Hs and draft head, Z, for different types of turbines.
76
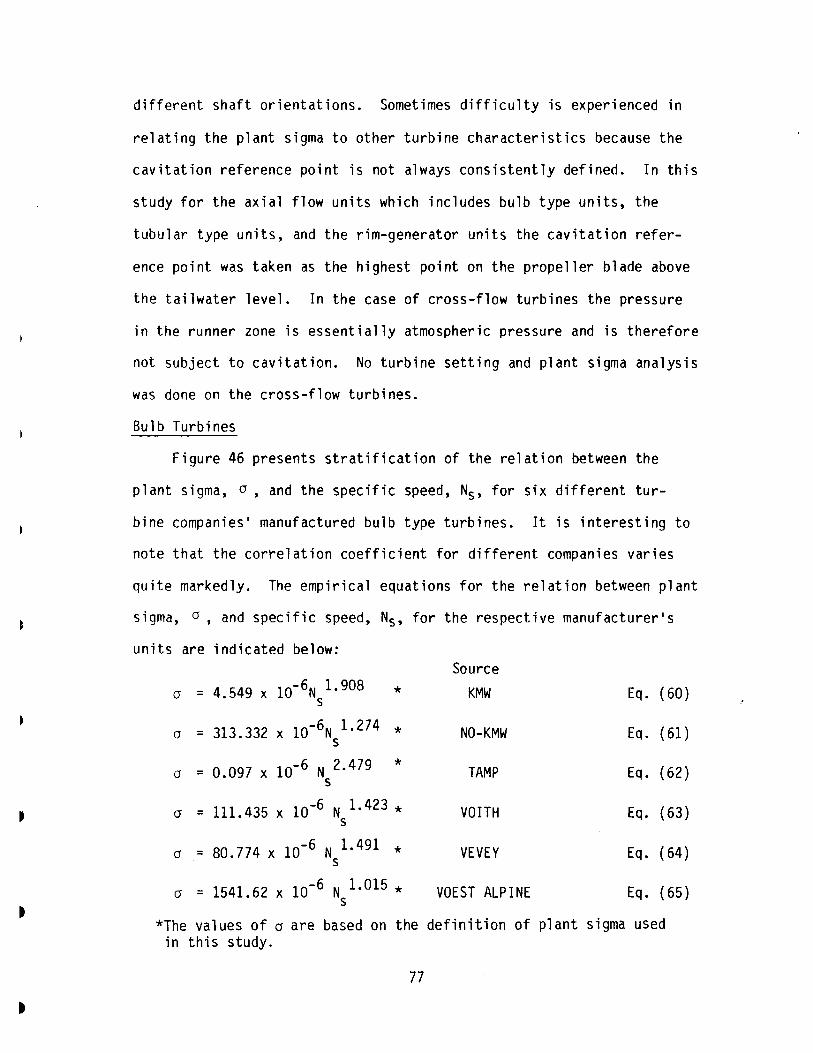
different shaft orientations. Sometimes difficulty is experienced in
relating the plant sigma to other turbine characteristics because the
cavitation reference point is not always consistently defined. In this
study for the axial flow units which includes bulb type units, the
tubular type units, and the rim-generator units the cavitation refer-
ence point was taken as the highest point on the propeller blade above
the tailwater level. In the case of cross-flow turbines the pressure
in the runner zone is essentially atmospheric pressure and is therefore
not subject to cavitation. No turbine setting and plant sigma analysis
was done on the cross-flow turbines.
Bulb Turbines
Figure 46 presents stratification of the relation between the
plant sigma, a, and the specific speed, Ns, for six different tur
bine companies• manufactured bulb type turbines. It is interesting to
note that the correlation coefficient for different companies varies
quite markedly. The empirical equations for the relation between plant
sigma, a, and specific speed, Ns, for the respective manufacturer•s
units are indicated below: Source
a = 4 549 10-6N 1· 908 • X S * KMW Eq. (60)
a = 313.332 X 10⁻⁶N 1· 274 s * NO-KMW Eq. (61)
0.097 x 10⁻⁶ N 2·479 * a = TAMP Eq. (62) s
a = 111.435 X 10⁻⁶ N 1· 423 * s VOITH Eq. (63)
a = 80 774 10-6 N 1· 491 • X S * VEVEY Eq. ( 64)
a = 1541 62 10-6 N 1•015 * • X S VOEST ALPINE Eq. (65)
*The values of a are based on the definition of plant sigma used in this study.
77
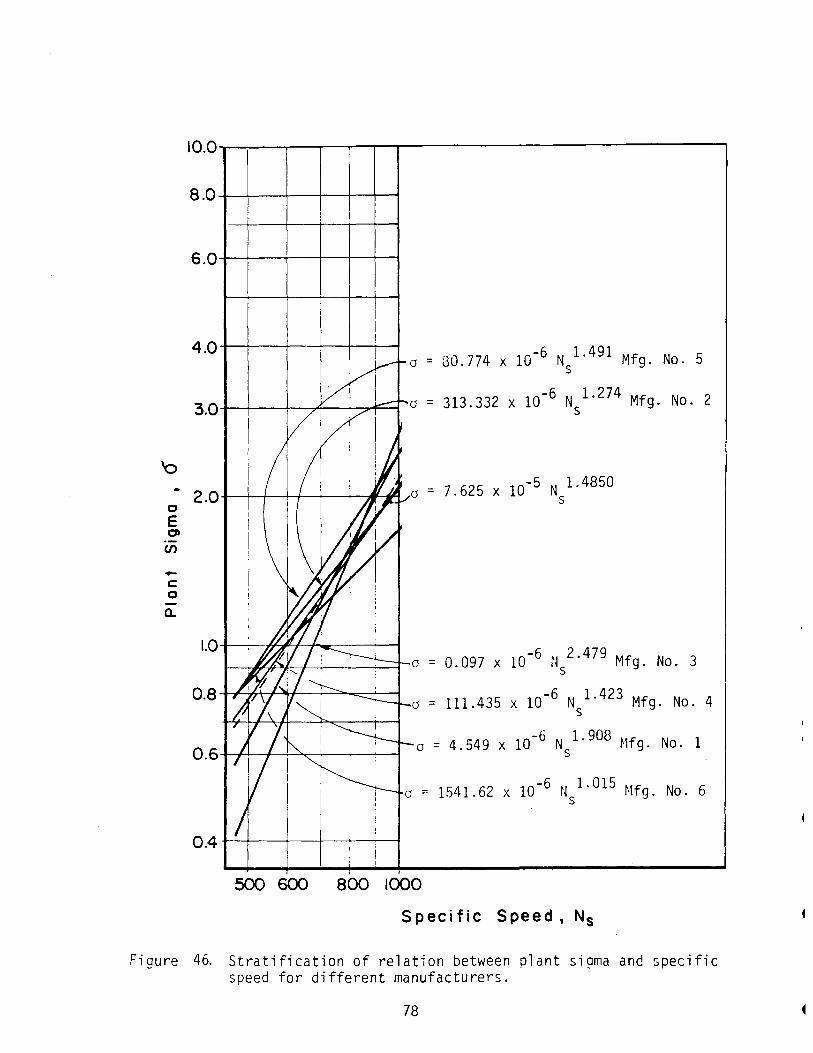
'o
0 E ~
en
-c: 0
a..
I 0.0 -r---:-----,.---r--,----,---.-----------------,
8 .0 ~--+--+----+---+-----"r---1
4 .0 +---+---+--+--+-----,.---4
2.0
1.0
0.8
'
a= 80.774 x 10⁻⁶ Ns 1·491 Mfg. No. 5
a = 313.332 x 10⁻⁶ N 1·274 Mfg. No. 2 s
7.625 X 10⁻⁵ N 1·4850 s
0.097 x 10⁻⁶ N 2·479 Mfg. No. 3 s
111.435 x 10⁻⁶ N 1·423 Mfg. No. 4 s
a = 4.549 x 10⁻⁶ Ns 1· 908 Mfg. No. 1
a = 1541.62 x 10-6 N 1·015 Mfg. No. 6 s
500 600 800 1000
Specific Speed, N5
Figure 46. Stratification of relation between plant sigma and specific speed for different manufacturers.
78
•
Figure 46 also presents a composite experience curve of the
relation between plant sigma, a, and specific speed, Ns, for all
manufactured bulb turbines for which turbine setting data were
obtained. The regression equation for this composite experience curve
is given by the following regression equation.
a = 7 625 10-5 N 1. 485 • X S Eq. ( 66)
The correlation coefficient for this regression is not very high and it
shows that such an experience curve is not expected to be very reli-
able. Using a regression relation suggested by Khanna and Bansal
(1979) a relation was developed between plant sigma, a, and unit dis
charge, Q. The regression equation developed for bulb turbines studied
on this project is:
a = 0. 5750 Q 1. 1937 11 Eq. (67)
Table 5 summarizes all the regression information on turbine
setting for manufactured bulb-type turbines that was obtained and gives
the respective correlation coefficients and the number of units used in
each regression relation that was developed. The information source or
manufacturer is also indicated in Table 5.
Tubular Turbines
Figure 47 presents the relation between plant sigma, a , and the
specific speed, N5 , for all manufactured tubular turbines studied.
The empirical equation for the relation between the plant sigma, a ,
and specific speed, Ns, for the manufactured tubular turbines is
indicated below:
a = 3.987 X l0-5N 1· 579 s Eq. {68)
79
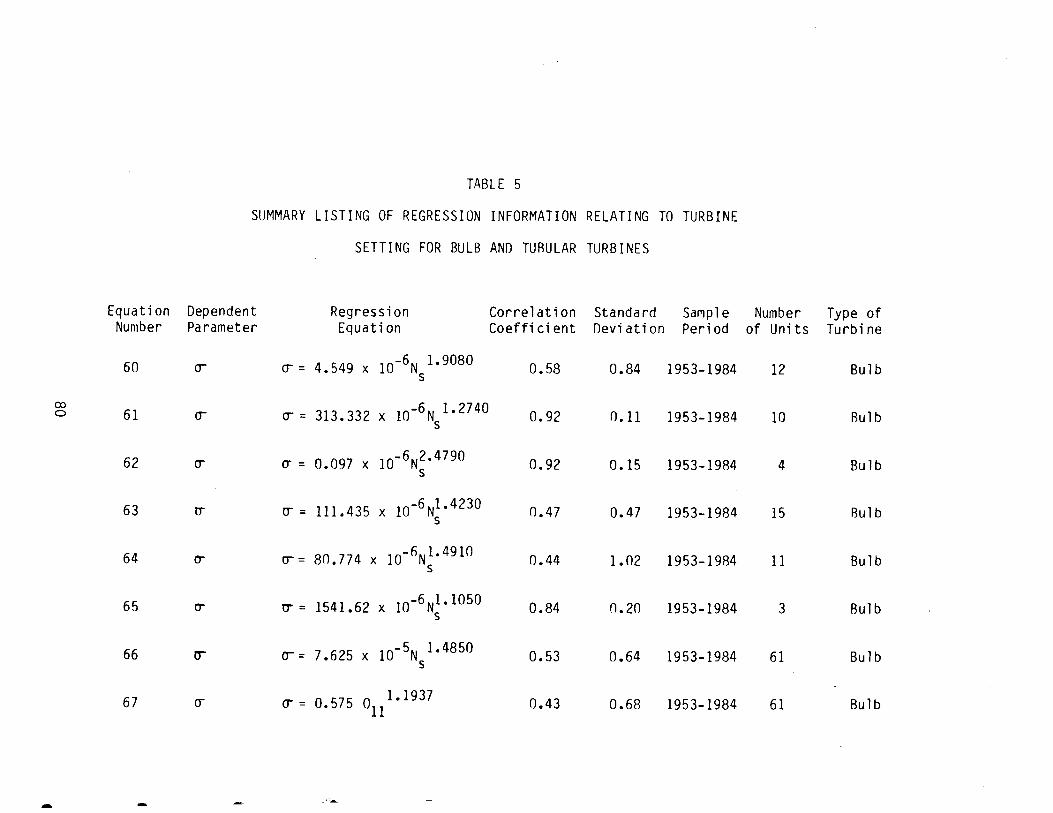
Equation Number
60
00 0 61
62
63
64
65
66
67
-
TABLE 5
SUMMARY LISTING OF REGRESSION INFORMATION RELATING TO TURBINE
SETTING FOR BULB ANO TUBULAR TURBINES
Dependent Regression Correlation Standard Sample Parameter Equation Coefficient Deviation Period
() ()= 4.549 X 10⁻⁶N 1•9080 o. 58 0.84 1953-1984 s
o- = 313.332 X 10⁻⁶N 1•2740 () 0.92 0.11 1953-1984 s
() ~ = 0.097 X 10- 6 N~" 4790 0.92 0.15 1953-1984
tT ~ = 111.435 X 10⁻⁶N1•4230 0.47 0.47 1953-1984 s
cr ~= 80.774 X 10-0N1"4910 0.44 1.02 1953-1984 s
cr ~ = 1541.62 X 10-6N1•1050 0.84 0.20 1953-1984 s
o- () = 7.625 X I0- 5N I. 4850 0.53 0.64 1953-1984 s
() () = o. 575 011 1.1937 0.43 0.68 1953-1984
•• l....._
Number Type of of Units Turbine
12 Bulb
10 Bulb
4 Bulb
15 Bulb
11 Bulb
3 Bulb
61 Bulb
61 Bulb
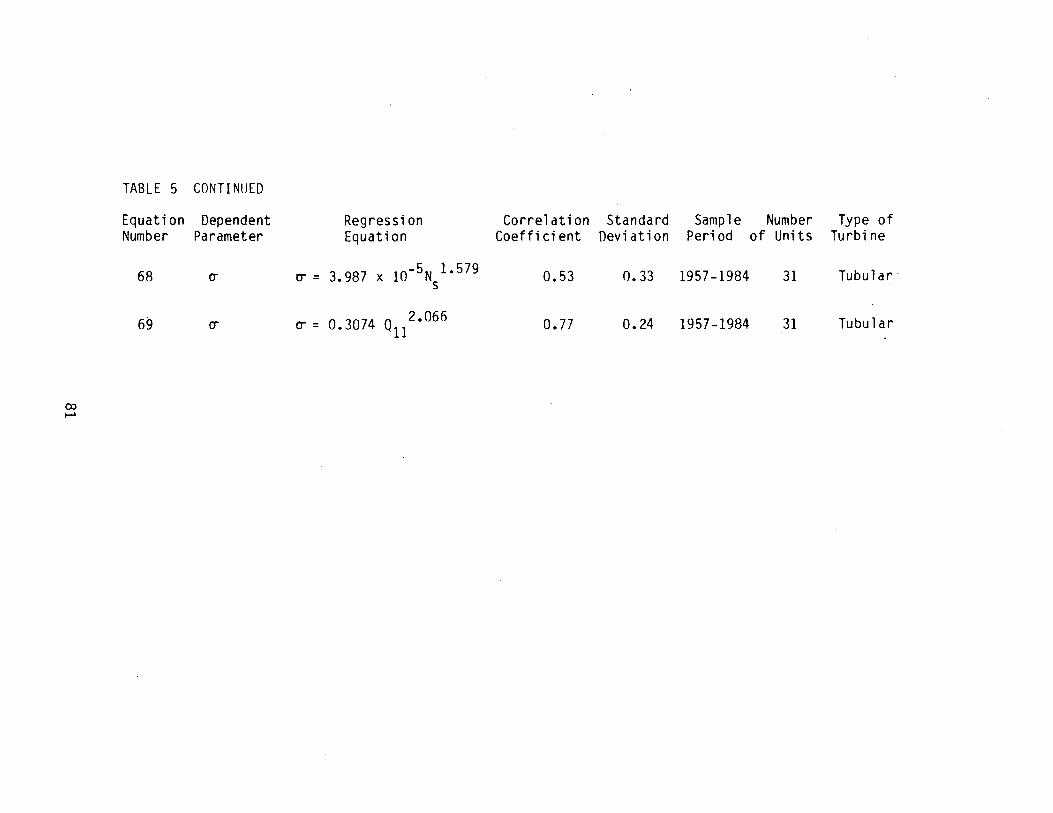
00 to-'
TABLE 5
Equation Number
68
69
CONTINUED
Dependent Parameter
cr
cr
Regression Equation
cr = 3.987 x 10⁻⁵N 1•579 s
o- = 0. 3074 Qll 2.066
Correlation Standard Sample Number Type of Coefficient Deviation Period of Units Turbine
0.53 0.33 1957-1984 31 Tubular·
o. 77 0. 24 1957-1984 31 Tubular
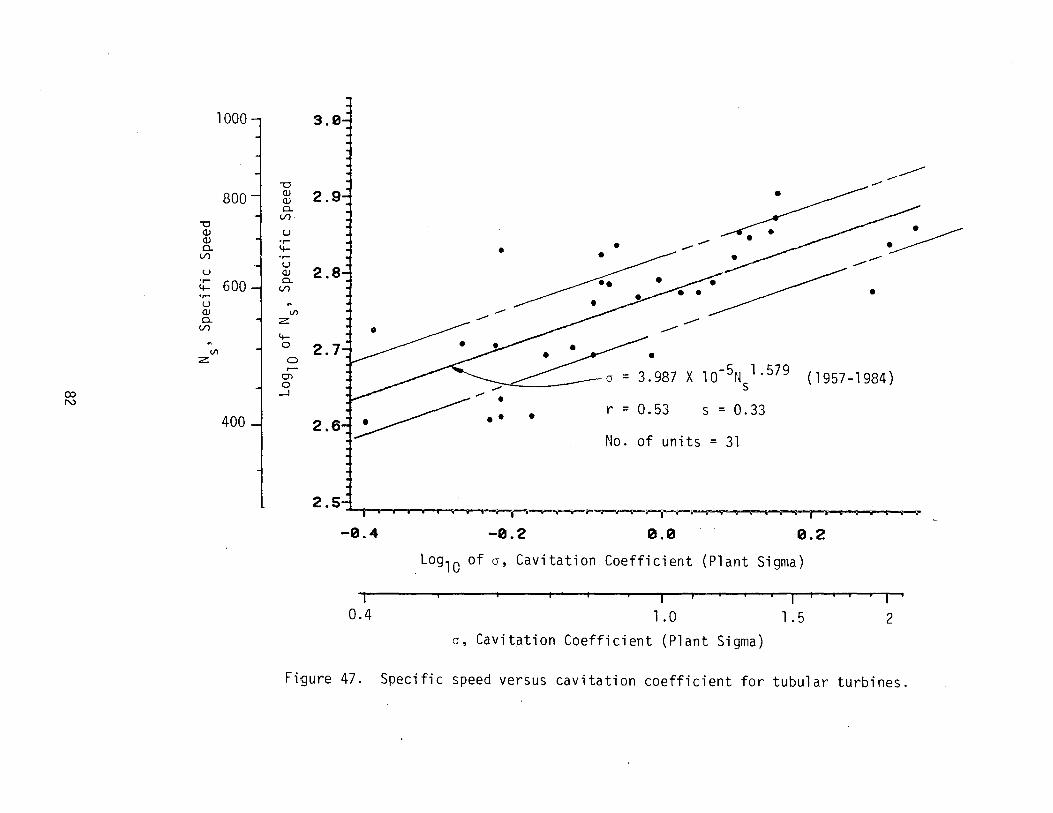
00 N
1000--, 3. 0
"'0 Q) Q) 0..
(/)
u
800
~ 600 .,..... u Q) 0.. (/)
Vl z
400
"'0 Q) Q) 0.. (/)
u .,..... 4-.,.....
2.9
u ~ 2.8
(/)
Vl z 4-0
0 r-
O'l 0
_J
2.7
2.6
-•
-----...-
• ~ • •
- ----.~. ·~ __:-:--__-a = 3~987 X l0-5N 1.579 s (1957-1984)
• r = 0.53 s = 0.33
No. of units = 31
2. 5 -'--..., I I I I ' • • .--.--.--.-....-.-i'"~--i~•-r ...... "I ....,.... I i""'"l I I ' I i I ' T
-0.4 -0.2 0.0 0.2
Log 10 of a, Cavitation Coefficient (Plant Sigma)
1 ~--..-----, ~ ,~
0.4 1.0 1.5 2
a, Cavitation Coefficient (Plant Sigma)
Figure 47. Specific speed versus cavitation coefficient for tubular turbines.
As for bulb turbines the correlation coefficient for this composite
regression for tubular turbines is not very high and it shows that such
an experience curve is not expected to be very reliable.
The relation between sigma, a, and unit discharge, Qn, for
tubular turbines is given by the regression equation:
a = 0.3074 Q112•066 Eq. ( 69)
The summary of regression information on turbine setting characteris-
tics for tubular turbines is presented along with regression informa-
tion on bulb turbines in Table 5.
WATER PASSAGE CHARACTERISTICS
The water passages of low-head turbines are quite different from
conventional Francis and vertical shaft Kaplan propeller turbines and
as such the dimensioning of the water passages is different for differ-
ent types. Significant in feasibility and preliminary design are the
entrance dimensions, the draft tube outlet dimensions or area, the
maximum diameter of the water passage surrounding the turbine, the
total length from entrance to draft tube outlet, and the length from
the centerline of the turbine to entrance. These data are useful in
layout design of the civil works and power house arrangement planning
as well as helpful in cost estimating. In this study it was possible
to obtain only enough different sets of data on manufactured bulb type
units to make regression analyses and develop experience curves.
In seeking the water passage information it was found that most
turbine manufacturers prefer to consider the various dimensions pro-
prietary information so that this phase of the research had to be
scaled to what could be collected under public disclosure allowances.
83
In the manufacturer contacts it was possible in several cases to
get recommended dimensions related back to a common turbine parameter
such as turbine runner diameter. This information has been grouped and
organized to be useful for design and also compared with different
manufacturers performance data to provide representative dimensions
that can be related to plant capacities.
During the study several companies provided standardized selection
information that gives considerable detail on different sized units.
These water passage dimensions have been analysed and comparisons
between different company's unit made and where possible regression
studies were conducted. In general there was insufficient information
on the possible standardized units to develop experience curves.
Following the earlier pattern the specific information on water passage
dimensions is presented systematically according to different turbine
types, beginning with bulb type turbines.
Bulb Turbines
To present the water passage information it is necessary to show
schematically the various water passage dimensions that were analysed.
Figure 48 shows a simplified dimensioning sketch with dimensions label
ed with letters that were used in the regression analyses and the com
parisons. All dimensions have been related back to the desi9n diameter
of the turbine runner as obtained from the manufacturer. Since the
rated power is frequently an estimated value that is obtained early in
the feasibility study, water passage dimensions were also related to
rated power, P, and in some cases relations were sought with the rated
discharge, Q. In certain cases like the entrance to the turbine and
the exit from the draft tube the dimensions actually represent areas.
84
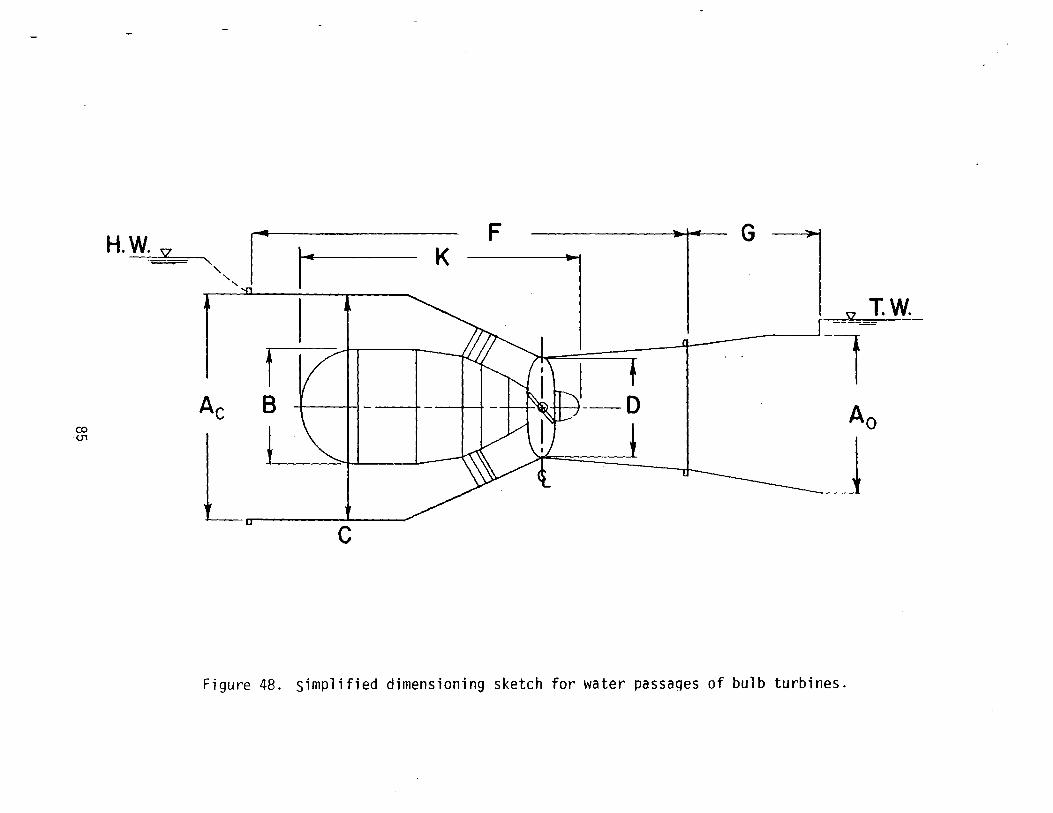
F G H.W. sz ~ ',,, r--~ K
T. w. --
' 1 __ 0 Ao ~c L\JI- I~ ~ co
J U'1
~ c
Figure 48. simplified dimensioning sketch for water passages of bulb turbines.
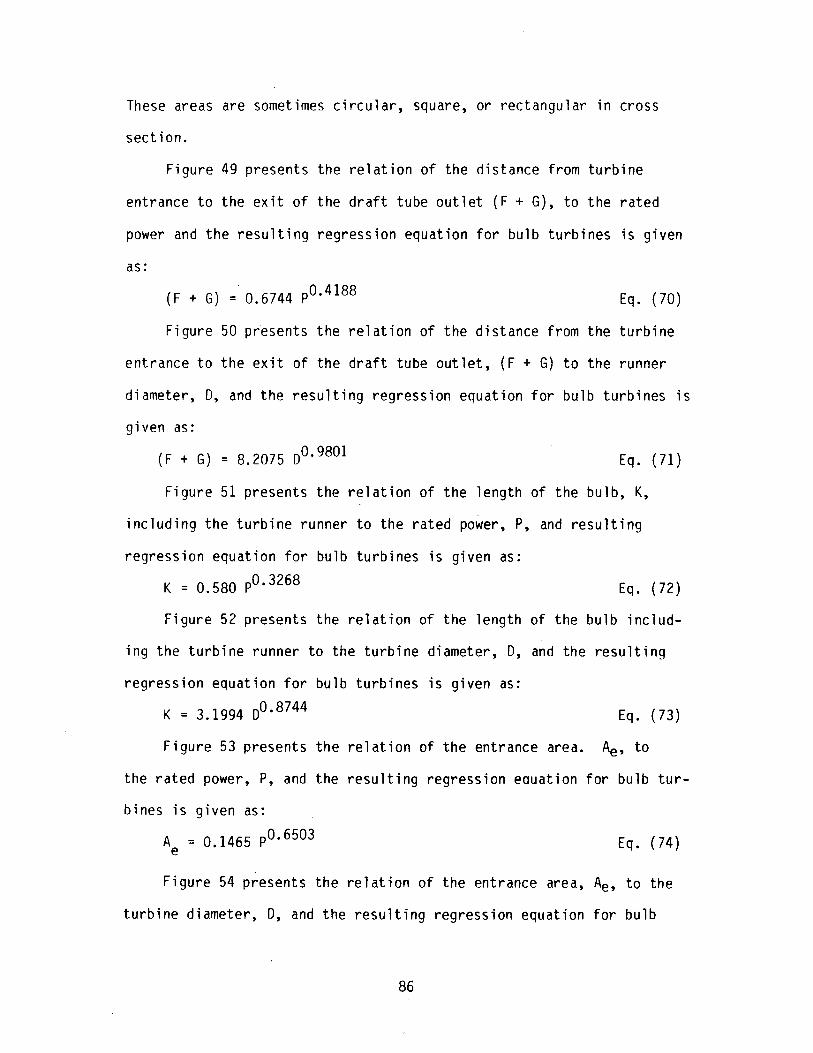
These areas are sometimes circular, square, or rectangular in cross
section.
Figure 49 presents the relation of the distance from turbine
entrance to the exit of the draft tube outlet (F + G), to the rated
power and the resulting regression equation for bulb turbines is given
as:
(F + G) = 0.6744 P0·4188 Eq. (70)
Figure 50 presents the relation of the distance from the turbine
entrance to the exit of the draft tube outlet, (F + G) to the runner
diameter, 0, and the resulting regression equation for bulb turbines is
given as:
(F + G) = 8.2075 o0· 9801 Eq. (71)
Figure 51 presents the relation of the length of the bulb, K,
including the turbine runner to the rated power, P, and resulting
regression equation for bulb turbines is given as:
K = 0.580 P0.3268 Eq. (72)
Figure 52 presents the relation of the length of the bulb includ-
ing the turbine runner to the turbine diameter, 0, and the resulting
regression equation for bulb turbines is given as:
K = 3.1994 o0·8744 Eq. (73)
Figure 53 presents the relation of the entrance area. Ae, to
the rated power, P, and the resulting regression equation for bulb tur-
bines is given as:
A = 0.1465 p0· 6503 e Eq. (74)
Figure 54 presents the relation of the entrance area, Ae, to the
turbine diameter, 0, and the resulting regression equation for bulb
86
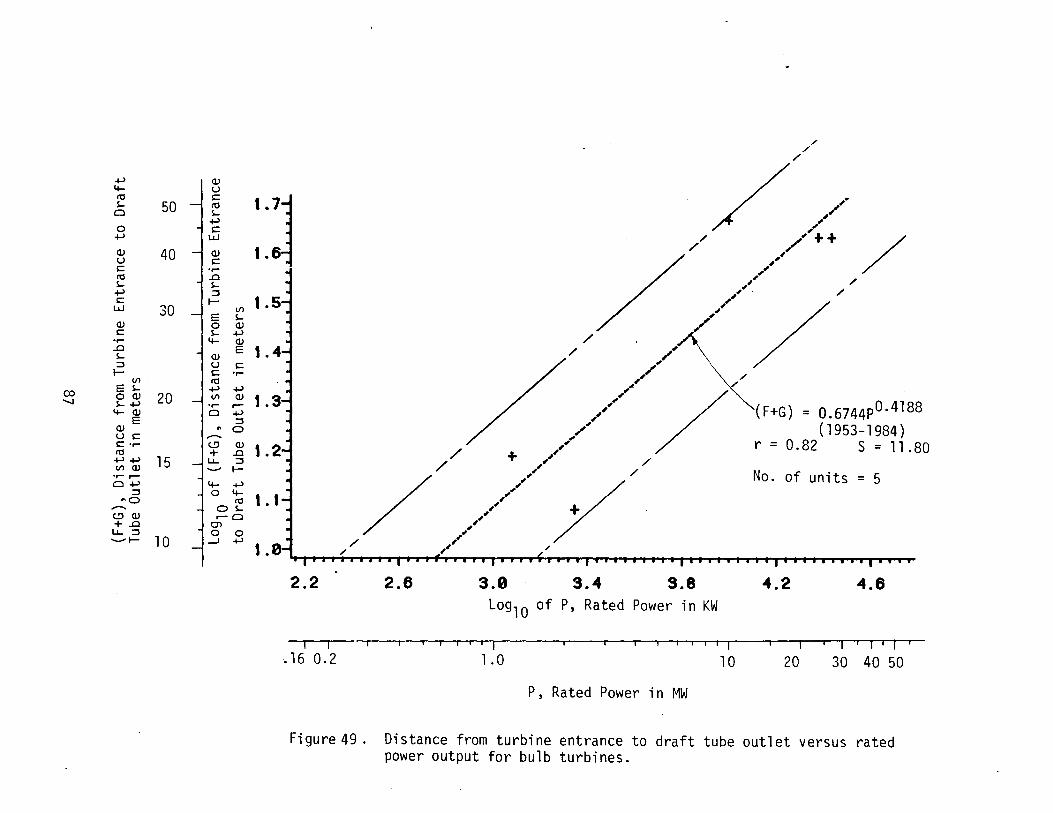
(X) '-1
+.l 4-~
~ 50 0
.f-)
Q) 40 u s:: ~ s... .f-)
~ 30 Q) s:: ......
..0 s... ::I 1-
Vl E s... e ~ 2o 4-CV
E Q) us:: S::•r~
t: t 15 ........... Cl .f-)
::I "0
c..!)Q) +..o LL. ::I ..__.I- 1 0
Q) u s:: ~ s... +.l s::
UJ
Q) s:: ......
..0 s... ::I 1-
Vl E s... 0 Q) s... .f-) 4- Q)
E Q)
u s:: s:: ...... ~
+.l .f-) Vl Q) ...... ..... Cl +.l
::I .. 0
(..!) Q)
+ ..0 LL. ::I
1-
4- +.l 0 4-
~ OS.. ..... Cl
01 0 0
.-1 .f-)
/ /
1.7i
Lei / / ,.
,/ / ,,'
/ ,,++ / ,, ,, ,,
1.1
2.2
/ /
,,
,,~ / ,, /
,.//\/' // ,,' // ,, ,, + // r = 0 ( 1953-1984)
,/ • 82 s = 11. 80 /
/ ,, ,, ,, No. of units = 5 // ,.,
,, ,, ,, ;/
,
2.6 3.9 3.4 3.8 4.2 4.6 Log10 of P, Rated Power in KW
~~--~-r-.-.,ro.------,--,-,-,,.-,.,,---~~-.~-.1'1~
.16 0.2 1.0 10 20 30 40 50
P, Rated Power in MW
Figure 49. Distance from turbine entrance to draft tube outlet versus rated power output for bulb turbines.
0 .._, .._,
50 ~ QJ u
ro c s... ro Cl s... .._, 0 40 .._, c
LJ.J
QJ QJ u c c ...... ro .0 s... 30 .._, s...
:::::! c
l.J..J 1-
QJ E 0
c s... ...... ~ .0 s... QJ :::::! u
1- 20 lll E s...
c ro .._,
QQ.) lll s,....._, ...... ~QJ
E Cl
QJ . uc ......... C•r- L!J ro .._, .._, +
l.J...
CX> l/lQJ ...... .--CX> Cl .._,
.........
~ :::::!
~a 0
.--.. L!JQ.) +.O 10 l.J...:J
........ I-
1.7
c
~ 1.1 :::::!
1-
-0.4 -0.2
~/ / / /
;// ,,'' //
, ,'
,' .... , /
// ,,"'Z_ , r = 0 ( 1965-1982)
.95 s = ..., ~;/// (F+G) = 8.2075D0.980l
+ / / / 3.o7
A/// / No. of units = 4
,' ,' , /+
,/ / ,,
/ ,'
0.0 0.2 0.4 0.6 0.8 Log 10 of D, Turbine Diameter in meters
I I
0.4 0.5 1 .o 2.0 3 4 5 6 7
D, Turbine Diameter in meters
Figure 50. Distance from turbine entrance to draft tube outlet versus turbine diameter for bulb turbines.
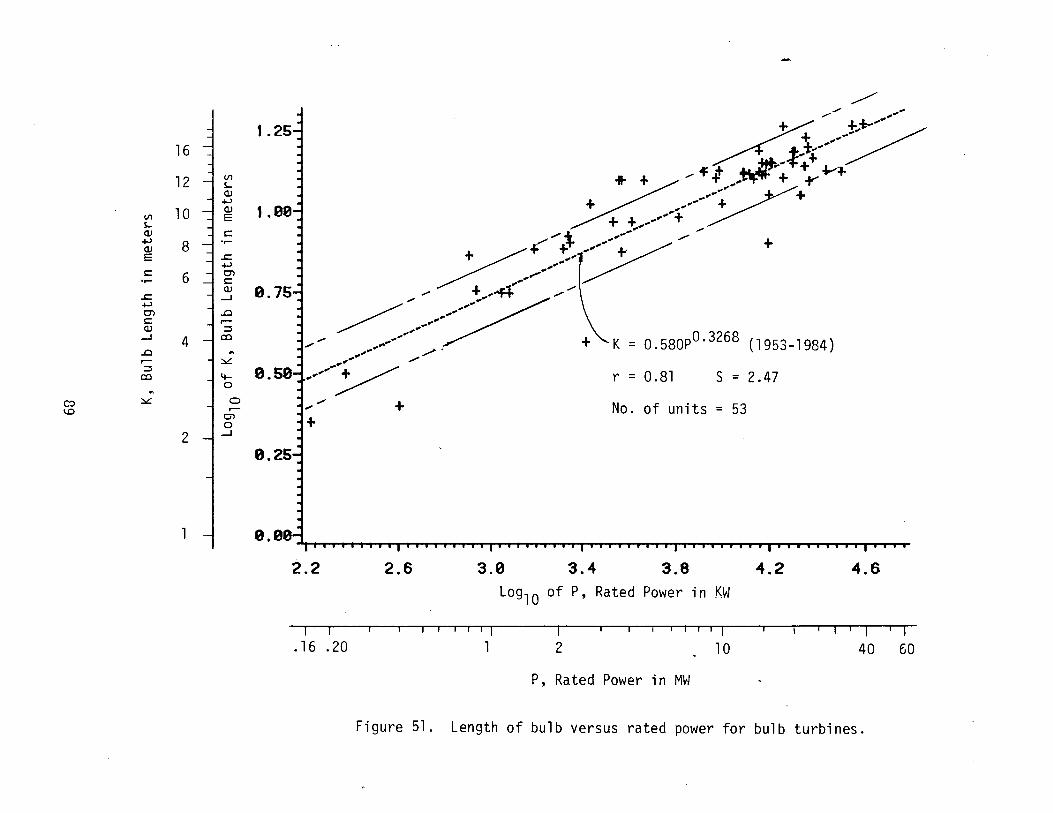
~ .. - .... ~/~ 1 .251 ~ fi-:: 16 J /·y/-
" ...... 12 -1
,, + + ...... , .... + .... 10
1 00 ;%. --- / + . .... .. Vl
~~):J/ s.. Q) +l 8 Q)
E
c 6 - + .,,'"f+ .....
.,...
0.75 / --;/ ~
;= ~-------- + '-.. K = O. 580po. 3268 ( 1953.1984)
+l 01 c
::li , ., .. Q)
"' / ----- /_.-· =081 5=2.47
_J 4
~ ,.. r . ..0
~ .... ~ ,...... ::::::1
':; 0.50 --- No. of units = 53
co ~
0 ..... + ~ .... ,...... c:> 01 +
1.0
0
2 -I_J 0.25
0.00d ~j-rl,irTI-i~i-ri,irTI-ri,jrTI~irTI-ri,irTI~irTI-ri,jrTI~irTI-ri,i-ri,irTI-i~j-ri~irTI-ri,irTI~irTI-ri~j~i-rl,lrTI~i~i-rl~lrTI-rj~irTI-rl-1~1-rl~l~l-rl~j~l-rl-1~1~
2.2 2.6 3.0 3.4 3.8 4.2 4.6 Log10 of P, Rated Power in KW
~-,--T
. 16 . 20 1 2 1 0 40 60
P, Rated Power in MW
Figure 51. Length of bulb versus rated power for bulb turbines.
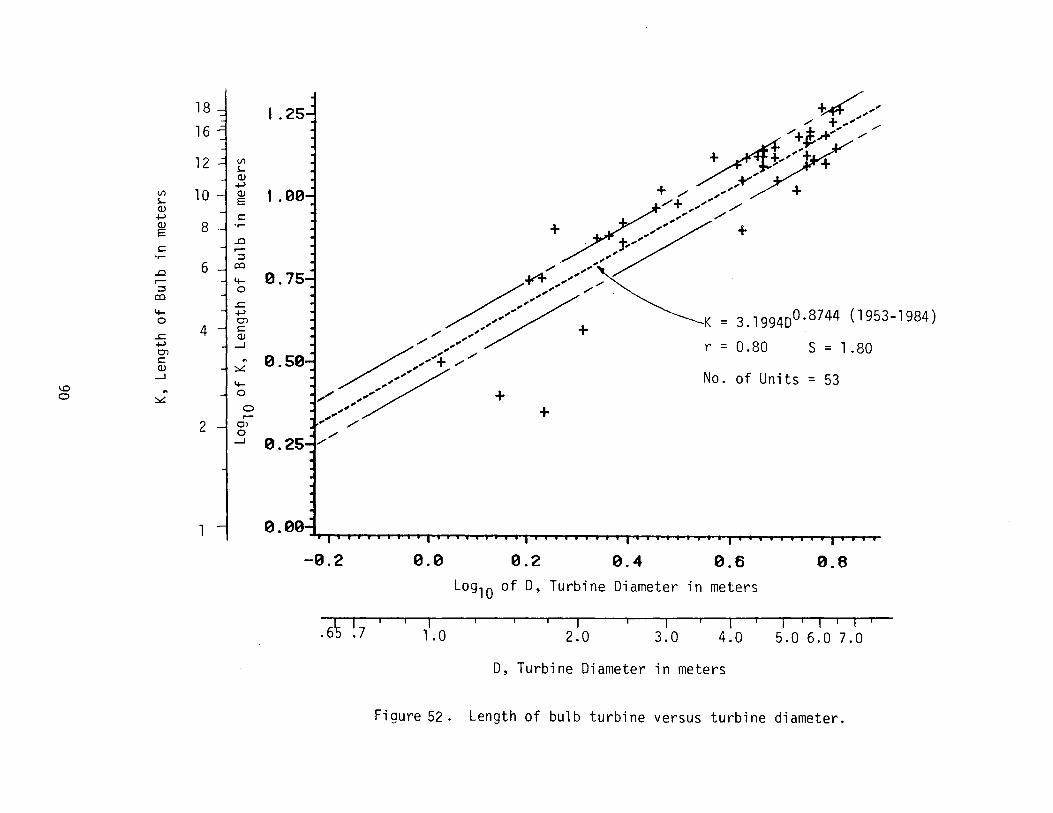
18 :1 1.25 16
12 -=1 r Cli
+.J
t. ee 1 + Vl 10 Cli l- E Cli
+.J I:: Cli 8 .,.... -i + . ../ ... - / + E
_ ... .0
I:: .-.,.... :::::s
6 co .0 0.75 .- 4-
:::::s 0 co
..s::
~ // ~K = 3. 199400.8744 (1953-1984) 4- +.J 0 C"l
4 I:: + ..s:: Cli / .... +.J _J / .... r = 0.80 s = 1 .80 01 / _.... -I:: .. 0.50 Cli ~
_J
~// No. of Units = 53 4-1.0 .. 0 + 0 ~ / ,,'
0 ...... + .- _ ..... 2 ~ Ol
0 _J 0.25
1
-0.2 0.0 0.2 0.4 0.6 0.8 Log 10 of D, Turbine Diameter in meters
~· I -, ,- 1- ---. - -, ------~ --.-- T--- ,---, ---.-,---.--1' .6 .7 1.0 2.0 3.0 4.0 5.0 6.0 7.0
D, Turbine Diameter in meters
Figure 52. Length of bulb turbine versus turbine diameter.
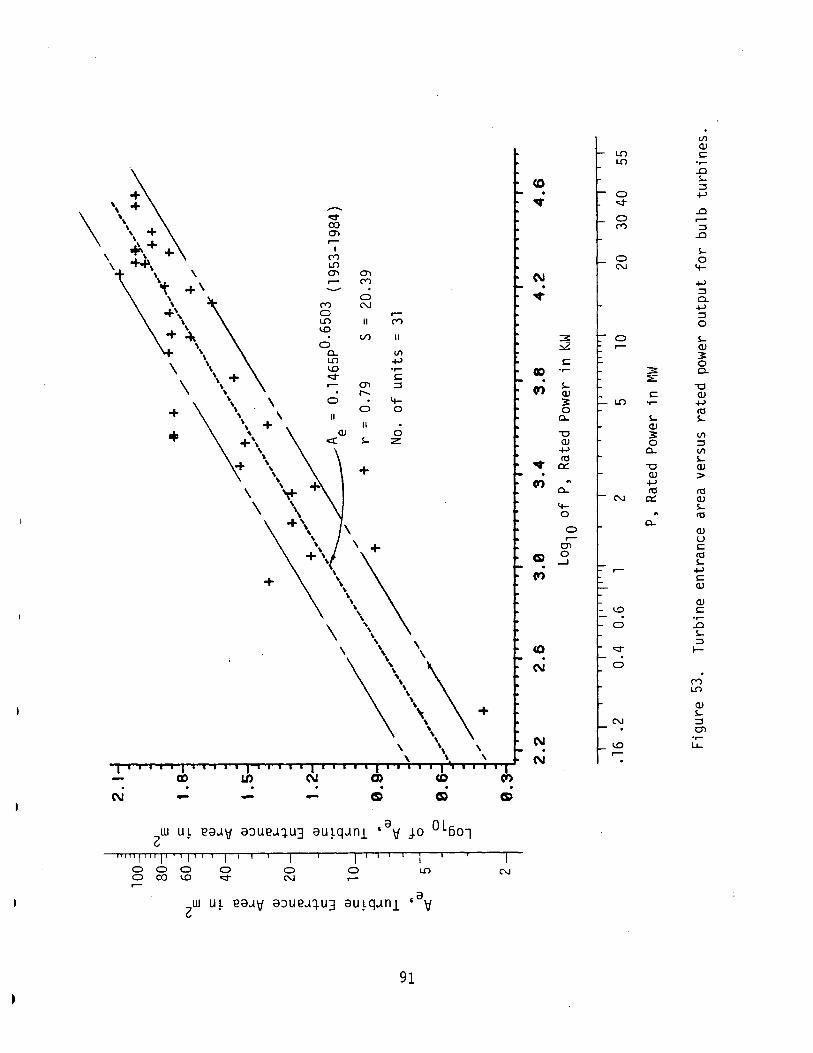
Vl Q)
l.(') 1:: l.(')
..0
co s... ::1
+ 0 +-' \ + ~ '<.T
\ ,-... ..0
\ \ o:::T 0 .-\ 00 (V') ::1 \ + 0"1 ..0 \
\ .-~+ + I s...
\ \ (V') 0 0 \ +.P, l.(') N '+-
\ \ 0"1 0"1 (\1 't .- (V') +-' +'
~ ::1
\ 0 0. \ (V') N +-' +\ 0 .- ::1
\ l.(') II (V') 0 \ ~
-k V) II 3 0 s... \ 0 :::.2 .- Q)
a... Vl 3 \ l.(') -+-' 1:: 0 \ \ \ ~ ..... CIO 3 0. \ o:::T 1:: . ::£: \
\ 0"1 ::1 s... -o \
~ \ ,...... Q) 1:: Q) \ \ 0 '+- 3 l.(') •r- +-'
\ 0 0 0 ItS + \ II a... s... s... \ + II Q)
+ ' 0 -o 3 Vl +\ s... z: Q) 0 ::1
\ -+-' a... Vl
~ ItS s...
+ \ + 0:::: -o Q) \ Q) > \
~ +-' \ a... ItS ItS \ ~ N 0:::: Q)
\ \ '+- s... 0 ItS
+\ a... 0 Q) \ .- u \
\ \ + en 1:: +\ (5) 0 ItS
\ ....J s... . .- +-' \ ~ 1:: + \
\ Q) \ \
Q) \ \ 1:: \
' •r-
\ \ 0 ..0
\ s... \ ::1 \ \ \ \ co o:::T 1-
\\<\+ (\1 0
(V') l.(')
Q) s...
N ::1 O'l
\ (\1 ~ LJ...
\ \ ' .-\ \ ' (\1
CIO 1J) (\1 0) . N - - (5) C5i)
w UL ea;. 'rJ a:> u e;. + u3 au~q.J.nl 'a'r.f .J.O 0 L5ol 6
Iiiii 11 II I' I I I I I I I I I I I I
0 0 0 0 0 0 l.(') N 0 CX) ~ o:::T N .-.-
6w u~ ea.J.\:.f a:>UT!J.lU] au~q.J.nl ,a\:.f
91
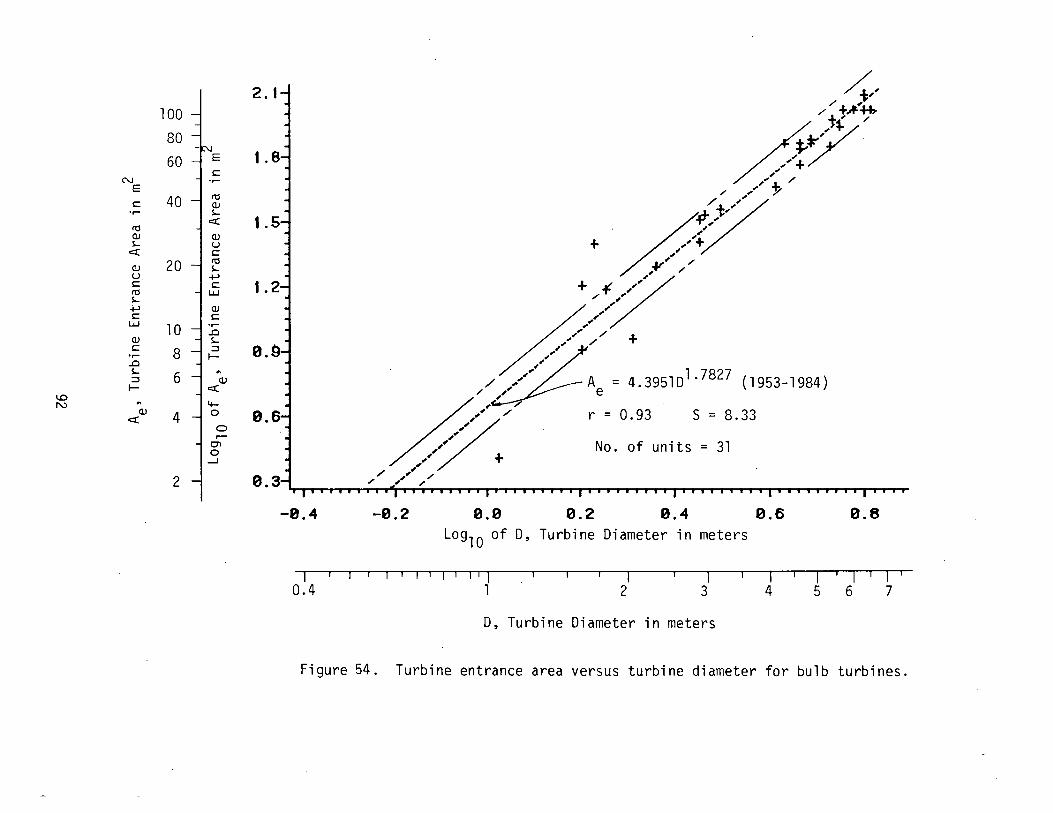
N E
s::: •r-
ttl ClJ s...
c::!
ClJ u s::: ttl s... 4-> s::: w
ClJ s:::
•r-..0 s... ;:::, I-
0..0 N
c::!(l)
100 80
60
40
20
10
8
6
4
2
2. I
-0.4
/ ,.
,' / ,,, , ,"' ,,
~,,'~ , , ,
,, , ,,' + ,, , ,.
-0.2 0.0
/~, / + .... ' ·~ t~~
*'t-,
+ ,,
,,+ ,,
(/
/ ,,,,,y/
~ , , ,,+ ,'
+ ¥/'',,¥ , , / ,, ,, ,, ,,
,, ,, /
,,,, / +
A = 4.3951D1· 7827 (1953-1984) e
r = 0.93 s = 8.33
No. of units = 31
0.2 0.4 0.6 0.8 Log10 of D, Turbine Diameter in meters
~~~~~~~~~----~~--~~--~--~~~--~~~----1
0.4 1 2 3 4 5 6 7
D, Turbine Diameter in meters
Figure 54. Turbine entrance area versus turbine diameter for bulb turbines.
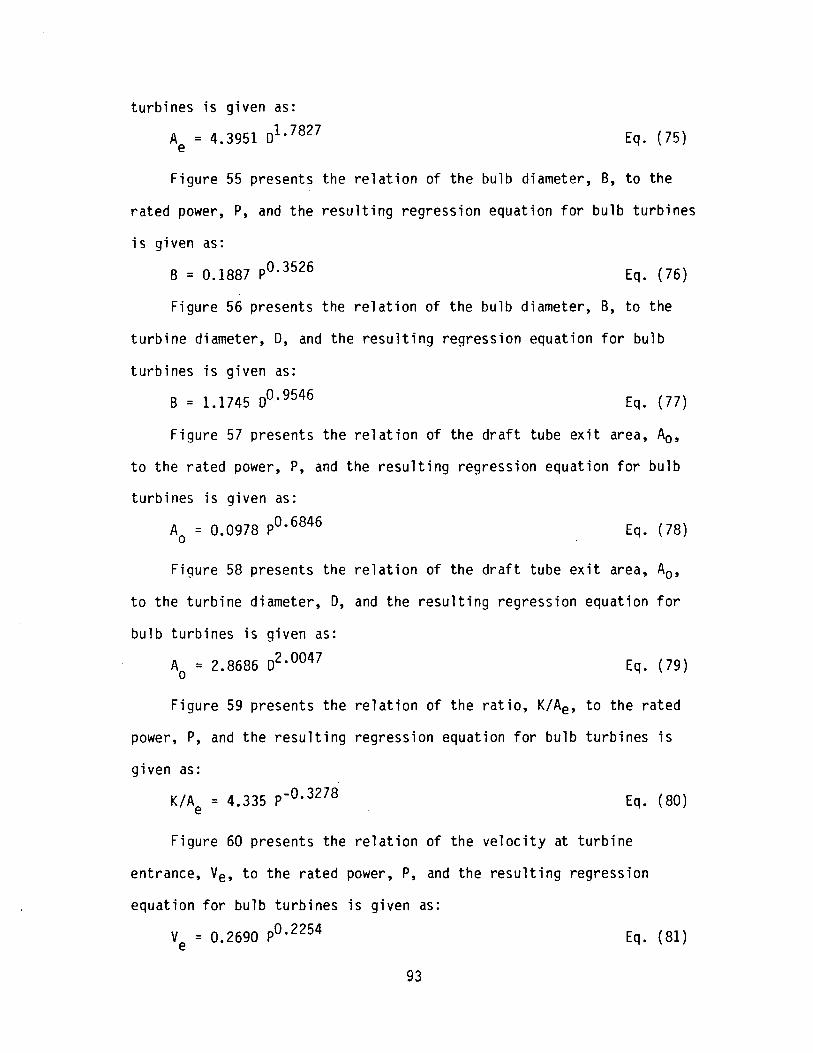
turbines is given as:
A = 4 3951 o1· 7827 e . Eq. (75)
Figure 55 presents the relation of the bulb diameter, B, to the
rated power, P, and the resulting regression equation for bulb turbines
is given as:
B = 0.1887 P0· 3526 Eq. (76)
Figure 56 presents the relation of the bulb diameter, B, to the
turbine diameter, 0, and the resulting regression equation for bulb
turbines is given as:
B = 1.1745 o0· 9546 Eq. (77)
Figure 57 presents the relation of the draft tube exit area, A0 ,
to the rated power, P, and the resulting regression equation for bulb
turbines is given as:
A0
= 0.0978 P0•6846 Eq. (78)
Figure 58 presents the relation of the draft tube exit area, A0 ,
to the turbine diameter, 0, and the resulting regression equation for
bulb turbines is given as:
A = 2 8686 o2·0047 0 • Eq. (79)
Figure 59 presents the relation of the ratio, K/Ae, to the rated
power, P, and the resulting regression equation for bulb turbines is
given as:
K/Ae = 4.335 p-0.3278 Eq. {80)
Figure 60 presents the relation of the velocity at turbine
entrance, Ve, to the rated power, P, and the resulting regression
equation for bulb turbines is given as:
v = 0 2690 p0.2254 e . Eq. {81)
93
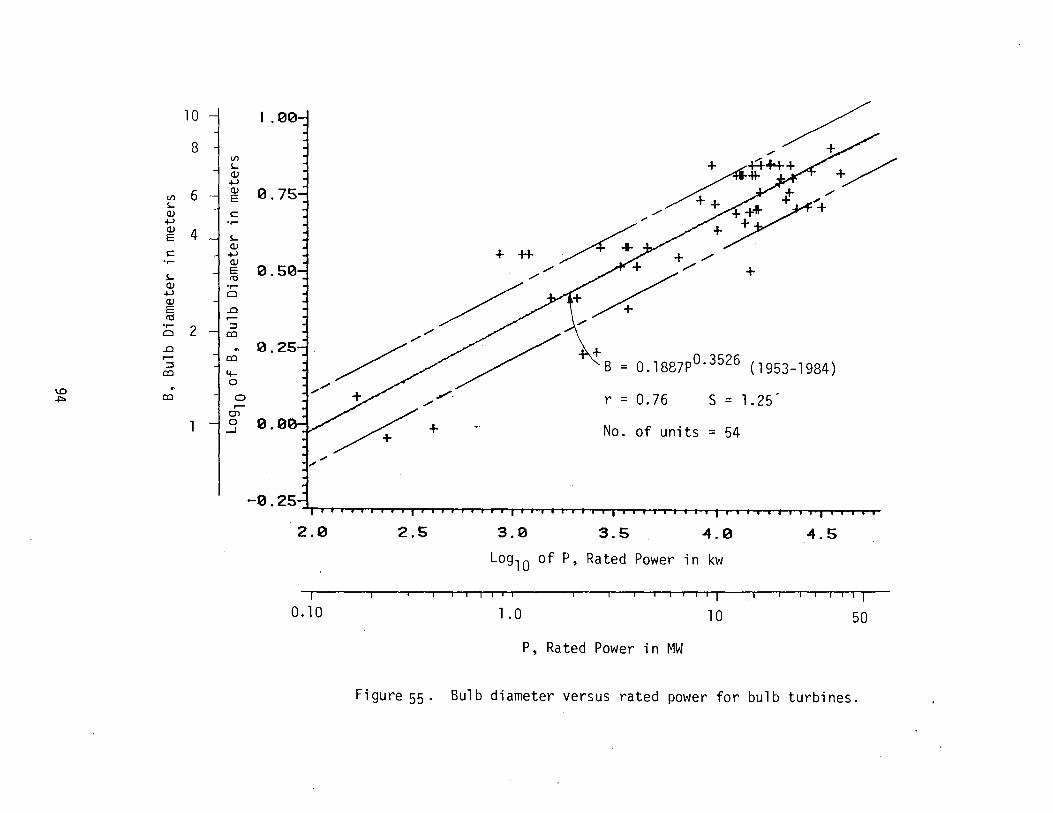
10 1 I .00
8 V'l s... (1)
+> 6 (1)
V'l E s... (1) c: +> ..... (1)
4 E s... (1)
~ + ++-c: +-> ..... (1)
s... E co + (1) .....
+> Cl (1)
E .0 co ..... .... 2 :::::l
Cl OJ
.0 .. ..... OJ :::::l
OJ 4-
+ B = 0.1887P0·3526 (1953-1984)
0 \D ..
0.0~/: ..j:::> OJ - 0 .....
Ol 0
..-l
r = 0.76 s = 1.25'
No. of units = 54
2.~ 2.5 3.0 3.5 4.~ 4.5
Log 10 of P, Rated Power in kw
I-~---,---------,---- -----,- -~-.-----~ ,---, ---,-,--,-, l
0. 1 0 1 . 0 1 0 50
P, Rated Power in MW
Figure 55. Bulb diameter versus rated power for bulb turbines.
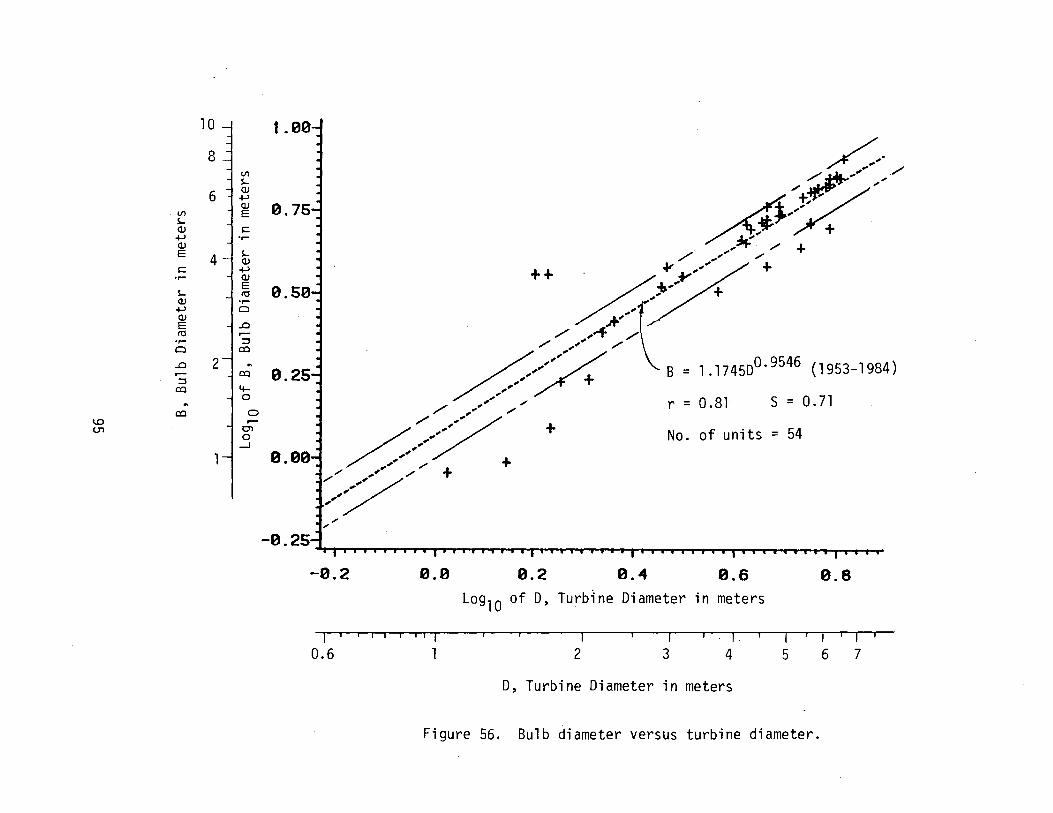
(/)
s... Q)
+-' Q)
E
s::: .,... s... Q)
+-' Q)
E ttl .,... Cl
..0
...-::I co
.. co
~ (.]'1
10
8
6
4
2
(/)
s... Q)
+-' Q)
E
s::: .,...
s... Q)
+-' Q)
E ttl .,... Cl
..0
...-::I co
.. co 4-0
0 ...-
C'l 0 _J
1.00
0.75
0.00
/. .. · .Aj)r+_;>/
~~~/+ ,""'t"· /
+ + ' ..., / ,,..... / +
d +-'"' ./ +
~, .. ..+ t"' /+ /.//__..-+ ///
/ ......;:.---:Y- B = 1.174500.9546 (1953-1984)
/ ,..... / -+
/ _____ ,,-· / r - 0.81 S = 0. 71
// .......... // // .... / + +
No. of units = 54
.... .... ....
--" • ~!) :.~.~~~·~•~•~•~•~•~•~•~•-,1-y;-y;-r•~•~•~•~•~•~•~•~•~•~•~•~•-y•~•~•~•-r•-r•-r;-r;-;r-;r-;r-;r-;r-;r-;~;r-;r-;r-;r-r;-r;-;r-;r-;r-;~;r-ar-ra~c -0.2 0.0 0.2 9.4 0.6 9.8
Log10 of D, Turb1ne Diameter in meters
,--1 ·-r
0.6 1 2 3 4 5 6 7
D, Turbine Diameter in meters
Figure 56. Bulb diameter versus turbine diameter.
100 C'J
80- E
C'J s:: E .,.... s:: 60- tO .,.... Q)
s-tO 40 Q)
<:(
s- +J c:x:: .,....
X +J L.L.J .,.... X Q)
w 20 ..0
::::::1 Q) t-
..0 ::::::1 +J t- 4-
tO ;....> s-4-
10 tO s-
Cl
~
Cl
~
0 0. c:x::
0 \.0 c:x:: 0\ 4-0
5 0 ....-
Ol 0
_J
2-
/ /
/
+ ~--~ ,·
+ ,.,~~ / , .. +.... t, .. + /
+ + / + _..,-·+++
/
+ ~~+ + ......
,, .,.,
,~ ,,
.,.," /
.,"/++ / + . + ,.," +
/
/ + ,~'' + .,.,"' .....+ + + ,., /
~,/' + .," + / ,, ,, / ++,,,:V' + A = 0.0978P0 · 6846 (1953-1984)
, / 0
r = 0.71 s = 33.49 ""/.,.,.,' / ,, ,,,'"' +
No. of units = 53 ...... ,.,' + .y..... + ,, / .-¥--/ >"
2.2 2.6 3.0 3.4 3.8 .4.2 4.6
Log10 of P, Rated power in kw
r---r----r------r----r--,---.--r-r....----.------r--r---r--r- ,- .--.--,- T .. T I
.16 0.2 1.0 10 40
P, Rated Power in MW
Figure 57. Draft tube exit area versus rated power for bulb turbine.
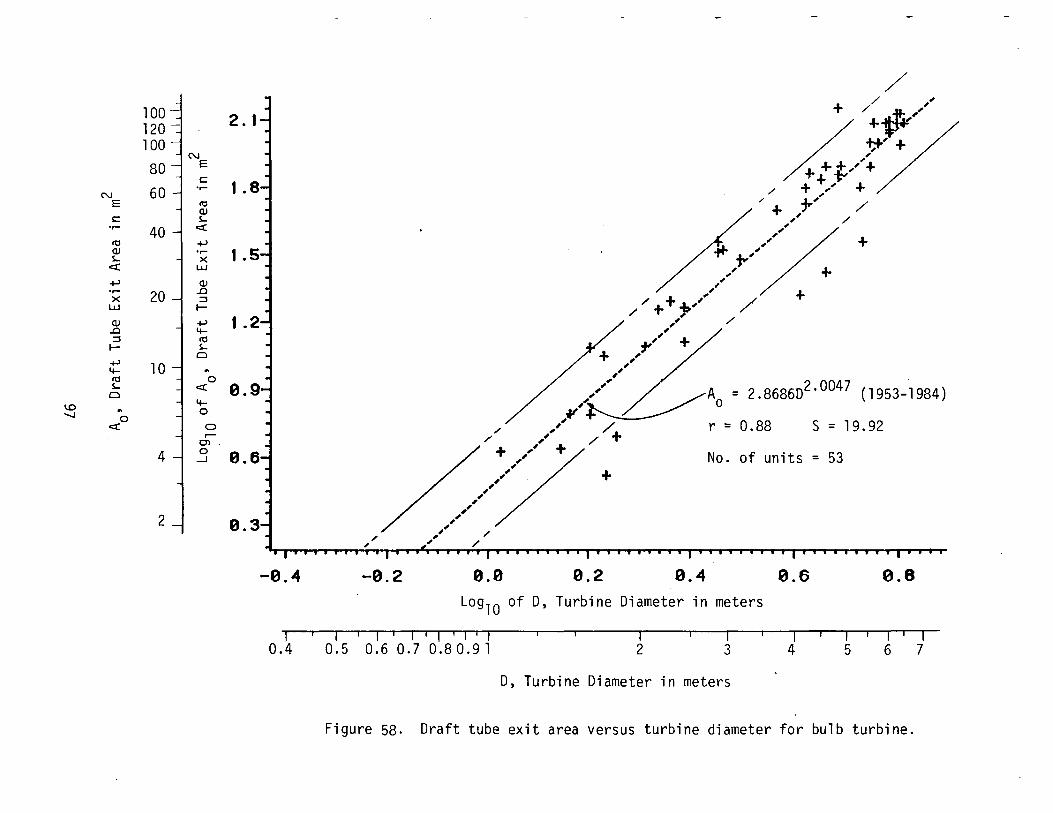
100-120 _j 2. I 100
N E s::
•r-N
E ro Q)
s:: s.. •r- c(
ro -+J Q) •r-s.. X c( LLJ
+-' Q) •r-X 20 .D
::I LLJ t-Q) +-' .D 4-::I ro t- s..
Cl +-' 4- 10 .. ro 0 s.. c(
Cl
\.0 -.....J
.. 4-
c(o
0
0 r-
C'l
4--l 0 _J
2
-0.4
, ,
-0.2
,' ,, ,,
,,
,
/ + //
k +tf¥'/ ++' + ~,~y
/ + + , .. -/ " + + 7/ / /
~ ~,,' + ,' ,' +
. /.,'' / / ,' / ++~/ + ,' /
,' ,,
,,' /
1'' +
,,'' / , _,¥~Ao = 2.868602.0047 ./+ ,,''_ //+ - (1953-1984)
/ r - 0.88 s = 19.92
,, ,' ,' ,'
0.0
+
0.2
No. of units = 53
0.4 0.6 0.8 Log10 of D, Turbine Diameter in meters
I I 0.4 0.5 0.6 0.7 0.8 0.9 1 2 3 4 5 6 7
D, Turbine Diameter in meters
Figure 58. Draft tube exit area versus turbine diameter for bulb turbine.
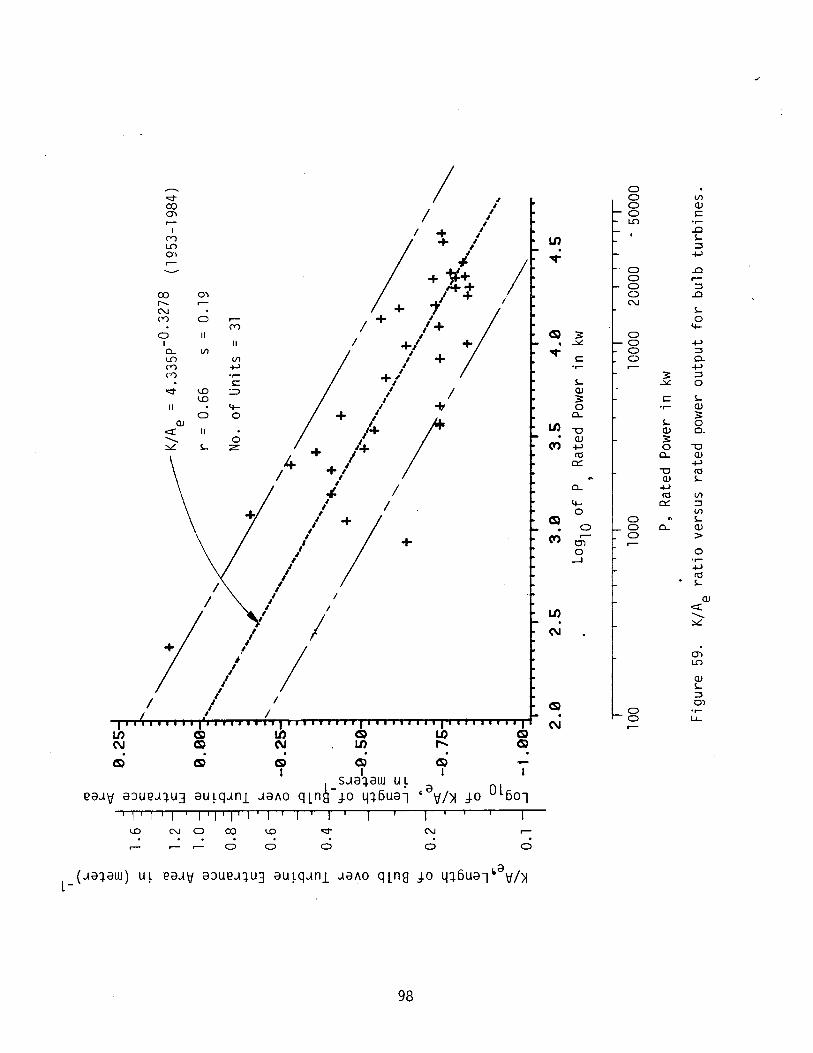
1J) N
I
co ........ N (V)
0 I 0... L() (V) ('')
o:::t
II
0
II
(/)
0
II
II
.,....
4-0
0 z:
+.
/ I
·' I
//
,ll
I , I
I l I / + I
/. ....... ?' I ,'*:t
/ .. i·: I +,'
I I
I
+ / I
/+ l!t.-
1 +l
I I
.j.
I ...,
I /
I I ,
/ /
l/ , /
I
/ 1J) N
~ I
I I
I
I
~ 1J)
(S)
+
I sJa:).aw u~
1J) ,.... (S) I I
ea;v aJueJ1U3 au~qJnl JaAo qln~-j.O 4+6ua1 ,aV/>l j.O OL6ol I I I I I I I I I I I' I I I I I
1.0 NO CO 1.0 o:::t . . 0 0 0
N
0 0
98
.,.... SQ)
3: 0
0...
1J) -o (/') 2
IJ)
(\1
(S) . N
10 a::
0...
4-0
0 r-
Ol 0 --'
0 0 0 0 L()
0 0 0 0 N
0 0 0 0
0 0 0
0 0 .--
.,.... SQ)
3: 0
0...
-o Q) +J 10 a::
0...
(/)
Q) s:: .,....
..0 S:::s +l
..0 r-:::s
..0
So 4-
+-l :::s 0.. +l :::s 0
SQ) :;;: 0 c. -o Q) +l 10 S-
(/)
:::s (/)
SQ)
> 0
+l 10
• S-
Q)
c:l: -:::.::: (J) L()
Q) S:::s 0)
LL...
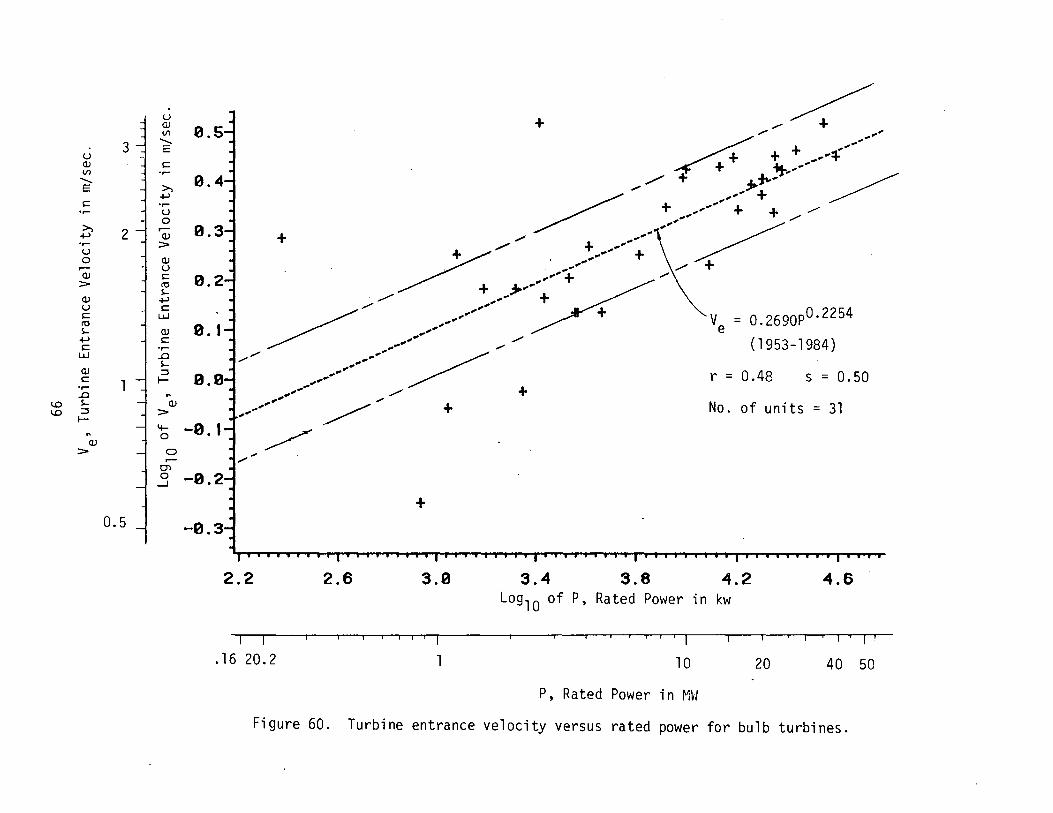
u Cll Vl
........ E 3
u Cll s:: Vl .,....
........ E >,
+-> s:: .,.... .,.... u
0
~ ,..... Cll 2 .,.... > u
0 Cll ,..... -· u Cll s:: > ttl
s... Cll +-> u s:: s:: LJ..J ttl s... Cll
+-> s:: s:: .,....
LJ..J ..Cl s...
Cll :::l s:: f-.,....
..Cl .. 1.0 s... Cll 1.0 :::l
f-> '+-.. 0
Cll > 0
0.5
0.5
0.4
0. I
-0. I , ....
2.2
~-..... .. .. /' .,..-'
~ + + ...... --~ it.--.. ~
+
~ .... ~ / + , .. ;§.+ "" .... _,.....
~----- ;:.--~--.... + ...... + \ + / ..... _,.....
~ ........ ~ ... ~----+
?' ,... + ....
~----- --------- --..... .,., ....... --~ ......
......... ,............ + ,.. ./ ,, , + ,.... _,......... ,.. ~
~
+
2.6 3.0 3.4 3.8
Ve = 0.2690P0.2254
(1953-1984)
r = 0.48 s = 0.50
No. of units = 31
4.2 4.6 Log 10 of P, Rated Power in kw
-r---r---....------,.----,----,--,-.,...-,-----,----,--.----r---r- ,.--,-, -.--,--"
.16 20.2 1 10 20 40 50
P, Rated Power in MW
Figure 60. Turbine entrance velocity versus rated power for bulb turbines.
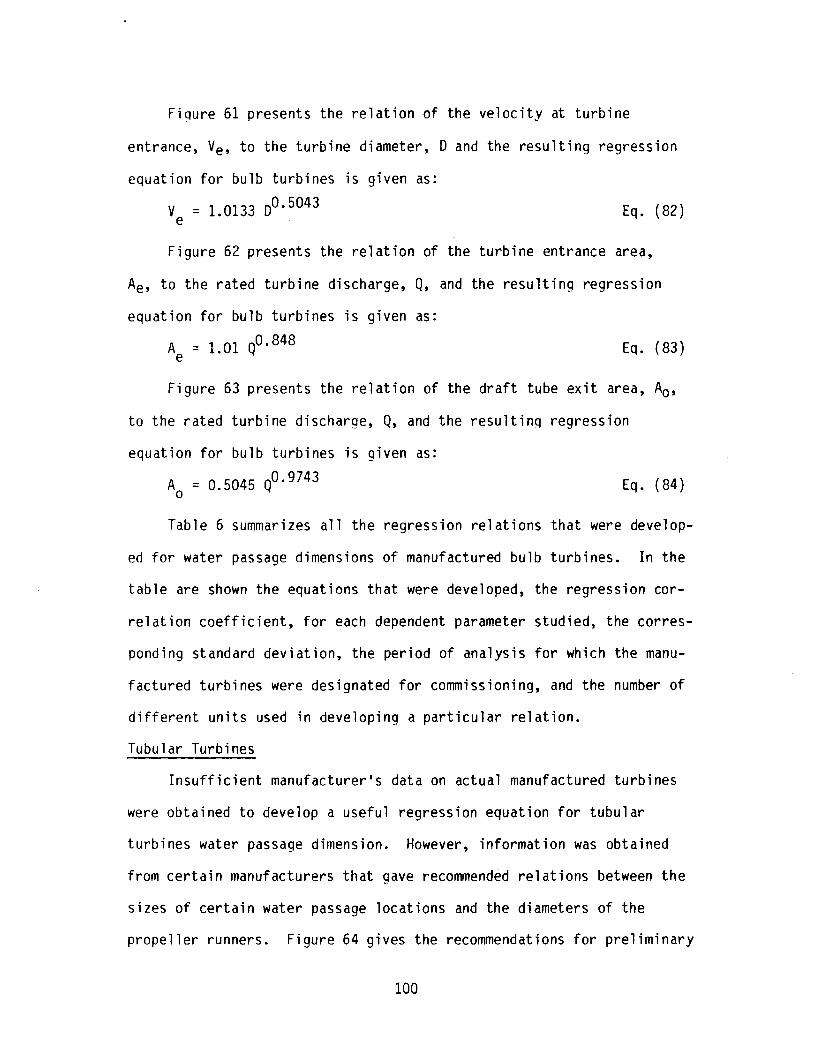
Fiqure 61 presents the relation of the velocity at turbine
entrance, Ve, to the turbine diameter, D and the resulting regression
equation for bulb turbines is given as:
ve = 1.0133 o0· 5043 Eq. (82)
Figure 62 presents the relation of the turbine entrance area,
Ae, to the rated turbine discharge, Q, and the resulting regression
equation for bulb turbines is given as:
A = 1 01 Q0.848 e . Eq. (83)
Figure 63 presents the relation of the draft tube exit area, A0 ,
to the rated turbine discharge, Q, and the resulting regression
equation for bulb turbines is given as:
A = 0 5045 q0· 9743 0 . Eq. (84)
Table 6 summarizes all the regression relations that were develop-
ed for water passage dimensions of manufactured bulb turbines. In the
table are shown the equations that were developed, the regression cor-
relation coefficient, for each dependent parameter studied, the corres-
ponding standard deviation, the period of analysis for which the manu
factured turbines were designated for commissioning, and the number of
different units used in developing a particular relation.
Tubular Turbines
Insufficient manufacturer•s data on actual manufactured turbines
were obtained to develop a useful regression equation for tubular
turbines water passage dimension. However, information was obtained
from certain manufacturers that gave recommended relations between the
sizes of certain water passage locations and the diameters of the
propeller runners. Figure 64 gives the recommendations for preliminary
100
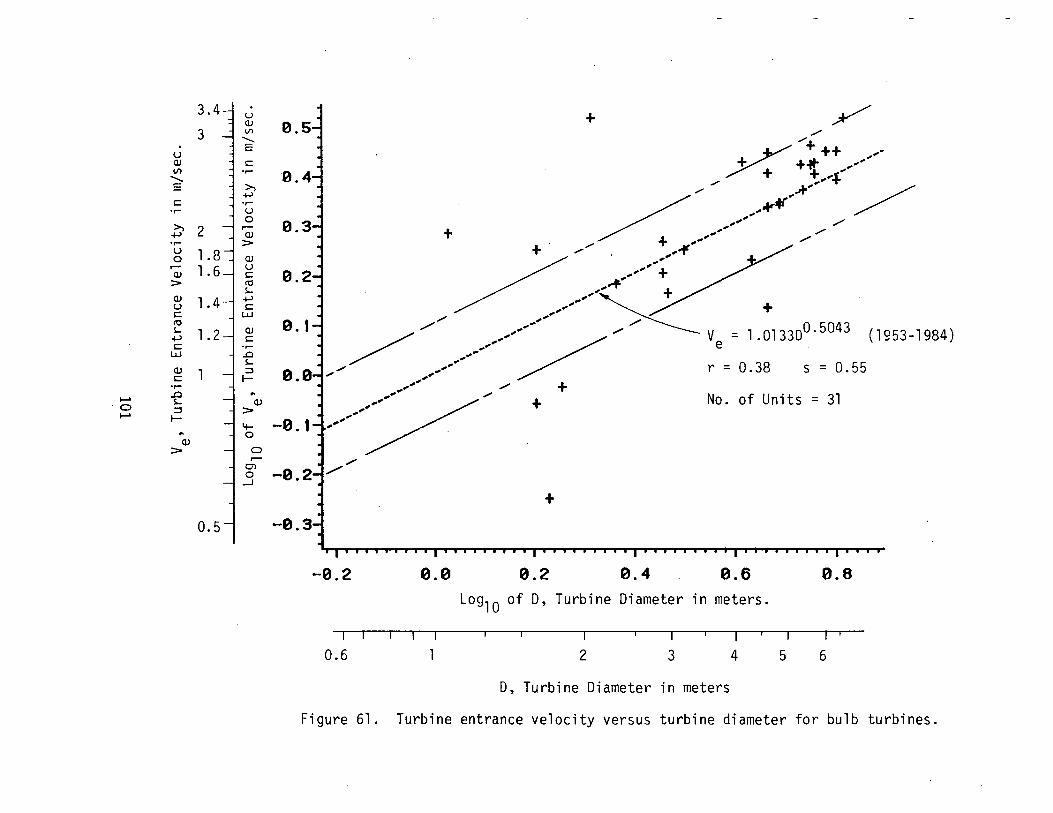
....... 0 .......
u Q) Ill
......... E
c: .,....
3.4
3
~ 2 .,.... g 1.8 '; 1. 6 >
~ 1.4 c: tO ~
.j-l c:
LLJ
Q) c: .,....
..0 ~ ::I 1-..
Q)
>
1.2
0.5
u Q) Ill
......... E
c: .,....
>, .j-l .,.... u 0 r-Q)
> Q) u c: tO ~
.j-l c:
LLJ
Q) c: .,....
..0 ~ ::I 1-..
Q)
> 4-0
0 r-
01 0 _l
0.5
0.4
0.3
0.2
0. I
-0. I
+ y /
/+
~ ++ ... + o&. ........ "'+ ....
/ ,,'~ / .......... /
/
,..,-¥ .... +
...... / .... .....
/
+ . ............... ' .. ~ .... -ft...... / ...... + .... .......
.......... '~+ / .... / +
/ ...... /
/ ..................... /.. ..... ve = l.Ol33D0
·5043
(1953-1984)
/ .... .... ........ r = 0. 38 s = 0. 55 ........ ..... +
.. .. .... , ..
-0.2
/ .... /
+ No. of Units = 31
+
0.0 0.2 0.4 0.6 0.8 Log
10 of D, Turbine Diameter in meters.
r-1 I 1 ~- I'
0.6 1 2 3 4 5 6
D, Turbine Diameter in meters
Figure 61. Turbine entrance velocity versus turbine diameter for bulb turbines.
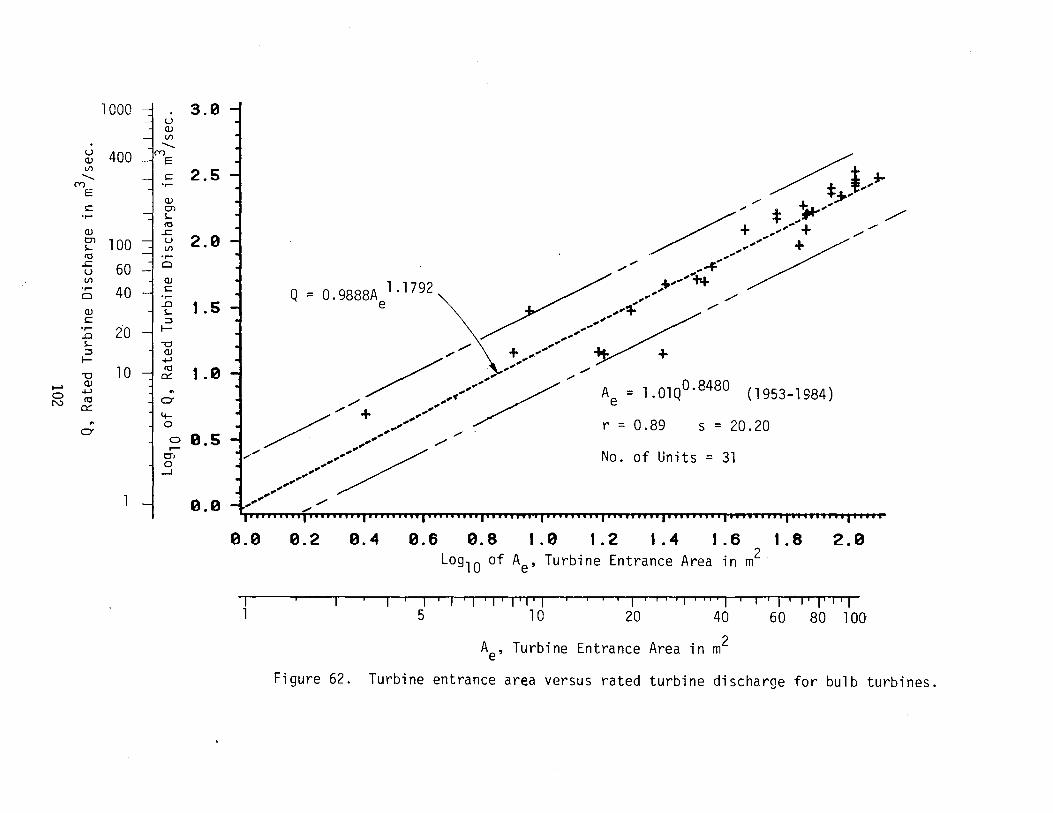
1000 ----d 3.0 u Q) Vl -u 400 (V)
Q) E Vl 2.5 - c
(Y) .,... E
Q) c en .,... s...
ttl Q) ..s::: en 100 u 2.0 s... Vl ttl .,...
..s::: 60 0 u Vl Q) .,... 40 c
0 .,... ..CJ 1.5 Q) s...
c :::::! .,... 20 1-
..CJ s... -o :::::! Q) I- +-'
10 ttl 1.0 -o 0:: ..... Q)
0 +-' .. N ttl 0'
0:: 4-.. 0
0' 0 0.5 ....-
en 0
_J
0.0
Q = 0.9888A 1.1792 e
~t-~ / ~ .. 7 ;' * .,........ /
/ + .................. + ,.., / _ ...... /' + ......
,..-"" .. ...,. .. ~ ..... '"++ ...... ..... /
"1." ./ .............. ,. /
/--~ +_,----------~ + / // ... ,, .,.,, A = 1.01q0·8480 (1953-1984)
.,., ~, e / + ....
/ .......... r = 0.89 s = 20.20 ,.. /
.,., /........ / .,., .. " .... .... .... .... , .. ...... ./
No. of Units = 31
, /
0.0 0.2 0.4 0.6 0.8 1.0 1.2 1.4 1.6 1.8 2.0 Log10 of Ae' Turbine Entrance Area in m2
1 - 1 I 1 --1 • 1 • 1 I 1 I 1 I 1 ~--.-· I 1 · · · · 1 I 1 I r·-T--T' T'l 1 5 10 20 40 60 80 100
Ae, Turbine Entrance Area in m2
Figure 62. Turbine entrance area versus rated turbine discharge for bulb turbines.
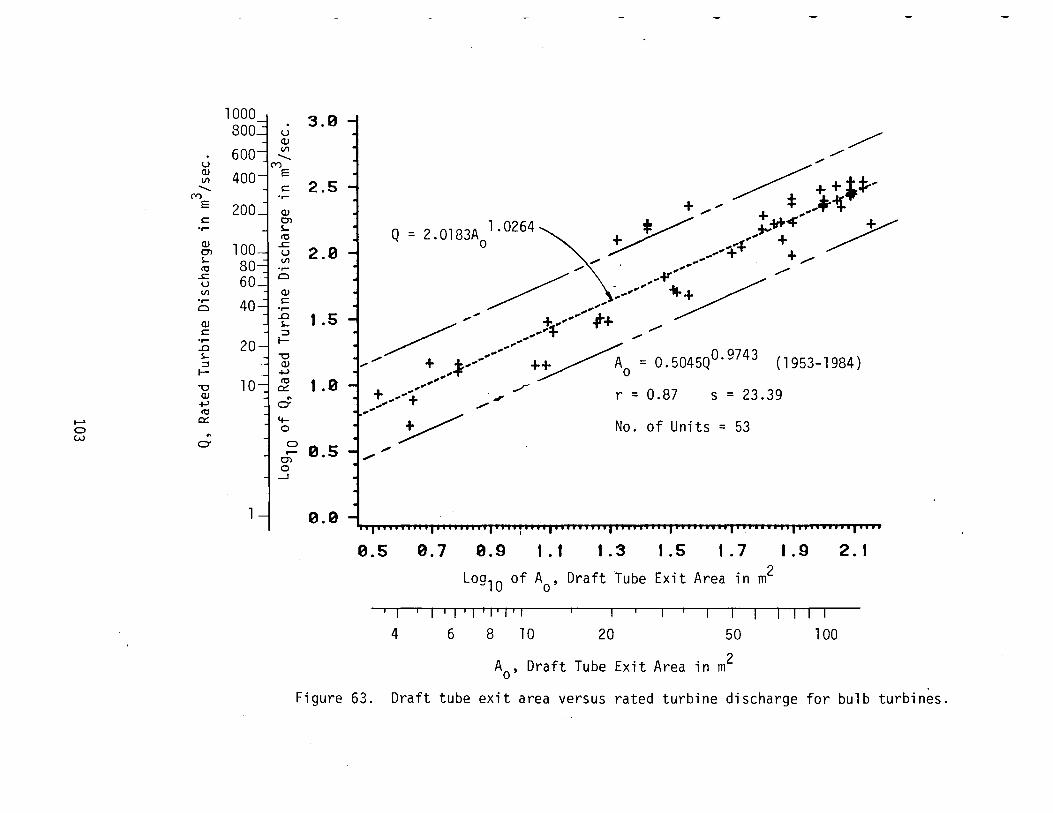
~
C> w
. u Q) Vl -C0 E
s:: •r-
Q) Ol s-10
..!:: u Vl .,....
Cl
Q) s::
•r-.0 s:::3
1-
'"0 Q)
+> 10
0:: .. c:r
1000 800
600 400
3.0
s:: 2.5 .,.... 200 _J Q)
Ol s-10
lOOi ~ 2.0 80 .,.... 60~ Cl
40
20
10
Q) s::
•r-.0 s:::3
1-
'"0 Q)
+> 10
0:: .. c:r 4-0
1.5
1.0
0 0.5 ,..... Ol 0 _J
0.0
........................
Q = 2.0183A
0
1.0264 + -~ ~: + ·;f;.-
~~ +""' ___ .. -!f.
~ . ____ .----+.f. __ i¥ +: ~
.... ¥ .........
~......... .. .............. ~ ......... _I_ .... + ~ .... ...
- ----=!=" .,. "" ..... ~ ...... + '* ............ ~ ...... .......
+ ------ ++ A _ __...---+ ..r o = o. so45Qo. 97 43
~ --; - (1953-1984)
r - 0.87 s = 23.39
No. of U . m ts = 53
0.5 0.7 0.9 1.1 1.3 1.5 1.7 1.9 2. I
Log 10 of A0
, Draft Tube Exit Area in m2
'I I r T r'l1 I T rrl-- I T-----.- I I r-Ill I
4 6 8 1 0 20 50 1 00
A0
, Draft Tube Exit Area in m2
Figure 63. Draft tube exit area versus rated turbine discharge for bulb turbines.
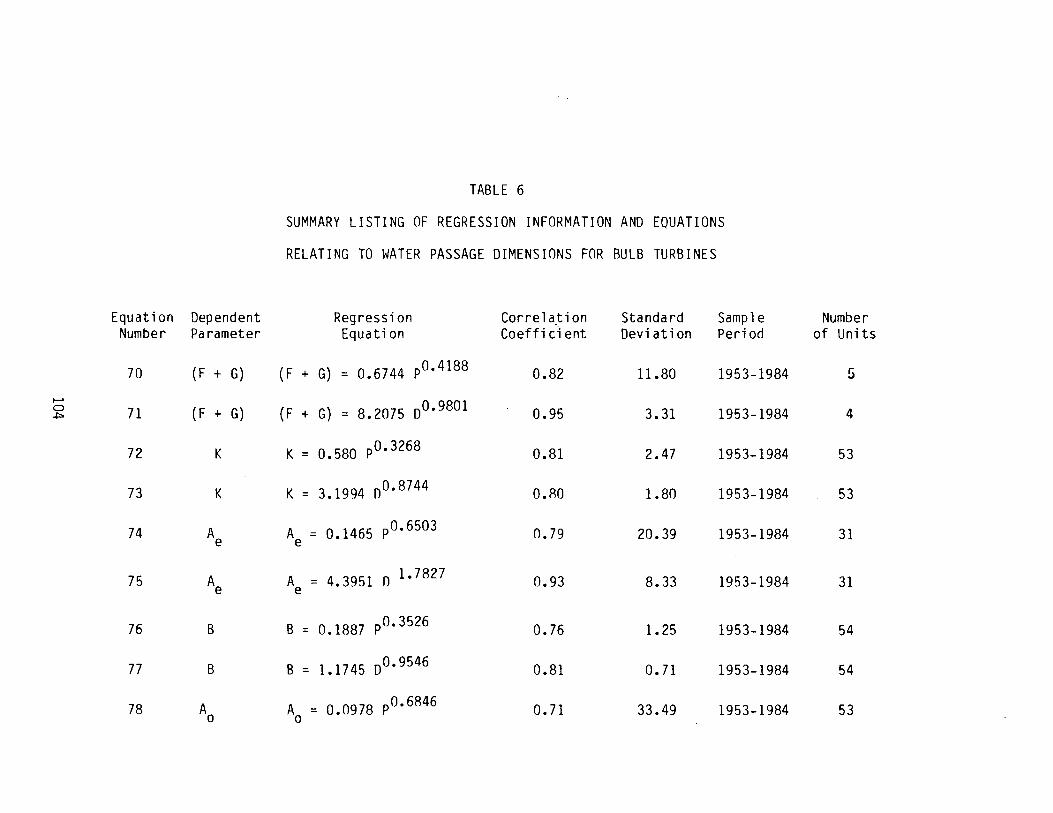
Equation Dependent Number Parameter
70 (F + G)
...... 0 71 (F + G) .+::>
72 K
73 K
74 A e
75 A e
76 B
77 B
78 A 0
TABLE 6
SUMMARY LISTING OF REGRESSION INFORMATION AND EQUATIONS
RELATING TO WATER PASSAGE DIMENSIONS FOR BULB TURBINES
Regression Correlation Standard Sample Equation Coeffi c1 ent Deviation Period
(F + G) = 0.6744 p0•4188 0.82 11.80 1953-1984
(F + G) = 8.2075 o0•9801 0.95 3.31 1953-1984
K = 0.580 P0•3268 0.81 2.47 1953-1984
K = 3.1994 n°· 8744 O.RO 1.80 1953-1984
A = 0 1465 P0•6503 e • 0.79 20.39 1953-1984
A = 4.3951 0 1•7827 e 0.93 8.33 1953-1984
B = 0.1887 P0•3526 0.76 1.25 1953-1984
B = 1.1745 D0•9546 0.81 0. 71 1953-1984
A = 0.0978 P0•6846 0
0. 71 33.49 1953-1984
Number of Units
5
4
53
53
31
31
54
54
53
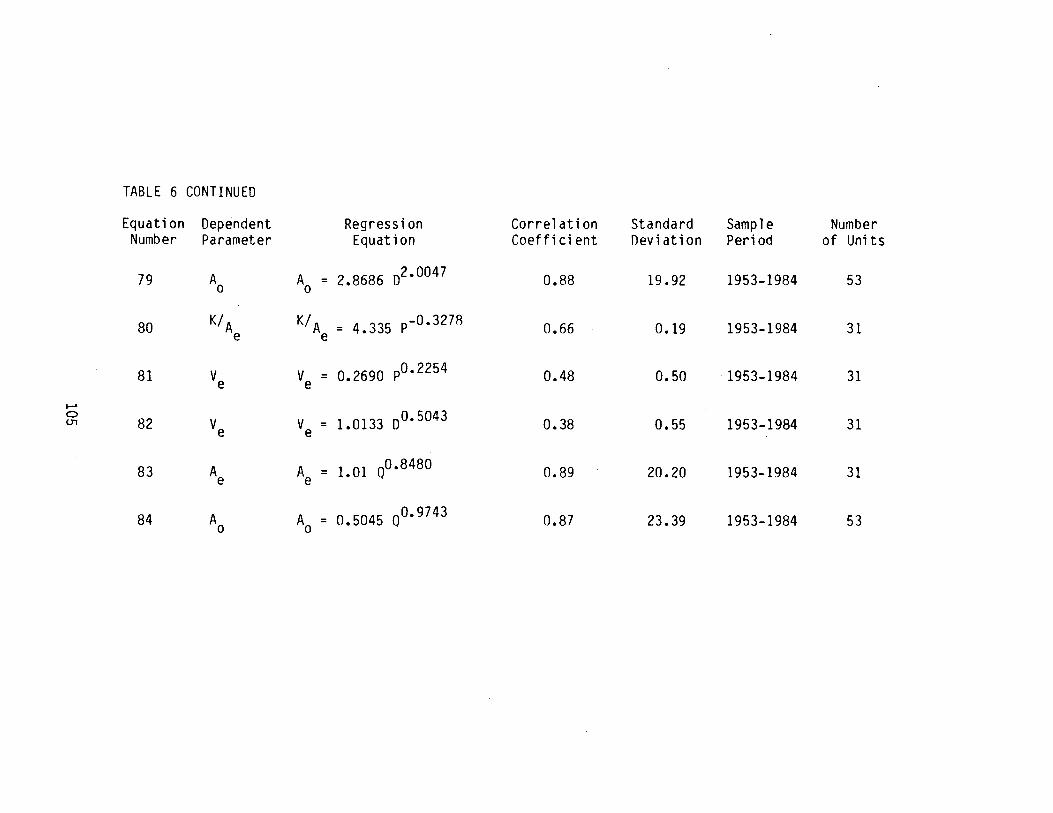
TABLE 6 CONTINUED
Equation Dependent Regression Correlation Standard Samp 1 e Number Number Parameter Equation Coefficient Oeviation Period of Units
79 A A0
= 2.8686 D2•0047 0.88 19.92 1953-1984 53 0
80 K/ A e
K/A = 4•335 p-0.3278 e 0.66 0.19 1953-1984 31
81 ve V = 0.2690 P0•2254 e 0.48 0.50 1953-1984 31
....... 0
ve = 1.0133 D0•5043 (.]1 82 ve 0.38 0.55 1953-1984 31
83 A Ae = 1.01 00.8480 0.89 20.20 1953-1984 31 e
84 A 0
Ao = 0.5045 00.9743 0.87 23.39 1953-1984 53
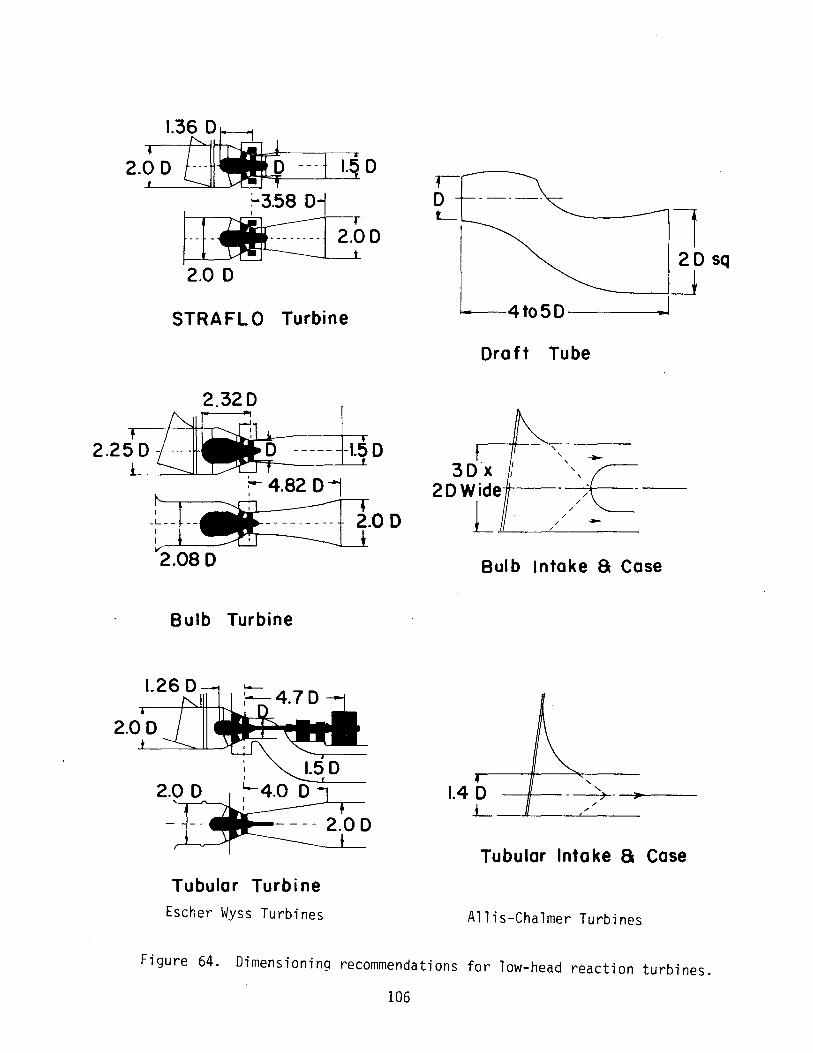
l 2.0 D
20 sq __ _j
STRA FL 0 Turbine
Draft Tube
' ' --
30 X*,'---~,',,/' __ _ 20Wide ~/C-
L ," --~"-
2.08 D Bulb Intake 8 Case
Bulb Turbine
2.0 D ' I. 4 D --ll---~- ---=----/ j_ _...JL__--L._/ __
Tubular Intake a Case
Tubular Turbine
Escher Wyss Turbines Allis-Chalmer Turbines
Figure 64. Dimensioning recommendations for low-head reaction turbines.
106
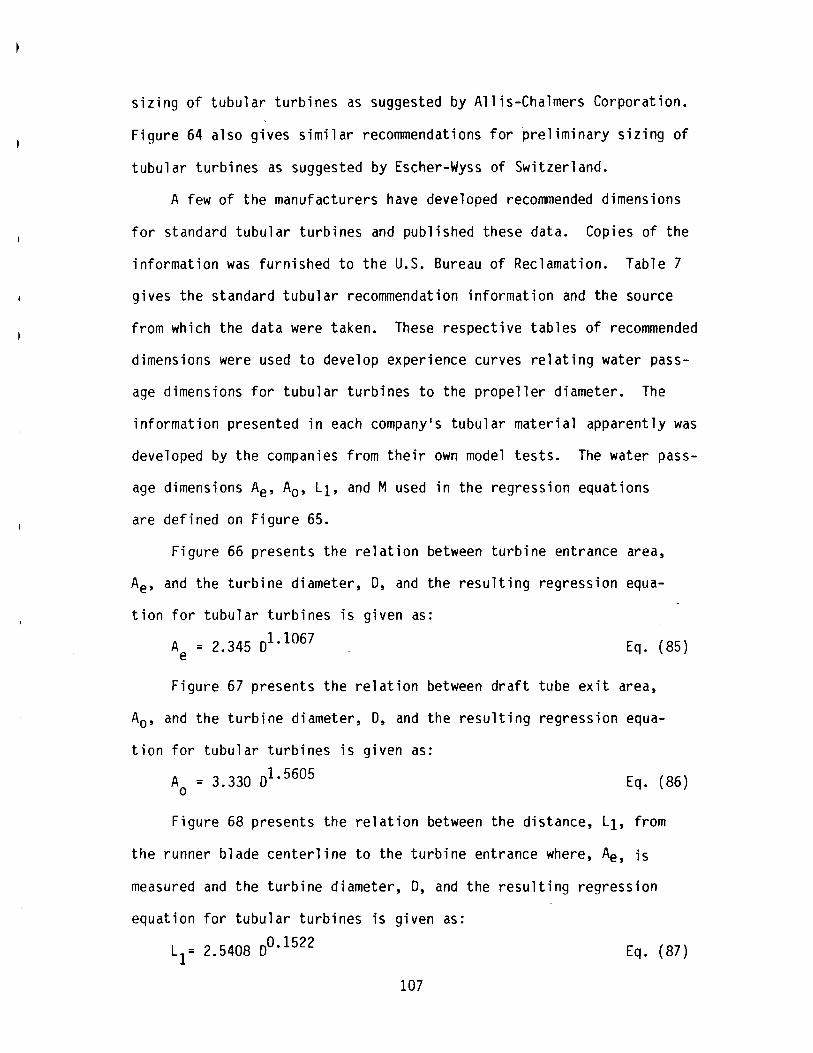
sizing of tubular turbines as suggested by Allis-Chalmers Corporation.
Figure 64 also gives similar recommendations for preliminary sizing of
tubular turbines as suggested by Escher-Wyss of Switzerland.
A few of the manufacturers have developed recommended dimensions
for standard tubular turbines and published these data. Copies of the
information was furnished to the U.S. Bureau of Reclamation. Table 7
gives the standard tubular recommendation information and the source
from which the data were taken. These respective tables of recommended
dimensions were used to develop experience curves relating water pass-
age dimensions for tubular turbines to the propeller diameter. The
information presented in each company's tubular material apparently was
developed by the companies from their own model tests. The water pass-
age dimensions Ae, Ao, L1, and M used in the regression equations
are defined on Figure 65.
Figure 66 presents the relation between turbine entrance area,
Ae, and the turbine diameter, 0, and the resulting regression equa-
tion for tubular turbines is given as:
A = 2.345 o1· 1067 e Eq. (85)
Figure 67 presents the relation between draft tube exit area,
A0 , and the turbine diameter, 0, and the resulting regression equa
tion for tubular turbines is given as:
Ao = 3.330 01.5605 Eq. (86)
Figure 68 presents the relation between the distance, L1, from
the runner blade centerline to the turbine entrance where, Ae, is
measured and the turbine diameter, 0, and the resulting regression
equation for tubular turbines is given as:
L1= 2.5408 o0· 1522 Eq. (87)
107
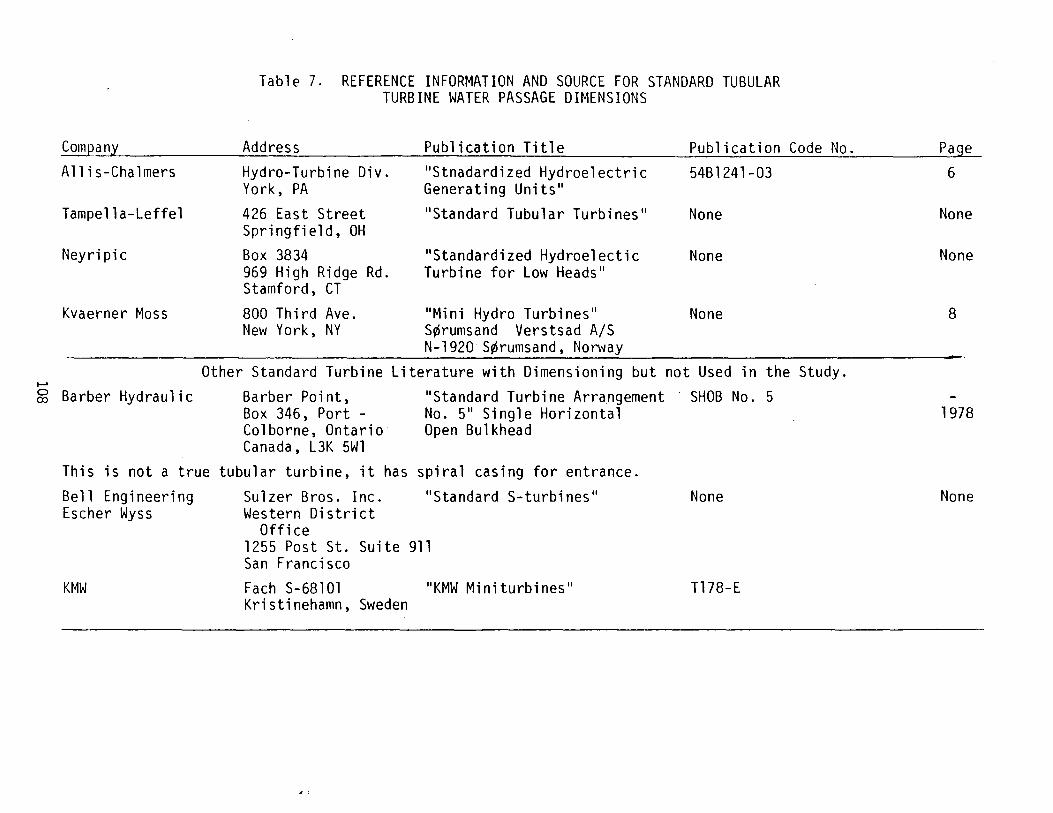
~
Table 7. REFERENCE INFORMATION AND SOURCE FOR STANDARD TUBULAR TURBINE WATER PASSAGE DIMENSIONS
Company Address Publication Title Publication Code No. Page Allis-Chalmers Hydro-Turbine Div. 11 Stnadardized Hydroelectric 54Bl241-03 6
Tampella-Leffel
Neyri pic
Kvaerner Moss
York, PA Generating Units ..
426 East Street 11 Standard Tubular Turbines .. Springfield, OH
Box 3834 969 High Ridge Rd. Stamford, CT
800 Third Ave. New York, NY
11 Standardized Hydroelectic Turbine for Low Heads ..
11 Mini Hydro Turbines 11
S~rumsand Verstsad A/S N-1920 S~rumsand, Norway
None
None
None
Other Standard Turbine Literature with Dimensioning but not Used in the Study.
None
None
8
~ Barber Hydraulic Barber Point, 11 Standard Turbine Arrangement SHOB No. 5 No. 511 Single Horizontal Box 346, Port -
Colborne, Ontario Canada, L3K 5Wl
Open Bulkhead
This is not a true tubular turbine, it has spiral casing for entrance.
Bell Engineering Escher Wyss
KMW
Sulzer Bros. Inc. 11 Standard S-turbines .. Western District
Office 1255 Post St. Suite 911 San Francisco
Fach S-68101 11 KMW Miniturbines 11
Kristinehamn, Sweden
1978
None None
Tl78-E
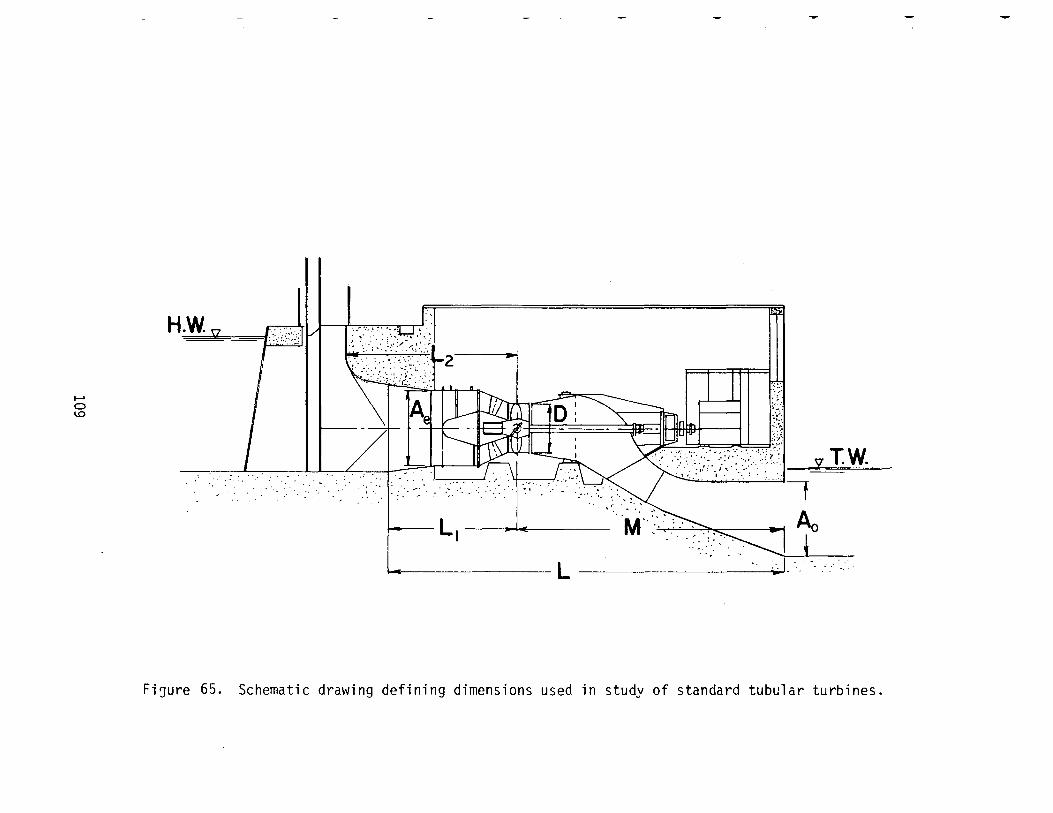
...... 0 1.0
H.W =
..... ·:-:··: ;·;:..~;
~~~
~.!I .:-:J.' . .,.';::; v T.W .
. -t
1- L1 M,,··:.
· .. ;: ........ ..I • c. • _.........._
~----- L--
Fi~ure 65. Schematic drawing defining dimensions used in study of standard tubular turbines.
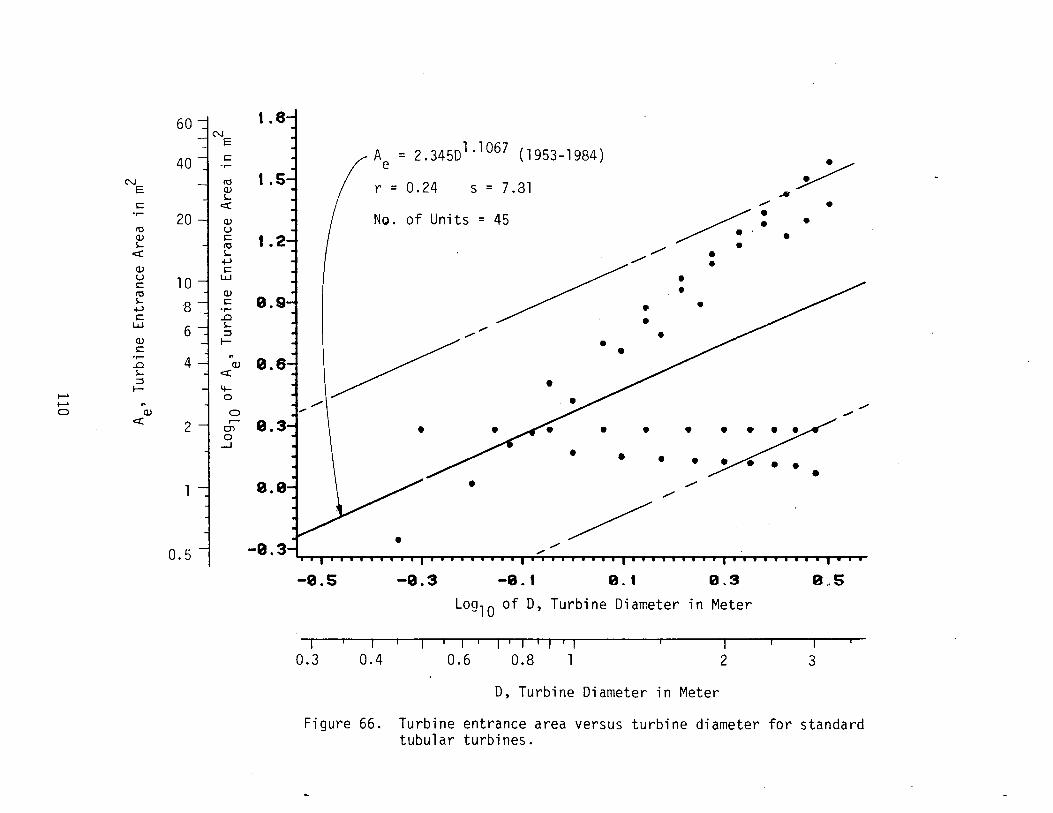
----. I I I I I I I I T
0.3 0.4 0.6 0.8 1 2 3
0, Turbine Diameter in Meter
Figure 66. Turbine entrance area versus turbine diameter for standard tubular turbines.
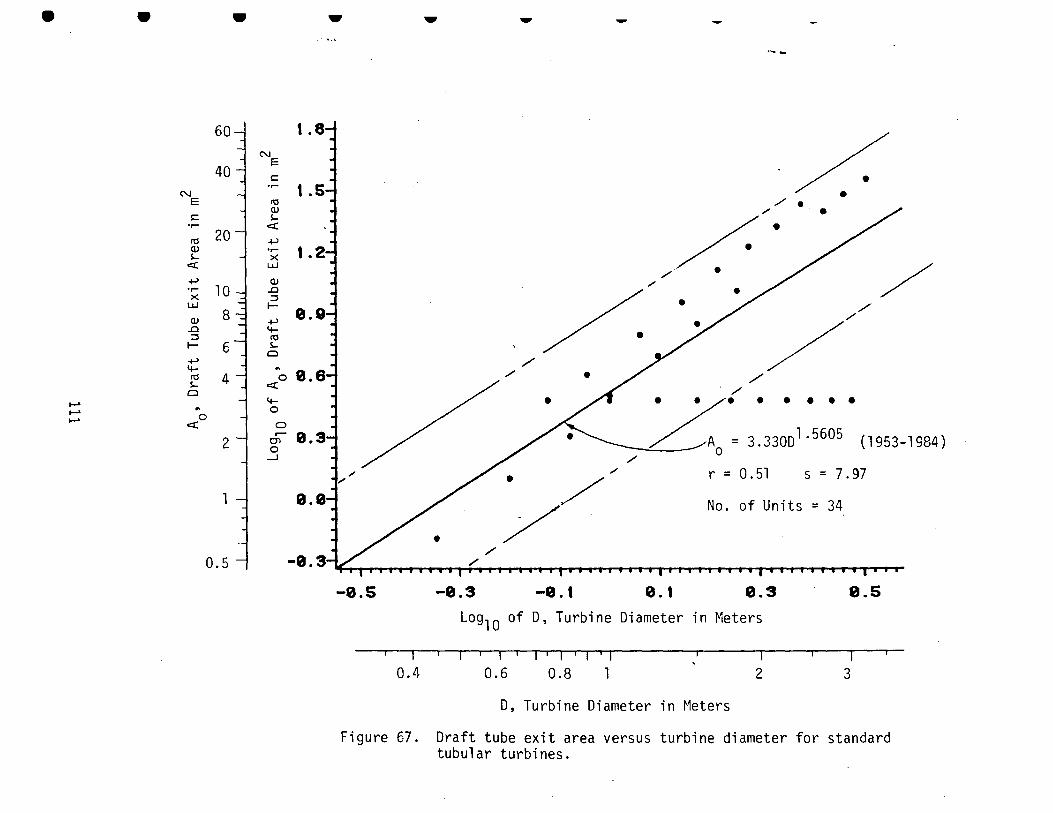
• •
60
40 N
E
s:: .,.... ~ 20 (I) ~
<:::(
+-' .,.... 10 X UJ
(I) 8 ..0 ::I I- 6 +-> 4-~ 4 ~
Cl ~ ~ ~
" .:::(0
2
1
0.5
•
N E
s:: .,....
~ (I) ~
<:::(
+-' .,.... X
UJ
t.8
t.S
t.2
(I) ..0 ::I I-+' 8.9 4-~ ~ Cl
0 <:::(
4-0
0 ,..... C'l 0 _l
..
-8.5
...
• /
/
-8.3
-
/ /
/. •
•
// /
-8.'
~-
/. • ///:· •
/ /
•
/ /
// . / ..... . ~~A_ = 3.330D1 ·5605 (1953-1984)
0
r = 0. 51 s = 7.97
No. of Units = 34
0. 1 8.3 e.s Log10 of D, Turbine Diameter in Meters
r---r---r----r---r---r--..----.r-r-,.....,..--r--.r-r-----,----~-----.---,--- r
0.4 0.6 0.8 1 2 3
D, Turbine Diameter in Meters
Figure 67. Draft tube exit area versus turbine diameter for standard tubular turbines.
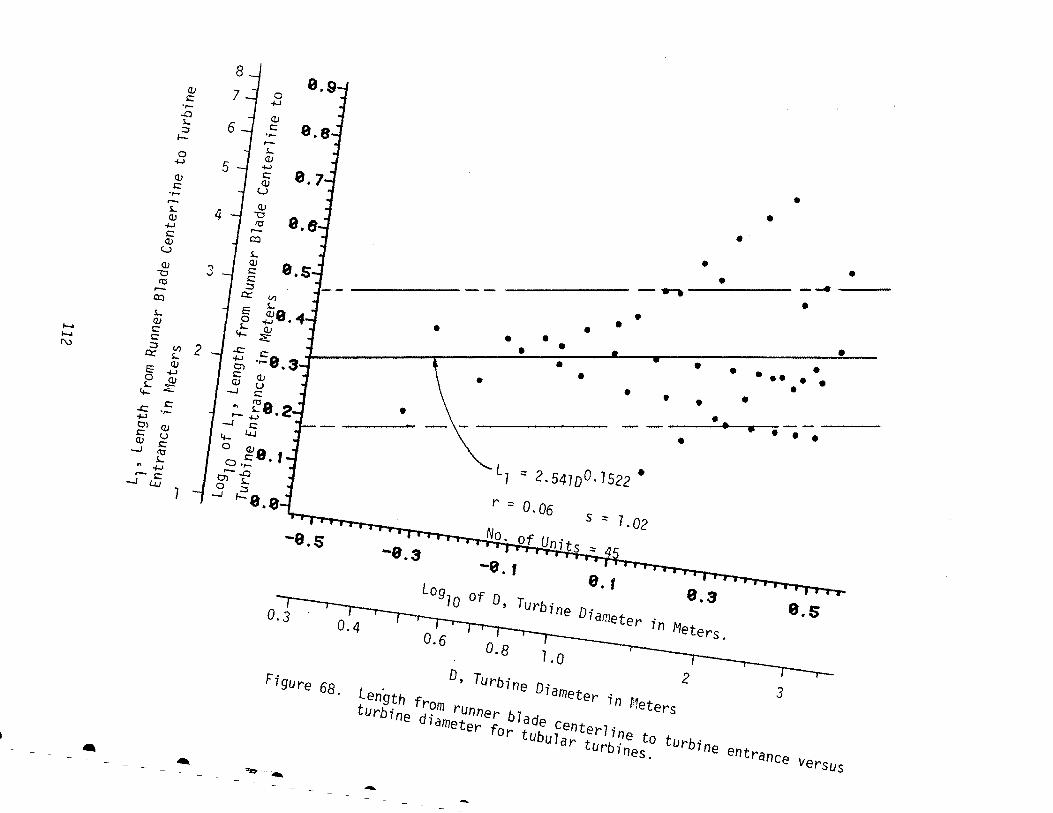
8 (!)
0 s:: -1-l .,.....
..0 (!) s... s:: ;:;;, ,_ .... ,_ s... 0 (!) -1-l 5 -1-l
s:: (!) (!) s:: u ,_
,.._ • (!) s... 4 "0 (!) lt1 -1-l • ,_ s:: co (!) • u s...
(!) (!) ':> s:: "0 '"' s:: lt1 ;;:s ,.._ ~ co
• • • _...,. -..-.
E s... 0 <ZJ s... ....... s:: If.-....... s:: 1'\) ;;:s V) 2 .J:: ~ s... -1-l
(!) 0) E ..., s:: (!) 0 .s! (!) u s... -J s:: 4- .....
.J:: s:: .. ~8.2 . ,..... ,.._ ...., -1-l -./ s:: 0) (!)
4.1 s:: u 4-(!) s:: 0 (1)8 ' -./ lt1 o.~ • s... .. ...., ,.._..0 -s:: 0) s... -J 4.1 0 ;:;;,
-J ,_8 8 ·..,_,
• • • •
• • •
• •
• • ••• • • •
• • •
• • • • . ..___.. • • • •
•
LJ ~ 2.S4Joo. 1s22 •
r ~ 0.06 s ~ 1. 02
-e.s -8.3 -e.'
8. t 8.3
e.s 0.3 0.4
Log10
of D, Turbine Diameter in Meters.
0.6 0.8 7.o
D, Turbine Diameter in Meters
Figure 68. LeniJth from runner blade centerline to turbine entrance versus turb1ne dJameter for tubular turbines .
2 3
• .. .... ,.... . ._ -
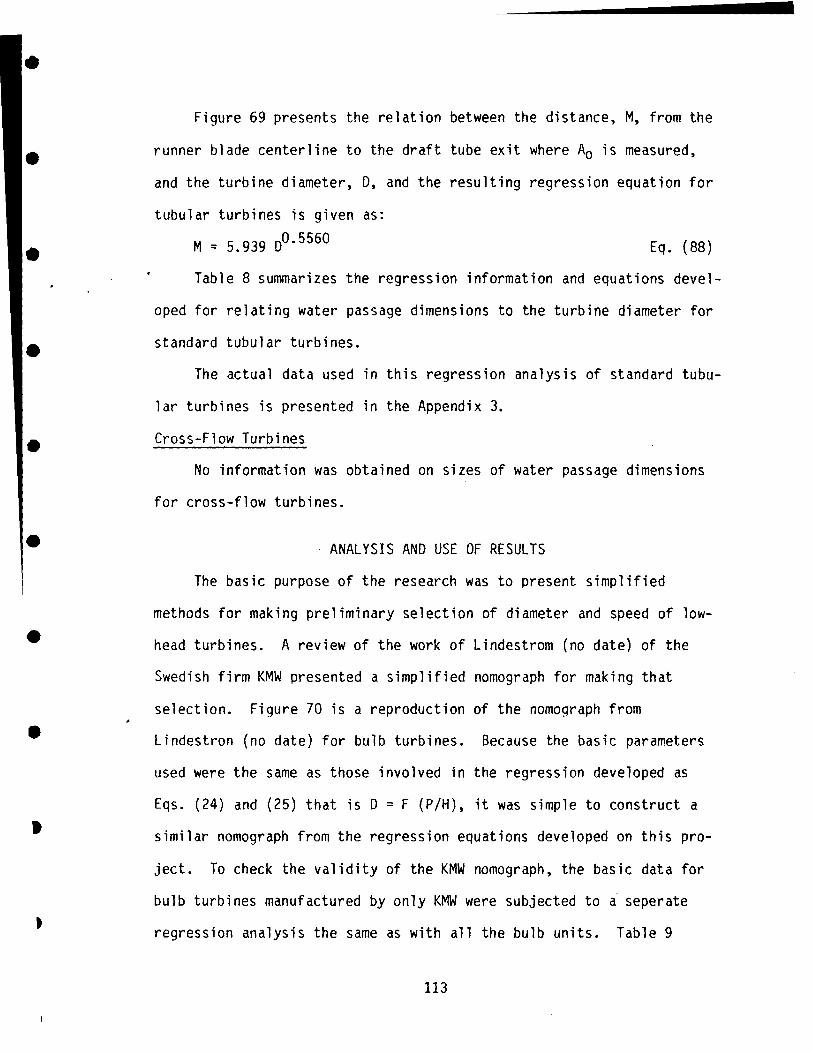
•
•
•
•
•
•
•
•
'
Figure 69 presents the relation between the distance, M, from the
runner blade centerline to the draft tube exit where A0 is measured,
and the turbine diameter, 0, and the resulting regression equation for
tubular turbines is given as:
M = 5.939 o0· 5560 Eq. (88)
Table 8 summarizes the regression information and equations devel-
oped for relating water passage dimensions to the turbine diameter for
standard tubular turbines .
The actual data used in this regression analysis of standard tubu
lar turbines is presented in the Appendix 3.
Cross-Flow Turbines
No information was obtained on sizes of water passage dimensions
for cross-flow turbines .
ANALYSIS AND USE OF RESULTS
The basic purpose of the research was to present simplified
methods for making preliminary selection of diameter and speed of low
head turbines. A review of the work of Lindestrom (no date) of the
Swedish firm KMW presented a simplified nomograph for making that
selection. Figure 70 is a reproduction of the nomograph from
Lindestron (no date) for bulb turbines. Because the basic parameters
used were the same as those involved in the regression developed as
Eqs. (24) and {25) that is D = F {P/H), it was simple to construct a
similar nomograph from the regression equations developed on this pro-
ject. To check the validity of the KMW nomograph, the basic data for
bulb turbines manufactured by only KMW were subjected to a seperate
regression analysis the same as with all the bulb units. Table 9
113
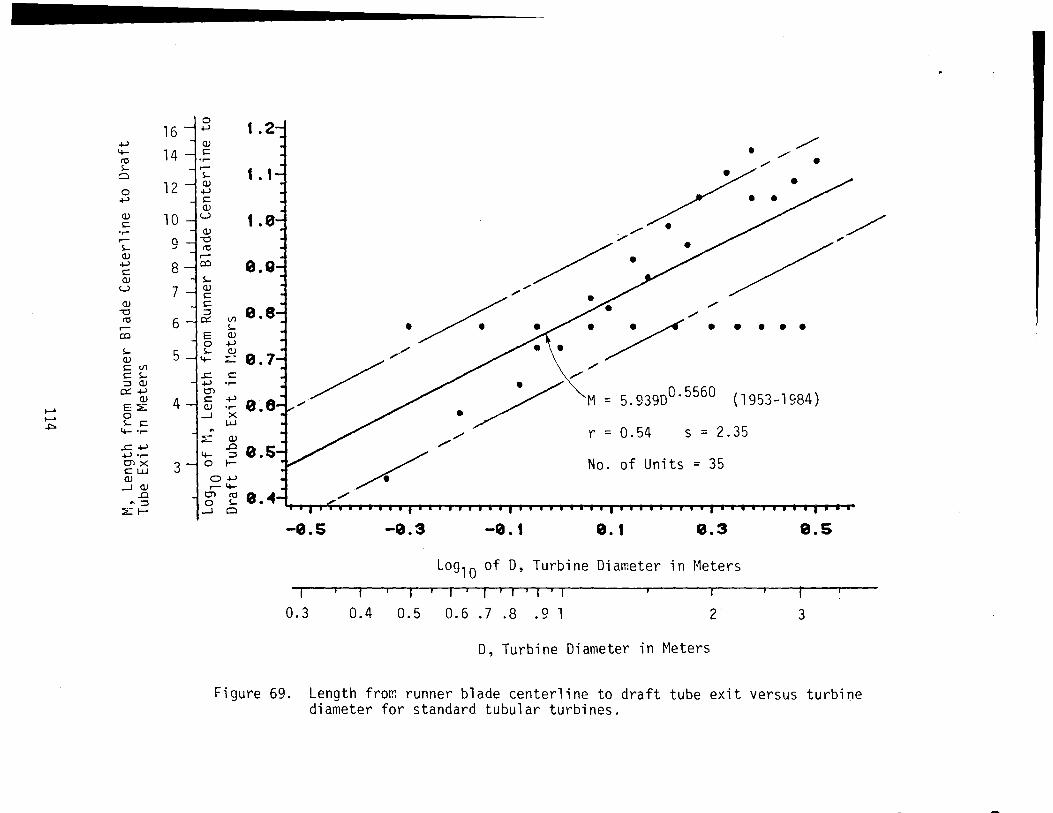
16 ~ 4- 14 <0 s...
Cl
0 12 ~
(l) 10 s:: ·.--..- 9 s... (l) ~ 8 s:: (l)
u 7 (l)
"0 <0 6 ..-
co s... 5 (l) S::Vl s::s... ::I (l)
0::: ~ (l) 4
t-' E~ .... ~ 0 ~ s... s::
4- ·.--
..c ~ ~ ·.--c:nx 3 s:: w.J (l) _,J(l)
..0 .. ::I
~~--
s... (l) s:: s:: ::I
0:::
..c ~ c:n s:: (l)
_,J
.. .."'-
4-0
Ill s... (l)
~ (l)
~
s:: ..... ~ ..... X
w.J
(l) ..0 ::I
1-
0~ ..- 4-
c:n <0 0 s...
_,J 0
1.2
1.1
1.0
9.9
0.7 //
-e.s -0.3
• //
/ .//. /
/
M- 5.J
• / / .
• • ••
(1953-1984) /~ - 039D0.5560
r = 0.54 s = 2.35
No. of Units = 35
-e. 1 e. 1 0.3 e.s
Log10 of D, Turbine Diameter in Meters ~--,- -,--.-T-.--,-T -1-r 1-, T 'T-- ---~-- ----.--~~-,
0.3 0.4 0.5 0.6 .7 .8 .9 1 2 3
D, Turbine Diameter in Meters
/
Figure 69. Length from runner blade centerline to draft tube exit versus turbine diameter for standard tubular turbines.
- • •
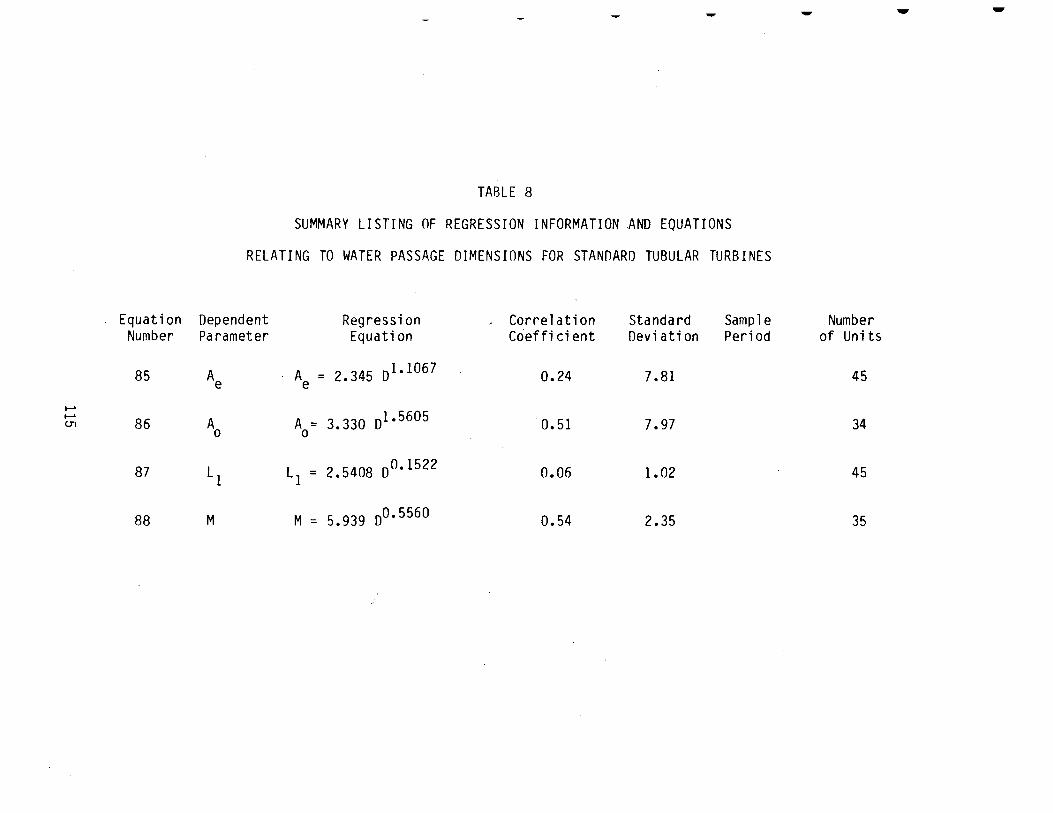
Equation Number
85
......
...... 86 <.Tl
87
88
TABLE 8
SUMMARY LISTING OF REGRESSION INFORMATION AND EQUATIONS
RELATING TO WATER PASSAGE DIMENSIONS FOR STANOARO TUBULAR TURBINES
Dependent Regression Correlation Standard Samp 1 e Parameter Equation Coefficient Deviation Period
A A = 2.345 o1•1067 0.24 7.81 e e
A - 3 330 D1•5605 A 0.51 7.97 0 0- 0
L1 L1 = 2.5408 D0•1522 0.06 1.02
M M = 5.939 D0•5560 0.54 2.35
- - -
Number of Units
45
34
45
35
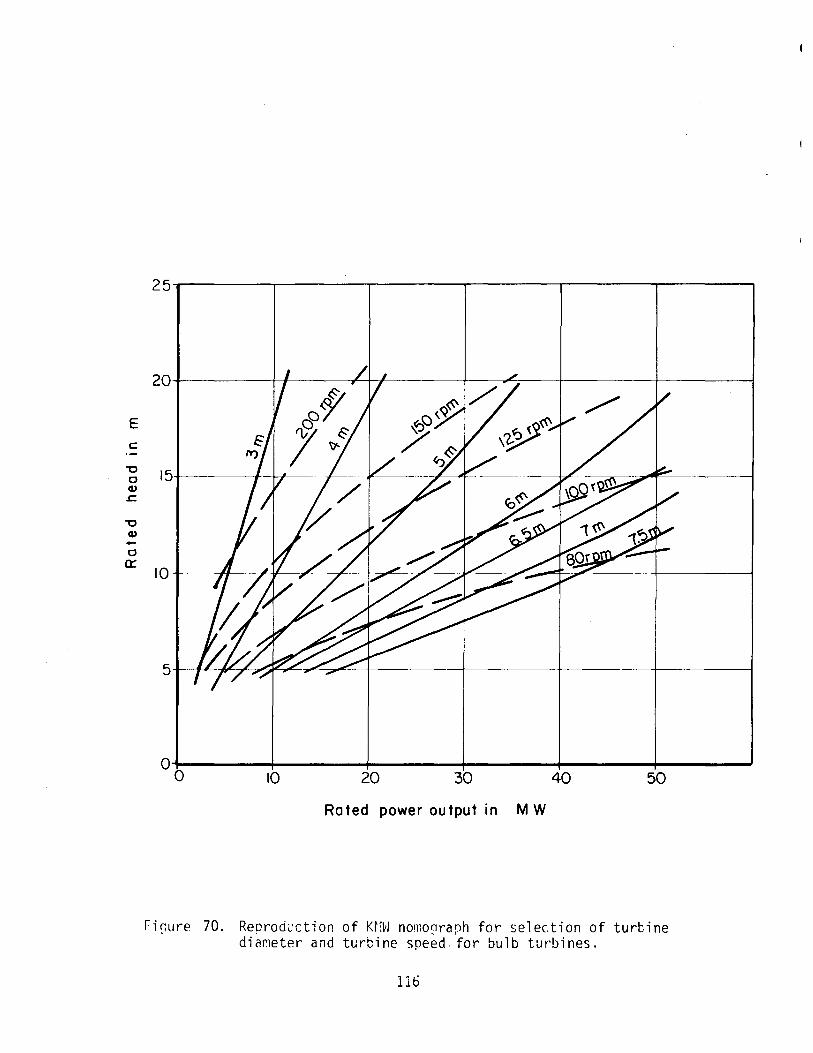
E c ·-"0 0 Q) L;
"0 Q)
0 a::
25~------~--------~------~--------,--------.-------~
20
15
10
10 20 30 40 50
Rated power output in M W
Fi0ure 70. Reorod1.·ction of KtivJ nomot;Jraph for selection of turbine dia~eter and turbine speed. for bulb turbines.
116
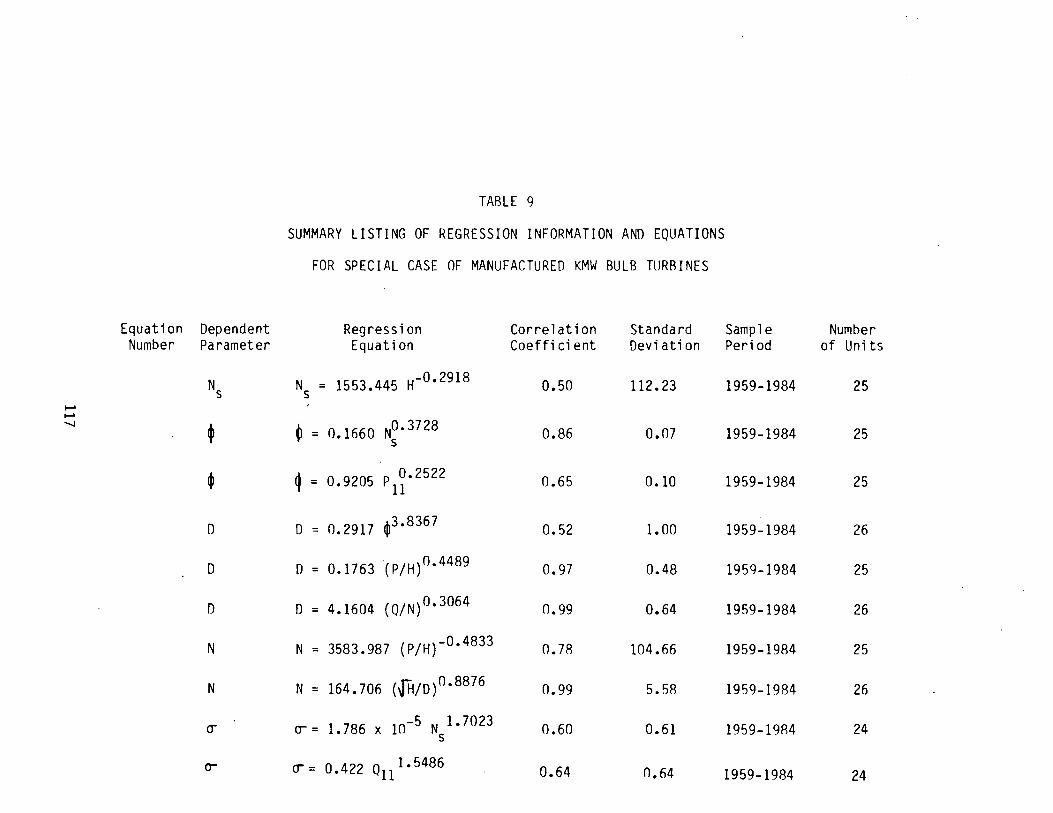
Equation Dependent Number Parameter
Ns ...... ...... -....1
• ~
D
D
D
N
N
CT
rr
TABLE 9
SUMMARY LISTING OF REGRESSION INFORMATION AND EQUATIONS
FOR SPECIAL CASE OF MANUFACTURED KMW BULB TURBINES
Regression Correlation Standard Equation Coefficient Deviation
N = 1553.445 H-0•2918 s 0.50 112.23
~ = 0.1660 N°· 3728 s 0.86 0.07
~ = 0.9205 p1~.2522 0.65 0.10
D = 0.2917 ~3 • 8367 0.52 1.00
D = 0.1763 (P/H) 0•4489 0.97 0.48
D = 4.1604 (Q/N) 0•3064 0.99 0.64
N = 3583.987 (P/H)-0•4833 0.78 104.66
N = 164.706 (JH/0) 0•8876 0.99 5.58
~= 1.786 X 10⁻⁵ N 1•7023 s 0.60 0.61
CT = o.422 o11 1.5486
0.64 0.64
Samp 1 e Number Period of Units
1959-1984 25
1959-1984 25
1959-1984 25
1959-1984 26
1959-1984 25
1959-1984 26
1959-1984 25
1959-1984 26
1959-1984 24
1959-1984 24
presents the summary of the results of that special regression analysis
of KMW manufactured bulb units, giving the empirical equation, correla-
tion coefficient, standard deviation, sample period and the number of
units involved. A check of using the regression from the authors
special study confirmed the individual curves of the nomograph that had
been presented in Lindestrom (no date).
Figure 71 gives a nomograph for estimating bulb turbine diameters
based on rated head and rated power output. This nomograph was devel
oped by using the regression equation, Eq. 25. A similar nomograph for
tubular turbines is presented in Figure 72 which utilizes regression
equation, Eq. 41. The corresponding nomograph for cross-flow turbines
is presented in Figure 73 which utilizes regression equation, Eq. 57.
An estimation of turbine speed can be made in several ways. One
way is to use the same parameters of rated head and rated power output
as used for bulb turbines the regression equation, Eq. 27. Another
method is to use the estimated diameter as found from the nomograph
Figure 71 or Eq. 25 and substitute that in regression equation, Eq.
26. An additional approach is to take the estimated diameter as found
from nomograph Figure 71 or Eq. 25 and substitute that value of dia-
meter into the regression equation, Eq. 30.
The more conventional approach for estimating turbine diameter and
speed has been that explained in U.S.B.R. Monograph No. 20 and is to
first find a trial value of specific speed, Ns, from a curve like
Figure 3. Then proceed to find a trial speed, N', from the specific
speed equation.
Ns = Nrp
From Eq. (4) H 1.25
118
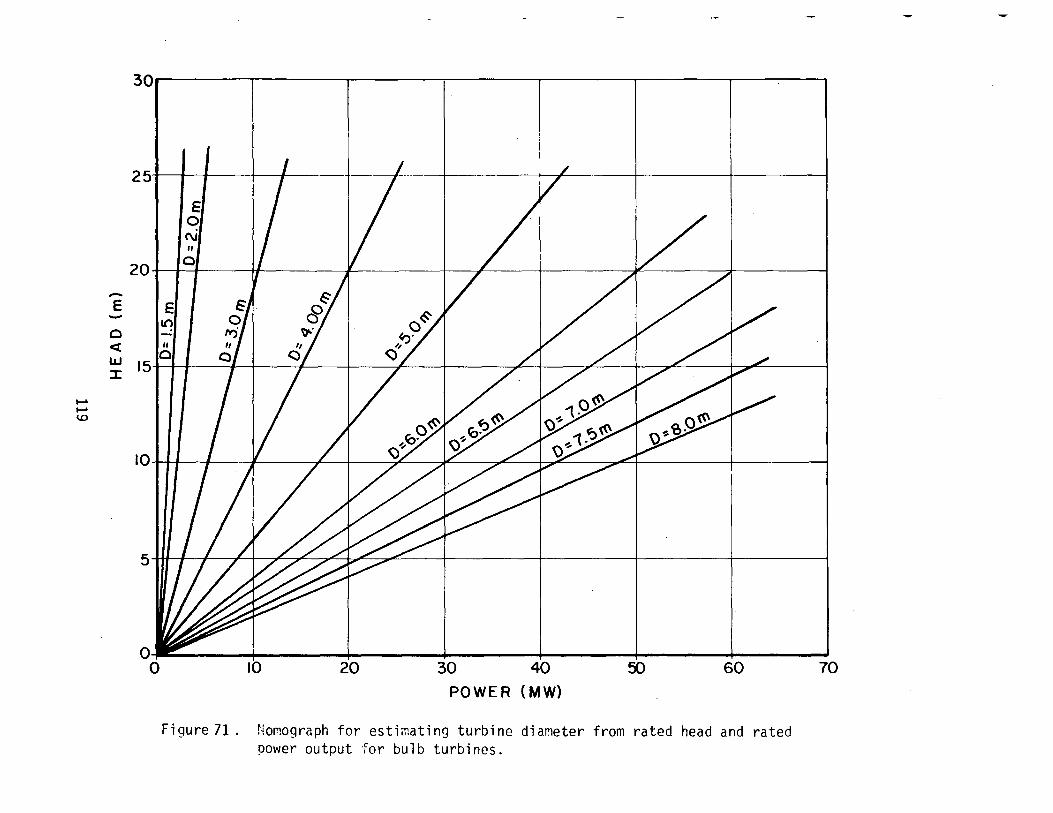
-E -0 <t LLJ :I:
...... ...... \0
30------~----~----~----~------r-----~~~
251 I I I I ~ - ~ ·- -
E1 0
,I (\J II
20. .o
E It)
15
10
5 Ill I I , I / ./ /j,........ ,r I I I I I r 7 ~7 7'~
0 0
Figure 71 .
10 20 30 40 ~ 60 70 POWER (MW)
t~omograph for estimating turbine dia~eter from rated head and rated power output for bulb turbines.
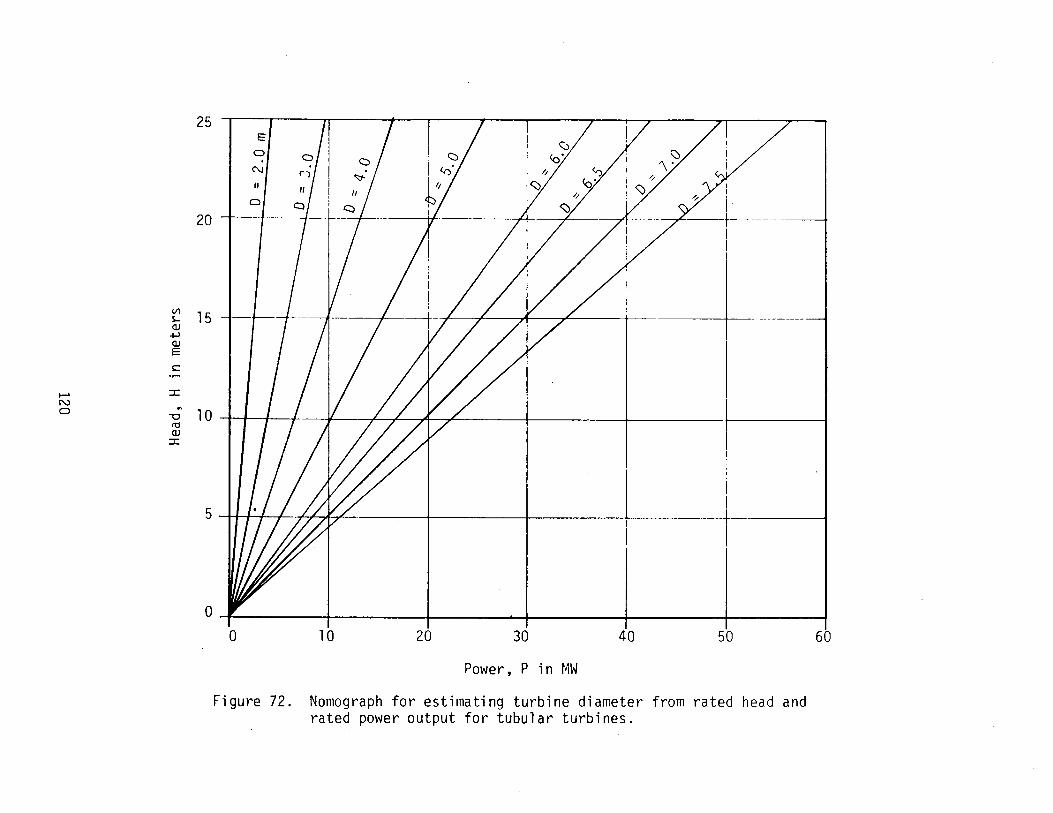
Ill s.... Q)
+' Q)
E
c: ..... ..... :::X: N 0 "' -o
~ Q)
:::X:
25
20
15
10
E
0
C'\J
II
Cl
.--~------y-·----~-
I I
i --t- ---- -----+ I I I
- --- -------
5 I I I t I --J/'7/~:If''-77,c..'-------,--+------+------+------l--------l
04r------~r-------~--------~-------+--------+-------~ 0 10 20 30 40 50
Power, P in t~W
Figure 72. Nomograph for estimating turbine diameter from rated head and rated power output for tubular turbines.
60
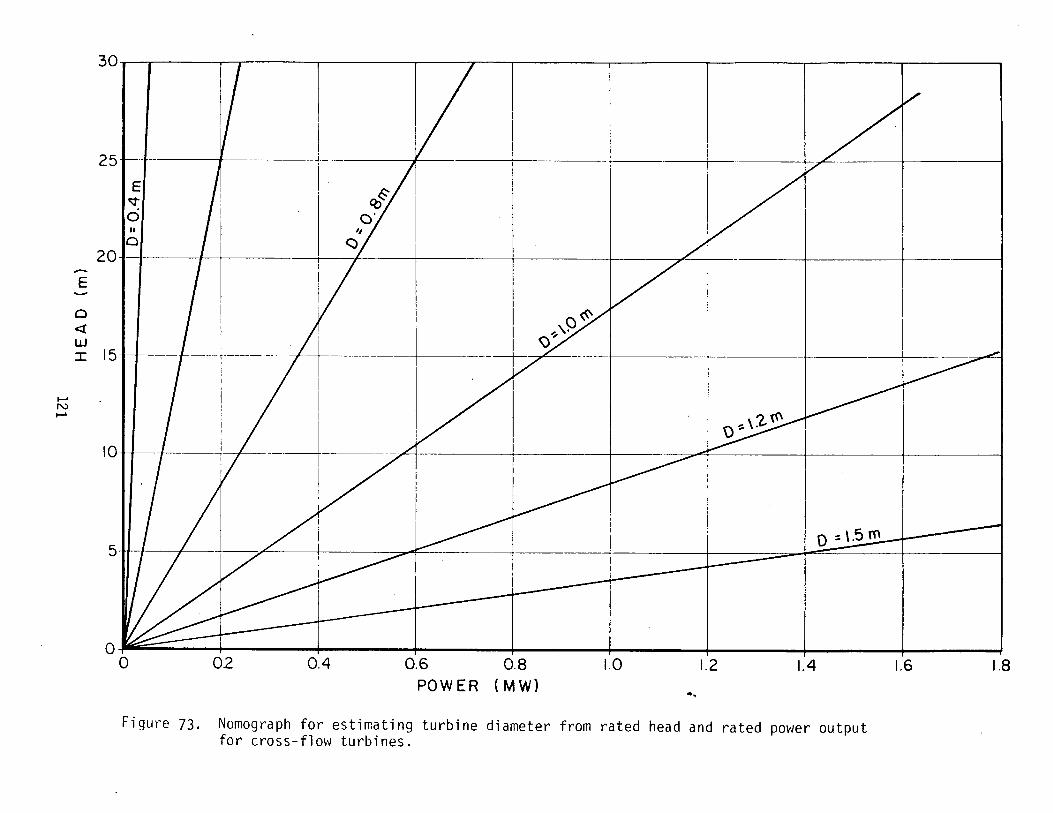
-E -Q
<t w I
...... N ......
30~.------..-----~--------~--~--~------~--------~------~--------~------~
25 I
E ~
0 II
Q . 20
15
10
I
I ------r ----
~r-i
t- --+--------+- / I .
: _ _j i-
1
o~~~--~------~------+-------4-------+-------+-------+-------4-------~ 0 0.2 0.4 0.6 0.8 1.0 1.2 1.4 1.6 1.8
POWER ( MW) ., Figure 73. Nomograph for estimating turbine diameter from rated head and rated power output
for cross-flow turbines.
A synchronous speed must then be chosen utilizing the relation. 120 X f Np =
where Np = number of generator poles
f = electrical frequency in Hz.
Eq. (89)
The number of poles, Np, must be in multiples of two or four, usually
in multiples of four. Once a synchronous speed is chosen then the
actual specific speed, Ns, is calculated using, Eq. 4. The next step
is to use the actual, Ns, in an empirical equation to determine the
speed ratio, 0. For bulb turbines this would utilize regression
equation, Eq. 18. For propeller units the U.S. Bureau of Reclamation
Monograph No. 20 (1976) gives the following:
0 = 0.0233 Ns 213 Eq. (90)
As a final step the estimated turbine diameter can be determined using
selected turbine speed, N, the rated head, H, and the empirically
determined value of speed ratio, 0, in the following form of the speed-
ratio equation: Ho.s
D = 84 . 58 0 -- E q . ( 91 ) N
This equation comes from the basic definition of speed ratio. To
illustrate the procedure for this selection process for estimating tur-
bine diameter and turbine speed sample calculations have been presented
in the Appendix. The sample calculations have been performed for a
manufactured unit at a plant in Europe known as Isawerk 3.
Additional comments are presented on the advantages of different
approaches to diameter estimation following a presentation of compar-
isons.
122
COMPARISONS
With the various different regression that were performed it is
informative to make a few simple comparisons. Figure 74 is a compari-
son of several different experience curves relating specific speed,
Ns, to the rated head, H, for different kinds of low-head turbines
studies on this project as well as results from other published stud-
ies. The curves include two experience curves taken from the Figure 11
of the U.S. Bureau of Reclamation Monograph No. 20 (1976), the work of
de Siervo and de Leva (1977), the work of Lindestrom (no·date), and the
experience curves for the three different types of turbines (bulb,
tubular, and cross-flow turbines) studied on this project. Table 10
summarizes the information on the specific speed versus rated head
relations for low-head type turbines.
Because the U.S. Bureau of Reclamation Monograph 20 gives an
empirical equation relating the speed ratio, 0, to the specific speed,
Ns, that is used in preliminary speed and diameter selection a com
parison was made with similar relations developed in this study.
Figure 75 shows this comparison. The data gathered on this project
were used to develop a regression equation with the same exponential
power of the Ns as was reported in the U.S.S.R. Monograph 20, that
is, Ns raised to two thirds power. The regression equations for the
different types of turbines developed are indicated below:
0 = 0.6374 + 0 164 N 213 (Bulb) Eq. . s
0 = 0.2036 + 0 0227 N 213 (Tubular) Eq. . s
0 = 0.4356 + 0 0026 N 213 (Cross-flow) Eq. . s
It should be noted that the plotting of Equation 19 developed by
Kpordze-Warnick for bulb turbines shows a slight deviation from
123
{92)
(93)
(94)
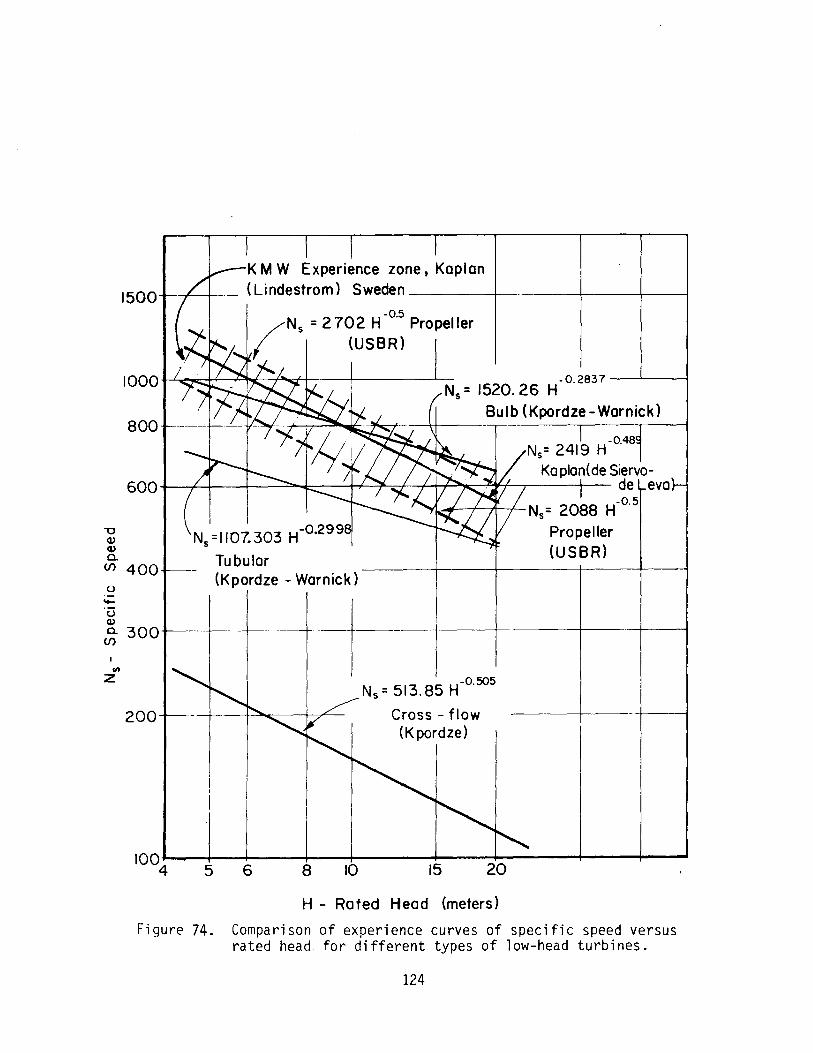
"0 Q.l Q.l a.
I 000 -f--L-.~:::-t-'----.1-~:-f~'--t---t--------'-- - 0. 283 7 ---'------l N5 = 1520.26 H
800 Bulb (Kpordze-Warnick)
-0.48 N5 = 2419 H
Ka plan(de Siervo-600+--+~--~-~~---++-~+-~~~~~-----~-- de eva
N5=1107.303 H-0
·299
.....t--+----,11---1-- Ns= 2088 H-0.5
Propeller (USSR)
(/) 400 Tubular (Kpordze -Warnick)
u -·u Q.l
a. 300 (/)
en z
200
5 6 8
----1------Ns = 513.85 H-
0.505
10
Cross- flow (Kpordze)
15 20
H - Rated Head (meters)
Figure 74. Comparison of experience curves of specific speed versus rated head for different types of low-head turbines.
124
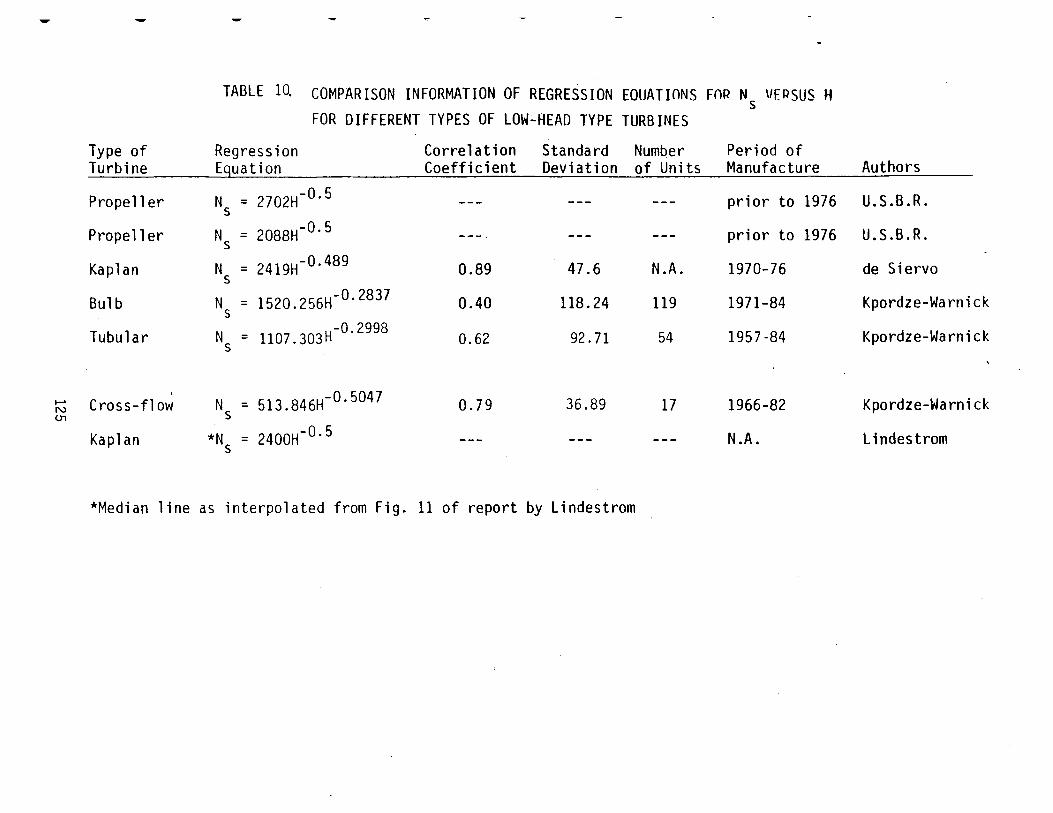
TABLE 10. COMPARISON INFORMATION OF REGRESSION EQUATIONS FOR N \/ERSUS H s FOR DIFFERENT TYPES OF LOW~HEAD TYPE TURBINES
Type of Regression Correlation Standard Number Period of Turbine Eguation Coefficient Deviation of Units Manufacture Authors
Propeller N = 2702H-0· 5 --- --- --- prior to 1976 U.S.B.R. s Propeller N = 2088H-0· 5 --- --- --- prior to 1976 U.S.B.R. s Kaplan N = 2419H-0·489
s 0.89 47.6 N.A. 1970-76 de Siervo
Bulb N = 1520.256H-0· 2837 0.40 118.24 119 1971-84 Kpordze-Warnick s Tubular N
5 = 1107.303H-0' 2998
0.62 92.71 54 1957-84 Kpordze-Warnick
' N = 513.846H- 0· 5047 1-' Cross-flow 0. 79 36.89 17 1966-82 Kpordze-Warni ck N (J1 s
Kaplan *N = 2400H-0. 5 ---s --- --- N.A. Lindestrom
*Median line as interpolated from Fig. 11 of report by Lindestrom
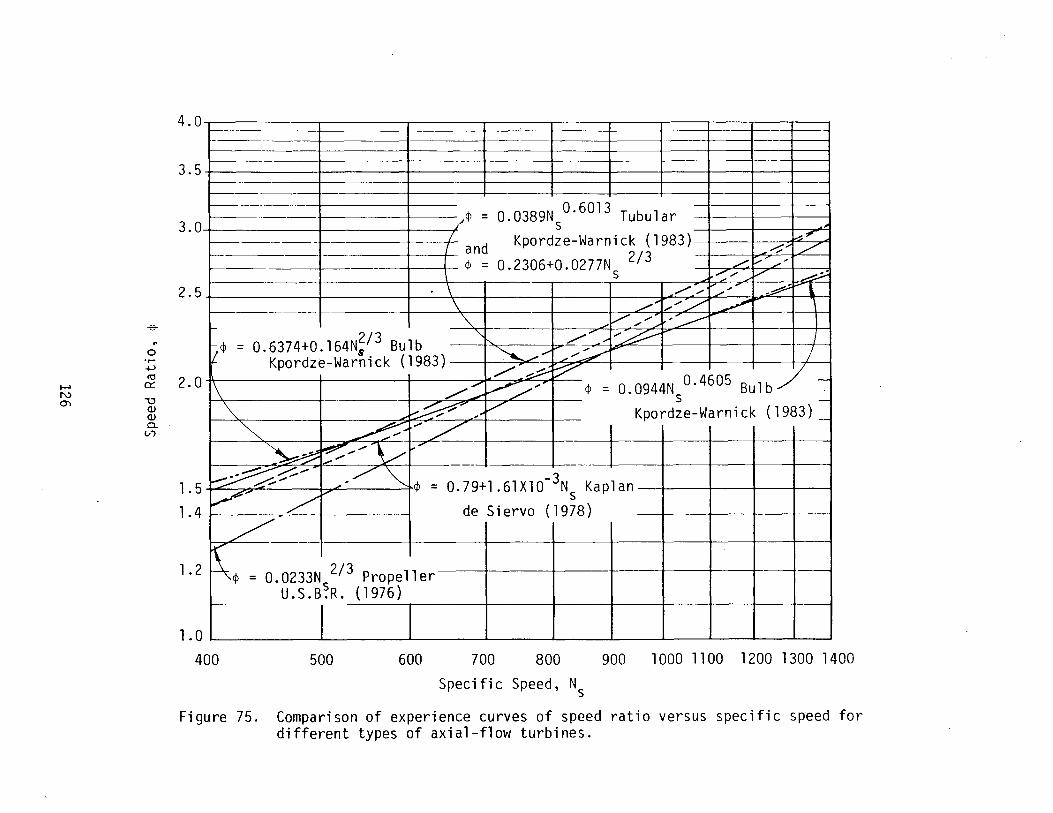
-e-~
0 •r-+-' ttl
....... 0::: I'V 0"1 " QJ
QJ c.
V>
4.0
3.5
3.0
2.5
2.0
1.5
1.4
1.2
f- ----· ----- ---
-!----··--
--
------=~ . /<P = 0.0389N °· 6013 Tubular -s , f-------- --+- d Kpordze-Warnick (1983) ~,.. f-· . --- an 2/3 ~;. / f----- <P = 0.2306+0.0277N _,....v .,/ - . s .7/ v ~
. \ / _,. _,... -~ ... \ ,--,<..-/ ~
1- "' / .,./ ~ =---~c--<P = 0.6374+0.164N;/3 Bulb -~ ,...-P/;_._ ... ;~ 1-t-
Kpordze-Warnick (1983) ~_,... L""~ /~~ / = /_:::.~/... <P = 0.0944N °· 4605
Bulb ----: ""' ~v s -~ ~: ........ ~ Kpordze-Warnick (1983)_
/1~ ± ~ -~~--- .... \......--~ -.~"/ _ .....
~~- /~ - ---v-.-? L?-- • = a. 79+1.61Xl0-3
Ns Kaplan
/ de Siervo (1978)
~- = 0.0233N 213 Propeller U.S.B~R. (1976)
~ -- r l.O
400 500 r-~~-~ 600 700 800
-- ---
900 1000 1100 1200 1300 1400
Specific Speed, N5
Figure 75. Comparison of experience curves of speed ratio versus specific speed for different types of axial-flow turbines.
Equation 92 at the two extremities of the plotted lines. The Kpordze
Warnick form of the relationship plots as a straight line on logarith
mic paper and has Ns raised to the exponential power value of 0.4605.
The correlation coefficient is slightly better for the Kpordze-Warnick
form than with the Ns raised to the two-thirds power. There is
essentially the same margin of error in the two forms of the equation
as indicated by the values of the standard deviation found in the
development of the two equations.
The plotting of Equation 38 developed by Kpordze-Warnick for tubu
lar turbine and the Equation 93 utilizing Ns raised to the two thirds
power for tubular turbine are so nearly the same it is not possible to
distinguish between the two lines on the scale shown in Figure 75.
Brief trial comparisons of using these different experience curves
shown in Figure 75 would indicate that in the middle range of situa
tions calling for turbine selection for Ns in the range from 700 to
900, reasonably similar results can be expected using de Siervo empiri
cal relations, the U.S.B.R. empirical equation for propeller units, and
the empirical equations for bulb turbine units developed in this study.
In ranges of Ns values outside the range 700 to 900 traditional
empirical equations should not give good results.
An additional comparison was made of the regression analysis
involving the plant sigma, a, and the specific speed, Ns. Figure 76
gives the comparison that includes a versus Ns for bulb turbines, a
versus Ns for tubular turbines and a reproduction of a KMW relation
between a versus Ns for all turbines manufactured by that company,
Lindestrom (no date). Plotted on Figure 76 is the empirical equation
for a versus Ns as taken from U.S. Bureau of Reclamation Monograph
20 (1976).
127
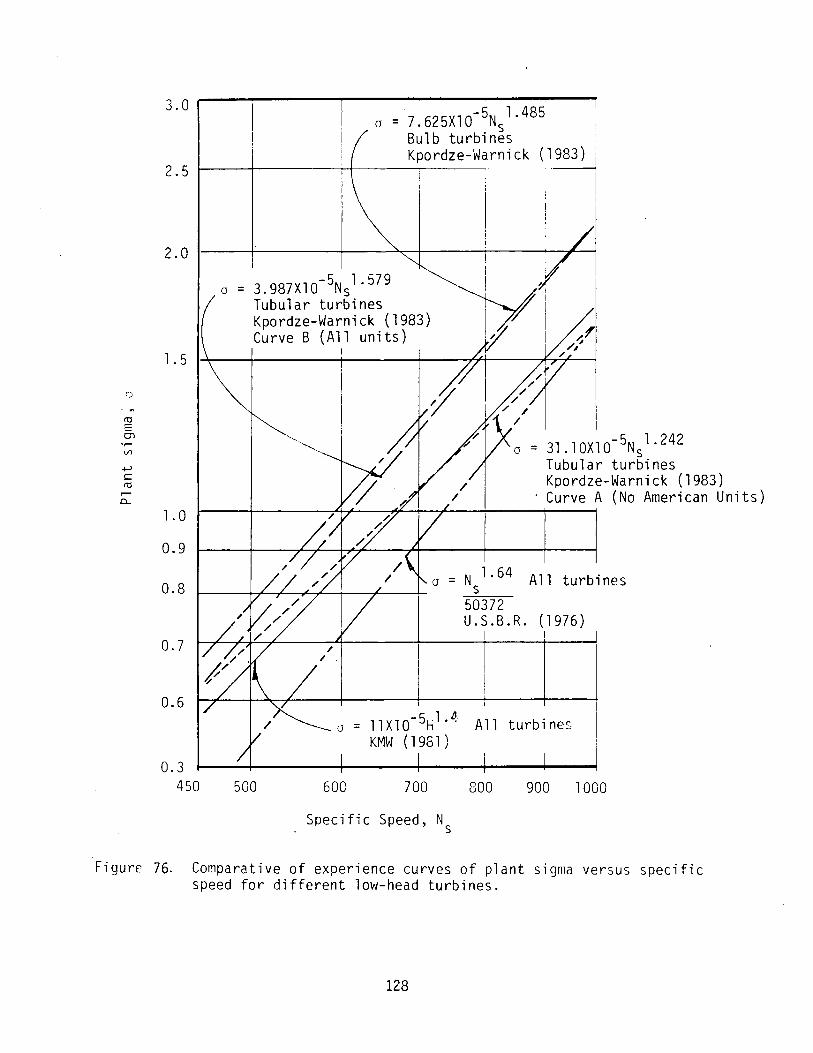
3.0
2.5
2.0
0
1.5
")
cu E 01 ...... l/1
+-' s::: cu
0...
1.0
0.9
0.8
0.7
0.6
0.3 450
=
o = 7.625Xl0- 5Ns 1· 485
Bulb turbines Kpordze-Warnick (1983)
3.987Xl0- 5Ns1 · 579
Tubular turbines Kpordze-Warnick (1983) Curve B (All units)
31. lOXl0- 5Ns 1· 242
Tubular turbines Kpordze-Warnick (1983)
· Curve A (No American Units)
= N 1· 64 All turbines s 50372 U.S.B.R. (1976)
I
= 11 X 1 0- 5h l . ~ All turbines KMW ( 1981 )
500 600 700 800 900 1000
Specific Speed, N s
Figurf 76. Comparative of experience curves of plant sigma versus specific speed for different low-head turbines.
128
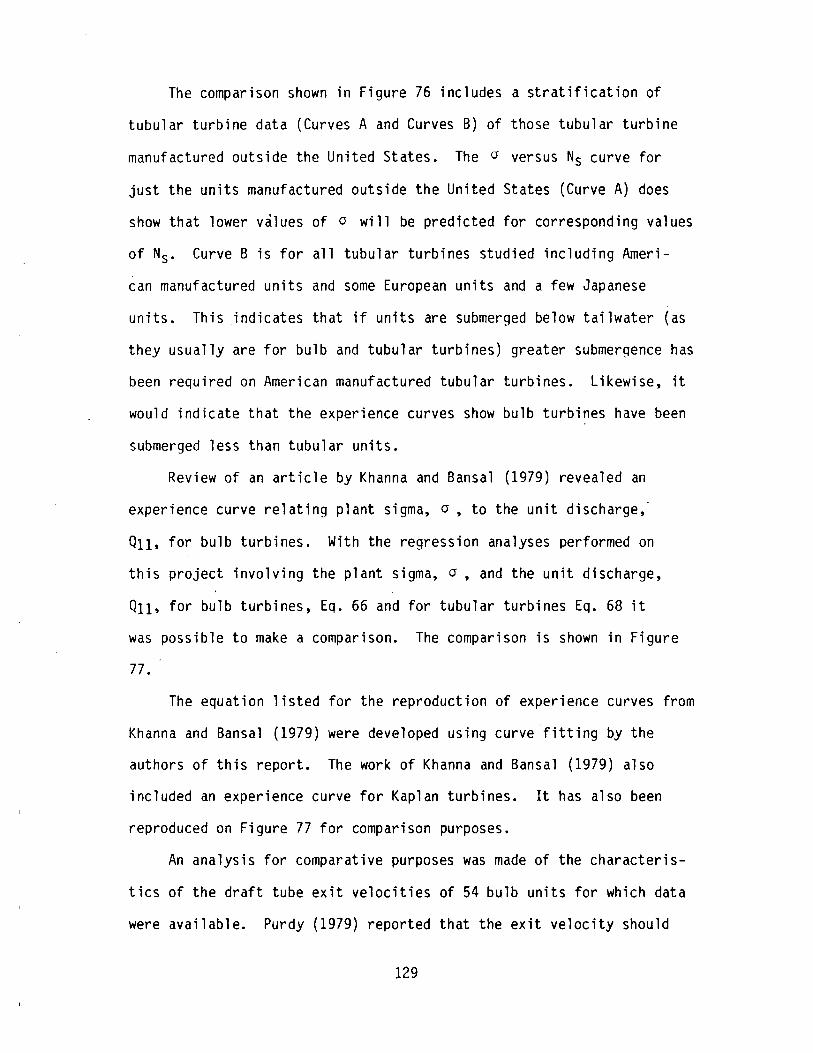
The comparison shown in Figure 76 includes a stratification of
tubular turbine data (Curves A and Curves B) of those tubular turbine
manufactured outside the United States. The o versus Ns curve for
just the units manufactured outside the United States (Curve A) does
show that lower values of 0 will be predicted for corresponding values
of Ns. Curve B is for all tubular turbines studied including Ameri
can manufactured units and some European units and a few Japanese
units. This indicates that if units are submerged below tailwater (as
they usually are for bulb and tubular turbines) greater submergence has
been required on American manufactured tubular turbines. Likewise, it
would indicate that the experience curves show bulb turbines have been
submerged less than tubular units.
Review of an article by Khanna and Bansal (1979) revealed an
experience curve relating plant sigma, o, to the unit discharge,·
Q11, for bulb turbines. With the regression analyses performed on
this project involving the plant sigma, o, and the unit discharge,
Q11, for bulb turbines, Eq. 66 and for tubular turbines Eq. 68 it
was possible to make a comparison. The comparison is shown in Figure
77.
The equation listed for the reproduction of experience curves from
Khanna and Bansal (1979) were developed using curve fitting by the
authors of this report. The work of Khanna and Bansal (1979) also
included an experience curve for Kaplan turbines. It has also been
reproduced on Figure 77 for comparison purposes.
An analysis for comparative purposes was made of the characteris
tics of the draft tube exit velocities of 54 bulb units for which data
were available. Purdy (1979) reported that the exit velocity should
129
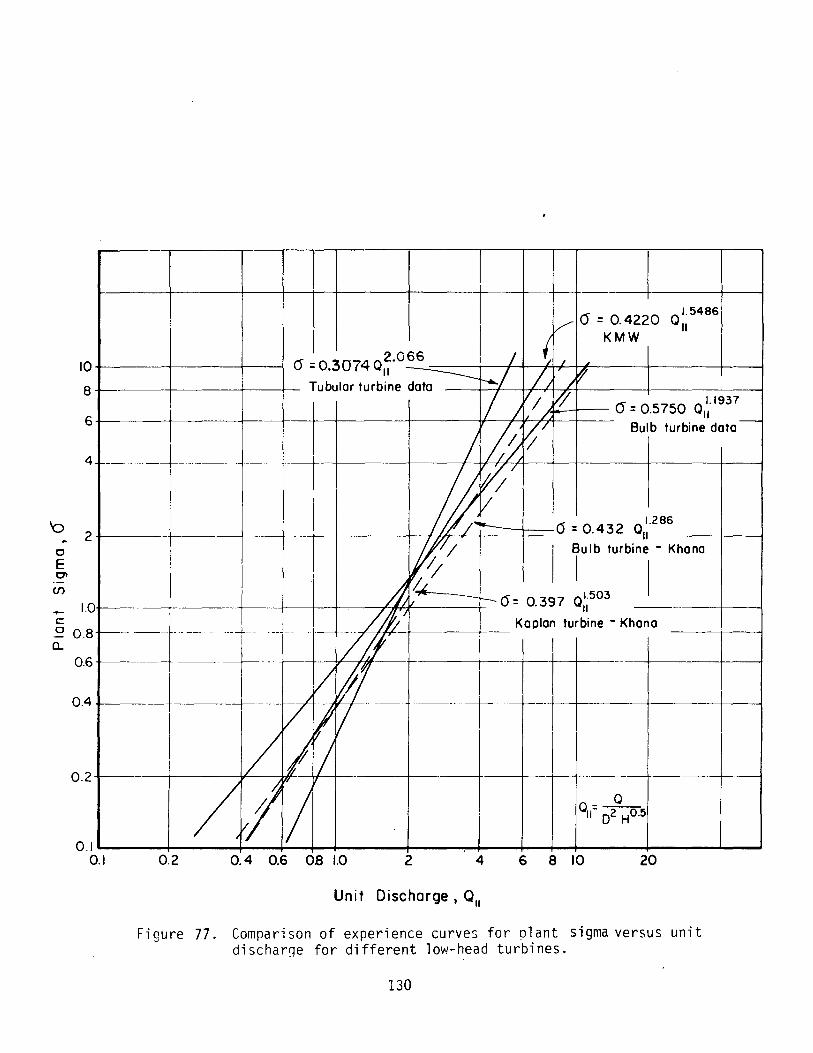
'o
0
E 0' ·-(/)
+-c 0
a..
10
8
6
4
2
---- --+- ----- -- ·--·-
I I
6 = 0.3074 0~'066------Tubular turbine data
1---1--- -·-f---- -
!A If/ /
/'..(_
-- --
v 6 = 0.4220 01.5486
II
{ KMW
I I ~
~I /; / b?
I / // w <J = o.575o o/i 1937 /: CJ: ~/ Bulb turbine data-
y} -~c--/ .._ c = o.432 o,:-286 --
I Bulb turbine - Khana
I 1.0
I ~ - 6 = o. 397 o:j503 ----~ -- -t--- -/It/ ----
=~~=r-~~ Kaplan turbine - Khana
0.8
0.6
0.4
0.2
0.1 0.1
71!' --
r-- -- -
JJ 1------ --vv ~L __ ·---------f-- 0 ---1----
1/// - ------
/ v/ 'I'
I 0 Q---11- 02 H0.5
0.2 0.4 0.6 OB 1.0 2 4 6 8 10 20
Unit Discharge, Q11
Figure 77. Comparison of experience curves for plant sigmaversus unit discharge for different low-head turbines.
130
not exceed 0.8 IRifor rated heads, H, of low-head turbines up to 17m.
Table 11 shows how exit velocity compares with the value of 0.8 IH for
each turbine. The recommendation of Purdy was based on the fact that
if higher velocities were permitted considerable power was lost but not
often considered in the real overall performance. This comparison
shows that many of the manufactured turbines have exit velocities that
exceed the Purdy recommendations.
To assess the difference that might be expected in using different
methods of estimating turbine diameter and turbine speed a comparative
study was made of eight hydro power plants that had data on rated head,
rated discharge, and rated power output. The data on the eight plants
also included the actual manufactured diameter and actual turbine speed
used at each plant. Five different methods were used in the assess
ment: (1) using the traditional approach as presented in U.S. Bureau of
Reclamation Monograph No. 20 for propeller turbines, (2) using the
regression equations developed by de Siervo and de Leva (1977 and 1978)
for Kaplan turbines, (3) using the nomograph from Lindestrom (no date),
(4) using the regression equation developed in the special study of KMW
manufactured units, and (5) using the regression relations developed in
this study using all the bulb turbines. Sample calculations showing
how the comparative numerical values for turbine diameter, D, and tur
bine speed, N, were obtained are presented in the Appendix 2. Table 12
presents the results of the assessment.
The results would indicate that the simplified selection procedures
suggested by the authors of this report have several advantages. The
procedures are simple and require only two parameters, rated head and
rated power, that are normally available early in feasibility studies.
A review and comparison of the correlation coefficients of the various
131
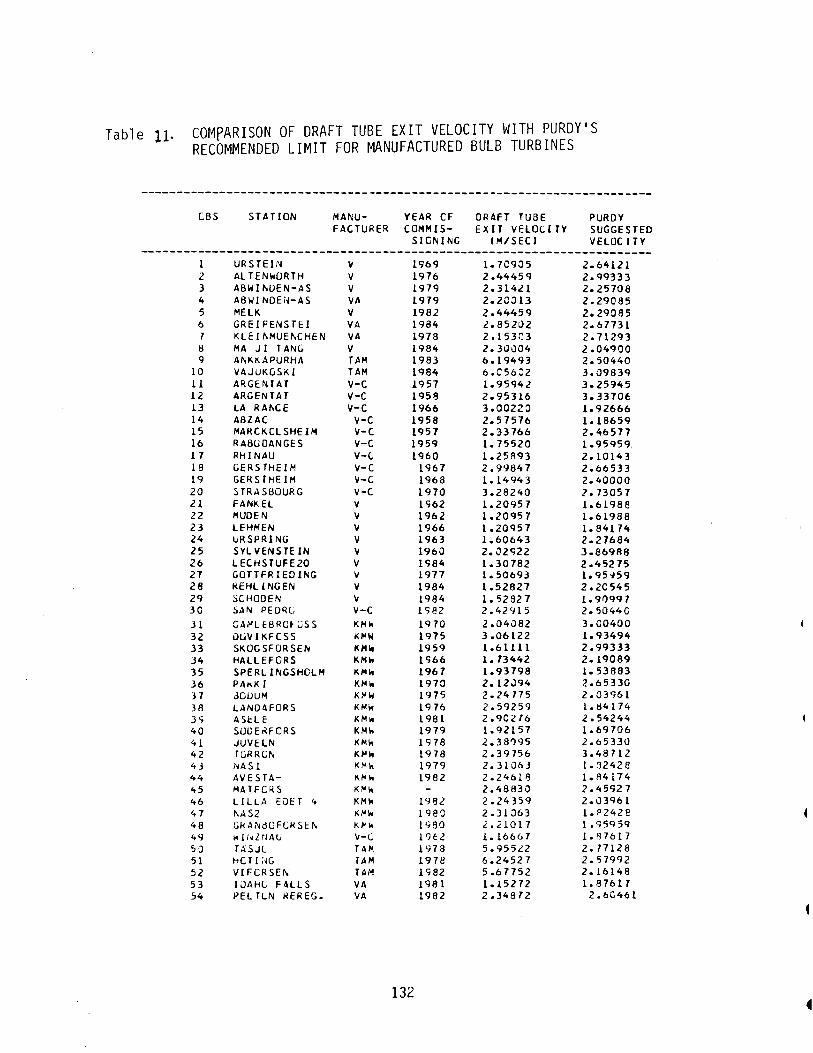
Table ll· COMpARISON OF DRAFT TUBE EXIT VELOCITY WITH PURDY'S RECOMMENDED LIMIT FOR r~NUFACTURED BULB TURBINES
CBS
1 2 3 4 5 6 7 !l 9
10 11 12 13 14 15 16 17 18 19 20 2l 22 23 24 25 26 27 28 29 30 31 32 33 J4 35 36 J1 38 3'7 40 41 42 43 44 45 46 47 48 49 5J 51 52 53 54
STATION
URSTEIN Al TEN wORTH ABWI~OEN-AS
ABWI NDEi~-AS MELK GREIFENSTEI Kl E 11\MUH.CHE N MA J I TANG ANKKAPURHA VAJUKGSKI ARGENT AT ARGENT AT LA RA~CE
ABZAC MARCKCLSHEIM RABUOANGES RHINAU GERSTHEIM GERS THF. IM STRASBOURG FANKEL MUDEN LEHMEN URSPRING SYLVENSTE IN LECHSTUFE20 GOTTFRIEOIII;G kEHllNGEN SCHOO EN SAN PEDRC GAo'olL EBRCt- GSS uUV I KFCSS SKOGSFORSEN HALLEFORS SPERL INGSHOUI PAKKI dGOUM LANOAFORS ASHE SOOEKFORS JUVELN TGRRG~
NASI AVESTAMATFCRS LILLA EuET 4 1\A$2 GkA,'IjtJUFCRSE:I\ wl/.ZrJAL TASJL hCT I :-1G VIFCRSEr\ IJAHC F"LLS PELTLN ~EREG.
MANU- YEAR CF FACTURER COMMIS
SIGNING
v v v VA v VA VA v TAM TAM v-c v-c v-c v-c v-c v-c v-c. v-c v-c v-c v v v v v v v v v v-c KMioo K(IIW KMie KMioo KM\o KMio KI"W KMioi KM~~o
KMioo KMW K,..w KMioo KM\oo
Kl"loo KMW J(o\ollo K/olloo v-c TAl" TAM TAM VA VA
1969 1976 1979 1979 1982 1984 1978 1984 1983 1984 1957 1958 1966 1958 1957 1959 1960
132
1967 1968 1970 1S62 1962 1966 1963 1960 1<;84 1977 1984 1984 1<;82 1HO 1975 1959 1<;66 196 7 1970 1975 19 76 1981 1979 1978 1978 1979 1982
1982 198() 1'180 1'JU 1978 1978 1982 1981 1982
DRAFT TUBE EXIT VELOCITY
lM/SECI
1. 7C905 2.44459 2.314~1
2.20013 2.44459 2..852u2 2.153~3
2.3u004 6.19493 6.C56::2 1.95942 2.95316 3.00220 2.57576 2. 33766 1.75520 1.25893 2.99847 1.14943 3.28240 1.20957 1.20957 1.20957 1.60643 2.02<;22 1.30782 1.50693 1.52827 1.52927 2.42915 2.04082 3.06122 1.61111 1. 73442 1.93798 2.12J94 2.24775 2.59259 2.90276 1.92157 2.381)95 2.39756 2.3101>3 2.24618 2.48830 2.24359 2.31063 .2.21017 1.16667 5.955£2 6.24527 5.67752 1.15272 2.34872
PURDY SUGGESTED VELOCITY
2.64121 2.<1<1333 2.25708 2.29085 2.29085 2.67731 2.71293 2.04900 2.50440 3.09839 3.25945 3.3370t 1.92666 1.18659 2. 46577 1.95959. 2.10143 2.66533 2.40000 2. 73057 1.6l98e 1.61988 1.84174 2.27684 ).86988 2.452 75 1.95~59 2.2C545 1.91)997 2.5044G 3.00400 1.93494 2.99333 2.19089 1.53883 2.65330 2.03961 1.1!4174 2.54244 1.69706 2.65330 3.48712 1.32428 1.84174 2.45927 2.03<161 1.P2428 1.95<159 1.137617 2. 77128 2.57992 2.16148 1.87617 2.6C46l
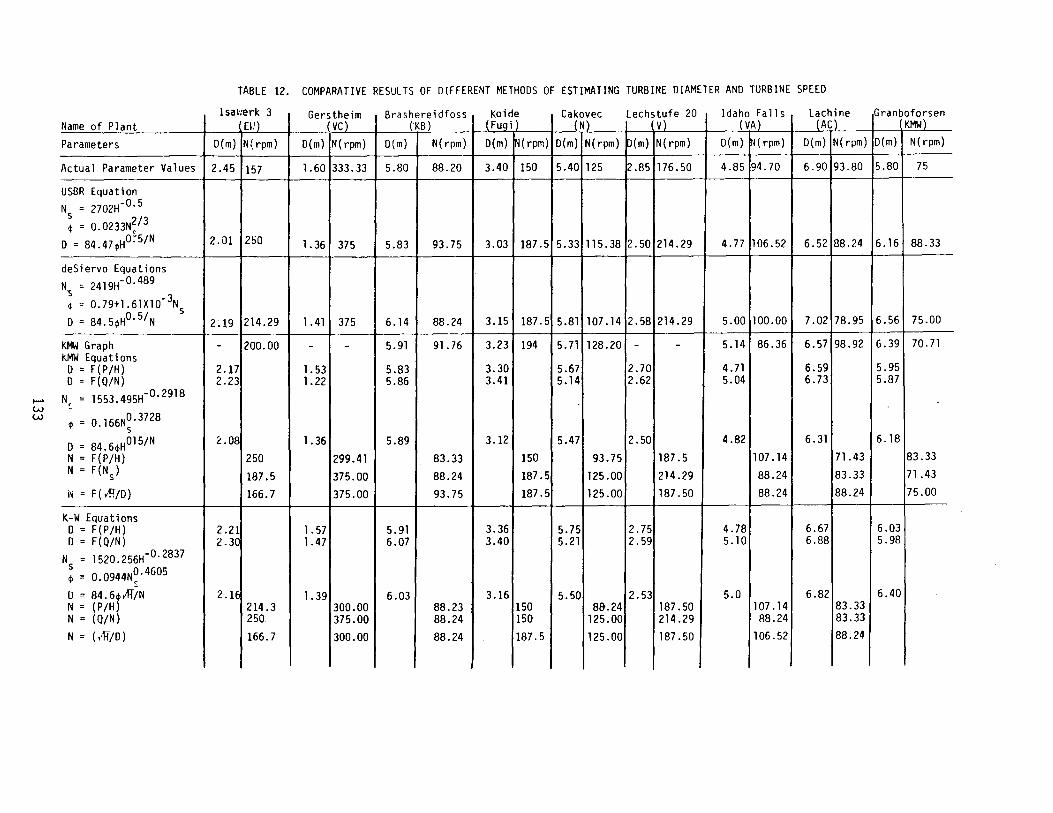
...... w w
Name of Plant
Parameters
Actual Parameter Values
USBR Equation N = 2702H-O.S s <1> = 0.0233N~/J
D = 84.47<t>HO:S/N
deSiervo Equations N = 2419H- 0·489 ~ -3 ~ = 0.79+1.61Xl0 Ns D = 84.5<t>HO.S/N
KMW Graph KMW Equations D = F(P/H) D = F(Q/N)
N = 1553 495H-0· 2918 ~- . <I>= 0.166N0.3728
s D = 84.6<t>HOlS/N N = F{P/H) N = F(N ) s N = F ( v'H/D)
K-W Equations D = F(P/H) D = F{Q/N)
N = 1520.256H-0· 2837 s ~ = 0.0944N~· 4605
U = 84.6),;H"fN N = {P/H N = (Q/N) N = (,·'R/D)
TABLE 12. COMPARATIVE RESULTS OF DIFFERENT METHODS OF ESTIMATING TURBINE DIAMETER AND TURBINE SPEED
llt!' (~c)'"' U~>
(F~~i) ~ 1-U: .... IIIIIt:'
El!) ,., .... , (N) v> ' .. (AC) KMW) lsawerk 3 G h . Brashereidf Koid Cak Lechstufe 20 Idaho Fall Lach· Granbof
D(m) N(rpm) D(m) N(rpm) D(m) N(rpm) D(m) ~(rpm) D(m) N(rpm) ~(m) N(rpm) D(m) ~(rpm) D(m) N(rpm) D(m) N(rpm)
2.45 157 1.60 333.33 5.80 88.20 3.40 150 5.40 125 12.85 176.50 4.85 94.70 6.90 93.80 5.80 75
2.01 2!i0 l. 36 375 5.83 93.75 3.03 187.5 5.33 115.38 2.50 214.29 4. 77 106.52 6.52 88.24 6.16 88.33
2:19 214.29 l. 41 375 6.14 88.24 3.15 187.5 5.81 107.14 2.58 214.29 5.00 100.00 7.02 78.95 6.56 75.00
- 200.00 - - 5.91 91.76 3.23 194 5.71 128.20 - - 5.14 86.36 6.57 98.92 6.39 70.71
2.17 1. 53 5.83 3.30 5.67 2.70 4.71 6.59 5.95 2.23 1.22 5.86 3.41 5.14 2.62 5.04 6.73 5.87
2.08 1.36 5.89 3.12 5.47 2.50 4.82 6.31 6.18
250 299.41 83.33 150 93.75 187.5 107.14 71.43 83.33
187.5 375.00 88.24 187.5 125.00 214.29 88.24 83.33 71 .43
166.7 375.00 93.75 187.5 125.00 187.50 88.24 88.24 75.00
2.21 l. 57 5.91 3.36 5.75 2.75 4.78 6.67 6.03 2.30 1.47 6.07 3.40 5.21 2.59 5.10 6.88 5.98
2.16 1.39 6.03 3.16 5.50 2.53 5.0 6.82 6.40 214.3 300.00 88.23 150 89.24 187.50 107.14 83.33 250. 375.00 88.24 150 125.00 214.29 88.24 83.33
166.7 300.00 88.24 187.5 125.00 187.50 106.52 88.24
regression equations used in the selection prodecures is revealing.
Table 13 shows the various regression relations used and the value of
the correlation coefficient for each relation for the various different
kinds of low-head turbines. This shows that for the functions
involving D = F(P/H), and N = F(IHI) the regression correlation D
coefficients are higher than the functions involving Ns and 0. The
author's suggested approach to estimation of turbine diameter and tur-
bine speed appears to give greater accuracy and consistency.
CONCLUSIONS AND RECOMMENDATIONS
This study of experience curves has collected data on rated head,
rated discharge, rated power output, turbine speed, and turbine dia-
meter on more than 300 manufactured low-head turbines produced through-
out the world since 1953. Additional information on turbine water
passage dimensions and on particular characteristic sizes of turbine
intakes and draft tube exits has been compiled. The data have been
subjected to an intensive mathematical analysis by regression techni-
ques in an attempt to develop useful predictive methods for feasibility
and preliminary design purposes. The following conclusions are made.
The information on rated head, rated discharge, rated power out
put, turbine speed and turbine diameter along with water passage dimen
sions has been catalogued in a convenient computer format (see Appendix
3). The catalogue in itself should be a valuable reference from which
comparisons could be made when choosing preliminary features of turbine
installations for a new hydro power sites.
A comprehensive collection of experience curves for the conven-
tional turbine constants and turbine selection approaches has been
developed for bulb turbines, tubular turbines and cross-flow turbines.
134
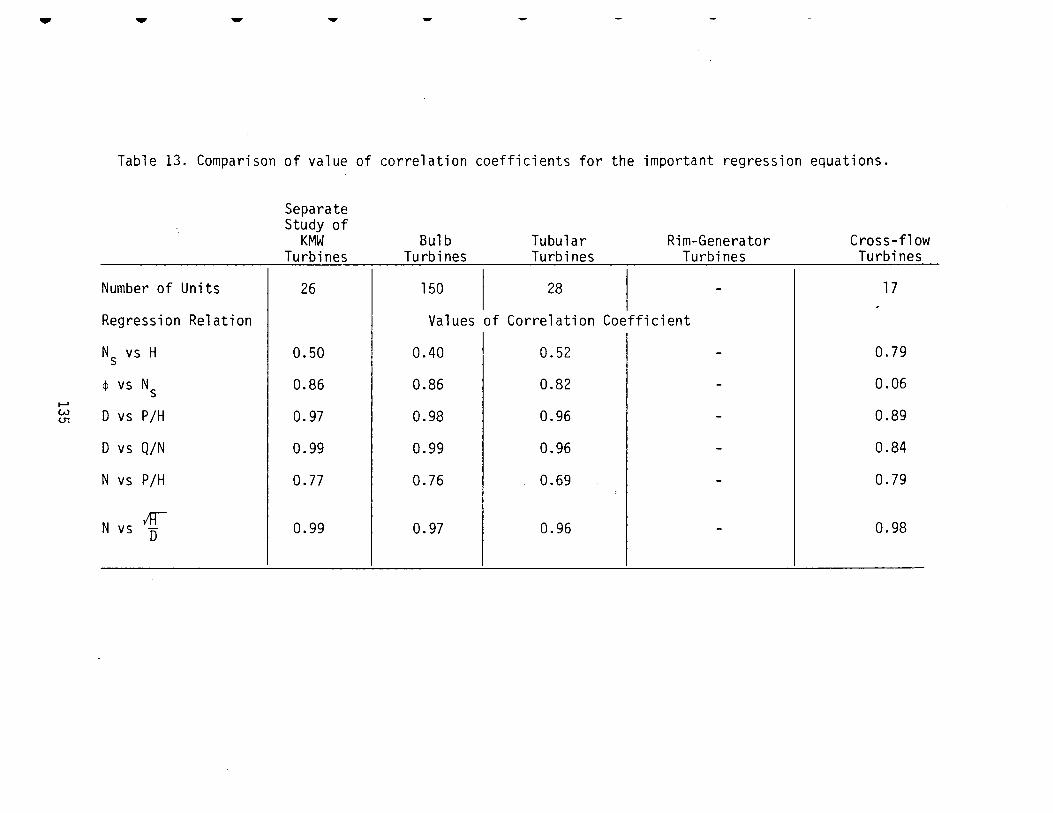
-
....... w U1
- - ....
Table 13. Comparison of value of correlation coefficients for the important regression equations.
Number of Units
Regression Relation
Ns vs H
¢ VS NS
D vs P/H
D vs Q/N
N vs P/H
N vs Ar o
Separate Study of
KMW Turbines
26
0.50
0.86
0.97
0.99
0. 77
0.99
Bulb Turbines
150
Tubular Turbines
28
Rim-Generator Turbines
-
Values of Correlation Coefficient
0.40 0.52 -
0.86 0.82 -
0.98 0.96 -
0.99 0.96 -
0.76 0.69 -
0.97 0.96 -
Cross-flow Turbines
17 ,
0.79
0.06
0.89
0.84
0.79
0.98
The experience curves have been developed using conventional hydro
power terms and turbine constants that have been applied to Kaplan tur
bines, Francis turbines and Pelton turbines of the impulse type. The
results have been presented in easy-to-use equation form and are also
presented graphically to show the scatter of the data in the various
relations that were developed.
The results of the study of cavitation characteristics of low-head
turbines using the relation between plant sigma, a, and specific
speed, Ns, did not show as good a correlation as expected. There is
considerable variation in the relation between plant sigma and specific
speed from company to company and the correlation coefficients of the
regression are not very high. Caution should be used in applying the
experience curves of plant sigma versus specific speed developed in
this study. Because the use of this cavitation coefficient in turbine
setting elevation determination is highly dependent on cost of excava
tion for the draft tube this becomes a difficult item to make authori
tative guidelines for preliminary design purposes.
The results of the study of dimensions of water passage, and their
relation to turbine diameter are reasonably good for the bulb turbines.
Insufficient data were obtained on tubular turbines to make regression
analysis of relations between turbine diameter and water passage dimen
sions. However, the latest recommendation of manufacturers with regard
to sizing water passages has been catalogued and presented in a useful
form for tubular turbines.
A significant and very simplified procedure for estimating turbine
runner diameter and turbine speed has been developed. This new proced
ure was tested and compared with the procedure presented in the
136
U.S.B.R. Monograph No. 20 and with other approaches. Results of the
comparison shown in Table 12 indicates that the new simplified proce-
dures give more consistent estimates of turbine diameter and speed than
other methods and are easier to apply using data that are readily
available early in the planning stage of a hydropower investigation. A
careful documentation of steps in the selection process for estimation
of turbine diameter and turbine speed has been presented in sample cal-
culations shown in Appendix 2.
Because these regression equations developed in this study are
from a much larger sampling of manufactured units that was used in
development of the empirical equations in U.S.B.R. Monograph No. 20 and I
because the study is for specific types of low-head turbines, the
empirical equations developed in this study should be relied on more
than using the older more traditional equations. It should always be
remembered that final design and confirmation of size of runner and
runner speed should be worked out with the individual manufacturers and
the· estimation developed from experience curves should be used as a
check on manufacturers recommendations.
In general good response from turbine manufacturers was obtained
but no data were obtained from Chinese and Indian manufacturers and
only limited data were obtained from Japanese firms.
Recommendations
The writers recommend that this information be incorporated in a
revised edition of the U.S. Bureau of Reclamation Monograph No. 20. To
make Monograph No. 20 most useful, the data on more conventional tur-
bines such as Pelton turbines, Frances turbines and vertical Kalpan
turbines should be updated and subjected to the same type of regression
analysis as was done in this study of low-head type turbines.
137
If desirable a nomograph for easy selection of each type of low
head turbine could be developed similar to that given in the work of
Lindestrom (no date). This nomograph could include further development
of the turbine setting restraint as limited by the plant sigma. A
recommendation here would be to develop some kind of standardized safe
ty factor that could be agreed to by a team of authorities. The result
could be developed as a family of curves of suction head superimposed
on an experience curve for selecting diameters given rated head and
rated power output. It is recommended that more careful appraisal be
made of the exit velocity from draft tubes in manufactured units of low
head turbines to see if reductions in velocities could improve future
hydropower installations.
The new procedures developed for estimating of turbine runner dia
meter and runner speed are recommended for use in preliminary design
and feasibility studies for low-head turbines because of the simplicity
and the evidence presented in this report of giving consistent results
when compared with other more involved procedures.
138
REFERENCES
Anderberg, M.R. Cluster Analysis for Applications, Academic Press, New York, N.Y. 1973.
Allis Chalmers, 11 Standard Definitions and Nomenclature- Hydraulic Turbines and Pump/Turbines ... Allis-Chalmers Corporation, HydroTurbine Division, 54X10084-01 York, PA., (no date).
Barr, D.I.H., 11 Similarity Criteria for Turbo-Machines, .. Water Power and Dam Construction, Vol. 18, No. 11, 1966.
Barrows, H.K. Water Power Engineering, New York: McGraw-Hill Book Co., 1927.
Cotillon, J., 11 Advantages of Bulb Units for Low-Head Developments, .. Vol. 29, No. 1, 1977.
Cotillon, J., 11 Bulb Turbines, .. Water Power and Dam Construction, Vol. 31, No. 3, 1979.
Cotillon, J., 11 World's Bulb Turbines, .. Water Power and Dam Construction, Vol. 33, No. 9, 1981.
Csanady, G.T., Theory of Turbomachines, New York: McGraw-Hill Book Co., 1964.
Davis, J.C. Statistics and Data Analysis in Geology, John Wiley & Sons, Inc., New York, N.Y., 1973.
de Siervo, F. and F. de Leva, 11 Modern Trends in Selecting and Designing Francis Turbines, .. Water Power and Dam Construction, Vol. 28, No. 3, 1976.
de Siervo, F. and F. de Leva, 11 Modern Trends in Selecting and Designing Kaplan Turbines, .. Water Power and Dam Construction, Vol. 29, No. 12, 1977, and Vol. 30, No. 1, 1978.
de Siervo, F. and A. Lugaresi, 11 Modern Trend in Selecting and Designing Pelton Turbines 11 Water Power and Dam Construction, Vol. 30, No. 12' 1978.
Doland, J.J., Hydro-Power Engineering, New York: The Ronald Press Co. ,1954.
Khanna, J.K. and S.C. Bansal, 11 Cavitation Characteristics and Setting Criteria for Bulb Turbines, .. Water Power and Dam Construction, Vol. 31, No. 5, 1979.
Kpordze, C.S.K., .. Experience Curves for Feasibility Studies and Planning of Modern Low-Head Hydro Turbines, .. M.S. Thesis, Civil Engineering Department, University of Idaho, Moscow, Idaho, 1982.
139
REFERENCES {continued)
Lindestrom, L.E., 11 Review of Modern Hydraulic Turbines and Their Application in Different Power Projects, AB KMW, Kristineham, Sweden, (No Date).
Pindyck, R. and Rubinfeld, D. 11 Econometric Models and Economic Forecasts. 11 Second Edition, New York: McGraw Hill Book Company, 1981.
Purdy, C.C., 11 Energy Losses at Draft Tube Exits and in Penstocks, 11
Water Power and Dam Construction, Vol. 31, No. 10, 1979.
Spiegel, M.R., Theory and Problems of Statistics, Schuam•s Outline Series, McGraw-Hill Book Co., New York, N.Y., 1961.
U.S. Bureau of Reclamation, 11 Selecting Hydraulic Reaction Turbines, 11
Engineering Monograph No. 20, U.S. Department of the Interior, 1976.
Warnick, C.C., Hydropower Engineering, Englewood Cliffs, N.J., Prentice Hall, Inc. (In Press).
140
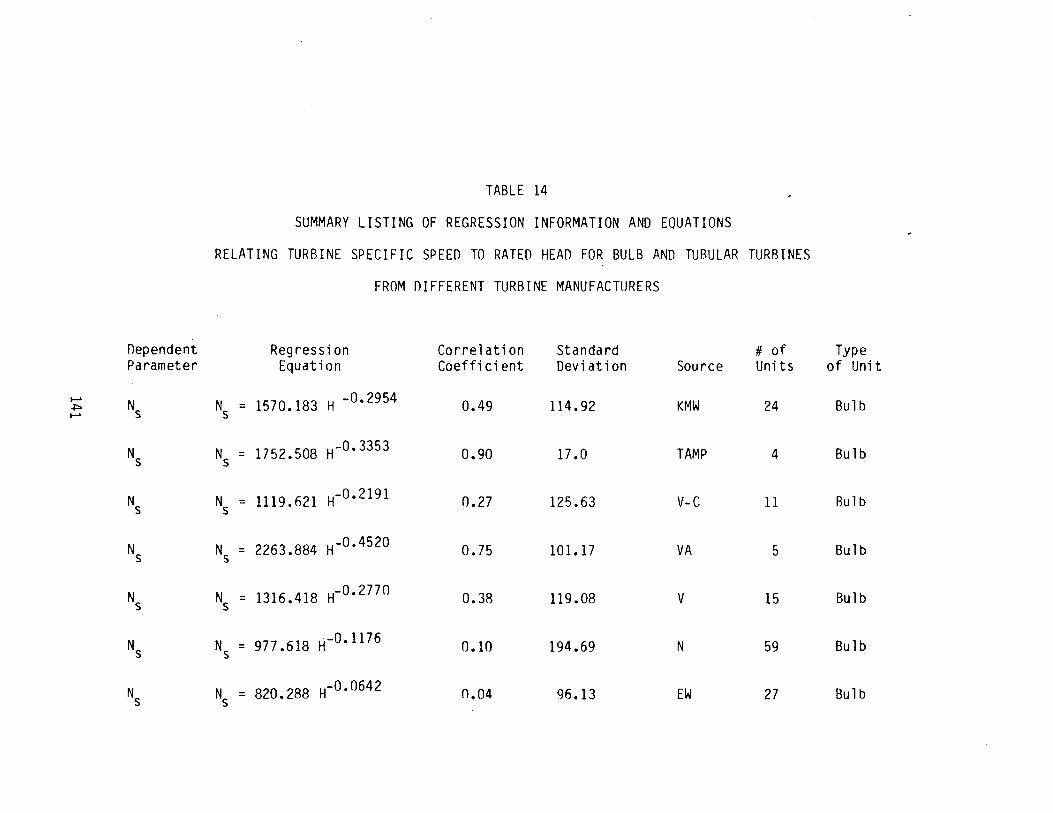
11ependent Parameter
...... Ns -+::> ......
Ns
Ns
Ns
Ns
Ns
Ns
TABLE 14
SUMMARY LISTING OF REGRESSION INFORMATION AND EQUATIONS
RELATING TURBINE SPECIFIC SPEED TO RATEO HEAD FOR BULB AND TUBULAR TURBINES
FROM niFFERENT TURBINE MANUFACTURERS
Regression Correlation Standard # of Equation Coefficient Deviation Source Units
N = 1570 183 H -0· 2954 s • 0.49 114.92 KMW 24
Ns = 1752.508 H-0•3353 0.90 17.0 TAMP 4
N = 1119 n21 H-0•2191 s • 0.27 125.63 V-C 11
Ns = 2263.884 H-0•4520 0.75 101.17 VA 5
Ns = 1316.418 H- 0•2770 0.38 119.08 v 15
Ns = 977.618 H-0•1176 0.10 194.69 N 59
N = 820.288 H-0•0642 s 0.04 96.13 EW 27
Type of Unit
Bulb
Bulb
Bulb
Bulb
Bulb
Bulb
Bulb
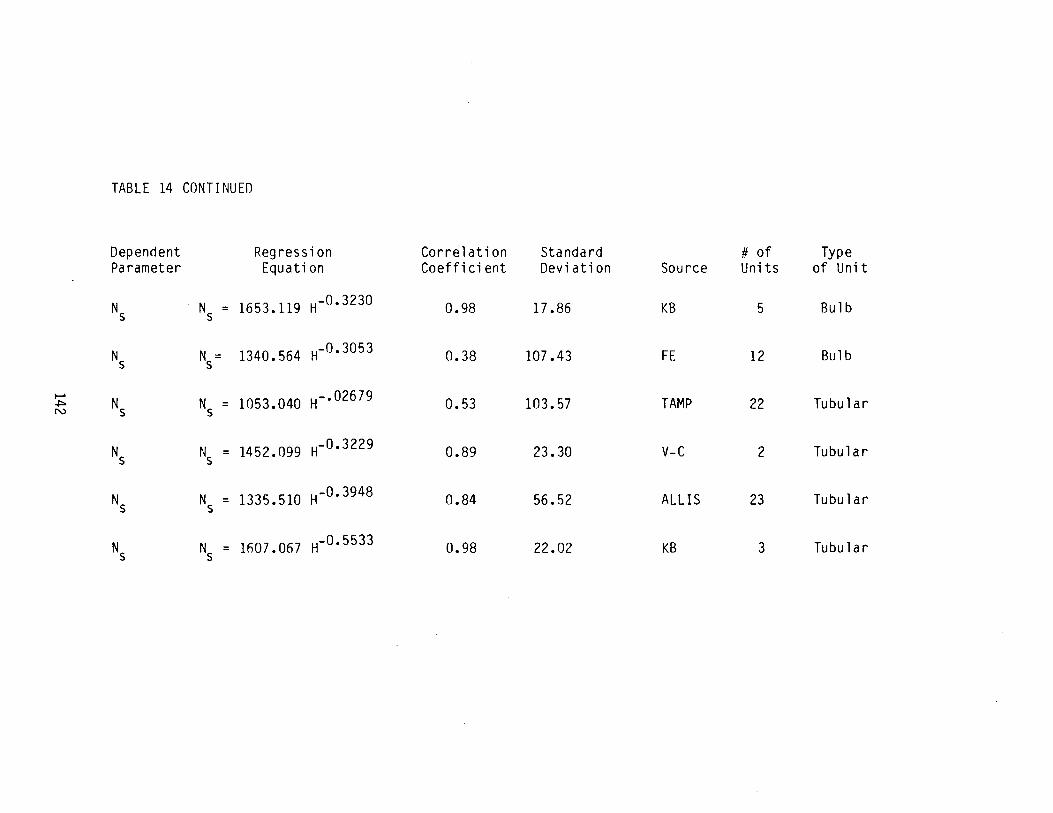
TABLE 14 CONTINUED
Dependent Regression Correlation Standard # of Type Parameter Equation Coefficient Deviation Source Units of Unit
Ns N = 1653.119 H- 0•3230 s 0.98 17.86 KB 5 Bulb
Ns N = s 1340.564 H- 0•3053 0.38 107.43 FE 12 Bulb
~
Ns N = 1053.040 H-· 02679 0.53 103.57 TAMP 22 Tubular +=-N s
Ns N = 1452.099 H- 0•3229 s 0.89 23.30 V-C 2 Tubular
Ns N = 1335.510 H-0•3948 s 0.84 56.52 ALLIS 23 Tubular
Ns N = lo07.067 H- 0•5533 s 0.98 22.02 KB 3 Tubular
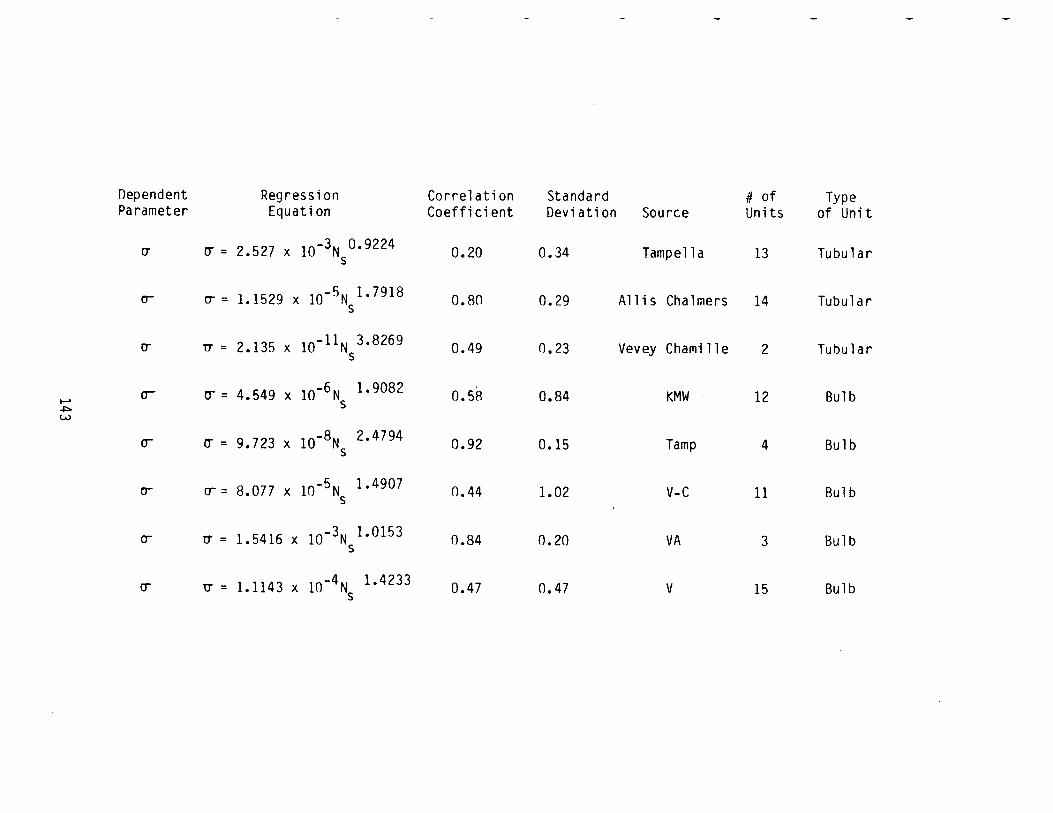
Dependent Regression Correlation Standard # of Type Parameter Equation Coefficient Deviation Source Units of Unit
0" ~ = 2.527 X 10⁻³N °· 9224 0.20 0.34 Tampella 13 Tubular s
cr ~ = 1.1529 X 10-SN 1•7918 0.80 0.29 Allis Chalmers 14 Tubular s
~ ~ = 2.135 X 10⁻¹¹N 3.8269 . s 0.49 0.23 Vevey Chami 11 e 2 Tubular
() ~ = 4.549 X 10⁻⁶N 1•9082 0.58 0.84 KMW 12 Bulb ...... s ~ w
(} ~ = 9.723 X 10⁻⁸N 2•4794 0.92 0.15 Tamp 4 Bulb s
cr cr= 8.077 X 10⁻⁵Ns 1.4907 0.44 1.02 V-C 11 Bulb
(j 0" = 1.5416 X 10⁻³N 1•0153 s 0.84 0.20 VA 3 Bulb
(j U = 1.1143 X 10⁻⁴N5
1.4233 0.47 0.47 v 15 Bulb
APPENDIX 1
SAMPLE CALCULATIONS FOR TURBINE CONSTANTS CONVERSIONS
A series of sample calculations are presented using actual data
from the Rock Island power plant on the Columbia River. Different
forms of turbine constants are used in both the American system of
units and also the metric system of units. This is presented in case
engineers desire to use different forms of the turbine constants and
desire to work in different weasurement units.
144
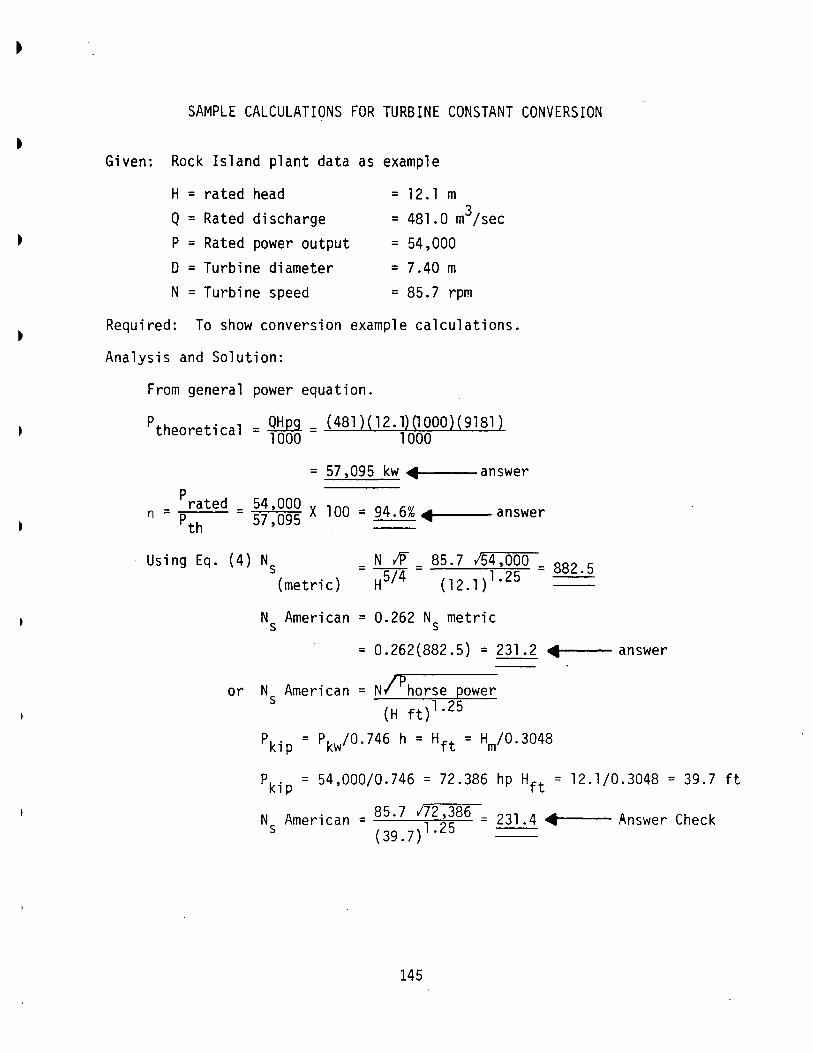
SAMPLE CALCULATIONS FOR TURBINE CONSTANT CONVERSION
Given: Rock Island plant data as example
H = rated head = 12.1 m Q = Rated discharge = 481.0 m3;sec
= 54,000 P = Rated power output D = Turbine diameter = 7.40 m N = Turbine speed = 85.7 rpm
Required: To show conversion example calculations.
Analysis and Solution:
From general power equation.
ptheoretical = .9.!:!E.9. = (481)(12.1)(1000)(9181) 1000 1000
= 57,095 kw .. ~~--answer p
n = rated = 54 ,000 X 100 = 94.6% ·~~--answer pth 57,095
Using Eq. (4) Ns _ N /P _ 85.7 /54,000 = 882 .5 (metric) - H5/ 4 - (12.1) 1· 25
Ns American = 0.262 Ns metric
= 0.262(882.5) = 231.2 .. 4t----answer
or Ns American = N;'Phorse power (H ft) 1 .25
Pkip = Pkw/0.746 h = Hft = Hm/0.3048
Pkip = 54,000/0.746 = 72.386 hp Hft = 12.1/0.3048 = 39.7 ft
Ns American = 85 · 7 1~ 2 2~86 = 231.4 •4r----- Answer Check ( 39. 7) .
145
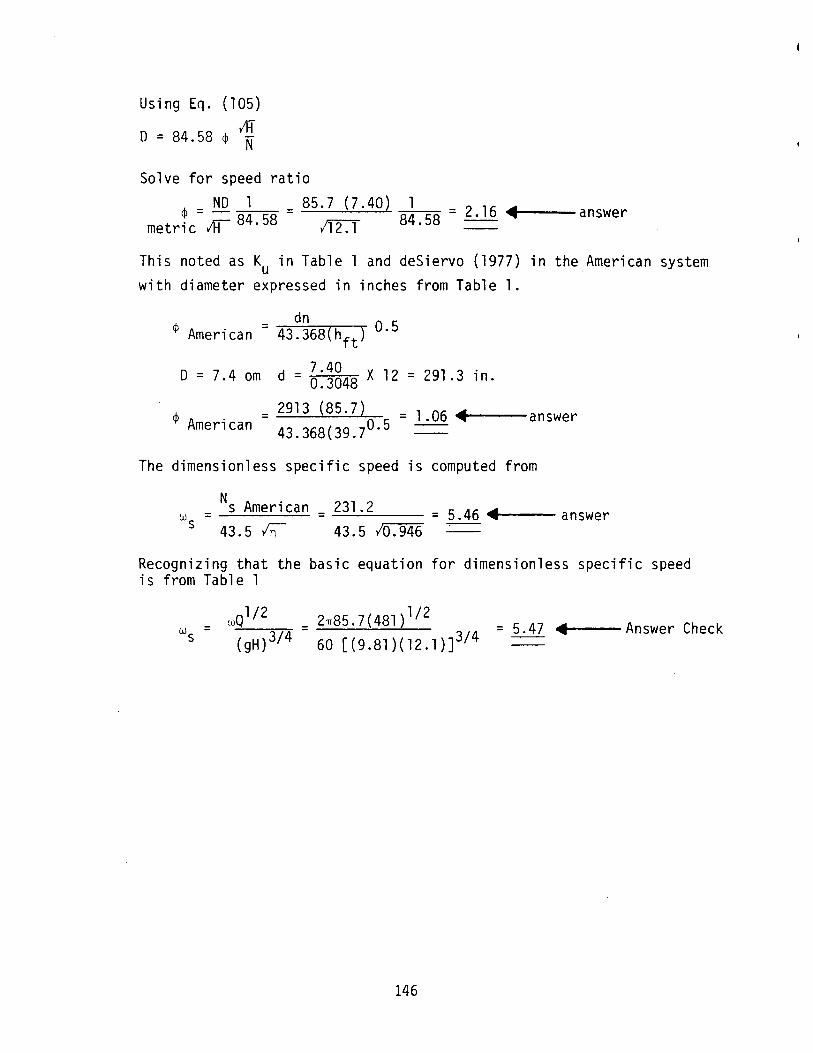
Using ECJ. (105) /H o = 84.58 cp N
Solve for speed ratio
4> = NO 1 = 85.7 (7 .40) 1 = 2.16 4~---answer metric 1fr 84 · 58 li2"":f 84.58 ===
This noted as Ku in Table 1 and deSiervo (1977) in the American system with diameter expressed in inches from Table 1.
dn
The dimensionless specific speed is computed from
N A . 231.2 = s men can = ..:::...:...,;_;_:::: ___ = 5.46 .. ~~-----answer w s 43. 5 In 43. 5 Ia. 946
Recognizing that the basic equation for dimensionless specific speed is from Table 1
wQ1/ 2 _ 2n85.7(481) 1/ 2 = = 5. 47 .. ~~--Answer Check
ws (gH) 3/ 4 - 60 [(9.81)(12.1)] 314
146
I .
APPENDIX 2
SAMPLE CALCULATIONS FOR DETERMINING TURBINE DIAMETER
AND TURBINE SPEED BY DIFFERENT METHODS
These sample calculations are executed to illustrate different
methods of estimating preliminary values of turbine speed and turbine
runner diameter. The traditional method as put forth in the U.S.
Bureau of Reclamation Monograph No. 20 (1976) is compared with publish
ed results of deSiervo, the work and methodology of Lindestrom of KMW
in Sweden and different approaches developed on this research project.
This illustrates the variability that can be obtained. Each method and
the appropriate equations require at least one empirical equation that
is based on experience curves based on performance of ~anufactured
units or from studies of model test data. Documentation as to where
each empirical equation came from is presented in these sample calcula
tions.
147
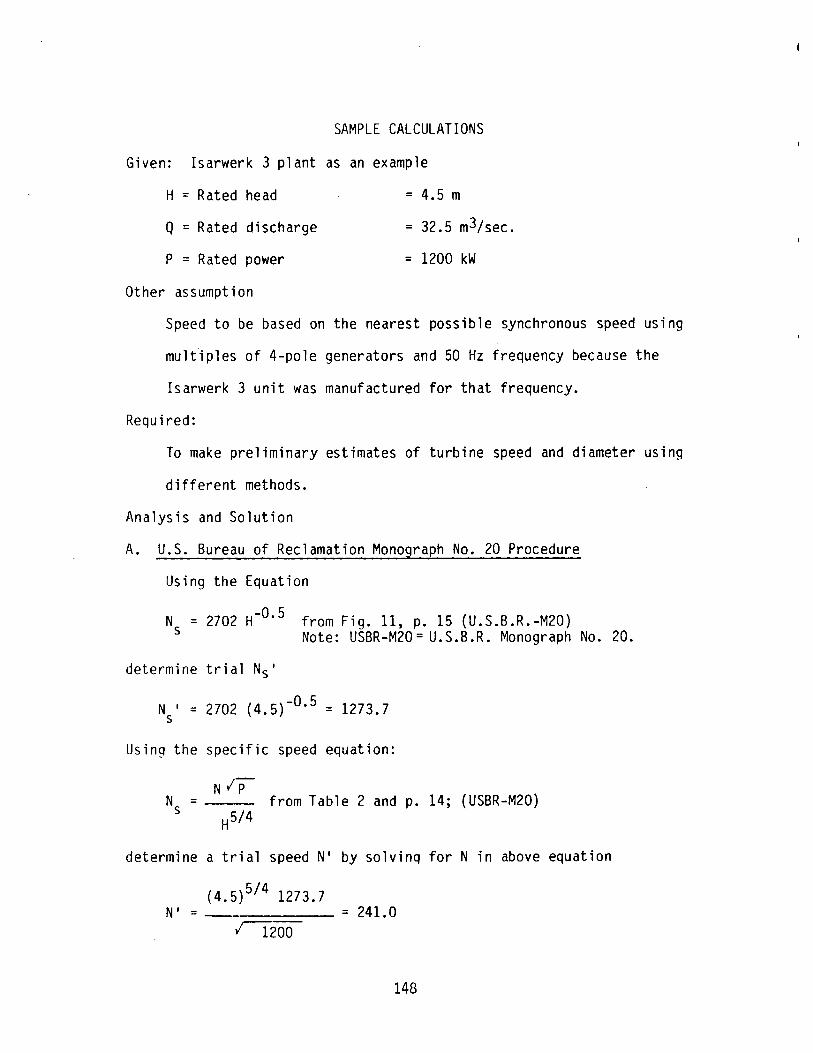
SAMPLE CALCULATIONS
Given: Isarwerk 3 plant as an example
H = Rated head
Q = Rated discharge
P = Rated power
Other assumption
= 4.5 m
= 32.5 m3fsec.
= 1200 kW
Speed to be based on the nearest possible synchronous speed using
multiples of 4-pole generators and 50 Hz frequency because the
Isarwerk 3 unit was manufactured for that frequency.
Required:
To make preliminary estimates of turbine speed and diameter using
different methods.
Analysis and Solution
A. U.S. Bureau of Reclamation Monograph No. 20 Procedure
Using the Equation
Ns = 2702 H-O.S from Fig. 11, p. 15 (U.S.B.R.-M20) Note: USBR-M20= U.S.B.R. Monograph No. 20.
determine trial Ns 1
N I = 2702 {4.5)-0·5 = 1273.7 s
Using the specific speed equation:
NIP from Table 2 and p. 14; {USBR-M20)
determine a trial speed N1 by solving for N in above equation
N I = {4.5) 514 1273.7
r--1200 = 241.0
148
Recognizing Np = 6000/N
Where Np = number of poles at 50 Hz
Then Np = 6000/241 = 24.9 poles
Therefore the nearest multiple of four poles would be Np = 24
Synchronous speed N = 6000/24 = 250 rpm (,----- ANSWER
Calculate the actual Ns from
N /P 250 /1200 = = 1321.3
H5/4 (4. 5)1.25
Now determine speed ratio from empirical Equation
2/3 ¢ = 0.0233 Ns from p. 14 (USBR-M20)
¢ = 0.0233 (1321.4) 213 = 2.806
Note, this equation is for propeller turbines
Now determine turbine diameter from Equation
84.47 ¢ iH 0 = from p. 14, (USBR-M20)
N
84.47 (2.806) 14.5 0 = -------- = 2.01 m <-
250
B. deSiervo and deleva Equations
Using the equation
ANSWER
Ns = 2419 H-0· 489 from p. 52 [deSiervo and deleva(1977)]
Ns = 2419 (4.5)-0·489 = 1159.4
Using the specific speed equation
NIP
149
determine a trial speed N• by solving for N in above equation,
{4.5) 1· 25 (1159.4) N I = ------- = 219.4
I 1200
Recognizing Np 1 = 6000/N
then Np = 6000/219.4 = 27.4 poles
Therefore nearest multiple of four poles would be Np = 28
Synchronous speed N = 6000/28 = 214.3 rpm <-- ANSWER
Calculate the actual Ns from
NIP N = -- = s 5/4
H
214.3 11200
(4.5)1.25 = 1132.7
Now determine speed ratio from Equation:
¢ = 0.79 + 1.61 x 10⁻³ Ns from p. 56 [deSierve & deleva (1977)]
¢ = 0.79 + 1.61 X 10⁻³ (1132.7) = 2.614
Now determine turbine diameter from Equation
84.5 IH 0 =----from p. 14 (USBR-M20)
N
84.5 (2.614) 14.5--0 = = 2.19 m <--
214.3
C. KMW Graphical Solution
ANSWER
From the KMW nomograph reproduced as Figure 70 as taken from
[Lindestrom (n.d.)]
N 200 this really falls off the scale of the nomograph
0 = less than 3
150
D. Special study of KMW Bulb Units Using Techniques and Regressions
Developed by Kpordze - Warnick
1. Determine turbine diameter by Equation:
p D = F(P/H) = 0.17633 (---) 0· 449
H
(1200)0.449
D = 0.17633 = 2.17 m <- ANSWER 4.5
Then using this value of D determine a trial value of N from Equation
vH N = F{---) =
0
IH 164.706 {---) 0•8876 from Table 9
D
(14
· 5)0.8876 N' = 164.706 = 161.42 rpm 2.17
For synchronous speed Np = 6000/N = 37.2 poles
choose 36 poles
Therefore N = 6000/36 = 166.7 rpm <-- ANSWER
2. Using D from above (1) and using empirical equation:
Q Q D = F (---) = 4.1604 (-) 0· 3064 from Tab 1 e 9
N N
and transposing solve for N
4.1604 3 264 N = ( ) • Q
D
(4.1604)3.264
N' = (32.5) = 272.0 rpm 2.17
For synchronous speed Np = 6000/N
Np = 6000/272 = 22.1 Use 24 poles
N = 6000/24 = 250 rpm <- ANSWER
151
3. Using empirical equation for N = F(P/H) solve for N and empirical
equation D = F(Q/N) solve for D using N from the solution of N = F(P/H)
Determine N from Equation:
N = F(P/H) = 3583.983 (P/H)-0· 4833 from Table 9
(-1200) -0.4833 N' = 3583.983 = 240.9 rpm 4.5
For synchronous speec Np = 6000/N
Np = 6000/240.9 = 24.9
N = 6000/24 = 250 rpm
Use 24 poles
Now using this N = 250 rpm determine turbine diameter D from
Q D = F(Q/N) = 4.1604 (-)0· 3064
N
(32 · 5)0.3064
= 4.1604 = 2. 23 m <- ANSWER 250
4. Using the more traditional approach, solve for Ns = F(H), then
find N from specific speed equation, then solve for ¢ = F(Ns),
then use D = F ( ¢/H) to so 1 ve for D. N
Using Equation:
Ns = F(H) = 1553.445 H-0·2918 from Tahle 9
Ns = 1553.445 (4.5)-0· 2918 = 1001.6
N H1· 25 1001.6 (4.5) 1· 25 s N' = = = 189.5 rpm IP l12oo
For synchronous speed Np = 6000/N
Np = 6000/189.5 = 31.66 Use 32 poles
N = 6000/32 = 187.5 rpm
152
•
Now find actual Ns
N lp 187.5 1!200 N
s = -- = ----- = 991.0 (4.5)1.25
Using Equation:
¢ = F(Ns) = 0.166 Ns 0· 3728 from Table 9
¢ = 0.166 (991.0) 0· 3728 = 2.173
Now solve for D using Equation
H0· 5 84.47 (2.173)(4.5) 0· 5 D=84.47¢ ---------------
N 187.5
D = 2. 08 m <;-- ANSWER
E. Study of all Bulb Units Using Techniques and Regression Developed
by Kpordze - Warnick
1. Determine turbine diameter by Equation:
D = 0.1826 (P/H) 0·4462 Eq. 25
(1200 )0.4462 D = 0.1826 = 2.21 m ~ ANSWER 4.5
Then using this value of D determine turbine speed by Equation
IH" N = F(-)
D
Iii = 169.199 (---) 0·926 from Eq. 30
D
(14."5) 0. 926 N' = 169.199 = 162.8 rpm 2.21
For synchronous speed Np = 6000/N'
Therefore Np = 6000/162.8 = 36.9 poles, Use 36 poles
N = 6000/36 = 166.7 rpm ~-- ANSWER
153
2. Using D from above (1) of 2.21 m = D and utilizing empirical
equation
Q D = F(-)
N
Q = 4.181 (-)0· 3175 from Eq. 26
N
or transposing to solve for N
N = (4.181)3.15 Q
D
4.181 3.15 N' = (-----) (32.5) = 242.1 rpm
2.21
For synchronous speed Np = 6000/N.
Np = 6000/242.1 = 24.8 poles Use 24 poles
N = 6000/24 = 250 rpm ~ ANSWER
3. Using empirical Equation for N = F{P/H) solve for N and use empiri
cal equation for D = F(Q/N) solve for D using the N from N = F(P/H)
as selected to agree with a synchronous speed.
p N = F(-)
H
p = 2152.856 (---)-0· 4062 from Eq. 28
H
1200 -0.4062 N' = 2152.856 (-) = 222.6 4.5
For synchronous speed Np = 6000/N
Np = 6000/222.6 = 26.9 Use 28 poles
N = 6000/28 = 214.3 rpm
Now using this N = 214.3 determine diameter D from Equation D = F(Q/N)
Q D = 4.181 (----) 0· 3175 from Eq. 26
N
( 32 · 5)0.3175 D = 4.181
214.3 = 2.30 m ~ ANSWER
154
4. Using the more traditional approach solve for Ns = F(H), then
find N from specific speed equation, then solve for ¢ = F(Ns), then
IH use D = F( ¢--u-) to solve for D.
Using Equation
Ns = F(H) = 1520.256 H-0· 2837 from Eq. 3
Ns = 1520.256 (4.5)-0· 2837 = 992.2
N H514 992.2 (4.5) 1· 25 s N' = = = 187.7 rpm IP I 1200
For synchronous speed Np = 6000/N
Np = 6000/187.7 = 31.97 Use 32 poles
N = 6000/32 = 187.5 rpm
Now find actual Ns
N /j) 187.5 /1200 N = = ----- = 991.0 s H5/4 (4.5)1.25
Using Equation
¢ = F(N ) = 0 0944 N °· 4605 from Eq. 19 s . s
¢ = 0.0944 (991.0) 0·4605 = 2.26
Now solve for D using Equation
H112 (2.26)(4.5) 112 D = 84 . 4 7 cp -- = 84. 4 7 = 2. 16m
N 187.5
D = 2.16 m <E-- ANSWER
155

F. Actual Manufactured Values of Diameter and Speed
0 actual = 2.45 m
N = 157 rpm
156
APPENDIX 3
COMPLETE TABLE OF DATA
157
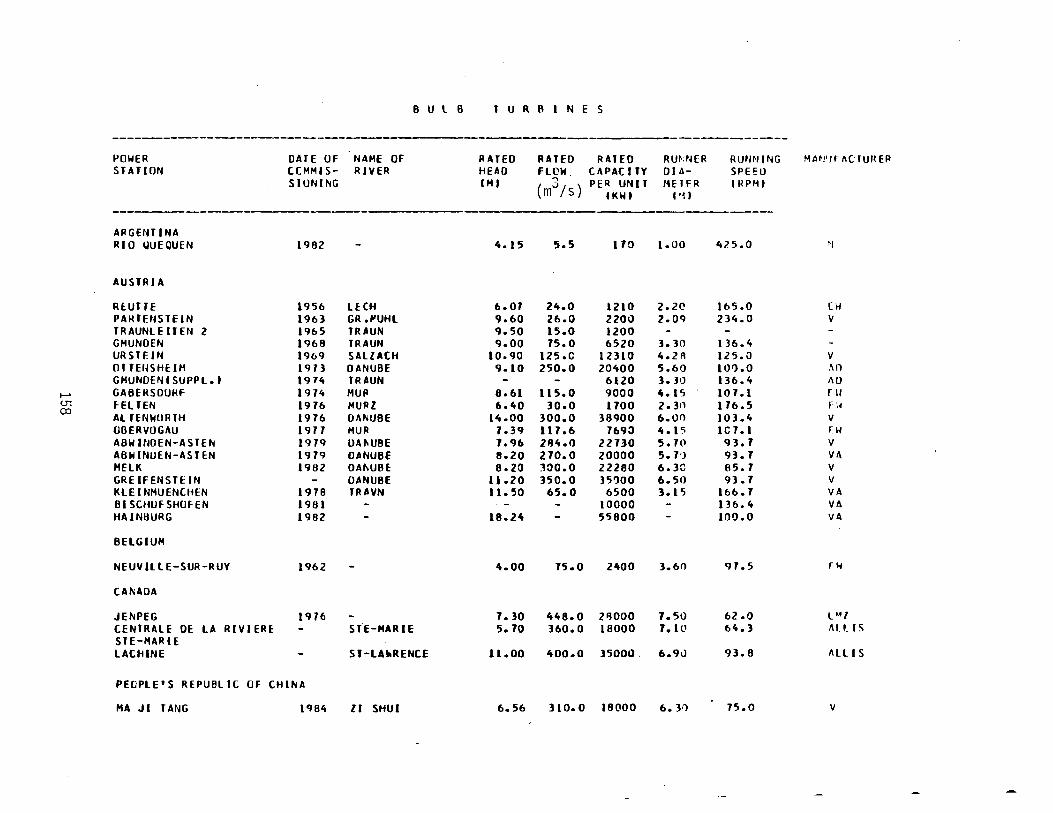
8 U l B T U R 8 I N E S
--------------------- - ---------POWER DATE OF NAME OF RATED RATED RATED RU~.NER RUNNING MM!'IF IICfUHEP STATION CCMMIS- RIVER HEAD flOW. CAPACITY DIA- SPHIJ
SIUNING (MJ ( 3 I ) PE R UN IT liE lfR IRPMJ m S ( KW I ( •1J
-ARGENTINA RIO I.IUEQUEN 1982 - 4.15 5.5 170 1.00 425.0 ~I
AUSTRIA
RWTTE 1956 LHH 6.07 24.0 1210 2.2() 165.0 [W PAIHENSTEIN 1963 GR.f'UHL 9.60 26.0 2200 2.09 234.0 v T R AUNl E IT EN 2 1965 TR-UN 9.50 15.0 1200 GHUNDEN 1968 TRAUN 9.00 75.0 6520 3.30 136.4 UR S TF.IN 1969 SAllACH 10.90 125.C 12310 4.2A 12 5. 0 v 01 fEI~SHEIH I 973 DANUBE 9.10 250.0 20400 5.60 101).0 .~n
GHUNOENtSUPPl.J l911t TRAUN - - 6120 3.30 136.4 110
...... GABERSOURF 1914 MUll 8.61 115.0 9000 4.1'> 10 7.1 ru U1 fELTEN 1976 MUIIZ 6.40 30.0 1700 2. 311 176.5 r ;~ co Al TENWORTH 1976 DANUBE 14.00 300.0 38900 6.0() 103.4 v
OBERVOGI\U 1971 HUR 7.39 117.6 769:> 4.15 IC 7. I HI
ABW ltlOEN-A S TEN 1979 UAt.UBE 7.96 294.0 22130 5.70 93.7 v ABW INUEN-AS TEN 1979 0-NUBE 8.20 270.0 20000 5. 7•) 93.7 VA HELK 1982 DA'-UBE 8.20 300.0 22280 6.3C 85.7 v GREIFENSTEIN - DANUBE 11.20 350.0 ]5')00 6.50 93.7 v KLEINMUENCHEN 1978 TR-VN 11.50 65.0 6500 3.15 166.1 VA Bl SCHUF SHU FEN 1981 - - - 10000 - IJ6. 4 VA HAINIJURG 1982 - 18.24 - 55800 - 101).0 VA
BELGIUM
NEUVILLE-SUR-ROY 1962 - 4.00 75.0 2lt00 3.60 9 7. 5 PI
CAt\ ADA
JENPEG 1976 - 7. 30 lt48.0 2JJOOO 7.50 62.0 L"'l CENTRALE DE LA RIVIERE - ST E-MAR IE 5. 70 360.0 18000 7.10 64.3 flU. IS STE-MAR IE LAUHNE - ST-LURENCE 11.00 400.0 15001)' 6.9u 93.8 IIlllS
PEOPlE'S REPUBLIC OF CHINA
HA Jl TANG 1984 ll SHUI 6.56 310.0 18000 6. 3•1 75.0 v
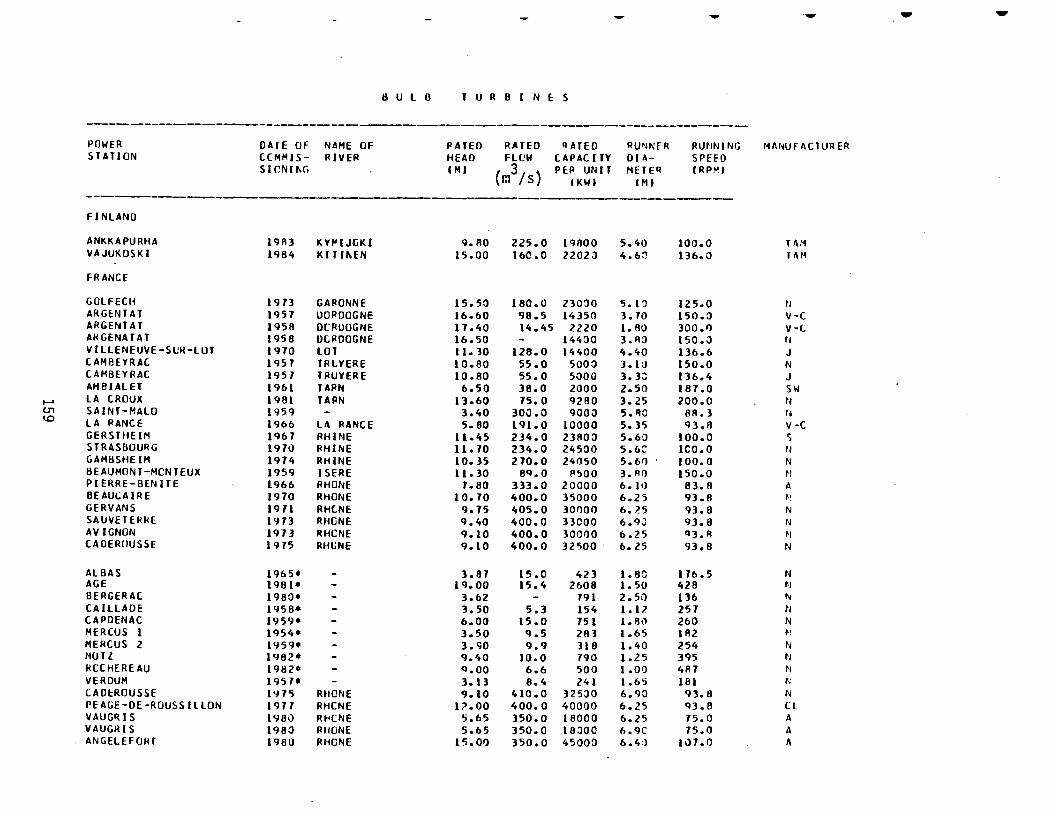
- ·- - -6 u l 0 T U R 8 I N E S
---------------- ------- -----------POWER DArE OF NAME OF PAT EO RATED qATEO RU"lf\!FR RU~JNI NG f~IINUFACTURER S TAllON COtlo!IS- RIVER HEAD FlCW CAPACirY DIA- SPHD
SICNI"G CMJ (m3/s)
PEP UNIT METE II IRPf'!J CKWI I M I
-
FINLAND
ANK.K.APURHA 19A3 KYI'IJCKI 9.RO 225.0 I 9800 5.40 100.0 TA~ VAJUKOSKI 1984 KITII\EN 15.00 160 .o 2202J 4.6:1 136.0 To\M
FRANCE
GOLFECti 1973 GARONNE 15.50 180.0 230:10 5.13 125.0 t~ ARGENT AT 1957 UOROOGNE 16.60 98.5 14350 3.10 150.() v-c ARGENT AT 1958 DCRUOGNE 17.40 14.45 2220 1. 80 300 .I) V-l ARGENATAT 1958 DCROOGNE 16.50 - 144()0 ).RJ 150.J r ~ VILLENEUVE-SUR-LOT 1970 lOT 11. 10 128.0 14400 4.40 136.6 J CAMBEYRAC 1957 TRlYERE 10.80 55.0 500() 3.1:J 150.0 N CAMBEYRAC I 957 TRUYERE 10.80 55.0 5000 3. 3~ 136.4 J AHBIAL ET 1961 TARN 6.50 38.0 2000 2.50 187.0 sw
...... LA CROUX I 981 TARN 13.60 75.0 9280 3. 25 200.0 N c.n SAINT-MALO 1959 - 3.40 300.0 9000 5. ItO 81!.] f4 1.0 LA PANCE 1966 LA RANCE 5. 80 191.0 10000 5.35 •n.A v -c
GERSTHEIM 1967 RHINE 11.45 234.0 ZJAOO 5.6{) 100.0 ')
STRAS80URG 1970 RHINE 11.70 Z34.0 24500 5.6C I CO. 0 IJ GAMBSHEIH 1974 RHINE 10. 15 270.0 241)50 5.61) 100.0 N BEAUMONT-MCNTEUX 1959 I SERE II. 30 8Q.O P~OO 3.Rr) 150.0 N PIERRE-BENITE 1966 RHONE 7.80 333.0 20000 6. I•J 83. A A BEAUC.:AIRE 1970 RHONE 1 o. 10 400.0 35000 6.25 93.8 ~!
GERVANS 1911 RHCNE 9.75 405.0 30()01) 6.25 93.8 N SAUVETERRE 1 '173 RHONE <J. 40 400.0 33000 6.qJ 93.8 N AVIGNON 1973 RHCNE 9.10 400.0 3001)0 6.25 Q3.R N CADERUUSSE 1975 RHUNE 9.10 400.0 32500 . 6.25 93.8 N
AL BAS 1965• - 3.87 15.0 423 1.BG 176.5 N AGE 1981• - 19.00 15.4 2608 1.50 428 ~I
BERGERAC 1980• - 3.62 - 791 2.5() 1)6 N CAillADE 1<J58* - 3.50 5.3 154 1.1? 257 N CAPDENAC 1959• - 6.00 15.0 751 1. fhl 260 N MERCUS 1 1954• - 3.50 9.5 2113 1.65 182 ~· MERCUS 2 1959• - 3.'00 9.9 318 1.40 254 N HUll 1982• - <J.40 10.0 790 1.2 5 395 tl RCCHEREAU 1962• - Q.OO 6.6 500 1.01) 487 N VEROUM 1957• - 3.13 8.4 241 1.65 181 )\;
CAOl:ROUSSE 1975 RttONE 9.10 410.0 325JO 6.90 93.8 N PEAGE-OE-ROUSSillON I'H7 llHCNE 1?.00 400.0 4001)0 6.25 •n.8 Cl VAUGRIS 1980 Rt<CNE 5.65 350.0 18000 6.25 75.0 A VAUGIU S 1980 PHONE 5.65 350.0 18:JOO 6.9C 75.0 A ANGELEFORT 1980 RHGNE 15.01) 350.0 45000 6 .4,) 1117.0 "
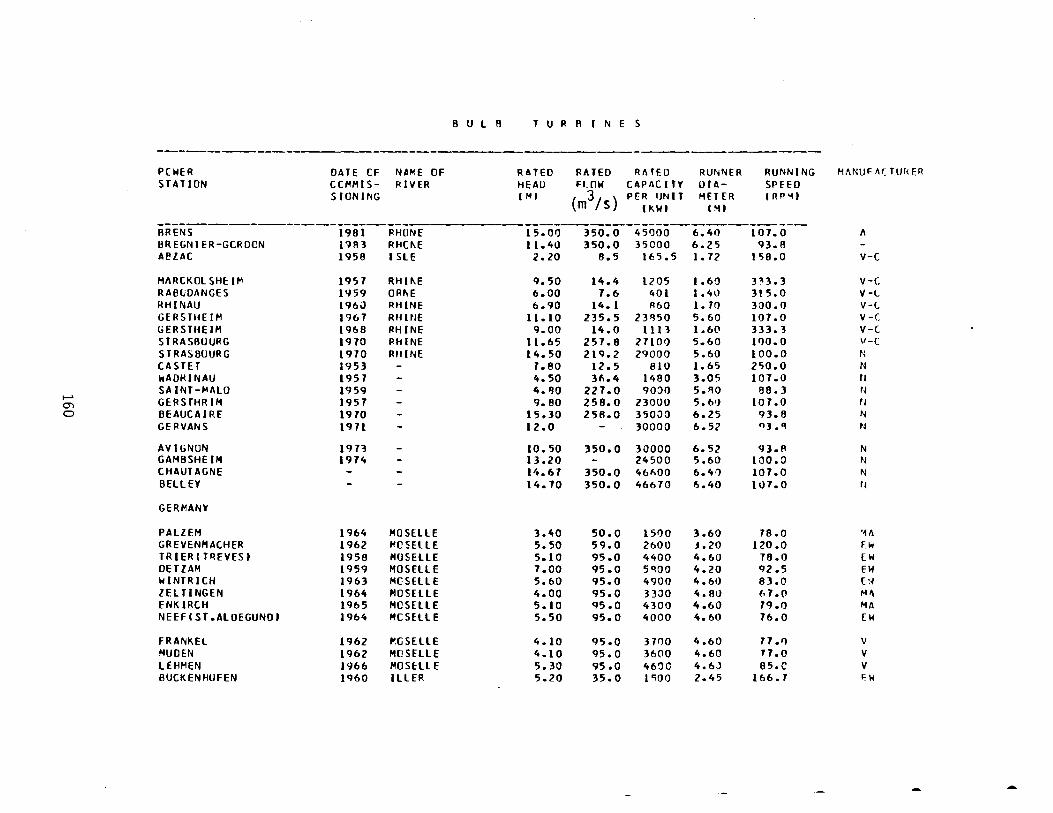
8 u l 8 TURRINE s
-PCWER DATE CF NA"'-E OF RATED RATED Rfl TEO RUNNER RUNNING MfiNUFI\r;TUf<ER STAT ION CCMMIS- RIVER HEAU FI_OW CAPACITY uu- SPEED
StONING I M I ( 3 I ) pER IJN IT Mfl ER IRP'-11 m S II<.WI
·~· ------------------------ ---------------------RRENS 1981 PHONE 15.01) 350.0 45000 6.40 107.0 " llREGNIER-GCRDCN 1':}83 RHCf\E 11.40 350.0 35000 6.25 <n.a AelAC 1958 ISLE 2.20 8.5 lf:5.5 1.12 158.0 v-c
MfiRCKOLSHE:I~ 1957 RHif\E 9.50 14.4 1205 I. 60 P3.3 v-c RABGDfiNGES 1'159 ORf\E 6.00 7.6 401 1 • 40 3t5.0 V-L RHINAU 196J RHINE 6.90 14. 1 AbO 1. 70 300.0 V-L GERSTHEIM 1967 RHINE ll.10 235.5 231!50 5.b0 107.0 V-( GERSTHE111 19b8 PHINE 9.00 14.0 1113 1. 6(1 333.3 v-c STRASBUURG 1970 PHINE 11.65 257.8 21100 5.60 11)0.0 \1-(
STRASBOURG 1970 RHINE 14.50 21'~.2 29000 5.60 100.0 N CASTEl 1953 - 7.80 12.5 810 1. b5 250.0 N wADIHNAU 1957 - 4.50 31>.4 1480 3.05 107.0 II SAINT-MALO 1959 - 4.'!0 227.0 90:>0 5.RO 1:!8.3 ,~
........ GERSTHRIM 1957 9.80 258.0 23000 5. 6 1} 10 7. 0 r1 0"1 -0 BEAUCAIRE 1970 - 15.30 258.0 3500() 6.25 93.8 N
GERVANS 1971 - 12.0 - 30000 6.52 03.'1 N
AVIGNON 1973 - 10.50 350.0 30000 6.52 93.!l N GAMBSHEIM 1974 - 13.20 - 24500 5.60 100.0 N CHAUTAGNE - - 14.67 350.0 46f..OO 6.41) 101.0 N BEllEY - - 14.70 350.0 46670 6.40 107.0 rl
GERMANY
PAll EM 1964 MOSEllE 3.40 50.0 1500 3.60 78.0 '1h GREVENMAC.HER 1962 MOSELLE 5.50 59.0 2b00 J.20 120.0 F.w TRIERITREVESI 1958 MOSELLE 5.10 95.0 4400 4.60 78.0 EW DETZAM 1959 MOSEllE 7.00 95 .o 5"l00 4.20 92.5 HI WINTRICH 1963 HCSEllE 5.60 95.0 4900 4.60 83.0 E•.4 ZEL TINGEN 1964 MOSELLE 4.00 95.0 3300 4.80 (, 1.0 Ml\ ENKIRCH 1965 MOSELLE 5.10 95.0 4300 4.60 79.1) MA NEEFIST.ALOEGUNOI 1964 MC SEllE 5.50 95.0 4000 4.60 76.0 [W
FRANfi.El 1962 ~GSELLE 4.10 95.0 311l0 4.60 11.fl v MUOEr~ 1962 MOSELLE 4.10 95.0 3600 4.60 71.0 v LEHMEN 1966 MOSE:LL E 5.30 95 .o 46:JO 4.6J B5.C v BUCKENHUFEN 1960 ILLER 5.20 35.0 1 o;oo 2.45 166.7 lOW
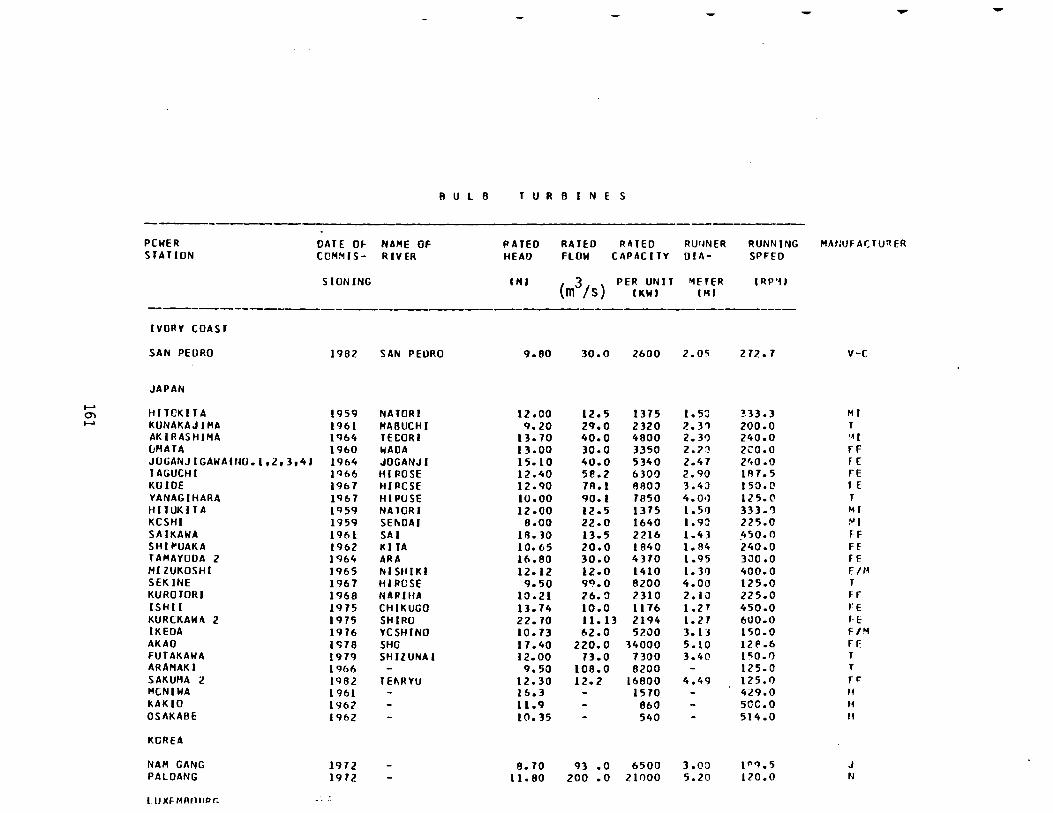
..... -
R U l B TURBINES
-PCWER DATE Of NAME Of PAJEO RATED Rill EO RurmeR RUNNING M/UliJFA(TURER STATION CCMMIS- RIVER HEAD FLOW CAPACITY OIA- SPFEO
SIGNING CHJ (m3ts)
PER UNIT "1HER I R P '1 J IKWJ Oil
------------------ - -------IVORY COAST
SAN PEDRO 1982 SAN PEORO 9.80 30.0 2600 z.or; 272 0 7 v-c
JAPAN
...... HITCKIT A 1959 NATORI 12.00 12.5 1375 1. 50 ~33.3 Ml 0)
...... KUNAKAJIMA 1961 MABUCHI 9.20 29.0 2320 2.3'l zoo.o T AK1RASHIMA 1964 TEI:ORI 13.70 40.0 4800 2.31) 240.0 ~~ I UMATA 1960 WAOA 13.00 30.0 3350 2.n 2~0.0 rF JUGANJIGAWA(~U.1,2,3,4J 1964 JOGANJI 15.10 40.0 5340 2.4 7 21t0o0 F-E TAGUCHI 1Q66 HI POSE 12.40 58.2 6300 2.90 1117.5 FE KOIVE 1967 HIPCSE 12.90 7Ao1 AIJOJ 3.4J 150.0 r E YANAGIHARA 1967 HIPUSE 10.00 90.1 7850 4. O•J 125.0 T HIT UK IT A 1Q59 NATORI 12.00 12.5 1315 1.51) 333.') Ml KCSHI 1959 SE~OAI 8.oo 22.0 1640 1. 9~ 225.0 ~· SAIKAWA 1961 SA 1 111.30 13.5 2216 1.4 3 _450. 0 FF SHIP'OAKA 1962 KIT A 10.65 20.0 1840 1.84 240.0 FE TAMAYOOA 2 1964 ARA lb.80 30.0 4370 1.95 3JO.O FE MIZUKOSHI 1965 NIStiiKI 12.12 12.0 1410 1.31) 400.0 F./I~
SEKINE 1967 HI POSE 9.50 9~.0 8200 4.00 125.0 T KUROTORI 1968 NAP llfA 10.21 ?6.:1 2310 2.10 225.0 fF ISHII 1975 CHIKUGO 13.74 10.0 1176 1.27 450.0 re KURCKAWI\ 2 1ns SHIRO 22.70 11. 13 2194 1. 27 600.0 H IKEDA 1976 YCSHINO 10.73 62.0 5200 3. 1 "j 150.0 F/"1 AKAO 1'>78 SHO 17.40 220.0 34000 5.10 12!1.6 ff: FUTAKAWA 1979 SHilUNA1 12.00 73.0 7300 3.40 150.1) T 1\RAMAK I 1966 - 9. 50 108.0 8200 - 125.0 T SAKUMA l 1982 T Et\R YU 12.30 12.2 16800 4.49 125.1) fF" MCNIWA 1 961 - 16.3 - 1570 - 429.0 H KAKIO 1962 - 11.9 - 860 - 50C.O H OSAKABE 1962 - 10. J5 - 540 - 514.0 II
KCREA
NAM GANG 1972 - 8.70 •n .o 6500 3.00 1"'l.5 J PAL DANG 1972 - 11.80 zoo .o 21000 5.20 120.0 N
l U XF MRilllPt: -. -
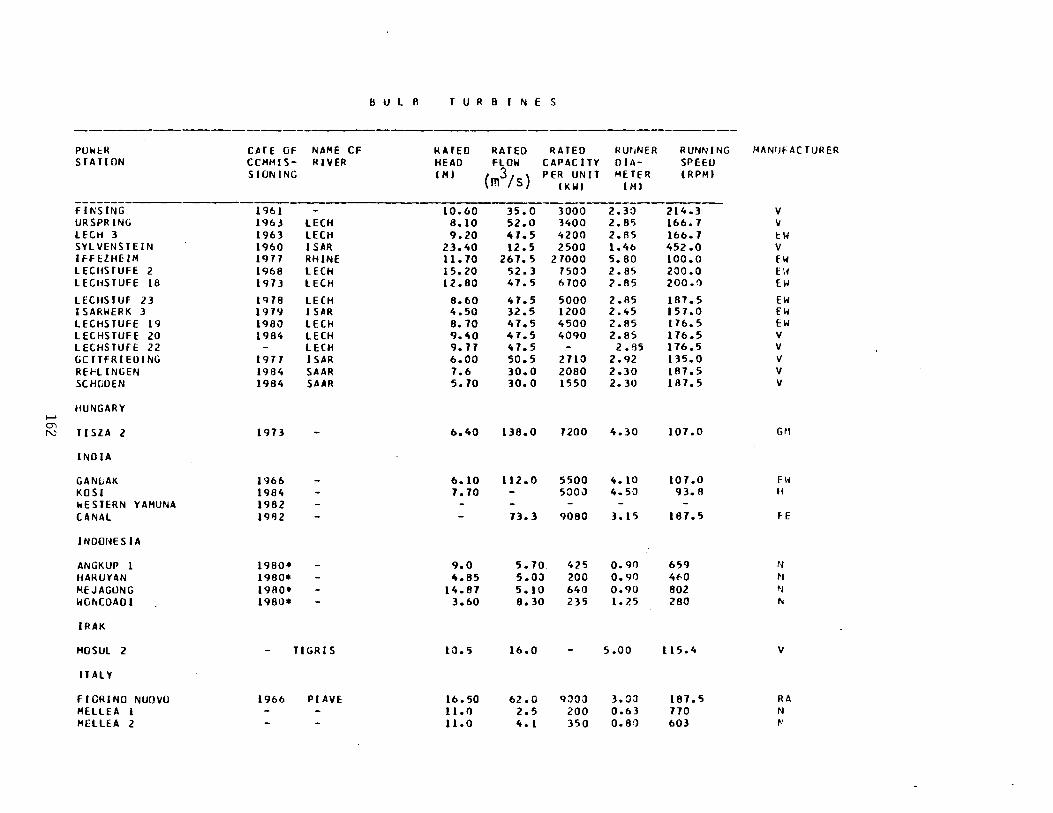
B U l II TURBINES
------ --------------POWI:H CAT E Of NAME CF HATED RATED RATED HUtiNER RUNNING H.-.NIJfAC TURER S TA Tl ON CCMMIS- HI VER HEAD FLOW CAPACITY OIA- SPEEU
SIGNING IHI (m3/s) PER UN IT 14ETER I RPM I IKWI I M I
--------FINS lNG 1961 - 10.60 35.0 3000 2.30 214.3 v URSPRING l9(d LECH 8.10 52.0 3400 2.8'> 166.7 IJ LECH 3 1963 LECH 9.20 47.5 4200 2.115 166.7 I:W SYlVENSTEIN 1960 I SAR 23.40 12.5 2500 1.46 452.0 v lffl:lHE IM 1977 RHINE 11.70 267.5 21000 5.80 100.0 fW LECiiSTUFE 2 1968 LECH 15.20 52.3 750:1 2. 85 200.0 HI LECiiSTUFE 18 1973 LECH 12.80 47.5 6700 2.115 200.!) EW
LECHSTUF 23 l'H8 LECH 8.60 4 7. 5 5000 2.R5 187.5 EW ISARWERK 3 191'1 I SAR 4.50 32.5 1200 2.45 157.0 Ew LECHSTUFE 19 1980 LECH 8.70 47.5 4500 2.115 176.5 EW LECHSTIJFE 20 1984 LECH 9.1t0 47.5 4090 2.85 176.5 v l ECHS TUFE 22 - LECH 9.17 47.5 - 2.!!5 176.5 IJ GCTTFRIEOING 1971 ISAR 6.00 50.5 2710 2.92 135.0 v REH lNG EN 1984 SAAR 7.6 30.0 2080 2.30 1117.5 v SCHGOEN 1984 SAAR 5. 70 30.0 1550 2. 30 18 7. 5 v
HUNGARY ~ CJ') ~ Tl SZA 2 1973 - 6.40 138.0 7200 4.30 107.0 Gil
INDIA
GANLAK 1966 - 6.10 112.0 5500 4.10 107 .o f \~
KOSI 1984 - 7.70 - 50011 4.5\l 93. II H
wESTERN YAMUNA 1982 CANAL 19112 - - 73.3 9080 3.15 187.5 F-E
INDOI~ES lA
ANGKUP 1 1980• - 9.0 5.70 425 0.91) 659 N HAIWYAN 1980* - lt.85 5.0J 200 0.91) 4f0 N MEJAGUNG 19110• - l't.87 5.10 640 0.90 802 ~l
WGI'.CDADI 1980• - 3.60 8.30 235 1.25 280 ,..
IRAK
HOSUL 2 - Tl GR IS 10.5 16.0 - 5.00 115.4 v
ITALY
FIORINO NUOIJO 1966 PI AVE 16.50 62.0 9JOJ 3.00 187.5 RA HELLEA 1 - - 11.1) 2.5 200 0.63 770 N MELLEA 2 - - u.o 4.1 350 o.8o 603 ~·
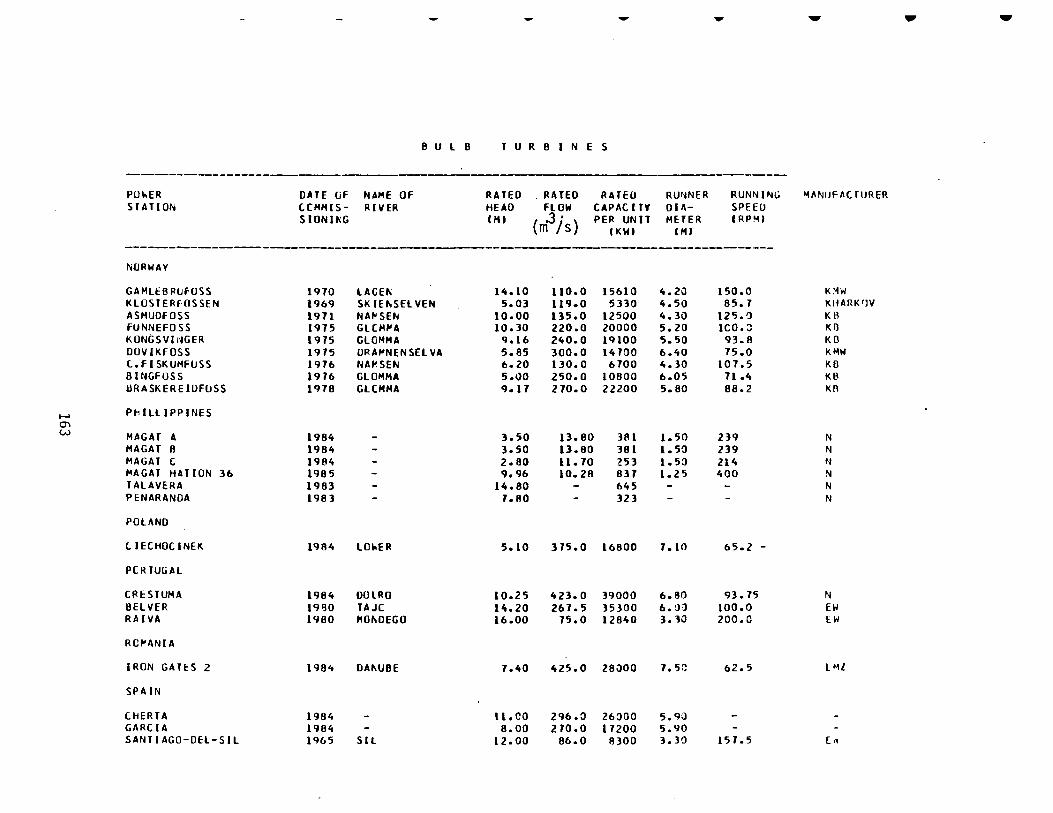
..... - .. ...
B U l B TURBINES
-------------PO .. ER OAJE Gf NAME OF RATED . RATED RAJ EO RUt'4NER RUNtiiNG "41\NIJFAC TURER SJ AT ION CCHHIS- RIVER HEAD FlOW CAPAC I JY 014- SPEEO
StONING CHI (m3 is) PER UN IT METER (RPM I CKWI CHJ
----------------------- - --------NORWAY
GAMLEBRUFOSS 1cno lAGE~ l't.10 110.0 15610 to.20 150.0 K:~w
KlOSJERfOSSEN 1969 SKIEt.SElVEN 5.03 119.0 5HO 4.50 85.7 KHARK'lV ASMUOFOSS 1971 NA,.,SEN 10.00 135.0 12500 4.30 12'5.1) KB fUNNEFOSS 1975 GlCMio'A 10.30 220.0 20000 5.20 1CO. J Kfl KONGSVII~GER 1975 GlOHHA 9.16 240.0 19100 5.50 93.8 KO DUVIKFOSS 1975 ORAio'NEN SElVA 5.85 300.0 14700 6.40 75.0 KMW l.F I SKUHFUSS 1976 NA,.,SEN 6.20 130.0 6700 4.30 107.5 KD BINGFOSS 1976 GlOMHA 5.1)0 250.0 10600 6.05 71.4 KB URASKEREIOFUSS 1q79 GlCHHA 9.17 270.0 22200 5. 80 88.2 KR
...... Ph llll PP INES 0'1 w MAGAJ A 1984 - 3.50 13.80 3A 1 1.50 239 N
MAGAT B 1984 - 3.50 13.80 381 1. 50 239 N MAGAT C 1984 - 2.ao 11.70 253 1.5() 214 N MAG AT HAT ION 36 1985 - 9.96 10.28 637 1.2'5 400 ~
TALAVERA 1963 - 14.80 - 645 - - N PENARANDA 1983 - 1. RO - 323 - - N
POlAND
tiECHOC INEK 1984 lOioER 5.10 375.0 16600 7.10 65.2 -
PCRTUGAL
CRESJUMA 198/o OUlRO 10.25 423.0 39000 6.80 93.75 N BElVER 1990 TAJC 14.20 267.5 35300 6. •J') 100.0 EW RAIVA 1980 MOfiDEGO 16.00 75.0 12840 3. 30 200.0 EW
RC,.ANIA
IRON GA HS 2 1984 DAfiUBE 7.40 lt25.0 Z8000 7.5C 62.5 l Ml
SPAIN
CHERTA 1984 - u.co 296.0 26000 5.90 GARC lA 1984 - 8.00 210.0 17200 5.90 SANTIAGO-DEL-SIL 1965 Sll 12.00 86.0 1!300 3.30 1 '57. 5 [ 11
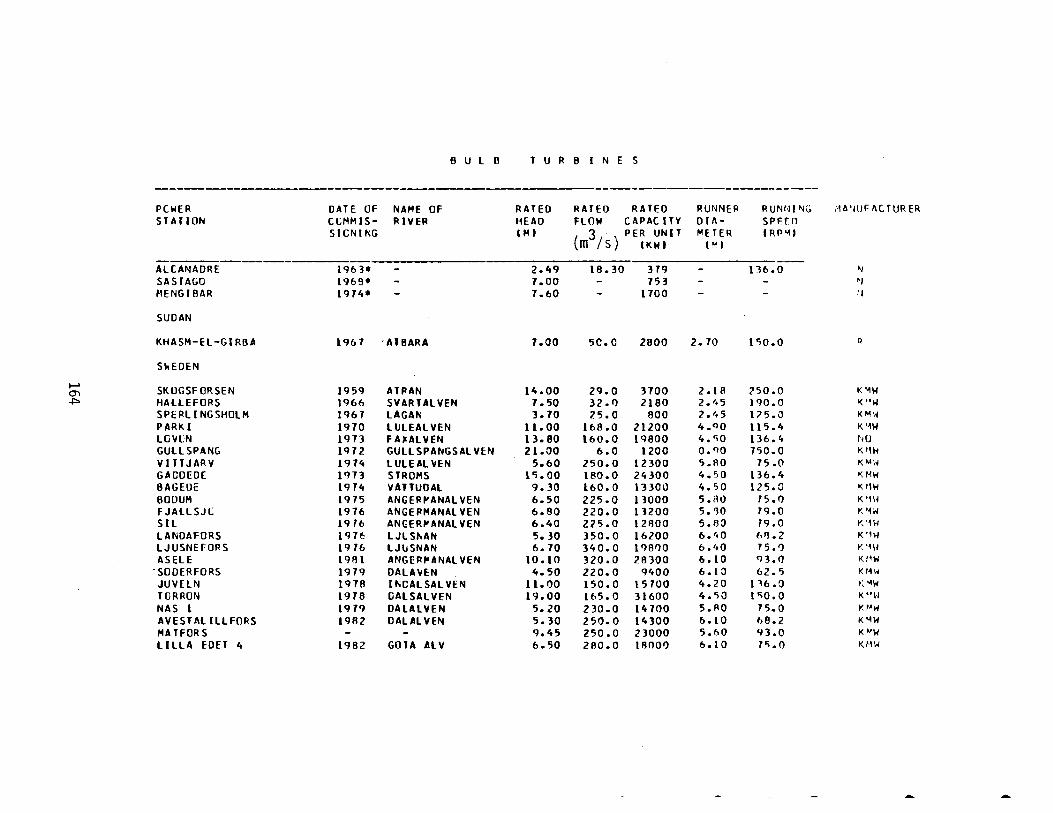
6 U l D T U R 8 I N E S
-------PCWER DATE OF NAME OF RATED RATED RATED RUNNER RUNr.JI~G ;~A~HJFI\CTURER
STATION CCMMIS- RIVER HEAD FLOW CAPACITY Dll\- SPHn SICNI~G on ( 3 · , PER UNIT METER IRP'11
m /S) CKWt pq
-ALCANADRE 1963• - 2.49 18.30 379 - 1)6.0 N
SASTAGO 1969* - 7.00 - 753 - - 'I ~IENGIBAR 1974• - 7.60 - 1700 - - ., SUDAN
KHASM-El-GI RBA 1967 ·AT8ARA 7.00 sc.o 2800 2. 70 1'iO.O Q
ShE DEN
...... SKUGSFORSEN 1959 AT PAN 14.00 29.0 HOO 2.1!1 ?50.0 K '1W 0'1 ~ HAllEFORS 1966 SVARTALVEN 7.50 32.1) 2180 2 ·'•5 190.0 '<"W
SPERLI NGSHOLM 1967 LAGA,._ 3.70 7.5o0 BOO lo 1t 5 175.\J KM\~
PARK I 1970 llJLEAL YEN 1lo00 I6Ao0 21200 4.QQ 115 0 4 K'~W
LGVLN 1973 FAIIALVEN 13.80 160o0 19800 4o'i0 136o ~ t1U GULL SPANG 1972 GULLSPANGSALVEN 21o00 6o0 1200 OoQO 750.0 Kr1w V 1 T T JARV 1974 LULEAL VEN 5.60 250o0 12300 5.80 75o0 K"~H
GAGOEDE 1'l73 STROHS 1';.00 180o0 24300 4o50 136o4 IU~W
BAGEUE 19 74 VATTUOAL 9o 30 160o0 1 330\) 4o50 125o0 I<IIW BOOUM 1975 ANGEP,.,ANALVEN 6.50 225o0 13000 5oAO 75.1) K ~~~~ FJAllSJC 1976 ANGEPHANALVEN 6.80 220o0 11200 5.'10 79.0 Y-"1rl
SIL 19 76 ANGERI"ANALVEN 6o40 225o0 12~00 5o~O 79o0 r,~~w
LANDAFORS 19H: LJLSt.AN 5. 30 350.0 16200 6. 1•0 M.2 K'1\ol LJUSNHORS 19 76 LJlJSNAN 6.70 340o0 1'l81)0 6o40 75oiJ ~ '111
ASELE 19~1 ANGERP'ANALVEN 10 o10 320o0 28300 6 0 10 <>3o 0 KriW ·soDERFORS 1979 OALAVEN 4.50 220.0 9400 6.10 62o5 t<r~w
JUV£LN 1978 lt.CALSALVEN 11o00 150o0 15700 4.20 1~6o0 1; '-~w TOR RON 1978 OALSALVEN 19o00 165o0 31600 4o'i0 1'i0o0 K"l·/ NAS 1 19 79 OALALVEN 5. 20 230.0 14700 5o flO 75.0 to•w AVESTIILILLFORS 1982 OAUILVEN 5.30 250.0 14100 6.10 68o2 K'1W MATFORS - - 9.45 250o0 21000 5o60 qJoO K"W LillA EDET 4 1982 GOTA Al V 6.50 2!10.0 18001) 6.10 7'io0 IUl\ol
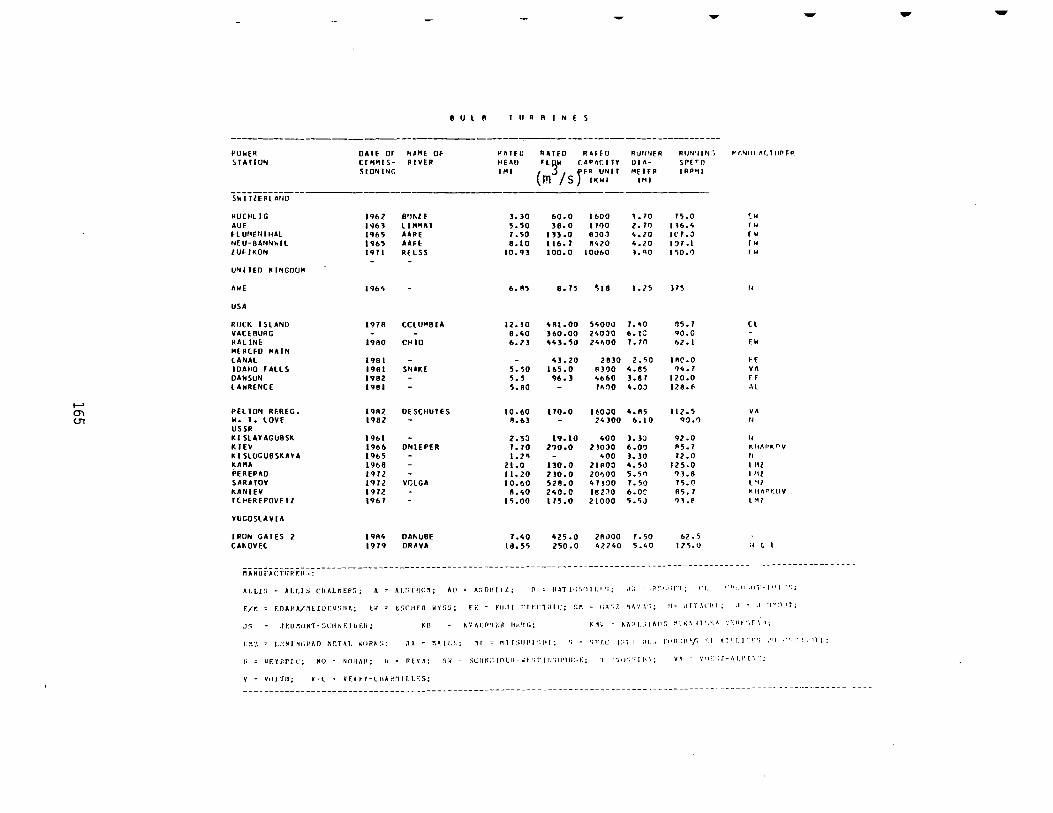
.... - - -
8 u l 8 I U R R I N £ S
--------------------PO~ER DA 1£ or IUME OF PAlEO RA IHI RAifO RtJ'INER RUN'JIN.'", ,..t."'llr A£. I UP FP. SIAIION crotlll s- RIVER HE All Fl~ll CAPACIIT DIA- sr( r 0
SIONING '"' ( rfR UNII 11£ I£ R IPP~I
m /s •~w• I'll
------------Sl<lllERlAilD
NUCHLI G 1962 BIJ~lE ).)0 60.0 1600 ).10 H.O ~w
AU£ 1'161 ll IIIlA I 5.50 )8.0 111)0 2. 11) 136.4 r w Fl UIIEIIIHAl 1965 AAPE 1.50 1n.o 8JOJ 4.20 (Cl.J FW NE U-8ANN1oll 1965 AAPE 8.10 116.1 8420 4.20 I~ 1.1 rw lUF J~ON 1911 RELSS 10.9) 100.0 10060 J.qo 1~0.1) rw
- -UN IT EO I< INGOUH
AWE 1964 - 6.85 8.15 ~18 1.15 H5 " USA
RfJCI\ ISLAND 1918 tClUHBIA 12.10 ~81.00 5400\l 1.40 ~5.1 (l
VACE8UNG - - 8.40 )60.00 240JO 6-1~ '10.0 RACINE 1980 CHIO 6.ZJ H).5tl 24~00 1.70 62.1 rw MERCED IOAIN lANAl 1981 - - It). 20 2810 2.50 IAr.o H IDAHO FAllS 1981 SNAKE 5.50 165.0 Rl'JO 4.85 '14.7 YA DAWSON 1982 - 5.5 96.) 4660 1.81 120.0 ff l AWRENC£ 1981 - 5.80 - 1~no 4.0J 128.f. o\l
..... C) PH ION REREG. I9R2 DE SCHUIES 10.60 110. o I~OJO 4.85 112.5 YA
U'1 11. I. lOVE 1982 - ~.63 - 24100 6.10 q~.l) lj
USSR I\ I SlAYAGU8SI\ 1961 - 2.50 19.10 400 ). )J n.o lj
1\ lEV 1966 DNIEPER 1.10 2?0.0 2JOJO 6.0'} P5.1 Klf!IPJ<nv
I\ I SLUGU8SI\A~A 1965 - I. 2~ - 400 ).)0 12.0 II I\ AliA 1968 - 21.0 130.0 ZIROO 4.5\l 125.0 I 11l PEREPAO 1912 - ll. 20 2)0.0 20'>00 5.51'1 '11.8 I Ill SARAIOV 1'112 VOlGA 10.60 528.0 41100 1.50 15. (l l '<I 1\ANJEV 1912 8.40 240.0 IBZJO 6.oc R5. 1 IUII'\Pt'.OV
ICI<EREPOVE ll 1'16 7 15.00 I 15 .o 21000 5.5J '11.~ l'<l
YUGOSlAV I A
IRON GAlES 2 I 9A4 DAPiUOE 7.40 "'25.0 281)00 1.50 62.5 CAI\OVEt 1919 DR AVA 18.55 250.0 42240 5.40 IB.O ;j ~
t'IANUFAC:TIIR~:H.;:
ALL15 ~ ALLIS CIIAL~~~~; A l.;.lllC:1; All '== A:: f.) II I'rl,: n = II AT l·i~lnll.~'i; ,1;: - ,jl'"•:•lf'l; r'f.- ··••:.IJ:,tJi'-1"1
f/r. tnAHA/~llUJ:!l';JI~; ~J t.:iCitfR WY~O~; fr: - f'IJ.IJ rU:t·1:11c; r." :.. r;,,·;t: M".'J.\ :; !I= dJT.\Citl; .J "' ,I .:I'"')"IT;
.J ~; .J f:IJ r.ONT-:iCII N r: IIJ Eli; Kll 1\li~EP'Ii:.rt ll1t'IG; 1\'1:.: - t.A<'I.:ill\11~ :1:1\~ lJ'.~;" ·;r·nr·~f\1'~
1.:-o.:~"' l.i:!HNt;(t~O 11r.T"J. h'OR"-:~; ,),\ :- !",1\(E:h; ,, f"''lf:;lll\1';11(; 'i •.;rt.L (::11 :11·, JriR:IPFo ''I .-.~•·J.J:' 1 "i ,Ill ·····r~ .. ·l'J);
"F.YHIC; NO NOJ!r\B; ntv,,; ;.<i - SLI!Pii:rntr!-.a.·>rJw;uqu:;f; •"j()::·ltlt',; v .o, - v•1: ·; r- r, 1.1' ,., .. ;
Vrl l'fll; v -( VEVtY-LIIAil~lti.L~S:
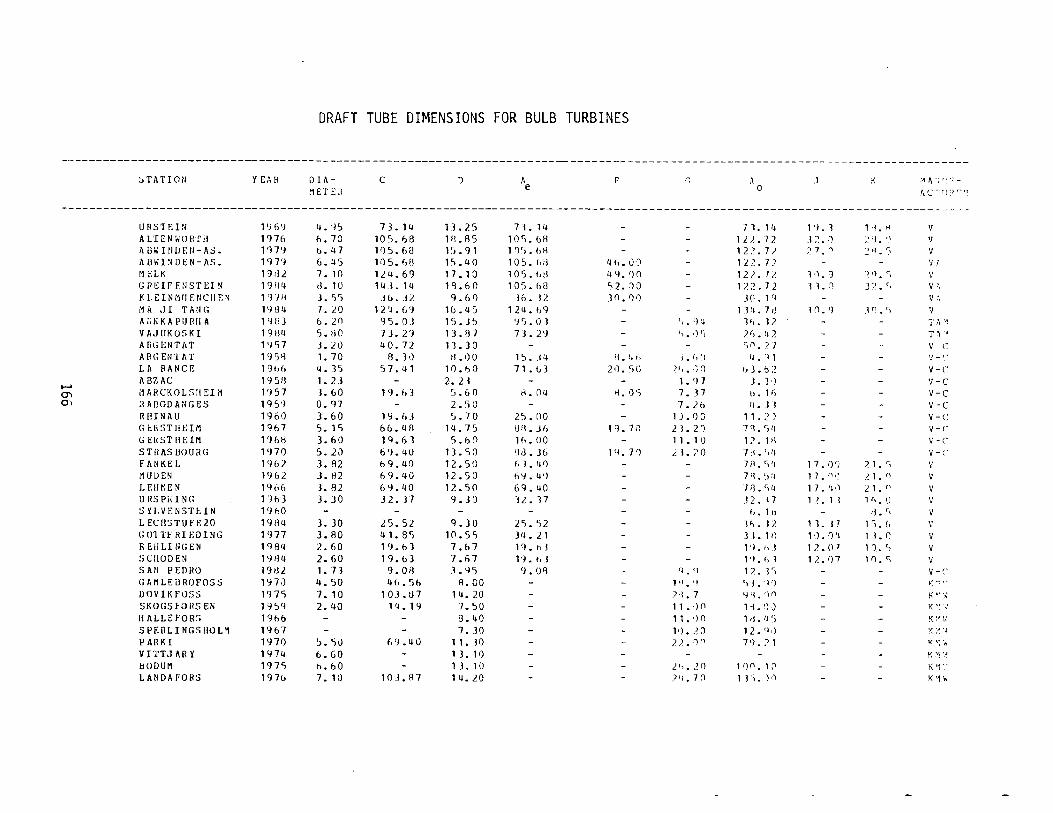
DRAFT TUBE DIMENSIONS FOR BULB TURBINES
-------------------------------------------------------------------------------------·-------------------------------------------:; TAT I 011 Y E.~ H D lh- c 0 A F' (~ ,\ .J ;\ .. , ~ ·;' . -
MET E:l e 0 !\ c··· I I:) r~ ·~
--------------------------------------------------------------------------------------------------------------------------------URSTF.IN 1Yf><J lj. 'l~ 73. 14 11. 2 r, 7"1.14 - - 7 l. 111 1 'I. l 1 l. H v A LTENWOH'fil 1'l76 h. 70 10 5. 6B Pl. fl5 1 or,. 6H - - 1 2). 7 2 .!;>. ') ~~ .- J • , ' " A U\i Iti!JE!l-AS. 1 ') 7'J h. 4 7 105.68 1'). 91 1 ')r,. €r8 - 1 2.1• 7 I ~ 7. ('\ ~ ~. ~' v A Ulll:-l DEN-AS. 1 '}7'1 6.45 11) 5. f,B 1">. 4 0 10 5. hd 11 h. OJ - 1 <>2. n - - v ,· M ELK 1J:l2 7. 10 124.69 17. 1 () 1 or,. htl lj 'l. ')0 - 122. 7!. H.) ·~ r) • r 1 v G fl(;lf ftiSTEl N 1 ')fill d. 10 14 3. 14 1q.6Q 1 o:,. h8 "2. 1 J - 17.2. 72 l1. ,"\ J? • cl v" !< l.t:IN11TJ EtiCliF:~ 1 '17!! J • c,r, .1&. J2 'l.60 3o. 32 311.')1) - 30. 1 ') - v .. i1 il ,J I T f1 :H~ 1'184 7. J.O 1 2 ·~ • (,'I 1(). 4 5 1 2ll. fJ9 - 11'1. 71) l '). ') .10. r) v h ;1 1\ K A P IJ B !1 A 1 '1113 b. 20 95.0.1 1~.J'J 'J 'J. 0 J - ll. '):.t 1 ,, • 17. - - 'l' A .. ~ VAJliKOSKl 1 9Hil 'i.HO 73.21 13. fJ7 7 3. 2'J - 1). i)~"J ;~r,. 112 - - T ~ .,
ARGENT/IT 1 'J'i7 J. ;w 40. 72 11. 3 0 - - - c, ('>. ')_ l - - v- (~
A[lt;ENThT 1 'l ')~ 1. 70 8. J ,) 1!.00 15 • .14 f\.l't") i. r, n fj. 11 - 1!- ,.
LA RhNCE 1 ');,(, 4. 35 57. 41 10.f:>O 7 1 • t.>J 20. 01G )f,. :~ n ,, 3. b 2 - - v-c ABZAC 19 ')ij 1. 2 j - 2. 2 j - - 1. ') 7 J. ) •) - 'J-C ...... i1AHCKOL:,IIEIM 1'l57 1. 60 19. h 3 S.60 ii. 04 rl. •) ') 7. 3 7 0"> t>. 1 r, - - v-c
0> :lAflODANGES 19 S'l O.'l7 - 2.'>0 - - 7.26 II. J I - - v-c RIHNAU 1960 ).60 1'1. fd s. 7 0 25. 00 - 1 J .0 G 11. 2) - - v -1'
GEHSTIIEIM 1967 5. 15 66.Lifl 14.75 f]Jl. j r, 1 'l. 7<1 21.20 7 'l. r,tl - v- ,. GEHSTilEIM 1 '} 61:) 3.60 1Q.61 5.60 1 (,. 00 - 1 1 • 1 () J.>. Pl - - v-c STHhS IJOUilG 1 'J71) 5. 2J 6 'J. llO 13. so 'lil. )b 1 Y. 7'l ). l. 70 7:1. ··,II - - v- :· FhNKEI. 1962 3. A2 b 9. 40 12.50 (,]. ,, f) - - 7ft. c-)
11 1 7. ;)'j /. 1 • r, v M UlJEN 1'J 62 J. i:J2 69.ll0 12.5 0 (,y. ll') - - 7•!. ,.,,, 17. "': .! 1. 0 v L F.llr.E N 1 'lt>6 J. 82 6 ':l. 40 12.50 69. 40 - - 1 fJ • r, II 17. fill ;>1. (I v UllSPiiiN<; 1'Hd 3.30 J 2. J7 9.30 ·u. n - - !2. 17 1?. 1 l 1 (,. <.) v ~iYI.'H~N3T~!N 1 'J 60 - - - - - - h. 1 ,, - ~ l .. r, v L E:CilSTUFE20 1YUll 3 • .10 25.52 9.)0 2S. S2 - - ~~ • .12 1 1 .. 1 7 1 r) • (, \' (; OTH Rl 1-:D 1 NG 1 '177 3.80 41. 8r1 10.5') 311. 2 1 - - JL 1>! 1•.). ']II 1 1. r v R £Hll tH;EN 1 '184 2.60 1 'l. b) 7.67 1'l. til - - 1 'l. t.J 1 ;>. ()7 1'). '> v SCIIODEN 1'1H4 2.60 1 'l. b) 7.67 19. ,, l - - 1'l. fr 1 1 2. 1)7 11). ') v SAN PEOHO 19tl2 1. 7l 9.0il .l. 'l ') 'J. Ofl - q. (J 1/. • J rl V-C GAMLEiJROf'OSS 1Y7J 4. 50 4h.')h A.OO - - 1 \I • 'l ,, 1 • ·l ') - ~: •·. "
DOVlKFOSS 1'J7S 7. 10 1 OJ. tl7 14. 20 - - 7'l. 7 Y1l. 'l" - K ,.. ·.;
SKOGSFOflSEN 1'15'1 2. 40 1 I~ • 1 9 7.50 - - 11. ·)f1 1 'l. ') J - - K ·: ·;
ll ALLEf'OR:; 1966 - - 8.40 - - 11. ')0 1 d. ,, ~) - - ~ '~ \.' SPF.flLINGSIIOLM 1967 - - 7. 30 - - 1•) • . !~ 12. q •l - - :\ ;.~ . ./ PARK I 1':171) ~.'JU (,'I .4 0 1 1 •. 10 - /).11'1 7<}. ;> 1 - - \("'' ' ~ V ITTJ AR Y 1 <j 74 &.GO - 1 3. 10 - - - - - - K ~~ ·.~
IJODUM 19 75 h.60 - 1 J. 10 - - .! ,, •• ~I) 1 0". 1i' - l\'1" L AliDA FORS 1 'l7u 7. 10 10 .l. A7 14. 20 - - /'!. 7 0 1 J'). )(\ - - K ·n;
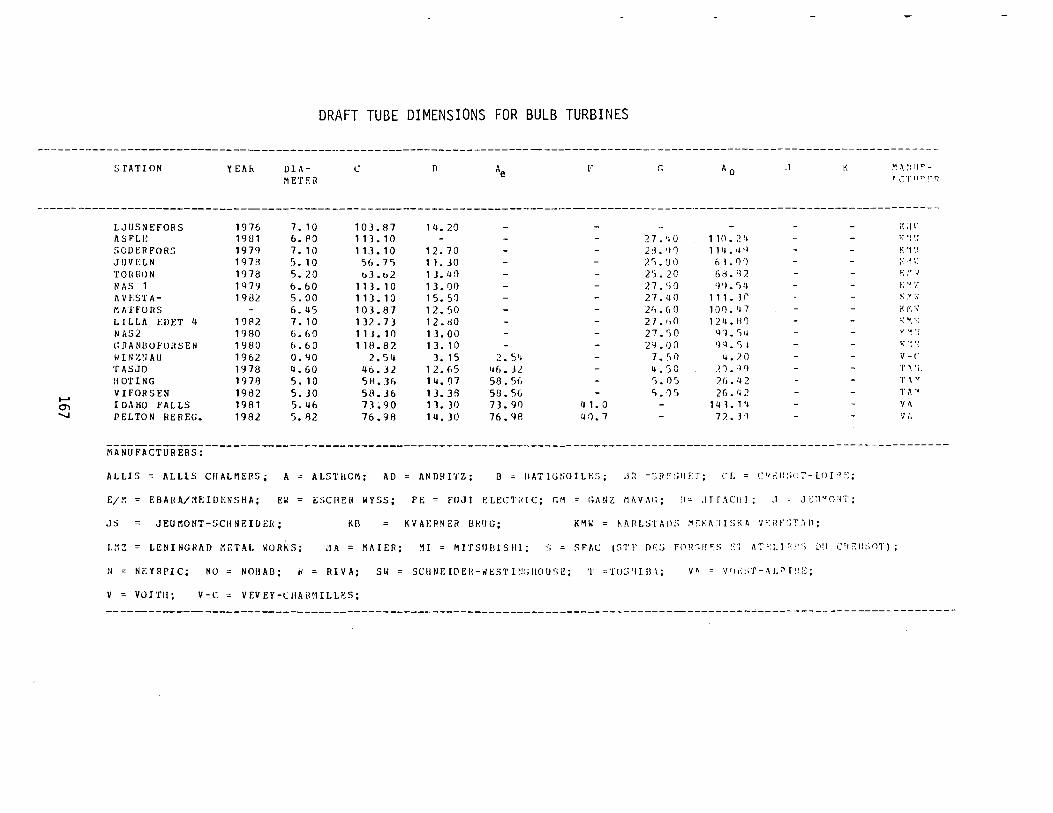
~ 0"1 -...,J
SfATION
LJUSNEFORS 1\SFLJ: SODER FOR!) J IJV ELN TOHilON N liS 1 fl VF.S'l' II-Mll'l'fO!lS LILLfl F.DET 4 N AS2 c:JlAN!IUf'OilSEN W INZtl AU 'f fiSJO HOT I NG V IFORSEN IO,\HO FALLS PELTON REilEG.
MANUFACTURERS:
YEl\h
1976 19tl1 197'1 1'lB 1978 1 'l7 'l 198L
-1982 19fl0 1980 1962 1978 197fl 1982 1981 1982
lJili~ETF.il
7. 10 6. flO 7. 10 r,. 1 0 5. 20 6.60 5.00 6.45 7. 10 6.60 6.60 0.'10 11.60 5. 10 5.JO 5. 46 5. ll2
DRAFT TUBE DIMENSIONS FOR BULB TURBINES
c n "e F
103.87 1 4. 20 - -11).10 - - -113.10 1 2. 70 - -')6.75 11. JO - -bJ.o2 1 J. u 0 - -
11 3. 10 1 3. 00 - -113.10 15. 51 - -103.87 1 2. 50 - -137..73 12.d0 - -11 J. 10 1 J. 00 - -11A.82 1 3. 10 - -
2.54 3. 15 2. 5 1 ~ -46.J2 1 2. 115 116. J2 -c;H.Jo 111. 07 58.% -5!l.J6 13. 38 5U. 5& -73.90 1 ) • )() 73. 91) 4 1. 0 76.98 14. JO 76. 'Hl 4().7
r, r, o ,J K
- - - -'.n. '10 1 10. 2 II -2:l. 'I '1 111J.ij•l - -7.'>.01} i) l. I):) - -2'>. 20 6 >j. 'l /. - -2 7. 'i I) ')'}. 5 lj - -27.40 111. 1 r -2''· I, 0 1 Ji). lj 7 - -27. ,,o 1211. H') - -27. r> 0 '11. ')II -L9. 00 ·n. 5·1 - -
7. r,o 4.)() - -4.50 :n.'~'l - -~). 0 s /.(i.:. 2 -'). ·15 26.!+2 - -- 1 4 1. 1 'I - -- 77..3'1 - -
ALLIS = ALLIS CHALMERS; A ALSTIICM; AD = 1\NDHI'I'Z; [3 = BATlGNOTLfo:~; d:1 =~jJ(;~;rJFT; CL = cr~;~t!:;I!7-LOI·l~·:;
E/1': EBAH A/ :H; 10 ENS HA; Eil ESCitER WYSS; FE = FUJI ~:LECT:liC; r.M = r;ll!lZ rl!.V,\1:; 'I~ ;ITT.\CIII; .1 c J;::J''O'n';
JS JEUMONT-SCHNEIDEU; K£l KVAER'lER BH 1JG; K '1 li = 1\ II II L S 'I' ll fl S :'1 r. 1\ II :II ~; 1\ ~ V 1·~ in' :; T ,, fl ;
~ . .\~;II~-! CT nn !~r;
i\:lt' I·~ •; ~:
K '4 fl ,, ;\'1i:
t.; ,'' ~'
t; ~ ; .. · f'V" . ·' i<l·:·.; ".\'1,'·: y '" ., ~.;·:··:
v-c T' 'i
T \ '' T ,\ .,
v~
v ;\
1.:12 LENINGHIID ~ETAL WORKS; liA = 111\IER; MI = MITSIJ£J1Sill; :. = SF'AC (::>TF 01·::; FPfl~H·~s !''! ~"!'1\I.l'<!"; Llll C!r~IJ~;<JT);
N Nr:YRPIC; NO NOIIA!l; k RIVA; Sl< = SCBIIEIDEil-i<lt:STU!:;IfOUO.E; T ='fO:_j'!Jil\; v•. = V'Ji::;'f-~LI"l!!!o;
v VOITI!; v-c V EV EY-C IIA il!H I. u;s;
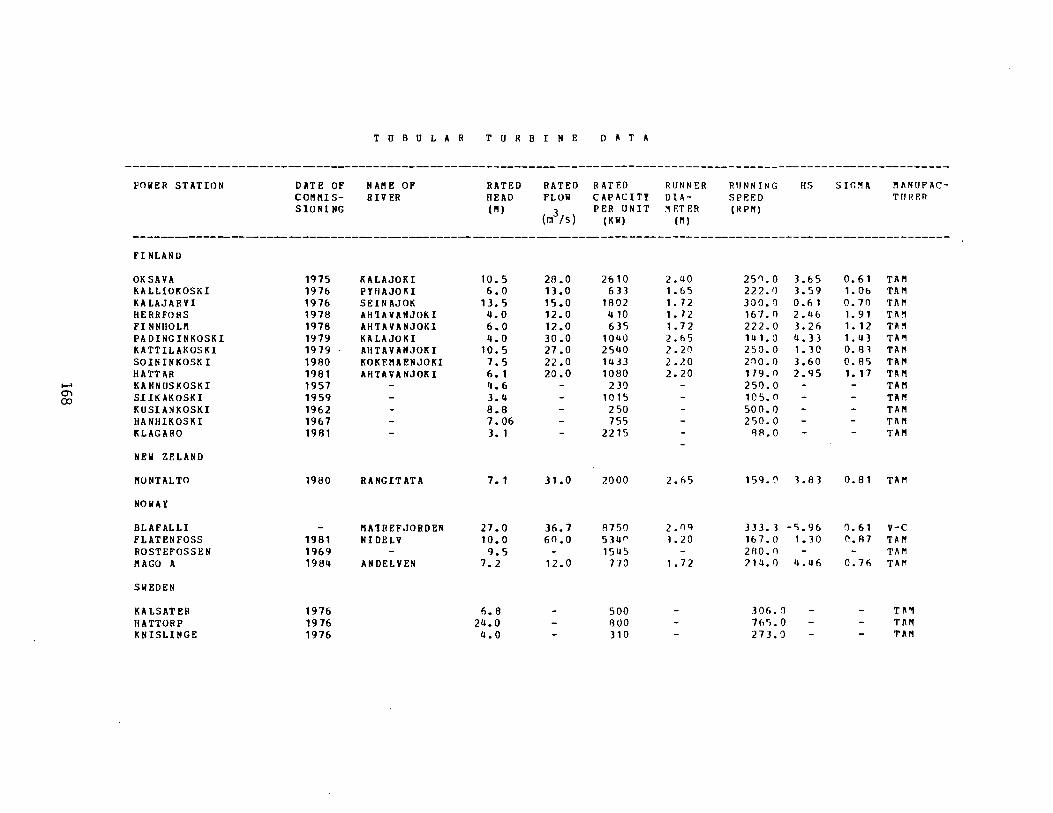
..... m co
!'OilER STATION
FINLAND
OKSAVA KALLIOKOSKI KALAJARVI HE RRFO RS FI NNIIOLII PADINGINKOSKI KATTILAKOSKI SOININKOSKI HATTAR KA NNUSKOSKI SIIKAKOSKI KUSIANKOSKI HANHIKOSKI KLAGARO
NEil ZELAND
11UNTALTO
NOWAY
DLAFALLI FLATEN FOSS ROSTEFOSSEN IIAGO A
SWEDEN
KA LSATER RATTORP KNISLINGE
DATE OF COI11USSIONING
1<J75 197b 197b 1978 1978 1979 19 79 1980 1981 1957 1959 1962 1967 1981
1980
1981 1969 1984
1976 1976 1976
T U B U L A R
NA11E 01' BIV ER
KALAJOKI PYilAJOKI SEIN AJOK All1A VANJOKI AHTAVANJOKI KALAJOKI AHTAVANJOKI KOKFIIAENJOKI AHTAVANJOKI
RANGITATA
IIA1REFJOBDEN NIDELV
ANDELVE!f
T U R D I N E
RATED READ (II)
10. 5 6.0
13.5 4.0 6.0 4.0
10.5 7.5 6. 1 4.6 3.4 8.8 7.06 3. 1
1. 1
27.0 10.0 9.5
7.2
6. 8 24.0 4.0
RATED PLOII
(rn3;s)
20.0 13.0 15.0 12.0 12.0 30.0 27 .o 22.0 20.0
31.0
36.7 60.0
12.0
D A T A
RAT ED CAPACITY PER UNIT
(KII)
2610 633
1802 4 10 635
1040 2540 14J3 1080
2 30 1015 250 755
2215
2000
A750 534" 1545
770
500 ROO 310
RUNNER DIA-... F.T Ell
(1'1)
2.40 1. b5 1. 7 2 1.72 1. 7 2 2.65 2.20 2.20 2.20
2.65
2.0<J l.20
1. 72
RUNNING SPEED (R Pl'1)
25'l.O 22 2. f) 300.0 167.0 222.0 141.0 250.0 2~0.0
179.0 250.0 10 5. n 500.0 250.0
flfl.O
HS
J. 6 5 3.59 0. 6 1 2.4b .1.26 4. ]J
1.] 0 3.60 2.<J5
159.0 3.8]
333. J -S.9b 167.0 1.30 2AO.O 214.0 4.46
306.0 765.0 27 3. 0
sir.~ A
0.61 1. Ob 0.70 1. 91 1. 12 1.10 o. 8l 0.85 1. 17
1'11\NUFACTifRP.R
Tl\1'1 TAI"' TIIM Tl\1'1 THI TA., TAI'I TAI'1 TAI"' TAll TAI'I TAP'! Tl\11 TAll
0.81 TAI'1
0.61 v-c n.A7 Tl\1'1
Tllrol 0.7f> TAM
TTl"' Tl\1"1 TAI"'
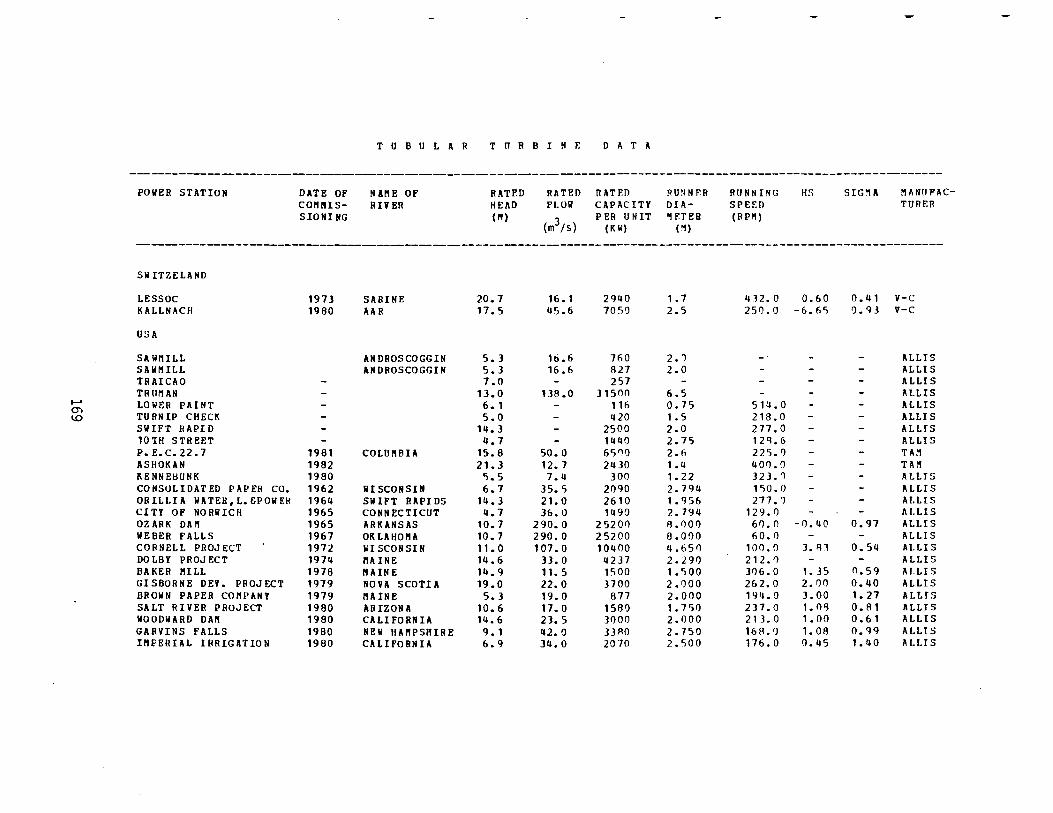
...... C"' 1.0
POWER STATION
SWITZELAND
LESSOC KALLNIICII
USA
SA WI'IILL SAWMILL TRAICAO TRUMAN LOWER PAINT TURNIP CHECK SWIFT RrtPID 10TH STREET P.E.C.22.7 AS HOKAN KENNEBUNK CONSOLIDATED PrtPER CO. ORILLIA WATEH,L.&POWER CITY OF NORWICH OZARK DAM WEBER FALLS CORNELL PROJECT DOLBY PROJECT BAKER lULL GISBORNE DEY. PROJECT BROWN PAPER COMPANY SALT RIVER PROJECT WOODWARD DAM GARYINS FALLS IMPERIAL IRRIGATION
DATE Of' COIII!ISSIONI NG
1973 1960
1981 1982 1960 1962 1964 1965 1965 1967 1972 1974 1976 1979 1979 1980 1960 1960 1960
TUBULAR
NAI'IE OF RIVER
SABINE AAR
ANDROSCOGGIN ANDROSCOGGIN
COLU!'IBIA
III SCONSIN SWIFT RAPIDS CONNECTICUT ARKANSAS OKLAHOIIA liiSCONSIN rlr.INE !lAINE NOVA SCOTIA !'lAINE ARIZONA CALIFORNIA NEW HAriPSRIRE CALIFORNIA
T 0 R B I N E
RATP.D HEAD (II)
20.7 17.5
5.3 5.3 7.0
13.0 6. 1 5.0
14. 3 4.7
15.8 21.3
'>.5 6.7
14.3 4.7
10.7 10.7 11. 0 14.6 14. 9 19.0 5.3
10. 6 14. 6 9. 1 6.9
RATED FLO II
(m3ts)
16.1 115.6
16.6 16.6
1]8 .o
50.0 12. 7 7.4
35. 5 21. 0 36.0
290.0 290.0 107.0
JJ. 0 11. 5 22.0 19.0 17. 0 23. 5 42. 0 311.0
D r. T A
Rnf.D CAPrtCITY PER UNIT
(KW)
2940 7050
760 8.27 257
3 1500 116 420
2500 1441) 6'>"0 2430
301) 2090 2610 1490
2 5200 25200 10400
4237 1500 3700
877 1560 3000 ]3Fl0 2070
RU~INP.R
DIA"F.TER
("')
1.7 2.5
2.'1 2.0
6.5 0.75 1.5 2.0 2.75 2.n 1. 4 1.22 2.794 1.956 2.794 A.OOIJ 6.000 11.651) 2.290 1. '>00 2.000 2.000 1.750 2.000 2.750 2.'>00
RUNNING SPEED (RPI'I)
HS
4]2.0 0.60 250.0 -6.6'1
514.0 216.0 277.0 12'1.6 225.1) 401).0 323. () 150.0 277. 'l
12 9. 0 60.0 60.0
100.0 212.1) 306. 0 26 2. 0 194.0 237.0 21 3. 0 16 R. '> 176.0
-0.4(1
3. A 1
1. 35 2.00 J. 00 1. O'l 1.00 1. 08 0.45
SIG.,A !lldW'PACTURER
o.41 v-c o. 'H v-c
0.97
0.54
0.59 0.40 1.27 O.R1 0.61 0.99 1. 4 0
ALLIS ALLIS ALLIS ALLIS ALLIS ALLIS ALLIS ALLIS TAM TAll ALLIS ALLIS AI. LIS ALLIS ALLIS ALLIS ALLIS ALLIS ALLIS ALLIS ALLIS 1\LLTS ALLIS ALLIS IlLLI S
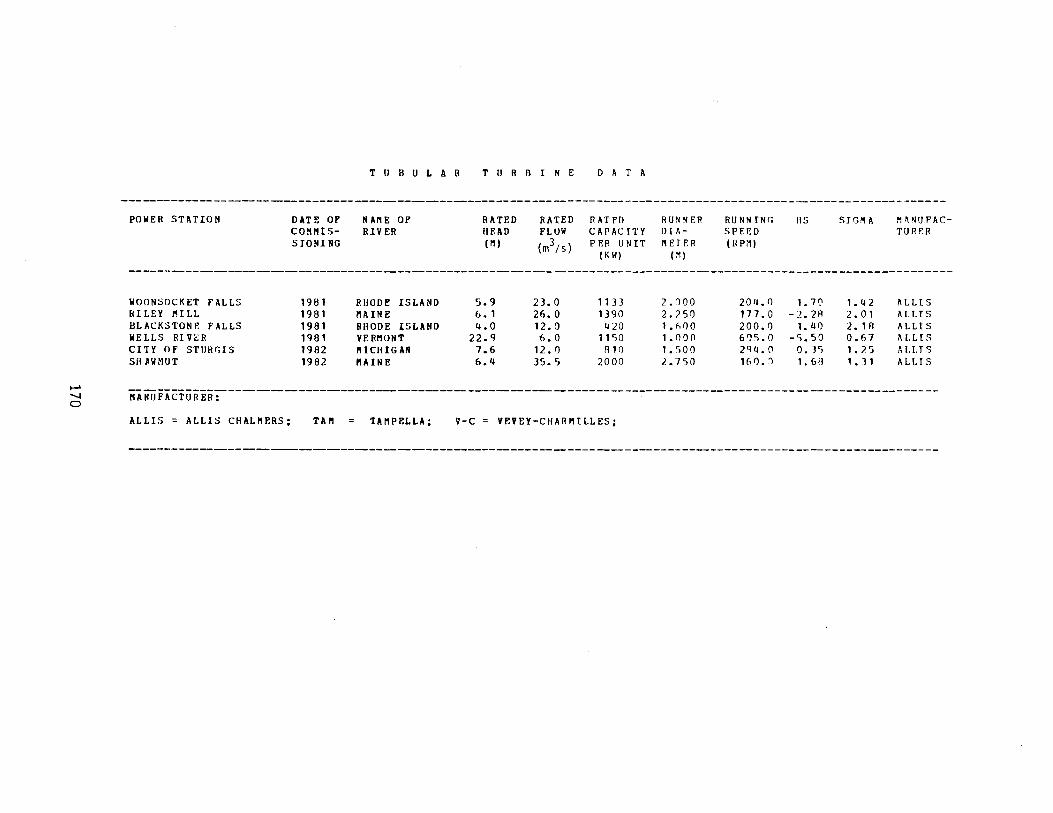
-" 0
POWER STATION
WOONSOCKET FALLS IHLEY IHLL BLACKSTONE FALLS WELLS RIVER CITY OF STURr.IS SH 11\IMUT
DATE OF CO~I"JIS
SJONI NG
1981 1981 1981 1981 1982 19 82
T U B U L A R
NAIH 01" RIVER
RHODE ISLAND !lA INE BIIODE ISLAND VER!IUNT PIICHIGAN PlAINE
T U R f3 I N E
RATED HEAD (1"1)
5.9 6. 1 4.0
22.9 7.6 6.4
RATED f'LOW
(m3;s)
23.0 26.0 12. a f>.O
12. I) 35. 5
D A T A
RATFO CAPAC TTY PER UNIT
(K W)
11 33 1390
4 20 1150
fl1() 2000
RUNNER 0111-IHfER
(~)
2.000 2.25rJ 1.hi)Q 1.000 1.'iO'l 2.750
RUNN IN(; SPEED (HPM)
2011.0 177.0 200.1) 6'l'i.O 294.0 161).1
HS
1.70 -:~.2A
1. 40 -').50
0. J'j
1. 6fl
STG,.. A
1.42 2. 0 1 2. 1 A 0.67 1. 25 1 • 3 1
M~NU'F'AC
TURf.R
IlLLIS ALLIS IlLLI S II !.LIS II I.I.T S ALLTS
------------------------------------------------------------------------------------------------------------------PIANUFACTURER:
ALLIS = ALLIS CHALPIERS; TA PI TAMPELLA; V-C = YEVEY-CHARI"JILLES;
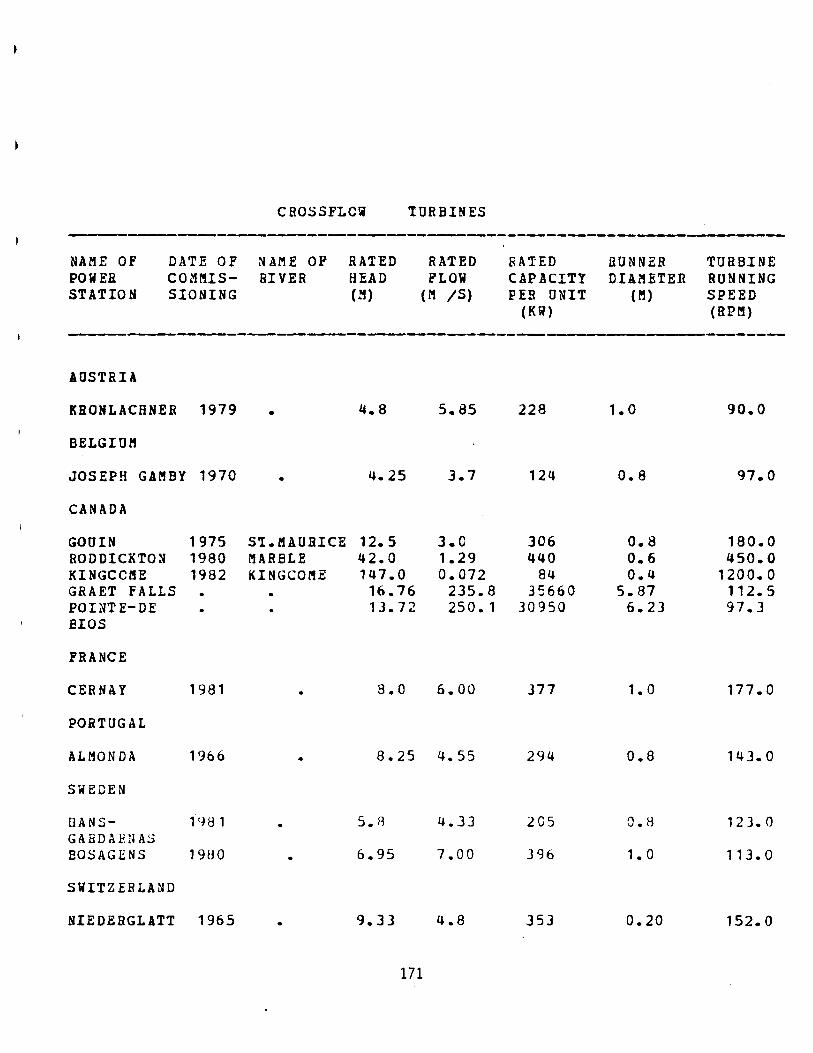
CROSSFLCW 'IURBINES
------- ------------- --NAME OF DATE OF NAME OP RATED RATED RATED RUNNER TURBINE PO WEB COM IUS- RIVER HEAD FLOW CAPACITY DIAMETER RUNNING STATION SIONING (M) (M /S) PEB ONIT (fi.l) SPEED
(KW) (RPM}
---------------- ----AUSTRIA
KROHLACHNER 1979 • 4.8 5.85 228 1. 0 90.0
BELGIU!!
JOSEPH GAl'.~ BY 1970 4.25 3.1 124 0.8 97.0
CANADA
GOUIN 1975 S'I.t!AUBICE 12.5 3.0 306 0.8 180.0 RODDICKTON 1980 MARBLE 42.0 1.29 440 0.6 450.0 KINGCC~E 1982 KINGCOL'!E 147.0 0.072 84 0.4 1200.0 GRAET FALLS 16.76 235.8 35660 5.87 112.5 POI~TE-DE 13.72 250. 1 30950 6.23 97.3 EIOS
FRANCE
CERNAY 1981 3.0 6.00 377 1.0 177.0
PORTUGAL
ALMONDA 1966 8.25 4.55 294 0.8 143.0
SWEDEN
BANS- 1Y81 S.H 4.33 2G5 O.H 123.0 GAiiDAE~~AS
BOSAGENS 19UO 6.95 7.00 J96 1. 0 113. 0
SWITZERLAND
NIEDERGLATT 1965 9.33 4.8 353 0.20 152.0
171
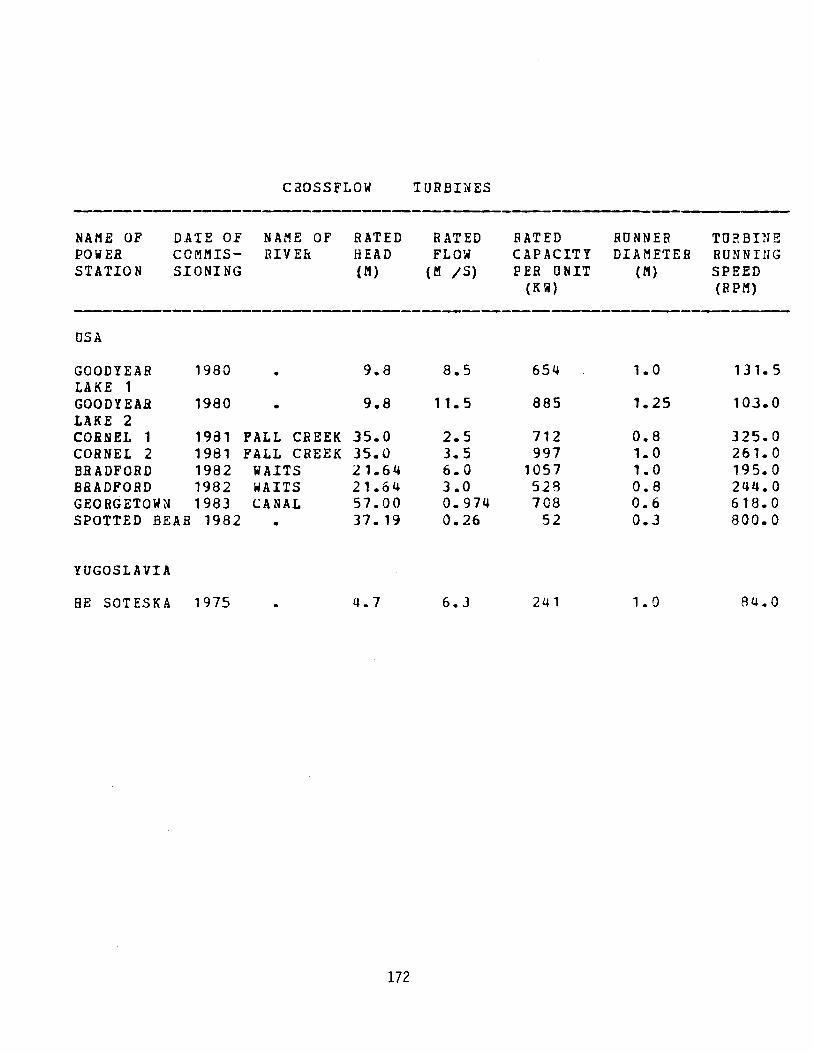
CROSS FLOW IURBDlES
--- ---- --NAME OF DA'IE O.F NAME OF RATED RATED BATED BONNER TORBDIE POWER CO MMIS- RIV Eft HEAD FLOW CAPACITY DIAMETER RUNNING STATION SIONING (!1) (M /S) [lER ONIT (M) SPEED
(K W) (RPM)
------- ---------- --------OSA
GOODYEAR 1980 9.8 8.5 654 1. 0 131. 5 LAKE 1 GOODYEAH 1980 • 9.8 11. 5 885 1.25 103.0 LAKE 2 COHNEL 1 1981 PALL CREEK 35.0 2.5 712 0.8 325.0 CORNEl 2 1981 PALL CREEK 35.0 3. 5 997 1. 0 261.0 BRADFORD 1982 WAITS 21.64 6.0 1057 1.0 195.0 BRADFORD 1982 WAITS 21.64 3.0 528 0.8 244.0 GEORGETOWN 1983 CANAl 57.00 0.974 708 0.6 618.0 SPOTTED BEAR 1982 • 37.19 0.26 52 0.3 800.0
YUGOSLAVIA
BE SOTESKA 1975 4.7 6.3 241 1. 0 84.0
172
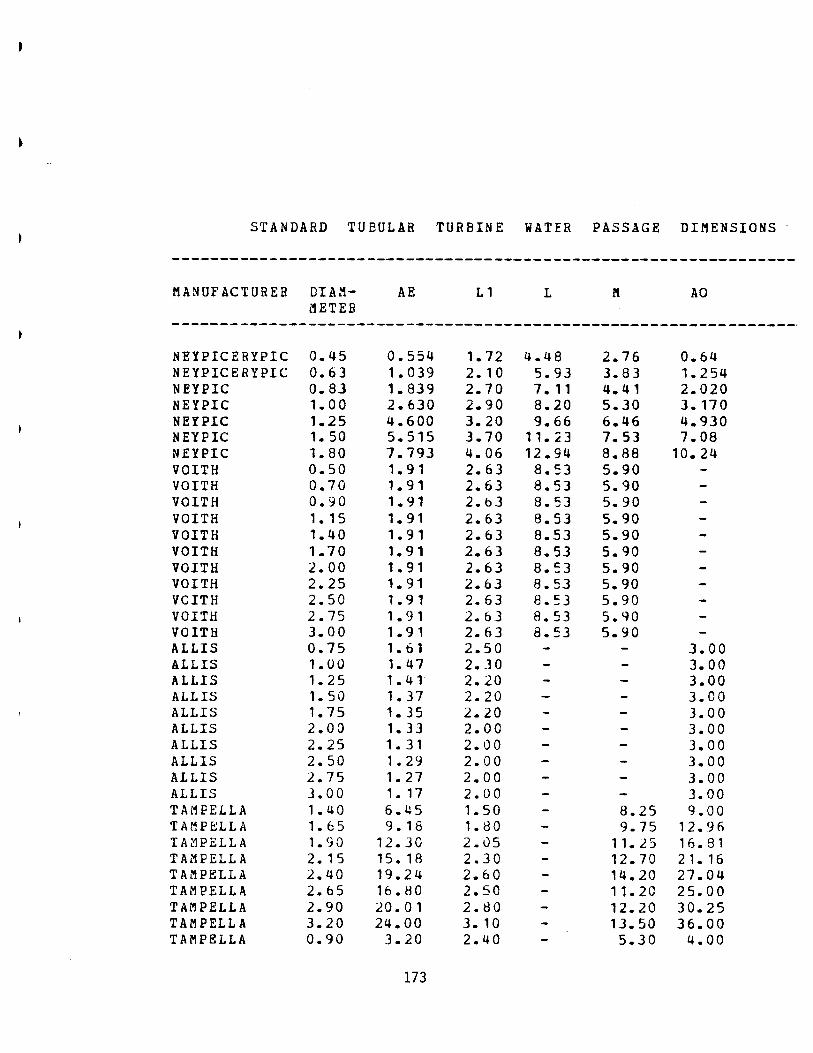
STANDARD TUBULAR TURBINE WATER PASSAGE DIMENSIONS
----------------------------------------------------------------· MANUFACTURER DIAM- AE 11 L ft AO
METER ----------------------------------------------------------------· NEYPICERYPIC 0 .. 45 0.554 1 .. 72 4 .. 48 2.76 0 .. 64 NEYPICERYPIC 0 .. 63 1.039 2. 1 0 5.93 3 .. 83 1.254 NEYPIC 0.83 1. 839 2.70 7. 11 4.41 2.020 NEYPIC 1 .. 00 2.630 2.90 8.20 5.30 3.170 NEYPIC 1.25 4.600 3.20 9.66 6.46 4.930 NEYPIC 1. 50 5.515 3.70 11.:l3 7.53 7.08 NEYPIC 1.80 7.793 4.06 12.94 8.88 10.24 VOITH 0.50 1. 91 2.63 8.53 5.90 VOITH 0.70 1.91 2.63 8.53 5.90 VOITH 0.90 1.91 2.63 8.53 5.90 VOITH 1. 15 1.91 2.63 8.53 5.90 VOITH 1. 40 1.91 2.63 8.53 5.90 VOITH 1.70 1. 91 2.63 8.53 5.90 VOITH 2.00 1.91 2.63 8.53 5.90 VOITH 2.25 1. 91 2.63 8.53 5.90 VCITH 2.50 1. 9 1 2.63 8.53 5.90 VOITH 2.75 1. 9 1 2.63 8.53 5.qo VOITH 3.00 1. 9 1 2.63 8.53 5.90 ALLIS 0.75 1. 6 1 2.50 3.00 ALLIS 1.00 1.47 2.JO 3.00 ALLIS 1.25 1.41 2.20 3.00 ALLIS 1. 50 1.37 2.20 3.00 ALLIS 1. 75 1. 3 5 2.20 3.00 ALLIS 2.00 1. 3 3 2.00 3.00 ALLIS 2.25 1. 3 1 2.00 3.00 ALLIS 2.50 1. 29 2.00 3.00 ALLIS 2.75 1.27 2.00 3.00 ALLIS J.OO 1. 17 2.00 3.00 TAM PELLA 1.40 6.45 1. 50 8.25 9.00 TAMPI:;LLA 1. 6 5 9. 18 1.80 9.75 12.96 TA~PELLA 1.90 12.30 2.05 11. 2 5 16.81 TAL'IPELLA 2. 1 5 15. 18 2.30 12.70 2 1. 16 TAMPELLA 2.40 19.2 4 2.60 14.20 27.04 TAM PELLA 2.65 16.80 2.50 11.20 25.00 TAl'IPELLA 2.90 20.01 2.80 12.20 30.25 TAM PELLA 3.20 24.00 3. 10 13.50 36.00 TAMPELLA 0.90 3.20 2.40 5 .. 30 4.00
173
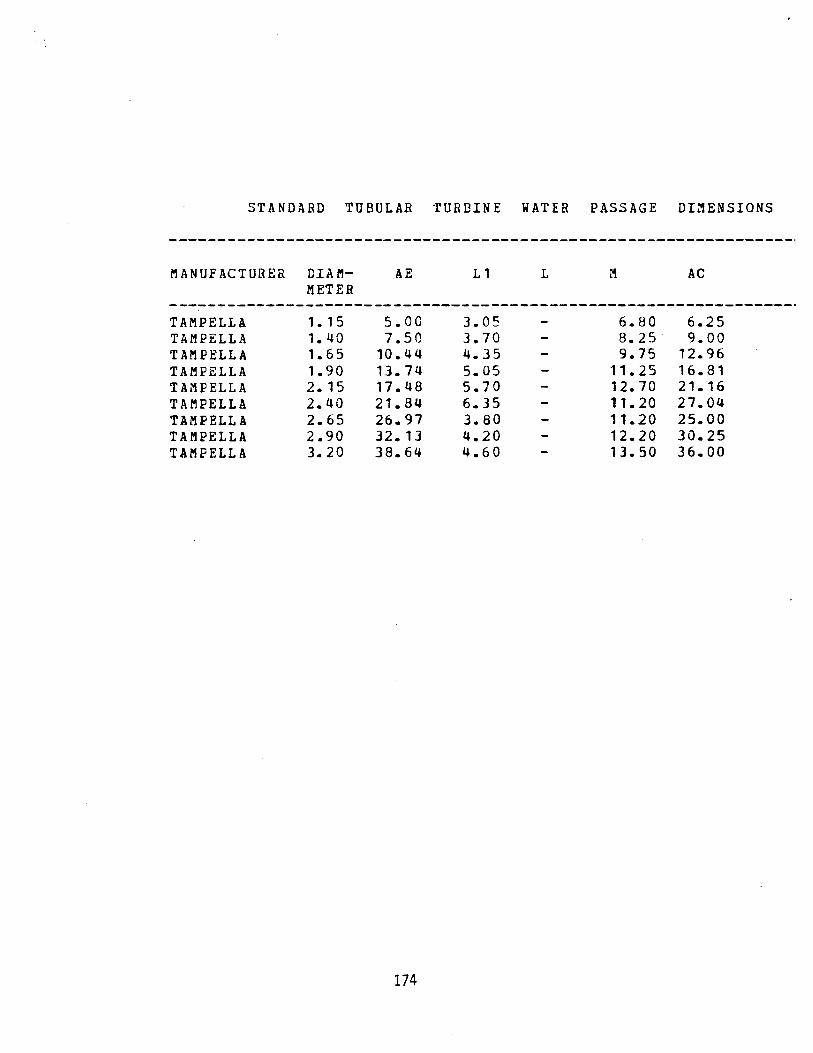
STANDARD TUBULAR TURBINE WATER PASSAGE DI~ENSIONS
MANUFACTURER DIAM- AE L1 L M AC METER
----------------------------------------------------------------· TAMPELLA 1. 15 5.00 3.05 6.80 6.25 TAM PELLA 1. 40 7.50 3.70 8.25. 9.00 TAM PELLA 1. 6 5 10.44 4.35 9.75 12.96 TAMPELLA 1.90 13.74 5.05 11.25 16.81 TAMP ELLA 2.15 17.48 5.70 12.70 21.16 TAMPELLA 2.40 21.84 6.35 11.20 27.04 TAMFELLA 2.65 26.97 3.80 11.20 25.00 TAMPELLA 2.90 32.13 4.20 12.20 30.25 TAMPELLA 3.20 38.64 4.60 13.50 36.00
174

APPENDIX 4
COMPUTER PROGRAMS
175
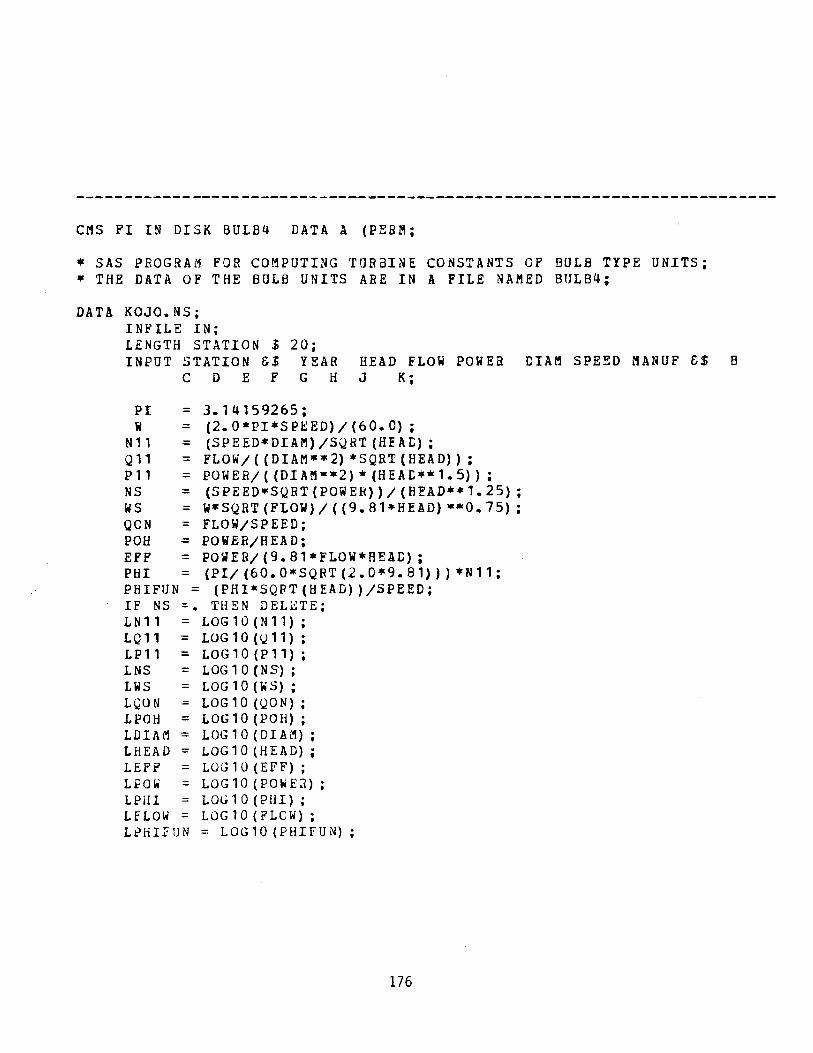
CMS PI IN DISK BULB4 DATA A (PEB!II;
* SAS PROGRAM FOR COMPUTING TORaiNE CONSTANTS CP BULB TYPE UNITS; • THE DATA OF THE BULB UNITS ABE IN A FILE NAMED BULB4;
DATA KOJO.NS; INr'ILE IN; LENGTH STATION $ INPUT STATION &$
C D E F
20; YEAR G H
PI = 3.14159265;
HEAD FLOw POWER J K;
W = (2.0*PI*SPEED)/(60.0); N11 = (SPEED*DIAM)/SQaT(HEA~);
Q11 = FLOW/((DIAM*•2)*SQRT(HEAD)); P 11 = POW E B I ( ( D I AM** 2 ) • (HE A I:** 1 • 5) ) ; NS = (SPEED•SQRT (POWER)) I (flEAD*'*1. 25); ws = W*SQRT (FLOW) I ( (9. 81•HfAD) ••O. 75); QCN = FLOW/SPEED; POH = POWER/HEAD; EFF = POiER/(9.81*FLOW*AEAD); PHI = (PI/(60.0*SQRT(2.0*9.81)))*N11; PHIFUN = (PHI*SQFT(HEAD))/SPEED; IF NS =. THEN DELETE; L N 11 = LOG 1 0 ( N 11) ; LQ11 = LOG10(U11); LP11 =LOG10(P11); L N S = LOG 1 0 ( N S) ; LWS = LOG10(loiS); LQON =LOG10(QON); LPOH = LOG 10 (POH) ; L D I AM = LOG 1 0 ( D I AM) ; LHEAD = LOG10 (HEAD); LEFF = LOG10 (EFF); LPO~ = LOG10 (POwEJ); LPHI =L0~10(PHI); LFLOW = LOG10 (FLOW); Li?HIFUN = LOG10 (PHIFUN);
176
DIAM SPE~D MANUF &$ B
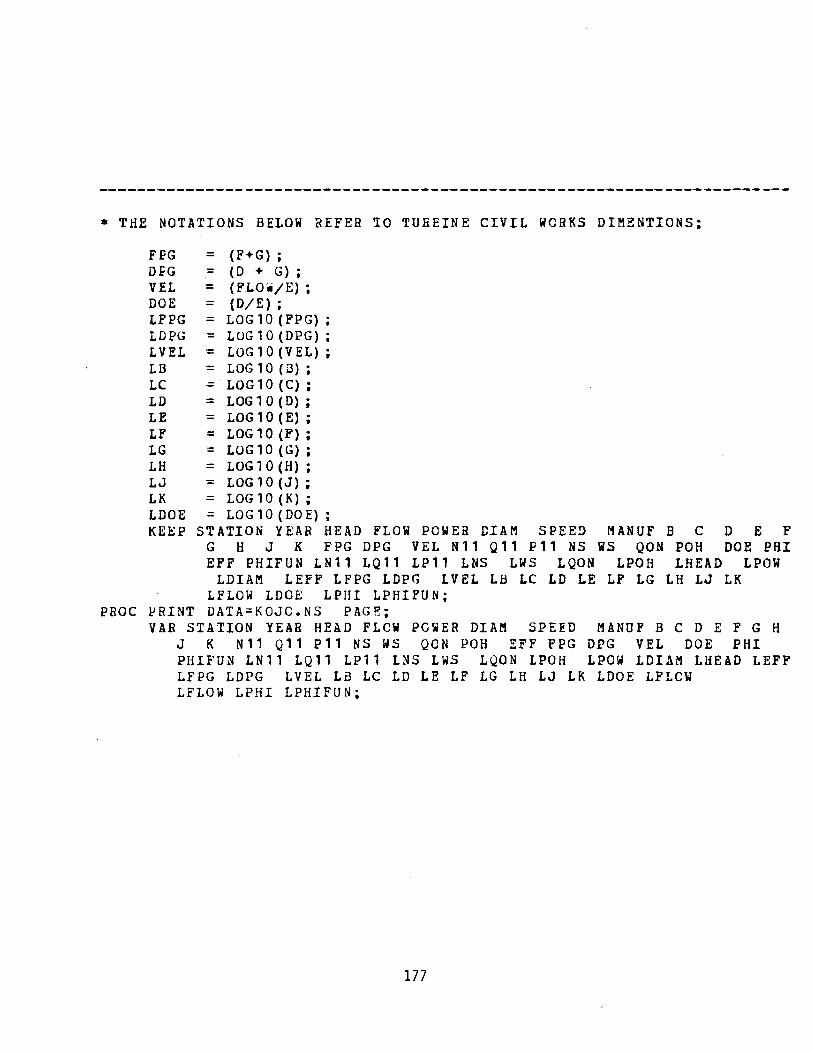
* THE NOTATIONS BELOW REFER 10 TUREINE CIVIL WCBKS DIMENTIONS;
FPG = (F+G); DFG = (D + G) ; VEL = (FLO./E) ; DOE = (D/E) ; LFPG =LOG10(FPG); LDPG = LOG 10 (DPG) ; LVEL =LOG10(VEL); LB =LOG10(l3}; LC = LOG10 (C); L D = LOG 1 0 ( D) ; LE =LOG10(E); L F = LOG 1 0 (F) ; LG =LOG10(G}; L H = LOG 1 0 ( H} ; LJ = LOG 10 (J) ; LK =LOG10(K); LDOE = LOG10 (DOE); KEEP STATION YEAR HEAD FLOW POWER DIAM SPEED MANUF B C D E F
G H J K FPG DPG VEL N11 Q11 P11 NS iS QON POH DOE PHI EFF PHIFUN LN11 LQ11 LP11 LNS LWS LQON LPOH LHEAD LPOW
LDIAM LEFF LFPG LDPG LVEL LB LC LD LE LF LG LH LJ LK LFLOW LDOE LPIII LPHIPUN;
PROC ~RINT DATA=KOJC.NS PAGE; VAR STATION YEAR HEAD FLCW PG~ER DIAM SPEED MANOP B C D E F G H
J K N11 Q11 P11 NS WS QCN POH ~FF FPG DPG VEL DOE PHI PHIFUN LN11 LQ11 LP11 LNS LWS LQON LPOH LPOW LDIAM LHEAD LEFF LFPG LDPG LVEL LB LC LD LE LF LG LH LJ LK LDOE LFLCW LFLOW LPHI LPHIFUN;
177
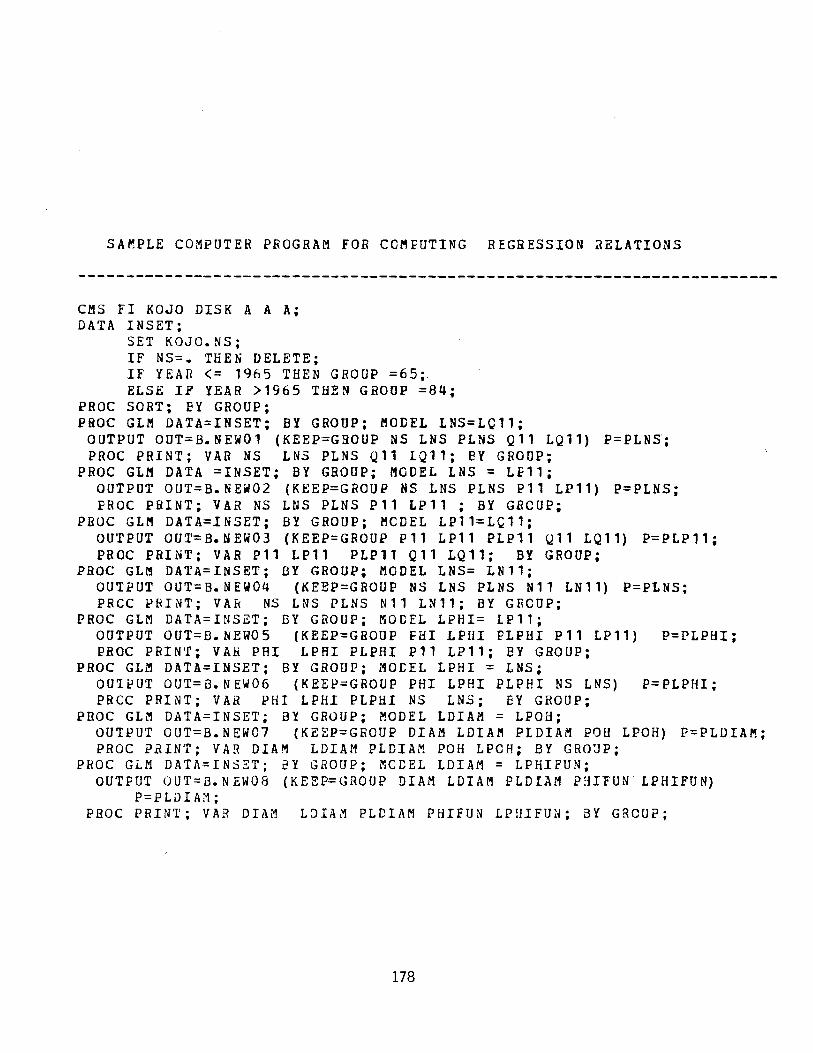
SA~PLE COMPUTER PROGRAM FOR CC~FUTING REGRESSION aELATIONS
CMS FI KOJO DISK A A A; DATA INSET;
SET KOJO.NS; IF NS=. THEN DELETE; IF YEAR <= 1965 THEN GROUP =65; ELSE IF YEAR >1965 THEN GROUP =84;
PROC SORT; EY GROUP; PROC GLM DATA=INSET; BY GROUP; MODEL LNS=LQ11;
OUTPUT OUT=B.NEW01 (KEEP=GROUP NS LNS PLNS Q11 LQ11) P=PLNS; PROC PRINT; VAR NS LNS PLNS Q11 LQ11; EY GROUP;
PROC GLM DATA =INSET; BY GROUP; MODEL LNS = Lf11; OUTPUT OUT=B. NEW02 (KEEP=GROUP NS LNS PLNS P1 1 LP11) P=PLNS; PROC PRINT; VAR NS LNS PLNS P11 LP11; BY GRCUP;
PHOC GLM DATA=INSET; BY GROUP; MCDEL LP11=LC11; OUTPUT OUT=B.NEW03 (KEEP=GROUP P11 LP11 PLP11 Q11 LQ11) P=PLP11; PROC PRINT; VAR P11 LP11 PLP11 Q11 LQ11; BY GROUP;
PROC GLM DATA=INSET; BY GROUP; MODEL LNS= LN11; OUTPUT OUT=B. NEW04 (KEEP=GROUP NS LNS PLNS N11 LN11) P=PLNS; PRCC PRINT; VA~ NS LNS PLNS N11 LN11; BY GRCOP;
PROC GLM DATA=INS~T; BY GROUP; MODEL LPHI= LP11; OUTPUT OUT=B.NEQ05 (KEEP=GROUP I:HI LPHI PLPHI P11 LP11) P=PLPHI; PROC PRINT; VAH PHI LPHI PLPHI P11 LP11; EY GROUP;
PROC GLM DATA=INSET; BY GROUP; MOtEL LPHI = LNS; OUTPUT OUT=B.NEW06 (KEEP=GROOP PHI LPHI PLPHI NS LNS) P=PLPHI; PRCC PRINT; VAH PHI LPHI PLPHI NS LNS; EY GROUP;
PROC GLM DATA=INSET; BY GROUP; MODEL LDIAM = LPOH; OUTPUT OUT=B.NEW07 (KEEP=GROUP DIAM LDIA.ll! PLDIAM POH LPOH} P=PLDIAM; PROC PRINT; VAR DIAM LDIAM PLDIAM POH LPCH; BY GROJP;
PHOC GLM DATA=INSET; BY GROUP; MCDEL LDIAM = LPHIFUN; OUTPUT OUT= B. N EW08 (KEEP=GROUP DIAM LDIAM PLDIAI1 P:HFUN LPHIFUN)
P=PLiHA:1; PBOC PRINT; VAR DIAM LDIA~ PLDIAM PHIFUN LPUIFUN; BY GRCUP;
178
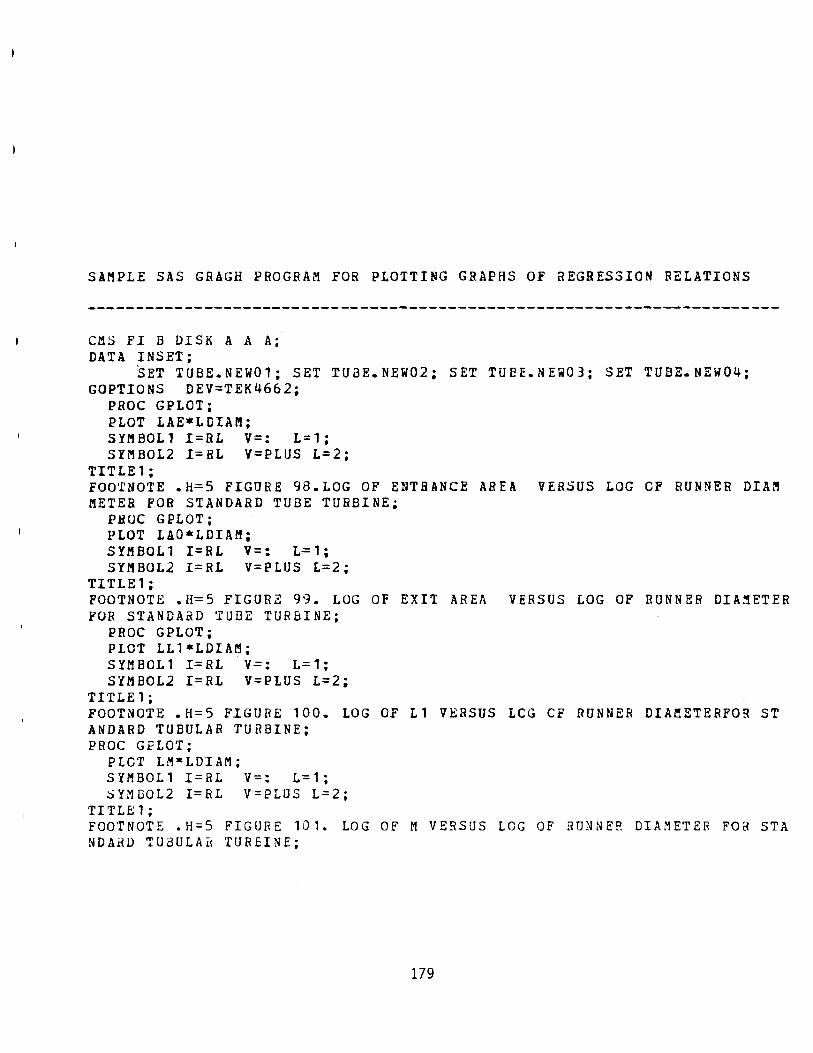
SAMPLE SAS GRAGH PROGRAM FOR PLOTTING GRAPHS OF REGRESSION RELATIONS
C~S FI B DISK A A A; DATA INSET;
SET TUBE.NEW01; SET TUBE.NEW02; SET TUEE.NEi03; SET TUBE.NEW04; GOPTIONS DEV=TEK4662;
PROC GPLOT; PLOT LAE*LDIA~; SYMBOL1 I=RL V=: L=1; SYMBOL2 I=RL V=PLUS L=2;
TITLE1; FOOTNOTE .H=S FIGURE 98.LOG OF ENTRANCE AREA VERSUS LOG OF RUNNER DIA~
METER FOR STANDARD TUBE TURBINE; PHOC GPLOT; PLOT LAO*LDIAM; SYMBOL1 I=RL V=: L=1; SYMBOL2 I=RL V=PLUS L=2;
TITLE1; FOOTNOTE .H=5 FIGURE 99. LOG OF EXIT AREA VERSUS LOG OF RUNNER DIA~ETER FOR STANDARD TUDE TURBINE;
PROC GPLOT; PLOT LL1*LDIAM; SYMBOL1 I=RL V=: L=1; SYMBOL2 I=RL V=PLUS 1=2;
TITLE1; FOOTNOTE .H=5 FIGURE 100. LOG OF L1 VERSUS LCG CF RUNNER DIA~ETERFOR ST ANDARD TUBULAR TURBINE; PROC GPLOT;
PLOT LM*LDIAM; SYMBOL1 I=RL V=: L=1; SYMDOL2 I=RL T=PLDS L=2;
TITLE 1; FOOTNOTE .H=5 FIGURE 101. LOG OF M VERSUS LOG OF RUNNER DIAMETER FOR STA NDArtD TUBULAd TUREINE;
179

APPENDIX 5
LIST OF TURBINE MANUFACTURERS
180
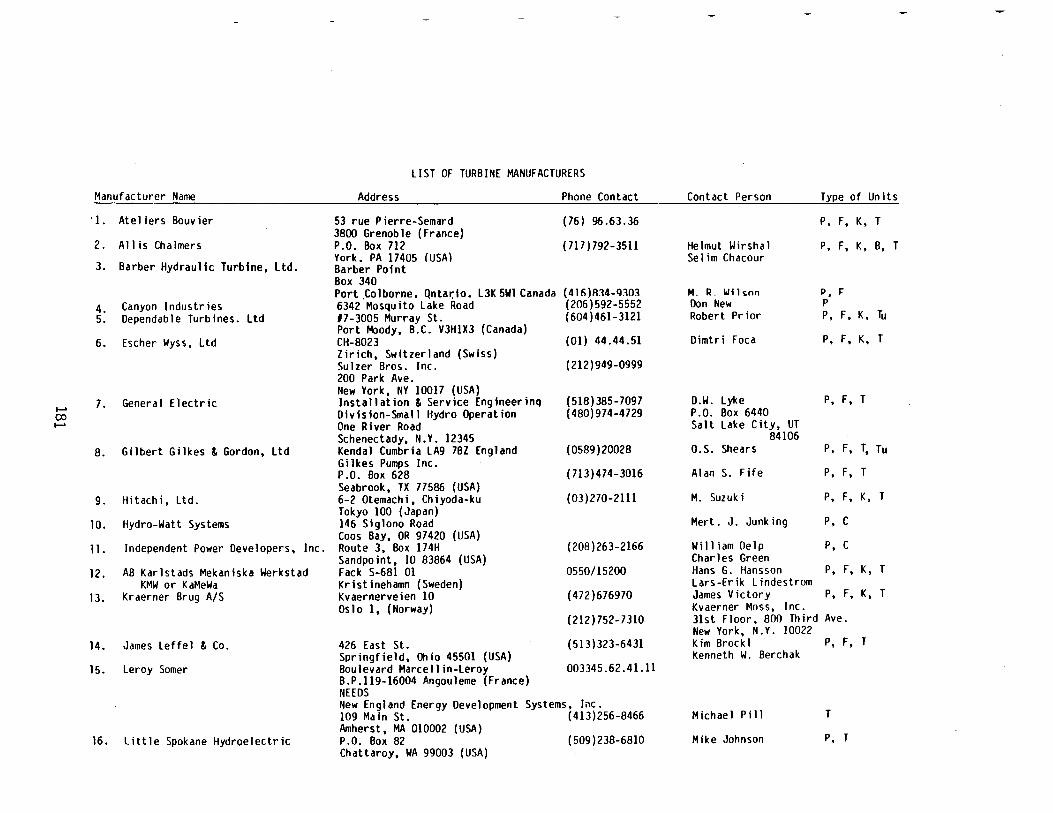
liST OF TURBINE MANUFACTURERS
Manufacturer Name Address Phone Contact Contact Person Type of Units
·I. Ateliers Bouvier 53 rue Pierre-Semard (76) 96.63.36 P, F, K, T 3800 Grenoble (France)
2. All is Chalmers P.O. Box 712 (717) 792-3511 Helmut Wirsha 1 P, F, K, B, T
3. Barber Hydraulic Turbine, Ltd. York. PA 17405 (USA) Sel im Chacour Barber Point Box 340 Port .Colborne. Qntar:io. l3K 5Wl Canada (41fi)R14-Q103 M. R. Wfhnn p • F
4. Canyon Industries 6342 Mosquito lake Road (206)592-5552 Don New p
5. Dependable Turbines. ltd #7-3005 Murray St. (604)461-3121 Robert Prior P, F, K, Tu Port Moody, B.C. V3H1X3 (Canada)
6. Escher Wyss, ltd CH-8023 (01) 44.44.51 Dimtri Foca P, F, K, T Zirich, Switzerland (Swiss) Sulzer Bros. Inc. (212)949-0999 200 Park Ave. New York, NY 10017 (USA)
..... 7 . General Electric Installation & Service Engineerinq (518)385-7097 D.W. lyke P, F, T co Division-Small Hydro Operation (480)974-4729 P.O. Box 6440 ..... One River Road Salt lake City, UT
Schenectady, N.Y. 12345 84106 8. Gilbert Gilkes & Gordon, Ltd Kendal Cumbria lA9 7BZ England (0589)20028 O.S. Shears P, F, T, Tu
Gilkes Pumps Inc. P.O. Box 628 (713)474-3016 Alan S. Fife P, F, T Seabrook, TX 77586 (USA)
9. Hitachi, ltd. 6-2 Otemachi, Chiyoda-ku (03)270-2111 M. Suzuki P, F, K, T Tokyo 100 (Japan)
10. Hydro-Watt Systems 146 Siglono Road Mert. J. Junking P, C Coos Bay, OR 97420 (USA)
11. Independent Power Developers, Inc. Route 3, Box 174H (208)263-2166 W i II i am De 1 p P, C Sandpoint, IO 83864 (USA) Charles Green
12. AB Karlstads Mekaniska Werkstad Fack S-681 01 0550/15200 Hans G. Hansson P, F, K, T KMW or KaMeWa Kristinehamn (Sweden) lars-Erik lindestrom
13. Kraerner Brug A/S Kvaernerveien 10 (472)676970 James Victory P, F, K, T Oslo 1, (Norway) Kvaerner Moss, Inc.
(212)752-7310 31st Floor, 800 Third Ave. New York, N.Y. 10022
14. James Leffel & Co. 426 East St. (513)323-6431 Kim Brock! P, F, T Springfield, Ohio 45501 (USA) Kenneth W. Berchak
15. leroy Somer Boulevard Marcellin-Leroy 003345.62.41.11 B.P.119-l6004 Angouleme (France) NEEDS New England Energy Development Systems, Inc. 109 Main St. ( 413)256-8466 Michael Pill T Amherst, MA 010002 (USA)
16. little Spokane Hydroelectric P.O. Box 82 (509)238-6810 Mike Johnson P, T Chattaroy, WA 99003 (USA)
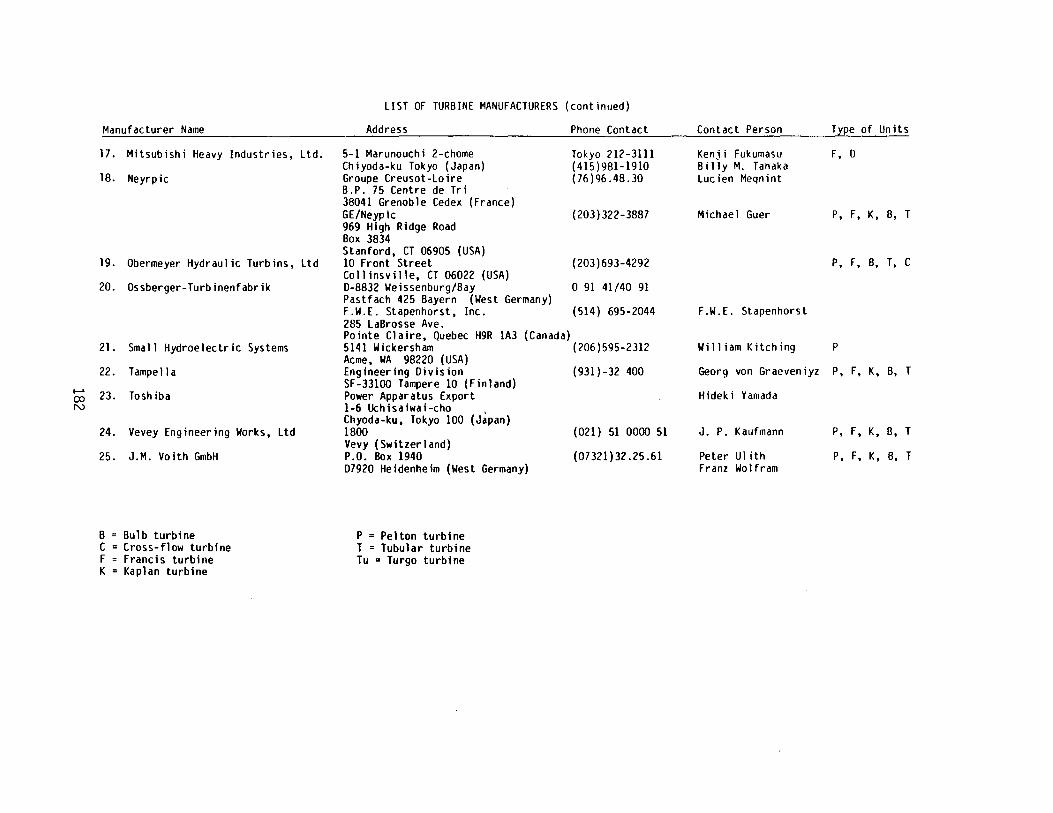
....... 00 N
Manufacturer Name
17. Mitsubishi Heavy Industries, Ltd.
18. Neyrp ic
19. Obermeyer Hydraulic Turbins, Ltd
20. Ossberger-Turbinenfabrik
21. Small Hydroelectric Systems
22. Tampella
23. Toshiba
24. Vevey Engineering Works, ltd
25. J.M. Voith GmbH
B = Bulb turbine C = Cross-flow turbine F = Francis turbine K = Kaplan turbine
LIST OF TURBINE MANUFACTURERS (continued)
Address
5-1 Marunouchi 2-chome Chiyoda-ku Tokyo (Japan) Groupe Creusot-loire B.P. 75 Centre de Tri 38041 Grenoble Cedex (France) GE/Neypic 969 High Ridge Road Box 3834 Stanford, CT 06905 (USA) 10 Front Street Collinsville, CT 06022 (USA) D-8832 Weissenburg/Bay Pastfach 425 Bayern (West Germany) F.W.E. Stapenhorst, Inc. 285 LaBrosse Ave. Pointe Claire, Quebec H9R 1A3 (Canada)
Phone Contact
Tokyo 212-3111 (415)981-1910 (76)96.48.30
(203)322-3887
(203)693-4292
0 91 41/40 91
(514) 695-2044
5141 Wickersham (206)595-2312 Acme, WA 98220 (USA) Engineering Division SF-33100 Tampere 10 (Finland) Power Apparatus Export 1-6 Uchisaiwai-cho , Chyoda-ku, Tokyo 100 (Japan) 1800 Vevy (Switzerland) P.O. Box 1940 07920 Heidenheim (West Germany)
P = Pelton turbine T = Tubular turbine Tu = Turgo turbine
(931)-32 400
(021) 51 0000 51
(07321)32.25.61
Contact Person Type of Units
Kenji Fukumasu F, 0 Billy M. Tanaka lucien Meqnint
Michael Guer P, F, K, B, T
P, F, B, T, C
F.W.E. Stapenhorst
William Kitching P
Georg von Graeveniyz P, F, K, B, T
Hideki Yamada
J. P. Kaufmann P, F, K, B, T
Peter Ulith P, F, K, B, T Franz Wolfram