experience, strength, evolution
TRANSCRIPT

The Gulf’s International Bank
Experience, Strength, Evolution
Annual Report 2015

GIB | Celebrating 40 years

Annual Report 2015 3
Contents
Board of Directors 6
Financial highlights 7
Chairman’s statement 8
Economic review 12
Management review 16
Corporate social responsibility review 22
Financial review 24
Corporate governance report 34
Biographies of the Board of Directors 48
Biographies of senior management 50
Organisation and corporate governance chart 52
Consolidated financial statements 53
Risk management and capital adequacy report 103
Corporate directory 137

GIB | Celebrating 40 years
4 Annual Report 2015
Gulf International Bank Gulf International Bank B.S.C. (GIB) is a leading pan-GCC universal bank, specialising in corporate and investment banking, with a growing retail footprint.
Founded in 1975, GIB provides innovative, client-focused solutions covering wholesale banking, treasury, investment banking, asset management, financial market products, and Shariah-compliant banking. In January 2015, the Bank officially launched Meem by GIB (meemم), a Shariah-compliant retail bank in Saudi Arabia, offering a suite of innovative, non-traditional banking products and services.
GIB employs over 1,000 professionals across its offices around the world. Its main subsidiaries are UK-based Gulf International Bank (UK) Ltd.; and Saudi Arabian-based GIB Capital LLC. The Bank has branches in London, New York, Abu Dhabi, Dhahran, Riyadh and Jeddah, together with representative offices in Dubai and Beirut.
Headquartered in the Kingdom of Bahrain, GIB is licensed as a conventional wholesale bank by the Central Bank of Bahrain. Owned by the governments of the six GCC countries, GIB’s principal shareholder is the Public Investment Fund of Saudi Arabia, with a majority stake of 97.2 per cent.

Annual Report 2015 5
Our Vision GIB aims to be the international GCC bank with regional expertise, global outreach and innovative financial solutions; and to be a value-adding partner, leveraging cutting-edge technology and superior human capital.

GIB | Celebrating 40 years
6 Annual Report 2015
Board of Directors
Dr. Yahya A. Alyahya Chairman, Gulf International Bank (UK) Limited Kingdom of Saudi Arabia
H.E. Jammaz bin Abdullah Al-Suhaimi Chairman Kingdom of Saudi Arabia
Mr. Abdulla bin Mohammed Al Zamil Chief Executive Officer Zamil Industrial Investment Company Kingdom of Saudi Arabia
Professor Abdullah bin Hassan Alabdulgader Independent Consultant Kingdom of Saudi Arabia
Mr. Khaled bin Saleh Al-Mudaifer President and CEO Ma’aden (Saudi Arabian Mining Company) Kingdom of Saudi Arabia
H.E. Mr. Sulaiman bin Abdullah Al-Hamdan Vice Chairman President, General Authority of Civil Aviation Kingdom of Saudi Arabia
Mr. Omar Hadir Al-Farisi Managing Member Diyala Advisors United States of America

Annual Report 2015 7
Financial highlights
2015 2014 2013 2012 2011 2010
Earnings (US$ millions)
Net income after tax 90.4 85.6 121.5 117.9 104.5 100.4
Net interest income 188.2 158.0 163.1 149.4 143.8 156.2
Fee and commission income 70.2 62.9 62.0 56.7 48.5 42.2
Operating expenses 192.1 164.9 151.6 136.1 119.8 113.3
Financial position (US$ millions)
Total assets 24,192.4 21,300.2 21,156.9 17,704.8 16,788.9 15,527.7
Loans 9,161.4 7,931.5 8,317.2 7,110.3 6,751.8 7,510.1
Investment securities 3,884.5 3,944.5 3,725.8 3,560.1 3,151.7 3,067.8
Senior term financing 2,420.0 3,372.9 2,332.9 2,432.7 3,690.3 3,176.6
Equity 2,431.0 2,350.7 2,264.0 2,130.2 1,962.8 1,918.0
Ratios (per cent)
Profitability
Return on average equity 3.8 3.7 5.5 5.8 5.4 5.4
Return on average assets 0.4 0.4 0.6 0.7 0.6 0.6
Capital
Risk asset ratio (Basel 3)
– Total 17.7 19.6 18.9 20.1 23.3 24.3
– Tier 1 16.8 18.1 16.9 17.4 19.2 18.7
Equity as % of total assets 10.0 11.0 10.7 12.0 11.7 12.4
Asset quality
Securities as % of total assets 16.4 18.9 17.9 20.7 19.3 20.3
Loans as % of total assets 37.9 37.2 39.3 40.2 40.2 48.4
Liquidity
Liquid assets ratio 60.0 60.9 58.8 57.9 58.2 50.0
Deposits to loans cover (times)1 2.1 2.2 2.1 2.0 2.0 1.6
¹ Deposits include senior term financing
CREdit RAtingS
FitchMoody’s Ratings
Capital intelligence
Long-term Deposit Rating A Baa1 A+
Long-term Senior Unsecured Debt Rating A A3 -
Short-term Deposit Rating F1 P-2 A1
Viability bbb- - -
Financial Strength - - BBB+
Outlook Stable Under review Stable

GIB | Celebrating 40 years
8 Annual Report 2015
Chairman’s statementOn behalf of the Board of Directors, it is my privilege and pleasure to present the annual report of Gulf International Bank (GIB) for the fiscal year ended 31st December 2015. Despite the many challenges during this period, not least the dramatic drop in oil prices and intensified market volatility, GIB posted a strong overall performance as measured by financial results, business and operational achievements, and solid progress on the delivery of the Bank’s strategy.
Financial results
GIB recorded another robust financial performance for 2015. Net income after tax was US$90.4 million compared with US$85.6 million in the previous year, representing a 5.6 per cent year-on-year increase. Total income at US$308.0 million was US$50.4 million or 19.6 per cent up on 2014, with increases recorded in all income categories. This reflects the successful progress in implementing the new business strategy to transform GIB into a leading pan-GCC universal bank providing innovative customer-centric solutions. The growth in total income more than offset an increase in total expenses of US$27.2 million associated with GIB’s innovative retail bank, resulting in an improvement in net income before provisions and tax of US$23.2 million or 25.0 per cent.
Net interest income at US$188.2 million for 2015 was US$30.2 million or 19.1 per cent up on the previous year. This growth principally reflected an increase in the loan volume, as the Bank continued to successfully re-orientate its lending activities from transactional-based long-term project and structured finance to relationship-based large and mid-cap corporates. Fee and commission income at US$70.2 million was US$7.3 million or 11.6 per cent up on 2014, and comprised 22.8 per cent of total income. This underlined
the success of GIB’s strategic focus on relationship-orientated products and services, and enhancement of fee income.
Foreign exchange income at US$19.8 million was US$0.4 million or 2.1 per cent up on 2014. This primarily comprised revenue from customer-related activities, and in particular, revenues derived from bespoke structured products designed to assist customers in hedging their foreign exchange exposures in volatile markets. Trading income at US$6.2 million improved by US$3.8 million over the previous year. This principally comprised gains on an investment in a fund managed by the Bank’s London-based subsidiary, GIB (UK) Limited, and customer-related interest rate derivative income. Other income at US$23.6 million was US$8.7 million or 58.4 per cent up on 2014. Other income for 2015 consisted largely of dividends on equity investments and asset recoveries.
Total expenses at US$192.1 million for the year were US$27.2 million or 16.5 per cent up on 2014. The increase was attributable to the ongoing investment in GIB’s new retail banking proposition, and the new core banking and treasury systems which were implemented in the middle of 2015. A loan provision charge of US$21.3 million was made in 2015 compared with US$10.3 million in the previous year.
Consolidated total assets at the end of 2015 stood at US$24.2 billion, being US$2.9 billion or 13.6 per cent higher than at the end of the previous year. The asset profile reflected a high level of liquidity. Cash and other liquid assets, and short-term placements, totalled US$10.5 billion and represented an exceptionally high 43.6 per cent of total assets. Investment securities, which principally comprised highly-rated and liquid debt securities issued by major financial institutions and regional government-related entities, amounted to US$3.9 billion. Loans and advances grew to US$9.2 billion, being US$1.2 billion or 15.5 per cent higher than 2014, reflecting new relationship-based large and mid-cap corporate loans. Shareholders’ equity at the end of 2015 stood at US$2.43 billion compared with US$2.35 billion at the end of the previous year, with return on average equity for 2015 at 3.8 per cent against 3.7 per cent for 2014. Return on average equity has been subdued due to the Bank’s business model, and we expect this to continue in the short-term. However, following the planned breakeven of the new retail bank in the next three to four years, we envisage returns to improve significantly.
There was a further improvement in the Bank’s funding profile during 2015, with a US$1.8 billion or 13.8 per cent increase in customer deposits,
H.E. Jammaz bin Abdullah Al-Suhaimi Chairman

Annual Report 2015 9
which accounted for 88.1 per cent of total deposits. Securities sold under agreements to repurchase (repos) increased by US$1.5 billion to US$2.1 billion. This reflected a strategic initiative to fund a higher proportion of the investment security portfolio through repos in order to minimise the related funding costs. A US$1.0 billion decrease in senior term financing was due to the maturity of a Saudi Riyal denominated bond issue in the second quarter of the year; while a US$0.3 billion decrease in subordinated term financing reflected the payment of a subordinated debt issue that matured in September 2015. GIB’s robust funding position demonstrates the confidence of the Bank’s customers and counterparties based on its strong ownership and financial strength. The Basel 3 total and tier 1 capital adequacy
ratios at the end of 2015 were an exceptionally strong 17.8 per cent and 16.8 per cent, respectively.
industry recognition
During 2015, the international rating agencies endorsed their confidence in GIB’s financial strength. Significantly, Moody’s Investors Service (Moody’s) affirmed GIB’s senior debt and foreign currency deposit rating at A3, and upgraded the outlook from negative to stable. Moody’s stated that their ratings affirmation and outlook upgrade “reflects GIB’s strong capital and liquidity buffers; improvements in the bank’s asset quality metrics; and a reduction in the level of concentrations of the bank’s asset base”. We view this affirmation as solid confirmation of GIB’s enhanced asset quality and robust capital position. We are confident that this strength will improve further in the future, as we expand our presence regionally and globally, generating a steady source of funding and diversified earnings for our shareholders.
Further recognition of our business achievements took the form of additional industry awards during the year. GIB was named ‘Best Equity Bank in the Middle East’, ‘Best Investment Bank in Bahrain’ and ‘Safest Bank in Bahrain’ by Global Finance; and was recognised as the ‘Fastest-growing Asset Management
Bank - Saudi Arabia’ by Global Banking & Finance Review. GIB was also named ‘Asset Manager of the Year - Bahrain’ and ‘Regional Equities Manager of the Year’ by the Global Investor. The Bank won the ‘Best IPO Deal in the Middle East’, ‘Best Sovereign Bond’ and ‘Best Merger & Acquisition Deal’ awards from EMEA Finance; and ‘Deal of the Year’ award from The Banker. In addition, GIB’s Emerging Markets Opportunities Fund received the ‘Credit Specialist’ award from Alternative Credit Intelligence.
Strategic progress
I am pleased to report that we made solid progress during the year in implementing our strategy. We continued to follow the vision first charted in 2010, to transform GIB into a pan-GCC universal bank, along with a strategy to enable its achievement. We previously defined three interconnected and equally-weighted priorities to help us deliver our strategy: grow the business; grow and diversify the funding base; and improve shareholder value. Each priority was complemented and underpinned by strategic initiatives within our operations.

GIB | Celebrating 40 years
10 Annual Report 2015
The Bank’s strategy is driven through five strategic pillars covering Wholesale Banking, Treasury, Retail Banking, Asset Management and Investment Banking. GIB continues to grow these businesses organically in each of the key GCC markets.
Key strategic highlights of 2015 include the official launch of GIB’s unique technology-based retail bank in Saudi Arabia under the brand name Meem by GIB (meemم), which marked the beginning of a new chapter in the Bank’s strategic evolution. In addition, a new wholesale banking branch in Abu Dhabi was inaugurated, strengthening GIB’s ambition to be the leading pan-GCC bank with strong regional expertise. GIB has had a representative office in Abu Dhabi since 1990, and the Emirate has played a pivotal role in the Bank’s growth and evolution. Our operations in the UAE are further enhanced by the Dubai representative office, which was opened in 2014.
Business performance
Our strong business achievements during 2015 continued to support the implementation of the Bank’s strategy. The development of new corporate banking and treasury relationships with large- and mid-cap corporates, has enabled GIB to grow its loan portfolio; increase non asset-based, client-related revenues; boost fee and commission
income through better cross-selling; and enhance its funding profile by attracting deposits from new customers. Additionally, the Bank’s Shariah-compliant banking business witnessed another active year. GIB Capital led a number of high-profile investment banking deals in 2015, with a particular focus on debt capital markets and debt advisory mandates. The Bank’s asset management business, which is managed by GIB (UK) Limited, also performed well, with the fixed income business being the driver of improved revenue performance. Following the receipt of Securities & Exchange Commission (SEC) registration, the Bank won a US$100 million fixed income mandate from one of the top ten US pension funds.
institutional capability
During 2015, we renewed our focus on strengthening the Bank’s institutional capability, in order to support the realisation of our strategy and continued business growth. This involved the strategic alignment of people, products, processes and systems across the organisation. Key initiatives included the development and piloting of a new comprehensive HR change management programme; full deployment of the new core banking system with the implementation of new wholesale banking and treasury systems; and restructuring and
streamlining organisation-wide end-to-end operational processes and procedures. We further strengthened the Bank’s corporate governance and risk management frameworks to ensure continued compliance with the latest rules and requirements of regulators in the various jurisdictions in which GIB operates. In addition, a new corporate social responsibility programme – WAGIB – was launched to support local communities in Bahrain and Saudi Arabia; and a new strategically-aligned corporate communications strategy was implemented.
Chairman’s statement continued

Annual Report 2015 11
Leadership changes
During 2015, the Board of Directors was re-appointed for a new three-year term. H.E. Dr. Hamad bin Sulaiman Al-Bazai resigned from the Board and was replaced as Vice Chairman by H.E. Mr. Sulaiman bin Abdullah Al-Hamdan. On behalf of my fellow directors, I thank Dr. Al-Bazai for his valuable contribution since 1999, and in turn welcome Dr. Yahya A. Alyahya, who joined the Board. Dr. Alyahya has stepped down as Chief Executive Officer at the end of January 2016, and has been replaced by Mr. Abdulaziz A. Al-Helaissi, who brings with him decades of banking experience that is uniquely relevant to leading GIB in the next phase of its strategic evolution. He was most recently Deputy Governor for Supervision at the Saudi Arabian Monetary Agency (SAMA), and previously held senior leadership positions over the course of 26 years with various banking institutions in Saudi Arabia.
The immense energy, focus and commitment of Dr. Alyahya to GIB over the past seven years are deeply valued by the Board. He was instrumental in returning the Bank to profitability in 2010 after two years of reporting material losses; and also led the launch of GIB’s new strategy for becoming a pan-GCC universal bank. The successful restructuring of wholesale activities, the
launch of retail operations, expansion of regional asset management capabilities, and strengthening of the support infrastructure, are testimony to his inspired leadership.
Looking ahead
As we prepare to embark upon our fifth decade of operations, we are fully aware that 2016 will be an extremely challenging year. Key issues facing the GCC region include declining oil prices, market volatility, lack of liquidity, and fiscal reforms; together with continuing geo-political tensions across many parts of the region. Nevertheless, GIB is strongly positioned to face all future challenges, and the Board has every confidence in the Bank’s management to continue implementing our new strategy and achieve our ambitious business goals. Over the past few years, we have put in place solid foundations through which to support our strategic objectives to grow and develop the business across the GCC region.
Acknowledgements
On behalf of the Board of Directors, I would like to express my sincere appreciation for the unwavering confidence and support of our shareholders; the enduring trust and loyalty of our clients; the continued encouragement and cooperation of our counterparties; and the ongoing
advice and guidance of the regulatory and supervisory bodies in the various jurisdictions where GIB operates. I also take this opportunity to pay special tribute to the commitment and professionalism of our management and staff, and their positive attitude towards embracing change and implementing the Bank’s strategic and cultural transformation.
Jammaz bin Abdullah Al-SuhaimiChairman of the Board
Further recognition of our business achievements took the form of additional industry awards during the year. GIB was named ‘Best Equity Bank in the Middle East’, ‘Best Investment Bank in Bahrain’ and ‘Safest Bank in Bahrain’ by Global Finance.
GIB | Celebrating 40 years
12 Annual Report 2015
Economic review 2015 Global growth remains tepid amid uneven prospects for countries and regions around the world. The persistently modest pace of recovery in the developed economies, and the fifth consecutive year of growth decline in the emerging markets space fuelled uncertainty and volatility throughout the year.
global economic trends and outlook
Declining commodity prices, reduced capital flows to emerging markets, exchange rate pressures, and increasing financial market volatility have tilted the balance of risks for global economic prospects towards the downside.
The US economic recovery continues but at an uneven pace, evidenced by the volatile performance of economic data, notably weakness in the manufacturing sector. Although impressive gains in the labour market have underpinned confidence, this has yet to translate into a meaningful improvement in consumer confidence and consumer spending. Inflation also continues to remain below the US Federal Reserve’s (Fed) 2.0% target, and is not expected to rise to that pace until well into 2017, restrained by pass-through from the strong dollar, weak oil prices and anaemic wage gains.
The year ended with the Fed raising its target federal funds rate by a quarter percentage point from a range of 0% to 0.25% to between 0.25% and 0.50%. After an extraordinarily long period of accommodative monetary policy, the Fed cited confidence in the economic fundamentals, the health of US households, and domestic spending, as the factors driving the increase in interest rates. In spite of pressures on some sectors of the economy,
particularly manufacturing and energy, the Fed added the potential for further rate increases during the course of the coming year.
A moderate recovery is also underway in the European Union (EU) supported by low oil prices, a euro depreciation, and continued accommodative policy through quantitative easing. However, growth potential remains weak, while subdued inflation is a key cause of concern. Similarly, while Japan’s economic activity has improved gradually, policy has remained geared towards additional stimulus and quantitative easing, as growth and inflation indicators continue to disappoint.
The onset of a tightening US interest rate cycle has added to an already long list of challenges facing the global economy: concerns about China’s overall economic prospects; rising global debt levels; festering deflation fears; weak corporate revenues; and the seeming ineffectiveness of the extraordinary action from central banks to buttress the economic recovery. Going forward, higher US interest rates and the further strengthening of the US dollar will dampen prospects for the rest of the world (particularly the emerging market countries), given the negative implications of higher debt repayments
for dollar-denominated borrowings and the heightened risk of capital outflows.
A number of downside risks have emerged, and pose a considerable challenge to the fragile and unbalanced state of the global economic recovery, including:
• Thehighly-volatilenatureoffinancial markets coupled with the increased tendency and correlations for global asset prices to move in unison.
• Theincreasedriskofglobalfinancial instability stemming from financial market volatility.
• UncertaintyaboutChina’seconomic conditions, and the risk of spillovers into emerging markets.

Annual Report 2015 13
• Lowerpricesforoilandother commodities complicate the outlook for commodity exporters, and are increasingly being viewed as indicators of faltering global demand and economic stagnation across developed and developing economies.
• Escalationofgeopoliticaltensions threatens the disruption in global trade, capital and investment flows.
Banking industry trends
Lacklustre global economic performance in an era of low growth and low interest rates continues to pose tremendous challenges for the banking industry. After the upheavals following the onset of the global financial crisis, banks are under tremendous stakeholder pressure to adopt new business models that capably meet the demands of the tough global banking environment. Key trends such as technology (digital revolution) and growing regulation are driving the change, making it harder for traditional players to cope. The former has lowered the industry’s barriers to entry and fuelled intense competitive pressure, while the latter has significantly inflated the cost base. Unsurprisingly, the industry’s return on equity has eroded and remains weak.
A changing customer base influenced by the technology and the digital revolution
is also creating new and different banking needs. Huge investments are becoming necessary to rejuvenate seemingly out-of-date banking infrastructure and style. There is new focus on customer-centricity, including greater transparency; personalised products; seamless transition between channels; emphasis on solutions rather than products; and an array of digital offerings. Banks are also changing their operational footprint through enhancing entity rationalisation, functionalisation and efficiency. The business of banking is moving towards more simplification of the business model and the deconstructing of products.
global outlook
In its latest forecasts, the International Monetary Fund (IMF) estimates global growth to strengthen from 3.1% in 2015 to a projected 3.4% in 2016 and 3.6% in 2017. Global activity is likely to progress at a more gradual pace, especially in emerging market and developing economies; while economic recovery in the developed economies will be ongoing, but remain modest and uneven. The IMF noted that near-term risks to the outlook remain tilted to the downside, and relate to the ongoing adjustments in the global economy: a generalised slowdown in emerging market economies; China’s economic slowdown and rebalancing; lower
commodity prices; and the gradual exit from extraordinarily accommodative monetary conditions in the United States. If these key challenges are not successfully managed, global growth could be derailed.
gCC economic trends and outlook
The year was dominated by the sharp fall in oil prices, and the debate over its impact on the GCC’s regional economies. The steep decline in oil prices certainly poses numerous challenges for the Gulf countries as fiscal revenues and external surpluses

GIB | Celebrating 40 years
14 Annual Report 2015
have dramatically declined; and further led to significant volatility in the region’s currencies and capital markets. However, as has been demonstrated since the oil price decline, regional economies have ample policy space to manage the downturn due to large foreign exchange reserves and low debt levels – the latter also underpin the region’s dollar peg regime. In particular, continued strong public spending has helped mitigate the impact on economic activity.
Nevertheless, there remains uncertainty on the time period before regional conditions start to deteriorate, with the immediate focus on the structural challenges facing the banking system. Although regional banking systems are expected to remain reasonably sound in the short-term, there is risk of a sudden sharp withdrawal of government deposits, which would induce liquidity pressures in banks, should oil prices remain low for an extended period of time. The increase in US interest rates has exacerbated the concerns, as this will lead to a tightening in financial conditions across the GCC countries because of the exchange rate peg. Eventually, this may also lead to a deceleration in private sector credit growth – even if US rates rise only modestly.
Much will depend on the trajectory of oil prices and when the current downward trend starts to reverse. The wild card is oil supply, notably the outlook for unconventional hydrocarbon sources such as US shale oil and Iran’s return to the market – both supply sources proving to be difficult to forecast.
So far, the risk of a collapse in the oil market does not appear to be the case. On the contrary, current oil market dynamics suggest that the seeds of the next oil boom may have already been sown for three key reasons. First, Saudi Arabia’s decision to abandon its role of swing producer as part of a long-term strategy to retain market share has resulted in energy investment cuts worldwide; cooled the US shale boom; and impacted expansion in production capacity by other oil producers. Second, despite its high-cost status, US shale has proven to be resilient despite the dramatic fall in oil prices. However, production levels are beginning to fall, while US energy and environmental policies also limit how aggressively US companies can compete on exports. Third, various security and geopolitical risks in the Middle East have elevated the probability of sudden oil supply disruptions.
Indeed, large parts of the Middle East region are fractured by conflict and tension, including the civil war in Syria and spillover effects on neighbouring Jordan and Lebanon; the spread of Islamic State (ISIS), which now controls large territories of Syria and Iraq; ongoing insurgencies in Libya; the war in Yemen; the fragile political transitions in Egypt and Tunisia; and the still uncertain political liberalisations in Morocco and Jordan, which accompanied with weak macroeconomic fundamentals and unfinished reform agenda, have kept economic performance far below potential. Added to this are the still unknown ramifications on the political and economic relations between GCC countries and Iran in a post-sanctions era.
Economic review 2015 continued

Annual Report 2015 15
gCC outlook
The GCC region is well positioned to cope with the slump in oil prices in the near-term, notwithstanding the challenging financial conditions. Regional countries are likely to be able to absorb adverse external headwinds, and expectations are that the real GDP growth will remain positive. Supporting the favourable outlook is the proactive stance adopted by GCC policy makers towards the decline in oil prices, with increased emphasis on efficiency; expenditure rationalisation (i.e. initiating reductions in subsidies to ease the financial pressures); and expectations that the region will implement a value-added tax in the near future.
Economic growth (both oil and non-oil) has started to decline, but is forecast to remain positive up to 2017 even under the most pessimistic scenarios. According to IMF data, real GDP growth is estimated to average around 3.4% in 2015 for the Gulf region, and forecast to drop moderately in 2016 to just below 3%. Recent announcements by GCC countries of local debt issuances, with Saudi Arabia tapping international capital markets for the first time, are considered positive developments for longer-term asset and liability management of the
region. This entails better matching infrastructure needs with longer-term funding, and should reduce the drawdown of foreign exchange reserves, as well as contribute to the deepening of regional capital markets.
However, the region has to contend with a number of challenges associated with low oil prices. GCC financial markets have been under pressure since oil prices started to decline, and recently this has escalated speculation against the sustainability of the GCC currencies’ peg to the US dollar. This is common during periods of low oil prices; in Saudi Arabia, during past episodes of speculation against the Saudi riyal peg to the US dollar, the Saudi Arabian Monetary Agency (SAMA) engaged in small-scale interventions to ward off concerns; and expectations are that it may do the same this time around. The Saudi riyal peg proved to be resilient during the more intense periods of speculation in 1993, 1998 and 2008; and now the Kingdom’s substantially stronger financial position and very low indebtedness imply that despite the stress of low oil prices, there are no realistic prospects of an exchange rate adjustment anytime soon, either in Saudi Arabia or other GCC countries.
The Gulf region’s corporate, construction, real estate, and infrastructure companies are expected to face a weaker operating environment in 2016 on the back of low oil prices, while government expenditures (although still at high levels) are slowing down amid easing economic growth. Most GCC countries have fiscal headroom to manage the current downturn; however, their resilience will depend on key policy responses in terms of government spending patterns and debt levels.
A delayed oil price recovery remains the most significant downside risk. If oil prices stay lower for longer, this would deplete the fiscal and external buffers, and entail a more negative impact on the economy. Tough policy adjustments will have to follow, particularly in terms of lowering fiscal spending, and this could adversely impact non-oil growth and the balance sheets of domestic banks.
The GCC region is well positioned to cope with the slump in oil prices in the near-term, notwithstanding the challenging financial conditions.

GIB | Celebrating 40 years
16 Annual Report 2015
Wholesale Banking
In 2015, GIB continued to make excellent progress in transforming its wholesale banking division into a client-centric, relationship-based business. The strategy is based on three key pillars of client acquisition, geographic footprint and product diversification.
Client base
During the year, the Bank successfully increased its client base by 30 per cent, due in part to more focused customer targeting, and by expanding the relationship management team. A continued focus on cross-selling fee-based corporate and investment banking, treasury, trade finance, and asset management products and services to a wider client base, resulted in an increase in non-asset based client-related revenues. GIB also grew its core loan portfolio by almost a third through successfully re-orientating its lending activities from transactional-based long-term project and structured finance to relationship-based large and mid-cap corporates.
Noteworthy conventional and Shariah-compliant financing deals closed during the year included underwriting and syndicating a US$1 billion sovereign loan to the Government of Oman;
acting as mandated lead arranger and book runner for a US$125 million five-year term facility to Bahrain Commercial Facilities Company; and arranging a US$109 million facility for Arab Maritime Petroleum Transport Company. Furthermore, GIB arranged an acquisition financing facility for the acquisition of a stake in a large group in Saudi Arabia; and a SAR157 million financing facility for AJA Pharma, a pharmaceuticals subsidiary of Saudi Chemical Company. The Bank also arranged through GIB Capital, its investment banking arm, a SAR700 million Murabaha facility to a privately-owned Saudi conglomerate.
GIB participated in a number of notable aircraft financing deals for major carriers in the region; and enhanced its relationship with Emirates National Oil Company (ENOC) by participating in a US$1.5 billion syndicated facility. Additionally, the Bank extended a SAR150 million revolving Murabaha facility to Abdulmohsen Alhokair Group for Tourism and Development, to finance working capital requirements.
Geographic footprint
The conversion of the Abu Dhabi representative office into a full-fledged wholesale banking branch has
strengthened GIB’s ambition to be the leading international GCC bank with regional expertise, global outreach and innovative financial solutions. The Bank’s presence in the dynamic UAE market was further enhanced by the newly-established Dubai representative office.
Product diversification
In a key strategic development, GIB commenced implementation of its new transaction banking value proposition. Plans were finalised for the introduction in 2016 of new products such as cash management and structured trade finance, and the launch of a new corporate e-banking portal. Recruitment of a new dedicated team was initiated, together with the development of a network of business partners; while three new corporate banking branches were established to serve clients in the Eastern, Central and Western provinces of Saudi Arabia. GIB also further enhanced its Sharia-compliant product suite to meet growing client demand, by structuring and launching a number of new Shariah-compliant products during the year.
Management reviewThe inauguration of the new wholesale banking branch in Abu Dhabi heralded the start of the Bank’s geographic expansion plan to establish a solid footprint in all key GCC markets.
Dr. Yahya A. Alyahya Chief Executive Officer (from January 2009 to January 2016)

Annual Report 2015 17
investment Banking
Against the backdrop of a difficult macroeconomic environment, GIB Capital, the Bank’s investment banking arm based in the Kingdom of Saudi Arabia, posted another strong performance in 2015. All three business lines – equity capital markets (ECM), debt capital markets (DCM) and debt advisory (DA) – closed high-profile investment transactions and were successful in securing new mandates. The year witnessed one of the best revenue performances in the history of GIB Capital, with ECM contributing the largest share of the revenues, and DCM and DA performing strongly. Advisory mandates largely comprised
assisting corporates with mergers and acquisitions, rights issues, financial restructuring and debt arranging transactions.
ECM transactions in 2015 included a SAR200 million equity-raising exercise for Al Alamiya Cooperative Insurance Company, as well as two M&A transactions for high-profile corporates. DCM transactions included a US$1 billion Sukuk issue for the Islamic Development Bank, a SAR1 billion Sukuk issue for Saudi Binladen Group, and a SAR1 billion Sukuk issue for Abdullah Al Othaim Real Estate Investment & Development Company. DA transactions included a SAR700 million Murabaha facility for a prominent privately-owned company in Saudi Arabia, a US$500 million syndicated Ijarah finance facility for a state-owned utility authority in the UAE, and a US$137 million debt restructuring exercise for a listed company in Bahrain.
GIB Capital enjoyed further industry recognition during 2015 with the receipt of four awards. These were ‘Best IPO Deal in the Middle East’, ‘Best Merger & Acquisition Deal’ and ‘Best Sovereign Bond’ awards from EMEA Finance; and ‘Deal of the Year’ award from The Banker for landmark transactions concluded during the previous year.
Asset Management
GIB’s asset management business, which is managed by its London-based subsidiary – GIB (UK) Limited (GIB UK) – posted another robust performance in 2015, despite increasingly volatile market conditions. Total revenues grew by 13.0 per cent, driven by the fixed income business, which includes the Bank’s flagship Emerging Markets Opportunities Fund (EMOF). The global passive equity business, which represents the bulk of assets under management, benefited from strong market values in the first half of the year, before a market correction in the third quarter saw income remain neutral overall. Total funds under management at the end of the year stood at US$12.4 billion compared with US$13.0 billion at the end of 2014.
GIB UK made excellent progress in implementing its new five-year strategic plan for asset management, marked by key developments in sales and marketing activity, product development, and market penetration. A new sales team was formed with representation in Saudi Arabia, the GCC, Europe and the US to broaden the client base footprint; while a new relationship management team was

GIB | Celebrating 40 years
18 Annual Report 2015
established to service existing clients. The recently-established product development team focused on the development of the existing product base with particular emphasis on Middle East and North Africa (MENA), and Shariah-compliant solutions for both equities and fixed income. This included the successful launching of a dedicated Sukuk portfolio management service. During the year, asset management won its first MENA Sukuk mandate from a Saudi-based insurance company.
In terms of developing a local Sukuk management profile in Saudi Arabia, GIB UK and GIB Capital collaborated to broaden an understanding of the market and explore potential opportunities. A joint process was initiated to recruit an analytical capability in the Kingdom, which will initially support the build out of Sukuk portfolio management; and work closely with the new Saudi-based sales executive employed through GIB Capital but dedicated to GIB UK asset management. In a key strategic breakthrough, GIB UK achieved Securities & Exchange Commission (SEC) registration in the US, which resulted in the winning of a US$100 million fixed income mandate from a top ten American pension fund. The achievements by asset management in 2015 resulted in the receipt of four prestigious industry awards. These were ‘Fastest-growing Asset Management Bank - Saudi Arabia’ by Global Banking
& Finance Review; plus ‘Asset Manager of the Year - Bahrain’ and ‘Regional Equities Manager of the Year’ by the Global Investor. GIB’s Emerging Markets Opportunities Fund received the ‘Credit Specialist’ award from Alternative Credit Intelligence.
Retail Banking
The public launch of the Bank’s pioneering technology-led Shariah-compliant retail bank under the brand name Meem by GIB (meemم) with an initial range of liability products, took place in January 2015 at Al-Khobar, Saudi Arabia. The launch event, which was attended by 400 guests, was streamed live on YouTube and attracted over 3,000 viewers; and also reached one million viewers on Twitter, representing over 2.5 million viral (non-paid) impressions. The results of an independent customer survey conducted during the year re-affirmed customers’ strong perception of the brand, which was reinforced by the highly-encouraging growth in new customers during 2015.
Plans were finalised for the public launch of retail asset products in 2016, comprising credit cards, personal loans, and term loans based on the Tawarruq structure. These were successfully introduced during 2015 through a soft launch to staff, followed by a pilot launch to founding customers (known as Meemers). The necessary IT systems
to enable the introduction of new asset products were developed and tested during the year; and are fully compliant with the requirements of the Saudi Payment Network (SPAN) and Payment Card Industry Data Security Standard (PCI DSS). To support the retail bank’s ambitious growth plans, additional staff were recruited; and the management team was strengthened with the appointment of Heads of Commercial, Marketing and Innovation. In addition, the change delivery framework was realigned to enhance the time-to-market delivery of product enhancements, and new products and services.
treasury & investments
GIB continued to invest in its core treasury business during 2015. New developments included the successful commissioning of a new treasury
Management review continued

Annual Report 2015 19
front-to-back office system and the recruitment of additional professionals. In addition, a full-fledged treasury function was established at the newly-inaugurated Abu Dhabi wholesale banking branch in the UAE, which complements the treasury functions in Bahrain, Saudi Arabia and London.
During the year, Treasury continued to support GIB’s new business strategy by providing the Bank’s client base with bespoke treasury solutions, and supporting strategic cross-selling initiatives with the wholesale banking business. The Client Solutions Desk continued to upgrade and diversify the range of treasury solutions available to the Bank’s clients in line with evolving market requirements.
GIB’s funding profile remained strong in 2015, demonstrating the continued confidence of existing clients and counterparties. The Bank’s investment portfolios – which are composed of highly-rated bonds and Sukuks issued by governments, supra-nationals, financial institutions and corporates – remained on par with 2014 levels. The composition of the liquidity portfolio was adjusted in light of changing market conditions and regulations, with increased exposure to corporates and decreased exposure to financial institutions.
Risk Management
GIB’s comprehensive risk management function comprises dedicated units covering enterprise risk management; credit, market, liquidity and operational risk; special assets management; information security; and economic analysis and legal. The risk management framework, processes and procedures are reviewed annually to ensure ongoing compliance with regulatory authorities in the various jurisdictions in which GIB operates. A key focus in 2015 was on managing the impact to the Bank’s credit risk profile due to the changing economic and market environment resulting from the steep decline in oil prices, and reduced government expenditure across the GCC region. Accordingly, GIB reviewed and strengthened its lending policies; and de-emphasised certain segments such as contracting, which are dependent on government spending.
The Bank’s asset quality remains strong, and the increase in the loan portfolio during the year was achieved with no dilution of the risk profile. This was reinforced by Moody’s Investors Service (Moody’s) affirming GIB’s senior debt and foreign currency deposit rating at A3, and upgrading the outlook from negative to stable. Moody’s stated that their ratings affirmation and outlook upgrade “reflects GIB’s strong capital
In 2015, GIB continued to make excellent progress in transforming its wholesale banking division into a client-centric, relationship-based business.
and liquidity buffers; improvements in the bank’s asset quality metrics; and a reduction in the level of concentrations of the bank’s asset base.”
With the implementation of new core wholesale banking, retail banking, treasury and other systems, the Bank’s Business Continuity Plan (BCP) and Disaster Recovery (DR) came under the spotlight during the second half of the year. Accordingly, the Bank’s Operational Risk unit undertook a detailed Business Impact Assessment (BIA) and has documented the revised BCP and DR arrangements for the Bank. Appropriate testing is conducted twice a year as required by the Bank’s policy.
Group Information Security continued their work on behalf of the Bank by

GIB | Celebrating 40 years
20 Annual Report 2015
leading the achievement of the Payment Card Industry (PCI) Pin Transaction Standard (PTS) and maintaining GIB’s newly-won PCI Data Security Standard (DSS) certification for the second year. They also established a new frontline team, the Security Services Group (SSG), to act as a first point-of-contact for all security-related activity.
Human Capital
During 2015, GIB took further steps to expand the scope of its human capital framework to support the implementation of the Bank’s strategy, and its vision of being the ‘employer-of-choice’ in the regional banking industry. The end-to-end recruitment process was completely overhauled, including implementation of the Oracle Taleo Cloud Service. The
Bank also launched the use of candidate video screening, the first time that this has been adopted by a financial services organisation in Bahrain. These tools enable the recruitment of top performers with the right talent skills, aligning them to key goals and performance, while developing and compensating them appropriately.
A key development was the significant enhancement of the Young Professional Development Programme, which was first launched in 2013 and recruits 40 high-calibre GCC university graduates in two tranches each year. Improvements included new career pathways, and a revised curriculum that places greater emphasis on technical training and professional certification. A key driver of GIB’s ongoing cultural transformation is the Mobilising Leadership for Change Programme. The second phase of this programme, targeting senior vice presidents and some vice presidents who comprise the second tier of senior management, was implemented during 2015. This programme sets out the behavioural competencies expected from the Bank’s leaders, including a solutions-oriented mind-set, customer-centric focus, collaborative approach, and a commitment to translate strategy into action.
Despite the increasing competition for high-calibre talent in the regional
banking industry, GIB was successful in recruiting new professionals to support the strategic development of the core business lines. At the end of the year, the headcount had grown to over 1,000 employees, and significantly, has almost doubled over the past three years.
information technology
In 2015, GIB passed a key information technology (IT) milestone, reaping the reward of a number of major projects in the past three years to completely overhaul its Group-wide IT infrastructure and system platforms. This comprised the implementation of a new retail branch network and the commissioning of new data centres; and the replacement of a number of key systems such as the core banking system, treasury front-to-back office system, and payment messaging system. It also included the development of a set of proprietary green field IT capabilities for the new retail bank.
The sheer scope and time frame of this project, involving the concurrent implementation of numerous key systems, is unprecedented in the regional banking industry. Additional achievements during 2015 included the implementation of an IT infrastructure and systems for the new Abu Dhabi branch and Dubai representative office; and compliance with the Payment Card Industry Data Security Standard (PCI
Management review continued

Annual Report 2015 21
DSS) for card issuance and acquiring by the new retail bank.
Corporate Communications
In 2015, GIB introduced a new corporate communications (CC) strategy that is closely aligned to the Bank’s new transformational business strategy, and integrates all communications with concerned stakeholders across a broader digital footprint. The new CC strategy is directed towards enhancing GIB’s image and reputation, reaching out to existing and prospective clients; as well as raising awareness of the Bank’s name within the industry.
Key developments during the year in support of the new CC strategy included the launch of a totally-redesigned corporate website. This features easier navigation, improved functionality and embedded social media channels. In addition, professional event planning and management was introduced to promote key corporate and business developments. The Bank’s internal communications programme was substantially enhanced with the addition of new communications channels including videos, and staff engagement events. GIB’s corporate social responsibility (CSR) activities during 2015 are covered by the separate CSR Review in this annual report.
Moving Forward
As we prepare to enter our 40th year of operations, we remain optimistic about the prospects for GIB in 2016. The GCC region is well positioned to cope with declining oil prices in the near-term, while the IMF has forecast real GDP growth to remain positive. GCC governments have adopted a proactive stance to offset the decline in oil prices through economic and fiscal reforms designed to diversify revenues and reduce expenditure. This approach will be positive in the long-term for regional economies by making them more sustainable and competitive in an era of low oil prices.
Based on our considerable progress during 2015 and the past few years, GIB is well placed to address the challenges posed by a new regional economic reality. We will continue to focus on aligning people, products, processes and systems, in order to ensure the ongoing implementation of GIB’s strategy and business model.
In 2015, GIB passed a key information technology (IT) milestone, reaping the reward of a number of major projects in the past three years to completely overhaul its Group-wide IT infrastructure and system platforms.

GIB | Celebrating 40 years
22 Annual Report 2015
Corporate social responsibility reviewGIB has a firm commitment to support the development of the regional banking industry, and contribute to the well-being of the local communities in which it operates. A key development in 2015 was the launch of WAGIB – the Bank’s new corporate social responsibility (CSR) programme, which is aimed at supporting the local communities in Bahrain and Saudi Arabia. Some examples of CSR initiatives undertaken by GIB during the year are highlighted below.
new CSR programme launched
In 2015, GIB launched a new corporate social responsibility (CSR) programme – WAGIB – which is designed to enable the Bank to better support the local communities in Bahrain and Saudi Arabia, through financial and practical support, and special CSR events. GIB made its first donation under this programme to the Bahrain Down Syndrome Society, which provides support for individuals with Down Syndrome, together with their parents and families.
Health awareness
GIB participated in breast cancer awareness initiatives in Bahrain and Saudi Arabia during 2015, with staff raising money for Think Pink Bahrain and the Zahra Breast Cancer Association in Saudi Arabia. In a special gesture to support Breast Cancer Awareness, GIB floodlit its head office building in pink for the entire month of October.
In addition, GIB male staff took part in a ‘Movember’ initiative to raise awareness about men’s cancer. The initiative included a lecture on men’s health education and awareness.
Community engagement
GIB encourages and supports staff to participate in community engagement activities. For many years, the Bank has fielded teams in two of Bahrain’s most enduring annual charitable fund-raising events – the Bahrain Marathon Relay and the Bahrain Raft Race.
The Bank participated in the 2015 Bahrain Marathon Relay, which is organised by the Bahrain Round Table in association with the Bahrain Athletics Association. The GIB team once again
won first place in the financial institutions category, and third place overall from among 177 participating teams. GIB also took part in the 2015 Bahrain Raft Race organised by the Rotary Club of Salmaniya. A team of Bank employees took part in the men’s open sea race category.
Events sponsorship
GIB sponsored and participated in the 10th Euromoney Saudi Arabia Conference held in Riyadh, Kingdom of Saudi Arabia during May 2015. Entitled ‘Opportunities and Capital Markets’, this prestigious financial and investment conference brought together over 1,500 government officials, policy makers, financiers and business leaders to share their thoughts and perspectives on the role of the Kingdom in the region and the global economy.
H.E. Dr. Ibrahim Al-Assaf, Minister of Finance, inaugurated the event, which included keynote addresses by H.E. Mr. Mohammed Al-Jadaan, Chairman of the Capital Markets Authority; Mr. Adel Al-Ghamdi, CEO of the Saudi Stock Exchange (Tadawul); Mr. Jean Lemierre, Chairman of BNP Paribas; and Dr. Yahya Alyahya, CEO of GIB (from January 2009 to January 2016). Dr. Alyahya also participated in a panel discussion on ‘Bank Strategy’; while Mr. Khalid Al-Ghamdi, Acting CEO of GIB Capital, was a member of a panel entitled ‘Equity Markets: Strategy, Governance and IPOs’.

Annual Report 2015 23
Oct.In a special gesture to support Breast Cancer Awareness, GIB floodlit its head office building specially in pink for the entire month of October.
Think Pink Bahrain and Zahra Breast Cancer Association
10th Euromoney Saudi Arabia Conference, Riyadh
Bahrain Marathon Relay
MayGIB sponsored and participated in the Conference, with over 1,500 government officials, policy makers, financiers and business leaders in attendance.
Nov.The GIB team won first place in the financial institutions category and came third overall from 177 participating teams.
GIB | Celebrating 40 years
24 Annual Report 2015
Financial reviewGIB recorded consolidated net income after tax of US$90.4 million for the year ended 31st December 2015, compared to US$85.6 million in the prior year, representing a 6 per cent year-on-year increase.
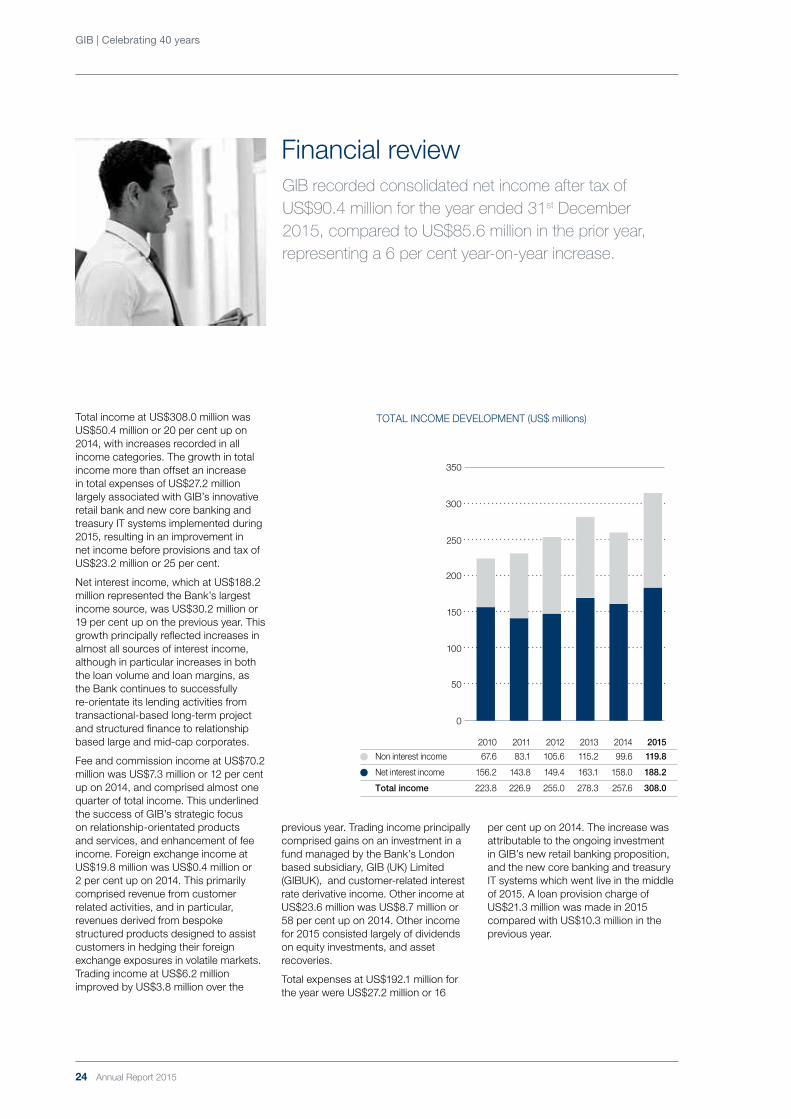
Total income at US$308.0 million was US$50.4 million or 20 per cent up on 2014, with increases recorded in all income categories. The growth in total income more than offset an increase in total expenses of US$27.2 million largely associated with GIB’s innovative retail bank and new core banking and treasury IT systems implemented during 2015, resulting in an improvement in net income before provisions and tax of US$23.2 million or 25 per cent.
Net interest income, which at US$188.2 million represented the Bank’s largest income source, was US$30.2 million or 19 per cent up on the previous year. This growth principally reflected increases in almost all sources of interest income, although in particular increases in both the loan volume and loan margins, as the Bank continues to successfully re-orientate its lending activities from transactional-based long-term project and structured finance to relationship based large and mid-cap corporates.
Fee and commission income at US$70.2 million was US$7.3 million or 12 per cent up on 2014, and comprised almost one quarter of total income. This underlined the success of GIB’s strategic focus on relationship-orientated products and services, and enhancement of fee income. Foreign exchange income at US$19.8 million was US$0.4 million or 2 per cent up on 2014. This primarily comprised revenue from customer related activities, and in particular, revenues derived from bespoke structured products designed to assist customers in hedging their foreign exchange exposures in volatile markets. Trading income at US$6.2 million improved by US$3.8 million over the
previous year. Trading income principally comprised gains on an investment in a fund managed by the Bank’s London based subsidiary, GIB (UK) Limited (GIBUK), and customer-related interest rate derivative income. Other income at US$23.6 million was US$8.7 million or 58 per cent up on 2014. Other income for 2015 consisted largely of dividends on equity investments, and asset recoveries.
Total expenses at US$192.1 million for the year were US$27.2 million or 16
per cent up on 2014. The increase was attributable to the ongoing investment in GIB’s new retail banking proposition, and the new core banking and treasury IT systems which went live in the middle of 2015. A loan provision charge of US$21.3 million was made in 2015 compared with US$10.3 million in the previous year.
2010 2011 2012 2013 2014 2015
Non interest income 67.6 83.1 105.6 115.2 99.6 119.8
Net interest income 156.2 143.8 149.4 163.1 158.0 188.2
Total income 223.8 226.9 255.0 278.3 257.6 308.0
TOTAL INCOME DEVELOPMENT (US$ millions)
350
300
250
200
150
100
50
0

Annual Report 2015 25
net interest income
Net interest income at US$188.2 million was US$30.2 million or 19 per cent higher than in the prior year.
Net interest income is principally derived from the following sources:
• marginincomeonthewholesalelending portfolio,
• marginincomeontheinvestmentsecurities portfolio,
• moneybookactivities,and
• earningsontheinvestmentoftheGroup’s net free capital.
Net interest income also incorporates the cost of term finance.
The year-on-year increase in net interest income was largely attributable to: (i) higher interest earnings derived from the wholesale lending portfolio, (ii) higher money book earnings, (iii) higher interest earnings on the investment of the net free capital, and (iv) a lower cost of term finance. Margin income on the investment portfolio was marginally lower than in the prior year.
Interest earnings on the wholesale lending portfolio accounted for 80 per cent of the Group’s net interest income before the cost of term finance. Margin income derived from wholesale lending was 9 per cent higher than in the prior year due to a higher average performing loan volume and an increase in average performing loan margins. The average performing loan volume during 2015 was 4 per cent higher than in 2014 and average performing loan margins were 8 b.p. higher than in the prior year. The increase in both average performing loan volumes and loan margins reflected the
ongoing success that has been achieved in the transformation of the Bank’s wholesale banking strategy to focus on relationship-based lending to large and mid-cap corporates.
Margin income on the investment securities portfolio accounted for 13 per cent of net interest income before the cost of term finance. The interest earnings from the investment securities portfolio were 2 per cent lower than in the prior year. The year-on-year decrease was attributable to a 5 b.p. year-on-year decrease in the average spread on the portfolio resulting from the reinvestment of maturing securities at lower prevailing spreads. The average volume of investment debt securities was at the same level as the prior year. The investment securities portfolio is primarily maintained as a liquidity reserve. The key factors underpinning the portfolio are therefore liquidity and quality rather than income-generating characteristics.
Money book earnings represent the differential between the funding cost of interest-bearing assets based on internal transfer pricing methodologies and the actual funding cost incurred by the Group. This includes benefits derived from the mismatch in the repricing profile of the Group’s interest-bearing assets and liabilities. Money book earnings in 2015 accounted for 16 per cent of net interest income before the cost of term finance, and were 38 per cent up on the prior year. During 2015, the Group was successful in further increasing the volume of customer deposits and deposit average tenors while enhancing income derived from interest repricing mismatches.
Earnings on the investment of the Group’s net free capital, which accounted for 11 per cent of net interest income before term finance costs, were 19 per cent up on the prior year. The net free capital was largely invested in shorter duration government bonds reflecting the Group’s view that economic conditions in the United States were more conducive to a rise in US interest rates in the short-term, with the shorter tenor fixed rate instruments providing the opportunity to reinvest on maturity at higher yields as interest rates rise in the short- to medium-term. At the end of 2015, more than half of the Group’s net free capital was invested in shorter duration fixed rate instruments, generating an enhanced return over short-term interest rates. Earnings on the net free capital in 2015 and 2014 were, however, negatively impacted by the historically low short-term US interest rates prevailing throughout both years. A rise in US interest rates would have a direct beneficial impact on the Group’s interest earnings.
The cost of term finance decreased in 2015 as a result of the maturity of a SAR 3.5 billion (US$933.3 million) term finance facility in April 2015. The maturing bond had been refinanced in 2014, well ahead of the bond maturity in 2015, resulting in a higher cost of term finance in 2014. The Group continues to minimise its previous reliance on funding longer tenor assets with short-term deposits, and the associated liquidity and refinancing risk, with proactive actions having been taken over the previous five years to raise new term finance to minimise this undue risk. As a result, at 31st December 2015,

GIB | Celebrating 40 years
26 Annual Report 2015
the volume of illiquid assets or assets maturing beyond one year that were funded by non-sticky or short-term deposits represented only 15 per cent of non-sticky customer deposits. The remaining customer deposits and all bank deposits therefore funded shorter tenor or liquid assets. This effectively addresses one of the key focuses of the new Basel 3 regulatory guidelines whereby banks will have less ability to fund longer tenor assets with shorter tenor wholesale deposits. The initiatives to reduce the Group’s exposure to liquidity risk resulted in a US$38.7 million or 17 per cent reduction in the Group’s net interest income in 2015.
non-interest income
Non-interest income comprises fee and commission income, foreign exchange income, trading income, and other income.
Fee and commission income at US$70.2 million was US$7.3 million or 12 per cent higher than in the prior year. An analysis of fee and commission income with prior year comparatives is set out in note 22 to the consolidated financial statements. Investment banking and management fees at US$38.3 million were the largest source of fee-based income, comprising 55 per cent of fee and commission income for the year, while commissions on letters of credit and guarantee at US$28.6 million represented 41 per cent.
Investment banking and management fees comprises fees generated by the Group’s asset management, fund management, corporate advisory, debt and equity capital markets, and underwriting activities. Investment banking and management fees were US$10.4 million or 37 per cent higher than the prior year level and incorporated fees derived from a number of debt and equity capital market mandates during the year, as commented on in more detail in the Management Review section of the Annual Report, contributing to associated income in 2015 being more than twice the level recorded in the prior year. In addition, asset and fund management fees in 2015 were 13 per cent higher than in the prior year, reflecting strong performance fees for the funds under management. As referred to in note 35 to the consolidated financial statements, assets held in a fiduciary capacity amounted to US$12.4 billion at 31st December 2015. A US$3.5 million or 11 per cent year-on-year decrease in commissions on letters of credit and guarantee reflected an industry sector realignment during 2015 with a reduction in activity in the construction and contracting sectors. Loan commitment fees at US$2.1 million were US$0.1 million higher than in the prior year with a focus on the utilisation by customers of their commitment facilities.
Foreign exchange income at US$19.8 million for the year was US$0.4 million up on the prior year level. Foreign exchange income principally comprised income generated from customer initiated foreign exchange transactions that were offset in the market with matching transactions. Accordingly, there is no market risk associated with the transactions that contribute to this material source of income. The strong foreign exchange earnings reflected the success achieved in the cross-selling of innovative products to meet customers’ needs and requirements, and the development of new products to meet
2010 2011 2012 2013 2014 2015
Foreign exchange, trading & other income
11.3
15.2
19.2
19.1
14.3
16.1
Fee & commission income 18.9 21.4 22.2 22.3 24.4 22.8
Net interest income 69.8 63.4 58.6 58.6 61.3 61.1
100.0 100.0 100.0 100.0 100.0 100.0
TOTAL INCOME COMPOSITION (%)
100
80
60
40
20
0
Financial review continued

Annual Report 2015 27
those needs. A growing demand is being witnessed for the products as customers experience the benefits derived from the new products in assisting them to effectively manage and hedge their currency exposures. Importantly, during 2015 the Group expanded its customer base to create a broader and a more desirable diversification of earnings from these products, as well as generating repeat business from existing clients.
The Group’s various trading activities recorded a US$6.2 million profit for the year compared to a US$2.4 million profit in the prior year. Trading income is reported inclusive of all related income, including interest income, gains and
losses arising on the purchase and sale, and from changes in the fair value of trading securities, dividend income, and interest expense, including all related funding costs. An analysis of trading income is set out in note 24 to the consolidated financial statements. Trading income in 2015 principally comprised profits recorded on managed funds and customer-related interest rate derivative income. The investment in managed funds represented an investment in an emerging market government-related debt fund managed by GIBUK. The fund, the Emerging Markets Opportunities Fund, generated a 6.11 per cent return in 2015.
Other income of US$23.6 million was recorded for the year. An analysis of other income is set out in note 25 to the consolidated financial statements. Other income principally comprised US$12.6 million of dividends received from equity investments classified as fair value through other comprehensive income (FVTOCI), US$7.9 million of asset recoveries, and a US$2.7 million profit realised on the sale of fixed rate investment debt securities in anticipation of a rise in US interest rates in the medium term.
DRIVER 2015 2016 AND BEYOND
Loan volume Increase in average loan volume Planned increase in 2016 and beyond to target level of $10 billion
Loan margins Increase in core loan portfolio margins through successful re-orientation of lending activities from transactional-based long-term project and structured finance to relationship-based large and mid-cap corporates
Continued increase in loan margins by replacement of lower margin lending with higher margin mid-cap corporates and initiation of passing along market disruption to customers
Income on net free capital
Increase in interest yield over the previous year, with the majority of the available net free capital invested in shorter duration fixed rate instruments, generating an enhanced return over short-term interest rates
Rising interest rate environment in the context of rising inflation, providing the opportunity to reinvest on maturity at higher yields
Term finance cost: liquidity risk cost
Decrease in term finance arising on the maturity of a SAR 3.5 billion term facility in April, and the prepayment of a US$328 million subordinated facility in June
New term finance to be raised in the short-term but replaced by retail deposits in the medium- to long-term
Fee and commission income Focus on cross-selling of non-asset based products and services, e.g. trade finance, investment bankingservices, and asset management
Focus on cross selling of non-asset based products and services, e.g. trade finance, investment banking services, and asset management
Treasury customer-related income: Foreign exchange and interest rate derivatives
Continued focus on cross-selling of treasury products and development of new products to assist customers in hedging their market risk exposures
Continued focus on cross selling of treasury products and development of new products to assist customers in hedging their market risk exposures
Overhead Ongoing investment in the new retail bank, and new core IT systems that went live during 2015
Continued investment in retail banking proposition, and the development of the Bank’s strategic initiatives
Loan provisions Increase in loan provision charge Any specific provisioning requirement to be reallocated from the non-specific provision buffer
Higher profitability Lower profitability Unchanged profitability
KEY PROFITABILITY DRIVERS

GIB | Celebrating 40 years
28 Annual Report 2015
Operating expenses
Operating expenses at US$192.1 million were US$27.2 million or 16 per cent up on the prior year. The year-on-year increase was principally attributable to costs associated with the implementation of the Group’s new universal banking strategy and new core banking and treasury IT systems which went live during 2015.
Staff expenses, which at US$128.4 million accounted for more than two thirds of total operating expenses, were US$13.0 million or 11 per cent up on the prior year. The year-on-year increase was attributable to an increase in headcount during 2015, in addition to specialist resources employed on a temporary basis to support the strategy implementation. The Group’s total headcount at 31st December 2015 of 1,106 staff was 72 higher than at the end of 2014. The increase in headcount reflected an enhancement of resources in business areas and certain support functions, as well as the business build teams for the new retail bank. The headcount at 31st December 2015 included 209 retail banking front office staff.
Premises expenses at US$17.5 million were US$1.8 million or 11 per cent up on the prior year. This was due to rent and depreciation costs relating to the Group’s new Kingdom of Saudi Arabia premises, and new premises for the Abu Dhabi branch and Dubai representative office that opened during 2015.
Other operating expenses at US$46.2 million were US$12.4 million or 37 per cent higher than in the prior year. The year-on-year increase was principally due to depreciation expenses relating to the new IT infrastructure that was implemented during 2015. There will
be a further increase in other operating expenses in 2016 reflecting the full year depreciation expense for the new IT systems.
Provisions
In 2015, there was a US$21.3 million net loan provision charge. The loan provision charge comprised specific provisions that were aligned with provisioning guidelines proposed by the Saudi Arabian Monetary Agency (SAMA) and similar guidelines set out in a consultation paper issued by the Central Bank of Bahrain (CBB). The provisioning guidelines require specific provisions to be determined based on the period that credit facilities have been past due, with a 100 per cent specific provision required for credit facilities that are more than 360 days past due. GIB’s specific loan provisions at 31st December 2015 were fully compliant with these provisioning guidelines in advance of their implementation dates. In addition, US$13.5 million was reallocated from the non-specific provision to specific provisions in relation to a number of impaired loan facilities for which new specific provisions were required in accordance with the SAMA and CBB provisioning guidelines. The total loan provision charge equated to 36.5 basis points based on gross loans at 31st December 2015 of US$9,522.4 million. This is well within the expected loss for the loan portfolio based on the rating profile and the prevailing related probabilities of default.
Capital strength
Total equity amounted to US$2,431.0 million at 31st December 2015. At the 2015 year end, the ratio of equity and tier 1 capital to total assets were both 10.0 per cent, ratios that are high by international comparison.
An US$80.3 million increase in total equity during 2015 comprised the net of the US$90.4 million profit for the year, a US$25.7 million net decrease in the fair value of equity investments classified as FVTOCI and derivative cash flow hedges , and a US$15.6 million increase in equity arising on the remeasurement of the defined benefit pension fund of the Group’s London-based subsidiary, GIBUK.
With a total regulatory capital base of US$2,555.7 million and total risk-weighted exposure of US$14,376.9 million, the risk asset ratio calculated in accordance with the Central Bank of Bahrain’s Basel 3 guidelines was 17.8 per cent while the tier 1 ratio was a particularly strong 16.8 per cent. In accordance with international regulatory guidelines, the fair value adjustments to equity arising under IFRS 9 in relation to derivative cash flow hedges are excluded from the regulatory capital base, while unrealised gains and losses on equity investments classified as FVTOCI are included in the regulatory capital base.
At 31st December 2015, the regulatory capital base would support an additional US$3.9 billion of 100 per cent risk-weighted assets while still maintaining the Group’s target minimum risk asset ratio of 14 per cent. The Group therefore has more than sufficient regulatory capital to support future growth plans.
The risk asset ratio incorporates both market and operational risk-weighted exposures. With approval from the Central Bank of Bahrain, the Group applies the internal models approach for market risk, and the standardised approach for determining the capital requirement for operational risk. This demonstrates that the Group’s regulator
Financial review continued

Annual Report 2015 29
is satisfied that the Group’s risk management framework fully meets the guidelines and requirements prescribed by both the Central Bank of Bahrain and the Basel Committee for Banking Supervision.
The Central Bank of Bahrain adopted the Basel 3 regulatory capital framework with effect from 1st January 2015. The Basel 3 framework revises the definition of regulatory capital. The application of the Basel 3 regulatory capital framework had only a very limited impact on the Bank’s regulatory capital ratios.
The Basel 3 Pillar 3 report set out in a later section of the Annual Report provides further detail on capital adequacy and the Group’s capital management framework. The Group’s policies in relation to capital
management are set out in note 27.5 to the consolidated financial statements. As described in more detail in the note, the Group’s policy is to maintain a strong capital base so as to maintain investor, counterparty and market confidence and to sustain the future development of the Group’s business.
Asset quality
The geographical distribution of risk assets is set out in note 28 to the consolidated financial statements. The credit risk profile of financial assets, based on internal credit ratings, is set out in note 27.1(b) to the consolidated financial statements. This note demonstrates that 82 per cent of all financial assets, comprising liquid assets, placements, securities and loans, were rated 4- or above, i.e. the equivalent of investment-grade rated.
Further assessment of asset quality can be facilitated by reference to note 37 to the consolidated financial statements on the fair value of financial instruments. Based on the valuation methodologies set out in that note, the net fair values of all on- and off-balance sheet financial instruments at 31st December 2015 were not significantly different to their carrying amounts.
At the 2015 year end, cash and other liquid assets, reverse repos and placements accounted for 44 per cent of total assets, investment securities accounted for 16 per cent, while loans and advances represented 38 per cent.
investment Securities
Investment securities totalled US$3,884.5 million at 31st December 2015. The investment securities portfolio primarily represents the Group’s liquidity reserve and accordingly, principally comprises investment-grade rated debt securities issued by major international and regional financial institutions and government-related entities.
Investment securities comprise two types of debt security portfolios and a limited investment in equities and equity funds. The larger debt security portfolio comprises floating rate securities or fixed rate securities that have been swapped to yield constant spreads over LIBOR. These accounted for US$2,005.0 million, or 56 per cent, of the total investment debt securities at the 2015 year end. The smaller debt security portfolio represents the investment of the Group’s net free capital in fixed rate securities. This portfolio amounted to US$1,607.6 million at the end of 2015 and comprised investments in OECD and GCC government-related bonds. The Group had no exposure to troubled eurozone government debt, i.e. no exposure to Greek, Irish, Italian, Portuguese or Spanish government debt.
25
20
15
10
5
0
2010 2011 2012 2013 2014 2015
Risk asset ratio 24.3 23.3 20.1 18.9 19.6 17.8
RISK ASSET RATIO (%)

GIB | Celebrating 40 years
30 Annual Report 2015
Equity investments at the end of 2015 amounted to US$271.9 million. Equity investments at 31st December 2015 included listed equities amounting to US$163.8 million received in settlement of a secured past due loan. The remaining equity investments largely comprised private equity-related investments.
An analysis of the investment securities portfolio by rating category is set out in note 9.1 to the consolidated financial statements. US$3,088.1 million or 86 per cent of the debt securities at the 2015 year end were rated A- / A3 or above. Based on the rating of the issuer, a further US$524.5million or 14 per cent of the debt securities represented other investment-grade rated securities.
Thus, all debt securities comprised investment-grade rated securities.
The fair value of investment debt securities at 31st December 2015 was US$3,599.5 million. The fair value was accordingly only US$4.0 million less than amortised cost. The small difference in fair value compared to the amortised cost of the investment debt securities reflected the high quality and high ratings of the securities.
There were no past due or impaired investment securities at 31st December 2015.
Loans and Advances
Loans and advances amounted to US$9,161.4 million at the 2015 year end. This represented a US$1,229.9 million
or 16 per cent increase compared to the 2014 year end. As is evident from note 40 to the consolidated financial statements, the average volume of loans and advances during 2015 was US$8,798.8 million, being US$593.4 million higher than the average volume during 2014. The year-on-year increase was largely recorded in the second half of the year.
Based on contractual maturities at the balance sheet date, 59 per cent of the loan portfolio was due to mature within one year while 79 per cent was due to mature within three years. Only 9 per cent of loans were due to mature beyond five years. Details of the classification of loans and advances by industry are set out in note 10.2 to the
INVESTMENT DEBT SECURITIES RATING PROFILE
US$
millions %
AAA to A-/Aaa to A3 3,088.1 85.5
BBB+ to BBB-/Baa1 to Baa3 524.5 14.5
3,612.6 100.0
2010 2011 2012 2013 2014 2015
Other 1.6 1.6 1.8 1.8 1.8 2.2
Placements & other liquid assets 29.8 38.9 37.3 41.0 42.1 43.5
Securities 20.3 19.3 20.7 17.9 18.9 16.4
Loans and advances 48.3 40.2 40.2 39.3 37.2 37.9
100.0 100.0 100.0 100.0 100.0 100.0
ASSET MIX BY CATEGORY (%)
100
80
60
40
20
0
85.5
14.5
Financial review continued

Annual Report 2015 31
consolidated financial statements while the geographical distribution of loans and advances is contained in note 28. At 31st December 2015, 21 per cent of the gross loan portfolio comprised exposure to the energy, oil and petrochemical sector compared to 38 per cent at the end of 2011. This sectorial exposure reflects the Group’s previous strategic focus on project finance and syndicated lending in the GCC states. The largest industry sectorial exposure is to the trading and services sector, comprising 22 per cent of gross loans, reflecting the new strategic focus on relationship-based lending to large and mid-cap corporates. There was limited exposure to the construction and real estate sectors at the 2015 year end.
The credit risk profile of loans and advances, based on internal credit ratings, is set out in note 27.1(b) to the consolidated financial statements. US$5,243.6 million or 57 per cent of total loans were rated 4- or above, i.e. the equivalent of investment grade-rated. Only US$42.3 million of loans
and advances, net of provisions for impairment, were classified as individually impaired. Individually impaired loans represent loans for which there is objective evidence that the Group will not collect all amounts due in accordance with the contractual terms of the obligation. Therefore, 99.5 per cent of loans and advances were not individually impaired.
Total loan loss provisions at 31st December 2015 amounted to US$361.0 million. Counterparty specific provisions amounted to US$226.5 million while non-specific provisions were US$134.5 million. Total provisions of US$361.0 million represented 160 per cent of the gross book value of past due loans. There was accordingly a significant buffer of provisions in excess of the volume of past due loans.
Specific provisions are determined based on the recoverable amount of the loan. The recoverable amount is measured as the present value of the expected future cash flows discounted based on the interest rate at the
inception of the facility. Non-specific provisions are determined on a portfolio basis utilising an incurred loss model. The incurred loss model estimates the probable losses inherent within the portfolio at the balance sheet date but that have not been specifically identified. The model is based on applicable credit ratings and associated historical default probabilities, loss severity and rating migrations, and reflects the current macroeconomic, political and business environment and other pertinent indicators.
Non-specific loan provisions at 31st December 2015 amounted to US$134.5 million, representing a high 1.4 per cent of non-specifically provisioned loans. The probabilities of default applied in the calculation of the non-specific provisions at 31st December 2015 equated to circa two times the current level of probabilities of default. The default rates applied in the calculation of the non- specific loan provision and the resultant provisioning levels for senior, unsecured exposure by internal rating category were as follows:-
LOAN MATURITY PROFILE
US$
millions %
Year 1 5,442.5 59.4
Year 2 and 3 1,838.8 20.1
Year 4 and 5 1,056.9 11.5
Over 5 years 823.2 9.0
9,161.4 100.0
59.420.1
11.5
9.0
Internal rating grade
Probability of default (PDs)
Senior, unsecured
provisioning level
% %
1 0.02% -
2+ 0.02% -
2 0.02% -
2- 0.04% -
3+ 0.12% 0.1%
3 0.16% 0.1%
3- 0.24% 0.1%
4+ 0.49% 0.3%
4 0.70% 0.4%
4- 0.86% 0.5%
5+ 1.50% 0.9%
5 2.32% 1.4%
5- 4.14% 2.5%
6+ 6.58% 3.9%
6 16.15% 9.7%
6- 26.30% 15.8%
7 55.74% 33.4%
The provisioning level is based on a Loss Given Default (LGD) of 60 per cent for senior, unsecured exposure.
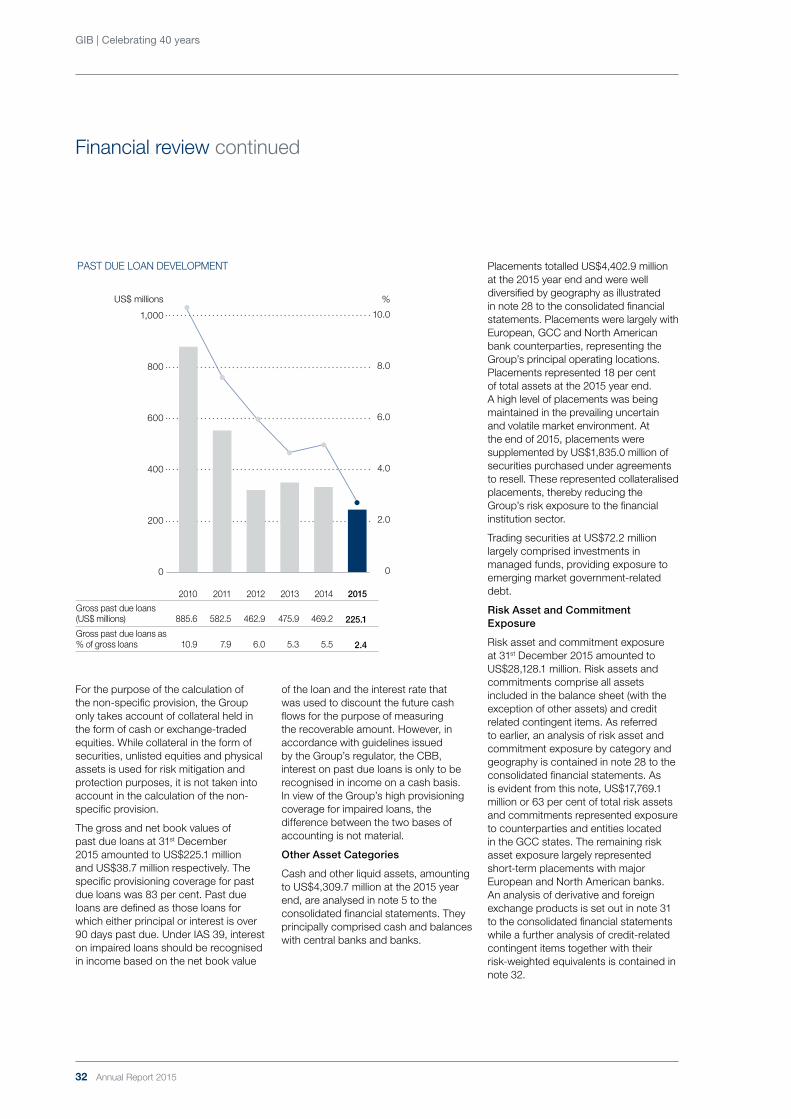
GIB | Celebrating 40 years
32 Annual Report 2015
For the purpose of the calculation of the non-specific provision, the Group only takes account of collateral held in the form of cash or exchange-traded equities. While collateral in the form of securities, unlisted equities and physical assets is used for risk mitigation and protection purposes, it is not taken into account in the calculation of the non-specific provision.
The gross and net book values of past due loans at 31st December 2015 amounted to US$225.1 million and US$38.7 million respectively. The specific provisioning coverage for past due loans was 83 per cent. Past due loans are defined as those loans for which either principal or interest is over 90 days past due. Under IAS 39, interest on impaired loans should be recognised in income based on the net book value
of the loan and the interest rate that was used to discount the future cash flows for the purpose of measuring the recoverable amount. However, in accordance with guidelines issued by the Group’s regulator, the CBB, interest on past due loans is only to be recognised in income on a cash basis. In view of the Group’s high provisioning coverage for impaired loans, the difference between the two bases of accounting is not material.
Other Asset Categories
Cash and other liquid assets, amounting to US$4,309.7 million at the 2015 year end, are analysed in note 5 to the consolidated financial statements. They principally comprised cash and balances with central banks and banks.
Placements totalled US$4,402.9 million at the 2015 year end and were well diversified by geography as illustrated in note 28 to the consolidated financial statements. Placements were largely with European, GCC and North American bank counterparties, representing the Group’s principal operating locations. Placements represented 18 per cent of total assets at the 2015 year end. A high level of placements was being maintained in the prevailing uncertain and volatile market environment. At the end of 2015, placements were supplemented by US$1,835.0 million of securities purchased under agreements to resell. These represented collateralised placements, thereby reducing the Group’s risk exposure to the financial institution sector.
Trading securities at US$72.2 million largely comprised investments in managed funds, providing exposure to emerging market government-related debt.
Risk Asset and Commitment Exposure
Risk asset and commitment exposure at 31st December 2015 amounted to US$28,128.1 million. Risk assets and commitments comprise all assets included in the balance sheet (with the exception of other assets) and credit related contingent items. As referred to earlier, an analysis of risk asset and commitment exposure by category and geography is contained in note 28 to the consolidated financial statements. As is evident from this note, US$17,769.1 million or 63 per cent of total risk assets and commitments represented exposure to counterparties and entities located in the GCC states. The remaining risk asset exposure largely represented short-term placements with major European and North American banks. An analysis of derivative and foreign exchange products is set out in note 31 to the consolidated financial statements while a further analysis of credit-related contingent items together with their risk-weighted equivalents is contained in note 32.
2010 2011 2012 2013 2014 2015
Gross past due loans(US$ millions)
885.6
582.5
462.9
475.9
469.2
225.1
Gross past due loans as % of gross loans
10.9
7.9
6.0
5.3
5.5
2.4
PAST DUE LOAN DEVELOPMENT
1,000
800
600
400
200
0
10.0
8.0
6.0
4.0
2.0
0
%US$ millions
Financial review continued

Annual Report 2015 33
Funding
Bank and customer deposits at 31st December 2015 totalled US$16,669.3 million. Customer deposits amounted to US$14,683.4 million at the 2015 year end, representing 88 per cent of total deposits. Bank deposits at 31st December 2015 amounted to US$1,985.9 million, representing only 12 per cent of total deposits.
Total deposits are analysed by geography in note 13 to the consolidated financial statements. US$11,749.6 million or 70 per cent of total deposits were derived from counterparties in GCC countries. Deposits derived from non-MENA countries, principally Europe, amounted to US$4,142.4 million or 25 per cent of total deposits. The deposits from counterparties in non-MENA countries largely related to deposit activity by GIBUK. These
deposits do not represent a core funding source for the Group. This compares to placements, reverse repos and other liquid assets with non-MENA counterparties of US$6,779.0 million and are placed on a short-term basis in the money market. The Group is therefore a net placer of funds in the international interbank market, and accordingly has no net reliance on the international interbank market.
Securities sold under agreements to repurchase (repos) were US$2,093.4 million at 31st December 2015. The Group utilises its high quality and highly rated investment securities to raise funding on a collateralised basis where effective from a cost and tenor perspective, as well as constantly validating its ability to repo the securities as part of the Group’s liquidity contingency plans.
Senior term financing at 31st December 2015 totalled US$2,420.0 million. Term finance, including subordinated term finance, and equity represented 134 per cent of loans maturing beyond one year. A decrease in senior term finance during 2015 of US$952.9 million was largely attributable to a SAR3.5 billion (US$933.3 million) bond that matured in April 2015. The maturing bond had been refinanced in 2014, well ahead of its maturity in 2015.
Further commentary on liquidity and funding is provided in the Risk Management and Capital Adequacy report.
RISK ASSET AND COMMITMENT EXPOSURE DEPOSITS - GEOGRAPHICAL PROFILE
US$
millions %
GCC countries 11,749.6 70.5
Other MENA 777.3 4.7
Other countries 4,142.4 24.8
16,669.3 100.0
63.2
1.3
0.5
0.16.0
28.9
US$
millions %
GCC 17,769.1 63.2
Other MENA 136.4 0.5
Europe 8,141.5 28.9
North America 1,688.0 6.0
Asia 367.0 1.3
Latin America 26.1 0.1
28,128.1 100.0
70.5
24.8
4.7

GIB | Celebrating 40 years
34 Annual Report 2015
Corporate governance reportFrom inception, sound corporate governance has been essential at Gulf International Bank, both in achieving organisational integrity and efficiency, and in attaining fairness for all stakeholders.
Sound governance practices
When Gulf International Bank B.S.C. (“GIB” or the “Bank”) was established in 1975, its Agreement of Establishment and Articles of Association (“AoA”), executed at the time by the GCC Governments that created it, set the foundation of solid governance practices for the Bank. From the start, sound corporate governance has been essential at GIB, both in achieving organisational integrity and efficiency as well as in attaining fairness for all stakeholders.
Over the years, GIB has progressively adopted and implemented standards of corporate governance relevant to publicly-traded financial institutions although it is not a listed company; and since 2003, GIB has regularly published a statement on corporate governance in its annual reports.
In 2010, when the Central Bank of Bahrain (“CBB”) introduced new corporate governance requirements for banks in Bahrain, GIB had already put in place many measures that are hallmarks of good corporate governance practices, such as comprehensive mandates for the Board of Directors (“Board”) and for Directors and for Board Committees; a Code of Conduct (Code on Conduct, Ethics and Avoiding Conflicts of Interest) in both English and Arabic published on the Bank’s website, and a detailed Corporate Policy Manual and operating policies that anticipated the CBB’s new requirements. Subsequently, GIB adopted additional measures that
included, amongst other things, a new Board Charter and updated mandates of the Board Committees; an enhanced Whistle Blowing Policy; establishment of a dedicated Corporate Governance Committee; and an update of its variable remuneration framework to fully comply with the Sound Remuneration Practices issued by the CBB.
The Board and its respective Committees’ mandates are subject to an annual review to ensure that they continue to reflect the current processes, best practices and any new regulatory requirements. The last updates were initiated and approved by the Board in December 2015.
The Board Charter is posted in its entirety on the Bank’s website (www.gib.com), and largely reflects the corporate governance requirements contained in the HC (High Level Controls) Module of the CBB Rulebook Volume 1.
The measures adopted by GIB formally entrenched a culture of professional corporate governance in the organisation. They also demonstrated GIB’s commitment to financial transparency, fairness and disclosure of financial information that will benefit all users of such information, including regulators, customers, counterparties, rating agencies and other stakeholders.
In March of every year, the Board prepares for its Shareholders’ Annual General Meeting (“AGM”) a report on GIB’s compliance with the CBB rules on corporate governance, which explains any non-compliance. The explanations
contained in this year’s “Comply or Explain” report are reproduced at the end of this section of the Annual Report.
GIB discloses in the Annual Report additional information required to be disclosed in accordance with Section PD-1.3.8 of the CBB Rulebook Volume 1, and the Board also discloses to the Shareholders the information required to be disclosed to them annually in accordance with Section PD-6.1.1 of the Rulebook.

Annual Report 2015 35
SHAREHOLdERS
The current shareholding structure of GIB is as follows:
Shareholder Percentage of shareholding
Public investment Fund Kingdom of Saudi Arabia
97.226%
Kuwait investment Authority State of Kuwait
0.730%
Qatar Holding Company State of Qatar
0.730%
Bahrain Mumtalakat Holding Company Kingdom of Bahrain
0.438%
State general Reserve Fund Sultanate of Oman
0.438%
Emirates investment Authority United Arab Emirates
0.438%
Organisation - rules and roles
GIB maintains a corporate governance structure that delineates and segregates the functions, roles and responsibilities of the Board and Management, and ensures that the requisite separate attribution of responsibilities between them is maintained:
• Thereisaneffectiveandappropriately constituted Board responsible for the stewardship of the Bank and the supervision of its business; it receives from Management all information required to properly fulfil its duties and the duties of the Committees that assist it; and it delegates to Management the authority and responsibility for managing the day- to day business of the Bank.
• Thereisaneffectiveandappropriately organised management structure responsible for the day-to-day management of the Bank and the implementation of Board approved strategy, policies and controls.
• Thereisacleardivisionofrolesand responsibilities between the Board and Management, and between the Chairman and the Chief Executive Officer (CEO).
• Therearedefinedanddocumented mandates and responsibilities (as well as delegated authorities where applicable) for Senior Management.
The Bank’s corporate governance structure and organisation chart is set out on page 52 of this Annual Report.
BOARd OF diRECtORS
Under GIB’s AoA, the Board comprises up to 10 members to be appointed or elected every three years. The AoA gives the right to each Shareholder holding 10 per cent of the share capital to appoint one member on the Board. The Shareholders exercising this right also have the right to terminate such appointment and replace the relevant Directors. The appointment of Directors is subject to prior approval from the CBB. In August 2015, the Shareholders re-appointed six Directors and appointed the CEO, Dr. Yahya A. Alyahya, as a Board member for a three-year term. Also, in October 2015, the Board assessed its composition and reconstituted its Committees, including the re-election of its Chairman and a new Vice Chairman of the Board.
GIB has a written appointment agreement with each Director. This agreement describes the Directors’ powers, duties, responsibilities and accountabilities, as well as other matters relating to their appointment, including their term, the time commitment envisaged, their assignment on the Board Committees, their remuneration and expense reimbursement entitlement, and their access to independent professional advice when needed.
At the year end, the Board comprised seven Directors of whom six are non-executive directors, including the Chairman and Vice-Chairman, and one executive Director, who together bring a wide range of skills and experience to the Board. Their biographies are set out on page 48 of this Annual Report.

GIB | Celebrating 40 years
36 Annual Report 2015
diRECtORS’ AttEndAnCE JAnUARy – dECEMBER 2015
Board membersBoard meetings
Executive Committee meetings
Audit Committee meetings
Nomination & Remuneration Committee meetings
Risk Policy Committee meetings
Corporate Governance Committee meetings
Executive / Non-executive
Independent / Non-independent
H.E. Jammaz bin Abdullah Al-Suhaimi, Chairman
6(6) 6(7) Non- Executive
Independent
H.E. Dr. Hamad bin Sulaiman Al-Bazai, Vice Chairman*
4(4) 4(4) 3(3) Non- Executive
Non-Independent
H.E. Mr. Sulaiman bin Abdullah Al-Hamdan, Vice Chairman
6(6) 7(7) 5(5) Non- Executive
Independent
Professor Abdullah bin Hassan Al-Abdul-Gader
6(6) 7(7) 5(5) 2(2) Non- Executive
Independent
Mr. Abdulla bin Mohammed Al Zamil
6(6) 5(5) 4(4) 2(2) Non- Executive
Independent
Mr. Khaled bin Saleh Al-Mudaifer
6(6) 5(5) 5(5) 2(2) Non- Executive
Independent
Mr. Omar Hadir Al-Farisi 6(6) 3(3) 5(5) 4(4) Non- Executive
Non-Independent
Dr. Yahya Abdullah Alyahya** 2(2) 1(1) Executive Non-Independent
* Board membership term ended in August 2015** Newly appointed in August 2015
Figures in (brackets) indicate the maximum number of meetings during the year.
Corporate governance report continued
independence of directors
The independence or non-independence of the Directors is subject to an annual review by the Board. As at 31st December 2015, two Directors of the Bank were classified as non-independent in accordance with the CBB regulations, and the other Directors were classified as independent (see table below).
Board responsibilities
The Board is responsible for the overall business performance and strategy of the Bank.
The Board establishes the objectives of the Bank, the adoption and annual review of strategy, the management structure and responsibilities, and the systems and controls framework. It monitors Management performance, and the implementation of strategy by Management, keeps watch over conflicts of interest, and prevents abusive related party transactions.
The Board is also responsible for the preparation and fair representation of the consolidated financial statements in accordance with International Financial Reporting Standards, and for such internal controls as the Board determines is necessary to enable the preparation of the consolidated financial statements that are free from material misstatement, whether due to fraud or error.
The Board also convenes and prepares the agenda for Shareholders’ meetings, and assures equitable treatment of Shareholders including minority Shareholders.
Finally, the Board delegates to Management the responsibility for the day-to-day management of the Bank in accordance with policies, guidelines and parameters set by the Board.
In preparation for Board and Committee meetings, the Directors receive, in a timely manner, regular reports and all other information required for
such meetings, supplemented by any additional information specifically requested by the Directors from time to time. The Directors also receive monthly financial reports and other regular management reports that enable them to evaluate the Bank’s and Management’s performance against agreed objectives. As prescribed in GIB’s Articles of Association, the Board plans at least four meetings per year, with further meetings to occur at the discretion of the Board.
The Board did not consider any issues that were outside the ordinary course of business during 2015.
The details of Board membership and Directors’ attendance during 2015 are set out in the following table:

Annual Report 2015 37
BOARd COMMittEES
The Committees of the Board derive their authorities and powers from the Board. Details of Committees’ membership and attendance are listed in the tables below:
BOARd COMMittEES’ MEMBERSHiP (JAnUARy – JULy 2015)
Board committees Member nameMember position
Executive Committee H.E. Jammaz bin Abdullah Al-SuhaimiH.E. Dr. Hamad bin Sulaiman Al-BazaiH.E. Mr. Sulaiman bin Abdullah Al-HamdanProfessor Abdullah bin Hassan Alabdulgader
Chairman Member Member Member
Audit Committee Professor Abdullah bin Hassan AlabdulgaderMr. Khaled bin Saleh Al-MudaiferMr. Omar Hadir Al-Farisi
Chairman Member Member
Nomination & Remuneration Committee H.E. Mr. Sulaiman bin Abdullah Al-HamdanMr. Abdulla bin Mohammed Al ZamilMr. Khaled bin Saleh Al-Mudaifer
Chairman Member Member
Risk Policy Committee H.E. Dr. Hamad bin Sulaiman Al-BazaiMr. Abdulla bin Mohammed Al ZamilMr. Omar Hadir Al-Farisi
Chairman Member Member
Corporate Governance Committee Professor Abdullah bin Hassan AlabdulgaderMr. Abdulla bin Mohammed Al ZamilMr. Khaled bin Saleh Al-Mudaifer
Chairman Member Member
BOARd COMMittEES’ MEMBERSHiP (AUgUSt – dECEMBER 2015)
Board committees Member nameMember position
Executive Committee H.E. Jammaz bin Abdullah Al-SuhaimiH.E. Mr. Sulaiman bin Abdullah Al-HamdanProfessor Abdullah bin Hassan AlabdulgaderMr. Omar Hadir Al-Farisi
Chairman Member Member Member
Audit Committee Professor Abdullah bin Hassan AlabdulgaderMr. Khaled bin Saleh Al-MudaiferMr. Omar Hadir Al-Farisi
Chairman Member Member
Nomination & Remuneration Committee H.E. Mr. Sulaiman bin Abdullah Al-HamdanMr. Abdulla bin Mohammed Al ZamilMr. Khaled bin Saleh Al-Mudaifer
Chairman Member Member
Risk Policy Committee Mr. Omar Hadir Al-FarisiMr. Abdulla bin Mohammed Al ZamilDr. Yahya Abdullah Alyahya
Chairman Member Member
Corporate Governance Committee Professor Abdullah bin Hassan AlabdulgaderMr. Abdulla bin Mohammed Al ZamilMr. Khaled bin Saleh Al-Mudaifer
Chairman Member Member

GIB | Celebrating 40 years
38 Annual Report 2015
on financial matters, internal controls, compliance and legal requirements. Its responsibilities include:
• AssistingtheBoardinitsoversight of (i) the integrity and reporting of the Bank’s quarterly and annual financial statements; (ii) compliance with legal and regulatory requirements; (iii) the Bank’s systems of internal controls; and (iv) the qualifications, independence and performance of the Bank’s internal and external auditors.
• OverseeingperformanceoftheBank’s internal audit function and independent audits.
The mandate of the Audit Committee provides further particulars on financial reporting processes, process improvements, and additional ethical and legal compliance overview responsibilities. The Group Chief Auditor reports functionally to the Audit Committee and administratively to the CEO.
Risk Policy Committee
The Committee assists the Board in fulfilling its oversight responsibilities in respect of setting the overall risk appetite, parameters and limits within which the Bank conducts its activities. On an on-going basis, the Committee:
• Ensuresthatrealisticpoliciesinrespect of management of all significant risks are drafted and approved appropriately.
• Receives,reviews,challengesandrecommends for approval by the Board any proposed amendments to the overall risk appetite of the Bank.
• MonitorswhetherManagementmaintains a culture that rewards the recognition, communication and management of risks.
• Ensuresthatrolesandresponsibilitiesfor risk management are clearly defined, with Group and/or division heads directly responsible, and that heads of risk management and the control functions are in supporting or monitoring roles, independent of business development.
Corporate governance report continued
Executive Committee
The mandate of the Executive Committee requires it, among other things, to:
• AssisttheBoardinformulating the executive policy of the Bank and controlling its implementation.
• AssisttheBoardbyreviewing, evaluating, and making recommendations to the Board with regard to key strategic issues or material changes in key strategic objectives or direction.
• Approvecreditlimitsthatexceedthe authority of the CEO, subject to the limits approved by the Board.
• Carryoutadditionalresponsibilities specifically mandated to it by the Board.
• ExercisethepowersoftheBoardon matters for which the Board has not otherwise given specific direction in circumstances in which it is impossible or impractical to convene a meeting of the Board (and subject to applicable law and GIB’s Agreement of Establishment & Articles of Association). However, the Board may, acting unanimously, modify or amend any decision of the Committee on such matters.
In all cases, the members of the Committee must exercise their business judgement to act in what they reasonably believe to be in the best interests of the Bank and its Shareholders.
Audit Committee
The role of the Audit Committee is to review the Group’s financial position and make recommendations to the Board
BOARd And COMMittEES MEEtingS dURing 2015
type of meeting Meeting dates
Board of Directors 1.2.3.4.5.6.
13 February 201512 March 201524 April 201510 July 20152 October 201511 December 2015
Executive Committee 1.2.3.4.5.6.7.
12 March 201524 April 20154 June 201510 July 201528 August 20152 October 201511 December 2015
Audit Committee 1.2.3.4.5.
12 February 201523 April 20159 July 201522 October 201510 December 2015
Nomination & Remuneration Committee
1.2.3.4.5.
31 January 201512 March 201523 April 201510 July 201517 September 2015
Risk Policy Committee 1.2.3.4.
12 February 201523 April 201510 July 201522 October 2015
Corporate Governance Committee 1.2.
12 February 201510 December 2015

Annual Report 2015 39
• EnsuresthatManagementreports significant excesses and exceptions, as and when they arise, to the Committee for information and review.
• Ensuresthat,onatimelybasis, Management informs the Committee of all significant risks arising, and that it is comfortable with Management’s responses and actions taken to address such findings.
• ReviewstheBank’sriskprofileand significant risk positions and in so doing:
– Receives reports on credit exposure by country, credit rating, industry/concentration, nonperforming loans and credit stress tests.
– Receives reports on liquidity and market risk positions (VaR).
– Receives updates on operational risk management.
– Receives updates on cyber risks
– Receives updates on strategic risks
– Receives reports on changes to credit approvals or extension processes, credit risk measurement, market risk measurement and risk control measures.
– Receives updates on retail banking risks.
nomination & Remuneration Committee
The principal objective of the Committee is to help the Board with ensuring that the Bank’s remuneration levels remain competitive for GIB to continue to attract, retain and motivate competent staff to achieve the strategy and objectives of the Bank. The responsibilities of the Committee, as stated in its mandate, also include, but are not limited to, the following:
nomination matters:
• Assessingtheskillsandcompetencies required on the Board, the Committees of the Board, and Senior Management.
• Assessingfromtimetotimethe extent to which the required skills are represented on the Board and Senior Management.
• Establishingprocessesforreviewing the performance of the individual Directors and the Board as a whole.
• Establishingprocessesforreviewing the performance of the individual Senior Executives and Senior Management as a whole.
• OverseeingDirectors’corporate governance educational activities.
• Establishingprocessesforthe identification of suitable candidates for Senior Management, and identifying and recommending individuals qualified to become members of Senior Management.
• Establishingasuccessionplanfor Senior Management.
Remuneration matters:
Reviewing and making recommendations to the Board in respect of:
• Theexecutiveremunerationand incentive policy which includes the fixed and variable remuneration for approved persons, and material risk-takers.
• Policiesrelatingtorecruitment, retention, performance measurement and termination for the Directors, the CEO and Senior Management.
• Approve,monitorandreviewthe remuneration system to ensure the system operates as intended.
• Approvetheremunerationamounts for each approved person and material risk taker, as well as total variable remuneration to be distributed, taking account of total remuneration including salaries, fees, expenses, bonuses and other employee benefits.
• Reviewthestresstestingandback testing results before approving the total variable remuneration to be distributed, including salaries, fees, expenses, bonuses and other employee benefits.
Corporate governance Committee
The role of the Committee is to assist the Board in shaping and monitoring the corporate governance policies. Its responsibilities include:
• Overseeingthedevelopmentand maintenance of corporate governance policies.
• MonitoringtheBank’scompliance with regulatory requirements relating to corporate governance.
• Reviewmandatesandperformance evaluations of the Board and its Committees, and recommend to the Board any improvements deemed necessary or desirable to the mandates.
• Reviewclassificationofindividual Directors, and declaration of Directors and members of Senior Management regarding their outside activities and interests to determine whether any conflict of interest exists, and take appropriate steps in that regard.
• OverseetheBank’spublicreporting on corporate governance matters.
Evaluation of the Board of directors
The mandates of the Corporate Governance and the Nomination & Remuneration Committees, as well as the Board Charter, reflect the requirement that the Board must conduct an evaluation of its performance, the performance of each Committee and of each individual Director, at least annually. The Board reviewed independent performance reports from each of its Committees as well as a report on its own performance by evaluating the major activities undertaken during the year in comparison with the respective mandates. The evaluation of individual Directors included measurable rating scales, self-evaluations and the Chairman’s input. A report on the evaluations conducted each year is also provided to Shareholders at each AGM.

GIB | Celebrating 40 years
40 Annual Report 2015
In 2014, the Bank adopted the Sound Remuneration Practices issued by the CBB, and updated its variable remuneration framework. The Board approved the revised policy framework and incentive components, and obtained Shareholders’ approval at the 2015 AGM. The key features of the remuneration framework are summarised below.
Remuneration strategy
It is the Bank’s basic compensation philosophy to provide a competitive level of total compensation to attract, retain and motivate qualified and competent employees. The Bank’s variable remuneration policy is driven primarily by a performance-based culture that aligns employee interests with those of the Shareholders of the Bank. These elements support the achievement of set objectives through balancing reward for both short-term results and long-term sustainable performance. The strategy is designed to share its success and to align employees’ incentives with the risk framework and risk outcomes.
The quality and long-term commitment of all employees is fundamental to the success of the Bank. The Bank therefore aims to attract, retain and motivate the very best people who are committed to maintaining a career with the GIB, and who will perform their role in the long-term interests of Shareholders. The Bank’s reward package comprises the following key elements
• Fixedpay
• Benefits
• Annualperformancebonus
• Deferredbonusshareplan.
A robust and effective governance framework ensures that the Bank operates within clear parameters of its compensation strategy and policy. All compensation matters, and overall compliance with regulatory requirements, are overseen by the Nomination and Remuneration Committee of the Board (“NRC”).
Corporate governance report continued
induction and the continuing education of directors
The Board and its Committees regularly receive updates on key developments in the regulatory and other areas that fall under their responsibilities (such as the update on the International Accounting Standards and the remuneration regulations issued by the CBB).
The Board also stresses the importance of providing training and development opportunities for the Directors. The Board has passed a resolution to encourage Directors to seek any training they deem necessary (with the Bank bearing the expenses of such training), and the Directors are frequently briefed on the availability of training opportunities.
MAnAgEMEnt
The Senior Management team is responsible for the day-to-day management of the Bank entrusted to it by the Board. It is headed by the CEO, who is assisted by the Chief Financial Officer, Chief Risk Officer, Chief Operating Officer, Wholesale Banking Head, Retail Banking Head, Chief Investment and Treasury Officer, Chief Information Officer and Chief Human Resources Officer. The biographies of the key members of the Senior Management team are set out on page 50 of this Annual Report.
The following six Committees assist the CEO in the management of the Bank:
• ManagementCommittee
• GroupRiskCommittee
• AssetsandLiabilitiesCommittee (ALCO)
• HumanResourcesCommittee
• InformationSecurityCommittee
• OperationalRiskCommittee
These Committees derive their authorities from the CEO, based on the authorities and limits delegated by the Board.
In fulfilling its principal responsibility for the day-to-day management of the Bank, the Senior Management team is required to implement Board-approved policies and effective controls, within the strategy and objectives set by the Board.
Letters of appointment are issued to members of the Senior Management team setting out their specific responsibilities and accountabilities that include assisting with and contributing to the following:
• FormulationoftheBank’sstrategic objectives and direction.
• FormulationoftheBank’sannual budget and business plan.
• Ensuringthathigh-levelpoliciesarein place for all areas, and that such policies are fully applied.
• Thesettingandmanagementofrisk return targets in line with the Bank’s overall risk appetite.
• DeterminingtheBank’soverall risk-based performance measurement standards.
• Reviewingbusinessunits’ performance and initiating appropriate action.
• EnsuringthattheBankoperatestothe highest ethical standards, and complies with both the letter and spirit of the law, applicable regulations and codes of conduct.
• EnsuringthattheBankisanexemplar of good business practice and customer service.
Their attention is also drawn to the fact that these obligations are in addition to their specific functional responsibilities and objectives, and those set out in the Bank’s Corporate Policy Manual.
REMUnERAtiOn
The Bank’s total compensation policy, which includes the variable remuneration policy, sets out GIB’s policy on remuneration for Directors and Senior Management, and the key factors that were taken into account in setting the policy.

Annual Report 2015 41
The Bank’s remuneration policy, in particular, considers the role of each employee, and has set guidance depending on whether an employee is a Material Risk Taker and/or an Approved Person in business line, control or support functions. An Approved Person is an employee whose appointment would require prior regulatory approval because of the significance of the role within the Bank; and an employee is considered a Material Risk Taker if they head up significant business lines, and any individuals within their control have a material impact on the Bank’s risk profile.
In order to ensure alignment between what is paid to employees and the business strategy, GIB assesses Bank-wide, divisional and individual performance against annual and long-term financial and non-financial objectives, summarised in line with the business planning and performance management process. This takes into account adherence to the Bank’s values, risk and compliance measures and, above all, acting with integrity. Altogether, performance is therefore judged not only on what is achieved over the short- and long-term, but also importantly on how it is achieved, as the latter contributes to the long-term sustainability of the business.
nRC role and focus
The NRC has oversight of all reward policies for the Bank’s employees. The NRC is the supervisory and governing body for compensation policy, practices and plans. It is responsible for determining, reviewing and proposing the variable remuneration policy for approval by the Board. It is responsible for setting the principles and governance framework for all compensation decisions. The NRC ensures that all persons must be remunerated fairly and responsibly. The remuneration policy is reviewed on a periodic basis to reflect changes in market practices, and the business plan and risk profile of the Bank.
The aggregate remuneration paid to the NRC members during the year in the form of sitting fees amounted to US$45,000 [2014: US$51,000].
External consultants
Consultants were appointed during 2014 to advise the Bank on amendments to its variable remuneration policy to be in line with the CBB’s Sound Remuneration Practices and industry norms. This included assistance in designing an appropriate Share-based Incentive Scheme for the Bank. The NRC also appointed consultants during the year to perform a pay benchmarking exercise to assist them in reviewing the total compensation offered by the Bank.
Scope of application of the remuneration policy
The principles of this remuneration policy apply on a Group-wide basis. However, application of deferral requirements and issue of non-cash instruments for foreign branches and subsidiaries of the Bank is determined by applicable local regulations and market norms.
Board remuneration
The Bank’s Board remuneration is determined by its Shareholders in line with its Articles of Association. The compensation is linked to actual attendance of meetings. The structure and level of the compensation for the members of the Board are approved by the AGM, and consist of the following:
• Attendancefeespayabletomembers attending different Board-related Committee meetings.
• Allowancetocovertravelling, accommodation and subsistence, while attending Board and related Committee meetings.
• Apre-definedfixedamount representing an annual remuneration fee.
In 2015, the aggregate remuneration paid to Board members and key Management was US$9.4 million [2014: US$8.6 million] of which US$2.6 million [2014: US$2.5 million] was paid to the Board members.
Variable remuneration for staff
The variable remuneration is performance related, and consists primarily of the annual performance bonus award. As a part of the staff’s variable remuneration, the annual bonus
reward consists of delivery of operational and financial targets set each year, the individual performance of the employees in achieving those targets, and their contribution to delivering the Bank’s strategic objectives.
The Bank has adopted a Board-approved framework to develop a transparent link between variable remuneration and performance. The framework is designed on the basis that the combination of meeting both financial performance and achievement of other non-financial factors would, all other things being equal, deliver a target bonus pool for the employees, prior to consideration of any allocation to business lines and employees individually. In the framework adopted to determine the variable remuneration pool, the NRC aims to balance the distribution of the Bank’s profits between Shareholders and employees.
The key performance metrics at the Bank level include a combination of short-term and long-term measures, and include profitability, solvency, liquidity and growth indicators. The performance management process ensures that all goals are appropriately cascaded down to respective business units and employees.
In determining the amount of variable remuneration, the Bank starts from setting specific targets, establishing market comparable bottom-up, setting a profit target and other qualitative performance measures that would result in a target top-down bonus pool. The bonus pool is then adjusted to take account of risk via the use of risk-adjusted measures.
The NRC carefully evaluates practices by which remuneration is paid for potential future revenues whose timing and likelihood remain uncertain. The NRC demonstrates that its decisions are consistent with an assessment of the Bank’s financial condition and future prospects.
The Bank uses a formalised and transparent process to adjust the bonus pool for quality of earnings. It is the Bank’s objective to pay out bonuses out of realised and sustainable profits.

GIB | Celebrating 40 years
42 Annual Report 2015
If the quality of earnings is not strong, the profit base could be adjusted based on the discretion of the NRC.
For the Bank to have any funding for distribution of a bonus pool, thresholds of financial targets have to be achieved. The performance measures ensure that the total variable remuneration is generally considerably contracted where subdued or negative financial performance of the Bank occurs. Furthermore, the target bonus pool, as determined above, is subject to risk adjustments in line with the risk adjustment and linkage framework.
Remuneration of control functions
The remuneration level of staff in the control and support functions allows the Bank to employ qualified and experienced personnel in these functions. The Bank ensures that the mix of fixed and variable remuneration for control and support function personnel is weighted in favour of fixed remuneration. The variable remuneration of control functions is based on function-specific objectives, and is not to be determined by the individual financial performance of the business area they monitor.
The Bank’s performance management system plays a major role in deciding the performance of the support and control units on the basis of the objectives set for them. Such objectives are more focused on non-financial targets that include risk, control, compliance and ethical considerations, as well as the market and regulatory environments, apart from value-adding tasks which are specific to each unit.
Variable remuneration for business units
The variable remuneration for the business units is primarily decided by the key performance objectives set through the performance management system of the Bank. Such objectives contain financial and non-financial targets, including risk control, compliance and ethical considerations, as well as the market and regulatory environments.
Risk assessment framework
The risk assessment framework of GIB aligns variable remuneration to the risk profile of the Bank, and also ensures that the remuneration policy reduces employees’ incentives to take excessive and undue risk. The Bank considers both quantitative measures and qualitative measures in the risk assessment process, and risk adjustments are applied to ensure that the Bank’s remuneration policies are aligned to its risk appetite.
The NRC considers whether the variable remuneration policy is in line with the Bank’s risk profile, and ensures that through the ex-ante and ex-post risk assessment framework and processes, remuneration practices where potential future revenues, whose timing and likelihood remain uncertain, are carefully evaluated.
Risk adjustments take into account all types of risks, including intangible and other risks such as reputation risk, liquidity risk and the cost of capital. The Bank undertakes risk assessment to review financial and operational performance against the business strategy and risk performance, prior to distribution of the annual bonus. GIB ensures that total variable remuneration does not limit its ability to strengthen its capital base.
The bonus pool takes into account the performance of the Bank, which is considered within the context of its risk management framework. This ensures that the variable pay pool is shaped by risk considerations and Bank-wide notable events.
The size of the variable remuneration pool and its allocation within the Bank takes into account the full range of current and potential risks, including:
• Thecapitalrequiredtosupportthe risks taken.
• Thelevelofliquidityriskassumedin the conduct of business.
• Consistencywiththetimingand likelihood of potential future revenues incorporated into current earnings.
The NRC keeps itself abreast of the Bank’s performance against the risk management framework. The NRC will use this information when considering remuneration to ensure that return, risk and remuneration are aligned.
Risk adjustments
The Bank has an ex-post risk assessment framework, which is a qualitative assessment to back-test actual performance against risk assumptions.
In years where the Bank suffers material losses in its financial performance, the risk adjustment framework would work as follows:
• Therewouldbeconsiderable contraction of the Bank’s total variable remuneration.
• Attheindividuallevel,poor performance by the Bank would mean individual KPIs are not met, and hence employee performance ratings would be lower.
• Reductioninvalueofdeferredshares or awards.
• Possiblechangesinvestingperiods, and additional deferral applied to unvested rewards.
• Lastly,ifthequalitativeand quantitative impact of a loss incident is considered significant, a malus or clawback of previous bonus awards may be considered.
The NRC, with Board approval, can rationalise and make the following discretionary decisions:
Corporate governance report continued

Annual Report 2015 43
• Theemployee’sbusinessunit suffers a material downturn in its financial performance, or a material risk management failure, or a material restatement of the financial statements of the Bank.
• Theemployeedeliberatelymisleads the market and/or Shareholders in relation to the financial performance of the Bank.
• Asignificantdeteriorationinthe financial health of the Bank, or the relevant line of business incurring losses.
Clawback can be used if the malus adjustment on the unvested portion is insufficient, given the nature and magnitude of the issue.
All deferred awards are subject to malus provisions. All share awards are released to the benefit of the employee after a six month retention period from the date of vesting. The number of equity share awards is linked to the Bank’s share price as per the rules of GIB’s Share Incentive Scheme. Any dividend on these shares is released to the employee, along with the shares (i.e. after the retention period).
COMPOnEntS OF VARiABLE REMUnERAtiOn
Variable remuneration has following main components:
Upfront cash The portion of the variable remuneration that is awarded and paid out in cash on conclusion of the performance evaluation process for each year.
Deferred cash The portion of variable remuneration that is awarded and paid in cash on a pro-rata basis over a period of 3 years.
Upfront share awards The portion of variable remuneration that is awarded and issued in the form of shares on conclusion of the performance evaluation process for each year.
Deferred shares The portion of variable remuneration that is awarded and paid in the form of shares on a pro-rata basis over a period of 3 years.
• Increase/reducetheex-post adjustment.
• Consideradditionaldeferralsor increase in the quantum of share awards.
• Recoverythroughmalusand clawback arrangements.
Malus and clawback framework
The Bank’s malus and clawback provisions allow the NRC to determine that, if appropriate, unvested elements under the deferred bonus plan can be forfeited/adjusted, or the delivered variable remuneration could be recovered in certain situations. The intention is to allow the Bank to respond appropriately if the performance factors, on which reward decisions were based, turn out not to reflect the corresponding performance in the longer-term. All deferred remuneration awards contain provisions that enable the Bank to reduce or cancel the awards of employees whose individual behaviour has had a materially detrimental impact on GIB during the concerned performance year. Any decision to take back an individual’s award can only be taken by the NRC.
The Bank’s malus and clawback provisions allow the Board to determine that, if appropriate, vested/unvested elements under the deferred bonus plan can be adjusted/cancelled in certain situations. These events include, but are not limited to, the following:
• Reasonableevidenceofmisbehaviour or material error by the employee causing harm to the Bank’s reputation, or where the employee’s actions have amounted to misconduct, incompetence or negligence.

GIB | Celebrating 40 years
44 Annual Report 2015
dEFERREd REMUnERAtiOn
All employees at the grade of Senior Vice-President (“SVP”) and higher shall be subject to deferral of variable remuneration as follows:
Corporate governance report continued
Element of variable remuneration
Allocation of variable remuneration
Deferral period Retention Malus Clawback
CEO, MDs and the 5 most highly-paid business line
employeesSVP and higher
Upfront cash 40% 50% none - - YesUpfront shares - 10% none 6 months Yes YesDeferred cash 10% - 3 years* - Yes YesDeferred share awards 50% 40% 3 years* 6 months Yes Yes
* The deferral vests on a pro-rata basis over a 3 year period.
Employees
US$ thousands
2015
Number of staff
Fixed remuneration
Sign on bonuses
Guaranteed bonuses
Variable remuneration
Total
Upfront Deferred
Cash Others(Cash / shares)
(Cash / shares) Cash Shares Cash Shares Others
Approved persons
- Business Lines 8 3,162 335 - - 807 14 184 976 - 5,478- Control & Support 13 3,411 371 - - 435 51 30 353 - 4,651Other material risk takers 8 1,859 262 - - 207 31 13 189 - 2,561Other staff 254 27,165 4,441 - - 2,958 50 - 199 - 34,813Overseas staff 823 55,627 11,399 - - 7,815 - - - - 74,841
total 1,106 91,224 16,808 - - 12,222 146 227 1,717 - 122,344 Other staff expenses reported in the consolidated statement of income that have not been included in the table above, amounting to US$6.1 million, comprise indirect staff costs including training, recruitment expenses, life assurance contributions, and differences between accrued staff expenses and the amounts actually paid.
The NRC, based on its assessment of role profiles and risk taken by an employee, could increase the coverage of employees that would subject to deferral arrangements.
dEtAiLS OF REMUnERAtiOn
Board of directors
US$ thousands 2015 2014
Sitting fees 434 343Remuneration fees 1,148 1,191Others* 995 936
total 2,577 2,470
* Represents allowances to cover travelling and accommodation while attending Board and related Committee meetings, including fees paid to a member for providing advisory services to the Bank US$360,000 [2014: US$360,000].

Annual Report 2015 45
US$ thousands
2014
Number of staff
Fixed remuneration
Sign on bonuses
Guaranteed bonuses
Variable remuneration
Total
Upfront Deferred
Cash Others(Cash / shares)
(Cash / shares) Cash Shares Cash Shares Others
Approved persons
- Business Lines 7 2,880 331 - - 803 8 190 985 - 5,197
- Control & Support 9 2,740 297 - - 407 55 33 384 - 3,916Other material risk takers 8 1,617 227 - - 194 39 - 155 - 2,232
Other staff 241 24,452 4,563 - - 2,660 36 - 145 - 31,856
Overseas staff 665 46,764 8,908 - - 8,105 - - - - 63,777
total 930 78,453 14,326 - - 12,169 138 223 1,669 - 106,978 Other staff expenses reported in the consolidated statement of income that have not been included in the table above, amounting to US$8.4 million, comprise indirect staff costs including training, recruitment expenses, life assurance contributions, and differences between accrued staff expenses and the amounts actually paid.
deferred awards
2015
Cash US$ thousands
Shares
Number US$ thousandsOthers
US$ thousandsTotal
US$ thousands
Opening balance - - - - -
Awarded during the period 223 1,943,801 1,807 - 2,030Paid out / released during the period - (149,343) (138) - (138)Service, performance and risk adjustments - - - - -Changes in value of unvested awards - - 64 - 64
Closing balance* 223 1,794,458 1,733 - 1,956 * Closing balance Share value based on NAV as on 31-12-15.
Severance pay
The severance payments during the year amounted to US$219,878 [2014: US$410,117] of which the highest paid to a single person amounted to US$153,645 [2014: US$152,403].

GIB | Celebrating 40 years
46 Annual Report 2015
Corporate Communications
The Bank has in place a Corporate Communications Strategy which ensures that the disclosures made by GIB are fair, transparent, comprehensive and timely; and reflect the character of the Bank and the nature, complexity and risks inherent in its business activities. Main communications channels include the website, annual report, corporate brochures, staff newsletters, and announcements in the appropriate media.
This transparency is also reflected in the Bank’s website (www.gib.com) which provides substantial information on the Bank; its financial statements for the last five years, and its press releases.
Code of Conduct
The Bank’s website also contains the Board-approved Code of Conduct that contains rules on conduct, ethics and on avoiding conflicts of interest, applicable to all the employees and Directors of the Bank. The Code of Conduct is designed to guide all employees and Directors through best practices to fulfil their responsibilities and obligations towards the Bank’s stakeholders (Shareholders, clients, staff, regulators, suppliers, the public, and the host countries in which the Bank conducts business, etc.), in compliance with all applicable laws and regulations.
The Code addresses such issues as upholding the law and following best practices; acting responsibly, honestly, fairly and ethically; avoiding conflicts of interest; protecting Bank property and data; protecting client-confidential information and safeguarding the information of others; complying with inside information rules and with the prohibition on insider trading; preventing money laundering and terrorism financing; rejecting bribery and corruption; avoiding compromising gifts; as well as speaking up and ‘whistle blowing’.
All employees and Directors of the Bank are reminded every year of their obligations under the Code of Conduct by means of an email from the Bank that includes a copy of the Code of Conduct (in English and Arabic), and everyone is required to sign an Acknowledgement and Declaration confirming that they have received and read the Code of Conduct and understand its requirements; have followed and will continue to follow these requirements; and agree that if they have any concern about any possible misconduct or breach of the Code of Conduct, they will raise the concern with the appropriate persons within the Bank as per the Code.
In addition, all employees of the Bank must sign an annual Declaration on outside employment and other activities, to ensure that no conflicts of interest exist. These Declarations are addressed to the Bank’s Human Resources department. Similarly, all Directors and members of the Management Committee must complete and sign a similar annual Declaration, addressed to the Corporate Governance Committee of the Board.
disclosures
The Bank’s website also provides access to GIB’s annual reports, and all the information contained in these reports is therefore accessible globally. The information includes Management discussion on the business activities of the Bank, as well as discussion and
analysis of the financial statements and risk management. The financial information reflects the latest International Financial Reporting Standards that are applicable for adoption in 2015.
The Board-approved Disclosure Policy is in accordance with the requirements of Basel 3 Pillar 3, in compliance with CBB rules. The objective of this policy is to ensure transparency in the disclosure of the financial and risk profiles of the Bank to all interested parties.
Policy on Connected Counterparties
The Board-approved Policy on Connected Counterparties governs GIB’s dealings with such parties. The policy defines which parties are considered to be connected with GIB within the criteria set by the CBB, and imposes not only the limitations placed by the CBB but also additional criteria imposed by GIB. The policy sets out the internal responsibilities for reporting GIB’s connected counterparties exposures to the CBB, and the disclosures to be made in GIB’s financial statements and annual reports, in line with applicable disclosure requirements.
Policy on Related Party transactions
GIB has a Board-approved Policy for the Approval of Related Party Transactions. The Bank’s dealings with its Shareholders are conducted on an arms-length basis in respect of its exposure to and deposits received from them. If loans are extended to related parties, these are approved on the basis of authorities delegated by the Board to the CEO. If the loans exceed these authorities, then further approval from the Executive Committee or the Board is requested. The Bank will not deal with any of its Directors in a lending capacity. It should be noted that Article 16 of the Articles of Association prevents Directors of the Bank from having any interest, directly or indirectly, in any contract with the Bank.
All loans to Senior Management members (including the CEO and his direct reports), as well as staff of GIB,
Corporate governance report continued

Annual Report 2015 47
are governed by the policies applicable to staff. These policies are reviewed by the Nomination & Remuneration Committee of the Board at least annually. All dealings with companies associated with a GIB Director or member of the Senior Management are referred to the Board for approval.
Material transactions that require Board approval
The Bank has delegated credit authority to the CEO based on a risk-rating matrix. When considering transactions, any exposure to an entity that exceeds the CEO’s limit will require the approval of the Board Executive Committee or the Board.
Compliance
The Compliance framework adopted by the Board reflects the principles for promoting sound compliance practices at GIB. It also demonstrates the Bank’s adherence to applicable legal and regulatory requirements, and to high professional standards. The role of the Compliance function is to assist Senior Management in ensuring that the activities of GIB and its staff are conducted in conformity with applicable laws and regulations, and generally with sound practices pertinent to those activities. The Group Head of Compliance, who reports directly to the CEO, also has access to the Board through the Audit Committee, if required.
In ensuring that the tone emanates from the top, the CEO issues a yearly message to all GIB employees reminding everyone of the importance of complying with all laws and regulations applicable to GIB’s operations. Good compliance behaviour is also rewarded by making it a mandatory measurement criteria in staff evaluations.
Anti-Money Laundering
The Bank’s current Anti-Money Laundering and Combating the Financing of Terrorism (AML/CFT) procedures and guidelines conform to the legal and regulatory requirements of the Kingdom of Bahrain. These legal and
regulatory requirements largely reflect the FATF recommendations on Money Laundering. GIB’s AML/CFT procedures and guidelines apply to all of the Bank’s offices, branches and subsidiaries, wherever located. In addition, the GIB entities located outside Bahrain are subject to the laws and requirements of the jurisdictions where they operate, and if local standards differ, the higher standards apply.
Systems are in place to ensure that business relationships are commenced with clients whose identity and activities can reasonably be established to be legitimate; to collect and record all relevant client information; to monitor and report suspicious transactions; to provide periodic AML/CFT training to employees; and to review with external auditors the effectiveness of the AML/CFT procedures and controls. The Bank’s AML/CFT procedures prohibit dealing with shell banks. A proactive structure of officers is in place to ensure Group-wide compliance with AML/CFT procedures, and the timely update of the same to reflect the changes in regulatory requirements. This structure consists of the Group Head of Compliance and the Group Money Laundering Reporting Officer, MLROs, and Deputy MLROs.
Corporate governance framework – Audit
The Internal Audit review of the Bank’s Corporate Governance framework is conducted annually as a separate project since the introduction of the Corporate Governance Rules in 2010. Accordingly, the latest audit was undertaken in April 2015. The purpose of the audit was to provide a level of assurance about the processes of corporate governance within the Bank. The scope of the audit included reviewing the existing policies, procedures and current practices followed by GIB in light of the CBB rules contained in the HC Module of the CBB Rulebook.
The overall conclusion of the audit was that the Corporate Governance framework of GIB appears to be operating effectively, and is providing a sound framework to control the risks inherent in GIB’s current business activities.
Status of compliance with the CBB rules (Module HC)
GIB is in compliance with the CBB rules on Corporate Governance outlined in Module HC of the CBB Rulebook, and instances of non-compliance in 2015 are explained as follows:
Module HC 7.2.2 requires all Directors to attend and be available to answer questions from Shareholders at any Shareholder meeting. The Chairman of the Board of Directors did not attend the Annual General Meeting (“AGM”) that was held on 12 March 2015. The Vice-Chairman of the Board chaired the AGM.
Under Article 2 of GIB’s Agreement of Establishment approved by Decree Law No. (30) for the year 1975 (as amended from time to time) (the “Agreement of Establishment”), GIB is subject to the Agreement of Establishment and its AoA (together the “GIB Constitutional Documents”), and in the event of any conflict between the GIB Constitutional Documents and the internal law of the Kingdom of Bahrain, the terms of the Constitutional Documents shall prevail. As a result, certain Corporate Governance requirements under HC-1, HC-4 and HC-5 that are in conflict with the AoA such as the nomination of Directors, the attendance requirements for Directors, the prohibition against proxies at Board Meetings, and the Board of Directors’ total remuneration, have not been adopted.

GIB | Celebrating 40 years
48 Annual Report 2015
1. H.E. Jammaz bin Abdullah Al-Suhaimi (1)
Chairman since 2008 Kingdom of Saudi Arabia
His Excellency Al-Suhaimi is ex-Chairman and Chief Executive of the Saudi Arabia Capital Market Authority (CMA); and ex-Deputy Governor of the Saudi Arabian Monetary Agency (SAMA), which he joined initially as Director General for Banking Control. He also served as Deputy Director General of the Saudi Industrial Development Fund. H.E. Al-Suhaimi is Vice Chairman of Saudi Arabian Investment Company (Sanabil Investments). He has also held board memberships in many leading public and private organisations, including the Saudi Arabian General Investment Authority, the General Petroleum and Minerals Organisation, the National Company for Cooperative Insurance, and the London-based Saudi International Bank (which merged with Gulf International Bank in 1999). H.E. Al-Suhaimi holds a Bachelor’s degree in Electrical Engineering from the University of Washington, USA. He has 41 years’ professional experience.
Biographies of the Board of Directors
1
5
2
6
3
7
4
2. H.E. Mr. Sulaiman bin Abdullah Al-Hamdan (1) (4)
Vice Chairman since 2015 Director since 2009 Kingdom of Saudi Arabia
His Excellency Al-Hamdan is President of the Saudi General Authority of Civil Aviation. Prior to this, he was Board Member and Group Chief Executive Officer of National Air Services (NAS Holding) in Saudi Arabia. He was also a Member of the Saudi Arabian Advisory Commission of the Supreme Economic Council. He previously worked for Saudi British Bank, where his various positions included Deputy Managing Director, and General Manager - Personal Banking; and at the Saudi Fund for Development. H.E. Al-Hamdan is an ex-Member of the Board of Trustees at Al Yamamah University; and an ex-Member of the Advisory Committee to the Industrial Management College at King Fahd University of Petroleum and Minerals, and Prince Sultan University, Saudi Arabia. He previously served as Chairman of Saudi Hollandi Capital; and Board Member of Middle East Specialized Cables Company, and Al Ahlia Cooperative Insurance Company. H.E. Al- Hamdan holds an MBA from the University of New Haven, USA; and a Bachelor’s degree in Administrative Science from King Saud University, Saudi Arabia. He has 36 years’ professional experience
3. Professor Abdullah bin Hassan Alabdulgader (1) (2) (5)
Director since 2009 Kingdom of Saudi Arabia
Professor Alabdulgader is Chairman of the Board of Saudi Telecom Company (STC) and serves as Director at Saudi Arabian Investment Company (Sanabil) and Saudi Company for Development and Technology Investment (Taqnia). He also chairs the Advisory Committee of the Saudi Arabia Capital Market Authority (CMA), and the Professional Quality Monitoring Committee at the Saudi Organization of Certified Public Accountants. Prior to this, he was Professor of Business Administration at King Fahd University of Petroleum and Minerals; and a Commissioner at the CMA, where he led development of the Kingdom’s corporate governance code. As a Founding Executive Director of the GCC Board Directors Institute, he continued to promote corporate governance in the region. Professor Alabdulgader holds a PhD in Business Administration from the University of Colorado Boulder, USA; and MBA and BSc degrees in Business Administration from King Fahd University of Petroleum and Minerals. He has 34 years’ professional experience.

Annual Report 2015 49
(1) Executive Committee member(2) Audit Committee member(3) Risk Policy Committee member(4) Nomination & Remuneration Committee member(5) Corporate Governance Committee member
4. Mr. Abdulla bin Mohammed Al Zamil (3) (4) (5)
Director since 2009 Kingdom of Saudi Arabia
Mr. Al Zamil is Board Member and Chief Executive Officer of Zamil Industrial Investment Company, having previously served as Chief Operating Officer. Prior to that, he was Senior Vice President at Zamil Air Conditioners, where he started his career as an industrial engineer. He is Chairman of GIB Capital, Saudi Global Ports and Singapore Ports Authority. Mr. Al Zamil’s board memberships include GIB UK Limited, Gulf Insulation Group, Ranco-Zamil Concrete Industries, General Authority of Civil Aviation (Government Entity) and Viva Bahrain; together with Saudi Human Resources Development Fund, Saudi Food Bank (Etaam), Endeavor - Saudi Arabia, and Dhahran Ahliyya School. Mr. Al Zamil holds an MBA (with a concentration in Finance) from King Fahd University of Petroleum and Minerals, Saudi Arabia; and a Bachelor’s degree in Industrial Engineering from the University of Washington, USA. He has 29 years’ professional experience.
5. Mr. Khaled bin Saleh Al-Mudaifer (2) (4) (5)
Director since 2009 Kingdom of Aaudi Arabia
Mr. Al-Mudaifer is President and Chief Executive Officer of Saudi Arabian Mining Company (Ma’aden), where he was previously Vice President for phosphate & new business development. Prior to that, he was Managing Director of Qassim Cement Company; and Vice President - Finance at Eastern Petrochemical Company (Sharq), a Sabic Affiliate. He is a Board and Executive Committee Member of Ma’aden; and an ex-Board Member of Qassim Cement Company, and Saudi Arabian Railway Company. Mr. Al-Mudaifer holds MBA and BSc degrees in Engineering from King Fahd University of Petroleum and Minerals, Saudi Arabia. He has 31 years’ professional experience.
6. Mr. Omar Hadir Al-Farisi (1) (2) (3)
Director since 2012 United States of America
Mr. Al-Farisi is Managing Member of Diyala Advisors in New York, and serves as an advisor to the Public Investment Fund of Saudi Arabia. Previously, he was an investment banker at Credit Suisse First Boston in New York, where he focused on energy sector financings, mergers and acquisitions, and related transactions. Prior to his career in banking, he was an attorney at the law firm of White & Case in New York, where he was a member of its Corporate & Financial Services Department. Mr. Al-Farisi holds a Juris Doctorate (JD) degree from Columbia University School of Law, USA; and a BA in Economics from the University of Notre Dame, USA. He has 22 years’ professional experience.
7. dr. yahya A. Alyahya (3)
Director since 2015 Chairman, Gulf International Bank (UK) Limited Kingdom of Saudi Arabia
Dr. Alyahya was Chief Executive Officer of Gulf International Bank (GIB) from January 2009 to January 2016. Prior to this, he was KSA Executive Director on the Board of the World Bank Group, where he held several prominent positions. Earlier, he was Advisor to the Governor of the Saudi Arabian Monetary Agency; GM of EA Juffali & Bro. in Riyadh; and Founder and Director General of the Institute of Banking, Riyadh. He was also Professor of Industrial and Systems Engineering at King Saud University, KSA, and the University of Michigan, USA; and Lecturer on Matching Problems and Algorithms at the Indian Statistical Institute, Bangalore, India. Dr. Alyahya is Chairman of GIB (UK); Saudi Airlines Catering Co; and Shuaibah Water and Electricity IWPP. He is a Board Member at the Institute of International Finance, Washington, and Co-Chairman of its Emerging Markets Advisory Council; and a Member of the Conciliation and Arbitration Panels of the International Center for Settlement of Investment Disputes. Previous board memberships include the Group of Twenty (G20) High Level Panel on Infrastructure Investment; NCB; GIC; Saudi Re; Oger Telecom; GIB; BSF; Saudi Agri Bank; and Saudi Eng. Soc. Dr. Alyahya holds a PhD in Industrial and Systems Engineering from the University of Michigan, USA; and graduated from King Fahd University of Petroleum and Minerals, KSA. He has 40 years’ professional experience.

GIB | Celebrating 40 years
50 Annual Report 2015
Biographies of senior management
Mr. Abdulaziz Al-Helaissi Chief Executive Officer
Mr. Al-Helaissi has 26 years of banking experience primarily in Saudi Arabia, and served on a number of boards including Tadawul (Saudi Arabia Stock Exchange).
Prior to joining GIB in February 2016, Mr. Al-Helaissi held the position of Deputy Governor for Supervision at the Saudi Arabian Monetary Agency (SAMA) having started there in May 2013. At SAMA, his responsibilities included the oversight of the Banking and Insurance sectors as well as Finance company regulations (mortgage, leasing, and other non-bank finance agreements). He was additionally responsible for consumer protection.
Prior to his post at SAMA, Mr. Al-Helaissi was Senior Country Officer and Managing Director, Saudi Arabia for JP Morgan Chase as well as Head of Global Corporate Banking for the Middle East and North Africa between September 2010 and May 2013. Earlier in his career, he was Central Province Area General Manager at Saudi British Bank (SABB), an affiliate of HSBC, covering all key lines of business, including corporate and consumer banking.
Mr. Al-Helaissi holds a Bachelor of Arts in Economics from the University of Texas in Austin, USA.
Stephen d. WilliamsManaging director – Chief Financial Officer
Member of Management Committee, Assets and Liabilities Committee, Group Risk Committee, Operational Risk Committee, Human Resources Committee, and Information Security Committee
Stephen Williams has 31 years’ international experience in banking, accountancy and audit. Joining GIB in 1987, he was appointed Group Financial Controller in 2000, and Chief Financial Officer in 2008. He is currently responsible for Group-wide statutory, regulatory and management reporting; financial and balance sheet planning, and capital management. He also has responsibility for the Bank’s Basel 3 implementation project. Prior to joining GIB, he worked for KPMG in London and the Middle East.
A certified Chartered Accountant and Member of the Institute of Chartered Accountants in England and Wales (ICAEW), Stephen Williams is the Bahrain country representative for the ICAEW. He holds a BSc Degree in Economics from Cardiff University, UK and is a Member of the Working Groups on Capital Adequacy and Working Liquidity at the Institute of International Finance.
Masood ZafarManaging director – Chief Risk Officer
Member of Management Committee, Assets and Liabilities Committee, Group Risk Committee, Operational Risk Committee, and Information Security Committee
Masood Zafar has 36 years’ international experience in banking, accountancy, audit and risk management. Joining GIB in 1982 in the Internal Audit department, he was subsequently appointed Chief Internal Auditor in 1987, Chief Credit Officer in 2004, and Chief Risk Officer in 2012. Prior to joining GIB, Mr. Zafar worked at Ernst & Young in London, and KPMG in Bahrain.
Masood Zafar is a Fellow of the Institute of Chartered Accountants in England and Wales.
Stewart MacphailSenior Managing director – Chief Operating Officer
Member of Management Committee, Assets and Liabilities Committee, Group Risk Committee, Operational Risk Committee, Human Resources Committee, and Information Security Committee
Stewart Macphail has over 26 years’ international business experience in both financial services and other business sectors, ranging from retail to construction. Joining GIB in his current position in December 2014, he is responsible for Group Operations, Information Technology, Administration Services, Corporate Communications and the Enterprise Programme Management Office; and currently has responsibility for the Bank’s retail business.
For seven years prior to joining GIB, Stewart Macphail held senior executive roles and board memberships across a diverse range of businesses in the MENA region, from large family groups and public companies to private equity-held businesses. In these positions, he operated at a strategic management level, developing restructuring strategies and translating them into clear operational implementation plans. Prior to moving to the Middle East, he worked for over 15 years in Europe with GE Capital, where his final position was CEO of GE Capital’s Card Services business in the UK.
Stewart Macphail holds a BA Honours degree in Business and Law from Lancaster University, UK.

Annual Report 2015 51
Mark WattsManaging director & Chief Executive Officergulf international Bank (UK) Limited
Mark Watts has 28 years’ experience in asset management and banking gained in the UK, USA and UAE, covering equities, fixed income, alternatives, structured products, emerging markets, currencies, derivatives, and real estate. He was appointed to his current position in 2014.
Prior to joining GIB UK, Mark Watts spent four years with the National Bank of Abu Dhabi, where his final position was Managing Director and Chief Investment Officer of the Asset Management Group. Previously, he was Head of Asset Management at Qatar Islamic Bank-owned European Finance House based in London; and Head of Global Fixed Income at Aviva Investors. Before this, he spent over 17 years at Baring Asset Management, a leading UK-based investment management firm, working in the UK and the US.
Mark Watts is a CFA Charter Holder, and a Fellow of the Chartered Institute for Securities & Investment (CISI). He holds Diplomas from the CISI and the International Security Managers Association (ISMA), together with the Islamic Finance Qualification (IFQ).
Khalid Saleh Al-ghamdiActing Chief Executive Officer giB Capital
Khalid Al-Ghamdi has over 19 years’ international experience in finance and investment banking. Joining GIB in 2004, he was appointed Head of Corporate Finance at GIB Capital in 2007, and subsequently promoted to his current position in 2013. Prior to GIB, he worked with Banque Saudi Fransi in Saudi Arabia; and with Merrill Lynch and Edward Jones in the UK.
Khalid Al-Ghamdi holds an MBA in Finance from the University of Colorado in Boulder, USA.
Ravi KrishnanExecutive Vice President – Acting Head of Wholesale Banking
Member of Management Committee, Assets and Liabilities Committee, Operational Risk Committee, Human Resources Committee, and Information Security Committee
Ravi Krishnan has over 15 years’ banking experience in the GCC. Joining GIB in 2004 as Vice President - Project Finance, he was subsequently promoted to Senior Vice President - Head of Project Advisory, followed by Head of Credit Products and then Head of Relationship Management for GCC and International Markets. He was appointed to his current position in 2015. Prior to joining GIB, Ravi Krishnan worked with Arab Petroleum Investments Corporation (APICORP) in Saudi Arabia as a member of the Project Finance team. Previously, he was a Management Consultant with KPMG in the UK and Bahrain.
Ravi Krishnan is a Fellow of the Institute of Chartered Accountants of India. He is also a Member of the Institute of Cost & Works Accountants of India, and the Institute of Company Secretaries of India.
Steven J. Moulder Acting Chief investment & treasury Officer
Member of Management Committee, Assets and Liabilities Committee, Operational Risk Committee, Human Resources Committee, and Information Security Committee
Steven Moulder has 35 years’ international experience in banking and treasury. He started his career with GIB in 1987 as a Senior Dealer Foreign Exchange at the London Branch. In 1997, he was appointed Head of Treasury and then in 2000, Head of Treasury & Banking Services at the newly established GIB (UK) Limited. Steven Moulder moved to GIB Bahrain in 2009 as Head of Treasury Capital
Markets, and assumed his current position in May 2015. Prior to joining GIB, he was a Foreign Exchange Dealer with the London branches of Crocker National Bank, ABN Bank and Bank of New Zealand.
Steven Moulder attended the Advanced Development Programme at Cranfield University School of Management, UK.
Sakhr Bin Abdulrahman Almulhem Head of Retail Banking (from June 2011 to January 2016)
Sakhr Almulhem has over 20 years’ experience in the banking industry covering North and Central America, the UK and the Middle East. He joined GIB in 2011 as Senior Vice President – Head of Proposition in Retail Banking, and was appointed to the position of Head of Retail Banking in 2013. Prior to joining GIB, he was Senior Vice President – Divisional Head of Retail Customer Management at National Commercial Bank (NCB), Saudi Arabia. His previous positions with NCB included Vice President – Regional Manager, and Vice President – Head of Sales Development. He started his career with SABB where he held various positions in the areas of Relationship Management, Branch Management, Quality Management and Consumer Finance.
Sakhr Almulhem holds an MBA and a BBA in Marketing from Washington University, USA.

GIB | Celebrating 40 years
52 Annual Report 2015
Executive Committee
Audit Committee
Risk Policy Committee
Corporate Governance Committee
Nomination & Remuneration
Committee
Board of Directors
Chief Executive Officer
Retail Banking
Operations
Administration
Information Technology
Corporate Communications
Chief Financial Officer
Chief Risk Officer
Chief Human Resources Officer
Corporate Secretary
Management Committee
Group Risk Committee
Human Resources Committee
Assets and Liabilities Committee (ALCO)
Operational Risk Committee
Information Security Committee
Chief Operating Officer
Group Chief Auditor
Chief Executive Officer
GIB Capital LLC
Board of Directors GIB Capital LLC
Managing Director & Chief Executive OfficerGulf International Bank
(UK) Ltd
Board of Directors Gulf International Bank
(UK) Ltd
Strategy & Enterprise Programme Management
Office Head
Group Money Laundering Reporting Officer & Group
Compliance Head
Chief Investment & Treasury Officer
Wholesale Banking Head
Financial Controls
Balance Sheet Management
Investment
Corporate Banking
Financial Institutions
Institutional Banking
Treasury Capital Markets
Information Security
Economics
Legal
Investment Banking
Credit Administration & Risk Control
Risk Management
Procurement
Internal Controls
GIB Shareholders: Public Investment Fund (KSA), Kuwait Investment Authority, Qatar Holding Company, Bahrain Mumtalakat Holding Company, Emirates
Investment Authority (UAE) and State General Reserve Fund (Sultanate of Oman)
Organisation and corporate governance chart

Annual Report 2015 53
Table of contents Independent auditors’ report to the shareholders ..........................................................................................54
Consolidated statement of financial position ..................................................................................................55Consolidated statement of income ..................................................................................................................56Consolidated statement of comprehensive income .......................................................................................57Consolidated statement of changes in equity .................................................................................................58Consolidated statement of cash flows .............................................................................................................59
Notes to the consolidated financial statements
1. Incorporation and registration .....................................................................................................................602. Accounting policies ....................................................................................................................................603. Accounting estimates and assumptions .....................................................................................................674. Classification of assets and liabilities...........................................................................................................685. Cash and other liquid assets ......................................................................................................................696. Securities purchased under agreements to resell........................................................................................697. Placements ................................................................................................................................................698. Trading securities .......................................................................................................................................699. Investment securities ..................................................................................................................................7010. Loans and advances ..................................................................................................................................7011. Other assets ..............................................................................................................................................7312. Post retirement benefits .............................................................................................................................7313. Deposits ....................................................................................................................................................7614. Securities sold under agreements to repurchase ........................................................................................7615. Other liabilities ............................................................................................................................................7616. Senior term financing .................................................................................................................................7717. Subordinated term financing ......................................................................................................................7718. Share capital ..............................................................................................................................................7719. Reserves ....................................................................................................................................................7820. Dividends ...................................................................................................................................................7821. Net interest income ....................................................................................................................................7922. Fee and commission income ......................................................................................................................7923. Foreign exchange income ..........................................................................................................................8024. Trading income ..........................................................................................................................................8025. Other income .............................................................................................................................................8026. Segmental information ...............................................................................................................................8027. Risk management ......................................................................................................................................8228. Geographical distribution of risk assets ......................................................................................................8929. Maturities of assets and liabilities ................................................................................................................9030. Interest rate risk .........................................................................................................................................9231. Derivatives and foreign exchange instruments ............................................................................................9332. Credit-related financial instruments .............................................................................................................9733. Contingent liabilities ...................................................................................................................................9734. Capital adequacy .......................................................................................................................................9735. Fiduciary activities ......................................................................................................................................9936. Related party transactions ..........................................................................................................................9937. Fair value of financial instruments .............................................................................................................10038. Earnings per share ...................................................................................................................................10239. Principal subsidiaries ................................................................................................................................10240. Average consolidated statement of financial position ................................................................................102
Consolidated Financial StatementsFor the year ended 31st December 2015

GIB | Celebrating 40 years
54 Annual Report 2015
Independent auditors’ report to the shareholders
Report on the consolidated financial statementsWe have audited the accompanying consolidated financial statements of Gulf International Bank B.S.C. (the “Bank”) and its subsidiaries (together the “Group”), which comprise the consolidated statement of financial position as at 31st December 2015, the consolidated statements of income, comprehensive income, changes in equity and cash flows for the year then ended, and notes, comprising a summary of significant accounting policies and other explanatory information.
Responsibility of the board of directors for the consolidated financial statementsThe board of directors is responsible for the preparation and fair presentation of these consolidated financial statements in accordance with International Financial Reporting Standards, and for such internal control as the board of directors determines is necessary to enable the preparation of consolidated financial statements that are free from material misstatement, whether due to fraud or error.
Auditors’ responsibilityOur responsibility is to express an opinion on these consolidated financial statements based on our audit. We conducted our audit in accordance with International Standards on Auditing. Those standards require that we comply with ethical requirements and plan and perform the audit to obtain reasonable assurance about whether the consolidated financial statements are free from material misstatement.
An audit involves performing procedures to obtain audit evidence about the amounts and disclosures in the consolidated financial statements. The procedures selected depend on our judgment, including the assessment of the risks of material misstatement of the consolidated financial statements, whether due to fraud or error. In making those risk assessments, we consider internal control relevant to the entity’s preparation and fair presentation of the consolidated financial statements in order to design audit procedures that are appropriate in the circumstances, but not for the purpose of expressing an opinion on the effectiveness of the entity’s internal control. An audit also includes evaluating the appropriateness of accounting policies used and the reasonableness of accounting estimates made by management, as well as evaluating the overall presentation of the consolidated financial statements.
We believe that the audit evidence we have obtained is sufficient and appropriate to provide a basis for our audit opinion.
Opinion In our opinion, the consolidated financial statements present fairly, in all material respects, the consolidated financial position of the Group as at 31st December 2015, and its consolidated financial performance and its consolidated cash flows for the year then ended in accordance with International Financial Reporting Standards.
Report on other regulatory requirementsAs required by the Bahrain Commercial Companies Law and Volume 1 of the Central Bank of Bahrain (CBB) Rule Book, we report that:
a) the Bank has maintained proper accounting records and the consolidated financial statements are in agreement therewith;b) the financial information contained in the chairman’s statement is consistent with the consolidated financial statements;c) we are not aware of any violations during the year of the Bahrain Commercial Companies Law, the Central Bank of Bahrain and
Financial Institutions Law, the CBB Rule Book (Volume 1, applicable provisions of Volume 6 and CBB directives) or the terms of the Bank’s memorandum and articles of association that would have had a material adverse effect on the business of the Bank or on its financial position; and
d) satisfactory explanations and information have been provided to us by management in response to all our requests.
KPMG FakhroPartner Registration No. 8312th February 2016

Annual Report 2015 55
Consolidated statement of financial position
Note31.12.15
US$ millions31.12.14
US$ millions
ASSETS
Cash and other liquid assets 5 4,309.7 2,472.6
Securities purchased under agreements to resell 6 1,835.0 1,305.2
Placements 7 4,402.9 5,180.5
Trading securities 8 72.2 72.7
Investment securities 9 3,884.5 3,944.5
Loans and advances 10 9,161.4 7,931.5
Other assets 11 526.7 393.2
Total assets 24,192.4 21,300.2
LIABILITIES
Deposits from banks 13 1,985.9 1,240.1
Deposits from customers 13 14,683.4 12,897.8
Securities sold under agreements to repurchase 14 2,093.4 618.0
Other liabilities 15 428.7 342.9
Senior term financing 16 2,420.0 3,372.9
Subordinated term financing 17 150.0 477.8
Total liabilities 21,761.4 18,949.5
EQUITY
Share capital 18 2,500.0 2,500.0
Reserves 19 379.8 392.0
Retained earnings (448.8) (541.3)
Total equity 2,431.0 2,350.7
Total liabilities & equity 24,192.4 21,300.2
The consolidated financial statements were approved by the Board of Directors on 12th February 2016 and signed on its behalf by:-
Jammaz bin Abdullah Al-SuhaimiChairman
Abdullah bin Hassan AlabdulgaderChairman of Board Audit Committee
Abdulaziz A. Al-HelaissiChief Executive Officer
The notes on pages 60 to 102 form part of these consolidated financial statements.

GIB | Celebrating 40 years
56 Annual Report 2015
Consolidated statement of income
Note
Year ended31.12.15
US$ millions
Year ended31.12.14
US$ millions
Interest income 21 344.0 308.9
Interest expense 21 155.8 150.9
Net interest income 188.2 158.0
Fee and commission income 22 70.2 62.9
Foreign exchange income 23 19.8 19.4
Trading income 24 6.2 2.4
Other income 25 23.6 14.9
Total income 308.0 257.6
Staff expenses 128.4 115.4
Premises expenses 17.5 15.7
Other operating expenses 46.2 33.8
Total operating expenses 192.1 164.9
Net income before provisions and tax 115.9 92.7
Provision release for investment securities 9 - 4.5
Provision charge for loans and advances 10 (21.3) (10.3)
Net income before tax 94.6 86.9
Taxation charge on overseas activities (4.2) (1.3)
Net income 90.4 85.6
Earnings per share 38 US$0.04 US$0.03
Jammaz bin Abdullah Al-SuhaimiChairman
Abdullah bin Hassan AlabdulgaderChairman of Board Audit Committee
Abdulaziz A. Al-HelaissiChief Executive Officer
The notes on pages 60 to 102 form part of these consolidated financial statements.

Annual Report 2015 57
Consolidated statement of comprehensive income
Year ended31.12.15
US$ millions
Year ended31.12.14
US$ millions
Net income 90.4 85.6
Other comprehensive income:-
Items that may subsequently be reclassified to consolidated statement of income:-
Cash flow hedges:-
- net changes in fair value 0.3 (0.2)
- net amount transferred to consolidated statement of income - (0.1)
0.3 (0.3)
Items that will not be reclassified to consolidated statement of income:-
Net changes in fair value of equity investments classified as fair value through other comprehensive income (FVTOCI)
(26.0) 7.0
Remeasurement of defined benefit pension fund 15.6 (5.6)
(10.4) 1.4
Total other comprehensive income (10.1) 1.1
Total comprehensive income 80.3 86.7
The notes on pages 60 to 102 form part of these consolidated financial statements.

GIB | Celebrating 40 years
58 Annual Report 2015
Consolidated statement of changes in equity
Share capitalUS$ millions
Reserves US$ millions
Retained earnings
US$ millionsTotal
US$ millions
At 1st January 2015 2,500.0 392.0 (541.3) 2,350.7
Net income for the year - - 90.4 90.4
Other comprehensive income for the year - (25.4) 15.3 (10.1)
Total comprehensive income for the year - (25.4) 105.7 80.3
Transfer from retained earnings - 13.2 (13.2) -
At 31st December 2015 2,500.0 379.8 (448.8) 2,431.0
At 1st January 2014 2,500.0 374.3 (610.3) 2,264.0
Net income for the year - - 85.6 85.6
Other comprehensive income for the year - 2.9 (1.8) 1.1
Total comprehensive income for the year - 2.9 83.8 86.7
Transfer from retained earnings - 14.8 (14.8) -
At 31st December 2014 2,500.0 392.0 (541.3) 2,350.7
The notes on pages 60 to 102 form part of these consolidated financial statements.

Annual Report 2015 59
Consolidated statement of cash flows
Note
Year ended31.12.15
US$ millions
Year ended31.12.14
US$ millions
OPERATING ACTIVITIES
Net income 90.4 85.6
Adjustments to reconcile net income to net cash inflow from operating activities:-
Provisions for investment securities - (4.5)
Provisions for loans and advances 21.3 10.3
Realised profits on debt investment securities (2.7) (1.4)
Amortisation of investment securities 8.4 13.8
Amortisation of senior term financing 0.3 0.2
Net (increase) / decrease in statutory deposits with central banks (59.2) 10.6
Net (increase) / decrease in securities purchased under agreements to resell (529.8) 437.5
Net decrease in placements 777.6 84.1
Net decrease / (increase) in trading securities 0.5 (21.8)
Net (increase) / decrease in loans and advances (1,251.2) 375.4
Increase in accrued interest receivable (28.0) (3.6)
Increase in accrued interest payable 27.0 8.3
Net increase in other net assets (30.8) (54.7)
Net increase / (decrease) in deposits from banks 745.8 (206.2)
Net increase / (decrease) in deposits from customers 1,785.6 (553.5)
Net increase / (decrease) in securities sold under agreements to repurchase 1,475.4 (167.2)
Net cash inflow from operating activities 3,030.6 12.9
INVESTING ACTIVITIES
Purchase of investment securities (1,192.5) (855.9)
Sale and maturity of investment securities 1,220.8 627.0
Net cash inflow / (outflow) from investing activities 28.3 (228.9)
FINANCING ACTIVITIES
Net (decrease) / increase in senior term financing (953.2) 1,039.8
Net decrease in subordinated term financing (327.8) -
Net cash (outflow) / inflow from financing activities (1,281.0) 1,039.8
Increase in cash and cash equivalents 1,777.9 823.8
Cash and cash equivalents at 1st January 2,339.6 1,515.8
Cash and cash equivalents at 31st December 5 4,117.5 2,339.6
The notes on pages 60 to 102 form part of these consolidated financial statements.

GIB | Celebrating 40 years
60 Annual Report 2015
Notes to the consolidated financial statementsFor the year ended 31st December 2015
1. Incorporation and registration The parent company of the Group, Gulf International Bank B.S.C. (the Bank), is a Bahraini Shareholding Company incorporated
in the Kingdom of Bahrain by Amiri Decree Law No. 30 dated 24th November 1975 and is registered as a conventional wholesale bank with the Central Bank of Bahrain. The registered office of the Bank is located at Al-Dowali Building, 3 Palace Avenue, Manama, Kingdom of Bahrain.
The Bank and its subsidiaries (the Group), is principally engaged in the provision of wholesale commercial, asset management and investment banking services. The Group operates through subsidiaries, branch offices and representative offices located in six countries worldwide. The total number of staff at the end of the financial year was 1,106.
2. Accounting policies The principal accounting policies adopted in the preparation of the consolidated financial statements are set out below:-
2.1 Basis of preparation The consolidated financial statements have been prepared in accordance with International Financial Reporting Standards (IFRS)
and in conformity with the Bahrain Commercial Companies Law and the Central Bank of Bahrain and Financial Institutions Law. The consolidated financial statements have been prepared under the historical cost convention as modified by the revaluation of trading securities, equity investment securities, and derivative financial instruments as explained in more detail in the following accounting policies. Recognised assets and liabilities that are hedged by derivative financial instruments are also stated at fair value in respect of the risk that is being hedged. The accounting policies have been consistently applied by the Bank and its subsidiaries and are consistent with those of the previous year, except for the adoption of applicable new accounting standards with effect from 1st January 2015 as referred to below.
IAS 19 – Employee Benefits The amendments to IAS 19 clarify the requirements relating to contributions made by employees or third parties. The amendments
have been applied retrospectively and have not had a significant impact on the Group’s consolidated financial statements.
2.2 Consolidation principles The consolidated financial statements include the accounts of Gulf International Bank B.S.C. and its subsidiaries. Subsidiary
undertakings are companies and other entities, including special purpose entities, which the Bank controls. The Bank controls an entity when it is exposed to, or has rights to, variable returns from its involvement with the entity and has the ability to affect those returns through its power over the entity. The subsidiary’s accounts are derecognised from the consolidated financial statements from the point when the control ceases. All intercompany balances and transactions, including unrealised gains and losses on transactions between Group companies, have been eliminated.
2.3 Foreign currencies Items included in the consolidated financial statements of the Bank and its subsidiaries are measured based on the currency
of the primary environment in which the entity operates (the functional currency). The consolidated financial statements are presented in US Dollars, representing the Group’s functional and presentation currency. Transactions in foreign currencies are converted to US Dollars at the rate of exchange prevailing at the date of the transaction. Monetary assets and liabilities denominated in foreign currencies are translated into US Dollars at market rates of exchange prevailing at the balance sheet date.
2.4 Financial assets and liabilities Financial assets and liabilities comprise all assets and liabilities reflected in the statement of financial position, although excluding
investments in subsidiaries, associated companies and joint ventures, employee benefit plans, property and equipment, deferred taxation and taxation payable.
a) Initial recognition and measurement The Group recognises financial assets and liabilities in the consolidated statement of financial position when, and only when, the
Group becomes party to the contractual provisions of the instrument.
Financial instruments are classified at inception into one of the following categories, which then determine the subsequent measurement methodology:-
Financial assets are classified into one of the following three categories:-
- financial assets at amortised cost - financial assets at fair value through other comprehensive income (FVTOCI) - financial assets at fair value through the profit or loss (FVTPL)

Annual Report 2015 61
2. Accounting policies (continued)
2.4 Financial assets and liabilities (continued)
a) Initial recognition and measurement (continued) Financial liabilities are classified into one of the following two categories:-
- financial liabilities at amortised cost - financial liabilities at fair value through the profit or loss (FVTPL)
Financial assets are initially recognised at fair value, including transaction costs that are directly attributable to the acquisition of the financial asset.
Financial liabilities are initially recognised at fair value, representing the proceeds received net of premiums, discounts and transaction costs that are directly attributable to the financial liability.
All regular way purchases and sales of financial assets and liabilities classified as FVTPL are recognised on the trade date, i.e. the date on which the Group commits to purchase or sell the financial asset or liability. All regular way purchases and sales of other financial assets and liabilities are recognised on the settlement date, i.e. the date on which the asset or liability is received from or delivered to the counterparty. Regular way purchases or sales are purchases or sales of financial assets that require delivery within the time frame generally established by regulation or convention in the market place.
b) Subsequent measurement Subsequent to initial measurement, financial assets and liabilities are measured at either amortised cost or fair value. The
classification and the basis for measurement are subject to the Group’s business model for managing the financial assets and the contractual cash flow characteristics of the financial assets, as detailed below:-
Financial assets at amortised cost Financial assets are measured at amortised cost using the effective interest rate method if:-
- the assets are held within a business model whose objective is to hold assets in order to collect contractual cash flows; and - the contractual terms of the financial assets give rise on specified dates to cash flows that are solely payments of principal and
interest on the principal amount outstanding.
If either of these two criteria is not met, the financial assets are classified and measured at fair value, either through the profit or loss (FVTPL) or through other comprehensive income (FVTOCI).
Additionally, even if a financial asset meets the amortised cost criteria, the entity may choose to designate the financial asset at FVTPL. Such an election is irrevocable and applicable only if the FVTPL classification significantly reduces a measurement or recognition inconsistency.
Financial assets at fair value through other comprehensive income (FVTOCI) At initial recognition, the Group can make an irrevocable election to classify an equity investment that is not held for trading as
FVTOCI.
For this purpose, a financial asset is deemed to be held for trading if the equity investment meets any of the following conditions:-
- it has been acquired principally for the purpose of selling in the near term; - on initial recognition, it is part of a portfolio of identified financial instruments that are managed together and for which there is
evidence of a recent actual pattern of short-term profitability; or - it is a derivative and not designated and effective as a hedging instrument or a financial guarantee.
The irrevocable election is on an instrument-by-instrument basis. If an equity investment is designated as FVTOCI, all gains and losses, except for dividend income, are recognised in other comprehensive income and are not subsequently included in the consolidated statement of income.
Financial assets at fair value through the profit or loss (FVTPL) Financial assets not otherwise classified above are classified and measured as FVTPL.
Notes to the consolidated financial statements (continued)For the year ended 31st December 2015

GIB | Celebrating 40 years
62 Annual Report 2015
2. Accounting policies (continued)
2.4 Financial assets and liabilities (continued)
b) Subsequent measurement (continued) Financial liabilities at amortised cost All financial liabilities, other than those classified as financial liabilities at FVTPL, are classified as financial liabilities at amortised
cost and are measured at amortised cost using the effective interest rate method as described in note 2.7(a).
Financial liabilities at fair value through the profit or loss Financial liabilities not otherwise classified above are classified as financial liabilities at FVTPL. This classification includes
derivatives that are liabilities measured at fair value.
c) Derecognition of financial assets and liabilities Financial assets are derecognised and removed from the consolidated statement of financial position when the right to receive
cash flows from the assets has expired; the Group has transferred its contractual right to receive the cash flows from the assets, and substantially all the risks and rewards of ownership; or where control is not retained. Financial liabilities are derecognised and removed from the consolidated statement of financial position when the obligation is discharged, cancelled, or expires.
2.5 Impairment of financial assets Only financial assets that are measured at amortised cost are tested for impairment. A provision for impairment is established
where there is objective evidence that the Group will not collect all amounts due, including both principal and interest, in accordance with the contractual terms of the credit facility. Objective evidence that a financial asset is impaired may include a breach of contract, such as default or delinquency in interest or principal payments, the granting of a concession that, for economic or legal reasons relating to the borrower’s financial difficulties, would not otherwise be considered, indications that it is probable that the borrower will enter bankruptcy or other financial reorganisation, the disappearance of an active market, or other observable data relating to a group of assets such as adverse changes in the payment status of borrowers or issuers in the group, or economic conditions that correlate with defaults in the group.
Provisions for impairment are determined based on the difference between the net carrying amount and the recoverable amount of the financial asset. The recoverable amount is measured as the present value of expected future cash flows, including amounts recoverable from guarantees and collateral, discounted based on the interest rate at the inception of the credit facility or, for debt instruments, at the current market rate of interest for a similar financial asset.
Provisions for impairment are also measured and recognised on a collective basis in respect of impairments that exist at the balance sheet date but which will only be individually identified in the future. Future cash flows for financial assets that are collectively assessed for impairment are estimated based on contractual cash flows and historical loss experiences for assets with similar credit risk characteristics. Historical loss experience is adjusted, based on current observable data, to reflect the effects of current conditions that did not affect the period on which the historical loss experience is based.
Provisions for impairment are recognised in the consolidated statement of income and are reflected in an allowance account against loans and advances and investment securities.
Financial assets are written off after all restructuring and collection activities have taken place and the possibility of further recovery is considered to be remote. Subsequent recoveries are included in other income.
Provisions for impairment are released and transferred to the consolidated statement of income where a subsequent increase in the recoverable amount is related objectively to an event occurring after the provision for impairment was established.
Financial assets which have been renegotiated are no longer considered to be past due and are replaced on performing status when all principal and interest payments are up to date and future payments are reasonably assured. Financial assets subject to individual impairment assessment and whose terms have been renegotiated, are subject to on-going review to determine whether they remain impaired or should be considered past due.
2.6 Offsetting financial assets and liabilities Financial assets and financial liabilities are only offset and the net amount reported in the consolidated statement of financial
position when there is a legally enforceable right to set off the recognised amounts and there is an intention to settle on a net basis, or to realise the asset and settle the liability simultaneously.
Notes to the consolidated financial statements (continued)For the year ended 31st December 2015

Annual Report 2015 63
2. Accounting policies (continued)
2.7 Revenue recognition
a) Interest income and interest expense Interest income and interest expense for all interest-bearing financial assets and liabilities except those classified as FVTPL are
recognised using the effective interest rate method. The effective interest rate method is a method of calculating the amortised cost of a financial asset or liability and of allocating the interest income or interest expense over the expected life of the asset or liability. The effective interest rate is the rate that exactly discounts estimated future cash flows through the expected life of the financial asset or liability or, where appropriate, a shorter period, to the net carrying amount of the financial asset or liability. The application of the effective interest rate method has the effect of recognising interest income and interest expense evenly in proportion to the amount outstanding over the period to maturity or repayment.
In calculating the effective interest rate, cash flows are estimated taking into consideration all contractual terms of the financial asset or liability but excluding future credit losses. Fees, including loan origination fees and early redemption fees, are included in the calculation of the effective interest rate to the extent that they are considered to be an integral part of the effective interest rate.
Interest income is suspended when either interest or principal on a credit facility is overdue by more than 90 days whereupon all unpaid and accrued interest is reversed from income. Interest on non-accrual facilities is included in income only when received. Credit facilities are restored to accrual status only after all delinquent interest and principal payments have been brought current and future payments are reasonably assured.
b) Fees and commissions Fees and commissions that are integral to the effective interest rate of a financial asset or liability are included in the calculation
of the effective interest rate.
Other fees and commissions are recognised as the related services are performed or received, and are included in fee and commission income.
c) Trading and foreign exchange income Trading and foreign exchange income arise from earnings generated from customer business and market making, and from
changes in fair value resulting from movements in interest and exchange rates, equity prices and other market variables. Changes in fair value and gains and losses arising on the purchase and sale of trading instruments are included in trading income, together with the related interest income, interest expense and dividend income.
d) Dividend income Dividend income is recognised as follows:-
- dividends from equity instruments classified as FVTPL are recognised when the right to receive the dividend is established and are included in trading income.
- dividends from equity instruments classified as FVTOCI are recognised when the right to receive the dividend is established and are included in other income.
2.8 Securities financing arrangements Securities purchased under agreements to resell (reverse repurchase agreements) and securities sold under agreements to
repurchase (repurchase agreements) are treated as collateralised lending and borrowing transactions and are recorded in the consolidated statement of financial position at the amounts the securities were initially acquired or sold. Interest earned on reverse repurchase agreements and interest incurred on repurchase agreements are included in interest income and interest expense respectively.
Notes to the consolidated financial statements (continued)For the year ended 31st December 2015

GIB | Celebrating 40 years
64 Annual Report 2015
GIB | Celebrating 40 years
2. Accounting policies (continued)
2.9 Premises and equipment Land is stated at cost. Other premises and equipment are stated at cost less accumulated depreciation. The residual values and
useful lives of premises and equipment are reviewed at each balance sheet date, and adjusted where appropriate. Depreciation is calculated using the straight-line method over various periods. Where the carrying amount of premises or equipment is greater than the estimated recoverable amount, the carrying amount is reduced to the recoverable amount.
Generally, costs associated with the maintenance of existing computer software are recognised as an expense when incurred. However, expenditure that enhances and extends the benefits of computer software programs beyond their original specifications and lives is recognised as a capital improvement and capitalised as part of the original cost of the software.
2.10 Other provisions Other provisions are recognised when the Group has a present legal or constructive obligation as a result of a past event, it
is probable that an outflow of resources embodying economic benefits will be required to settle the obligation, and a reliable estimate can be made of the amount of the obligation.
2.11 Derivative financial instruments and hedge accounting Derivative financial instruments are contracts, the value of which is derived from one or more underlying financial instruments or
indices, and include futures, forwards, swaps and options in the interest rate, foreign exchange, equity and credit markets.
Derivative financial instruments are recognised in the consolidated statement of financial position at fair value. Fair values are derived from prevailing market prices, discounted cash flow models or option pricing models as appropriate.
In the consolidated statement of financial position, derivative financial instruments with positive fair values (unrealised gains) are included in other assets and derivative financial instruments with negative fair values (unrealised losses) are included in other liabilities.
The changes in the fair values of derivative financial instruments entered into for trading purposes or to hedge other trading positions are included in trading income.
The recognition of changes in the fair values of derivative financial instruments entered into for hedging purposes is determined by the nature of the hedging relationship. For the purposes of hedge accounting, derivative financial instruments are designated as a hedge of either: (i) the fair value of a recognised asset or liability (fair value hedge), or (ii) the future cash flows attributable to a recognised asset or liability or a firm commitment (cash flow hedge).
The Group’s criteria for a derivative financial instrument to be accounted for as a hedge include:-
- the hedging instrument, the related hedged item, the nature of the risk being hedged, and the risk management objective and strategy must be formally documented at the inception of the hedge,
- it must be clearly demonstrated that the hedge is expected to be highly effective in offsetting the changes in fair values or cash flows attributable to the hedged risk in the hedged item,
- the effectiveness of the hedge must be capable of being reliably measured, and - the hedge must be assessed on an on-going basis and determined to have actually been highly effective throughout the
financial reporting period.
Changes in the fair values of derivative financial instruments that are designated, and qualify, as fair value hedges and that prove to be highly effective in relation to the hedged risk, are included in trading income together with the corresponding change in the fair value of the hedged asset or liability that is attributable to the risk that is being hedged. Unrealised gains and losses arising on hedged assets or liabilities which are attributable to the hedged risk are adjusted against the carrying amounts of the hedged assets or liabilities in the consolidated statement of financial position. If the hedge no longer meets the criteria for hedge accounting, any adjustment to the carrying amount of a hedged interest-bearing financial instrument is amortised to income over the remaining period to maturity.
Notes to the consolidated financial statements (continued)For the year ended 31st December 2015

Annual Report 2015 65
2. Accounting policies (continued)
2.11 Derivative financial instruments and hedge accounting (continued) Changes in the fair values of derivative financial instruments that are designated, and qualify, as cash flow hedges and that prove
to be highly effective in relation to the hedged risk, are recognised in other comprehensive income. Unrealised gains or losses recognised in other comprehensive income are transferred to the consolidated statement of income at the same time that the income or expense of the corresponding hedged item is recognised in the consolidated statement of income and are included in the same income or expense category as the hedged item. Unrealised gains or losses on any ineffective portion of cash flow hedging transactions are included in trading income.
The interest component of derivatives that are designated, and qualify, as fair value or cash flow hedges is included in interest income or interest expense relating to the hedged item over the life of the derivative instrument.
Hedge accounting is discontinued when the derivative hedging instrument either expires or is sold, terminated or exercised, or no longer qualifies for hedge accounting. Gains and losses arising on the termination of derivatives designated as cash flow hedges are recognised in interest income or interest expense over the original tenor of the terminated hedge transaction.
Some hybrid instruments contain both a derivative and non-derivative component. In such cases, the derivative is categorised as an embedded derivative. Embedded derivatives are separated from the host contract and accounted for separately if certain criteria are met. Where it is not practically possible to separate the embedded derivative, the entire hybrid instrument is categorised as a financial asset at FVTPL and measured at fair value. Changes in fair value are included in trading income.
2.12 Financial guarantees Financial guarantees are contracts that require the Group to make specified payments to reimburse the holder for a loss it
incurs because a specific debtor fails to make payment when due in accordance with the terms of a debt instrument. Financial guarantees are issued to financial institutions and other counterparties on behalf of customers to secure loans, overdrafts and other banking facilities, and to other parties in relation to the performance of customers under obligations related to contracts, advance payments made by other parties, tenders and retentions.
Financial guarantees are initially recognised at fair value on the date the guarantee is issued. The guarantee liability is subsequently measured at the higher of the initial measurement, less amortisation to recognise the fee income earned over the period, or the present value of any expected financial obligation arising as a result of an anticipated non-recoverable payment under a guarantee. Any increase in a liability relating to guarantees is recognised in the consolidated statement of income. In the consolidated statement of financial position, financial guarantees are included in other liabilities.
2.13 Post retirement benefits The majority of the Group’s employees are eligible for post retirement benefits under either defined benefit or defined contribution
pension plans which are provided through separate trustee-administered funds or insurance plans. The Group also pays contributions to Government defined contribution pension plans in accordance with the legal requirements in each location.
The Group’s contributions to defined contribution pension plans are expensed in the year to which they relate.
The calculation of obligations in respect of the defined benefit pension plan is performed by a qualified actuary using the projected unit credit method. The Group’s net obligation is calculated by estimating the amount of future benefit that employees have earned in the current and prior periods, discounting that amount and deducting the fair value of the plan assets. When the calculation results in a potential asset for the Group, the recognised asset is limited to a ceiling so that it does not exceed the economic benefits available in the form of refunds from the plan or reductions in future contributions.
Remeasurements of the net defined benefit liability or asset, which comprises actuarial gains and losses, the return of plan assets (excluding interest) and the effect of the asset ceiling, are recognised immediately in the consolidated statement of other comprehensive income. The Group determines the net interest expense or income on the net defined benefit liability or asset for the year by applying the discount rate used to measure the defined benefit obligation at the beginning of the year to the opening net defined benefit liability or asset. Net interest expense and other expenses related to the defined benefit plan are recognised in the consolidated statement of income.
When the benefits of a plan are changed or when a plan is curtailed, the resulting change in benefit that relates to past service or the gain or loss on curtailment is recognised immediately in the consolidated statement of income. The Group recognises gains and losses on the settlement of a defined benefit plan when the settlement occurs.
Notes to the consolidated financial statements (continued)For the year ended 31st December 2015

GIB | Celebrating 40 years
66 Annual Report 2015
2. Accounting policies (continued)
2.14 Taxation
a) Current tax Current taxation is the expected tax payable on the taxable income for the year, using tax rates enacted at the balance sheet
date, and includes any adjustments to tax payable in respect of previous years.
b) Deferred tax Deferred tax is provided, using the liability method, for temporary differences arising between the tax bases of assets and
liabilities and their carrying amounts for financial reporting purposes. A deferred tax asset is recognised only to the extent that it is probable that future taxable income will be available against which the unutilised tax losses and credits can be utilised. Currently enacted tax rates are used to determine deferred taxes.
2.15 Cash and cash equivalents In the consolidated statement of cash flows, cash and cash equivalents comprise cash and other liquid assets, excluding
statutory deposits with central banks.
2.16 Segment reporting An operating segment is a distinguishable component of the Group that is engaged in business activities from which revenues
are earned and expenses are incurred, including revenues and expenses that relate to transactions with any of the Group’s other operating segments. All segments have discrete financial information which is regularly reviewed by the Group’s Management Committee, being the Group’s chief operating decision maker, to make decisions about resources allocated to the segment and to assess its performance. The Group’s Management Committee assesses the segments based on net interest income which accounts for the majority of the Group’s revenues.
2.17 Fiduciary activities The Group administers and manages assets owned by clients which are not reflected in the consolidated financial statements.
Asset management fees are earned for providing investment management services and for managing mutual fund products. Asset administration fees are earned for providing custodial services. Fees are recognised as the services are provided and are included in fee and commission income.
2.18 Dividends Dividends on issued shares are recognised as a liability and deducted from equity when they are approved by the Bank’s
shareholders.
2.19 Shariah-compliant banking The Group offers various Shariah-compliant products to its customers. The Shariah compliant activities are conducted in
accordance with Shariah principles and are subject to the supervision and approval of the Group’s Shariah Supervisory Board. The disclosures set out in the consolidated financial statements in relation to these activities are prepared in accordance with Financial Accounting Standard 18 issued by the Accounting and Auditing Organisation for Islamic Financial Institutions (AAOIFI).
2.20 Comparatives Where necessary, comparative figures have been adjusted to conform with changes in presentation in the current year.
2.21 Future accounting developments The International Accounting Standards Board (IASB) have issued a number of new standards, amendments to standards, and
interpretations that are not yet effective and have not been applied in the preparation of the consolidated financial statements for the year ended 31st December 2015. The relevant new standards, amendments to standards, and interpretations, are as follows:-
- IFRS 15 – Revenue from contracts with customers: IFRS 15 introduces a new five-step model framework for determining whether, how much and when revenue is recognised.
The Group is assessing the potential impact on its consolidated financial statements resulting from the application of this standard.
Notes to the consolidated financial statements (continued)For the year ended 31st December 2015

Annual Report 2015 67
2. Accounting policies (continued)
2.21 Future accounting developments (continued) - IFRS 9 (2014) – Financial Instruments: IFRS 9 (2014) was issued as a complete standard including the requirements previously issued and adopted, and additional
amendments to introduce a new expected loss impairment model, hedge accounting and revised guidance on the classification and measurement requirements of financial instruments. The Group had earlier adopted IFRS 9 (2010) and is currently assessing the potential impact on its consolidated financial statements resulting from the application of this standard.
3. Accounting estimates and assumptions The preparation of the consolidated financial statements requires management to make estimates and assumptions that affect
the reported amounts of certain financial assets, liabilities, income and expenses.
The use of estimates and assumptions is principally limited to the determination of provisions for impairment, the valuation of financial instruments, the valuation of the Group’s defined benefit pension plan, and in determining control relationships over investees, as explained in more detail below:-
3.1 Provisions for impairment Financial assets are evaluated for impairment on the basis set out in note 2.5.
In determining provisions for impairment, judgement is required in the estimation of the amount and timing of future cash flows.
In addition to provisions for impairment against specific assets, the Group also maintains provisions that are measured and recognised on a collective basis. Key assumptions included in the measurement of the portfolio provisions include data on the probability of default and the eventual recovery amount in the event of a forced sale or write off. These assumptions are based on observed historical data and updated as considered appropriate to reflect current conditions. The accuracy of the portfolio provisions would therefore be affected by unexpected changes in these assumptions.
3.2 Fair value of financial assets and liabilities Where the fair value of financial assets and liabilities cannot be derived from active markets, they are determined using a variety
of valuation techniques that include the use of mathematical models. The input to these models is derived from observable markets where available, but where this is not feasible, a degree of judgement is required in determining assumptions used in the models. Changes in assumptions used in the models could affect the reported fair value of financial assets and liabilities.
3.3 Retirement benefit obligations Management, in coordination with an independent qualified actuary, are required to make assumptions regarding the defined
benefit pension plan. The principal actuarial assumptions for the defined benefit pension plan are set out in note 12 and include assumptions on the discount rate, return on pension plan assets, mortality, future salary increases, and inflation. Changes in the assumptions could affect the reported asset, service cost and return on pension plan assets.
3.4 Determination of control over investees The Group acts as fund manager to a number of investment funds. The determination of whether the Group controls an
investment fund is based on an assessment of the aggregate economic interests of the Group in the fund and includes an assessment of any carried interests, expected management fees, and the investors’ rights to remove the Group as fund manager.
Management are required to conclude whether the Group acts as an agent for the investors in the fund, or if the underlying fund is controlled by the Group.
The principal investment funds are set out in note 35.
Notes to the consolidated financial statements (continued)For the year ended 31st December 2015

GIB | Celebrating 40 years
68 Annual Report 2015
4. Classification of assets and liabilities The classification of assets and liabilities by accounting categorisation was as follows:-
Financial assets at
amortised cost
US$ millions
Financial assets &
liabilities at FVTPL
US$ millions
Financial assets at
FVTOCI US$ millions
Financial liabilities at
amortised cost
US$ millions
Non-financial assets & liabilities
US$ millionsTotal
US$ millions
At 31st December 2015Cash and other liquid assets 4,309.7 - - - - 4,309.7Securities purchased under
agreements to resell 1,835.0-
--
- 1,835.0Placements 4,402.9 - - - - 4,402.9Trading securities - 72.2 - - - 72.2Investment securities 3,612.6 - 271.9 - - 3,884.5Loans and advances 9,161.4 - - - - 9,161.4Other assets 197.9 172.6 - - 156.2 526.7Total assets 23,519.5 244.8 271.9 - 156.2 24,192.4
Deposits from banks - - - 1,985.9 - 1,985.9Deposits from customers - - - 14,683.4 - 14,683.4Securities purchased under
agreements to resell - - - 2,093.4 - 2,093.4Other liabilities - 176.8 - 183.0 68.9 428.7Senior term financing - - - 2,420.0 - 2,420.0Subordinated term financing - - - 150.0 - 150.0Equity - - - - 2,431.0 2,431.0Total liabilities & equity - 176.8 - 21,515.7 2,499.9 24,192.4
At 31st December 2014Cash and other liquid assets 2,472.6 - - - - 2,472.6
Securities purchased under agreements to resell 1,305.2 - - - - 1,305.2
Placements 5,180.5 - - - - 5,180.5Trading securities - 72.7 - - - 72.7Investment securities 3,636.9 - 307.6 - - 3,944.5Loans and advances 7,931.5 - - - - 7,931.5Other assets 132.7 130.0 - - 130.5 393.2Total assets 20,659.4 202.7 307.6 - 130.5 21,300.2
Deposits from banks - - - 1,240.1 - 1,240.1Deposits from customers - - - 12,897.8 - 12,897.8
Securities sold under agreements to repurchase - - - 618.0 - 618.0
Other liabilities - 131.0 - 150.0 61.9 342.9Senior term financing - - - 3,372.9 - 3,372.9Subordinated term financing - - - 477.8 - 477.8Equity - - - - 2,350.7 2,350.7Total liabilities & equity - 131.0 - 18,756.6 2,412.6 21,300.2
The other assets and other liabilities classified as financial assets and liabilities at FVTPL comprise the fair values of derivatives designated as fair value and cash flow hedges.
The fair value analysis of derivative financial instruments is set out in note 31.4.
Notes to the consolidated financial statements (continued)For the year ended 31st December 2015

Annual Report 2015 69
5. Cash and other liquid assets
31.12.15US$ millions
31.12.14US$ millions
Cash and balances with central banks 3,605.9 1,519.4
Cash and balances with banks 471.7 494.5
Government bills 39.9 274.7
Certificates of deposit - 51.0
Cash and cash equivalents 4,117.5 2,339.6
Statutory deposits with central banks 192.2 133.0
Cash and other liquid assets 4,309.7 2,472.6
Statutory deposits with central banks are subject to local regulations which provide for restrictions on the deployment of these funds.
The increase in cash and balances with central banks and the decrease in government bills and certificates of deposits at 31st December 2015 was principally attributable to the deposit of liquid funds with central banks rather than investment in government bills, certificate of deposits or placements.
6. Securities purchased under agreements to resell The Group enters into collateralised lending transactions (reverse repurchase agreements) in the ordinary course of its operating
activities. The collateral is in the form of highly rated debt securities. The collateralised lending transactions are conducted under standardised terms that are usual and customary for such transactions.
7. Placements Placements at 31st December 2015 included placements with central banks amounting to US$1,085.8 million (2014: US$1,511.0
million). The placements with central banks represented the placement of surplus liquid funds.
8. Trading securities
31.12.15US$ millions
31.12.14US$ millions
Managed funds 47.6 60.6
Debt securities 13.1 -
Equity securities 11.5 12.1
72.2 72.7
Equity and debt securities comprised securities acquired in relation to investment banking activities undertaken by the Group. The securities were held with the intention of selling in the near term.
Managed funds comprised funds placed for investment with specialist managers.
Notes to the consolidated financial statements (continued)For the year ended 31st December 2015

GIB | Celebrating 40 years
70 Annual Report 2015
9. Investment securities
9.1 Composition The credit rating profile of investment securities, based on the lowest rating assigned by the major international rating agencies,
was as follows:-
US$ millions31.12.15
% US$ millions31.12.14
%
AAA to A- / Aaa to A3 3,088.1 85.5 3,298.3 90.7
BBB+ to BBB- / Baa1 to Baa3 524.5 14.5 338.6 9.3
Total debt securities 3,612.6 100.0 3,636.9 100.0
Equity investments 271.9 307.6
3,884.5 3,944.5
Investment securities principally comprised investment-grade rated debt securities issued by major international financial institutions and government-related entities.
Debt securities are classified as investment securities at amortised cost and equity investments are classified as FVTOCI.
9.2 Provisions for impairment The movement in the provisions for impairment of investment securities were as follows:-
2015US$ millions
2014US$ millions
At 1st January 3.2 7.7
Release for the year - (4.5)
At 31st December 3.2 3.2
At 31st December 2015, the provisions for the impairment of investment securities entirely comprised non-specific provisions for debt investment securities determined on a collective basis.
The provision release during the year ended 31st December 2014 arose on an adjustment to the historical loss estimate to reflect the effects of current conditions in relation to the investment-grade rated debt securities. The probabilities of default applied in the calculation of the collective provisions for impairment nevertheless continued to reflect stressed probabilities of default and exceeded prevailing default levels.
10. Loans and advances
10.1 Composition
31.12.15US$ millions
31.12.14US$ millions
Gross loans and advances 9,522.4 8,532.6
Provisions for impairment (361.0) (601.1)
Net loans and advances 9,161.4 7,931.5
Notes to the consolidated financial statements (continued)For the year ended 31st December 2015

Annual Report 2015 71
10. Loans and advances (continued)
10.2 Industrial classification
31.12.15US$ millions
31.12.14US$ millions
Trading and services 2,100.6 1,739.6
Energy, oil and petrochemical 1,986.5 2,042.2
Financial 1,861.7 1,395.8
Transportation 1,087.4 1,068.8
Manufacturing 917.7 944.5
Construction 765.2 714.2
Real estate 280.9 143.3
Communication 273.5 267.9
Other 248.9 216.3
9,522.4 8,532.6
Provisions for impairment (361.0) (601.1)
9,161.4 7,931.5
Gross loans at 31st December 2015 included Shariah-compliant transactions amounting to US$3,268.0 million (2014: US$2,190.1 million).
10.3 Provisions for impairment The movements in the provisions for the impairment of loans and advances were as follows:-
SpecificUS$ millions
Non-specific
US$ millions
2015
TotalUS$ millions
SpecificUS$ millions
Non-specific
US$ millions
2014
TotalUS$ millions
At 1st January 453.1 148.0 601.1 423.3 168.0 591.3
Exchange rate movements (0.4) - (0.4) (0.5) - (0.5)
Amounts utilised (261.0) - (261.0) - - -
Amounts reallocated 13.5 (13.5) - 20.0 (20.0) -
Charge for the year 21.3 - 21.3 10.3 - 10.3
At 31st December 226.5 134.5 361.0 453.1 148.0 601.1
The level of non-specific loan provisions reflect the application of stressed probabilities of default in the calculation of provisions for impairment measured on a collective basis.
Non-specific provisions at 31st December 2015 represented 1.4 per cent of non-specifically provisioned loans (2014: 1.8 per cent).
The gross amount of specifically provisioned loans at 31st December 2015 was US$238.8 million (2014: US$462.5 million). Total specific provisions at 31st December 2015 represented 94.8 per cent of loans against which a specific provision had been made (2014: 98.0 per cent).
Notes to the consolidated financial statements (continued)For the year ended 31st December 2015

GIB | Celebrating 40 years
72 Annual Report 2015
10. Loans and advances (continued)
10.3 Provisions for impairment (continued) Specific provisions as at 31st December 2015 included provisions against credit-related non-loan exposures of US$41.7 million
(2014: US$37.6 million).
Amounts utilised during the year ended 31st December 2015 represented provisions utilised on the transfer of the related loans to the memorandum records. Recovery efforts on these loans are still ongoing with the intention to maximise potential recoveries.
10.4 Past due loans The gross and carrying amounts of loans for which either principal or interest was over 90 days past due were as follows:-
GrossUS$ millions
31.12.15Carrying Amount
US$ millionsGross
US$ millions
31.12.14Carrying Amount
US$ millions
Corporates 212.2 33.1 335.1 9.4
Financial institutions 12.9 5.6 134.1 6.7
225.1 38.7 469.2 16.1
Corporates include loans extended for investment purposes.
The overdue status of gross past due loans based on original contractual maturities was as follows:-
Past due but not impaired
US$ millions
31.12.15Past due
and impairedUS$ millions
Past due but not impaired
US$ millions
31.12.14Past due
and impairedUS$ millions
Less than 1 year 0.9 35.6 - 66.7
Years 2 to 7 5.6 183.0 6.7 395.8
6.5 218.6 6.7 462.5
At 31st December 2015, the past due but not impaired loan of US$5.6 million (2014: US$6.7 million) represented a loan guaranteed by a government export credit agency.
10.5 Restructured loans During the year ended 31st December 2015, the Group restructured two loans amounting to US$20.3 million (2014: nil) and
made concessions that would not ordinarily have been accepted, due to a deterioration in the customer’s financial position.
10.6 Collateral The Group did not take possession of any collateral during the years ended 31st December 2015 and 31st December 2014.
Notes to the consolidated financial statements (continued)For the year ended 31st December 2015

Annual Report 2015 73
11. Other assets
31.12.15US$ millions
31.12.14US$ millions
Derivative financial instruments 172.6 130.0
Accrued interest, fees and commissions 121.6 93.6
Prepayments 98.4 82.4
Premises and equipment 55.4 45.4
Deferred items 2.4 2.7
Pension asset 13.0 -
Other, including accounts receivable 63.3 39.1
526.7 393.2
Derivative financial instruments represent the positive fair values of derivative financial instruments entered into for trading purposes, or designated as fair value or cash flow hedges. An analysis of the fair value of derivative financial instruments is set out in note 31.4.
An analysis of the pension asset is set out in note 12.
12. Post retirement benefits The Group contributes to defined benefit and defined contribution pension plans which cover substantially all of its employees.
The Bank maintains defined contribution pension plans for the majority of its employees. Contributions are based on a percentage of salary. The amounts to be paid as retirement benefits are determined by reference to the amounts of the contributions and investment earnings thereon. The total cost of contributions to defined contribution pension plans for the year ended 31st December 2015 amounted to US$10.8 million (2014: US$9.0 million).
The Bank’s principal subsidiary, Gulf International Bank (UK) Limited (GIBUK), maintains a defined benefit final salary pension plan for a number of its employees. The assets of the plan are held independently of the subsidiary’s assets in a separate trustee administered fund. The fund is subject to the UK regulatory framework for pensions.
The fund exposes the Group to the risk of paying unanticipated contributions in times of adverse experience. Such events could be members living for longer than expected, higher than expected inflation or salary growth, and the risk that increases in the fund’s obligations are not met by a corresponding improvement in the value of the fund’s assets.
12.1 The amount recognised in the consolidated statement of financial position is analysed as follows:-
31.12.15US$ millions
31.12.14US$ millions
Fair value of plan assets 203.8 214.5
Present value of fund obligations 190.8 216.8
Net asset / (liability) in the consolidated statement of financial position 13.0 (2.3)
Notes to the consolidated financial statements (continued)For the year ended 31st December 2015

GIB | Celebrating 40 years
74 Annual Report 2015
12. Post retirement benefits (continued)
12.2 The movements in the fair value of plan assets were as follows:-
2015US$ millions
2014US$ millions
At 1st January 214.5 201.0
Included in the consolidated statement of income:-
- Interest income on the plan assets 7.1 8.8
Included in the consolidated statement of other comprehensive income:-
- Remeasurements:-
- Return on plan assets excluding interest income (2.0) 20.3
Other movements:-
- Exchange rate movements (12.0) (12.7)
- Contributions paid by the Group 0.7 1.4
- Benefits paid by the plan (4.5) (4.3)
At 31st December 203.8 214.5
The plan assets at 31st December 2015 comprised a 50 per cent exposure to multi-asset funds, with the balance exposure to equities, debt and hedging funds in equal proportion. The plan assets have a quoted price in an active market and the hedging funds are designed to hedge the majority of inflation and interest rate risk.
12.3 The movements in the present value of fund obligations were as follows:-
2015US$ millions
2014US$ millions
At 1st January 216.8 198.3
Included in the consolidated statement of income:-
- Current service cost 0.9 0.9
- Interest cost on the fund obligations 7.2 8.6
Included in the consolidated statement of other comprehensive income:-
- Remeasurements due to changed actuarial assumptions:-
- Financial assumptions (11.6) 25.9
- Experience (6.0) -
Other movements:-
- Exchange rate movements (12.0) (12.6)
- Benefits paid by the plan (4.5) (4.3)
At 31st December 190.8 216.8
Notes to the consolidated financial statements (continued)For the year ended 31st December 2015

Annual Report 2015 75
12. Post retirement benefits (continued)
12.4 The movements in the net asset / (liability) recognised in the consolidated statement of financial position were as follows:-
2015US$ millions
2014US$ millions
At 1st January (2.3) 2.7
Net expense included in consolidated statement of income (1.0) (0.7)
Remeasurement included in consolidated statement of comprehensive income 15.6 (5.6)
Contributions paid by the Group 0.7 1.4
Exchange rate movements - (0.1)
At 31st December 13.0 (2.3)
The Group paid US$0.7 million in contributions to the plan during 2015 and expects to pay US$0.7 million during 2016.
12.5 The principal actuarial assumptions used for accounting purposes were as follows:-
2015 2014
Discount rate (per cent) 3.9 3.6
Retail price inflation (per cent) 3.1 3.1
Consumer price inflation (per cent) 2.1 2.1
Pension increase rate (per cent) 3.1 3.1
Salary growth rate (per cent) 3.0 3.0
Average life expectancy (years) 89 89
The present value of the fund’s obligations, which has a weighted average duration of 21 years, was calculated based on certain actuarial assumptions. Should any one of the key assumptions change by an amount that is probable whilst holding the other assumptions constant, the present value of the fund’s obligations would increase or decrease as follows:-
2015US$ millions
Life expectancy increased by 1 year 4.8
Discount rate increased by 0.1 per cent 3.8
Inflation increased by 0.1 per cent 2.6
Salary growth rate increased by 0.1 per cent 0.2
Notes to the consolidated financial statements (continued)For the year ended 31st December 2015

GIB | Celebrating 40 years
76 Annual Report 2015
13. Deposits The geographical composition of total deposits was as follows:-
31.12.15US$ millions
31.12.14US$ millions
GCC countries 11,749.6 9,856.0
Other Middle East and North Africa countries 777.3 674.8
Other countries 4,142.4 3,607.1
16,669.3 14,137.9
GCC deposits comprise deposits from GCC country governments and central banks and other institutions headquartered in the GCC states.
At 31st December 2015, GCC deposits represented 70.5 per cent of total deposits (2014: 69.7 per cent).
Deposits from other countries during the year ended 31st December 2015 and 31st December 2014 reflected a high level of deposit activity by the Group’s London-based subsidiary, Gulf International Bank (UK) Limited.
Total deposits at 31st December 2015 included Shariah-compliant transactions amounting to US$4,112.0 million (2014: US$3,153.7 million). Shariah-compliant transactions comprise murabaha contracts.
14. Securities sold under agreements to repurchase The Group enters into collateralised borrowing transactions (repurchase agreements) in the ordinary course of its financing
activities. Collateral is provided in the form of securities held within the investment securities portfolio. At 31st December 2015, the fair value of investment securities that had been pledged as collateral under repurchase agreements was US$2,192.0 million (2014: US$711.3 million). The collateralised borrowing transactions are conducted under standardised terms that are usual and customary for such transactions.
15. Other liabilities
31.12.15US$ millions
31.12.14US$ millions
Derivative financial instruments 176.8 131.0
Deferred items 68.9 61.9
Accrued interest 95.8 68.8
Pension liability - 2.3
Other, including accounts payable and accrued expenses 87.2 78.9
428.7 342.9
Derivative financial instruments represent the negative fair values of derivative financial instruments entered into for trading purposes, or designated as fair value or cash flow hedges. An analysis of the fair value of derivative financial instruments is set out in note 31.4.
Notes to the consolidated financial statements (continued)For the year ended 31st December 2015

Annual Report 2015 77
16. Senior term financing
Maturity31.12.15
US$ millions31.12.14
US$ millions
Floating rate loan 2016 500.0 500.0
Floating rate note 2017 499.9 499.6
Floating rate loans 2018 615.0 605.7
Floating rate note 2019 533.3 533.0
Floating rate loans 2019 - 2022 271.8 266.5
Floating rate note 2015 - 932.7
Floating rate repurchase agreements 2015 - 35.4
2,420.0 3,372.9
The US$500.0 million floating rate loan maturing in 2016 was provided by the Group’s majority shareholder, the Public Investment Fund. The loan was based on market rates and standardised terms that are usual and customary for such transactions.
At 31st December 2014, the fair value of investment securities that had been pledged as collateral under floating rate repurchase agreements was US$50.1 million. The floating rate repurchase agreements matured during 2015.
17. Subordinated term financing
Maturity31.12.15
US$ millions31.12.14
US$ millions
Floating rate loans 2016 150.0 150.0
Floating rate note 2015 - 327.8
150.0 477.8
The subordinated term financing facilities represent unsecured obligations of the Group and are subordinated in right of payment to the claims of depositors and other creditors of the Group that are not also subordinated. The subordinated financing facilities have been approved for inclusion in tier 2 capital for capital adequacy purposes by the Bank’s regulator, the Central Bank of Bahrain.
18. Share capital The authorised share capital at 31st December 2015 comprised 3.0 billion shares of US$1 each (2014: 3.0 billion shares of US$1
each). The issued share capital at 31st December 2015 comprised 2.5 billion shares of US$1 each (2014: 2.5 billion shares of US$1 each). All issued shares are fully paid.
Notes to the consolidated financial statements (continued)For the year ended 31st December 2015

GIB | Celebrating 40 years
78 Annual Report 2015
19. Reserves
Share Premium
US$ millions
Compulsoryreserve
US$ millions
Voluntaryreserve
US$ millions
Cash flow hedge
reserveUS$ millions
Investmentsecurities
revaluationreserve
US$ millionsTotal
US$ millions
At 1st January 2015 7.6 214.1 151.6 (0.3) 19.0 392.0
Net fair value gains on cash flow hedges - - - 0.3 - 0.3
Net fair value gains on equity investments classified as FVTOCI - - - - (25.7) (25.7)
Net (decrease) / increase - - - 0.3 (25.7) (25.4)
Transfers from retained earnings - 6.6 6.6 - - 13.2
At 31st December 2015 7.6 220.7 158.2 - (6.7) 379.8
At 1st January 2014 7.6 206.7 144.2 - 15.8 374.3
Net fair value losses on cash flow hedges - - - (0.2) - (0.2)
Net fair value gains on equity investments classified as FVTOCI - - - - 3.2 3.2
Transfers to consolidated statement of income - - - (0.1) - (0.1)
Net (decrease) / increase - - - (0.3) 3.2 2.9
Transfers from retained earnings - 7.4 7.4 - - 14.8
At 31st December 2014 7.6 214.1 151.6 (0.3) 19.0 392.0
In accordance with the Bank’s articles of association, 10 per cent of the Bank’s net profit for the year is required to be transferred to each of the compulsory and voluntary reserves. Transfers to the compulsory reserve are required until such time as this reserve represents 50 per cent of the issued share capital of the Bank. The voluntary reserve may be utilised at the discretion of the Board of Directors.
The investment securities revaluation reserve entirely comprised unrealised fair value gains and losses on equity investments arising since the adoption of IFRS 9 (2010) on 1st January 2012.
20. Dividends No dividend is proposed in respect of the financial year ended 31st December 2015.
Notes to the consolidated financial statements (continued)For the year ended 31st December 2015

Annual Report 2015 79
21. Net interest income
Year ended31.12.15
US$ millions
Year ended31.12.14
US$ millions
Interest income
Placements and other liquid assets 48.1 37.7
Investment securities 60.7 55.2
Loans and advances 235.2 216.0
Total interest income 344.0 308.9
Interest expense
Deposits from banks and customers 94.9 84.2
Securities sold under agreements to repurchase 8.2 3.4
Term financing 52.7 63.3
Total interest expense 155.8 150.9
Net interest income 188.2 158.0
Interest income on loans and advances includes loan origination fees that form an integral part of the effective interest rate of the loan.
Accrued interest on impaired loans included in interest income for the year ended 31st December 2015 amounted to nil (2014: Nil). There was no accrued but uncollected interest included in interest income on past due loans or past due investment securities for either the year ended 31st December 2015 or 31st December 2014.
22. Fee and commission income
Year ended31.12.15
US$ millions
Year ended31.12.14
US$ millions
Fee and commission income
Investment banking and management fees 38.3 27.9
Commissions on letters of credit and guarantee 28.6 32.1
Loan commitment fees 2.1 2.0
Other fee and commission income 2.6 2.4
Total fee and commission income 71.6 64.4
Fee and commission expense (1.4) (1.5)
Net fee and commission income 70.2 62.9
Investment banking and management fees comprise fees relating to the provision of investment management and financial services, including asset and fund management, underwriting activities, and services relating to structured financing, privatisations, initial public offerings, and mergers and acquisitions.
Investment banking and management fees for the year ended 31st December 2015 included fee income relating to the Group’s fiduciary activities amounting to US$23.5 million (2014: US$20.8 million).
Fee and commission expense principally comprises security custody fees.
Notes to the consolidated financial statements (continued)For the year ended 31st December 2015

GIB | Celebrating 40 years
80 Annual Report 2015
23. Foreign exchange income Foreign exchange income principally comprises customer-initiated foreign exchange contracts which have been offset in
the market with matching contracts. There is no remaining market risk associated with these offset customer-related foreign exchange contracts.
Foreign exchange includes spot and forward foreign exchange contracts, and currency futures and options.
24. Trading income
Year ended31.12.15
US$ millions
Year ended31.12.14
US$ millions
Managed funds 3.6 1.2
Interest rate derivatives 2.8 0.7
Equity securities (0.2) 0.5
6.2 2.4
Trading income comprises gains and losses arising both on the purchase and sale, and from changes in the fair value, of trading instruments, together with the related interest income, interest expense and dividend income. Trading income accordingly incorporates all income and expenses related to the Group’s trading activities.
25. Other income
Year ended31.12.15
US$ millions
Year ended31.12.14
US$ millions
Dividends on equity investments classified as FVTOCI 12.6 9.5
Asset recoveries 7.9 3.8
Net realised profits on investment debt securities 2.7 1.4
Sundry income 0.4 0.2
23.6 14.9
Asset recoveries comprised recoveries relating to assets that had previously been either written off or transferred to the memorandum records.
26. Segmental information Segmental information is presented in respect of the Group’s business and geographical segments. The primary reporting
format, business segments, reflects the manner in which financial information is evaluated by the Board of Directors and the Group Management Committee.
26.1 Business segments For financial reporting purposes, the Group is organised into four main operating segments:-
- Wholesale banking: the provision of wholesale commercial financing and other credit facilities for corporate and institutional customers, and the provision of financial advisory services relating to structured financing, privatisations, initial public offerings, and mergers and acquisitions.
- Treasury: the provision of a broad range of treasury and capital market products and services to corporate and financial institution clients, money market, proprietary investment and trading activities and the management of the Group’s balance sheet, including funding.
Notes to the consolidated financial statements (continued)For the year ended 31st December 2015

Annual Report 2015 81
26. Segmental information (continued)
26.1 Business segments (continued) - Financial markets: the provision of asset and fund management services.
- Head office and support units: income arising on the investment of the Group’s net free capital funds and expenses incurred by support units, including the investment in the retail banking strategy prior to the launch of all planned retail banking products and services.
The results reported for the business segments are based on the Group’s internal financial reporting systems, which report interest revenue and interest expense on a net basis. The accounting policies of the segments are the same as those applied in the preparation of these consolidated financial statements and are set out in note 2. Transactions between business segments are conducted on normal commercial terms and conditions. Transfer pricing between the business units is based on the market cost of funds.
Segment results, assets and liabilities comprise items directly attributable to the business segments. Liabilities reported for head office and support units comprise senior and subordinated term finance facilities and related accrued interest, the cost of which is recharged to the relevant operating business segments.
The business segment analysis is as follows:-
Wholesale banking
US$ millionsTreasury
US$ millions
Financial markets
US$ millions
Head officeand support
unitsUS$ millions
TotalUS$ millions
2015
Net interest income 94.6 62.7 - 30.9 188.2
Total income 145.0 90.4 25.2 47.4 308.0
Segment result 80.3 79.5 17.9 (83.1) 94.6
Taxation charge on overseas activities (4.2)
Net income after tax 90.4
Segment assets 9,334.3 14,462.2 51.2 344.7 24,192.4
Segment liabilities - 19,100.8 11.1 2,649.5 21,761.4
Total equity 2,431.0
Total liabilities and equity 24,192.4
2014
Net interest income 71.0 55.2 - 31.8 158.0
Total income 120.2 76.8 22.6 38.0 257.6
Segment result 67.9 66.6 16.7 (64.3) 86.9
Taxation charge on overseas activities (1.3)
Net income after tax 85.6
Segment assets 8,086.1 12,846.2 39.0 328.9 21,300.2
Segment liabilities - 15,014.6 10.7 3,924.2 18,949.5
Total equity 2,350.7
Total liabilities and equity 21,300.2
Notes to the consolidated financial statements (continued)For the year ended 31st December 2015

GIB | Celebrating 40 years
82 Annual Report 2015
26. Segmental information (continued)
26.2 Geographical segments Although the Group’s three main business segments are managed on a worldwide basis, they are considered to operate in two
geographical markets: the GCC and the rest of the world.
The geographical composition of total income and total assets based on the location in which transactions are booked and income is recorded was as follows:-
Total incomeUS$ millions
2015Total assets
US$ millionsTotal income
US$ millions
2014Total assetsUS$ millions
GCC 247.7 16,881.0 206.3 15,720.6
Other countries 60.3 7,311.4 51.3 5,579.6
308.0 24,192.4 257.6 21,300.2
The geographical analyses of deposits and risk assets are set out in notes 13 and 28 respectively.
27. Risk management The principal risks associated with the Group’s businesses are credit risk, market risk, liquidity risk and operational risk. The
Group has a comprehensive risk management framework in place for managing these risks which is constantly evolving as the business activities change in response to credit, market, product and other developments. The risk management framework is guided by a number of overriding principles including the formal definition of risk management governance, an evaluation of risk appetite expressed in terms of formal risk limits, risk oversight independent of business units, disciplined risk assessment and measurement including Value-at-Risk (VaR) methodologies and portfolio stress testing, and risk diversification. The Board of Directors set the Group’s overall risk parameters and risk tolerances, and the significant risk management policies. A Board Risk Policy Committee reviews and reports to the Board of Directors on the Group’s risk profile and risk taking activities. A Management Committee, chaired by the Group Chief Executive Officer, has the primary responsibility for sanctioning risk taking activities and risk management policies within the overall risk parameters and tolerances defined by the Board of Directors. A Group Risk Committee, under the chairmanship of the Chief Risk Officer and comprising the Group’s most senior risk professionals, provides a forum for the review and approval of risk measurement methodologies, risk control processes and the approval of new products. The Group Risk Committee also reviews all risk policies and limits that require the formal approval of the Management Committee. The risk management control process is based on a detailed structure of policies, procedures and limits, and comprehensive risk measurement and management information systems for the control, monitoring and reporting of risks. Periodic reviews by internal and external auditors and regulatory authorities subject the risk management processes to additional scrutiny which help to further strengthen the risk management environment.
The principal risks associated with the Group’s businesses and the related risk management processes are described in detail in the Basel 3 Pillar 3 disclosure report in the Annual Report, and are summarised below together with additional quantitative analyses:-
27.1 Credit risk Credit risk is the risk that counterparties will be unable to meet their obligations to the Group. Credit risk arises principally
from the Group’s lending and investment activities in addition to other transactions involving both on- and off-balance sheet financial instruments. Disciplined processes are in place at both the business unit and corporate level that are intended to ensure that risks are accurately assessed and properly approved and monitored. Formal credit limits are applied at the individual transaction, counterparty, country and portfolio levels. Overall exposures are also evaluated to ensure a broad diversification of credit risk. The credit management process involves the monitoring of concentrations by product, industry, single obligor, risk grade and geography, and the regular appraisal of counterparty credit quality through the analysis of qualitative and quantitative information.
Notes to the consolidated financial statements (continued)For the year ended 31st December 2015

Annual Report 2015 83
27. Risk management (continued)
27.1 Credit risk (continued) Credit risk is actively managed and rigorously monitored in accordance with well-defined credit policies and procedures. Prior
to the approval of a credit proposal, a detailed credit risk assessment is carried out which includes an analysis of the obligor’s financial condition, market position, business environment and quality of management. The risk assessment generates an internal credit risk rating for each exposure, which affects the credit approval decision and the terms and conditions of the transaction. For cross border transactions an analysis of country risk is also conducted. The Group bases its credit decision for an individual counterparty on the aggregate Group exposure to that counterparty and all its related entities. Groupwide credit limit setting and approval authorisation requirements are conducted within Board approved guidelines, and the measurement, monitoring and control of credit exposures are done on a Groupwide basis in a consistent manner.
The Group also mitigates its credit exposures on foreign exchange and derivative financial instruments through the use of master netting agreements and collateral arrangements.
a) Maximum exposure to credit risk The gross maximum exposure to credit risk before applying collateral, guarantees and other credit enhancements was as
follows:-
31.12.15US$ millions
31.12.14US$ millions
Balance sheet items:
Cash and other liquid assets 4,309.7 2,472.6
Securities purchased under agreements to resell 1,835.0 1,305.2
Placements 4,402.9 5,180.5
Trading securities 72.2 72.7
Investment securities 3,884.5 3,944.5
Loans and advances 9,161.4 7,931.5
Accrued interest receivable 121.6 93.6
Total on-balance sheet credit exposure 23,787.3 21,000.6
Off-balance sheet items:
Credit-related contingent items 4,462.4 3,976.0
Foreign exchange-related items 239.7 195.7
Derivative-related items 34.2 40.7
Commodity contracts 1.1 3.0
Total off-balance sheet credit exposure 4,737.4 4,215.4
Total gross credit exposure 28,524.7 25,216.0
Notes to the consolidated financial statements (continued)For the year ended 31st December 2015

GIB | Celebrating 40 years
84 Annual Report 2015
27. Risk management (continued)
27.1 Credit risk (continued)
b) Credit risk profile The Group monitors, manages and controls credit risk exposures based on an internal credit rating system that rates individual
obligors based on a rating scale from 1 to 10, subject to positive (+) and negative (-) modifiers for rating grades 2 to 6. The internal credit rating is a measure of the credit-worthiness of a single obligor, based on an assessment of the credit risk relating to senior unsecured, medium-term, foreign currency credit exposure. The primary objectives of the internal credit rating system are the maintenance of a single uniform standard for credit quality measurement, and to serve as the primary basis for Board-approved risk parameters and delegated credit authority limits. The internal credit rating system also serves as a key input into the Group’s risk-adjusted return on capital (RAROC) performance measurement system. Ratings are assigned to obligors, rather than facilities, and reflect a medium-term time horizon, thereby rating through an economic cycle.
The internal ratings map directly to the rating grades used by the international credit rating agencies as follows:-
External rating
Internal rating gradeInternal
classification
Fitch and Standard &
Poor’s Moody’s
Investment grade
Rating grade 1 Standard AAA Aaa
Rating grade 2 Standard AA Aa
Rating grade 3 Standard A A
Rating grade 4 Standard BBB Baa
Sub-investment grade
Rating grade 5 Standard BB Ba
Rating grade 6 Standard B B
Rating grade 7 Standard CCC Caa
Classified
Rating grade 8 Substandard CC Ca
Rating grade 9 Doubtful C C
Rating grade 10 Loss D -
Notes to the consolidated financial statements (continued)For the year ended 31st December 2015

Annual Report 2015 85
27. Risk management (continued)
27.1 Credit risk (continued)
b) Credit risk profile (continued) The credit risk profile, based on internal credit ratings, was as follows:-
Placements, reverse repos &
other liquid assets
US$ millionsSecurities
US$ millions
31.12.15
Loans and advances
US$ millions
Placements, reverse repos & other liquid
assetsUS$ millions
SecuritiesUS$ millions
31.12.14
Loans and advances
US$ millions
Neither past due nor impaired
Rating grades 1 to 4- 10,427.6 3,625.7 5,243.6 8,858.3 3,636.9 4,801.4
Rating grades 5+ to 5- 120.0 - 3,328.2 100.0 - 2,767.8
Rating grades 6+ to 6- - - 540.8 - - 346.2
Equity investments - 331.0 - - 380.3 -
Carrying amount 10,547.6 3,956.7 9,112.6 8,958.3 4,017.2 7,915.4
Past due but not impaired
Rating grades 1 to 7 - - 6.5 - - 6.7
Carrying amount - - 6.5 - - 6.7
Past due and individually impaired
Rating grade 7 - - 0.7 - - -
Rating grade 8 - - - - - 3.8
Rating grade 9 - - 31.5 - - 5.6
Carrying amount - - 32.2 - - 9.4
Individually impaired but not past due
Rating grade 9 - - 10.1 - - -
Carrying amount - - 10.1 - - -
10,547.6 3,956.7 9,161.4 8,958.3 4,017.2 7,931.5
The above analysis is reported net of the following provisions for impairment:-
Provisions for impairment - (3.2) (361.0) - (3.2) (601.1)
Individually impaired financial assets represent assets for which there is objective evidence that the Group will not collect all amounts due, including both principal and interest, in accordance with the contractual terms of the obligation.
Unimpaired financial assets are stated net of allocated non-specific provisions for impairment.
Notes to the consolidated financial statements (continued)For the year ended 31st December 2015

GIB | Celebrating 40 years
86 Annual Report 2015
27. Risk management (continued)
27.1 Credit risk (continued)
b) Credit risk profile (continued) The Group holds collateral against loans and advances in the form of physical assets, cash deposits, securities and guarantees.
The amount and type of collateral is dependent upon the assessment of the credit risk of the counterparty. The market / fair value of the collateral is actively monitored on a regular basis and requests are made for additional collateral in accordance with the terms of the underlying agreements. Collateral is not usually held against securities or placements and no such collateral was held at either 31st December 2015 or 31st December 2014.
An analysis of the credit risk in respect of foreign exchange and derivative financial instruments is set out in note 31 while the notional and risk-weighted exposures for off-balance sheet credit-related financial instruments are set out in note 32.
c) Credit risk concentration The Group monitors concentrations of credit risk by sector and by geographic location. The industrial classification of loans and
advances is set out in note 10.2. The geographical distribution of risk assets is set out in note 28. An analysis of the credit risk in respect of foreign exchange and derivative financial instruments is set out in note 31.
d) Settlement risk Settlement risk is the risk of loss due to the failure of a counterparty to honour its obligations to deliver cash, securities, or other
assets as contractually agreed.
For certain types of transactions, the Group mitigates this risk by conducting settlements through a settlement or clearing agent to ensure that a trade is settled only when both parties have fulfilled their contractual settlement obligations. Settlement limits form part of the credit approval and limit monitoring process.
27.2 Market risk Market risk is the risk of loss due to adverse changes in interest rates, foreign exchange rates, equity prices and market
conditions, such as liquidity. The principal market risks to which the Group is exposed are interest rate risk, foreign exchange risk and equity price risk associated with its trading, investment and asset and liability management activities. The portfolio effects of holding a diversified range of instruments across a variety of businesses and geographic areas contribute to a reduction in the potential negative impact on earnings from market risk factors.
a) Trading market risk The Group’s trading activities principally comprise trading in debt and equity securities, foreign exchange and derivative financial
instruments. Derivative financial instruments include futures, forwards, swaps and options in the interest rate, foreign exchange, equity, credit and commodity markets. The Group manages and controls the market risk within its trading portfolios through limit structures of both a VaR and non-VaR nature. Non-VaR based constraints relate, inter alia, to positions, volumes, concentrations, allowable losses and maturities. VaR is a risk measurement concept which uses statistical models to estimate, within a given level of confidence, the maximum potential negative change in the market value of a portfolio over a specified time horizon resulting from an adverse movement in rates and prices. It is recognised that there are limitations to the VaR methodology. These limitations include the fact that the historical data may not be the best proxy for future price movements. The Group performs regular back testing exercises to compare actual profits and losses with the VaR estimates to monitor the statistical validity of the VaR model. VaR is calculated based on the Group’s market risk exposures at the close of the business each day. Intra-day risk levels may vary from those reported at the end of the day. In addition, losses beyond the specified confidence level are not captured by the VaR methodology. VaR is not a measure of the absolute limit of market risk and losses in excess of the VaR amounts will, on occasion, arise. To manage the risk associated with extreme market movements, the Group conducts stress testing which measures the impact of simulated abnormal changes in market rates and prices on the market values of the portfolios. The composition of the debt and equity trading securities is set out in note 8. An analysis of derivative financial instruments, including the VaR of foreign exchange and derivative trading contracts, is set out in note 31.
Notes to the consolidated financial statements (continued)For the year ended 31st December 2015

Annual Report 2015 87
27. Risk management (continued)
27.2 Market risk (continued)
a) Trading market risk (continued) The VaR for the Group’s trading positions, as calculated in accordance with the basis set out in note 34, was as follows:-
31.12.15US$ millions
AverageUS$ millions
HighUS$ millions
2015Low
US$ millions31.12.14
US$ millionsAverage
US$ millionsHigh
US$ millions
2014Low
US$ millions
Total VaR 0.7 0.9 1.3 0.7 0.4 0.1 0.4 -
Total undiversified stressed VaR
1.5 1.7 2.3 1.4 0.6 0.3 1.5 0.1
b) Non-trading market risk Structural interest rate risk arises in the Group’s core balance sheet as a result of mismatches in the repricing of interest rate
sensitive financial assets and liabilities. The associated interest rate risk is managed within VaR limits and through the use of models to evaluate the sensitivity of earnings to movements in interest rates. The repricing profile and related interest rate sensitivity of the Group’s financial assets and liabilities are set out in note 30. Movements in the fair value of equity investment securities are accounted for in other comprehensive income. The Group does not maintain material foreign currency exposures. In general, the Group’s policy is to match financial assets and liabilities in the same currency or to mitigate currency risk through the use of currency swaps. Details of significant foreign currency net open positions are set out in note 31.5.
The more significant market risk-related activities of a non-trading nature undertaken by the Group, the related risks associated with those activities, and the types of derivative financial instruments used to manage and mitigate such risks are summarised as follows:-
Activity Risk Risk mitigant
Management of the return on variable rate assets funded by shareholders’ funds
Reduced profitability due to a fall in short-term interest rates
Receive fixed interest rate swaps
Fixed rate assets funded by floating rate liabilities
Sensitivity to increases in short-term interest rates
Pay fixed interest rate swaps
Investment in foreign currency assets Sensitivity to strengthening of US$ against other currencies
Currency swaps
Profits generated in foreign currenciesSensitivity to strengthening of US$ against other currencies
Forward foreign exchange contracts and purchased currency options
27.3 Liquidity risk Liquidity risk is the risk that sufficient funds are not available to meet the Group’s financial obligations on a punctual basis as they
fall due.
Liquidity management policies are designed to ensure that funds are available at all times to meet the funding requirements of the Group, even in adverse conditions. In normal conditions the objective is to ensure that there are sufficient funds available not only to meet current financial commitments but also to facilitate business expansion. These objectives are met through the application of prudent liquidity controls. These controls provide security of access to funds without undue exposure to increased costs from the liquidation of assets or the aggressive bidding for deposits. The Group’s liquidity controls ensure that, over the short-term, the future profile of cash flows from maturing assets is adequately matched to the maturity of liabilities. Liquidity controls also provide for the maintenance of a stock of liquid and readily realisable assets and a diversified deposit base in terms of both maturities and range of depositors.
Notes to the consolidated financial statements (continued)For the year ended 31st December 2015

GIB | Celebrating 40 years
88 Annual Report 2015
27. Risk management (continued)
27.3 Liquidity risk (continued) The management of liquidity and funding is primarily conducted in the Group’s individual geographic entities within limits set and
approved by the Board of Directors. The limits take account of the depth and liquidity of the market in which the entity operates. It is the Group’s general policy that each geographic entity should be self-sufficient in relation to funding its own operations.
The Group’s liquidity management policies include the following:-
- the monitoring of (i) future contractual cash flows against approved limits, and (ii) the level of liquid resources available in a stress event
- the monitoring of balance sheet liquidity ratios - the monitoring of the sources of funding in order to ensure that funding is derived from a diversified range of sources - the monitoring of depositor concentrations in order to avoid undue reliance on individual depositors - the maintenance of a satisfactory level of term financing - the maintenance of appropriate standby funding arrangements; and - the maintenance of liquidity and funding contingency plans. These plans identify early indicators of stress conditions and
prescribe the actions to be taken in the event of systemic or other crisis, while minimising adverse long-term implications for the Group’s business activities.
The Group has established approved limits which restrict the volume of liabilities maturing in the short-term. An independent risk management function monitors the future cash flow maturity profile against approved limits on a daily basis. The cash flows are monitored against limits applying to both daily and cumulative cash flows occurring over a 30 day period. The liquidity limits ensure that the net cash outflows over a 30 day period do not exceed the eligible stock of available liquid resources. The cash flow analysis is also monitored on a weekly basis by the Assets and Liabilities Committee (ALCO).
Customer deposits form a significant part of the Group’s funding. The Group places considerable importance on maintaining the stability of both its customer and interbank deposits. The stability of deposits depends on maintaining confidence in the Group’s financial strength and financial transparency.
The maturity profile of assets and liabilities is set out in note 29. An analysis of debt investment securities by rating classification is set out in note 27.1.
27.4 Operational risk Operational risk is the risk of unexpected losses resulting from inadequate or failed internal controls or procedures, systems
failures, fraud, business interruption, compliance breaches, human error, management failure or inadequate staffing.
A framework and methodology has been developed to identify and control the various operational risks. While operational risk cannot be entirely eliminated, it is managed and mitigated by ensuring that the appropriate infrastructure, controls, systems, procedures, and trained and competent people are in place throughout the Group. A strong internal audit function makes regular, independent appraisals of the control environment in all identified risk areas. Adequately tested contingency arrangements are also in place to support operations in the event of a range of possible disaster scenarios.
27.5 Capital management The Group’s lead regulator, the Central Bank of Bahrain (CBB), sets and monitors capital requirements for the Group as a whole.
The parent company and individual banking operations are directly supervised by their local regulators.
As referred to in more detail in note 34, the Group adopted the Basel 2 capital adequacy framework with effect from 1st January 2008, and has adopted Basel 3 from 1st January 2015 as required by the CBB. The Basel 3 framework revises the definition of regulatory capital and introduces certain new liquidity and funding ratios. The Group’s current capital position is sufficient to meet the new regulatory capital requirements.
In applying current capital requirements, the CBB requires the Group to maintain a prescribed minimum ratio of total regulatory capital to total risk-weighted assets. The CBB’s minimum risk asset ratio is 12.5 per cent compared to a minimum ratio of 8 per cent prescribed by the Basel Committee on Banking Supervision. The Group calculates regulatory capital requirements for general market risk in its trading portfolios using a Value-at-Risk model and uses the CBB’s prescribed risk-weightings under the standardised approach to determine the risk-weighted amounts for credit risk and specific market risk. Operational risk is calculated in accordance with the standardised approach. The regulatory capital requirement is calculated by applying the CBB’s prescribed range of beta coefficients, ranging from 12 to 18 per cent, to the average gross income for the preceding three financial years for each of eight predefined business lines.
Notes to the consolidated financial statements (continued)For the year ended 31st December 2015

Annual Report 2015 89
27. Risk management (continued)
27.5 Capital management (continued) The Group’s regulatory capital is analysed into two tiers:-
- Tier 1 capital, comprising issued share capital, share premium, retained earnings and reserves, adjusted to exclude revaluation gains and losses arising on the remeasurement to fair value of derivative cash flow hedging transactions.
- Tier 2 capital, comprising qualifying subordinated term finance and collective impairment provisions, after applicable haircuts and ceiling limitations.
The CBB applies various limits to elements of the regulatory capital base. The amount of innovative tier 1 securities cannot exceed 15 per cent of total tier 1 capital; qualifying tier 2 capital cannot exceed tier 1 capital; and qualifying subordinated term finance cannot exceed 50 per cent of tier 1 capital. There are also restrictions on the amount of collective impairment provisions that may be included as part of tier 2 capital.
The Group’s risk exposures are categorised as either trading book or banking book, and risk-weighted assets are determined according to specified requirements that seek to reflect the varying levels of risk attached to assets and off-balance sheet exposures.
The Group’s policy is to maintain a strong capital base so as to maintain investor, creditor and market confidence and to sustain the future development of the business. The impact of the level of capital on shareholders’ return is also recognised as well as the need to maintain a balance between the higher returns that might be possible with greater gearing and the advantages and security afforded by a sound capital position. The Group manages its capital structure and makes adjustments to the structure taking account of changes in economic conditions and strategic business plans. The capital structure may be adjusted through the dividend payout and the issue of new shares.
The Group complied with all externally imposed capital requirements throughout the years ended 31st December 2015 and 31st December 2014.
There have been no material changes in the Group’s management of capital during the years ended 31st December 2015 and 31st December 2014.
The capital adequacy ratio calculation is set out in note 34.
28. Geographical distribution of risk assets
Placements, reverse repos &
other liquid assets
US$ millionsSecurities
US$ millions
Loans and advances
US$ millions
Credit-related
contingent items
US$ millions
31.12.15
TotalUS$ millions
31.12.14
TotalUS$ millions
GCC 3,768.6 1,784.3 8,357.8 3,858.4 17,769.1 16,406.5
Other Middle East & North Africa - 0.5 64.9 71.0 136.4 46.9
Europe 6,510.3 1,179.3 193.3 258.6 8,141.5 5,962.8
North America 220.8 805.0 443.2 219.0 1,688.0 1,619.6
Asia 47.9 185.9 77.8 55.4 367.0 791.6
Latin America - 1.7 24.4 - 26.1 55.6
10,547.6 3,956.7 9,161.4 4,462.4 28,128.1 24,883.0
At 31st December 2015, risk exposures to customers and counterparties in the GCC represented 63.2 per cent (2014: 65.9 per cent) of total risk assets. The risk asset profile reflects the Group’s strategic focus on wholesale banking activities in the GCC states.
Notes to the consolidated financial statements (continued)For the year ended 31st December 2015

GIB | Celebrating 40 years
90 Annual Report 2015
28. Geographical distribution of risk assets (continued) Placements, reverse repos and other liquid assets exposure to Europe principally comprised exposure to financial institutions
located in Belgium, Germany, Netherlands, Switzerland and the United Kingdom.
An analysis of derivative and foreign exchange instruments is set out in note 31.
29. Maturities of assets and liabilities The maturity profile of the carrying amount of assets and liabilities, based on the contractual maturity dates, was as follows:-
Within 3 months
US$ millions
4 months to 1 year
US$ millions
Years 2 and 3
US$ millions
Years 4 and 5
US$ millions
5 yearsand other
US$ millionsTotal
US$ millions
At 31st December 2015
Cash and other liquid assets 4,296.8 - - - 12.9 4,309.7
Securities purchased under agreements to resell
685.0 1,100.0 50.0 - - 1,835.0
Placements 3,699.2 703.7 - - - 4,402.9
Trading securities - - - 13.1 59.1 72.2
Investment securities 174.3 502.8 1,627.6 859.5 720.3 3,884.5
Loans and advances 3,424.0 2,018.5 1,838.8 1,056.9 823.2 9,161.4
Other assets 108.1 49.6 94.5 50.3 224.2 526.7
Total assets 12,387.4 4,374.6 3,610.9 1,979.8 1,839.7 24,192.4
Deposits 13,067.4 3,597.9 4.0 - - 16,669.3
Securities sold under agreements to repurchase
1,321.6 771.8 - - - 2,093.4
Other liabilities 102.8 43.3 79.1 42.7 160.8 428.7
Term financing 500.0 150.0 1,114.9 799.9 5.2 2,570.0
Equity - - - - 2,431.0 2,431.0
Total liabilities & equity 14,991.8 4,563.0 1,198.0 842.6 2,597.0 24,192.4
At 31st December 2014
Total assets 10,815.7 3,583.3 3,277.3 1,844.7 1,779.2 21,300.2
Total liabilities & equity 11,335.5 4,901.9 1,169.7 1,405.3 2,487.8 21,300.2
The asset and liability maturities presented in the table above are based on contractual repayment arrangements and as such do not take account of the effective maturities of deposits as indicated by the Group’s deposit retention records. Formal liquidity controls are nevertheless based on contractual asset and liability maturities.
Notes to the consolidated financial statements (continued)For the year ended 31st December 2015

Annual Report 2015 91
29. Maturities of assets and liabilities (continued) The gross cash flows payable by the Group under financial liabilities, based on contractual maturity dates, was as follows:-
Within 3 months
US$ millions
4 months to 1 year
US$ millions
Years 2 and 3
US$ millions
Years 4 and 5
US$ millions
Over 5 years
and otherUS$ millions
At 31st December 2015
Deposits 13,137.6 3,730.3 4.3 - -
Securities sold under agreements to repurchase 1,324.8 775.7 - - -
Term financing 517.5 194.8 1,192.2 804.1 5.4
Derivative financial instruments
- contractual amounts payable 58.0 133.0 192.0 80.1 48.6
- contractual amounts receivable (56.0) (83.7) (159.0) (45.7) (18.4)
Total undiscounted financial liabilities 14,981.9 4,750.1 1,229.5 838.5 35.6
At 31st December 2014
Deposits 10,619.5 3,551.4 4.5 - -
Securities sold under agreements to repurchase 550.8 68.1 - - -
Term financing 44.8 1,290.0 1,209.2 1,413.6 -
Derivative financial instruments
- contractual amounts payable 68.6 91.9 162.6 53.4 78.0
- contractual amounts receivable (74.7) (112.2) (185.5) (62.9) (50.8)
Total undiscounted financial liabilities 11,209.0 4,889.2 1,190.8 1,404.1 27.2
Information on the contractual terms for the drawdown of gross loan commitments is set out in note 32.
The figures in the table above do not agree directly to the carrying amounts in the consolidated statement of financial position as they incorporate all cash flows, on an undiscounted basis, related to both principal as well as those associated with future coupon and interest payments. Coupons and interest payments for periods for which the interest rate has not yet been determined have been calculated based on the relevant forward rates of interest prevailing at the balance sheet date.
A maturity analysis of derivative and foreign exchange instruments based on notional amounts is set out in note 31.3.
Notes to the consolidated financial statements (continued)For the year ended 31st December 2015

GIB | Celebrating 40 years
92 Annual Report 2015
30. Interest rate risk The repricing profile of assets and liabilities categories were as follows:-
Within 3 months
US$ millions
Months 4 to 6
US$ millions
Months 7 to 12
US$ millions
Over1 year
US$ millions
Non-interestbearing
itemsUS$ millions
TotalUS$ millions
At 31st December 2015
Cash and other liquid assets 4,296.8 - - - 12.9 4,309.7
Securities purchased under agreements to resell
685.0 1,000.0 100.0 50.0 - 1,835.0
Placements 3,699.2 479.2 224.5 - - 4,402.9
Trading securities - 13.1 - - 59.1 72.2
Investment securities
- Fixed rate 172.6 81.0 74.9 1,279.1 - 1,607.6
- Floating rate 1,783.2 225.0 - - (3.2) 2,005.0
- Equities - - - - 271.9 271.9
Loans and advances 7,088.4 1,954.4 253.1 - (134.5) 9,161.4
Other assets - - - - 526.7 526.7
Total assets 17,725.2 3,752.7 652.5 1,329.1 732.9 24,192.4
Deposits 13,067.4 2,612.8 985.1 4.0 - 16,669.3
Securities sold under agreements to repurchase
1,321.6 710.9 60.9 - - 2,093.4
Other liabilities - - - - 428.7 428.7
Term financing 2,420.0 - 150.0 - - 2,570.0
Equity - - - - 2,431.0 2,431.0
Total liabilities & equity 16,809.0 3,323.7 1,196.0 4.0 2,859.7 24,192.4
Interest rate sensitivity gap 916.2 429.0 (543.5) 1,325.1 (2,126.8) -
Cumulative interest rate sensitivity gap
916.2 1,345.2 801.7 2,126.8 - -
At 31st December 2014
Cumulative interest rate sensitivity gap
(696.9) 615.6 869.0 2,071.3 - -
The repricing profile is based on the remaining period to the next interest repricing date. Derivative financial instruments that have been used for asset and liability management purposes to hedge exposure to interest rate risk are incorporated in the repricing profiles of the related hedged assets and liabilities. The non-specific investment security and loan provisions are classified in non-interest bearing items.
The substantial majority of assets and liabilities reprice within one year. Accordingly, there is limited exposure to interest rate risk. The principal interest rate risk beyond one year, as set out in the asset and liability repricing profile, represents the investment of the Group’s net free capital in fixed rate government securities. At 31st December 2015, the modified duration of these fixed rate securities was 2.33. Modified duration represents the approximate percentage change in the portfolio value resulting from a 100 basis point change in yield. More precisely in dollar terms, the price value of a basis point of the fixed rate securities was US$301,000.
Notes to the consolidated financial statements (continued)For the year ended 31st December 2015
Annual Report 2015 93
30. Interest rate risk (continued) Based on the repricing profile at 31st December 2015, and assuming that the financial assets and liabilities were to remain until
maturity or settlement with no action taken by the Group to alter the interest rate risk exposure, an immediate and sustained one per cent increase in interest rates across all maturities would result in an increase in net income before tax for the following year by approximately US$7.0 million and an increase in the Group’s equity by US$6.8 million. The impact on the Group’s equity represents the cumulative effect of the increase in interest rates over the entire duration of the mismatches in the repricing profile of the interest rate sensitive financial assets and liabilities.
The Value-at-Risk by risk class for the Group’s trading positions is set out in note 27. The market risk relating to derivative and foreign exchange instruments classified as FVTPL is set out in note 31.
31. Derivatives and foreign exchange instruments The Group utilises derivative and foreign exchange instruments to meet the needs of its customers, to generate trading revenues
and as part of its asset and liability management (ALM) activity to hedge its own exposure to market risk. Derivative instruments are contracts whose value is derived from one or more financial instruments or indices. They include futures, forwards, swaps and options in the interest rate, foreign exchange, equity, credit and commodity markets. Derivatives and foreign exchange are subject to the same types of credit and market risk as other financial instruments. The Group has appropriate and comprehensive Board-approved policies and procedures for the control of exposure to both market and credit risk from its derivative and foreign exchange activities.
In the case of derivative transactions, the notional principal typically does not change hands. It is simply a quantity which is used to calculate payments. While notional principal is a volume measure used in the derivative and foreign exchange markets, it is neither a measure of market nor credit risk. The Group’s measure of credit exposure is the cost of replacing contracts at current market rates should the counterparty default prior to the settlement date. Credit risk amounts represent the gross unrealised gains on non-margined transactions before taking account of any collateral held or any master netting agreements in place.
The Group participates in both exchange traded and over-the-counter (OTC) derivative markets. Exchange traded instruments are executed through a recognised exchange as standardised contracts and primarily comprise futures and options. OTC contracts are executed between two counterparties who negotiate specific agreement terms, including the underlying instrument, notional amount, maturity and, where appropriate, exercise price. In general, the terms and conditions of these transactions are tailored to the requirements of the Group’s customers although conform to normal market practice. Industry standard documentation is used, most commonly in the form of a master agreement. The existence of a master netting agreement is intended to provide protection to the Group in the event of a counterparty default.
The Group’s principal foreign exchange transactions are forward foreign exchange contracts, currency swaps and currency options. Forward foreign exchange contracts are agreements to buy or sell a specified quantity of foreign exchange on a specific future date at an agreed rate. A currency swap involves the exchange, or notional exchange, of equivalent amounts of two currencies and a commitment to exchange interest periodically until the principal amounts are re-exchanged on a specified future date. Currency options provide the buyer with the right, but not the obligation, either to purchase or sell a fixed amount of a currency at a specified exchange rate on or before a specified future date. As compensation for assuming the option risk, the option seller (or writer) receives a premium at the start of the option period.
The Group’s principal interest rate-related derivative transactions are interest rate swaps, forward rate agreements, futures and options. An interest rate swap is an agreement between two parties to exchange fixed rate and floating rate interest by means of periodic payments based upon a notional principal amount and the interest rates defined in the contract. Certain agreements combine interest rate and foreign currency swap transactions, which may or may not include the exchange of principal amounts. In a forward rate agreement, two parties agree a future settlement of the difference between an agreed rate and a future interest rate, applied to a notional principal amount for an agreed period. The settlement, which generally occurs at the start of the contract period, is the discounted present value of the payment that would otherwise be made at the end of that period. An interest rate future is an exchange traded contract for the delivery of a standardised amount of a fixed income security or time deposit at a future specified date. Interest rate options, including caps, floors and collars, provide the buyer with the right, but not the obligation, either to purchase or sell an interest rate financial instrument at a specified price or rate on or before a specified future date.
The Group’s principal equity-related derivative transactions are equity and stock index options. An equity option provides the buyer with the right, but not the obligation, either to purchase or sell a specified stock or index at a specified price or level on or before a specified future date.
Notes to the consolidated financial statements (continued)For the year ended 31st December 2015

GIB | Celebrating 40 years
94 Annual Report 2015
31. Derivatives and foreign exchange instruments (continued) The Group buys and sells credit protection through credit default swaps. Credit default swaps provide protection against the
decline in value of a referenced asset as a result of credit events such as default or bankruptcy. It is similar in structure to an option whereby the purchaser pays a premium to the seller of the credit default swap in return for payment related to the deterioration in value of the referenced asset. Credit default swaps purchased and sold by the Group are classified as derivative financial instruments.
31.1 Product analysis The table below summarises the aggregate notional and credit risk amounts of foreign exchange, interest rate and commodity
contracts.
TradingUS$ millions
Notional amounts Credit risk amounts
US$ millionsHedging
US$ millionsTotal
US$ millions
At 31st December 2015
Foreign exchange contracts:-
Unmatured spot, forward and futures contracts 3,842.0 3,313.9 7,155.9 227.1
Options purchased 1,790.6 - 1,790.6 12.6
Options written 1,790.6 - 1,790.6 -
7,423.2 3,313.9 10,737.1 239.7
Interest rate contracts:-
Interest rate swaps 1,362.9 12,951.2 14,314.1 34.2
Options, caps and floors purchased 9.9 - 9.9 -
Options, caps and floors written 9.9 - 9.9 -
1,382.7 12,951.2 14,333.9 34.2
Commodity contracts:-
Options and swaps purchased 26.1 - 26.1 1.1
Options and swaps written 26.1 - 26.1 -
52.2 - 52.2 1.1
8,858.1 16,265.1 25,123.2 275.0
At 31st December 2014 8,738.6 14,607.6 23,346.2 239.4
There is no credit risk in respect of caps and floors written and options as they represent obligations of the Group.
At 31st December 2015, the Value-at-Risk of the foreign exchange, interest rate and credit derivative trading contracts analysed in the table above was US$0.1 million, nil and nil respectively (2014: nil, nil and nil respectively). Value-at-Risk is a measure of market risk exposure and represents an estimate, with a 99 per cent level of confidence, of the potential loss that might arise if the positions were to be held unchanged for ten consecutive business days. The estimate is based on a twelve month historical observation period of unweighted data from the DataMetrics data set.
Notes to the consolidated financial statements (continued)For the year ended 31st December 2015

Annual Report 2015 95
31. Derivatives and foreign exchange instruments (continued)
31.2 Counterparty analysis
BanksUS$ millions
CorporatesUS$ millions
31.12.15Total
US$ millions
31.12.14Total
US$ millions
OECD countries 137.8 87.4 225.2 180.2
GCC countries 5.9 43.9 49.8 49.4
Other countries - - - 9.8
143.7 131.3 275.0 239.4
Credit risk is concentrated on major OECD-based banks and corporates.
31.3 Maturity analysis
Year 1US$ millions
Years 2 & 3US$ millions
Years 4 & 5US$ millions
Over 5 yearsUS$ millions
TotalUS$ millions
At 31st December 2015
Foreign exchange contracts 7,557.1 3,112.5 67.5 - 10,737.1
Interest rate contracts 10,621.0 1,886.4 1,279.2 547.3 14,333.9
Commodity contracts 52.2 - - - 52.2
18,230.3 4,998.9 1,346.7 547.3 25,123.2
At 31st December 2014 18,728.0 3,326.1 1,008.2 283.9 23,346.2
The Group’s derivative and foreign exchange activities are predominantly short-term in nature. Transactions with maturities over one year principally represent either fully offset trading transactions or transactions that are designated, and qualify, as fair value or cash flow hedges.
Notes to the consolidated financial statements (continued)For the year ended 31st December 2015

GIB | Celebrating 40 years
96 Annual Report 2015
31. Derivatives and foreign exchange instruments (continued)
31.4 Fair value analysis
Positive fair value
US$ millions
31.12.15 Negative fair value
US$ millions
Positive fair value
US$ millions
31.12.15 Negative fair value
US$ millions
Derivatives classified as FVTPL:-
Forward foreign exchange contracts 120.6 (118.6) 98.5 (82.2)
Interest rate swaps and swaptions 52.0 (49.0) 31.5 (30.1)
172.6 (167.6) 130.0 (112.3)
Derivatives held as fair value hedges:-
Interest rate swaps - (9.2) - (18.7)
Amount included in other assets / (other liabilities) 172.6 (176.8) 130.0 (131.0)
31.5 Significant net open positions There were no significant derivative trading or foreign currency net open positions at either 31st December 2015 or at 31st
December 2014.
31.6 Hedge effectiveness Gains and losses recognised in the consolidated statement of income relating to fair value hedging relationships were as
follows:-
2015US$ millions
2014US$ millions
Net gains / (losses) on derivatives fair value hedging instruments 0.7 (2.3)
Net (losses) / gains on hedged items attributable to the hedged risk (0.7) 2.3
There were no ineffective portions of derivative fair value or cash flow hedging transactions recognised in the consolidated statement of income in either the year ended 31st December 2015 or 31st December 2014.
Certain derivative cash flow hedging transactions were unwound during the year ended 31st December 2009. The resultant realised profits are being recognised in the consolidated statement of income over the respective tenors of the original transactions for periods to 2015.
Notes to the consolidated financial statements (continued)For the year ended 31st December 2015

Annual Report 2015 97
32. Credit-related financial instruments Credit-related financial instruments include commitments to extend credit, standby letters of credit and guarantees which are
designed to meet the financing requirements of customers. The credit risk on these transactions is generally less than the contractual amount. The table below sets out the notional principal amounts of outstanding credit-related contingent items and the risk-weighted exposures calculated in accordance with the CBB’s Basel 3 guidelines.
Notional principal amount
US$ millions
31.12.15 Risk-
weighted exposure
US$ millions
Notional principal amount
US$ millions
31.12.14 Risk-
weighted exposure
US$ millions
Direct credit substitutes 618.5 545.3 528.3 470.5
Transaction-related contingent items 1,950.1 767.4 2,058.2 798.3
Short-term self-liquidating trade-related contingent items 307.1 74.5 498.4 75.0
Commitments, including undrawn loan commitments and underwriting commitments under note issuance and revolving facilities 1,586.7 602.1 891.1 373.3
4,462.4 1,989.3 3,976.0 1,717.1
Commitments may be drawndown on demand.
Direct credit substitutes at 31st December 2015 included financial guarantees amounting to US$508.2 million (2014: US$467.2 million). Financial guarantees may be called on demand.
The notional principal amounts reported above are stated gross before applying credit risk mitigants, such as cash collateral, guarantees and counter-indemnities. At 31st December 2015, the Group held cash collateral, guarantees, counter-indemnities or other high quality collateral in relation to credit-related contingent items amounting to US$569.1 million (2014: US$526.9 million).
33. Contingent liabilities The Bank and its subsidiaries are engaged in litigation in various jurisdictions. The litigation involves claims by and against Group
companies which have arisen in the ordinary course of business. The directors of the Bank, after reviewing the claims pending against Group companies and based on the advice of relevant professional legal advisors, are satisfied that the outcome of these claims will not have a material adverse effect on the financial position of the Group.
34. Capital adequacy The Group adopted the Basel 3 capital adequacy framework with effect from 1st January 2015. The Basel 2 framework was
applicable for the year ended 31st December 2014. The CBB’s Basel 3 guidelines became effective on 1st January 2015 as the common framework for the implementation of the Basel Committee on Banking Supervision’s (Basel Committee) Basel 3 capital adequacy framework for banks incorporated in the Kingdom of Bahrain. The Basel 3 framework revises the definition of regulatory capital and introduces certain new liquidity and funding ratios. The application of the new Basel 3 framework had no material impact on the capital adequacy ratios of the Group.
Notes to the consolidated financial statements (continued)For the year ended 31st December 2015

GIB | Celebrating 40 years
98 Annual Report 2015
34. Capital adequacy (continued) The risk asset ratio calculated in accordance with the CBB’s Basel 3 guidelines (2014: Basel 2 guidelines) was as follows:-
31.12.15US$ millions
31.12.14US$ millions
Regulatory capital base
Tier 1 capital:
Total equity 2,431.0 2,350.7
Tier 1 adjustments (13.0) (39.7)
Tier 1 capital 2,418.0 2,311.0
Tier 2 capital:
Subordinated term financing - 30.0
Non-specific provisions (subject to 1.25% credit risk-weighted exposure limit) 137.7 151.2
Tier 2 adjustments - 17.9
Tier 2 capital 137.7 199.1
Total regulatory capital base 2,555.7 2,510.1
Notional principal amount
US$ millions
Risk-weighted exposure
US$ millions
Notional principal amount
US$ millions
Risk-weighted exposure
US$ millions
Risk-weighted exposureCredit risk
Balance sheet items:-
Cash and other liquid assets 4,309.7 102.2 2,472.6 125.9
Securities purchased under agreements to resell 1,835.0 14.4 1,305.2 10.1
Placements 4,402.9 898.9 5,180.5 968.3
Investment securities 3,956.7 1,318.1 3,944.5 1,329.1
Loans and advances 9,161.4 8,797.8 7,931.5 7,587.3
Other assets, excluding derivative-related items 354.1 377.5 263.2 232.7
11,508.9 10,253.4
Off-balance sheet items:-
Credit-related contingent items 4,462.3 1,989.3 3,976.0 1,717.1
Foreign exchange-related items 10,737.1 130.1 11,070.6 103.6
Derivative-related items 14,333.9 8.3 12,243.2 33.5
Commodity contracts 52.2 - 32.4 -
Forward placements - - 60.3 12.1
Repo counterparty risk - 30.2 - 37.3
2,157.9 1,903.6
Credit risk-weighted exposure 13,666.8 12,157.0Market risk
General market risk 85.9 43.9
Specific market risk 53.9 39.8
Market risk-weighted exposure 139.8 83.7
Operational risk
Operational risk-weighted exposure 570.3 541.4
Total risk-weighted exposure 14,376.9 12,782.1
Tier 1 risk asset ratio 16.8% 18.1%
Total risk asset ratio 17.8% 19.6%
Notes to the consolidated financial statements (continued)For the year ended 31st December 2015

Annual Report 2015 99
34. Capital adequacy (continued) For regulatory Basel 3 purposes, the Group has adopted the standardised approach for credit risk as mandated by CBB for
all locally incorporated banks. For market risk, the Group uses the internal models approach. GIB applies the standardised approach for determining the capital requirement for operational risk.
In accordance with the capital adequacy guidelines of the CBB, revaluation gains and losses arising on the remeasurement to fair value of derivative cash flow hedging transactions are excluded from tier 1 capital, while unrealised gains and losses arising on the remeasurement to fair value of equity investment securities classified as fair value through other comprehensive income (FVTOCI) are included in tier 1 capital.
The Group’s subordinated term financing facilities have been approved for inclusion in tier 2 capital by the CBB. During the last five years before maturity, a cumulative amortisation (discount) factor of 20 per cent per year is to be applied to the facilities. As at 31st December 2015, the amortisation amount excluded from tier 2 capital amounted to US$150.0 million (2014: US$447.8 million).
The Group calculates the regulatory capital requirement for general market risk using a Value-at-Risk model. The use of the internal model approach for the calculation of the capital requirement for general market risk has been approved by the Bank’s regulator, the CBB. The multiplication factor to be applied to the Value-at-Risk calculated by the internal model has been set at 3.0 (2014: 3.0) by the CBB, representing the regulatory minimum. During 2012, the CBB implemented revisions to the market risk framework, consequently, the inclusion of metrics such as a ‘stressed VaR’ measure has been included in the calculation of the regulatory capital requirement.
Value-at-Risk is calculated based on a 99 per cent confidence level, a ten-day holding period and a twelve-month historical observation period of unweighted data from the DataMetrics regulatory data set. Correlations across broad risk categories are excluded. Prescribed additions in respect of specific risk are made to the general market risk. The resultant measure of market risk is multiplied by 12.5, the reciprocal of the 8 per cent international minimum capital ratio, to give market risk-weighted exposure on a basis consistent with credit risk-weighted exposure.
The regulatory capital requirement for operational risk is calculated by the Group in accordance with the standardised approach. The regulatory capital requirement is calculated based on a range of beta coefficients, ranging from 12 to 18 per cent, applied to the average gross income for the preceding three financial years for each of eight predefined business lines.
35. Fiduciary activities The Group conducts investment management and other fiduciary activities on behalf of clients. Assets held in trust or in a
fiduciary capacity are not assets of the Group and accordingly have not been included in the consolidated financial statements. The aggregate amount of the funds concerned at 31st December 2015 was US$12,406.5 million (2014: US$12,964.5 million).
The Group acts as fund manager to an investment fund called the Emerging Market Opportunities Fund. In its capacity as fund manager, the Group is entitled to performance and management fees. The Group maintains an investment with the fund.
The investors are able to vote by simple majority to remove the Group as the fund manager, without cause, and the Group’s aggregate economic interest is less than 20 per cent. As a result, the Group has concluded that it acts as agent for the investors in this case, and therefore has not consolidated the fund.
The maximum exposure to loss is equal to the carrying amount of the trading securities, which at 31st December 2015 amounted to US$46.4 million (2014: US$59.0 million).
36. Related party transactions The Group is owned by the six Gulf Cooperative Council (GCC) governments, with the Public Investment Fund holding a majority
(97.2 per cent) controlling stake. The Public Investment Fund is an investment body of the Kingdom of Saudi Arabia. There were no individual or collectively significant transactions with the Public Investment Fund during the years ended 31st December 2015 or 31st December 2014, other than the senior term loan referred to in note 16.
The Group transacts with various entities controlled, jointly controlled or significantly influenced by the six GCC governments, these transactions are conducted in the ordinary course of the Group’s business on terms comparable to those with other entities that are not government-related.
The Group’s other related party transactions are limited to the compensation of its directors and executive officers.
Notes to the consolidated financial statements (continued)For the year ended 31st December 2015

GIB | Celebrating 40 years
100 Annual Report 2015
36. Related party transactions The compensation of key management personnel was as follows:-
2015US$ millions
2014US$ millions
Short-term employee benefits 8.9 8.2
Post-employment benefits 0.5 0.4
9.4 8.6
Key management personnel comprise members of the Board of Directors, the Group Chief Executive Officer and the Managing Directors of the Group.
Post-employment benefits principally comprise compensation paid to personnel on retirement or resignation from the services of the Group.
37. Fair value of financial instruments The Group’s financial instruments are accounted for under the historical cost method with the exception of trading securities,
equity investment securities and derivative financial instruments, which are accounted for at fair value. The fair value represents the price that would be received to sell an asset, or paid to transfer a liability, in an orderly transaction between market participants at the measurement date. Differences therefore can arise between book values under the historical cost method and fair value estimates. Underlying the definition of fair value is the presumption that the Group is a going concern without any intention or requirement to curtail materially the scale of its operation or to undertake a transaction on adverse terms. Generally accepted methods of determining fair value include reference to quoted prices (level 1 measurement) or to the pricing prevailing for similar financial instruments (level 2 measurement) and the use of unobservable inputs in estimation techniques such as discounted cash flow analysis (level 3 measurement).
The valuation methodologies applied are outlined below.
37.1 Trading securities The fair values of trading securities are based on quoted prices (level 1) or valuation techniques (level 2 or 3).
37.2 Investment securities The fair values of equity investment securities are based on quoted prices (level 1) or valuation techniques (level 2 or 3). The fair
values of debt investment securities are based on quoted market prices (level 1) and approximate the carrying values.
37.3 Loans and advances The fair values (level 2) of loans on a floating interest rate basis are principally estimated at book value. The fair values (level
3) of impaired loans are estimated at the recoverable amount, measured as the present value of expected future cash flows discounted based on the interest rate at the inception of the loan. The fair values of fixed rate loans are estimated on a discounted cash flow basis utilising discount rates equal to prevailing market rates of interest in the respective currencies for loans of similar residual maturity and credit quality. The fair values (level 2) approximate the carrying values.
37.4 Term financing The fair value of term financing is based on observable market data, including quoted market prices for debt instruments issued
by similarly rated financial institutions and with similar maturities, or estimated on a discounted cash flow basis utilising currently prevailing spreads for borrowings with similar maturities. The fair values (level 2) of senior term financing and subordinated term financing at 31st December 2015 approximate their respective book values.
37.5 Other on-balance sheet items The fair values of foreign exchange and derivative financial instruments are based on market prices, discounted cash flow
techniques or option pricing models as appropriate. The fair values of all other on-balance sheet financial assets and liabilities approximate their respective book values due to their short-term nature.
Notes to the consolidated financial statements (continued)For the year ended 31st December 2015

Annual Report 2015 101
37. Fair value of financial instruments (continued)
37.6 Credit-related contingent items There was no material fair value excess or shortfall in respect of credit-related off-balance sheet financial instruments, which
include commitments to extend credit, standby letters of credit and guarantees, as the related future income streams reflected contractual fees and commissions actually charged at the balance sheet date for agreements of similar credit standing and maturity. Specific provisions made in respect of individual transactions where a potential for loss has been identified are included in provisions for the impairment of loans and advances.
37.7 Valuation basis The valuation basis for financial assets and financial liabilities carried at fair value was as follows:-
Quoted prices(level 1)
US$ millions
Valuation based on observable
market data (level 2)
US$ millions
Other valuation
techniques (level 3)
US$ millions
At 31st December 2015
Financial assets:-
Trading securities 57.8 1.3 13.1
Investment securities - equities 172.4 - 99.5
Derivative financial instruments - 172.6 -
Financial liabilities:-
Derivative financial instruments - 176.8 -
At 31st December 2014
Financial assets:-
Trading securities 71.1 1.6 -
Investment securities - equities 183.5 - 124.1
Derivative financial instruments - 130.0 -
Financial liabilities:-
Derivative financial instruments - 131.0 -
Quoted prices include prices obtained from lead managers, brokers and dealers. Investment securities valued based on other valuation techniques comprise private equity investments that have been valued based on price / earnings and price / book ratios for similar entities, discounted cash flow techniques or other valuation methodologies.
During the year ended 31st December 2015, the value of investment securities whose measurement was determined by other valuation techniques (level 3 measurement) decreased by US$24.6 million (2014: decrease of US$8.5 million). The decrease principally comprised changes in assigned valuations as recognised in other comprehensive income. A transfer into level 3 measurement classification was made during the year on purchase of a debt security of US$ 13.1 million. No transfers out of the level 3 measurement classification occurred during the years ended 31st December 2015 and 31st December 2014. Similarly, no transfers between level 1 and level 2 measurement classifications were made during the years ended 31st December 2015 and 31st December 2014.
Sensitivity of the movement in the fair value of financial instruments in the level 3 category is assessed as not significant to other comprehensive income or total equity.
Notes to the consolidated financial statements (continued)For the year ended 31st December 2015

GIB | Celebrating 40 years
102 Annual Report 2015
38. Earnings per share Basic earnings per share are calculated by dividing the net income attributable to the shareholders by the weighted average
number of shares in issue during the year.
2015 2014
Net income (US$ millions) 90.4 85.6
Weighted average number of shares in issue (millions) 2,500 2,500
Basic earnings per share (US$) 0.04 0.03
The diluted earnings per share is equivalent to the basic earnings per share set out above. 39. Principal subsidiaries The principal subsidiary companies were as follows:-
Principal activities Country of incorporation
Gulf International Bank (UK) Limited Asset management United Kingdom
GIB Capital L.L.C. Investment banking Kingdom of Saudi Arabia
The Group’s ownership interest in the principal subsidiary companies was 100 per cent for the years ended 31st December 2015 and 31st December 2014.
40. Average consolidated statement of financial position The average consolidated statement of financial position was as follows:-
31.12.15US$ millions
31.12.14US$ millions
ASSETS
Cash and other liquid assets 3,366.1 2,210.4
Securities purchased under agreements to resell 1,631.9 2,645.6
Placements 4,766.6 5,395.6
Trading securities 70.7 60.3
Investment securities 4,105.5 3,722.9
Loans and advances 8,798.8 8,205.4
Other assets 486.4 414.7
Total assets 23,226.0 22,654.9
LIABILITIES
Deposits from banks 1,616.3 1,420.5
Deposits from customers 14,522.5 14,398.4
Securities sold under agreements to repurchase 1,345.8 729.8
Other liabilities 399.3 344.0
Senior term financing 2,645.0 2,960.1
Subordinated term financing 286.6 477.8
Total liabilities 20,815.5 20,330.6
Total equity 2,410.5 2,324.3
Total liabilities & equity 23,226.0 22,654.9
Notes to the consolidated financial statements (continued)For the year ended 31st December 2015

Annual Report 2015 103
Table of contents
Executive summary.…....……………………………………………………………………………. .............104
1. The Basel 3 framework .........................................................................................................................1051.1 Pillar 1 ......................................................................................................................................................1051.2 Pillar 2 ......................................................................................................................................................1061.3 Pillar 3 ......................................................................................................................................................106
2. Group structure and overall risk and capital management ..............................................................1072.1 Group structure ........................................................................................................................................1072.2 Risk and capital management ..................................................................................................................1072.3 Risk types ................................................................................................................................................1082.4 Risk in Pillar 1 ...........................................................................................................................................1082.5 Risk in Pillar 2 ...........................................................................................................................................1112.6 Monitoring and reporting ..........................................................................................................................112
3. Regulatory capital requirements and the capital base .....................................................................1133.1 Capital requirements for credit risk ...........................................................................................................1133.2 Capital requirements for market risk .........................................................................................................1133.3 Capital requirements for operational risk ...................................................................................................1143.4 Capital base .............................................................................................................................................114
4. Credit risk – Pillar 3 disclosures ..........................................................................................................1144.1 Definition of exposure classes ..................................................................................................................1144.2 External rating agencies ...........................................................................................................................1154.3 Credit risk presentation under Basel 3 ......................................................................................................1164.4 Credit exposure ........................................................................................................................................1164.5 Impaired credit facilities and provisions for impairment .............................................................................1214.6 Past due facilities .....................................................................................................................................122
5. Market risk – Pillar 3 disclosures ........................................................................................................1235.1 Market risk ...............................................................................................................................................1235.2 VaR model ...............................................................................................................................................1245.3 Sensitivity analysis ....................................................................................................................................126
6. Operational risk – Pillar 3 disclosures .................................................................................................1266.1 Operational risk ........................................................................................................................................126
7. Off-balance sheet exposure and securitisations ...............................................................................1267.1 Credit-related contingent items ................................................................................................................1277.2 Derivative and foreign exchange instruments ............................................................................................1277.3 Counterparty credit risk ............................................................................................................................1287.4 Securitisations ..........................................................................................................................................129
8. Internal capital including other risk types ..........................................................................................1298.1 Economic capital model ...........................................................................................................................1308.2 Other risk types ........................................................................................................................................131
9. Capital adequacy ratios and other issues ..........................................................................................1349.1 Capital adequacy ratios ............................................................................................................................1349.2 ICAAP considerations ..............................................................................................................................135
10. Glossary of abbreviations ....................................................................................................................136
Risk management and capital adequacy report

GIB | Celebrating 40 years
104 Annual Report 2015
Risk management and capital adequacy report31st December 2015
Executive summaryThe Central Bank of Bahrain (CBB) Basel 3 guidelines prescribe the capital adequacy framework for banks incorporated in the Kingdom of Bahrain. GIB (the Group) adopted Basel 3 from 1st January 2015 as required by the CBB. The Basel 3 framework revises the definition of regulatory capital and introduces certain new liquidity and funding ratios.
This Risk Management and Capital Adequacy report encompasses the Pillar 3 disclosure requirements prescribed by the CBB based on the Basel Committee’s Pillar 3 guidelines. The report contains a description of GIB’s risk management and capital adequacy policies and practices, including detailed information on the capital adequacy process.
For regulatory purposes, GIB has adopted the standardised approach for credit risk. GIB uses the internal models approach for market risk and the standardised approach for determining the capital requirement for operational risk.
The disclosed tier 1 and total capital adequacy ratios comply with the minimum capital requirements under the CBB’s Basel 3 framework.
GIB’s total risk-weighted assets at 31st December 2015 amounted to US$14,376.9 million. Credit risk accounted for 95.1 per cent, market risk 0.9 per cent and operational risk 4.0 per cent of the total risk-weighted assets. Tier 1 and total regulatory capital were US$2,418.0 million and US$2,555.7 million respectively.
At 31st December 2015, GIB’s tier 1 and total capital adequacy ratios were 16.8 per cent and 17.8 per cent respectively. GIB aims to maintain a tier 1 capital adequacy ratio above 10.5 per cent and a total capital adequacy ratio in excess of 14.0 per cent.
GIB views the Pillar 3 disclosures as an important contribution to increased risk transparency within the banking industry, and particularly important during market conditions characterised by high uncertainty. In this regard, GIB has provided more disclosure in this report than is required in accordance with the CBB’s Pillar 3 guidelines in order to provide the level of transparency that is believed to be appropriate and relevant to the Group’s various stakeholders and market participants.
All figures presented in this report are as at 31st December 2015 unless otherwise stated.

Annual Report 2015 105
Risk management and capital adequacy report (continued)31st December 2015
1. The Basel 3 framework The CBB’s Basel 3 framework is based on three pillars, consistent with the Basel 3 framework developed by the Basel Committee,
as follows:-
- Pillar 1: the calculation of the risk-weighted amounts (RWAs) and capital requirement. - Pillar 2: the supervisory review process, including the Internal Capital Adequacy Assessment Process (ICAAP). - Pillar 3: the disclosure of risk management and capital adequacy information.
1.1 Pillar 1 Pillar 1 prescribes the basis for the calculation of the regulatory capital adequacy ratio. Pillar 1 sets out the definition and
calculations of the RWAs, and the derivation of the regulatory capital base. The capital adequacy ratio is calculated by dividing the regulatory capital base by the total RWAs.
With the introduction of Pillar 2, the CBB will implement a minimum ratio threshold to be determined for each institution individually, as described in more detail in the Pillar 2 section of this report. As at 31st December 2015, and pending the finalisation of the CBB’s Pillar 2 guidelines, all banks incorporated in Bahrain are required to maintain a minimum capital adequacy ratio of 12.5 per cent and a tier 1 ratio of 10.5 per cent.
In the event that the capital adequacy ratio falls below 12.5 per cent, additional prudential reporting requirements apply and a formal action plan setting out the measures to be taken to restore the ratio above the target level is to be formulated and submitted to the CBB.
The table below summarises the approaches available for calculating RWAs for each risk type in accordance with the CBB’s Basel 3 capital adequacy framework:-
Approaches for determining regulatory capital requirements
Credit risk Market risk Operational risk
Standardised approach Standardised approach Basic indicator approach
Internal models approach Standardised approach
The approach applied by GIB for each risk type is as follows:-
a) Credit risk For regulatory reporting purposes, GIB applies the standardised approach for credit risk.
The RWAs are determined by multiplying the credit exposure by a risk weight factor dependent on the type of counterparty and the counterparty’s external rating, where available.
b) Market risk For the regulatory market risk capital requirement, GIB applies the internal models approach based on a Value-at-Risk (VaR)
model. The use of the internal models approach for the calculation of regulatory market risk capital has been approved by the CBB.
c) Operational risk Under the CBB’s Basel 3 capital adequacy framework, all banks incorporated in Bahrain are required to apply the basic indicator
approach for operational risk unless approval is granted by the CBB to use the standardised approach. The CBB’s Basel 3 guidelines do not currently permit the use of the advanced measurement approach (AMA) for operational risk. The standardised approach for the calculation of regulatory operational risk capital has been approved by the CBB.
Under the standardised approach, the regulatory capital requirement is calculated based on a range of beta coefficients, ranging from 12 to 18 per cent, applied to the average gross income for the preceding three financial years for each of eight predefined business lines.

GIB | Celebrating 40 years
106 Annual Report 2015
1. The Basel 3 framework (continued)
1.2 Pillar 2 Pillar 2 defines the process of supervisory review of an institution’s risk management framework and, ultimately, its capital
adequacy.
Under the CBB’s Pillar 2 guidelines, each bank is to be individually assessed by the CBB and an individual minimum capital adequacy ratio is to be determined for each bank. The CBB is yet to undertake the assessment exercises, which will allow their setting of higher minimum capital ratios based on the CBB’s assessment of the financial strength and risk management practices of the institution. Currently, pending finalisation of the assessment process, all banks incorporated in Bahrain are required to maintain a 12.5 per cent minimum capital adequacy ratio and a tier 1 ratio of 10.5 per cent.
Pillar 2 comprises two processes:-
- an Internal Capital Adequacy Assessment Process (ICAAP), and - a supervisory review and evaluation process.
The ICAAP incorporates a review and evaluation of risk management and capital relative to the risks to which the bank is exposed. GIB’s ICAAP has been developed around its economic capital framework which is designed to ensure that the Group has sufficient capital resources available to meet regulatory and internal capital requirements, even during periods of economic or financial stress. The ICAAP addresses all components of GIB’s risk management, from the daily management of more material risks to the strategic capital management of the Group.
The supervisory review and evaluation process represents the CBB’s review of the Group’s capital management and an assessment of internal controls and corporate governance. The supervisory review and evaluation process is designed to ensure that institutions identify their material risks and allocate adequate capital, and employ sufficient management processes to support such risks.
The supervisory review and evaluation process also encourages institutions to develop and apply enhanced risk management techniques for the measurement and monitoring of risks in addition to the credit, market and operational risks addressed in the core Pillar 1 framework. Other risk types which are not covered by the minimum capital requirements in Pillar 1 include liquidity risk, interest rate risk in the banking book, business risk and concentration risk. These are covered either by capital, or risk management and mitigation processes under Pillar 2.
1.3 Pillar 3 In the CBB’s Basel 3 framework, the third pillar prescribes how, when, and at what level information should be disclosed about
an institution’s risk management and capital adequacy practices.
The disclosures comprise detailed qualitative and quantitative information. The purpose of the Pillar 3 disclosure requirements is to complement the first two pillars and the associated supervisory review process. The disclosures are designed to enable stakeholders and market participants to assess an institution’s risk appetite and risk exposures and to encourage all banks, via market pressures, to move toward more advanced forms of risk management.
Under the current regulations, partial disclosure consisting mainly of quantitative analysis is required during half year reporting, whereas fuller disclosure is required to coincide with the financial year end reporting.
In this report, GIB’s disclosures are beyond the minimum regulatory requirements and provide disclosure of the risks to which it is exposed, both on- and off-balance sheet. The disclosures in this report are in addition to the disclosures set out in the consolidated financial statements presented in accordance with International Financial Reporting Standards (IFRS).
Risk management and capital adequacy report (continued)31st December 2015

Annual Report 2015 107
2. Group structure and overall risk and capital management This section sets out the consolidation principles and the capital base of GIB as calculated in accordance with the Pillar 1
guidelines, and describes the principles and policies applied in the management and control of risk and capital.
2.1 Group structure The Group’s financial statements are prepared and published on a full consolidation basis, with all subsidiaries being consolidated
in accordance with IFRS. For capital adequacy purposes, all subsidiaries are included within the Gulf International Bank B.S.C. Group structure. However, the CBB’s capital adequacy methodology accommodates both normal and aggregation forms of consolidation.
Under the CBB capital adequacy framework, subsidiaries reporting under a Basel 3 framework in other regulatory jurisdictions may, at the bank’s discretion, be consolidated based on that jurisdiction’s Basel 3 framework, rather than based on the CBB’s guidelines. Under this aggregation consolidation methodology, the risk-weighted assets of subsidiaries are consolidated with those of the rest of the Group based on the guidelines of their respective regulator to determine the Group’s total risk-weighted assets.
GIB’s principal subsidiary, Gulf International Bank (UK) Limited (GIBUK), is regulated by the Financial Conduct Authority (FCA) and the Prudential Regulation Authority (PRA) of the United Kingdom, and has calculated its risk-weighted assets in accordance with the PRA’s guidelines.
The principal subsidiaries and basis of consolidation for capital adequacy purposes are as follows:-
Subsidiary Domicile Ownership Consolidation basis
Gulf International Bank (UK) Limited United Kingdom 100% Aggregation
GIB Capital LLC Saudi Arabia 100% Full Consolidation
No investments in subsidiaries are treated as a deduction from the Group’s regulatory capital.
2.2 Risk and capital management GIB maintains a prudent and disciplined approach to risk taking by upholding a comprehensive set of risk management policies,
processes and limits, employing professionally qualified people with the appropriate skills, investing in technology and training, and actively promoting a culture of sound risk management at all levels. A key tenet of this culture is the clear segregation of duties and reporting lines between personnel transacting business and personnel processing that business. The Group’s risk management is underpinned by its ability to identify, measure, aggregate and manage the different types of risk it faces.
The Board of Directors has created from among its members a Board Risk Policy Committee to review the Group’s risk taking activities and report to the Board in this regard. The Board has the ultimate responsibility for setting the overall risk parameters and tolerances within which the Group conducts its activities, including responsibility for setting the capital ratio targets. The Board reviews the Group’s overall risk profile and significant risk exposures as well as the Group’s major risk policies, processes and controls.
The Management Committee, chaired by the Chief Executive Officer (CEO), has the primary responsibility for sanctioning risk taking policies and activities within the tolerances defined by the Board. The Group Risk Committee assists the Management Committee in performing its risk related functions.
The Group Risk Committee, under the chairmanship of the Chief Risk Officer (CRO) and comprising the Group’s most senior risk professionals, provides a forum for the review and approval of new products, risk measurement methodologies and risk control processes. The Group Risk Committee also reviews all risk policies and limits that require approval by the Management Committee. The Assets and Liabilities Committee (ALCO), chaired by the Chief Financial Officer (CFO), provides a forum for the review of asset and liability activities within GIB. It co-ordinates the asset and liability functions and serves as a link between the funding sources and usage in the different business areas.
From a control perspective, the process of risk management is facilitated through a set of independent functions, which report directly to senior management. These functions include Credit Risk, Market Risk, Operational Risk, Financial Control and Internal Audit. This multi-faceted approach aids the effective management of risk by identifying, measuring and monitoring risks from a variety of perspectives.
Risk management and capital adequacy report (continued)31st December 2015

GIB | Celebrating 40 years
108 Annual Report 2015
2. Group structure and overall risk and capital management (continued)
2.2 Risk and capital management (continued) Internal Audit is responsible for carrying out a risk-based programme of work designed to provide assurance that assets are
being safeguarded. This involves ensuring that controls are in place and working effectively in accordance with Group policies and procedures as well as with laws and regulations. The work carried out by Internal Audit includes providing assurance on the effectiveness of the risk management functions, as well as that of controls operated by the business units. The Board Audit Committee approves the annual audit plan and also receives regular reports of the results of audit work.
The Group’s policy is to maintain a strong capital base so as to maintain investor, creditor and market confidence and to sustain future business development. The Group manages its capital structure and makes adjustments to the structure taking account of changes in economic conditions and strategic business plans. The capital structure may be adjusted through the dividend payout or the issue of new shares.
The CFO is responsible for the capital planning process. Capital planning includes capital adequacy reporting, economic capital and parameter estimation, i.e. probability of default (PD) and loss given default (LGD) estimates, used for the calculation of economic capital. The CFO is also responsible for the balance sheet management framework.
The governance structure for risk and capital management is set out in the table below:-
Board of Directors
Board Audit Committee Board Risk Policy Committee
Chief Executive Officer
Management Committee(Chairman: CEO)
Group Risk Committee(Chairman: CRO)
Assets and Liabilities Committee(Chairman: CFO)
The risk, liquidity and capital management responsibilities are set out in the table below:-
Chief Executive Officer
Chief Financial Officer(CFO)
Chief Risk Officer(CRO)
Balance sheet management frameworkCapital management framework
Risk management framework and policiesGroup credit controlCredit risk Market riskOperational riskLiquidity risk
2.3 Risk types The major risks associated with the Group’s business activities are credit, market, operational and liquidity risk. These risks
together with a commentary on the way in which the risks are managed and controlled are set out in the following sections, based on the Basel 3 pillar in which the risks are addressed.
2.4 Risk in Pillar 1 Pillar 1, which forms the basis for the calculation of the regulatory capital requirement, addresses three specific risk types: credit,
market and operational risk.
Risk management and capital adequacy report (continued)31st December 2015

Annual Report 2015 109
2. Group structure and overall risk and capital management (continued)
2.4 Risk in Pillar 1 (continued)
a) Credit risk Credit risk is the risk that a customer, counterparty or an issuer of securities or other financial instruments fails to perform under
its contractual payment obligations thus causing the Group to suffer a loss in terms of cash flow or market value. Credit risk is the predominant risk type faced by the Group in its banking, investment and treasury activities, both on- and off-balance sheet. Where appropriate, the Group seeks to minimise its credit exposure using a variety of techniques including, but not limited to, the following:-
- entering netting agreements with counterparties that permit the offsetting of receivables and payables - obtaining collateral - seeking third party guarantees of the counterparty’s obligations - imposing restrictions and covenants on borrowers
Credit risk is actively managed and rigorously monitored in accordance with well-defined credit policies and procedures. Prior to the approval of a credit proposal, a detailed credit risk assessment is undertaken which includes an analysis of the obligor’s financial condition, market position, business environment and quality of management. The risk assessment generates an internal credit risk rating for each counterparty, which affects the credit approval decision and the terms and conditions of the transaction. For cross-border transactions, an analysis of country risk is also conducted. The credit decision for an individual counterparty is based on the aggregate Group exposure to that counterparty and all its related entities. Groupwide credit limit setting and approval authorisation requirements are conducted within Board approved guidelines, and the measurement, monitoring and control of credit exposures are done on a Groupwide basis in a consistent manner. Overall exposures are evaluated to ensure broad diversification of credit risk. Potential concentration risks by product, industry, single obligor, credit risk rating and geography are regularly assessed with a view to improving overall portfolio diversification. Established limits and actual levels of exposure are regularly reviewed by the Chief Risk Officer (CRO), Chief Credit Officer (CCO) and other members of senior management. All credit exposures are reviewed at least once a year. Credit policies and procedures are designed to identify, at an early stage, exposures which require more detailed monitoring and review. The credit risk associated with foreign exchange and derivative instruments is assessed in a manner similar to that associated with on-balance sheet activities. The Group principally utilises derivative transactions to facilitate customer transactions and for the management of interest and foreign exchange risks associated with the Group’s longer-term lending, borrowing and investment activities. Unlike on-balance sheet products, where the principal amount and interest generally represent the maximum credit exposure, the notional amount relating to a foreign exchange or derivative transaction typically exceeds the credit exposure by a substantial margin. The measure of credit exposure for foreign exchange and derivative instruments is therefore more appropriately considered to be the replacement cost at current market rates plus an add-on amount commensurate with the position’s size, volatility and remaining life. Derivative contracts may also carry legal risk; the Group seeks to minimise these risks by the use of standard contract agreements.
b) Market risk Market risk is the risk of loss of value of a financial instrument or a portfolio of financial instruments as a result of adverse changes
in market prices and rates, and market conditions such as liquidity. Market risk arises from the Group’s trading, asset and liability management, and investment activities.
The categories of market risk to which the Group is exposed are as follows:-
Interest rate risk results from exposure to changes in the level, slope, curvature and volatility of interest rates and credit spreads. The credit spread risk is the risk that the interest yield for a security will increase, with a reduction in the security price, relative to benchmark yields as a result of the general market movements for that rating and class of security. Interest rate risk is the principal market risk faced by the Group and arises from the Group’s investment activities in debt securities, asset and liability management, and the trading of debt and off-balance sheet derivative instruments.
Foreign exchange risk results from exposure to changes in the price and volatility of currency spot and forward rates. The principal foreign exchange risk arises from the Group’s foreign exchange forward and derivative trading activities.
Equity risk arises from exposures to changes in the price and volatility of individual equities or equity indices.
Risk management and capital adequacy report (continued)31st December 2015

GIB | Celebrating 40 years
110 Annual Report 2015
2. Group structure and overall risk and capital management (continued)
2.4 Risk in Pillar 1 (continued)
b) Market risk (continued) The Group seeks to manage exposure to market risk through the diversification of exposures across dissimilar markets and the
establishment of hedges in related securities or off-balance sheet derivative instruments. To manage the Group’s exposures, in addition to the exercise of business judgement and management experience, the Group utilises limit structures including those relating to positions, portfolios, maturities and maximum allowable losses.
A key element in the Group’s market risk management framework is the estimation of potential future losses that may arise from adverse market movements. The Group utilises Value-at-Risk (VaR) to estimate such losses. The VaR is derived from quantitative models that use statistical and simulation methods that take account of all market rates and prices that may cause a change in a position’s value. These include interest rates, foreign exchange rates and equity prices, their respective volatilities and the correlations between these variables. The Group’s VaR is calculated on a Monte Carlo simulation basis using historical volatilities and correlations to generate a profit and loss distribution from several thousand scenarios.
The VaR takes account of potential diversification benefits of different positions both within and across different portfolios. Consistent with general market practice, VaR is computed for all financial instruments for which there are readily available daily prices or suitable proxies. VaR is viewed as an effective risk management tool and a valuable addition to the non-statistically based limit structure. It permits a consistent and uniform measurement of market risk across all applicable products and activities. Exposures are monitored against a range of limits both by risk category and portfolio and are regularly reported to and reviewed by senior management and the Board of Directors.
An inherent limitation of VaR is that past market movements may not provide an accurate prediction of future market losses. Historic analyses of market movements have shown that extreme market movements (i.e. beyond the 99 per cent confidence level) occur more frequently than VaR models predict. Stress tests are regularly conducted to estimate the potential economic losses in such abnormal markets. Stress testing combined with VaR provides a more comprehensive picture of market risk. The Group regularly performs stress tests that are constructed around changes in market rates and prices resulting from pre-defined market stress scenarios, including both historical and hypothetical market events. Historical scenarios include the 1997 Asian crisis, the 1998 Russian crisis, the events of 9/11 and the 2008 credit crisis. In addition, the Group performs stress testing based on internally developed hypothetical market stress scenarios. Stress testing is performed for all material market risk portfolios.
c) Operational risk Operational risk is the risk of loss arising from inadequate or failed internal processes, people and systems or from external
events, whether intentional, unintentional or natural. It is an inherent risk faced by all businesses and covers a large number of potential operational risk events including business interruption and systems failures, internal and external fraud, employment practices and workplace safety, customer and business practices, transaction execution and process management, and damage to physical assets.
Whilst operational risk cannot be eliminated in its entirety, the Group endeavours to minimise the risk by ensuring that a strong control infrastructure is in place throughout the organisation. The various procedures and processes used to manage operational risk include effective staff training, appropriate controls to safeguard assets and records, regular reconciliation of accounts and transactions, close monitoring of risk limits, segregation of duties, and financial management and reporting. In addition, other control strategies, including business continuity planning and insurance, are in place to complement the control processes, as applicable.
The Group has an independent operational risk function. As part of the Group’s Operational Risk Management Framework (ORMF), comprehensive risk assessments are conducted, which identify operational risks inherent in the Group’s activities, processes and systems. The controls in place to mitigate these risks are also reviewed, and enhanced if necessary.
Risk management and capital adequacy report (continued)31st December 2015

Annual Report 2015 111
2. Group structure and overall risk and capital management (continued)
2.5 Risk in Pillar 2 Other risk types are measured and assessed in Pillar 2. GIB measures and manages these risk types although they are not
included in the calculation of the regulatory capital adequacy ratio. Most of the Pillar 2 risks are included in GIB’s calculation of internal economic capital. Pillar 2 risk types include liquidity risk, interest rate risk in the banking book, business risk and concentration risk.
a) Liquidity risk Liquidity risk is the risk that sufficient funds are not available to meet the Group’s financial obligations on a punctual basis as they
fall due. The risk arises from the timing differences between the maturity profiles of the Group’s assets and liabilities. It includes the risk of losses arising from the following:-
- forced sale of assets at below normal market prices - raising of deposits or borrowing funds at excessive rates - the investment of surplus funds at below market rates
Liquidity management policies are designed to ensure that funds are available at all times to meet the funding requirements of the Group, even in adverse conditions. In normal conditions, the objective is to ensure that there are sufficient funds available not only to meet current financial commitments but also to facilitate business expansion. These objectives are met through the application of prudent liquidity controls. These controls provide access to funds without undue exposure to increased costs from the liquidation of assets or the aggressive bidding for deposits.
The Group’s liquidity controls ensure that, over the short-term, the future profile of cash flows from maturing assets is adequately matched to the maturity of liabilities. Liquidity controls also provide for the maintenance of a stock of liquid and readily realisable assets and a diversified deposit base in terms of both maturities and range of depositors.
The management of liquidity and funding is primarily conducted in the Group’s individual geographic entities within approved limits. The limits ensure that contractual net cash flows occurring over the following 30 day period do not exceed the eligible stock of available liquid resources.
It is the Group’s general policy that each geographic entity should be self-sufficient in relation to funding its own operations.
The Group’s liquidity management policies include the following:-
- the monitoring of (i) future contractual cash flows against approved limits, and (ii) the level of liquid resources available in a stress event
- the monitoring of balance sheet liquidity ratios - the monitoring of the sources of funding in order to ensure that funding is derived from a diversified range of sources - the monitoring of depositor concentrations in order to avoid undue reliance on individual depositors - the maintenance of a satisfactory level of term financing - the maintenance of appropriate standby funding arrangements; and - the maintenance of liquidity and funding contingency plans. These plans identify early indicators of stress conditions and
prescribe the actions to be taken in the event of a systemic or other crisis, while minimising adverse long-term implications for the Group’s business activities.
b) Interest rate risk in the banking book Structural interest rate risk arises in the Group’s core balance sheet as a result of mismatches in the repricing of interest rate
sensitive financial assets and liabilities. The associated interest rate risk is managed within VaR limits and through the use of models to evaluate the sensitivity of earnings to movements in interest rates.
c) Business risk Business risk represents the earnings volatility inherent in all businesses due to the uncertainty of revenues and costs associated
with changes in the economic and competitive environment. Business risk is evaluated based on the observed volatility in historical profits and losses.
Risk management and capital adequacy report (continued)31st December 2015

GIB | Celebrating 40 years
112 Annual Report 2015
2. Group structure and overall risk and capital management (continued)
2.5 Risk in Pillar 2 (continued)
d) Concentration risk Concentration risk is the risk related to the degree of diversification in the credit portfolio, i.e. the risk inherent in doing business
with large customers or not being equally exposed across industries and regions.
Concentration risk is captured in GIB’s economic capital framework through the use of a credit risk portfolio model which considers single-name concentrations in the credit portfolio. Economic capital add-ons are applied where counterparty exposures exceed specified thresholds.
Potential concentration risks by product, industry, single obligor, and geography are regularly assessed with a view to improving overall portfolio diversification. Established limits and actual levels of exposure are regularly reviewed by senior management and the Board of Directors.
2.6 Monitoring and reporting The monitoring and reporting of risk is conducted on a daily basis for market and liquidity risk, and on a monthly or quarterly
basis for credit and operational risk.
Risk reporting is regularly made to senior management and the Board of Directors. The Board of Directors receives internal risk reports covering market, credit, operational and liquidity risks.
Capital management, including regulatory and internal economic capital ratios, is reported to senior management and the Board of Directors on a monthly basis.
3. Regulatory capital requirements and the capital base This section describes the Group’s regulatory capital requirements and capital base.
The composition of the total regulatory capital requirement was as follows:-
3.1 Capital requirements for credit risk For regulatory reporting purposes, GIB calculates the capital requirements for credit risk based on the standardised approach.
Under the standardised approach, on- and off-balance sheet credit exposures are assigned to exposure categories based on the type of counterparty or underlying exposure. The exposure categories are referred to in the CBB’s Basel 3 capital adequacy framework as standard portfolios. The primary standard portfolios are claims on sovereigns, claims on banks and claims on corporates. Following the assignment of exposures to the relevant standard portfolios, the RWAs are derived based on prescribed risk-weightings. Under the standardised approach, the risk-weightings are provided by the CBB and are determined based on the counterparty’s external credit rating. The external credit ratings are derived from eligible external rating agencies approved by the CBB. GIB uses ratings assigned by Standard & Poor’s, Moody’s and Fitch.
Credit risk capital
Operational risk capital
Market risk capital
0.9%4.0%
95.1%
Risk management and capital adequacy report (continued)31st December 2015

Annual Report 2015 113
3. Regulatory capital requirements and the capital base (continued)
3.1 Capital requirements for credit risk (continued) An overview of the exposures, RWAs and capital requirements for credit risk analysed by standard portfolio is presented in the
table below:-
Rated exposure
US$ millions
Unrated exposure
US$ millions
Total exposure
US$ millions
Average risk weight
%RWA
US$ millions
Capital requirement
US$ millions
Sovereigns 5,487.1 3.7 5,490.8 0% 8.0 1.0
PSEs 155.5 0.5 156.0 20% 31.6 4.0
Banks 8,781.8 108.5 8,890.3 23% 2,039.7 255.0
Corporates 1,046.3 10,465.6 11,511.9 95% 10,933.7 1,366.7
Equities - 290.2 290.2 122% 353.5 44.2
Past due loans - 26.4 26.4 103% 27.2 3.4
Other assets 23.2 269.1 292.3 93% 273.1 34.1
15,493.9 11,164.0 26,657.9 51% 13,666.8 1,708.4
Exposures are stated after taking account of credit risk mitigants where applicable. The treatment of credit risk mitigation is explained in more detail in section 4.4(g) of this report.
The unrated exposure to banks principally represents unrated subordinated loans to rated banks.
The definitions of each standard portfolio and the related RWA requirements are set out in section 4 of this report.
3.2 Capital requirements for market risk GIB uses a Value-at-Risk (VaR) model to calculate the regulatory capital requirements relating to general market risk.
The VaR calculated by the internal model is subject to a multiplication factor determined by the CBB. GIB’s multiplication factor has been set at the regulatory minimum of 3.0 by the CBB.
Prescribed additions in respect of specific risk are made to general market risk. The resultant measure of market risk is multiplied by 12.5, to give market risk-weighted exposure on a basis consistent with credit risk-weighted exposure.
The RWAs and capital requirements for market risk are presented in the table below:-
RWAUS$ millions
Capital requirement
US$ millions
Interest rate risk 3.8 0.5
Equities 74.6 9.3
Foreign exchange risk 7.5 0.9
Total general market risk 85.9 10.7
Total specific market risk 53.9 6.7
139.8 17.4
From April 2012, the general market risk calculation includes the addition of stressed VaR in accordance with CBB guidelines.
Risk management and capital adequacy report (continued)31st December 2015

GIB | Celebrating 40 years
114 Annual Report 2015
3. Regulatory capital requirements and the capital base (continued)
3.3 Capital requirements for operational risk For regulatory reporting purposes, the capital requirement for operational risk is calculated in accordance with the standardised
approach. Under this approach, the Group’s average gross income over the preceding three financial years is multiplied by a range of beta coefficients. The beta coefficients are determined based on the business line generating the gross income and are prescribed in the CBB’s Basel 3 capital adequacy framework and range from 12 to 18 per cent.
The capital requirement for operational risk at 31st December 2015 amounted to US$70.6 million.
3.4 Capital base The regulatory capital base is set out in the table below:-
Tier 1US$ millions
Tier 2US$ millions
TotalUS$ millions
Share capital 2,500.0 - 2,500.0
Share premium 7.6 - 7.6
Compulsory reserve 220.7 - 220.7
Voluntary reserve 158.2 - 158.2
Retained earnings (448.8) - (448.8)
Unrealised losses from fair valuing equity investments (6.7) - (6.7)
Collective impairment provisions - 137.7 137.7
Regulatory capital deduction:
Defined benefit pension fund asset (13.0) - (13.0)
Tier 1 and tier 2 capital base 2,418.0 137.7 2,555.7
Tier 1 capital is defined as capital of the same or close to the character of paid up capital and comprises share capital, share premium, retained earnings and eligible reserves. Eligible reserves exclude revaluation gains and losses arising on the remeasurement to fair value of derivative cash flow hedging transactions, although include unrealised gains and losses arising on the remeasurement to fair value of equity investment securities classified as fair value through other comprehensive income (FVTOCI). Regulatory capital deductions are applied to tier 1 and tier 2 capital with respect to investment exposures for entities where the Group does not own more than 10 per cent of the issued share capital of the entity, and to tier 1 capital to exclude any outstanding cash flow hedge reserves.
Tier 2 capital comprises qualifying subordinated term finance and collective impairment provisions, after applicable haircuts and ceiling limitations.
The CBB applies various limits to elements of the regulatory capital base. The amount of innovative tier 1 securities cannot exceed 15 per cent of total tier 1 capital; qualifying tier 2 capital cannot exceed tier 1 capital; and qualifying subordinated term finance cannot exceed 50 per cent of tier 1 capital. There are also restrictions on the amount of collective impairment provisions that may be included as part of tier 2 capital.
There are no impediments on the transfer of funds or regulatory capital within the Group other than restrictions over transfers of statutory deposits with central banks and safeguards to ensure minimum regulatory capital requirements are met for subsidiary companies.
4. Credit risk – Pillar 3 disclosures This section describes the Group’s exposure to credit risk and provides detailed disclosures on credit risk in accordance with
the CBB’s Basel 3 framework in relation to Pillar 3 disclosure requirements.
4.1 Definition of exposure classes GIB has a diversified on- and off-balance sheet credit portfolio, the exposures of which are divided into the counterparty
exposure classes defined by the CBB’s Basel 3 capital adequacy framework for the standardised approach for credit risk. A high-level description of the counterparty exposure classes, referred to as standard portfolios in the CBB’s Basel 3 capital adequacy framework, and the generic treatments, i.e. the risk weights to be used to derive the RWAs, are as follows:-
Risk management and capital adequacy report (continued)31st December 2015

Annual Report 2015 115
4. Credit risk – Pillar 3 disclosures (continued)
4.1 Definition of exposure classes (continued)
Sovereigns portfolio The sovereigns portfolio comprises exposures to governments and their respective central banks. The risk weights are 0 per
cent for exposures in the relevant domestic currency, or in any currency for exposures to GCC governments. Foreign currency claims on other sovereigns are risk-weighted based on their external credit ratings.
Certain multilateral development banks as determined by the CBB may be included in the sovereigns portfolio and treated as exposures with a 0 per cent risk-weighting.
PSE portfolio Public sector entities (PSEs) are risk-weighted according to their external ratings with the exception of Bahrain PSEs, and
domestic currency claims on other PSEs which are assigned a 0 per cent risk weight by their respective country regulator.
Banks portfolio Claims on banks are risk-weighted based on their external credit ratings. A preferential risk weight treatment is available for
qualifying short-term exposures. Short-term exposures are defined as exposures with an original tenor of three months or less.
The Banks portfolio also includes claims on investment firms, which are risk-weighted based on their external credit ratings although without any option for preferential treatment for short-term exposures. A regulatory deduction is applied to investment exposures for entities where the Group does not own more than 10 per cent of the issued share capital of the bank.
Corporates portfolio Claims on corporates are risk-weighted based on their external credit ratings. A 100 per cent risk weight is assigned to unrated
corporate exposures. A preferential risk weight treatment is available for certain corporates owned by the Government of Bahrain, as determined by the CBB, which are assigned a 0 per cent risk weight.
Equities portfolio The equities portfolio comprises equity investments in the banking book, i.e. in the investment securities portfolio and non-
qualifying equities and funds in the trading portfolio. The credit (specific) risk for qualifying equities in the trading book is included in market risk RWAs for regulatory capital adequacy calculation purposes. A regulatory deduction is applied to investment exposures for entities where the Group does not own more than 10 per cent of the issued share capital of the entity.
A 100 per cent risk weight is assigned to listed equities and funds. Unlisted equities and funds are risk-weighted at 150 per cent. Investments in rated funds are risk-weighted according to their external credit rating. Equity investments in securitisations are deducted from the regulatory capital base.
In addition to the standard portfolios, other exposures are assigned to the following exposure classes:-
Past due exposures All past due loan exposures, irrespective of the categorisation of the exposure if it were performing, are classified separately
under the past due exposures asset class. A risk-weighting of either 100 per cent or 150 per cent is applied depending on the level of provision maintained against the loan.
Other assets and holdings of securitisation tranches Cash balances are risk-weighted at 0 per cent, other assets are risk-weighted at 100 per cent. A credit valuation adjustment
(CVA) is applied to applicable derivative exposures.
Securitisation tranches are risk-weighted based on their external credit ratings and tenor. Risk-weightings range from 20 per cent to 1250 per cent.
4.2 External rating agencies GIB uses ratings issued by Standard & Poor’s, Moody’s and Fitch to derive the risk-weightings under the CBB’s Basel 3 capital
adequacy framework. Where ratings vary between rating agencies, the highest rating from the lowest two ratings is used to derive the risk-weightings for regulatory capital adequacy purposes.
Risk management and capital adequacy report (continued)31st December 2015

GIB | Celebrating 40 years
116 Annual Report 2015
4. Credit risk – Pillar 3 disclosures (continued)
4.3 Credit risk presentation under Basel 3 The credit risk exposures presented in this report may differ from the credit risk exposures reported in the consolidated financial
statements. Differences arise due to the application of different methodologies, as illustrated below:-
- Under the CBB’s Basel 3 framework, off-balance sheet exposures are converted into credit exposure equivalents by applying a credit conversion factor (CCF). The off-balance sheet exposure is multiplied by the relevant CCF applicable to the off-balance sheet exposure category. Subsequently, the exposure is treated in accordance with the standard portfolios referred to in section 4.1 of this report in the same manner as on-balance sheet exposures.
- Credit risk exposure reporting under Pillar 3 is frequently reported by standard portfolios based on the type of counterparty. The financial statement presentation is based on asset class rather than the relevant counterparty. For example, a loan to a bank would be classified in the Banks standard portfolio under the capital adequacy framework although is classified in loans and advances in the consolidated financial statements.
- Certain eligible collateral is applied to reduce exposure under the Basel 3 capital adequacy framework, whereas no such collateral netting is applicable in the consolidated financial statements.
- Based on the CBB’s Basel 3 guidelines, certain exposures are either included in, or deducted from, regulatory capital rather than treated as an asset as in the consolidated financial statements.
- Under the CBB’s Basel 3 capital adequacy framework, external rating agency ratings are based on the highest rating from the lowest two ratings, while for internal credit risk management purposes the Group uses the lowest rating.
4.4 Credit exposure
a) Gross credit exposure The gross and average gross exposure to credit risk before applying collateral, guarantees, and other credit enhancements was
as follows:-
Gross credit exposure
US$ millions
Average gross credit
exposureUS$ millions
Balance sheet items:
Cash and other liquid assets 4,309.7 3,366.1
Securities purchased under agreements to resell 1,835.0 1,631.9
Placements 4,402.9 4,766.6
Trading securities 72.2 70.7
Investment securities 3,884.5 4,105.5
Loans and advances 9,161.4 8,798.8
Accrued interest receivable 121.6 112.5
Total on-balance sheet credit exposure 23,787.3 22,852.1
Off-balance sheet items:
Credit-related contingent items 4,462.4 3,982.9
Derivative and foreign exchange instruments 275.0 288.8
Total off-balance sheet credit exposure 4,737.4 4,271.7
Total gross credit exposure 28,524.7 27,123.8
The average gross credit exposure is based on daily averages during the year ended 31st December 2015.
Risk management and capital adequacy report (continued)31st December 2015

Annual Report 2015 117
4. Credit risk – Pillar 3 disclosures (continued)
4.4 Credit exposure (continued)
a) Gross credit exposure (continued) The gross credit exposure for derivative and foreign exchange instruments is the replacement cost (current exposure) representing
the cost of replacing the contracts at current market rates should the counterparty default prior to the settlement date. The gross credit exposure reported in the table above does not include potential future exposure. Further details on the counterparty credit risk relating to off-balance sheet exposures are set out in section 7.3(a) of this report.
b) Credit exposure by geography The classification of credit exposure by geography, based on the location of the counterparty, was as follows:-
Placements, reverse repos & other liquid
assetsUS$ millions
SecuritiesUS$ millions
Loans and advances
US$ millions
Accrued interest
receivableUS$ millions
Off-balance sheet itemsUS$ millions
TotalUS$ millions
GCC 3,768.6 1,784.3 8,357.8 74.7 3,908.3 17,893.7
Other MENA - 0.5 64.9 0.2 72.1 137.7
Europe 6,510.3 1,179.3 193.3 32.7 395.3 8,310.9
North America 220.8 805.0 443.2 10.7 244.3 1,724.0
Asia 47.9 185.9 77.8 3.1 117.4 432.1
Latin America - 1.7 24.4 0.2 - 26.3
10,547.6 3,956.7 9,161.4 121.6 4,737.4 28,524.7
The MENA region comprises the Middle East and North Africa.
c) Credit exposure by industrial sector The classification of credit exposure by industrial sector was as follows:-
Placements, reverse repos & other liquid
assetsUS$ millions
SecuritiesUS$ millions
Loans and advances
US$ millions
Accrued interest
receivableUS$ millions
Off-balance sheet itemsUS$ millions
TotalUS$ millions
Financial services 5,592.2 1,389.5 1,791.1 63.7 632.9 9,469.4
Government 4,955.4 1,429.1 - 9.8 88.0 6,482.3
Energy, oil and petrochemical - 482.5 1,911.2 10.1 956.4 3,360.2
Construction - 21.2 736.2 2.9 2,109.9 2,870.2
Trading and services - 20.0 2,021.0 7.2 298.7 2,346.9
Transportation - 151.6 1,046.2 3.2 197.7 1,398.7
Manufacturing - 19.2 882.9 4.3 204.3 1,110.7
Real estate - 65.1 270.2 4.3 30.1 369.7
Communication - 47.5 263.2 1.0 34.1 345.8
Equity investments - 331.0 - - 3.2 334.2
Other - - 239.4 15.1 182.1 436.6
10,547.6 3,956.7 9,161.4 121.6 4,737.4 28,524.7
Risk management and capital adequacy report (continued)31st December 2015

GIB | Celebrating 40 years
118 Annual Report 2015
4. Credit risk – Pillar 3 disclosures (continued)
4.4 Credit exposure (continued)
d) Credit exposure by internal rating The credit risk profile based on internal credit ratings was as follows:-
Placements, reverse repos & other liquid
assetsUS$ millions
SecuritiesUS$ millions
Loans and advances
US$ millions
Accrued interest
receivableUS$ millions
Off-balance sheet itemsUS$ millions
TotalUS$ millions
Neither past due nor impaired
Rating grades 1 to 4- 10,427.6 3,625.7 5,243.6 104.7 2,336.6 21,738.2
Rating grades 5+ to 5- 120.0 - 3,328.2 15.9 2,314.5 5,778.6
Rating grades 6+ to 6- - - 540.8 1.0 51.0 592.8
Rating grade 7 - - - - 20.3 20.3
Rating grade 9 - - - - 11.8 11.8
Equity investments - 331.0 - - 3.2 334.2
Carrying amount 10,547.6 3,956.7 9,112.6 121.6 4,737.4 28,475.9
Past due but not impaired
Rating grade 7 - - 6.5 - - 6.5
Carrying amount - - 6.5 - - 6.5
Past due and individually impaired
Rating grade 7 - - 0.7 - - 0.7
Rating grade 9 - - 31.5 - - 31.5
Carrying amount - - 32.2 - - 32.2
Individually impaired but not past due
Rating grade 9 - - 10.1 - - 10.1
Carrying amount - - 10.1 - - 10.1
10,547.6 3,956.7 9,161.4 121.6 4,737.4 28,524.7
The analysis is presented prior to the application of credit risk mitigation techniques.
The Group’s internal credit rating system is commented on in more detail in section 8.1 of this report.
Risk management and capital adequacy report (continued)31st December 2015

Annual Report 2015 119
4. Credit risk – Pillar 3 disclosures (continued)
4.4 Credit exposure (continued)
e) Credit exposure by maturity The maturity profile of funded credit exposures based on contractual maturity dates was as follows:-
Placements, reverse repos & other liquid
assetsUS$ millions
SecuritiesUS$ millions
Loans and advances
US$ millions
Accrued interest
receivableUS$ millions
TotalUS$ millions
Within 3 months 8,681.0 174.3 3,424.0 84.6 12,363.9
4 months to 1 year 1,803.7 502.8 2,018.5 36.3 4,361.3
Years 2 to 5 50.0 2,500.2 2,895.7 0.7 5,446.6
Years 6 to 10 - 425.0 645.9 - 1,070.9
Years 11 to 20 - 26.6 177.3 - 203.9
Over 20 years and other 12.9 327.8 - - 340.7
10,547.6 3,956.7 9,161.4 121.6 23,787.3
An analysis of off-balance sheet exposure is set out in section 7 of this report.
Securities exposure over 20 years comprises equity investments and the securities non-specific provision.
Placements, reverse repos & other liquid assets exposure over 20 years comprises cash in hand.
f) Equities held in the banking book Equity investments included in investment securities in the consolidated balance sheet are included in the equities standard
portfolio in the Pillar 1 credit risk capital adequacy framework. Such equity investment securities principally comprise listed equities received in settlement of a past due loan, investments of a private equity nature, and investments in funds managed by specialist managers.
At 31st December 2015, equity investment securities held in the banking book amounted to US$271.9 million, of which US$163.8 million comprised listed equities received in settlement of a secured past due loan and US$20.8 million comprised managed funds.
During the year ended 31st December 2015, US$0.3 million of losses were realised on equity investments. At 31st December 2015, net unrealised losses on equity investment securities amounted to US$6.7 million and are included in tier 1 capital.
g) Credit risk mitigation The credit exposure information presented in section 4 of this report represents gross exposures prior to the application of any
credit risk mitigants. Collateral items and guarantees which can be used for credit risk mitigation under the capital adequacy framework are referred to as eligible collateral. Only certain types of collateral and some issuers of guarantees are eligible for preferential risk weights for regulatory capital adequacy purposes. Furthermore, the collateral management process and the terms in the collateral agreements have to fulfil the CBB’s prescribed minimum requirements (such as procedures for the monitoring of market values, insurance and legal certainty) set out in their capital adequacy regulations.
Risk management and capital adequacy report (continued)31st December 2015

GIB | Celebrating 40 years
120 Annual Report 2015
4. Credit risk – Pillar 3 disclosures (continued)
4.4 Credit exposure (continued)
g) Credit risk mitigation (continued) The reduction of the capital requirement attributable to credit risk mitigation is calculated in different ways, depending on the type
of credit risk mitigation, as follows:-
- Adjusted exposure amount: GIB uses the comprehensive method for financial collateral such as cash, bonds and shares. The exposure amount is adjusted with regard to the financial collateral. The size of the adjustment depends on the volatility of the collateral and the exposure. GIB uses volatility adjustments specified by the CBB, known as supervisory haircuts, to reduce the benefit of collateral and to increase the magnitude of the exposure.
- Substitution of counterparty: The substitution method is used for guarantees, whereby the rating of the counterparty is substituted with the rating of the guarantor. This means that the credit risk in respect of the counterparty is substituted by the credit risk of the guarantor and the capital requirement is thereby reduced. Hence, a fully guaranteed exposure will be assigned the same capital treatment as if the exposure was to the guarantor rather than to the counterparty.
Description of the main types of credit risk mitigation GIB uses a variety of credit risk mitigation techniques in several different markets which contribute to risk diversification and credit
protection. The different credit risk mitigation techniques such as collateral, guarantees, credit derivatives, netting agreements and covenants are used to reduce credit risk. All credit risk mitigation activities are not necessarily recognised for capital adequacy purposes as they are not defined as eligible under the CBB’s Basel 3 capital adequacy framework, e.g. covenants and non-eligible tangible collateral such as unquoted equities.
Exposures secured by eligible financial collateral, guarantees and credit derivatives, presented by standard portfolio were as follows:-
Exposure before credit risk mitigation
US$ millionsEligible collateral
US$ millions
Of which secured by:Eligible guarantees
or credit derivativesUS$ millions
Sovereigns 109.1 - 109.1
Banks 4,578.4 3,935.0 582.6
Corporates 333.3 106.3 -
Guarantees and credit derivatives Only eligible providers of guarantees and credit derivatives may be recognised in the standardised approach for credit risk.
Guarantees issued by corporate entities may only be taken into account if their rating corresponds to A- or higher. The guaranteed exposures receive the risk weight of the guarantor.
GIB uses credit derivatives as credit risk protection only to a limited extent as the credit portfolio is considered to be well diversified.
Collateral and valuation principles The amount and type of collateral is dependent upon the assessment of the credit risk of the counterparty. The market/ fair
value of the collateral is actively monitored on a regular basis and requests are made for additional collateral in accordance with the terms of the facility agreements. In general, lending is based on the customer’s repayment capacity rather than the collateral value. However, collateral is considered the secondary alternative if the repayment capacity proves inadequate. Collateral is not usually held against securities or placements.
Types of eligible collateral commonly accepted The Group holds collateral against loans and advances in the form of physical assets, cash deposits, securities and guarantees.
Risk management and capital adequacy report (continued)31st December 2015

Annual Report 2015 121
4. Credit risk – Pillar 3 disclosures (continued)
4.5 Impaired credit facilities and provisions for impairment Individually impaired financial assets represent assets for which there is objective evidence that the Group will not collect
all amounts due, including both principal and interest, in accordance with the contractual terms of the obligation. Objective evidence that a financial asset is impaired may include: a breach of contract, such as default or delinquency in interest or principal payments, the granting of a concession that, for economic or legal reasons relating to the borrower’s financial difficulties, would not otherwise be considered, indications that it is probable that the borrower will enter bankruptcy or other financial re-organisation, the disappearance of an active market, or other observable data relating to a group of assets such as adverse changes in the payment status of borrowers or issuers in the group, or economic conditions that correlate with defaults in the group.
Provisions for impairment are determined based on the difference between the net carrying amount and the recoverable amount of a financial asset. The recoverable amount is measured as the present value of expected future cash flows, including amounts recoverable from guarantees and collateral.
Provisions for impairment are also measured and recognised on a collective basis in respect of impairments that exist at the reporting date but which will only be individually identified in the future. Future cash flows for financial assets that are collectively assessed for impairment are estimated based on contractual cash flows and historical loss experiences for assets with similar credit risk characteristics. Historical loss experience is adjusted, based on current observable data, to reflect the effects of current conditions that did not affect the period on which the historical loss experience is based. Provisions for impairment are recognised in the consolidated statement of income and are reflected in an allowance account against loans and advances and investment securities.
a) Impaired loan facilities and related provisions for impairment Impaired loan facilities and the related provisions for impairment were as follows:-
Gross exposure
US$ millions
Impairment provisionsUS$ millions
Net exposure
US$ millions
Corporates 231.5 219.2 12.3
Financial institutions 7.3 7.3 -
238.8 226.5 12.3
The gross amount of specifically provisioned loans at 31st December 2015 was US$238.8 million. Total specific provisions at 31st December 2015 represented 94.8 per cent of impaired loans.
The impaired loan facilities were principally to counterparties in the GCC.
Risk management and capital adequacy report (continued)31st December 2015

GIB | Celebrating 40 years
122 Annual Report 2015
4. Credit risk – Pillar 3 disclosures (continued)
4.5 Impaired credit facilities and provisions for impairment (continued)
b) Provisions for impairment – loans and advances The movements in the provisions for the impairment of loans and advances were as follows:-
Specific provisions
CorporatesUS$ millions
Financial institutionsUS$ millions
TotalUS$ millions
Collective provisionsUS$ millions
Total provisionsUS$ millions
At 1st January 2015 325.7 127.4 453.1 148.0 601.1
Exchange rate movements 0.2 (0.6) (0.4) - (0.4)
Amounts utilised (141.5) (119.5) (261.0) - (261.0)
Amounts reallocated 13.5 - 13.5 (13.5) -
Charge for the year 21.3 - 21.3 - 21.3
At 31st December 2015 219.2 7.3 226.5 134.5 361.0
Amounts utilised during the year ended 31st December 2015 represented provisions utilised on the transfer of the related loans to the memorandum records. Recovery efforts on these loans are still ongoing with the intention to maximise potential recoveries.
c) Impaired investment securities and related provisions for impairment There were no impaired debt investment securities at 31st December 2015.
d) Provisions for impairment – investment securities The movements in the provisions for the impairment of investment securities were as follows:-
Specific provisionsUS$ millions
Collective provisionsUS$ millions
Total provisionsUS$ millions
At 1st January and 31st December 2015 - 3.2 3.2
At 31st December 2015, the provisions for the impairment of investment securities entirely comprised non-specific provisions for debt investment securities determined on a collective basis.
4.6 Past due facilities In accordance with guidelines issued by the CBB, credit facilities are placed on non-accrual status and interest income
suspended when either principal or interest is overdue by 90 days whereupon unpaid and accrued interest is reversed from income. Interest on non-accrual facilities is included in income only when received. Credit facilities classified as past due are assessed for impairment in accordance with the IFRS guidelines as set out in section 4.5 of this report. A specific provision is established only where there is objective evidence that a credit facility is impaired.
Risk management and capital adequacy report (continued)31st December 2015

Annual Report 2015 123
4. Credit risk – Pillar 3 disclosures (continued)
4.6 Past due facilities (continued)
a) Loans The gross and carrying amount of loans for which either principal or interest was over 90 days past due were as follows:-
GrossUS$ millions
Carrying amount
US$ millions
Corporates 212.2 33.1
Financial Institutions 12.9 5.6
225.1 38.7
The past due loan facilities were principally to counterparties in the GCC.
Non-specific loan provisions of US$134.5 million represented 3.5 times the net carrying amount of past due loans.
The overdue status of gross past due loans based on original contractual maturities were as follows:-
Less than 1 year
US$ millions
Years 2 and 3
US$ millions
Over3 years
US$ millionsTotal
US$ millions
Corporates 36.5 90.3 85.4 212.2
Financial Institutions - - 12.9 12.9
36.5 90.3 98.3 225.1
b) Investment securities There were no debt investment securities for which either principal or interest was over 90 days past due.
5. Market risk – Pillar 3 disclosures
5.1 Market risk Market risk is the risk of loss due to adverse changes in interest rates, foreign exchange rates, equity prices and market
conditions, such as liquidity. The principal market risks to which the Group is exposed are interest rate risk and foreign exchange risk associated with its trading, investment and asset and liability management activities. The portfolio effects of holding a diversified range of instruments across a variety of businesses and geographic areas contribute to a reduction in the potential negative impact on earnings from market risk factors.
The Group’s trading and foreign exchange activities principally comprise trading in debt securities, foreign exchange and derivative financial instruments. Derivative financial instruments include futures, forwards, swaps and options in the interest rate and foreign exchange markets. The Group manages and controls the market risk within its trading portfolios through limit structures of both a VaR and non-VaR nature. Non-VaR based constraints relate, inter alia, to positions, volumes, concentrations, allowable losses and maturities.
Risk management and capital adequacy report (continued)31st December 2015

GIB | Celebrating 40 years
124 Annual Report 2015
5. Market risk – Pillar 3 disclosures (continued)
5.2 VaR model A key element in the Group’s market risk management framework is the estimation of potential future losses that may arise from
adverse market movements. Exposure to general market risk is calculated utilising a VaR model. The use of the internal model approach for the calculation of the capital requirement for general market risk has been approved by the CBB. The multiplication factor to be applied to the VaR calculated by the internal model has been set at the regulatory minimum of 3.0 by the CBB.
An inherent limitation of VaR is that past market movements may not provide an accurate prediction of future market losses. Historic analyses of market movements have shown that extreme market movements (i.e. beyond the 99 per cent confidence level) occur more frequently than VaR models predict. Stress tests are therefore regularly conducted to estimate the potential economic losses in such abnormal markets. Stress testing combined with VaR provides a more comprehensive picture of market risk. The Group regularly performs stress tests that are constructed around changes in market rates and prices resulting from pre-defined market stress scenarios, including both historical and hypothetical market events. Historical scenarios include the 1997 Asian crisis, the 1998 Russian crisis, the events of 9/11 and the 2008 credit crisis. In addition, the Group performs stress testing based on internally developed hypothetical market stress scenarios. Stress testing is performed for all material market risk portfolios.
From April 2012, the CBB has required that the VaR used for regulatory capital adequacy purposes incorporate a stressed VaR measure. This measure is intended to replicate the VaR for the Group’s market risk exposures during periods of stress. The stressed VaR is increased by the multiplication factor and then added to the actual VaR to determine the regulatory capital requirement for market risk.
A key objective of asset and liability management is the maximisation of net interest income through the proactive management of the asset and liability repricing profile based on anticipated movements in interest rates. VaR-based limits are utilised to manage the risk associated with fluctuations in interest earnings resulting from changes in interest rates. The asset and liability repricing profile of the various asset and liability categories is set out in section 8.2(c) of this report.
For internal risk management purposes, the Group measures losses that are anticipated to occur within a 95 per cent confidence level. Internally, the Group measures VaR utilising a one-month assumed holding period for both trading and banking book positions. For regulatory capital adequacy purposes, the figures are calculated using the regulatory VaR basis at a 99 per cent confidence level (2.33 standard deviations) and a ten-day holding period using one-year unweighted historical daily movements in market rates and prices. Correlations across broad risk categories are excluded for regulatory capital adequacy purposes.
The VaR for the Group’s trading positions as calculated in accordance with the regulatory parameters set out above, was as follows:-
31.12.15US$ millions
AverageUS$ millions
HighUS$ millions
LowUS$ millions
Total VaR 0.7 0.9 1.3 0.7
Total undiversified stressed VaR 1.5 1.7 2.3 1.4
Risk management and capital adequacy report (continued)31st December 2015
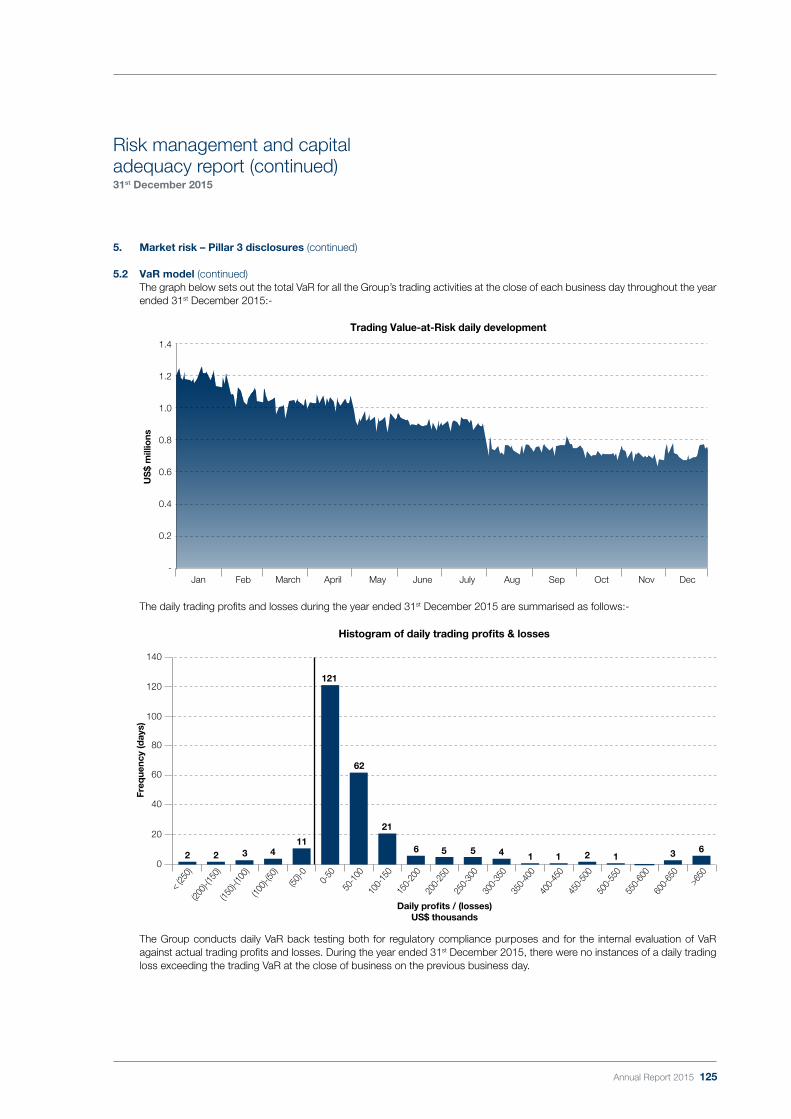
Annual Report 2015 125
5. Market risk – Pillar 3 disclosures (continued)
5.2 VaR model (continued) The graph below sets out the total VaR for all the Group’s trading activities at the close of each business day throughout the year
ended 31st December 2015:-
The daily trading profits and losses during the year ended 31st December 2015 are summarised as follows:-
The Group conducts daily VaR back testing both for regulatory compliance purposes and for the internal evaluation of VaR against actual trading profits and losses. During the year ended 31st December 2015, there were no instances of a daily trading loss exceeding the trading VaR at the close of business on the previous business day.
Trading Value-at-Risk daily development
US
$ m
illio
ns
Jan Feb March April May June July Aug Sep Oct Nov Dec
1.0
1.2
1.4
0.8
0.6
0.4
0.2
-
Histogram of daily trading profits & losses
0
40
60
80
120
140
20
100
< (25
0)(20
0)-(15
0)(15
0)-(10
0)(10
0)-(50
)
(50)-0
0-50
50-1
0010
0-15
015
0-20
020
0-25
025
0-30
030
0-35
035
0-40
040
0-45
045
0-50
050
0-55
055
0-60
060
0-65
0
>650
2 2 3 411
121
62
21
6 5 5 4 1 1 2 1 3 6
Daily profits / (losses)US$ thousands
Freq
uenc
y (d
ays)
Risk management and capital adequacy report (continued)31st December 2015

GIB | Celebrating 40 years
126 Annual Report 2015
5. Market risk – Pillar 3 disclosures (continued)
5.2 VaR model (continued) The five largest daily trading losses during the year ended 31st December 2015 compared to the 1-day VaR at the close of
business on the previous business day were as follows:-
Daily trading losses
US$ thousands1-day VaR
US$ thousands
16th November 1,132 241
4th March 291 387
7th May 182 301
5th March 157 374
3rd December 123 252
5.3 Sensitivity analysis The sensitivity of the interest rate risk in the banking book to changes in interest rates is set out in section 8.2(c) of this report.
The Group’s investment debt securities are measured at amortised cost. However, the Group nevertheless monitors the impact of changes in credit spreads on the fair value of the debt securities.
6. Operational risk – Pillar 3 disclosures
6.1 Operational risk Whilst operational risk cannot be eliminated in its entirety, the Group endeavours to minimise it by ensuring that a strong control
infrastructure is in place throughout the organisation. The various procedures and processes used to manage operational risk include effective staff training, appropriate controls to safeguard assets and records, regular reconciliation of accounts and transactions, close monitoring of risk limits, segregation of duties, and financial management and reporting. In addition, other control strategies, including business continuity planning and insurance, are in place to complement the procedures, as applicable.
As part of the Group’s Operational Risk Management Framework (ORMF), comprehensive risk self-assessments are conducted, which identify the operational risks inherent in the Group’s activities, processes and systems. The controls in place to mitigate these risks are also reviewed, and enhanced as necessary. A database of measurable operational risk events is maintained, together with a record of key risk indicators, which can provide an early warning of possible operational risk.
The capital requirement for operational risk is calculated for regulatory purposes according to the standardised approach, in which the regulatory capital requirement is calculated based on a range of beta coefficients, ranging from 12 to 18 per cent, applied to the average gross income for the preceding three financial years for each of eight predefined business lines. Consequently, the operational risk capital requirement is updated only on an annual basis.
7. Off-balance sheet exposure and securitisations Off-balance sheet exposures are divided into two exposure types in accordance with the calculation of credit risk RWAs in the
CBB’s Basel 3 capital adequacy framework:-
- Credit-related contingent items: Credit-related contingent items comprise guarantees, credit commitments and unutilised approved credit facilities
- Derivative and foreign exchange instruments: Derivative and foreign exchange instruments are contracts, the value of which is derived from one or more underlying financial instruments or indices, and include futures, forwards, swaps and options in the interest rate, foreign exchange, equity and credit markets
In addition to counterparty credit risk measured within the Basel 3 credit risk framework, derivatives also incorporate exposure to market risk and carry a potential market risk capital requirement, as commented on in more detail in section 5 of this report. A credit valuation adjustment (CVA) is applied to the relevant derivative exposure RWAs.
Risk management and capital adequacy report (continued)31st December 2015

Annual Report 2015 127
7. Off-balance sheet exposure and securitisations (continued) For the two off-balance exposure types, there are different possible values for the calculation base of the regulatory capital
requirement, as commented on below:-
7.1 Credit-related contingent items For credit-related contingent items, the notional principal amount is converted to an exposure at default (EAD) through the
application of a credit conversion factor (CCF). The CCF factor is 50 per cent or 100 per cent depending on the type of contingent item, and is intended to convert off-balance sheet notional amounts into equivalent on-balance sheet exposures.
Credit commitments and unutilised approved credit facilities represent commitments that have not been drawndown or utilised. The notional amount provides the calculation base to which a CCF is applied for calculating the EAD. The CCF ranges between 0 per cent and 100 per cent depending on the approach, product type and whether the unutilised amounts are unconditionally cancellable or irrevocable.
The table below summarises the notional principal amounts, RWAs and capital requirements for each credit-related contingent category:-
Notional principal amount
US$ millionsRWA
US$ millions
Capital requirement
US$ millions
Direct credit substitutes 618.5 545.3 68.2
Transaction-related contingent items 1,950.1 767.4 95.9
Short-term self-liquidating trade-related contingent items 307.1 74.5 9.3
Commitments 1,586.7 602.1 75.3
4,462.4 1,989.3 248.7
Commitments include undrawn loan commitments and underwriting commitments under note issuance and revolving facilities, and may be drawndown on demand.
The notional principal amounts reported above are stated gross before applying credit risk mitigants, such as cash collateral, guarantees and counter-indemnities. At 31st December 2015, the Group held cash collateral, guarantees, counter-indemnities or other high quality collateral in relation to credit-related contingent items amounting to US$569.1 million.
7.2 Derivative and foreign exchange instruments The Group utilises derivative and foreign exchange instruments to meet the needs of its customers, to generate trading revenues
and as part of its asset and liability management activity to hedge its own exposure to market risk. Derivative and foreign exchange instruments are subject to the same types of credit and market risk as other financial instruments. The Group has appropriate and comprehensive Board-approved policies and procedures for the control of exposure to both credit and market risk from its derivative and foreign exchange activities.
In the case of derivative transactions, the notional principal typically does not change hands. It is simply a quantity which is used to calculate payments. While notional principal is a volume measure used in the derivative and foreign exchange markets, it is neither a measure of market nor credit risk. The Group’s measure of credit exposure is the cost of replacing contracts at current market rates should the counterparty default prior to the settlement date. Credit risk amounts represent the gross unrealised gains on non-margined transactions before taking account of any collateral held or any master netting agreements in place.
The Group participates in both exchange traded and over-the-counter (OTC) derivative markets. Exchange traded instruments are executed through a recognised exchange as standardised contracts and primarily comprise futures and options. OTC contracts are executed between two counterparties who negotiate specific agreement terms, including the underlying instrument, notional amount, maturity and, where appropriate, exercise price. In general, the terms and conditions of these transactions are tailored to the requirements of the Group’s customers although conform to normal market practice. Industry standard documentation is used, most commonly in the form of a master agreement. The existence of a master netting agreement is intended to provide protection to the Group in the event of a counterparty default.
Risk management and capital adequacy report (continued)31st December 2015

GIB | Celebrating 40 years
128 Annual Report 2015
7. Off-balance sheet exposure and securitisations (continued)
7.2 Derivative and foreign exchange instruments (continued) The Group’s derivative and foreign exchange activities are predominantly short-term in nature. Transactions with maturities over
one year principally represent either fully offset trading transactions or transactions that are designated, and qualify, as fair value or cash flow hedges.
The aggregate notional amounts for derivative and foreign exchange instruments at 31st December 2015 were as follows:-
TradingUS$ millions
HedgingUS$ millions
TotalUS$ millions
Foreign exchange contracts:-
Unmatured spot, forward and futures contracts 3,842.0 3,313.9 7,155.9
Options purchased 1,790.6 - 1,790.6
Options written 1,790.6 - 1,790.6
7,423.2 3,313.9 10,737.1
Interest rate contracts:-
Interest rate swaps 1,362.9 12,951.2 14,314.1
Options, caps and floors purchased 9.9 - 9.9
Options, caps and floors written 9.9 - 9.9
1,382.7 12,951.2 14,333.9
Commodity contracts:-
Options and swaps purchased 26.1 - 26.1
Options and swaps written 26.1 - 26.1
52.2 - 52.2
8,858.1 16,265.1 25,123.2
7.3 Counterparty credit risk Counterparty credit risk is the risk that a counterparty to a contract in the interest rate, foreign exchange, equity or credit markets
defaults prior to the maturity of the contract. The counterparty credit risk for derivative and foreign exchange instruments is subject to credit limits on the same basis as other credit exposures. Counterparty credit risk arises in both the trading book and the banking book.
a) Counterparty credit risk calculation For regulatory capital adequacy purposes, GIB uses the current exposure method to calculate the exposure for counterparty
credit risk for derivative and foreign exchange instruments in accordance with the credit risk framework in the CBB’s Basel 3 capital adequacy framework. A capital charge to cover the risk of mark-to-market losses on expected counterparty risk (CVA) is applied to over-the-counter derivatives. Credit exposure comprises the sum of current exposure (replacement cost), and potential future exposure. The potential future exposure is an estimate, which reflects possible changes in the market value of the individual contract during the remaining life of the contract, and is measured as the notional principal amount multiplied by a risk weight. The risk weight depends on the risk categorisation of the contract and the contract’s remaining life. Netting of potential future exposures on contracts within the same legally enforceable netting agreement is done as a function of the gross potential future exposure.
Risk management and capital adequacy report (continued)31st December 2015

Annual Report 2015 129
7. Off-balance sheet exposure and securitisations (continued)
7.3 Counterparty credit risk (continued)
a) Counterparty credit risk calculation (continued) The EAD, CVA, RWAs and capital requirements for the counterparty credit risk of derivative and foreign exchange instruments
analysed by standard portfolio, is presented in the table below:-
Exposure at Default (EAD)
Current exposure
US$ millions
Future exposure
US$ millions
Total exposure
US$ millionsCVA
US$ millionsRWA
US$ millions
Capital requirement
US$ millions
Banks 171.0 70.5 241.5 30.1 80.8 13.9
Corporates 32.8 46.0 78.8 28.3 57.5 10.7
Governments 71.2 0.3 71.5 6.7 0.1 0.9
275.0 116.8 391.8 65.1 138.4 25.4
b) Mitigation of counterparty credit risk exposure Risk mitigation techniques are widely used to reduce exposure to single counterparties. The most common risk mitigation
technique for derivative and foreign exchange-related exposure is the use of master netting agreements, which allow the Group to net positive and negative replacement values of contracts under the agreement in the event of default of the counterparty.
The reduction of counterparty credit risk exposure for derivative and foreign exchange instruments through the use of risk mitigation techniques is demonstrated as follows:-
Currentexposure
US$ millions
Effect of nettingagreements
US$ millions
Netted current exposure
US$ millions
Counterparty credit risk exposure 275.0 (15.2) 259.8
7.4 Securitisations Securitisations are defined as structures where the cash flow from an underlying pool of exposures is used to secure at least two
different stratified risk positions or tranches reflecting different degrees of credit risk. Payments to the investors depend upon the performance of the underlying exposures, as opposed to being derived from an obligation of the entity originating those exposures.
At 31st December 2015, the Group had no exposure to securitisation tranches.
The Group provides collateral management services to five collateralised debt obligations (CDOs) issued between 2002 and 2006. The CDOs are intended to extract relative value from a wide range of asset classes across a broad spectrum of credit ratings. The underlying collateral of the CDOs includes leveraged loans, residential and commercial real estate, consumer finance, lending to small and medium sized enterprises, and other receivables. Each CDO holds up to 45 individual investments.
At 31st December 2015 the underlying investments in the CDOs for which the Group acted as collateral manager amounted to US$0.5 billion. At 31st December 2015, GIB did not hold any exposure to CDOs managed by the Group.
8. Internal capital including other risk types GIB manages and measures other risk types that are not included under Pillar 1 in the CBB’s Basel 3 framework. These are
principally covered in the Group’s internal economic capital model.
This section describes GIB’s economic capital model and discusses the treatment of the other risk types that are not addressed in Pillar 1 of the CBB’s Basel 3 framework.
Risk management and capital adequacy report (continued)31st December 2015

GIB | Celebrating 40 years
130 Annual Report 2015
8. Internal capital including other risk types (continued)
8.1 Economic capital model For many years, GIB has applied economic capital and risk-adjusted return on capital (RAROC) methodologies which are used
for both decision making purposes and performance reporting and evaluation.
GIB calculates economic capital for the following major risk types: credit, market and operating risk. Operating risk includes business risk. Additionally, the economic capital model explicitly incorporates concentration risk, interest rate risk in the banking book and business risk.
The composition of economic capital by risk type and business unit was as follows:-
The primary differences between economic capital and regulatory capital under the CBB’s Basel 3 framework are summarised as follows:-
- In the economic capital methodology, the confidence level for all risk types is set at 99.88 per cent, compared to 99.0 per cent in the CBB’s Basel 3 framework
- Credit risk is calculated using GIB’s estimates of probability of default, loss given default and exposures at default, rather than the regulatory values in the standardised approach
- The economic capital model utilises GIB’s embedded internal rating system, as described in more detail later in this section of the report, to rate counterparties rather than using the ratings of credit rating agencies or the application of a 100 per cent risk-weighting for unrated counterparties
- Concentration risk is captured in the economic capital model through the use of an internal credit risk portfolio model and add-on factors where applicable
- The economic capital model applies a capital charge for interest rate risk in the banking book - The economic capital model applies a business risk capital charge where applicable
Internal rating system The economic capital model is based on an internal credit rating system. The internal credit rating system is used throughout the
organisation and is inherent in all business decisions relating to the extension of credit. A rating is an estimate that exclusively reflects the quantification of the repayment capacity of the customer, i.e. the risk of customer default.
The Group monitors, manages and controls credit risk exposures based on an internal credit rating system that rates individual obligors based on a rating scale from 1 to 10, subject to positive (+) and negative (-) modifiers for rating grades 2 to 6. The internal credit rating is a measure of the credit-worthiness of a single obligor, based on an assessment of the credit risk relating to senior unsecured, medium-term, foreign currency credit exposure. The primary objectives of the internal credit rating system are the maintenance of a single uniform standard for credit quality measurement, and to serve as the primary basis for Board-approved risk parameters and delegated credit authority limits. The internal credit rating system also serves as a key input into the Group’s RAROC performance measurement system. Ratings are assigned to obligors, rather than facilities, and reflect a medium-term time horizon, thereby rating through an economic cycle.
Credit risk capital
Risk type Business unit
Market risk capital
Operating risk capital
Wholesale Banking
Treasury
Financial Markets
7.0% 1.3%
74.0% 78.3%
19.0%
20.4%
Risk management and capital adequacy report (continued)31st December 2015

Annual Report 2015 131
8. Internal capital including other risk types (continued)
8.1 Economic capital model (continued) The internal ratings map directly to the rating grades used by the international credit rating agencies as illustrated below:-
Internal rating gradeInternal
classification
Historical default rate range
%
Fitch and Standard &
Poor’sMoody’s
Investment grade
Rating grade 1 Standard 0.00 - 0.00 AAA Aaa
Rating grade 2 Standard 0.00 - 0.03 AA Aa
Rating grade 3 Standard 0.06 - 0.08 A A
Rating grade 4 Standard 0.13 - 0.30 BBB Baa
Sub-investment grade
Rating grade 5 Standard 0.40 - 1.09 BB Ba
Rating grade 6 Standard 2.23 - 7.50 B B
Rating grade 7 Standard 26.38 CCC Caa
Classified
Rating grade 8 Substandard 26.38 CC Ca
Rating grade 9 Doubtful 26.38 C C
Rating grade 10 Loss - D -
The rating mapping does not intend to reflect that there is a fixed relationship between GIB’s internal rating grades and those of the external agencies as the rating approaches differ.
8.2 Other risk types
a) Liquidity risk The Group has established approved limits which restrict the volume of liabilities maturing in the short-term. An independent
risk management function monitors the future cash flow maturity profile against approved limits on a daily basis. The cash flows are monitored against limits applying to both daily and cumulative cash flows occurring over a 30 day period. The liquidity limits ensure that the net cash outflows over a 30 day period do not exceed the eligible stock of available liquid resources. The cash flow analysis is also monitored on a weekly basis by the Assets and Liabilities Committee (ALCO).
Customer deposits form a significant part of the Group’s funding. The Group places considerable importance on maintaining the stability of both its customer and interbank deposits. The stability of deposits depends on maintaining confidence in the Group’s financial strength and financial transparency.
The funding base is enhanced through term financing, amounting to US$2,570.0 million at 31st December 2015. Access to available but uncommitted short-term funding from the Group’s established GCC and international relationships provides additional comfort. In addition to the stable funding base, the Group maintains a stock of liquid and marketable securities that can be readily sold or repoed.
Contractual standby facilities are available to the Group, providing access to US$500.0 million of collateralised funding based on pre-determined terms.
At 31st December 2015, 69.3 per cent of total assets were contracted to mature within one year. With regard to deposits, retention records demonstrate that there is considerable divergence between their contractual and effective maturities.
Risk management and capital adequacy report (continued)31st December 2015

GIB | Celebrating 40 years
132 Annual Report 2015
8. Internal capital including other risk types (continued)
8.2 Other risk types (continued)
a) Liquidity risk (continued) US$11,749.6 million or 70.5 per cent of the Group’s deposits at 31st December 2015 were from GCC countries. Historical
experience has shown that GIB’s deposits from counterparties in the GCC region are more stable than deposits derived from the international interbank market. At 31st December 2015, placements and other liquid assets with counterparties in non-GCC countries were 1.4 times the deposits received, demonstrating that the Group is a net lender of funds in the international interbank market.
b) Concentration risk Concentration risk is the credit risk stemming from not having a well diversified credit portfolio, i.e. the risk inherent in doing
business with large customers or being overexposed in particular industries or geographic regions. GIB’s internal economic capital methodology for credit risk addresses concentration risk through the application of a single-name concentration add-on.
Under the CBB’s single obligor regulations, banks incorporated in Bahrain are required to obtain the CBB’s approval for any planned exposure to a single counterparty, or group of connected counterparties, exceeding 15 per cent of the regulatory capital base. At 31st December 2015, the following single obligor exposure exceeded 15 per cent of the Group’s regulatory capital base (i.e. exceeding US$383.4 million).
On-balancesheet exposure
US$ millions
Off-balancesheet exposure
US$ millions
Total exposure
US$ millions
Counterparty A 190.5 290.0 480.5
c) Interest rate risk in the banking book Structural interest rate risk arises in the Group’s core balance sheet as a result of mismatches in the repricing of interest rate
sensitive financial assets and liabilities. The associated interest rate risk is managed within VaR limits and through the use of models to evaluate the sensitivity of earnings to movements in interest rates.
Risk management and capital adequacy report (continued)31st December 2015

Annual Report 2015 133
8. Internal capital including other risk types (continued)
8.2 Other risk types (continued)
c) Interest rate risk in the banking book (continued) The repricing profile of the Group’s assets and liabilities, including the trading book, are set out in the table below:-
Within 3 months
US$ millions
Months 4 to 6
US$ millions
Months 7 to 12
US$ millions
Over 1 year
US$ millions
Non-interest bearing
itemsUS$ millions
TotalUS$ millions
Cash and other liquid assets 4,296.8 - - - 12.9 4,309.7
Securities purchased under agreements to resell 685.0 1,000.0 100.0 50.0 - 1,835.0
Placements 3,699.2 479.2 224.5 - - 4,402.9
Trading securities - 13.1 - - 59.1 72.2
Investment securities:
- Fixed rate 172.6 81.0 74.9 1,279.1 - 1,607.6
- Floating rate 1,783.2 225.0 - - (3.2) 2,005.0
- Equities - - - - 271.9 271.9
Loans and advances 7,088.4 1,954.4 253.1 - (134.5) 9,161.4
Other assets - - - - 526.7 526.7
Total assets 17,725.2 3,752.7 652.5 1,329.1 732.9 24,192.4
Deposits 13,067.4 2,612.8 985.1 4.0 - 16,669.3
Securities sold under agreements to repurchase 1,321.6 710.9 60.9 - - 2,093.4
Other liabilities - - - - 428.7 428.7
Term financing 2,420.0 - 150.0 - - 2,570.0
Equity - - - - 2,431.0 2,431.0
Total liabilities & equity 16,809.0 3,323.7 1,196.0 4.0 2,859.7 24,192.4
Interest rate sensitivity gap 916.2 429.0 (543.5) 1,325.1 (2,126.8) -
Cumulative interest rate sensitivity gap 916.2 1,345.2 801.7 2,126.8 - -
The repricing profile is based on the remaining period to the next interest repricing date. Derivative financial instruments that have been used for asset and liability management purposes to hedge exposure to interest rate risk are incorporated in the repricing profiles of the related hedged assets and liabilities. The non-specific investment security and loan provisions are classified in non-interest bearing items.
The substantial majority of assets and liabilities reprice within one year.
Interest rate exposure beyond one year amounted to US$1,325.1 million or 5.5 per cent of total assets. This exposure principally represented the investment of the net free capital funds in fixed rate government securities. At 31st December 2015, the modified duration of these fixed rate government securities was 2.33. Modified duration represents the approximate percentage change in the portfolio value resulting from a 100 basis point change in yield. More precisely in dollar terms, the price value of a basis point of the fixed rate securities was US$301,000.
Risk management and capital adequacy report (continued)31st December 2015

GIB | Celebrating 40 years
134 Annual Report 2015
8. Internal capital including other risk types (continued)
8.2 Other risk types (continued)
c) Interest rate risk in the banking book (continued) Based on the repricing profile at 31st December 2015, and assuming that the financial assets and liabilities were to remain until
maturity or settlement with no action taken by the Group to alter the interest rate risk exposure, an immediate and sustained one per cent (100 basis points) increase in interest rates across all maturities would result in an increase in net income before tax for the following year of approximately US$7.0 million and an increase in the Group’s equity of approximately US$6.8 million. The impact on the Group’s equity represents the cumulative effect of the increase in interest rates over the entire duration of the mismatches in the repricing profile of the interest rate sensitive financial assets and liabilities.
d) Foreign exchange risk The Group does not maintain material foreign currency exposures. In general, the Group’s policy is to match assets and liabilities
in the same currency or to mitigate currency risk through the use of currency swaps.
e) Business risk Business risk represents the earnings volatility inherent in all businesses due to the uncertainty of revenues and costs due to
changes in the economic and competitive environment.
For economic capital purposes, business risk is calculated based on the annualised cost base of applicable business areas.
9. Capital adequacy ratios and other issues
9.1 Capital adequacy ratios The Group’s policy is to maintain a strong capital base so as to preserve investor, creditor and market confidence and to sustain
the future development of the business. The impact of the level of capital on shareholders’ return is also recognised as well as the need to maintain a balance between the higher returns that might be possible with greater gearing and the advantages and security afforded by a sound capital position. The Group manages its capital structure and makes adjustments to the structure taking account of changes in economic conditions and strategic business plans. The capital structure may be adjusted through the dividend payout or the issue of new shares.
The capital adequacy ratios of GIB’s principal subsidiary, GIBUK, and the Group were as follows:-
GIBUK Group
Total RWAs (US$ millions) 838.9 14,376.9
Capital base (US$ millions) 318.9 2,555.7
Tier 1 capital (US$ millions) 318.9 2,418.0
Total ratio (per cent) 38.0 17.8
Tier 1 ratio (per cent) 38.0 16.8
GIB aims to maintain a minimum tier 1 ratio in excess of 10.5 per cent and a total capital adequacy ratio in excess of 14.0 per cent.
Strategies and methods for maintaining a strong capital adequacy ratio GIB prepares multi-year strategic projections on a rolling annual basis which include an evaluation of short-term capital
requirements and a forecast of longer-term capital resources.
The evaluation of the strategic planning projections have historically given rise to capital injections. The capital planning process triggered the raising of additional tier 2 capital through a US$400 million subordinated debt issue in 2005 to enhance the total regulatory capital adequacy ratio, and a US$500 million capital increase in March 2007 to provide additional tier 1 capital to support planned medium-term asset growth. A further US$1.0 billion capital increase took place in December 2007 to enhance capital resources and compensate for the impact of likely provisions relating to exposures impacted by the global credit crisis.
Risk management and capital adequacy report (continued)31st December 2015

Annual Report 2015 135
9. Capital adequacy ratios and other issues (continued)
9.2 ICAAP considerations Pillar 2 in the Basel 3 framework covers two main processes: the ICAAP and the supervisory review and evaluation process. The
ICAAP involves an evaluation of the identification, measurement, management and control of material risks in order to assess the adequacy of internal capital resources and to determine an internal capital requirement reflecting the risk appetite of the institution. The purpose of the supervisory review and evaluation process is to ensure that institutions have adequate capital to support the risks to which they are exposed and to encourage institutions to develop and apply enhanced risk management techniques in the monitoring and measurement of risk.
GIB’s regulatory capital base exceeded the CBB’s minimum requirement of 12.5 per cent throughout the year ended 31st December 2015. Based on the results of capital adequacy stress testing and capital forecasting, GIB considers that the buffers held for regulatory capital adequacy purposes are sufficient and that GIB’s internal minimum capital targets of 10.5 per cent for tier 1 capital and 14.0 per cent for total capital are adequate given its current risk profile and capital position. The Group’s regulatory capital adequacy ratios set out in section 9.1 of this report significantly exceeded the minimum capital targets and are high by international comparison.
GIB uses its internal capital models, economic capital, and capital adequacy calculations when considering internal capital requirements both with and without the application of market stress scenarios. As a number of Pillar 2 risk types exist within GIB’s economic capital framework (i.e. interest rate risk in the banking book, concentration risk and business risk), GIB uses its existing internal capital measurements as the basis for determining additional capital buffers. GIB considers the results of its capital adequacy stress testing, along with economic capital and RWA forecasts, to determine its internal capital requirement and to ensure that the Group is adequately capitalised in stress scenarios reflecting GIB’s risk appetite.
Risk management and capital adequacy report (continued)31st December 2015

GIB | Celebrating 40 years
136 Annual Report 2015
10. Glossary of abbreviations
ALCO Assets and Liabilities Committee
AMA Advanced Measurement Approach
Basel Committee Basel Committee for Banking Supervision
CBB Central Bank of Bahrain
CCF Credit Conversion Factor
CDO Collateralised Debt Obligation
CEO Chief Executive Officer
CFO Chief Financial Officer
CCO Chief Credit Officer
CRO Chief Risk Officer
CVA Credit Valuation Adjustment
EAD Exposure at Default
FCA Financial Conduct Authority (of the United Kingdom)
FVTOCI Fair Value through Other Comprehensive Income
GCC Gulf Cooperation Council
GIB Gulf International Bank B.S.C.
GIBUK Gulf International Bank (U.K.) Limited
The Group Gulf International Bank B.S.C. and subsidiaries
ICAAP Internal Capital Adequacy Assessment Process
IFRS International Financial Reporting Standards
LGD Loss Given Default
MENA Middle East and North Africa
ORMF Operational Risk Management Framework
OTC Over-The-Counter
PD Probability of Default
PRA Prudential Regulation Authority (of the United Kingdom)
PSE Public Sector Entity
RAROC Risk-adjusted Return on Capital
RWA Risk-weighted Amount
VaR Value-at-Risk
Risk management and capital adequacy report (continued)31st December 2015

Annual Report 2015 137
Gulf International Bank B.S.C.
Head OfficeAl-Dowali Building3 Palace AvenueP.O. Box 1017Manama, Kingdom of Bahrain
TelephoneGeneral: +973 17 534000Money Markets: +973 17 530030FX: +973 17 522456 / 17 534300Treasury Sales: +973 17 511511Client Solutions Desk: +973 17 522521Investments: +973 17 522120Investment Banking: +973 17 522671Relationship Management: +973 17 522548International Banking: +973 17 522655Financial Institutions: +973 17 522685
FaxFX & Money Markets: +973 17 522530Treasury Sales: +973 17 522422Investments: +973 17 522629Investment Banking: +973 17 542790International Banking: +973 17 522642Financial Institutions: +973 17 542730
S.W.I.F.T: GULFBHBM
Reuters Direct DialForex Unit & Options: GIBBMM Desk: GIBFTreasury Sales: GIBA
Website: www.gib.com
Gulf International Bank (UK) LimitedOne KnightsbridgeLondon SW1X 7XSUnited Kingdom
Telephone: +44 20 7259 3456Fax: +44 20 7259 6060
CablesSAUDIBANKLONDON SW1
S.W.I.F.T: SINTGB2L
Corporate directory
GIB Capital L.L.C.4th floor, Low Rise Building 1Granada Business & Residential ParkEastern Ring RoadP. O. Box 89589Riyadh 11692Kingdom of Saudi Arabia
Telephone: +966 11 511 2200Fax: +966 11 511 2201
Branches
Kingdom of Saudi Arabia
Dhahran Eastern ProvinceAl Kifah TowerDammam Khobar HighwayP.O. Box 39268, Dhahran 31942
Telephone: +966 13 8664000Fax: +966 13 8100 607 / +966 13 8100 608
Jeddah Private Offices BuildingPrince Sultan RoadP.O. Box 40530, Jeddah 21511
Telephone: +966 12 5117000Fax: +966 12 5117090
S.W.I.F.T: GULFSARI
Riyadh Granada Business & Residential ParkEastern Ring Road P.O. Box 93413, Riyadh 11673
Telephone: +966 11 5103333Fax +966 11 5103333
S.W.I.F.T: GULFSARI
United Arab Emirates
Abu Dhabi3rd floorAbu Dhabi Plaza TowerHamdan Street P.O. Box 27051, Abu DhabiUnited Arab Emirates
Telephone: + 971 2 631 8080Fax: +971 2 6311966
United States of America
New York330 Madison AvenueNew York, NY 10017United States of America
Telephone: +1 212 922 2300Fax: +1 212 922 2309
S.W.I.F.T: GULFUS33
Cayman IslandsC/o New York Branch
United Kingdom
London One KnightsbridgeLondon SW1X 7XSUnited Kingdom
Telephone:General: +44 20 7393 0410Treasury: +44 20 7393 0461Fax:General: +44 20 7393 0458Treasury: +44 20 7393 0430
S.W.I.F.T: GULFGB2L
Representative Offices
United Arab Emirates
DubaiOffice No. 901, Al Moosa Tower 2P.O. Box 9445, Sheikh Zayed Road Dubai, United Arab Emirates
Telephone: +9714 3553235Fax: +9714 3559397
Lebanon
BeirutGefinor Centre, Block B Office Number 1401P.O. Box 113/6973Beirut, Lebanon
Telephone: +961 1 739505Fax: +961 1 739503

53 التقرير السنوي 2015
دليل الشركات
بنك الخليج الدولي ش.م.ب.
المقر الرئيسي مبنى الدولي
3 شارع القصرص.ب. 1017
المنامة، مملكة البحرين
هاتفعام: 000 534 17 973+
أسواق المال: 030 530 17 973+تبادل العمالت: 534300 17 / 522456 17 973+
مبيعات الخزينة: 511511 17 973+خدمات العمالء: 522521 17 973+
اإلستثمارات: 522120 17 973+األعمال المصرفية اإلستثمارية: 522671 17 973+
إدارة عالقات العمالء: 522548 17 973+األعمال المصرفية الدولية: 522655 17 973+
المؤسسات المالية: 522685 17 973+
فاكستبادل العمالت وأسواق المال: 522530 17 973+
مبيعات الخزينة: 522422 17 973+اإلستثمارات: 522629 17 973+
األعمال المصرفية اإلستثمارية:+973 17 542 790
األعمال المصرفية الدولية: 522642 17 973+المؤسسات المالية الدولية: 542730 17 973+
GULFBHBM :سويفت
خط رويتر المباشرGIBB :وحدة تبادل العمالت وحقوق الخيار
GIBF :أسواق المالGIBA :مبيعات الخزينة
www.gib.com :الموقع اإللكتروني
بنك الخليج الدولي )المملكة المتحدة( المحدود
One KnightsbridgeLondon SW1X 7XS
United Kingdom
هاتف: 3456 7259 20 44+فاكس: 6060 7259 20 44+
العنوان البرقي
SAUDIBANKLONDON SW1
SINTGB2L :سويفت
جي آي بي كابيتال ذ.م.م.
الطابق الرابع، المباني المنخفضةمبنى رقم 1، واحة غرناطة للمباني السكنية
والمكتبيةطريق الدائري الشرقي
ص.ب. 89589الرياض 11692، المملكة العربية السعودية
هاتف: 2200 511 11 966+فاكس: 2201 511 11 966+
الفروع
المملكة العربية السعودية
الظهرانالمنطقة الشرقية
برج الكفاح طريق الدمام الخبر السريع
ص.ب. 39268، الظهران 31942
هاتف: 8664000 13 966+ فاكس: 8100607 13 966+ / 8100608 13 966+
جدةمبنى المكاتب الخاصة
طريق األمير سلطانص.ب. 40530، جدة 21511
هاتف: 5117000 12 966+ فاكس: 5117090 12 966+
GULFSARI :سويفت
الرياضغرناطة للمباني السكنية والمكتبية
طريق الدائري الشرقيص.ب. 93413، الرياض 11673
هاتف: 5103333 11 966+فاكس: 5103333 11 966+
GULFSARI :سويفت
دولة اإلمارات العربية المتحدة
أبوظبيالطابق الثالث
بناية أبوظبي بالزاشارع حمدانص.ب 27051
طريق الكورنيشأبوظبي، دولة اإلمارات العربية المتحدة
هاتف: 8080 631 2 971+فاكس: 1966 631 2 971+
الواليات المتحدة األمريكية
نيويوركMadison Avenue 330
New York 10017United States of America
هاتف: 9222300 212 1+ فاكس: 9222309 212 1+
GULFUS33 :سويفت
فرع جزر كيمنبواسطة فرع نيويورك
المملكة المتحدة
لندن One KnightsbridgeLondon SW1X 7XS
United Kingdom
هاتفعام: 0410 7393 20 44+
الخزينة: 0461 7393 20 44+
فاكسعام: 0458 7393 20 44+
الخزينة: 0430 7393 20 44+
GULFGB72L :سويفت
المكاتب التمثيلية
دولة اإلمارات العربية المتحدة
دبيمكتب رقم 901، برج الموسى 2ص.ب. 9445، طريق الشيخ زايد
دبي، دولة اإلمارات العربية المتحدة
هاتف: 3553235 9714+ فاكس: 3559397 9714+
لبنان
بيروتمركز جفينور، الجناح ب
مكتب رقم 1401ص.ب. 113/6973
بيروت، لبنان
هاتف: 739505 9611+ فاكس: 739503 9611+

بنك الخليج الدولي | اإلحتفال بمرور 40 عاما
التقرير السنوي 2015 52
الهيكل التنظيمي وحوكمة الشركات
مساهمو بنك الخليج الدولي: صندوق االستثمارات العامة (المملكة العربية السعودية)،الهيئة العامة لالستثمار (دولة الكويت)، شركة قطر القابضة (دولة قطر)، شركة ممتلكات
البحرين القابضة (مملكة البحرين)، جهاز اإلمارات لإلستثمار (دولة اإلمارات العربية المتحدة) وصندوق اإلحتياطي العام للدولة (سلطنة عمان)
لجنة حوكمة الشركات
اللجنة التنفيذية
لجنة التدقيق
لجنة سياسة المخاطرلجنة الترشيح والمكافآت
أمين الشركة
األعمال المصرفية لألفراد
العمليات
الخدمات اإلدارية
تقنية المعلومات
اإلتصال المؤسسي
المشتريات
الضوابط الداخلية
مجلس اإلدارة
الرئيس التنفيذي
رئيس التدقيق للمجموعة
الرئيس التنفيذي للعمليات
رئيس إدارة تنفيذ المشاريع
رئيس مراقبة اإللتزام باألنظمة والقوانين
وضابط مجموعة اإللتزام لغسل األموال
العضو المنتدب والرئيس التنفيذي
بنك الخليج الدولي (المملكة المتحدة) المحدود
مجلس اإلدارةبنك الخليج الدولي
(المملكة المتحدة) المحدود
رئيس الشئون الماليةرئيس األعمال
المصرفية بالجملةرئيس إدارة االستثمار
والخزينة
رئيس إدارة المخاطررئيس الموارد البشرية
الرئيس التنفيذيجي آي بي كابيتال ذ.م.م.
مجلس اإلدارةجي آي بي كابيتال ذ.م.م.
لجنة اإلدارة
لجنة المخاطر للمجموعةلجنة األصول والخصوم
لجنة الموارد البشرية
لجنة أمن تقنية المعلومات
لجنة مخاطر التشغيل
الرقابة المالية
إدارة الميزانية العمومية
المؤسسات المصرفية
الخدمات المصرفيةللشركات
المؤسسات المالية
أسواق خزينة رأس المالاالستثمار
إدارة المخاطر
إدارة اإلئتمان ومراقبة المخاطر
أمن المعلومات
االقتصاد
الشئون القانونية
األعمال المصرفية االستثمارية

51 التقرير السنوي 2015
السيد مارك واتسالعضو المنتدب والرئيس التنفيذي
بنك الخليج الدولي )المملكة المتحدة( المحدوديمتلك مارك واتس خبرة تصل إلى 28 عاما في
إدارة األصول، والتي اكتسبها من العمل في كل من المملكة المتحدة والواليات المتحدة
األمريكية واإلمارات العربية المتحدة. وتشمل خبرته في إدارة األسهم وسندات الدخل الثابت
واالستثمارات البديلة والمنتجات المهيكلة واألسواق الناشئة والعمالت والمشتقات
المالية والعقارات. وقد تم تعيينه في منصبه الحالي عام 2014.
وقبل انضمامه للعمل في بنك الخليج الدولي )المملكة المتحدة( المحدود، أمضى مارك
أربع سنوات في بنك أبوظبي الوطني، حيث شغل منصب العضو المنتدب ورئيس إدارة
االستثمار بمجموعة إدارة األصول. وقبل ذلك، شغل مارك منصب رئيس إدارة األصول في
بيت التمويل األوروبي المملوك لمصرف قطر اإلسالمي ومقره في لندن، كما عمل كرئيس
لقسم الدخل الثابت العالمي لشركة أفيفا انفستورز “Aviva Investors”، وقد أمضى قبل ذلك أكثر من 17 عاما في بارينج إلدارة األصول
“Baring Asset Management”، الشركة الرائدة في مجال االستثمار، وتعمل في كل من المملكة المتحدة والواليات المتحدة األمريكية.
يحمل مارك شهادة المحلل المالي المعتمد “CFA” وعضو في معهد األوراق المالية
واالستثمار “CISI”. كما أنه حائز على شهادة الدبلوم من معهد األوراق المالية واالستثمار
،”ISMA“ وجمعية سوق األوراق المالية الدولية.”IFQ“ إلى جانب شهادة في التمويل اإلسالمي
السيد خالد صالح الغامديالرئيس التنفيذي المكلف
شركة جي آي بي كابيتاليمتلك خالد الغامدي خبرة دولية تزيد على 19 عاما من العمل في مجال االستشارات
المصرفية االستثمارية. انضم خالد إلى فريق العمل ببنك الخليج الدولي في عام 2004، حيث عين رئيسا لوحدة تمويل الشركات بشركة جي
اي بي كابيتال في عام 2007، ومن ثم أصبح الرئيس التنفيذي المكلف في العام 2013.
عمل قبل االلتحاق ببنك الخليج الدولي بالبنك السعودي الفرنسي بالمملكة؛ ومع كل من
ميرل لينش وإدوارد جونز بالمملكة المتحدة قبل ذلك.
حصل خالد الغامدي على درجة الماجستير في إدارة األعمال بتخصص المالية من جامعة
كولورادو، بولدر بالواليات المتحدة األمريكية. السيد رافي كريشنان
نائب رئيس تنفيذي - رئيس الخدمات المصرفية بالجملة المكلف
عضو لجنة اإلدارة ولجنة األصول والخصوم ولجنة المخاطر التشغيلية ولجنة الموارد البشرية
ولجنة أمن تقنية المعلوماتيتمتع رافي كريشنان بخبرة تصل إلى 15
عاما من العمل المصرفي في دول مجلس التعاون الخليجي. التحق بالعمل ببنك الخليج
الدولي في عام 2004 في منصب نائب رئيس - استشارات إدارة المشاريع، تولى بعدها رئاسة
وحدة المنتجات االئتمانية ورئاسة إدارة عالقات األسواق الخليجية والعالمية، ثم عين في منصبه
الحالي في عام 2015. عمل قبل التحاقه ببنك الخليج الدولي مع الشركة العربية لالستثمارات البترولية في المملكة العربية السعودية ضمن فريق تمويل المشاريع. كما عمل في السابق مستشارا إداريا بشركة كي بي ام جي بكل من
المملكة المتحدة والبحرين.رافي كريشنان حاصل على زمالة المعهد الهندي
للمحاسبين القانونيين. كما أنه عضو في المعهد الهندي لمحاسبي التكاليف واألشغال ومعهد
األوراق المالية للشركات في الهند.السيد ستيفن جيه مولدر
رئيس إدارة االستثمار والخزينة المكلفعضو لجنة اإلدارة ولجنة األصول والخصوم
ولجنة المخاطر التشغيلية ولجنة الموارد البشرية ولجنة أمن تقنية المعلومات
يمتلك ستيفن مولدر خبرة دولية تصل إلى 35 عاما من العمل في مجال االستثمارات
المصرفية وعمليات الخزينة. بدأ مسيرته المهنية مع بنك الخليج الدولي في عام 1987 في وظيفة
كبير متعاملين في الصرف األجنبي في فرع لندن. عين في عام 1997 رئيسا لقسم الخزينة،
ثم عين في عام 2000 رئيسا للخزينة والخدمات المصرفية في بنك الخليج الدولي )المملكة المتحدة( المحدود الذي أنشئ حديثا آنذاك. انتقل ستيفن مولدر للعمل مع بنك الخليج
الدولي في البحرين في عام 2009 بوظيفة رئيس لوحدة الخزينة وأسواق المال ومن ثم تولى مهام
منصبه الحالي في مايو 2015. وقبل االنضمام إلى بنك الخليج الدولي عمل مولدر تاجر أوراق مالية في فروع بنك كروكر ناشيونال وبنك ايه
بي ان وبنك أوف نيوزيلندا في لندن.شارك ستيفن مولدر في برنامج التطوير
المتقدم في كلية اإلدارة بجامعة كرانفيلد بالمملكة المتحدة.
السيد صخر بن عبدالرحمن الملحم رئيس الخدمات المصرفية لألفراد
)من يونيو 2011 إلى يناير 2016(يمتلك صخر بن عبدالرحمن الملحم خبرة تمتد
ألكثر من 20 عاما في األعمال المصرفية ترأس فيها مناصب مسؤولة متعددة وعلى نحو متزايد
في أنحاء أمريكا الشمالية والوسطى والمملكة المتحدة والشرق األوسط. انضم إلى بنك
الخليج الدولي في عام 2011 كنائب رئيس أول للخدمات المصرفية لألفراد. وتم تعيينه في
منصبه كرئيس للخدمات المصرفية لألفراد في عام 2013. قبل انضمامه إلى بنك الخليج الدولي،
شغل مناصب مختلفة في البنك األهلي التجاري حيث شغل منصب نائب رئيس – المدير
االقليمي للمنطقة الشرقية، ونائب رئيس – مدير تطوير المبيعات. شغل بعد ذلك منصب
رئيس إدارة الخدمات المصرفية لألفراد. وقد بدأ مشواره المهني في ساب )البنك السعودي
البريطاني(، حيث تم تعيينه في منصب مدير عالقات العمالء، ومدير مجموعة الفروع، ورئيس
إدارة الجودة ومدير أول تمويل األفراد. يحمل صخر بن عبدالرحمن الملحم شهادة
البكالوريوس في التسويق وماجستير في إدارة األعمال من جامعة واشنطن بالواليات المتحدة
األمريكية.

بنك الخليج الدولي | اإلحتفال بمرور 40 عاما
التقرير السنوي 2015 50
نبذة عن أعضاء اإلدارة العليا
األستاذ عبد العزيز الحليسيالرئيس التنفيذي
يتمتع األستاذ الحليسي بخبرة 26 عاما من العمل في القطاع المصرفي بالمملكة العربية
السعودية، كما وشارك بعضوية مجالس إدارات العديد من المؤسسات ومن بينها السوق
المالية السعودية )تداول(.قبل انضمامه إلى بنك الخليج الدولي في فبراير 2016، شغل األستاذ عبدالعزيز الحليسي منصب
وكيل المحافظ للرقابة في مؤسسة النقد العربي السعودي، حيث بدأ العمل هناك في مايو 2013.
شملت مسؤوليات األستاذ الحليسي آنذاك اإلشراف على قطاعي المصارف والتأمين،
إضافة إلى الرقابة على شركات التمويل )التمويل العقاري واإلجارة وغيرها من اتفاقيات التمويل غير المصرفي(. وكان مسؤوال إلى جانب ذلك
عن حماية العمالء.وقبل االلتحاق بالمؤسسة، شغل األستاذ
الحليسي منصب المدير اإلقليمي والعضو المنتدب في جي بي مورجان تشيس في
المملكة العربية السعودية، كما ترأس أيضا الخدمات المصرفية للشركات لمنطقة الشرق
األوسط وشمال أفريقيا في الفترة بين سبتمبر 2010 ومايو 2013. وفي وقت سابق من حياته المهنية عمل في البنك السعودي البريطاني - ساب )التابع لبنك اتش اس بي سي( في
منصب المدير العام للمنطقة الوسطى وكان مسؤوال عن كل األقسام الرئيسية لألعمال بما في ذلك الخدمات المصرفية للشركات واألفراد.
يحمل األستاذ الحليسي شهادة البكالوريوس في االقتصاد من جامعة تكساس في أوستن
بالواليات المتحدة األمريكية.
السيد ستيفن وليامزمدير تنفيذي – رئيس الشئون المالية
عضو في لجنة اإلدارة ولجنة األصول والخصوم ولجنة المخاطر للمجموعة ولجنة المخاطر
التشغيلية ولجنة الموارد البشرية ولجنة أمن تقنية المعلومات
يمتلك ستيفن وليامز خبرة دولية تصل إلى 31 عاما في مجال األعمال المصرفية، المحاسبة
والتدقيق. انضم إلى بنك الخليج الدولي عام 1987. تم تعيينه مديرا للرقابة المالية
عام 2000 ورئيسا للشئون المالية عام 2008. وتشمل مسئولياته الحالية إعداد التقارير المالية
والتنظيمية واإلدارية للبنك، إضافة إلى وضع الخطط االستراتيجية والمالية وصياغة الميزانية العامة وإدارة رأس المال. وقد أشرف أيضا على
مشروع تطبيق متطلبات اتفاقية بازل الثالثة. وقبل التحاقه بالبنك عمل في شركة التدقيق المحاسبي “كي بي ام جي” في لندن والشرق
األوسط.ستيفن وليامز هو محاسب قانوني وعضو
في جمعية المحاسبين القانونيين في انجلترا وويلز. حاصل على البكالوريوس في االقتصاد
من جامعة كارديف في بريطانيا. وهو عضو في فريق العمل الخاص بالمالءة المالية في معهد
.)IIF( التمويل الدولي بواشنطنالسيد مسعود ظفر
مدير تنفيذي – رئيس إدارة المخاطرعضو في لجنة اإلدارة ولجنة األصول والخصوم
ولجنة المخاطر للمجموعة ولجنة المخاطر التشغيلية ولجنة أمن تقنية المعلومات
يمتلك مسعود ظفر خبرة دولية تصل إلى 36 عاما في مجال األعمال المصرفية، المحاسبة،
التدقيق وإدارة المخاطر. ولقد انضم مسعود إلى إدارة التدقيق الداخلي في بنك الخليج
الدولي عام 1982، وتم تعيينه كرئيس لدائرة التدقيق الداخلي عام 1987. وفي عام 2004 عين
رئيسا لالئتمان، وفي عام 2012 عين مسعود رئيسا إلدارة المخاطر وقبل انضمامه إلى البنك
عمل في شركة إرنست آند يونج في لندن وشركة كي بي ام جي في البحرين.
مسعود ظفر عضو في جمعية المحاسبين القانونيين في انجلترا وويلز.
السيد ستيوارت ماكفيلمدير تنفيذي أول – الرئيس التنفيذي للعملياتعضو في لجنة اإلدارة ولجنة األصول والخصوم
ولجنة المخاطر للمجموعة ولجنة المخاطر التشغيلية ولجنة الموارد البشرية ولجنة أمن
تقنية المعلوماتيمتلك ستيوارت ماكفيل خبرة دولية تمتد ألكثر
من 26 عاما في اإلدارة المصرفية والقطاعات األخرى كالخدمات المصرفية لألفراد والقطاع
العقاري. انضم ستيوارت إلى بنك الخليج الدولي بمنصبه الحالي في ديسمبر 2014 كرئيس
تنفيذي للعمليات، وهو المسئول عن عمليات المجموعة وتقنية المعلومات والخدمات
اإلدارية واإلتصال المؤسسي ومكتب إدارة تنفيذ المشاريع. وحاليا مسؤوال عن الخدمات
المصرفية لألفراد.وخالل السبع سنوات السابقة، شغل ستيوارت
منصب الرئيس التنفيذي وعضو مجلس اإلدارة في مجموعات عائلية مرموقة وشركات
عامة وشركات األسهم الخاصة العاملة في مختلف القطاعات في جميع أنحاء منطقة
الشرق األوسط وشمال أفريقيا. ومن خالل هذه المناصب، عمل ستيوارت على وضع
استراتيجيات إعادة الهيكلة وترجمتها إلى خطط تنفيذ تشغيلية واضحة. وقبل انتقاله إلى الشرق األوسط، عمل ماكفيل في شركة جنرال إلكتريك
كابيتال في أوروبا، حيث كان آخر منصب شغله هو الرئيس التنفيذي لجنرال إلكتريك كارد
سيرفيسز في المملكة المتحدة.يحمل ستيوارت ماكفيل شهادة البكالوريوس
مع مرتبة الشرف في إدارة األعمال والقانون من جامعة النكستر في المملكة المتحدة.

49 التقرير السنوي 2015
4. األستاذ عبدالله بن محمد الزامل )3( )4( )5(عضو مجلس اإلدارة منذ عام 2009
المملكة العربية السعوديةيشغل األستاذ عبدالله الزامل منصب الرئيس التنفيذي وعضو مجلس اإلدارة لشركة الزامل
لالستثمار الصناعي )شركة مساهمة عامة(، وشغل قبل ذلك منصب الرئيس التنفيذي للعمليات في الشركة. وكان قد عمل في
شركة مكيفات الزامل كنائب رئيس أول، وبدأ حياته المهنية في هذه الشركة كمهندس
صناعي. وحاليا يشغل عضوية مجالس إدارة العديد من الشركات من بينها شركة مجموعة العزل الخليجية وشركة الربيعة والنصار والزامل
للصناعات الخرسانية المحدودة ورئيس مجلس إدارة جي اي بي كابيتال ورئيس مجلس إدارة الشركة السعودية العالمية للموانئ )شركة تضامن بين صندوق االستثمارات العامة
السعودي وهيئة موانئ سنغافورة( وعضو مجلس إدارة بنك الخليج الدولي )المملكة
المتحدة( المحدود، وعضو مجلس إدارة الهيئة العامة للطيران المدني )هيئة حكومية( إضافة
إلى عضوية مجلس إدارة صندوق تنمية الموارد البشرية )هيئه حكومية( وعضو مجلس إدارة
شركة ڤيڤا البحرين لالتصاالت )مملوكة من قبل شركة االتصاالت السعودية(. باإلضافة إلى عضوية مجالس اإلدارة في المنظمات
والمؤسسات الغير الربحية التالية: بنك الطعام السعودي )اطعام( وانديفور السعودية ومدارس
الظهران األهلية. وهو حاصل على بكالوريوس الهندسة الصناعية من جامعة واشنطن
بالواليات المتحدة وماجستير إدارة مالية وإدارة أعمال من جامعة الملك فهد للبترول والمعادن،
الظهران، المملكة العربية السعودية. يتمتع األستاذ الزامل بخبرة مهنية واسعة تصل إلى
29 عاما.
5. األستاذ المهندس خالد بن صالح المديفر )5( )4( )2(
عضو مجلس اإلدارة منذ عام 2009المملكة العربية السعودية
يشغل المهندس المديفر حاليا منصب الرئيس التنفيذي وكبير المدراء التنفيذيين لشركة
التعدين العربية السعودية )معادن(، وقد انضم لشركة معادن كنائب لرئيس الشركة للفوسفات
وتطوير األعمال الجديدة. قبل ذلك شغل منصب المدير العام لشركة اسمنت القصيم
ونائب الرئيس للشئون المالية في الشركة الشرقية للبتروكيماويات )شركة شرق، إحدى شركات سابك(. المهندس المديفر عضو في
مجلس اإلدارة واللجنة التنفيذية لشركة معادن. وكان في السابق عضو مجلس إدارة شركة
اسمنت القصيم والشركة السعودية للخطوط الحديدية. وهو حاصل على البكالوريوس في الهندسة والماجستير في إدارة األعمال من
جامعة الملك فهد للبترول والمعادن، المملكة العربية السعودية. يتمتع المهندس المديفر
بخبرة مهنية واسعة تصل إلى 31 عاما.6. األستاذ عمر هدير الفارسي )1( )2( )3(
عضو مجلس اإلدارة منذ عام 2012الواليات المتحدة األمريكية
يشغل األستاذ الفارسي حاليا منصب رئيس شركة ديالى لالستشارات )ذ.م.م.( في نيويورك، وهو أيضا مستشار مالي لصندوق االستثمارات
العامة في المملكة العربية السعودية. وعمل سابقا في دائرة األعمال المصرفية االستثمارية في بنك كريدت سويس فيرست بوسطن في
نيويورك، حيث تركزت مهامه على التمويل وعمليات دمج وتملك الشركات في قطاع
الطاقة. وقبل التحاقه بالعمل المصرفي عمل محاميا في شركة وايت أند كيس في نيويورك،
حيث كان عضوا في دائرة الخدمات المالية والتجارية فيها. السيد الفارسي حاصل على
بكالوريوس في االقتصاد من جامعة نوتردام ودكتوراه في القانون من كلية الحقوق في
جامعة كولومبيا في الواليات المتحدة األمريكية. يتمتع األستاذ الفارسي بخبرة مهنية واسعة
تصل إلى 22 عاما.
7. الدكتور يحيى عبدالله اليحيى )3(عضو مجلس اإلدارة منذ عام 2015
رئيس مجلس اإلدارة، بنك الخليج الدولي )المملكة المتحدة( المحدودالمملكة العربية السعودية
تولى الدكتور يحيى اليحيى منصب الرئيس التنفيذي لبنك الخليج الدولي )GIB( منذ شهر
يناير 2009 وحتى يناير 2016. قبل ذلك شغل عضوية مجلس إدارة مجموعة البنك الدولي
كمدير تنفيذي ممثال للمملكة العربية السعودية حيث أنيطت إليه عدة مناصب خالل تلك الفترة.
وعمل الدكتور اليحيى قبل ذلك مستشارا لمحافظ مؤسسة النقد العربي السعودي، ومديرا عاما لشركة الجفالي بالرياض، وهو مؤسس ومدير عام المعهد المصرفي في الرياض وأستاذ جامعي للهندسة الصناعية وهندسة النظم في جامعة الملك سعود
بالمملكة العربية السعودية وجامعة ميشيغان بالواليات المتحدة األمريكية، وعمل محاضرا في المطابقة الثنائية والخوارزميات بالمعهد الهندي
لإلحصاء في بنغلور، الهند. ويشغل الدكتور اليحيى حاليا منصب رئيس مجلس إدارة بنك الخليج الدولي )المملكة المتحدة(، كما يرأس
مجلس إدارة الشركة السعودية لتموين الخطوط، ورئيسا لشركة الشعيبة للمياه والكهرباء. وهو
عضو أيضا في مجلس إدارة معهد التمويل الدولي )IIF( بواشنطن ورئيس مشارك للمجلسه االستشاري لألسواق الناشئة )EMAC(، كما انه
عضو في لجنة التوفيق والتحكيم في المركز .)ICSID( الدولي لتسوية منازعات االستثمار
وشغل الدكتور اليحيى عضوية لجان ومجالس إدارات العديد من المؤسسات كان من أبرزها اللجنة العليا لالستثمار في البنية األساسية بمجموعة العشرين )G20(، والبنك األهلي،
وشركة اعاده، واوجيه لالتصاالت، ومؤسسة الخليج لالستثمار، وبنك الخليج الدولي، والبنك
السعودي الفرنسي، والبنك الزراعي، ولجنة المهندسين السعوديه. نال الدكتور اليحيى
درجة الدكتوراه في الهندسة الصناعية وهندسة األنظمة من جامعة ميشيغان، بالواليات
المتحدة األمريكية، وهو خريج جامعة الملك فهد للبترول والمعادن بالمملكة العربية السعودية
الظهران )KFUPM(. يتمتع الدكتور اليحيى بخبرة مهنية واسعة تصل إلى 40 عاما.
)1( عضو اللجنة التنفيذية)2( عضو لجنة التدقيق
)3( عضو لجنة سياسات المخاطر )4( عضو لجنة الترشيح والمكافآت
)5( عضو لجنة حوكمة الشركات

بنك الخليج الدولي | اإلحتفال بمرور 40 عاما
التقرير السنوي 2015 48
نبذة عن أعضاء مجلس اإلدارة
1234
567
1. معالي جماز بن عبدالله السحيمي )1( رئيس مجلس اإلدارة منذ عام 2008
المملكة العربية السعوديةشغل معالي جماز السحيمي منصب رئيس
مجلس اإلدارة والرئيس التنفيذي لهيئة السوق المالية، وهي الهيئة الرقابية لسوق األوراق المالية بالمملكة العربية السعودية. وعمل
معاليه وكيال لمحافظ مؤسسة النقد العربي السعودي بعد أن التحق بمؤسسة النقد كمدير
عام للرقابة على البنوك. كما شغل منصب نائب المدير العام لصندوق التنمية الصناعية
السعودي وتم تعيينه نائبأ لرئيس مجلس إدارة الشركة العربية السعودية لالستثمار )سنابل
لالستثمار(. في السابق انتخب عضوا في مجالس إدارة العديد من الشركات الرائدة في القطاعين العام والخاص، بما في ذلك الهيئة
العامة لالستثمار في المملكة العربية السعودية والمؤسسة العامة للبترول والمعادن والشركة
الوطنية للتأمين التعاوني والبنك السعودي العالمي )الذي تم دمجه الحقا مع بنك الخليج
الدولي في عام 1999(. ويحمل معالي جماز السحيمي درجة البكالوريوس في الهندسة الكهربائية من جامعة واشنطن في سياتل
بالواليات المتحدة األمريكية. يتمتع معاليه بخبرة مهنية واسعة تصل إلى 41 عاما.
2. معالي األستاذ سليمان بن عبدالله الحمدان )4( )1(
نائب رئيس مجلس اإلدارة منذ عام 2015عضو مجلس اإلدارة منذ عام 2009
المملكة العربية السعوديةيترأس معالي األستاذ سليمان الحمدان الهيئة
العامة للطيران المدني في المملكة العربية السعودية بعد أن شغل مناصب عدة من ضمنها
منصب عضو مجلس إدارة والرئيس التنفيذي لمجموعة الشركة الوطنية للخدمات الجوية
)ناس القابضة( في المملكة العربية السعودية، وكان أيضا عضوا في الهيئة االستشارية
للمجلس االقتصادي األعلى سابقا، وقبل ذلك شغل عدة مناصب في البنك السعودي
البريطاني، بما في ذلك نائب العضو المنتدب ومدير عام الخدمات المصرفية الشخصية، كما عمل سابقا في الصندوق السعودي للتنمية، وشغل معالي سليمان الحمدان عضو مجلس األمناء في جامعة اليمامة وكذلك عضو سابق
في الهيئة االستشارية لكلية اإلدارة الصناعية في جامعة الملك فهد للبترول والمعادن وكذلك
عضو الهيئة االستشارية لكلية إدارة األعمال في جامعة األمير سلطان في المملكة العربية السعودية. كما شغل معالي األستاذ سليمان
الحمدان سابقا منصب رئيس مجلس إدارة شركة السعودي الهولندي المالية وعضوية
مجلس إدارة شركة الشرق األوسط للكابالت المتخصصة والشركة األهلية للتأمين التعاوني.
حصل على بكالوريوس في العلوم اإلدارية من جامعة الملك سعود وماجستير في إدارة
األعمال من جامعة نيوهيفين بالواليات المتحدة األمريكية. يتمتع معاليه بخبرة مهنية واسعة
تصل إلى 36 عاما.
3. البروفيسور عبدالله بن حسن العبدالقادر )5( )2( )1(
عضو مجلس اإلدارة منذ عام 2009المملكة العربية السعودية
يشغل البروفيسور العبدالقادر رئاسة مجلس شركة االتصاالت السعودية. كما يسهم في مجالس اإلدارة ولجان المراجعة في عدد من
الشركات، منها: الشركة العربية السعودية لالستثمار)سنابل(، والشركة السعودية للتنمية
واالستثمار التقني )تقنية(، وبنك الرياض. ويرأس اللجنة االستشارية لهيئة السوق المالية
السعودية ولجنة مراقبة جودة األداء المهني بالهيئة السعودية للمحاسبين القانونيين. وعمل الدكتور العبدالقادر أستاذا في جامعة الملك فهد للبترول والمعادن. وكان عضوا في أول مجلس
لهيئة السوق المالية السعودية خالل الفترة من عام 2004 – 2009، وأسهم خالل وجوده
في الهيئة في إقرار الئحة حوكمة الشركات، وواصل العمل على تعزيز الحوكمة في دول
مجلس التعاون رئيسا تنفيذا مؤسسا لمعهد أعضاء مجلس اإلدارة الخليجي. والبروفيسور
العبدالقادر حاصل على بكالوريوس وماجستير إدارة األعمال من جامعة الملك فهد للبترول
والمعادن ودكتوراة في إدارة األعمال من جامعة كولورادو بالواليات المتحدة األمريكية. يتمتع
البروفيسور العبدالقادر بخبرة مهنية واسعة تصل إلى 34 عاما.

47 التقرير السنوي 2015
المعامالت التي تتطلب موافقة مجلس اإلدارةلقد فوض البنك الصالحيات االئتمانية إلى
الرئيس التنفيذي بناء على تقييم المخاطر. وإذا وجد الرئيس التنفيذي أن مخاطر أي معاملة
تتجاوز حدود التفويض الممنوح له، فإن المعاملة تحتاج إلى موافقة اللجنة التنفيذية أو
مجلس اإلدارة.االلتزام باألنظمة والقوانين
أقر مجلس اإلدارة أطر االلتزام باألنظمة والقوانين التي تؤكد السعي الجاد لتطبيق
أفضل الممارسات المهنية في كل أعمال البنك وتعكس التزام البنك بتنفيذ كافة األنظمة
والقوانين المعمول بها. وبناء على ذلك فإن من مهام قسم مراقبة االلتزام باألنظمة والقوانين
مساعدة اإلدارة العليا في ضمان التزام جميع أعمال البنك وموظفيه بالقوانين والقيام بها
وفقا ألفضل المعايير المهنية. ويمكن لرئيس قسم مراقبة االلتزام باألنظمة والقوانين
للمجموعة اللجوء إلى مجلس اإلدارة من خالل لجنة التدقيق إذا استدعى األمر ذلك.
وتأكيدا ألهمية االلتزام باألنظمة والقوانين يقوم الرئيس التنفيذي سنويا بإصدار خطاب
إلى جميع الموظفين لتذكيرهم بضرورة االلتزام بكل القوانين واألنظمة التي تنطبق على أعمال
البنك، وقد تم تضمين االلتزام الجيد كمعيار دائم في التقييم السنوي ألداء الموظفين.
مكافحة غسل األموالإن أنظمة وإجراءات البنك الخاصة بمكافحة غسل األموال وتمويل اإلرهاب تتطابق مع
القوانين والتشريعات المعمول بها في مملكة البحرين. وهذه المتطلبات القانونية والتنظيمية
تعكس إلى حد كبير توصيات فريق العمل المالي )FATF( الخاصة بمكافحة غسل األموال وتمويل
اإلرهاب. إن إجراءات مكافحة غسيل األموال وتمويل اإلرهاب يتم تطبيقها في كافة مكاتب
البنك وفروعه وشركاته التابعة. وتلتزم فروع ومكاتب البنك الخارجية بقوانين وأنظمة الدول التي تتواجد فيها، ويتم تطبيق اإلجراءات األشد
لمكافحة غسل األموال وتمويل اإلرهاب إذا تفاوتت القوانين المحلية.
إن النظم واإلجراءات المتبعة تهدف إلى التعامل فقط مع العمالء الذين يمكن التعرف
عليهم إلى حد معقول بأن هويتهم ونشاطاتهم التجارية قانونية، وإلى الحصول على واالحتفاظ
بالمعلومات الضرورية عنهم، واإلبالغ عن المعامالت المشبوهة. كما أن هذه النظم
تحث على توفير التدريب المستمر للموظفين، وتتم مراجعتها مع المدقق الخارجي للتأكد من
فعاليتها. وتمنع إجراءات مكافحة غسل األموال وتمويل اإلرهاب في البنك التعامل مع البنوك التي ليس لها مقرات حقيقية. ولضمان االلتزام الفعال بقوانين مكافحة غسل األموال وتمويل اإلرهاب على مستوى المجموعة ومتابعة تطور القوانين والتشريعات في هذا الشأن، تم إنشاء
قسم خاص يتألف من رئيس قسم االلتزام باألنظمة والقوانين للمجموعة ومسئول التبليغ
عن غسل األموال للمجموعة ومساعديه وعدد من الموظفين.
إطار عمل الحوكمة - تقرير المدقق الداخليتقوم دائرة التدقيق الداخلي بمراجعة إطار
الحوكمة سنويا كمشروع منفصل منذ إدخال قواعد حوكمة الشركات في العام 2010. ووفقا
لذلك، جرت آخر عملية تدقيق إلطار الحوكمة في شهر أبريل من العام 2015. والغرض من هذا
التدقيق هو ضمان مستوى عمليات الحوكمة داخل البنك. وشمل نطاق التدقيق مراجعة
السياسات واإلجراءات والممارسات القائمة التي يتبعها البنك في ضوء قواعد مصرف البحرين المركزي المتضمنة في قسم الضوابط العليا
)HC( من دليل القواعد )المجلد األول(.وأكد تقرير المدقق الداخلي أن إطار حوكمة
الشركات في بنك الخليج الدولي يعمل بفعالية كإطار للرقابة على المخاطر الناتجة عن األعمال
الحالية للبنك.
حالة االلتزام بقواعد مصرف البحرين المركزي )HC القسم(
يلتزم بنك الخليج الدولي بتنفيذ متطلبات مصرف البحرين المركزي بشأن حوكمة
الشركات التي ذكرت في القسم “HC” من دليل المصرف، وفيما يلي تفسير للمتطلبات التي
لم يتم االلتزام بها عام 2015:ينص المتطلب رقم “HC-7.2.2” من قسم •
الضوابط العليا على ضرورة حضور كافة أعضاء مجلس اإلدارة اجتماعات الجمعية
العامة وقيامهم باإلجابة على األسئلة التي يطرحها المساهمون في أي اجتماع مخصص
لهم. ولم يتمكن رئيس مجلس اإلدارة من حضور اجتماع الجمعية العامة الذي عقد
في 12 مارس 2015 لذلك ترأس نائب رئيس مجلس اإلدارة هذا االجتماع.
يذكر أنه وفقا للمادة الثانية من اتفاقية •تأسيس البنك الصادرة بموجب المرسوم
بقانون رقم 30 لسنة 1975 والتعديالت التي أدخلت عليها، فإن البنك يخضع التفاقية
التأسيس والنظام األساسي )“الوثائق التأسيسية”( وفي حال وقوع تضارب بين
الوثائق التأسيسية للبنك والقوانين األخرى في مملكة البحرين، فإن البنك يلتزم بما جاء في الوثائق التأسيسية. نتيجة لذلك،
لم يتم تبني بعض المتطلبات الواردة في القسم “HC-1” و”HC-4” و “HC-5”التي تتضارب مع النظام األساسي للبنك، بما
في ذلك طريقة تعيين أعضاء مجلس االدارة ومتطلبات حضور اجتماعات المجلس ومنع استخدام التفويض في اجتماعات المجلس
واجمالي المكافآت المدفوعة ألعضاء المجلس.

بنك الخليج الدولي | اإلحتفال بمرور 40 عاما
التقرير السنوي 2015 46
تقرير حوكمة الشركات تتمة
اإلعالميلتزم البنك بسياسة إعالمية تتماشى مع
متطلبات مصرف البحرين المركزي وتضمن اإلفصاح والتواصل مع كل من لهم عالقة
بالبنك بشفافية وشمولية وبتوقيت مناسب لتعكس بشكل صحيح طبيعة أعمال ومخاطر
البنك. وتشمل وسائل اإلفصاح التقرير السنوي وكتيبات البنك والنشرة الدورية والبيانات التي
توزع على وسائل اإلعالم. www.( كذلك يتسم الموقع االلكتروني للبنكgib.com( بالشفافية ويوفر معلومات شاملة عن البنك والبيانات المالية آلخر خمسة أعوام على األقل، باإلضافة إلى البيانات الصحفية.
قواعد السلوك المهنييوفر الموقع اإللكتروني للبنك معلومات عن
قواعد السلوك المهني التي أقرها مجلس اإلدارة وتتضمن قواعد سلوكية محددة تسري
على أعضاء مجلس اإلدارة وموظفي البنك وتسعى إلى تعزيز األداء المهني واألخالقي ومنع
تضارب المصالح.وتهدف الئحة القواعد السلوكية في البنك
إلى إرشاد أعضاء مجلس اإلدارة والموظفين بشأن أفضل الممارسات التي يمكن اتباعها في تنفيذ مهامهم ومسئولياتهم تجاه كافة
الجهات المعنية بالبنك )المساهمين، العمالء، الموظفين، السلطات المعنية، الموردين،
الجمهور، والدول التي يعمل بها البنك( وااللتزام بكافة القوانين واألنظمة ذات الصلة.
وتفصل القواعد السلوكية مجموعة من الشئون المتعلقة بتطبيق القانون وااللتزام
بأفضل الممارسات المهنية مثل: تحمل
المسئولية واألمانة والعدل واألخالق، تجنب تضارب المصالح، المحافظة على ممتلكات
البنك وبياناته، الحفاظ على سرية المعلومات الخاصة بالعمالء، االلتزام بقوانين عدم تسريب
المعلومات أو االستفادة منها في األعمال، الحيلولة دون حدوث عمليات غسل األموال وتمويل اإلرهاب، مكافحة الرشوة والفساد،
عدم تلقي الهدايا الثمينة وكشف التجاوزات إن حدثت.
يتم تذكير جميع الموظفين واعضاء مجلس اإلدارة سنويا بواجبهم وفق قواعد السلوك
ويطلب من الجميع التوقيع على إقرار باستالمهم نسخة من قواعد السلوك المهني
وقراءتها وفهمها، والتعهد بااللتزام بما ورد فيها وكذلك االقرار بأنه في حال وجود أي مخاوف بشأن أي خرق لقواعد السلوك، فسوف يرفع
األمر إلى الشخص المعني في البنك وفقا للقواعد.
باإلضافة إلى ذلك، يتوجب على جميع موظفي البنك التوقيع على إقرار بشأن االفصاح عن أي وظيفة أخرى أو أي نشاط آخر قد يمارسونه من
أجل ضمان تجنب تضارب المصالح. وتوجه هذه اإلقرارات إلى قسم الموارد البشرية بالبنك.
وبالمثل، فإن جميع أعضاء مجلس اإلدارة ولجنة االدارة يقومون بالتوقيع على إقرار مماثل يوجه
إلى لجنة حوكمة الشركات.اإلفصاح وتوفير المعلومات
يتم نشر التقارير السنوية أيضا في موقع البنك اإللكتروني ويمكن الوصول إلى هذه التقارير وما تتضمنه من معلومات من أي مكان في العالم.
وتشمل هذه المعلومات تقارير اإلدارة حول أعمال البنك وتحليال مفصال إلدارة المخاطر
والبيانات المالية. وتعكس التقارير المالية أحدث المعايير الدولية إلعداد التقارير المالية.
وتعكس سياسة اإلفصاح التي وافق عليها مجلس اإلدارة االلتزام بمتطلبات الركيزة الثالثة
من معايير اتفاقية بازل الثالثة وذلك وفقا لمتطلبات مصرف البحرين المركزي. وتهدف هذه السياسة إلى ضمان شفافية اإلفصاح
عن المعلومات المالية ومخاطر البنك لجميع األطراف المعنية.
سياسة التعامل مع شركاء األعمالإن سياسة البنك بشأن التعامل مع شركاء
أعمال البنك التي وافق عليها مجلس اإلدارة تحدد كيفية التعامل مع هذه األطراف. وتبين
هذه السياسة األطراف التي تعتبر مرتبطة بالبنك وفقا للمعايير التي حددها مصرف
البحرين المركزي وتفرض حدودا للتعامل مع هذه األطراف متوافقة أو أكثر تشددا من معايير
المصرف المركزي. وتوضح هذه السياسة المسئوليات الداخلية إلبالغ مصرف البحرين
المركزي بمخاطر البنك لدى األطراف المرتبطة بالبنك والمخاطر التي ستسجل في البيانات
المالية والتقارير السنوية للبنك بما يتوافق مع متطلبات اإلفصاح المتبعة.
سياسة التعامل مع األطراف ذات الصلةيتبع البنك سياسة معتمدة من مجلس اإلدارة في عملية إقرار المعامالت مع األطراف ذات الصلة. يتم إجراء المعامالت مع المساهمين
وفق المخاطر والودائع الواردة منهم. في حالة تقديم قروض ألطراف ذات عالقة، يتم
الموافقة عليها بناء على السلطات والصالحيات الممنوحة من مجلس اإلدارة للرئيس التنفيذي،
فإذا كانت تتجاوز تلك الصالحيات فالبد من الحصول على موافقة اللجنة التنفيذية أو مجلس
اإلدارة. وال يقوم البنك بمنح قروض ألعضاء مجلس اإلدارة. ويتم التعامل مع الودائع الواردة من أعضاء مجلس إدارة البنك على أساس عادي
وفق األسعار السائدة في السوق. وينبغي المالحظة أن المادة 16 من النظام األساسي
للبنك تمنع أعضاء مجلس اإلدارة من تحقيق أي مصلحة شخصية، مباشرة أو غير مباشرة، من
أي صفقة خاصة بالبنك.جميع القروض الممنوحة ألعضاء اإلدارة
التنفيذية )بما فيهم الرئيس التنفيذي ومرؤوسيه المباشرين( وسائر موظفي البنك تخضع للسياسات الخاصة بالموظفين. وتتم
مراجعة تلك السياسات من قبل لجنة الترشيح والمكافآت مرة واحدة سنويا على األقل.
كما يجب مراجعة مجلس اإلدارة في جميع المعامالت للشركات ذات العالقة بأعضاء
مجالس اإلدارة أو اإلدارة التنفيذية.
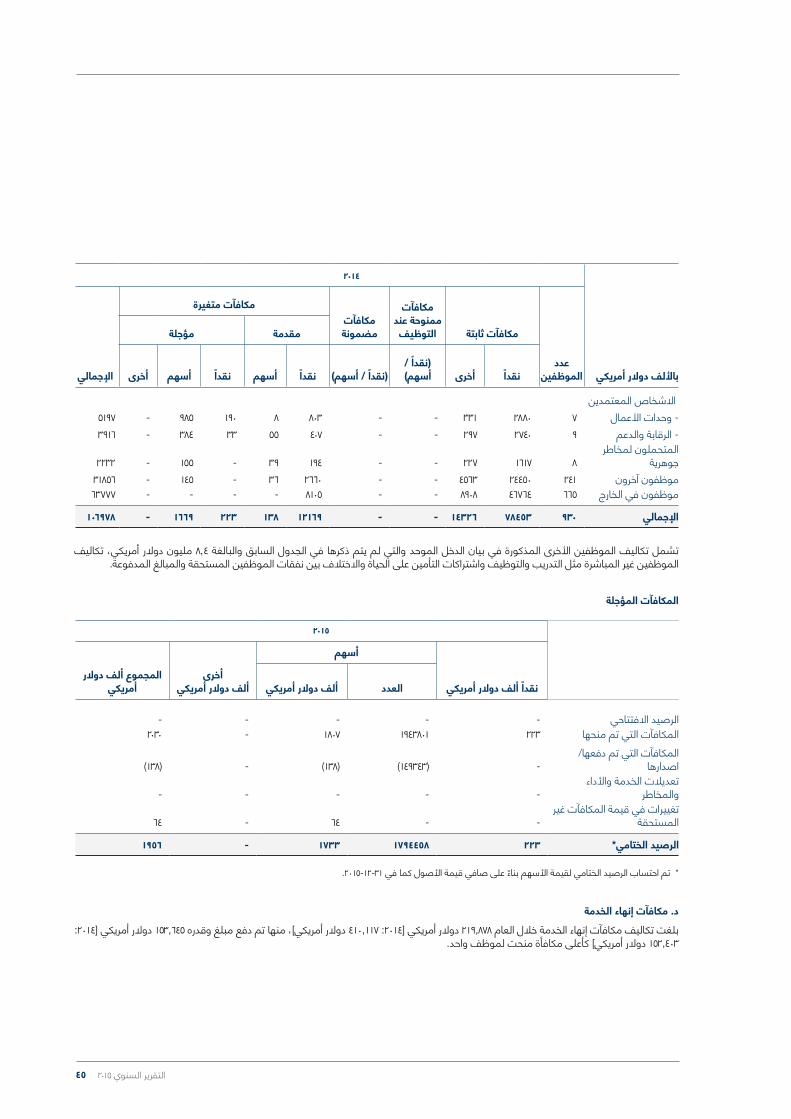
45 التقرير السنوي 2015
تشمل تكاليف الموظفين األخرى المذكورة في بيان الدخل الموحد والتي لم يتم ذكرها في الجدول السابق والبالغة 8.4 مليون دوالر أمريكي، تكاليف الموظفين غير المباشرة مثل التدريب والتوظيف واشتراكات التأمين على الحياة واالختالف بين نفقات الموظفين المستحقة والمبالغ المدفوعة.
* تم احتساب الرصيد الختامي لقيمة األسهم بناء على صافي قيمة األصول كما في 2015-12-31.
د. مكافآت إنهاء الخدمةبلغت تكاليف مكافآت إنهاء الخدمة خالل العام 219,878 دوالر أمريكي ]2014: 410,117 دوالر أمريكي[، منها تم دفع مبلغ وقدره 153,645 دوالر أمريكي ]2014:
152,403 دوالر أمريكي[ كأعلى مكافأة منحت لموظف واحد.
المكافآت المؤجلة
باأللف دوالر أمريكي
2014
عدد الموظفين
مكافآت ثابتة
مكافآت ممنوحة عند
التوظيفمكافآت مضمونة
مكافآت متغيرة
اإلجمالي
مؤجلةمقدمة
أخرىنقدا)نقدا / أخرىأسهمنقداأسهمنقدا)نقدا / أسهم(أسهم(
االشخاص المعتمدين5197-8038190985--72880331- وحدات األعمال3916-4075533384--92740297- الرقابة والدعم
المتحملون لمخاطر 2232-155-19439--1617227 8جوهرية
31856-145-266036--241244504563موظفون آخرون63777----8105--665467648908موظفون في الخارج
106978-121691382231669--9307845314326اإلجمالي
2015
نقدا ألف دوالر أمريكي
أسهم
ألف دوالر أمريكيالعددأخرى
ألف دوالر أمريكيالمجموع ألف دوالر
أمريكي
-----الرصيد االفتتاحي2030-22319438011807المكافآت التي تم منحها
المكافآت التي تم دفعها/)138(-)138()149343(-اصدارها
تعديالت الخدمة واألداء ---- -والمخاطر
تغييرات في قيمة المكافآت غير 64-64--المستحقة
1956-22317944581733الرصيد الختامي*

بنك الخليج الدولي | اإلحتفال بمرور 40 عاما
التقرير السنوي 2015 44
المكافآت المؤجلةيخضع الموظفين من منصب نائب رئيس أول )SVP( فما فوق لتأجيل المكافأة المتغيرة وذلك على النحو التالي:-
تقرير حوكمة الشركات تتمة
الموظفين
باأللف دوالر أمريكي
2015
عدد الموظفين
مكافآت ثابتة
مكافآت ممنوحة عند
التوظيفمكافآت مضمونة
مكافآت متغيرة
اإلجمالي
مؤجلةمقدمة
أخرىنقدا)نقدا / أخرىأسهمنقداأسهمنقدا)نقدا / أسهم(أسهم(
االشخاص المعتمدين5478-80714184976--83162335- وحدات األعمال5651-4355130353--133411371- الرقابة والدعم
المتحملون لمخاطر 2561-2073113189--81859262جوهرية
34813-199-295850--254271654441موظفون آخرون74841----7815--8235562711399موظفون في الخارج
122344-122221462271717--11069122416808اإلجمالي
تشمل تكاليف الموظفين األخرى المذكورة في بيان الدخل الموحد والتي لم يتم ذكرها في الجدول السابق والبالغة 6.1 مليون دوالر أمريكي، تكاليف الموظفين غير المباشرة مثل التدريب والتوظيف واشتراكات التأمين على الحياة واالختالف بين نفقات الموظفين المستحقة والمبالغ المدفوعة.
مكونات المكافآت المتغيرة
تخصيص المكافأة المتغيرة
االستردادالضبطاالحتجازمدة التأجيل
الرئيس التنفيذي والمدراء التنفيذيون وأعلى خمس موظفين مرتبا من إدارات
األعمالنائب رئيس أول
فأعلى
نعم--ال يوجد50%40%النقد المقدمنعمنعم6 أشهرال يوجد10%-األسهم المقدمة
نعمنعم -3 سنوات*-10%النقد المؤجلنعمنعم6 أشهر3 سنوات*40%50%مكافآت األسهم المؤجلة
* يتم استحقاق النقد و/أو األسهم المؤجلة على أساس تناسبي على مدى 3 سنوات.
يمكن أن تزيد لجنة الترشيح والمكافآت من تغطية الموظفين الذين يخضعون لترتيبات التأجيل على أن يكون ذلك حسب تقييمها لحجم األدوار والمخاطر التي يتحملها هؤالء الموظفون.
تفاصيل المكافآت المدفوعةمجلس اإلدارة
20152014باأللف دوالر أمريكي
434343أتعاب حضور جلسات االجتماعات
1,1481191أتعاب سنوية ثابتة
995936أخرى *
25772470اإلجمالي
* يمثل بدل لتغطية مصاريف السفر واإلقامة أثناء حضور اجتماعات المجلس واللجان بما في ذلك الرسوم المدفوعة إلى أحد اعضاء مجلس اإلدارة لتقديم خدمات استشارية للبنك بمقابل 360,000 دوالر أمريكي ]2014: 360,000 دوالر أمريكي[.

43 التقرير السنوي 2015
يمكن للجنة الترشيح والمكافآت بعد الحصول على موافقة مجلس اإلدارة ترشيد واتخاذ
القرارات التقديرية التالية:زيادة / تقليل التعديل على تقييم المخاطر بأثر •
رجعيامكانية إجراء تأجيالت اضافية أو زيادة مبلغ •
مكافآت األسهماالستعادة من خالل تعديالت الضبط •
واالستردادإطار الضبط واالسترداد
من شأن أحكام الضبط واالسترداد الخاصة بالبنك أن تتيح للجنة الترشيح والمكافآت تحديد،
متى كان ذلك مالئما، ما إذا كانت العناصر غير المستحقة بموجب خطة المكافآت المؤجلة
يمكن إسقاطها / تعديلها أو ما إذا كان يمكن استرداد المكافآت المتغيرة المقدمة في حاالت معينة. والقصد من ذلك هو تمكين البنك من
االستجابة بشكل مناسب إذا كانت عوامل األداء التي تستند إليها قرارات منح المكافآت تثبت
عدم انعكاس األداء المماثل على المدى الطويل. تشتمل جميع منح المكافآت المؤجلة على
أحكام تمكن البنك من خفض أو إلغاء مكافآت الموظفين الذين كان لسلوكهم الفردي تأثيرا
جوهريا ضارا على البنك خالل عام األداء المعني. تنفرد لجنة الترشيح والمكافآت دون غيرها باتخاذ
أي قرار باستعادة مكافأة أحد األفراد.من شأن أحكام الضبط واالسترداد السماح
للبنك بتحديد، متى كان ذلك مالئما، ما إذا كان من الممكن تعديل/إلغاء العناصر المستحقة/
غير المستحقة في إطار خطة المكافآت المؤجلة في حاالت معينة. وفيما يلي بعض الحاالت
دون حصر:وجود أدلة معقولة بسوء تصرف الموظف أو •ارتكابه لخطأ جوهري مما يتسبب في اإلضرار
بسمعة البنك أو حيثما تصل تصرفات الموظف إلى حد سوء السلوك أو عدم
الكفاءة أو اإلهمال.
تعرض إدارة عمل الموظف لتراجع جوهري •في األداء المالي أو إخفاق جوهري في إدارة
المخاطر أو إعادة صياغة جوهرية للبيانات المالية للبنك.
تضليل الموظف بتعمد للسوق و/أو •المساهمين فيما يتعلق باألداء المالي للبنك.وجود تدهور كبير في الوضع المالي للبنك أو •تكبد أحد إدارات األعمال بالبنك لخسائر مادية.يمكن استخدام االسترداد إذا كان ضبط النسبة
غير المستحقة غير كاف بالنظر إلى طبيعة المسألة وحجمها.
تخضع كافة المكافآت المؤجلة ألحكام الضبط. ويتم صرف كافة مكافآت األسهم لصالح
الموظف بعد ستة )6( أشهر كفترة احتجاز من تاريخ االستحقاق. ويرتبط عدد مكافآت األسهم
بسعر سهم البنك وفقا لقواعد برنامج حوافز األسهم لدى البنك. يتم صرف أي أرباح على
هذه األسهم للموظف جنبا إلى جنب مع األسهم )أي بعد فترة االحتجاز(.
مكونات المكافآت المتغيرةتتألف المكافآت المتغيرة من المكونات الرئيسية التالية:-
جزء من المكافآت المتغيرة يتم منحه ودفعه نقدا فور االنتهاء النقد المقدممن عملية تقييم األداء لكل سنة.
جزء من المكافآت المتغيرة يتم منحه ودفعه نقدا على أساس النقد المؤجلتناسبي على مدى 3 سنوات.
جزء من المكافآت المتغيرة يتم منحه وإصداره في شكل أسهم مكافآت األسهم المقدمةفور االنتهاء من عملية تقييم األداء لكل سنة.
جزء من المكافآت المتغيرة يتم منحه ودفعه في شكل أسهم أسهم مؤجلةعلى أساس تناسبي على مدى 3 سنوات.

بنك الخليج الدولي | اإلحتفال بمرور 40 عاما
التقرير السنوي 2015 42
تقرير حوكمة الشركات تتمة
لكي يحصل البنك على أي تمويل لتوزيع حزمة المكافآت فال بد أن تتحقق األهداف المالية. ومن شأن مقاييس األداء ضمان أن إجمالي
المكافآت المتغيرة تتقلص عموما بشكل جوهري عندما يكون هناك أداء مالي ضعيف أو سلبي. كما تخضع حزمة المكافآت المستهدفة
كما هو موضح أعاله لتعديالت المخاطر بما يتوازى مع إطار عمل االرتباط والتعديل حسب
المخاطر.مكافآت إدارات الرقابة
مستوى مكافآت العاملين في إدارات الرقابة والدعم للبنك يسمح توظيف ذوي الخبرة
والكفاءات العالية في هذه اإلدارات. ويضمن البنك أن مكافآت العاملين في إدارات الرقابة
والدعم مرجحة في صالح المكافآت الثابتة وأما المكافآت المتغيرة لهذه اإلدارات فتستند على
تحقيق أهداف وظيفية وال ترتبط باألداء المالي لمجال األعمال الذي يتم مراقبته.
يلعب نظام إدارة األداء لدى البنك دورا محوريا في قياس أداء إدارات الرقابة والدعم على أساس
األهداف الموضوعة لها. وترتكز هذه األهداف بشكل كبير على األهداف غير المالية والتي
تشمل المخاطر والرقابة واالمتثال واالعتبارات األخالقية وكذلك بيئة السوق والبيئة التنظيمية
فضال عن مهام القيمة المضافة الخاصة بكل إدارة.
المكافآت المتغيرة إلدارات األعمالتتحدد المكافآت المتغيرة إلدارات األعمال بشكل رئيسي بمدى تحقيق أهداف األداء
األساسية المحددة من خالل نظام إدارة األداء. وتشمل هذه األهداف كل من أهدافا مالية وغير
مالية منها السيطرة على المخاطر واعتبارات االمتثال واالعتبارات األخالقية وكذلك بيئة
السوق والبيئة التنظيمية.
إطار تقييم المخاطريوازي إطار تقييم المخاطر لدى البنك بين
المكافآت المتغيرة وحجم المخاطر التي تواجه البنك ويضمن أيضا سياسة المكافآت لدى
البنك تقليل قابلية إقدام الموظفين على أخذ مخاطر كبيرة وغير الضرورية. يراعي البنك تطبيق
المقاييس الكمية والنوعية في عملية تقييم المخاطر والتعديالت حسب المخاطر بهدف
ضمان أن سياسات المكافآت لدى البنك تتماشى مع درجة إقباله على المخاطر.
تأخذ لجنة الترشيح والمكافآت بعين االعتبار كون سياسة المكافآت المتغيرة منسجمة مع توزيع
مخاطر البنك. ويضمن تطبيق إطار وعمليات تقييم المخاطر حسب التوقعات المستقبلية
والتقييم بأثر رجعي، التقييم الدقيق للممارسات المكافآت القائمة على اإليرادات المستقبلية
المحتملة والتي تكون ذات توقيت وتحقق غير مضمون.
تأخذ تعديالت المخاطر بعين االعتبار جميع أنواع المخاطر بما في ذلك المخاطر غير الملموسة
والمخاطر االخرى مثل مخاطر السمعة ومخاطر السيولة وكلفة رأس المال. ويقوم البنك
بتقييم المخاطر من أجل مراجعة األداء المالي والتشغيلي في مقابل استراتيجية األعمال وأداء المخاطر قبل توزيع المكافآت السنوية. ويتأكد
البنك على أن إجمالي المكافآت المتغيرة ال يحد من قدرته على تعزيز قاعدة رأس المال.
يراعى في حزمة المكافآت أداء البنك والذي ينظر فيه في سياق إطار إدارة المخاطر لدى البنك.
وهذا يضمن تشكيل حزمة المكافآت المتغيرة حسب اعتبارات المخاطر واألحداث البارزة على
مستوى البنك.يراعى في تحديد حجم حزمة المكافآت المتغيرة كامل نطاق المخاطر الحالية والمحتملة، ومنها:
رأس المال المطلوب لدعم المخاطر التي تم •تحملها.
مستوى مخاطر السيولة المفترض عند أداء •األعمال.
االتساق مع توقيت ومدى احتمال تحقق •العوائد المستقبلية المحتملة المتضمنة في
األرباح الحالية.تطلع لجنة الترشيح والمكافآت دوما على
أداء البنك باالعتماد على إطار إدارة المخاطر. وتستخدم لجنة الترشيح والمكافآت هذه
المعلومات عند النظر في المكافآت لضمان المواءمة بين العوائد والمخاطر والمكافآت.
التعديالت حسب المخاطريمتلك البنك إطارا لتقييم المخاطر الالحقة، وهو
تقييم نوعي لدعم اختبار األداء الفعلي مقابل افتراضات المخاطر.
وفي السنوات التي يعاني فيها البنك من خسائر جوهرية في أدائه المالي، يعمل إطار تعديالت
المخاطر على النحو التالي:يكون هناك انخفاض كبير في إجمالي •
المكافآت المتغيرة لدى البنكعلى المستوى الفردي، يعني أداء البنك •
الضعيف عدم الوفاء بمؤشرات األداء الرئيسية لألفراد، وبالتالي ستنخفض
معدالت أداء الموظفهبوط قيمة األسهم أو المكافآت المؤجلة •
تغيرات محتملة في فترات االستحقاق •والتأجيل اإلضافي المطبق على المكافآت غير
المستحقةوأخيرا، إذا اعتبر التأثير النوعي والكمي ألي •خسارة كبيرا، يجوز هنا مراعاة حق تعديل أو
استرداد المكافآت السابقة

41 التقرير السنوي 2015
من أجل ضمان المواءمة بين ما يدفع للموظفين واستراتيجية األعمال، يقوم بنك الخليج الدولي بتقييم أداء البنك ككل وأداء
األقسام واألفراد مقابل األهداف المالية وغير المالية السنوية وطويلة المدى التي تم تلخيصها
بما يتماشى مع تخطيط األعمال وعملية إدارة األداء. ويراعى في هذا التقييم االلتزام بقيم البنك ومقاييس المخاطر واالمتثال، وقبل كل شيء العمل بنزاهة. وبشكل عام، يكون
الحكم على هذا األداء ليس فقط بناء على ما تم تحقيقه على المدى القصير أو الطويل ولكن
أيضا وبشكل هام كيفية تحقيق ذلك إذ من شأن هذه النقطة األخيرة أن تسهم في استدامة
العمل على المدى الطويل.دور لجنة الترشيح والمكافآت ومدار تركيزهاتشرف لجنة الترشيح والمكافآت على كافة
سياسات المكافآت المقدمة لموظفي البنك. حيث تعتبر اللجنة هي الجهة اإلشرافية
والمنظمة لسياسة وممارسات وخطط األجور والمكافآت والحاكمة لها. كما تضطلع بوضع
سياسة المكافآت المتغيرة ومراجعتها وإحالتها إلى مجلس اإلدارة العتمادها. وهي مسؤولة عن وضع المبادئ وإطار عمل الحوكمة لكافة قرارات األجور والتعويضات. وتضمن اللجنة
تلقي جميع األشخاص لمكافآتهم بشكل عادل ومسؤول. وتتم مراجعة سياسة المكافآت على أساس دوري لكي تعكس التغيرات التي تحدث
في ممارسات السوق وخطة األعمال وحجم المخاطر لدى البنك.
بلغ مجموع المكافآت المدفوع ألعضاء لجنة الترشيح والمكافآت خالل العام على شكل
أتعاب حضور جلسات االجتماعات 45,000 دوالر أمريكي ]2014: 51,000 دوالر أمريكي[.
المستشارون الخارجيونتم تعيين مستشارين خالل عام 2014 لتقديم
المشورة إلى البنك بشأن التعديالت المدخلة على سياسة المكافآت المتغيرة لديه حتى
تتماشى مع الممارسات السليمة للمكافآت الصادرة عن مصرف البحرين المركزي ومع
المعايير المعهودة في المجال. واشتمل هذا على المساعدة في وضع خطة مناسبة للحوافز على أساس األسهم. كما عينت لجنة الترشيح
والمكافآت مستشارين خالل العام ألداء مقارنة مرجعية لألجور من أجل مساعدتهم في مراجعة إجمالي األجور والمكافآت التي يقدمها البنك.
نطاق تطبيق سياسة المكافآتتنطبق مبادئ هذه السياسة الخاصة بالمكافآت
على مستوى المجموعة. بيد أن تطبيق متطلبات التأجيل وإصدار األدوات غير النقدية
للفروع األجنبية والشركات التابعة للبنك تحدده اللوائح المحلية السارية والقواعد المتبعة في
السوق.مكافآت مجلس اإلدارة
تتحدد مكافآت مجلس اإلدارة من قبل الشركاء وبما يتماشى مع النظام االساسي للبنك،
وترتبط المكافآت بالحضور الفعلي لالجتماعات. ويعتمد هيكل ومستوى مكافآت أعضاء
المجلس في اجتماع الجمعية العامة ويتكون مما يلي:
أتعاب حضور اجتماعات مجلس اإلدارة •واللجان التابعة له.
عالوة تغطية نفقات السفر واإلقامة عند •حضور اجتماعات المجلس واللجان التابعة له.
مبلغ ثابت ومحدد مسبقا يمثل األتعاب •السنوية ألعضاء المجلس.
في 2015، بلغ مجموع األجور والمكافآت المدفوعة ألعضاء مجلس اإلدارة وكبار موظفي
اإلدارة 9.4 مليون دوالر أمريكي ]2014: 8.6 مليون دوالر أمريكي[ من بينها 2.6 مليون دوالر أمريكي ]2014: 2.5 مليون دوالر أمريكي[ دفعت ألعضاء
مجلس اإلدارة.المكافآت المتغيرة للموظفين
المكافآت المتغيرة هي مكافآت تتعلق باألداء وتتألف في المقام األول من مكافأة األداء
السنوي. وترتبط المكافآت السنوية باعتبارها جزءا من المكافآت المتغيرة للموظفين بتحقيق األهداف التشغيلية والمالية المحددة كل سنة
واألداء الفردي للموظفين في تحقيق هذه األهداف ومدى إسهامهم في تحقيق األهداف
االستراتيجية للبنك.اتبع البنك إطار عمل معتمد من قبل مجلس اإلدارة بهدف تحقيق شفافية بين المكافآت
المتغيرة واألداء. وقد تم تصميم إطار العمل على أساس الجمع بين األداء المالي والعوامل غير المالية األخرى لتحقيق الحزمة المستهدفة لمكافآت الموظفين وذلك قبل النظر في أي
تخصيص للمكافأة لدوائر األعمال وللموظفين بشكل فردي. وفي إطار العمل المتبع في تحديد
حزمة المكافآت المتغيرة، تهدف لجنة الترشيح والمكافآت إلى موازنة توزيع أرباح البنك بين
المساهمين والموظفين.
تتضمن مقاييس األداء الرئيسية على مستوى البنك مجموعة من المقاييس قصيرة وطويلة األجل والتي تشمل مؤشرات الربحية والمالءة
المالية والسيولة والنمو. وتضمن عملية إدارة األداء تحديد األهداف بالشكل المناسب
للوحدات األعمال ذات الصلة والموظفين المعنيين.
يبدأ البنك عند تحديد مقدار المكافآت المتغيرة بوضع أهداف محددة ووضع مقياس تصاعدي يمكن مقارنته في السوق وتحديد أهداف الربح
وغير ذلك من مقاييس األداء النوعية والتي ينتج عنها في نهاية المطاف حزمة تنازلية مستهدفة
للمكافآت. ثم يتم تعديل حزمة المكافآت بحيث تراعي المخاطر من خالل استخدام المقاييس
المعدلة حسب المخاطر.تقيم لجنة الترشيح والمكافآت بعناية
الممارسات التي يتم بموجبها دفع المكافآت بناء على اإليرادات المستقبلية المحتملة التي
تزال توقيتها واحتمالية تحقيقها غير مؤكدة. وتتخذ اللجنة قراراتها بناء على تقييم الوضع
المالي للبنك وتطلعاته المستقبلية.يتبع البنك اجراءات رسمية وشفافة لتعديل
حزمة المكافآت حسب جودة األرباح. ويسعى البنك إلى دفع المكافآت من األرباح المحققة والمستدامة. فإذا كانت األرباح ليست قوية، فسوف يتم تعديل قاعدة األرباح وفق تقدير
لجنة الترشيح والمكافآت.

بنك الخليج الدولي | اإلحتفال بمرور 40 عاما
التقرير السنوي 2015 40
تقرير حوكمة الشركات تتمة
اإلعداد والتدريب المستمر ألعضاء مجلس اإلدارة
يتلقى مجلس اإلدارة واللجان المنبثقة عنه وبشكل منتظم التحديثات التي تطرأ على
أهم التطورات في المجال التنظيمي وبقية المجاالت التي تقع في نطاق مسؤولياتهم )مثل التحديثات بشأن معايير المحاسبة الدولية ولوائح المكافآت الصادرة عن مصرف البحرين المركزي(.
وأكد المجلس أيضا على أهمية توفير فرص التدريب والتطوير ألعضائه. فقد أصدر المجلس
قرارا لتشجيع األعضاء على الحصول على التدريب الذي يرونه ضروريا، وذلك على نفقة البنك، كما يتم إطالع األعضاء باستمرار على
فرص التدريب المتوفرة.اإلدارة العليا
تتولى اإلدارة العليا مسئولية إدارة أعمال البنك اليومية والمفوضة إليها من قبل مجلس
اإلدارة، ويتولى الرئيس التنفيذي رئاسة هذه اإلدارة ويساعده رئيس الشئون المالية، ورئيس إدارة المخاطر، ورئيس إدارة العمليات، ورئيس
األعمال المصرفية بالجملة، ورئيس األعمال المصرفية لألفراد، ورئيس إدارة االستثمار
والخزينة، ورئيس تقنية المعلومات، ورئيس الموارد البشرية. وقد وردت تفاصيل السيرة
الذاتية للمدراء التنفيذيين في الصفحة رقم 50 من التقرير السنوي.
ولمساعدة الرئيس التنفيذي تم تشكيل اللجان اإلدارية التالية:
لجنة اإلدارة. •لجنة المخاطر للمجموعة. •
لجنة الموجودات والمطلوبات. •لجنة الموارد البشرية. •
لجنة أمن المعلومات. •لجنة المخاطر التشغيلية. •
وتستمد هذه اللجان صالحياتها من الرئيس التنفيذي وفقا للسلطات والحدود التي يقررها له
مجلس اإلدارة.ولغرض تسيير األعمال اليومية ألنشطة البنك،
يتطلب من اإلدارة العليا تطبيق السياسات والوسائل الرقابية الفعالة التي يقرها مجلس
اإلدارة في إطار استراتيجية وأهداف البنك التي يضعها المجلس.
وقد صدرت خطابات التعيين إلى فريق اإلدارة العليا لتحديد مسئولياتهم وواجباتهم للمساعدة
والمساهمة في األمور التالية:-تحديد األهداف االستراتيجية وتوجه البنك. •
وضع الميزانية السنوية وخطة العمل للبنك. •ضمان وجود وتنفيذ السياسات العليا الخاصة •
بكافة أعمال للبنك.وضع األطر الخاصة بإدارة المخاطر والعوائد •المستهدفة في نطاق السياسة المسموح
بها.تحديد المعايير العامة لتقييم األداء استنادا •
إلى مستوى المخاطر المحدد.المراجعة الدورية ألداء األقسام المختلفة •
واتخاذ اإلجراءات الالزمة عند الحاجة.التأكد من أن البنك ينفذ جميع أنشطته وفقا •ألعلى المعايير األخالقية وااللتزام بالقوانين
وبقواعد السلوك المهني.العمل على جعل البنك مثاال يحتذى به في •االلتزام بأفضل الممارسات المهنية وخدمة
العمالء.كما أشارت خطابات التعيين إلى أن هذه
الواجبات تعتبر إضافة إلى مسئولياتهم الوظيفية المحددة واألهداف التي وضعت لهم حسب ما
جاء في دليل سياسات البنك.األجور والمكافآت
تحدد سياسة إجمالي األجور والمكافآت بالبنك، والتي تشمل سياسة المكافآت المتغيرة،
سياسة البنك تجاه مكافآت أعضاء مجلس اإلدارة واإلدارة العليا والعوامل الرئيسية التي
روعيت في وضع هذه السياسة.في عام 2014، اتبع البنك ممارسات المكافآت السليمة الصادرة عن مصرف البحرين المركزي
وقام بتحديث إطار العمل الخاص لديه بالمكافآت المتغيرة. وقد اعتمد مجلس اإلدارة
إطار عمل سياسة ومكونات التحفيز المعدلة والحصول على موافقة المساهمين عليها
في اجتماع الجمعية العامة في 2015. وفيما يلي ملخص ألهم سمات إطار العمل الخاص
بالمكافآت.
استراتيجية المكافآتإن من فلسفة البنك في األجور والمكافآت تقديم مستوى تنافسي من إجمالي األجور لجذب والحفاظ وتحفيز الموظفين األكفاء
المؤهلين. فالدافع الرئيسي وراء سياسة البنك للمكافآت المتغيرة هو الثقافة القائمة على
مستوى األداء التي توائم بين مصالح الموظفين ومصالح مساهمي البنك. وتساهم هذه
العناصر تحقيق األهداف الموضوعة من خالل التوازن بين المكافآت الممنوحة مقابل تحقيق
نتائج على المدى القصير واألداء المستدام على المدى الطويل. وقد وضعت هذه االستراتيجية بهدف مشاركة نجاحات البنك ومواءمة حوافز
الموظفين مع إطار المخاطر.تعتبر كفاءة الموظفين والتزامهم على المدى
الطويل هما العامالن األساسيان لنجاح البنك. ولهذا يسعى البنك إلى جذب واحتفاظ وتحفيز
أفضل الكفاءات والكوادر الملتزمة باستمرار في العمل لدى البنك من أجل مصلحة المساهمين على المدى الطويل. تتألف حزمة المكافآت لدى
البنك من العناصر الرئيسية التالية:األجر الثابت •
المزايا •مكافآت األداء السنوية •
خطة أسهم منحة مؤجلة •يضمن إطار حوكمة قوي وفعال أن البنك
يعمل وفق معايير واضحة الستراتيجية وسياسة األجور والمكافآت لديه. حيث تخضع كافة أمور
األجور والمكافآت واالمتثال الكامل للمتطلبات التنظيمية إلشراف لجنة الترشيح والمكافآت
التابعة لمجلس اإلدارة.تأخذ سياسة المكافآت لدى البنك بعين االعتبار
دور كل موظف وتحدد التوجيهات بناء على مدى كون الموظف متحمل لمخاطر جوهرية و/أو شخص معتمد في دوائر األعمال أو وظائف
الرقابة أو الدعم. الشخص المعتمد هو الموظف الذي يستلزم تعيينه الموافقة المسبقة من
الجهات الرقابية نظرا ألهمية دوره في البنك كما يعتبر الموظف متحمال لمخاطر جوهرية إذا كان
يرأس احدى دوائر األعمال الهامة وأي شخص يقع ضمن إدارته ممن لهم أثر ملموس على
حجم المخاطر لدى البنك.

39 التقرير السنوي 2015
مراجعة تقارير التعرض للمخاطر االئتمانية -على أساس الدولة، التصنيف االئتماني،
الصناعة/التركيز، القروض المتعثرة وكذلك تقارير اختبار التحمل.
استالم التقارير بشأن السيولة ومخاطر -.)VaR( األسواق
تلقي آخر المستجدات بشأن إدارة المخاطر -التشغيلية.
تلقي آخر المستجدات بشأن مخاطر شبكة -االنترنت.
تلقي آخر المستجدات بشأن مخاطر نظم -تكنولوجيا المعلومات.
استالم التقارير بشأن تغير موافقات االئتمان -أو تمديد االئتمان، مقاييس مخاطر االئتمان
والسوق، وإجراءات مراقبة المخاطر.تلقي آخر المستجدات بشأن مخاطر الخدمات -
المصرفية لألفراد.لجنة الترشيح والمكافآت
إن الهدف الرئيسي لهذه اللجنة هو مساعدة مجلس االدارة في ضمان الحفاظ على تقديم
مستويات أجور ومكافآت تنافسية حتى يتمكن البنك من االستمرار في استقطاب والمحافظة
على وتشجيع الكوادر الكفؤة من أجل تنفيذ استراتيجية البنك وتحقيق أهدافه. وتشمل
مسئوليات اللجنة، كما هو مبين في الئحة مهام عمل اللجة، ما يلي:-
شئون التعيين:تقييم المهارات والقدرات المطلوبة في •
المجلس واللجان المنبثقة عنه واإلدارة العليا.تقييم دوري لمدى تحقق وجود المهارات •
المطلوبة في مجلس اإلدارة واإلدارة العليا.وضع إجراءات لمراجعة أداء أعضاء مجلس •
اإلدارة منفردين ومجتمعين.
وضع إجراءات لمراجعة أداء أعضاء اإلدارة •التنفيذية والعليا منفردين ومجتمعين.
اإلشراف على األنشطة التعليمية لمجلس •اإلدارة الخاصة بحوكمة الشركات.
وضع إجراءات لتحديد المرشحين المناسبين •لشغل المناصب اإلدارية العليا، وتزكية
األشخاص المؤهلين لشغل هذه المناصب.وضع خطة اإلحالل ألعضاء اإلدارة العليا. •
شئون المكافآت:مراجعة وتقديم التوصيات الى مجلس اإلدارة
بشأن:-سياسة المكافآت والحوافز التنفيذية •
التي تتضمن المكافآت الثابتة والمتغيرة لألشخاص المعتمدين و/أو متحملي المخاطر
الجوهرية.السياسات المتعلقة بتعيين واالحتفاظ •
وتقييم االداء وعزل أعضاء مجلس اإلدارة والرئيس التنفيذي وفريق اإلدارة العليا.
اعتماد نظام المكافآت ومراقبته ومراجعته •لضمان عمل هذا النظام وفق المخطط له.
اعتماد مبالغ المكافآت لكل شخص معتمد •ومتحمل للمخاطر الجوهرية وكذلك إجمالي المكافآت المتغيرة المقرر توزيعه مع األخذ
في االعتبار إجمالي المكافآت بما يشمل الرواتب والرسوم والمصاريف والمكافأة
السنوية وغيرها من مزايا الموظفين.مراجعة نتائج اختبار التحمل واالختبار الرجعي •
قبل اعتماد إجمالي المكافآت المتغيرة المراد توزيعه بما في ذلك الرواتب والرسوم والمصاريف والمكافأة السنوية وغيرها من
مزايا الموظفين.لجنة حوكمة الشركات:
دور اللجنة هو مساعدة المجلس في تشكيل ورصد سياسات حوكمة الشركات. وتشمل
مسؤوليات اللجنة:اإلشراف على تطوير ومتابعة سياسات •
حوكمة الشركات.
مراقبة التزام البنك بالمتطلبات التنظيمية •المتعلقة بحوكمة الشركات.
مراجعة مهام وتقييم أداء عمل المجلس •ولجانه والتوصية إلى المجلس بالتحديثات
الضرورية لتحسين نظام ومهام عمل المجلس ولجانه.
مراجعة تصنيف أعضاء مجلس اإلدارة •ومراجعة البيانات الصادرة عن أعضاء المجلس
وأعضاء اإلدارة العليا بشأن أنشطتهم ومصالحهم الخارجية للتحقق من مدى
وجود تضارب في المصالح واتخاذ الخطوات المناسبة في هذا الصدد.
اإلشراف على إعداد التقارير العامة للبنك •بشأن مسائل حوكمة الشركات.
تقييم مجلس اإلدارةإن نظام ولوائح مهام عمل مجلس اإلدارة ولجانه
تتطلبان قيام المجلس بإجراء تقييم ألدائه، أداء اللجان التابعة له وأداء أعضاء المجلس مرة
واحدة سنويا على األقل. وقد قام المجلس بمراجعة تقارير مستقلة بشأن االداء من كافة
اللجان التابعة له، إضافة الى تقرير بشأن أدائه، لتقييم االنشطة الرئيسية خالل العام ومقارنتها
بلوائح المهام. فضال عن ذلك، تضمن تقييم أداء أعضاء المجلس معايير تقييم يمكن قياسها
وتقييما ذاتيا ورأي رئيس مجلس اإلدارة بهذا الخصوص. كما يتم تزويد المساهمين أثناء اجتماع الجمعية العامة تقريرا بشأن عمليات
التقييم التي تجري سنويا.

بنك الخليج الدولي | اإلحتفال بمرور 40 عاما
التقرير السنوي 2015 38
اجتماعات مجلس اإلدارة واللجان المنبثقة عنه خالل عام 2015
تاريخ االجتماعنوع االجتماع
1.مجلس اإلدارة.2.3.4.5.6
13 فبراير 201512 مارس 201524 أبريل 201510 يوليو 20152 أكتوبر 2015
11 ديسمبر 2015
1.اللجنة التنفيذية.2.3.4.5.6.7
12 مارس 201524 أبريل 20154 يونيو 2015
10 يوليو 201528 أغسطس 2015
2 أكتوبر 201511 ديسمبر 2015
1.لجنة التدقيق.2.3.4.5
12 فبراير 201523 أبريل 20159 يوليو 2015
22 أكتوبر 201510 ديسمبر 2015
1.لجنة الترشيح والمكافآت.2.3.4.5
31 يناير 201512 مارس 201523 أبريل 201510 يوليو 2015
17 سبتمبر 2015
1.لجنة سياسات المخاطر.2.3.4
12 فبراير 201523 أبريل 201510 يوليو 2015
22 أكتوبر 2015
1.لجنة حوكمة الشركات.2
12 فبراير 201510 ديسمبر 2015
تقرير حوكمة الشركات تتمة
اللجنة التنفيذيةتشمل صالحيات اللجنة التنفيذية ما يلي:-
مساعدة مجلس اإلدارة في وضع السياسات •التنفيذية للبنك ومتابعة تنفيذها.
تقديم المساعدة لمجلس اإلدارة من خالل •مراجعة وتقييم وتقديم التوصيات إلى
المجلس بشأن القضايا االستراتيجية للبنك، أو بشأن التطورات الهامة في توجه وأهداف
البنك االستراتيجية.الموافقة على مبالغ االئتمان التي تتجاوز •
صالحيات الرئيس التنفيذي للبنك وذلك في نطاق الحدود المخولة لها من قبل مجلس
اإلدارة.تنفيذ المهام اإلضافية التي يكلفها بها •
مجلس اإلدارة.
القيام بصالحيات مجلس اإلدارة لمعالجة •القضايا التي لم يصدر فيها المجلس قرارا
في الظروف الطارئة التي يصعب فيها عقد اجتماع مجلس اإلدارة، وذلك وفق القوانين
ذات الصلة واتفاقية التأسيس والنظام األساسي للبنك. ويمكن لمجلس اإلدارة أن
يقوم باإلجماع بتغيير أو تعديل أي من قرارات اللجنة التنفيذية التي يتم اتخاذها.
وفي كافة األحوال فإن على أعضاء اللجنة التنفيذية ممارسة مهامهم واتخاذ القرارات
بشكل يضمن مصالح البنك ومساهميه.لجنة التدقيق
إن مهمة لجنة التدقيق هي مراجعة الوضع المالي للبنك وتقديم التوصيات الى مجلس االدارة بشأن األمور المالية والرقابة الداخلية
وااللتزام باألنظمة والمتطلبات القانونية. أما مسؤولياتها الرئيسية فتتضمن:
مساعدة مجلس اإلدارة في اإلشراف على •دقة التقارير الخاصة بالبيانات المالية ربع
السنوية والسنوية للبنك، االلتزام باألنظمة والقوانين، نظم الرقابة الداخلية، وضمان
استقاللية المدققين الداخليين والخارجيين وحسن أدائهم.
اإلشراف على أداء وكفاءة التدقيق الداخلي •للبنك واستقالل المدقق الداخلي.
وتوفر الئحة صالحيات اللجنة التفاصيل الضرورية بشأن عمليات إعداد التقارير المالية
وطرق تطويرها، إضافة إلى المسئوليات بشأن االلتزامات القانونية واألخالقية. يخضع رئيس
دائرة التدقيق الداخلي مباشرة تحت اشراف لجنة التدقيق ويتبع الرئيس التنفيذي في االمور
اإلدارية.لجنة سياسات المخاطر
تساعد لجنة سياسات المخاطر مجلس اإلدارة في القيام بمسئولياته فيما يتعلق بالضوابط المتبعة لضمان االلتزام بحدود المخاطر التي
يحددها البنك. وتعمل اللجنة بصورة مستمرة على:
ضمان قيام البنك بتوثيق سياسات واقعية •إلدارة المخاطر والموافقة عليها.
استالم، مراجعة، بحث وتقديم التوصيات •لمجلس اإلدارة بشأن المقترحات بتعديل
حدود المخاطر المسموح بها.مراقبة سعي اإلدارة إلى إيجاد بيئة تشجع •
وتكافئ مناقشة المخاطر المحتملة واإلبالغ عنها وإدارتها بفعالية.
التأكد من وضوح األدوار والمسئوليات •المتعلقة بإدارة المخاطر، مع تحمل رؤساء
األقسام للمسئولية المباشرة. وكذلك التأكد من استقاللية مسئولو إدارات المخاطر والرقابة عن أنشطة تطوير أعمال البنك.
ضمان قيام اإلدارة باطالع اللجنة على أي •استثناء أو تجاوز ملحوظ لحدود المخاطر
المسموح بها لمراجعتها. التأكد من قيام اإلدارة باطالع اللجنة دوريا •على كافة المخاطر المهمة التي قد تواجه
أعمال البنك واالطالع على اإلجراءات المتخذة لمعالجتها بشكل فعال.
مراجعة حدود المخاطر المسموح بها •والمخاطر التي قد يتعرض لها البنك نتيجة
ألنشطته، وتشمل:

37 التقرير السنوي 2015
لجان مجلس اإلدارةتستمد لجان مجلس اإلدارة صالحياتها من المجلس. ويتضمن الجدول التالي قائمة بأعضاء مجلس اإلدارة وسجل حضورهم لالجتماعات:-
عضوية لجان مجلس اإلدارة )يناير – يوليو 2015(
المنصباسم العضولجان مجلس اإلدارة
معالي جماز بن عبدالله السحيمياللجنة التنفيذيةمعالي الدكتور حمد بن سليمان البازعي
معالي األستاذ سليمان بن عبدالله الحمدانبروفيسور عبدالله بن حسن العبدالقادر
رئيس عضو عضوعضو
بروفيسور عبدالله بن حسن العبدالقادرلجنة التدقيقاألستاذ خالد بن صالح المديفر
األستاذ عمر هدير الفارسي
رئيس عضوعضو
معالي األستاذ سليمان بن عبدالله الحمدانلجنة الترشيح والمكافآتاألستاذ عبدالله بن محمد الزامل
األستاذ خالد بن صالح المديفر
رئيس عضوعضو
معالي الدكتور حمد بن سليمان البازعيلجنة سياسات المخاطراألستاذ عبدالله بن محمد الزامل
األستاذ عمر هدير الفارسي
رئيس عضوعضو
بروفيسور عبدالله بن حسن العبدالقادرلجنة حوكمة الشركاتاألستاذ عبدالله بن محمد الزامل
األستاذ خالد بن صالح المديفر
رئيس عضوعضو
عضوية لجان مجلس اإلدارة )أغسطس – ديسمبر 2015(
المنصباسم العضولجان مجلس اإلدارة
معالي جماز بن عبدالله السحيمياللجنة التنفيذيةمعالي األستاذ سليمان بن عبدالله الحمدان
بروفيسور عبدالله بن حسن العبدالقادراألستاذ عمر هدير الفارسي
رئيس عضو عضوعضو
بروفيسور عبدالله بن حسن العبدالقادرلجنة التدقيقاألستاذ خالد بن صالح المديفر
األستاذ عمر هدير الفارسي
رئيس عضوعضو
معالي األستاذ سليمان بن عبدالله الحمدانلجنة الترشيح والمكافآتاألستاذ عبدالله بن محمد الزامل
األستاذ خالد بن صالح المديفر
رئيس عضوعضو
األستاذ عمر هدير الفارسيلجنة سياسات المخاطراألستاذ عبدالله بن محمد الزاملالدكتور يحيى بن عبدالله اليحيى
رئيس عضوعضو
بروفيسور عبدالله بن حسن العبدالقادرلجنة حوكمة الشركاتاألستاذ عبدالله بن محمد الزامل
األستاذ خالد بن صالح المديفر
رئيس عضوعضو

بنك الخليج الدولي | اإلحتفال بمرور 40 عاما
التقرير السنوي 2015 36
استقاللية أعضاء مجلس اإلدارةتخضع معايير استقاللية عضو مجلس اإلدارة
للمراجعة السنوية من قبل مجلس اإلدارة. وبتاريخ 31 ديسمبر 2015 تضمن مجلس اإلدارة
عضوين غير مستقلين وذلك وفقا ألنظمة مصرف البحرين المركزي، فيما تم تصنيف بقية
األعضاء كمستقلين )أنظر الجدول في الصفحة أدناه(.
مسئوليات مجلس اإلدارةيتولى مجلس اإلدارة مسئولية اإلشراف على األداء العام وتحديد التوجه االستراتيجي للبنك.
يقوم مجلس اإلدارة بتحديد أهداف البنك، واعتماد االستراتيجية العامة ومراجعتها سنويا،
ووضع الهيكل اإلداري ومسئولياته وأنظمة وأطر الرقابة. باإلضافة إلى ذلك يقوم مجلس اإلدارة
بمراقبة أداء اإلدارة التنفيذية ومدى تطبيقهم لالستراتيجية المحددة. كذلك يقوم بمراقبة تضارب المصالح ومنع أي إساءة استغالل
للنفوذ من األطراف ذات العالقة.
باإلضافة إلى ذلك، فإن مجلس اإلدارة مسئول عن إعداد تقارير مالية موحدة وصادقة تعبر عن
الوضع المالي الحقيقي للبنك وفق المعايير الدولية للتقارير المالية، وعن تحديد أطر الرقابة
الداخلية بما يضمن إعداد التقارير المالية الموحدة دون أخطاء جوهرية.
كما يقوم مجلس اإلدارة بإعداد جدول أعمال اجتماع الجمعية العامة، ويضمن المساواة في المعاملة بين جميع المساهمين مهما تفاوتت
نسبة مساهمتهم.أخيرا، يمارس مجلس اإلدارة مسئولياته كهيئة
إشرافية ويفوض إلدارة البنك مسئولية القيام بالمهام اليومية المطلوبة منها حسب
السياسات والقواعد التي يحددها المجلس.عندما يجري التحضير لعقد اجتماع لمجلس
اإلدارة أو اللجان المنبثقة عنه، يتم تزويد أعضاء المجلس بالتقارير الدورية وكافة المعلومات الالزمة لهذه االجتماعات مسبقا، باإلضافة
إلى المعلومات المحددة التي يطلبها األعضاء
من حين آلخر. كما يتم تزويد أعضاء مجلس اإلدارة بالتقارير المالية الشهرية وغيرها من
التقارير اإلدارية الدورية التي تمكنهم من تقييم أداء البنك وإدارته التنفيذية حسب األهداف
المرسومة. ويعقد مجلس اإلدارة، وفقا للنظام األساسي للبنك، ما ال يقل عن أربعة اجتماعات سنويا، ويجوز له أن يعقد اجتماعات إضافية إذا
دعت الحاجة إلى ذلك.ولم يناقش مجلس االدارة خالل عام 2015
أية قضايا خارجة عن نطاق االعمال العادية أو المسئوليات الموكلة له.
يتضمن الجدول التالي قائمة بأعضاء مجلس اإلدارة وسجل حضورهم لالجتماعات خالل عام
-:2015
تقرير حوكمة الشركات تتمة
جدول حضور اجتماعات مجلس اإلدارة واللجان المنبثقة عنه خالل الفترة من يناير – ديسمبر 2015
أعضاء مجلس اإلدارة
اجتماعات مجلس اإلدارة
اجتماعات اللجنة
التنفيذية اجتماعات
لجنة التدقيق
اجتماعات لجنة الترشيح
والمكافآت
اجتماعات لجنة
سياسات المخاطر
اجتماعات لجنة حوكمة
الشركاتتنفيذي/ غير
تنفيذيمستقل/ غير
مستقل
معالي جماز بن عبدالله السحيمي، رئيس مجلس اإلدارة
مستقلغير تنفيذي 6)7(6)6(
معالي الدكتور حمد بن سليمان البازعي، نائب رئيس مجلس اإلدارة *
غير مستقلغير تنفيذي3)3(4)4(4)4(
معالي األستاذ سليمان بن عبدالله الحمدان،نائب رئيس مجلس اإلدارة
مستقلغير تنفيذي5)5(7)7(6)6(
مستقلغير تنفيذي2)2(5)5(7)7(6)6(بروفيسور عبدالله بن حسن العبدالقادر
مستقلغير تنفيذي2)2(4)4(5)5(6)6(األستاذ عبدالله بن محمد الزامل
مستقلغير تنفيذي2)2(5)5(5)5(6)6(األستاذ خالد بن صالح المديفر
غير مستقلغير تنفيذي4)4(5)5(3)3(6)6(األستاذ عمر هدير الفارسي
غير مستقلتنفيذي1)1(2)2(الدكتور يحيى بن عبدالله اليحيى**
* إنتهت فترة العضوية في المجلس في أغسطس 2015** عين في أغسطس 2015
الرقم بين القوسين يشير الى العدد االجمالي لالجتماعات خالل السنة.

35 التقرير السنوي 2015
المساهمون
يظهر الجدول التالي الجهات المساهمة في البنك ونسبة ملكيتها فيه:-
النسبة المئويةاسم المساهم
97.226%صندوق االستثمارات العامة - المملكة العربية السعودية
0.730%الهيئة العامة لالستثمار - دولة الكويت
0.730%شركة قطر القابضة - دولة قطر
0.438%شركة ممتلكات البحرين القابضة - مملكة البحرين
0.438%صندوق اإلحتياطي العام للدولة - سلطنة عمان
0.438%جهاز اإلمارات لالستثمار - دولة اإلمارات العربية المتحدة
الهيكل التنظيمي – القواعد واألدوارإن الهيكل التنظيمي للحوكمة في بنك الخليج
الدولي يحدد ويفصل بين مسئوليات ومهمات مجلس اإلدارة من جهة ومسئوليات وصالحيات
اإلدارة التنفيذية من جهة أخرى، ويعمل على ضمان تحقيق هذا التحديد والفصل والمحافظة
عليهما: يتولى مجلس اإلدارة مسئولية توجيه البنك •واإلشراف على أعماله، ويتلقى من اإلدارة التنفيذية المعلومات الالزمة لتمكينه من
القيام بمسئولياته وتمكين اللجان المنبثقة عنه من القيام بالمهام المناطة بها على أكمل وجه. كذلك فإن المجلس يفوض إدارة البنك السلطات والصالحيات الالزمة لتنفيذ أعمال
البنك اليومية.الهيكل التنظيمي إلدارة البنك مناسب •
وفعال، مما يمكنها من تولي مسئولية اإلدارة اليومية ألعمال البنك وتنفيذ
استراتيجيته وسياسته وأعمال الرقابة الداخلية التي يقرها مجلس اإلدارة.
تم الفصل بين مهام ومسئوليات مجلس •اإلدارة ومهام ومسئوليات اإلدارة التنفيذية
من جهة، وبين مهام ومسئوليات رئيس مجلس اإلدارة والرئيس التنفيذي من جهة
أخرى.تم تحديد وتوثيق الصالحيات والمسئوليات •
)وكذلك صالحيات التفويض( لإلدارة التنفيذية.
وقد ورد الهيكل التنظيمي وهيكل الحوكمة للبنك في الصفحة رقم 52 من التقرير السنوي.
مجلس اإلدارةينص نظام البنك األساسي على تشكيل
مجلس إدارة من عشرة أعضاء كحد أقصى يتم تعيينهم أو انتخابهم كل ثالث سنوات، كما
يمنح كل مساهم يملك عشرة بالمائة من رأس المال الحق بتعيين عضو في المجلس، ولهذا
المساهم كذلك صالحية إنهاء هذا التعيين واستبدال عضو مجلس اإلدارة ذي الصلة. وتجدر اإلشارة إلى أن تعيين أعضاء مجلس
اإلدارة يتطلب الموافقة المسبقة من مصرف البحرين المركزي. وفي شهر أغسطس من عام
2015، قام المساهمين بإعادة تعيين ستة أعضاء لمجلس اإلدارة وتعيين الدكتور يحيى اليحيى
عضو في مجلس اإلدارة، ولمدة ثالث سنوات. وقد قام المجلس أيضا في شهر أكتوبر 2015
بإعادة تشكيل لجانه بما في ذلك إعادة انتخاب رئيس مجلس اإلدارة وانتخاب نائب للرئيس.
وأبرم البنك اتفاقية خطية لتعيين كل عضو من أعضاء مجلس اإلدارة تحدد صالحيات وواجبات ومسؤوليات وعمليات مساءلة أعضاء مجلس
اإلدارة ومسائل أخرى تتعلق بتعيينهم، بما في ذلك فترة واليتهم والوقت المخصص
والمتوقع منهم كأعضاء مجلس اإلدارة وتحديد مهامهم في اللجان التابعة للمجلس
وتعويضاتهم ومستحقات تسديد مصاريفهم وإمكانية حصولهم على المشورة المهنية
المستقلة عند الحاجة.في نهاية العام تألف مجلس اإلدارة من
سبعة أعضاء منهم ستة أعضاء غير تنفيذيين ومن ضمنهم الرئيس ونائبه، وعضو تنفيذي واحد، يتمتعون بخبرات إدارية واسعة وقدرات
مهنية متنوعة. يمكن الحصول على المزيد من التفاصيل حول خبرات أعضاء مجلس اإلدارة من سيرهم الذاتية الواردة في الصفحة رقم 48 من
التقرير السنوي.

بنك الخليج الدولي | اإلحتفال بمرور 40 عاما
التقرير السنوي 2015 34
ممارسات الحوكمة السليمةعندما تأسس بنك الخليج الدولي في عام 1975، تم إرساء قواعد ممارسة الحوكمة السليمة في
اتفاقية تأسيسه ونظامه األساسي التي شاركت فيها دول مجلس التعاون الخليجي. وقد أولى
البنك منذ بدايته أهمية كبرى للحوكمة السليمة كعنصر حيوي للتعامل العادل مع جميع األطراف
ذات العالقة ولتحقيق الكفاءة والمصداقية المؤسسية.
وعلى مر السنوات، قام البنك باعتماد وتطبيق معايير حوكمة الشركات المتعلقة بالمؤسسات المالية التي يتم تداول أسهمها، بالرغم من أنه
ليس شركة مدرجة، ومنذ عام 2003 يقوم البنك بنشر تقرير الحوكمة ضمن تقريره السنوي.
في عام 2010، عند قيام مصرف البحرين المركزي بتبني متطلبات حوكمة جديدة للبنوك في البحرين، كان بنك الخليج الدولي قد سبق له وضع العديد من معايير وإجراءات الحوكمة
على أعلى المستويات، مثل تحديد الصالحيات الشاملة لمجلس اإلدارة وألعضاء المجلس وأعضاء اللجان المنبثقة عنه، وصياغة الئحة
القواعد السلوكية باللغتين العربية واإلنجليزية ونشرها في الموقع اإللكتروني للبنك، ووضع دليل مفصل لسياسات المؤسسة وسياسات
التشغيل. وقد استبقت كل هذه المبادرات متطلبات مصرف البحرين المركزي الجديدة.
وتلى ذلك اتخاذ البنك تدابير إضافية شملت، من بين أمور أخرى، صياغة الئحة نظام عمل ومهام جديدة لمجلس اإلدارة وتحديث لوائح
عمل اللجان المنبثقة عن المجلس وتحديث برنامج اإلبالغ عن التجاوزات وإنشاء لجنة حوكمة
الشركات وتحديث إطار المكافآت المتغيرة لمالئمته مع متطلبات مصرف البحرين
المركزي.يخضع مجلس اإلدارة واللجان التابعة له لمراجعة سنوية للتأكد االلتزام بالمهام المحددة، وأفضل
الممارسات والمتطلبات التنظيمية الجديدة. وقد وافق مجلس اإلدارة على آخر التحديثات في
ديسمبر 2015.توجد الئحة صالحيات مجلس اإلدارة بأكملها
)www.gib.com( على موقع البنك اإللكترونيوتعكس الئحة الصالحيات بحد ذاتها شروط
الحوكمة الواردة في قسم الضوابط العليا من دليل قواعد مصرف البحرين المركزي )المجلد
األول(.اعتمد بنك الخليج الدولي بشكل رسمي
اإلجراءات التي من شأنها ترسيخ ثقافة الحوكمة السليمة فيه، ويدل ذلك على مدى التزام البنك
بالشفافية المالية واإلنصاف واإلفصاح عن المعلومات المالية وتوفيرها لكافة مستخدمي هذه المعلومات، بمن فيهم الجهات التنظيمية
والعمالء وشركاء األعمال ووكاالت التصنيف االئتماني وغيرهم من الجهات المعنية.
في شهر مارس من كل عام، يقوم المجلس بإعداد تقرير حول مدى التزام البنك بقواعد
مصرف البحرين المركزي بشأن حوكمة الشركات، وهو التقرير الذي يفسر أي مخالفة
لهذه القواعد إن وجدت، ويتم تقديم هذا التقرير للمساهمين في االجتماع السنوي للجمعية
العامة. وتم ايراد االيضاحات التي تضمنها تقرير “االلتزام أو التفسير” بالنسبة لقواعد الحوكمة
في نهاية تقرير حوكمة الشركات.ويفصح بنك الخليج الدولي في هذا التقرير
السنوي عن المعلومات المطلوبة وفقا للفقرة PD-1.3.8 من دليل قواعد مصرف البحرين المركزي )المجلد األول(. كما يقوم مجلس
اإلدارة بإبالغ المساهمين بالبيانات المطلوب اإلفصاح عنها وفقا للفقرة PD-6.1.1 من دليل
القواعد ذاته.
تقرير حوكمة الشركاتمنذ البداية، كانت الحوكمة السليمة أساس بنك
الخليج الدولي في تحقيق النزاهة والكفاءة وتحقيق العدالة لكافة األطراف.

33 التقرير السنوي 2015
التمويلبلغ حجم ودائع البنوك والعمالء 16669,3 مليون
دوالر أمريكي في 31 ديسمبر 2015، منها 14683,4 مليون دوالر أمريكي لودائع العمالء بنهاية عام
2015 وهو ما نسبته 88 بالمائة من مجموع الودائع. وفي 31 ديسمبر 2015 بلغت ودائع
البنوك 1985,9 مليون دوالر أمريكي، تمثل نسبة 12 بالمائة من مجموع الودائع.
ويتناول اإليضاح رقم 13 من البيانات المالية الموحدة تحليال إلجمالي الودائع حسب التوزيع
الجغرافي. فجاءت 70 بالمائة من إجمالي الودائع بقيمة 11749,6 مليون دوالر أمريكي
من األطراف المقابلة في دول مجلس التعاون الخليجي، أما الودائع التي جاءت من الدول خارج منطقة الشرق األوسط وشمال أفريقيا وخاصة
من أوروبا فقد بلغت 4142,4 مليون دوالر أمريكي أو 25 بالمائة من مجموع الودائع. تتعلق
ودائع األطراف المقابلة من غير دول منطقة الشرق األوسط وشمال أفريقيا بودائع بنك
الخليج الدولي )المملكة المتحدة( المحدود. وال تمثل هذه الودائع مصدر تمويل رئيسيا للبنك.
ويقابل ذلك الودائع لدى البنوك واتفاقيات إعادة الشراء المعاكسة واألصول السائلة األخرى من
دول منطقة الشرق األوسط وشمال أفريقيا البالغة 6779,0 مليون دوالر أمريكي، والتي تودع
في األسواق المالية لفترات قصيرة األجل. وبالتالي فإن البنك هو مودع صرف لألموال في
السوق المالية الدولية بين البنوك، وال يعتمد في تمويله على هذه السوق.
وبلغت قيمة األوراق المالية المباعة بموجب اتفاقيات إعادة الشراء 2093,4 مليون دوالر
أمريكي في 31 ديسمبر 2015. ويوظف البنك استثماراته ذات الجودة والتصنيف المرتفعين
لتعزيز قدرته على التمويل بضمان األوراق المالية، حيث يكون فعاال من منظور التكلفة
واالستحقاق، كما يبرهن بشكل دائم على قدرة البنك على تداول األوراق المالية بصفتها جزء
من الخطط الطارئة التي وضعتها للسيولة.وبلغ حجم التمويل األولي ألجل 2420,0 مليون
دوالر أمريكي في 31 ديسمبر 2015. وكانت نسبة التمويل ألجل وأسهم حقوق الملكية 134 بالمائة من القروض المستحقة بعد عام. وفي عام 2015
انخفض التمويل األولي ألجل بمقدار 952,9 مليون دوالر أمريكي، ويعزى ذلك إلى سندات
بقيمة 3,5 مليار ريال سعودي )933,3 مليون دوالر أمريكي( حان موعد استحقاقها في أبريل 2015. وكان قد تم إعادة تمويل هذه السندات
في 2014 قبل حلول موعد استحقاقها.يمكن االطالع على مزيد من اإليضاحات
بخصوص السيولة والتمويل في تقرير إدارة المخاطر ومالءة رأس المال.
توزيع مخاطر األصول وااللتزامات
مليون دوالر %أمريكي
17769.163.2دول مجلس التعاون الخليجي
دول الشرق األوسط األخرىوشمال أفريقيا
136.4 0.5
28.9 8141.5 أوروبا
6.0 1688.1 أمريكا الشمالية
1.3 367.0 آسيا
0.1 26.1 أمريكا الالتينية
28128.1 100.0
مليون دوالر
%أمريكي
11749.670.5دول مجلس التعاون الخليجي
دول الشرق األوسط األخرىوشمال أفريقيا
777.34.7
4142.424.8دول أخرى
16669.3100.0
التوزيع الجغرافي للودائع
٦٫٠١٫٣٠٫١
٢٨٫٩
٠٫٥٦٣٫٢
٢٤٫٨
٤٫٧
٧٠٫٥

بنك الخليج الدولي | اإلحتفال بمرور 40 عاما
التقرير السنوي 2015 32
201020112012201320142015
القيمة اإلجمالية للقروض متأخرة السداد
885.6582.5462.9475.9469.2225.1)ماليين الدوالرات األمريكية(
تطور القروض متأخرة السداد10.97.96.05.35.52.4% من إجمالي القروض
1,000
800
600
400
200
0
10.0
8.0
6.0
4.0
2.0
0
ولغرض احتساب المخصصات غير المحددة، فإن البنك ال يأخذ بعين االعتبار أي ضمانات
باستثناء األموال النقدية واألسهم المتداولة. أما الضمانات األخرى التي على هيئة أوراق
مالية أو أسهم شركات غير مدرجة واألصول المادية فتستخدم كمخففات للمخاطر وألغراض
الحماية، وال تؤخذ بعين االعتبار في عملية احتساب المخصصات الغير محددة.
بلغ إجمالي وصافي قيمة القروض متأخرة السداد في 31 ديسمبر 2015 نحو 225,1 مليون دوالر أمريكي و38,7 مليون دوالر أمريكي على التوالي. فكانت تغطية المخصصات المحددة
للقروض متأخرة السداد تبلغ 83 بالمائة. والقروض المتأخرة السداد هي تلك القروض
التي مر على موعد سداد رأس مالها أو فائدتها أكثر من 90 يوما. وبموجب معيار المحاسبة
الدولي رقم 39، تسجل الفائدة على القروض منخفضة القيمة في بيان الدخل بناء على صافي
القيمة الدفترية للقرض ونسبة الفائدة التي
استخدمت لخصم تدفقات النقد المستقبلية ألغراض حساب القيمة المستردة. وبموجب
توجيهات مصرف البحرين المركزي، تسجل الفائدة على القروض متأخرة السداد في بيان
الدخل باتباع المبدأ النقدي. وفي ضوء التغطية االحتياطية المرتفعة التي يوفرها البنك للقروض
منخفضة القيمة، فإن الفرق بين القاعدتين ال يمثل فرقا ملموسا.
فئات األصول األخرىيتناول اإليضاح رقم 5 من البيانات المالية
الموحدة تحليال لألصول النقدية والسائلة األخرى والتي بلغت 4309,7 مليون دوالر أمريكي بنهاية
عام 2015. وهي تتضمن في األساس النقد واألرصدة لدى المصارف والبنوك المركزية.
وبلغت الودائع لدى البنوك 4402,9 مليون دوالر أمريكي بنهاية عام 2015، وصنفت تصنيفا جيدا
حسب المناطق الجغرافية كما هو وارد في اإليضاح رقم 28 من البيانات المالية الموحدة.
وكان الجزء األكبر منها لدى األطراف المصرفية في دول مجلس التعاون الخليجي وأوروبا
وشمال أمريكا، وهي تمثل المواقع التشغيلية الرئيسية للبنك. وبلغت الودائع لدى البنوك بنهاية عام 2015 نسبة 18 بالمائة من مجموع
األصول، وتوجد منها نسبة عالية في األسواق التي تسودها التقلبات. ومع نهاية عام 2015،
تم دعم الودائع لدى البنوك بأوراق مالية مشتراة بموجب اتفاقيات إعادة البيع بقيمة
1835,0 مليون دوالر امريكي. وهي تمثل ودائع مضمونة، مما يقلل من تعرض البنك لمخاطر
المؤسسات.وبشكل أساسي تضمنت األوراق المالية
المتداولة التي بلغت 72,2 مليون دوالر أمريكي االستثمارات في الصناديق المدارة مما يوفر
التعرض للسندات الحكومية لألسواق الناشئة.عرض األصول الخطرة وااللتزامات
بلغ مجموع األصول الخطرة وااللتزامات 28128,1 مليون دوالر أمريكي في 31 ديسمبر 2015.
وتضمنت هذه األصول الخطرة وااللتزامات جميع األصول المذكورة في الميزانية العمومية
)باستثناء األصول األخرى( باإلضافة إلى بنود االئتمان المحتملة. وكما أشرنا سابقا، يمكن
االطالع على عرض األصول الخطرة وااللتزامات حسب الفئة والتوزيع الجغرافي في اإليضاح رقم 28 من البيانات المالية الموحدة، والذي يتضح منه أن 17769,1 مليون دوالر أمريكي
من مجموع األصول الخطرة وااللتزامات – أو ما يعادل 63 بالمائة منها – يمثل التعرض
لألطراف المقابلة والمؤسسات المتواجدة في دول مجلس التعاون الخليجي. أما النسبة
المتبقية من األصول الخطرة فتتمثل في ودائع قصيرة األجل لدى البنوك الرئيسية في أوروبا وأمريكا الشمالية. ويتضمن اإليضاح رقم 31
من البيانات المالية الموحدة أدوات المشتقات المالية والصرف األجنبي، بينما يتضمن
اإليضاح رقم 32 من البيانات المالية الموحدة تحليال أخر عن بنود االئتمان المحتملة مع مخاطر
االلتزام الموزونة.
استعراض الوضع المالي تتمة
تطور القروض متأخرة السداد
٪ماليين الدوالرات األمريكية

31 التقرير السنوي 2015
والبتروكيماويات مقارنة مع 38 بالمائة في نهاية 2011. يعكس هذا التعرض االئتماني القطاعي أهمية التركيز االستراتيجي السابق للبنك على
تمويل المشاريع واإلقراض المشترك في دول مجلس التعاون الخليجي. وإن أكبر تعرض
إئتماني للصناعة المصرفية في قطاع الخدمات والتجارة الذي يضم 22 بالمائة من القروض
والسلفيات في انعكاس للتوجه االستراتيجي الجديد الذي يركز على العالقات مع الشركات
الكبيرة والمتوسطة. وكان هناك فرصة محدودة لقطاعي البناء والعقارات في نهاية عام 2015.ويحتوي اإليضاح رقم 27-1 )ب( في البيانات
المالية الموحدة على تقييم لحجم مخاطر االئتمان للقروض والسلفيات، وهو مبني على
التصنيف الداخلي لالئتمان. وحصلت 5243,6 مليون دوالر أمريكي أي نسبة 57 بالمائة من
مجموع القروض على تصنيف -4 أو أعلى، وهو ما يوازي التصنيف بدرجة االستثمار. وقد
صنفت 42,3 مليون دوالر أمريكي فقط من القروض والسلفيات – صافية من مخصصات
إنخفاض القيمة –على أنها منخفضة القيمة. والقروض منخفضة القيمة هي تلك القروض
التي يوجد بشأنها دليل موضوعي على أن البنك لن يستردها بالكامل طبقا للبنود وااللتزامات التعاقدية. وعليه فإن نسبة 99,5 من القروض
ليست قروضا منخفضة القيمة الفردية.
بلغ مجموع مخصصات خسائر القروض 361,0 مليون دوالر أمريكي في 31 ديسمبر 2015، بينما وصلت مخصصات انخفاض القيمة
المحددة لألطراف المقابلة 226,5 مليون دوالر أمريكي، أما مخصصات انخفاض القيمة غير المحددة فقد بلغ 134,5 مليون دوالر أمريكي.
وكان مجموع المخصصات البالغ 361,0 مليون دوالر أمريكي يعادل نسبة 160 بالمائة من إجمالي القيمة الدفترية إلجمالي القروض
متأخرة السداد، وعليه تتجاوز قيمة المخصصات حجم القروض المتأخرة السداد بمقدار كبير.وتحسب المخصصات المحددة استنادا الى المبلغ القابل للتحصيل من القروض والذي
يحدد بالقيمة الحالية للتدفقات النقدية المستقبلية المتوقعة بناء على معدل الفائدة
عند تقديم هذه القروض. أما المخصصات غير المحددة فتحسب على أساس المحافظ باستخدام نموذج الخسائر المتكبدة. ويقدر
نموذج الخسائر المتكبدة الكامنة داخل المحفظة في تاريخ الميزانية العمومية ولكن
لم يتم تحديدها على وجه الخصوص. ويأخذ هذا النموذج بعين االعتبار التصنيفات االئتمانية
واحتماالت عدم السداد التاريخية وحجم الخسائر الممكنة وتغير التصنيف االئتماني، كما أنه يعكس البيئة االقتصادية العامة واألوضاع
السياسية والمؤشرات األخرى الوثيقة الصلة.
وبلغت مخصصات القروض غير المحددة 134,5 مليون دوالر أمريكي في 31 ديسمبر 2015،
مما يمثل زيادة بنسبة 1,4 بالمائة من القروض الغير مخصصة تحديدا. وتطبق احتماالت
التعثر على حساب المخصصات غير المحددة في 31 ديسمبر 2015، بما يساوي المستوى
الحالي الحتماالت التعثر مرتين تقريبا. وفيما يلي تفصيل لمعدالت التعثر المستخدمة في
احتساب المخصصات غير المحددة لقروض أولية غير مضمونة ومستويات المخصصات
المحتسبة حسب التصنيف الداخلي:
فئة التصنيف الداخلي
احتماالتالتعثر
مستوى المخصصات
للقروض األولية الغير
مضمونة
% % 1%0.02-
+2%0.02-2%0.02-
-2%0.04-+3%0.12%0.1
3%0.16%0.1-3%0.24%0.1+4%0.49%0.3
4%0.70%0.4-4%0.86%0.5+5%1.50%0.9
5%2.32%1.4-5%4.14%2.5+6%6.58%3.9
6%16.15%9.7-6%26.30%15.87%55.74%33.4
يعتمد مستوى المخصصات على مقدار الخسارة المحتملة بنسبة 60 بالمائة للديون األولية غير
المضمونة.
توزيع استحقاق القروض
مليون دوالر
%أمريكي
5442.559.4السنة األولى
1838.820.1السنتان 2 و 3
1056.911.5السنتان 4 و 5
823.29.0أكثر من 5 سنوات
9161.4100.0
9.0
11.5
20.159.4

بنك الخليج الدولي | اإلحتفال بمرور 40 عاما
التقرير السنوي 2015 30
بنهاية عام 2015 بلغت استثمارات األسهم 271,9 مليون دوالر أمريكي، تضمنت في 31 ديسمبر 2015 أسهما مدرجة قيمتها 163,8 مليون دوالر
أمريكي تم الحصول عليها كتسوية لقرض مضمون متأخر السداد. أما بقية استثمارات األسهم فتمثل حصصا في أسهم شركات
خاصة.يتضمن اإليضاح رقم 9-1 في البيانات المالية
الموحدة تحليال لمحفظة األوراق المالية االستثمارية حسب فئة التصنيف. وقد حصلت
استثمارات بلغت قيمتها 3088,1 مليون دوالر أمريكي في نهاية 2015 – ما يعادل 86 بالمائة
من االستثمار في سندات الدين – على تصنيف )A/A3-( أو أعلى. وبناء على تقييم
الجهة المصدرة، صنفت 524,5 مليون دوالر أمريكي أخرى من سندات الدين أو ما يعادل 14 بالمائة منها في درجة االستثمار. وبالتالي فإن كل سندات الدين في البنك مصنفة في درجة
االستثمار.
بلغت القيمة العادلة للسندات االستثمارية 3599,5 مليون دوالر أمريكي في 31 ديسمبر
2015. مما يعني زيادة القيمة العادلة عن الكلفة المطفأة بمبلغ 4,0 مليون دوالر أمريكي.
ويعكس الفارق البسيط في القيمة العادلة مقارنة بالكلفة المطفأة للسندات االستثمارية
الجودة العالية والتصنيف العالي للسندات.لم يتم تسجيل أوراق مالية استثمارية متأخرة
السداد أو متعثرة في 31 ديسمبر 2015.القروض والسلفيات
في نهاية عام 2015 بلغت القروض والسلفيات 9161,4 مليون دوالر أمريكي، مما يمثل زيادة
قدرها 1229,9 مليون دوالر أمريكي أو ما يعادل 16 بالمائة مقارنة بنهاية عام 2014. ويظهر
اإليضاح رقم 40 في البيانات المالية الموحدة متوسط حجم القروض والسلفيات خالل عام 2015 والتي بلغت 8798,8 مليون دوالر أمريكي
بزيادة قدرها 595,4 مليون دوالر أمريكي عن متوسط حجم القروض والسلفيات خالل
عام 2014. وتحققت هذه الزيادة السنوية في معظمها خالل النصف الثاني من العام.
وبناء على آجال االستحقاق التعاقدية بتاريخ الميزانية العمومية فإن 59 بالمائة من محفظة
القروض تكون مستحقة في خالل سنة، ونسبة 79 بالمائة تكون مستحقة في خالل ثالث
سنوات. واقتصرت القروض المستحقة بعد أكثر من خمس سنوات على نسبة 9 بالمائة.
ويمكن االطالع على تفاصيل تصنيف الصناعة المصرفية للقروض والسلفيات في اإليضاح
رقم 10-2 في البيانات المالية الموحدة، أما التصنيف حسب التوزيع الجغرافي فيمكن
االطالع عليه في اإليضاح رقم 28 في البيانات المالية الموحدة. وفي 31 ديسمبر 2015 اشتملت
21 بالمائة من إجمالي محفظة القروض على تعرض ائتماني لقطاع النفط والطاقة
201020112012201320142015
1.61.61.81.81.82.2أخرى
إيداعات وأصول سائلة29.838.937.341.042.143.5 أخرى
20.319.320.717.918.916.4أوراق مالية
48.340.240.239.337.237.9قروض وسلف
100.0100.0100.0100.0100.0100.0
100
80
60
40
20
0
استعراض الوضع المالي تتمة
التوزيع حسب فئات األصول )٪(
مليون دوالر
%أمريكي
A3 إلى Aaa/A- إلى AAA3088.185.5
Baa3 إلى Baa1/BBB- إلى BBB+524.514.5
3612.6100.0
توزيع السندات االستثمارية حسب التصنيف
14.5
85.5

29 التقرير السنوي 2015
جودة األصوليوضح اإليضاح رقم 28 في البيانات المالية
الموحدة، التوزيع الجغرافي لمخاطر األصول. أما المستوى المقدر للمخاطر االئتمانية في
األصول المالية المستند على التصنيف الداخلي لالئتمان فمبين في اإليضاح رقم 27-1)ب( في
البيانات المالية الموحدة. يشير هذا اإليضاح إلى أن نسبة 82 بالمائة من مجموع األصول
المالية تتكون من أصول سائلة ودائع لدى البنوك وأوراق مالية قروض مصنفة في درجة
-4 أو أعلى، أي ما يعادل التصنيف في درجة االستثمار.
ويمكن االطالع على تقييم إضافي لجودة األصول بالرجوع إلى اإليضاح رقم 37 في
البيانات المالية الموحدة بشأن القيمة العادلة لألدوات المالية. وباالستعانة بأسلوب التقييم
المتبع في ذلك اإليضاح فإن صافي القيمة العادلة لألدوات المالية في داخل وخارج الميزانية
العمومية كما في 31 ديسمبر 2015 ال يختلف كثيرا عن القيمة الدفترية.
وفي نهاية عام 2015 شكل النقد واألصول السائلة األخرى واتفاقيات إعادة الشراء المعاكس
والودائع لدى البنوك نسبة 44 بالمائة من مجموع األصول، وشكلت األوراق المالية
االستثمارية ما نسبته 16 بالمائة، بينما شكلت القروض والسلفيات نسبة 38 بالمائة.
األوراق المالية االستثماريةبلغ مجموع قيمة األوراق المالية االستثمارية
3884,5 مليون دوالر أمريكي في 31 ديسمبر 2015. وتشكل محفظة األوراق المالية
االستثمارية في األساس احتياطيا للسيولة، وتتألف إجماال من سندات دين مصنفة بالدرجة
االستثمارية من قبل مؤسسات مالية دولية وإقليمية ومؤسسات حكومية.
وتتكون األوراق المالية االستثمارية من نوعين من محافظ سندات الدين واستثمارات محدودة
في حقوق الملكية والصناديق االستثمارية. وتتضمن كبرى محافظ سندات الدين من أوراق
مالية بسعر فائدة متغير أو ثابت تم تبادلها لجني الفروق الثابتة من سعر الفائدة على سعر الليبور. وقد بلغت قيمة هذه األوراق المالية االستثمارية
2005,0 مليون دوالر أمريكي وهو ما يعادل 56 بالمائة من إجمالي االستثمار في سندات الدين في نهاية 2015. أما بالنسبة للمحفظة الصغرى
من سندات الدين فهي تمثل استثمار صافي رأس المال الحر للمجموعة في السندات بسعر
فائدة ثابت. وقد بلغت قيمة هذه المحفظة 1607,6 مليون دوالر أمريكي بنهاية عام 2015
وتتكون من استثمارات في سندات خاصة بحكومات منظمة التعاون االقتصادي والتنمية ودول مجلس التعاون الخليجي. وال يوجد لدى
البنك أية تعرضات ائتمانية في منطقة السوق األوروبية التي واجهت أزمة ديون حكومية مؤخرا مثل اليونان وأيرلندا وإيطاليا والبرتغال وإسبانيا.
25
20
15
10
5
0
201020112012201320142015
النسبة المئوية لمخاطر األصول
24.323.320.118.919.617.8
النسبة المئوية لمخاطر األصول )٪(

بنك الخليج الدولي | اإلحتفال بمرور 40 عاما
التقرير السنوي 2015 28
وبلغت المصاريف التشغيلية األخرى 46,2 مليون دوالر أمريكي أي بإرتفاع بلغ 12,4 مليون دوالر أمريكي أو ما يعادل 37 بالمائة عما كانت عليه في العام السابق. وتعزى هذه الزيادة إلى
مصروفات االستهالك المتعلقة بالبنية التحتية الجديدة لتقنية المعلومات التي تم تنفيذه
خالل العام 2015. ويتوقع أن يكون هناك مزيدا من مصروفات التشغيل في 2016 تعكس
مصروفات استهالك أنظمة تقنية المعلومات الجديدة خالل العام.
المخصصاتفي عام 2015، بلغ صافي المخصصات 21,3 مليون دوالر أمريكي، تضمنت مخصصات محددة تتوافق مع الموجهات الجديدة التي
طرحتها مؤسسة النقد العربي السعودي )ساما( وموجهات مماثلة واردة في ورقة استشارية
صادرة عن مصرف البحرين المركزي. وتتطلب هذه الموجهات رصد مخصصات محددة يتم
تحديد قدرها بناء على مدة تجاوز موعد استحقاق التسهيالت االئتمانية، مع تجنيب مخصصات بنسبة 100 بالمائة للتسهيالت االئتمانية التي
يتجاوز موعد استحقاقها أكثر من 360 يوما. كانت المخصصات المحددة للقروض في
بنك الخليج الدولي كما في 31 ديسمبر 2015 تتوافق تماما مع الموجهات الجديدة بشأن
المخصصات حتى قبل أن يحل موعد تنفيذها. وباإلضافة إلى ذلك، تم ترحيل مبلغ 13,5 مليون
دوالر أمريكي من المخصصات غير المحددة إلى المخصصات المحددة فيما يتعلق بعدد
من تسهيالت القروض المتعثرة التي كان يلزم تجنيب مخصصات محددة جديدة لها وفقا
للمبادئ التوجيهية للمخصصات الصادرة من مؤسسة النقد العربي السعودي ومصرف
البحرين المركزي. يعادل إجمالي المخصصات 36,5 نقطة أساس من إجمالي القروض الذي بلغ 9522,4 مليون دوالر أمريكي كما في 31 ديسمبر
2015. يجيء ذلك في النطاق المتوقع للخسائر في محفظة القروض بناء على مستوى تصنيف
المحفظة واالحتماالت المقدرة للتخلف عن السداد.
قوة رأس المالبلغت حقوق الملكية 2431,0 مليون دوالر
أمريكي في 31 ديسمبر 2015. وفي نهاية عام 2015، بلغت نسبة كل من حقوق الملكية
والفئة األولى لرأس المال إلى إجمالي األصول 10,0 بالمائة وتعد هذه النسبة مرتفعة مقارنة
بالمعايير الدولية السائدة.تكونت الزيادة البالغة 80,3 مليون دوالر أمريكي في حقوق الملكية خالل عام 2015 من صافي
أرباح بلغت 90,4 مليون دوالر أمريكي للعام، وانخفاض قدره 25,7 مليون دوالر أمريكي في القيمة العادلة الستثمارات األسهم من خالل
الدخل الشامل اآلخر ومشتقات تحوطات التدفق النقدي. وارتفاع في قيمة حقوق الملكية بلغ 15,6 مليون دوالر أمريكي نتيجة إعادة قياس صندوق خطة منافع التقاعد المحددة لبنك الخليج الدولي )المملكة المتحدة( المحدود
ومقره لندن.مع قاعدة رأس المال التنظيمي التي بلغت
2555,7 مليون دوالر أمريكي، ومجموع التعرضات المرجحة بالمخاطر التي بلغت 14376,9 مليون دوالر أمريكي، فإن معدل مخاطر األصول
المحتسب وفقا لتوجيهات مصرف البحرين المركزي بموجب قواعد اتفاقية بازل 3، بلغ 17,8 بالمائة. ووفقا لإلرشادات الرقابية الدولية، فإن تعديالت القيمة العادلة لألسهم الناشئة وفق معيار المحاسبة الدولي رقم 9 بشأن تحوطات التدفق النقدي للمشتقات يتم استثناؤها من قاعدة رأس المال التنظيمي. وتصنف األرباح
والخسائر غير المحققة على استثمارات األسهم كقيمة عادلة من خالل دخل شامل آخر وتدرج
في قاعدة رأس المال التنظيمي.
في 31 ديسمبر 2015، سوف تدعم قاعدة رأس المال التنظيمي أصوال إضافية تبلغ قيمتها
3,9 مليار دوالر أمريكي مرجحة المخاطر بنسبة 100 بالمائة، مع المحافظة في الوقت ذاته على
الحد األدنى من معدل مخاطر األصول وقدره 14 بالمائة. وعلى ذلك يمتلك البنك رأس المال
التنظيمي الكافي لدعم خطط توسعة أعماله في المستقبل.
تتضمن مخاطر األصول كل من تعرضات السوق والتشغيل المرجحة المخاطر. وقد عمد
البنك بعد موافقة مصرف البحرين المركزي إلى تطبيق نماذج داخلية للتعامل مع مخاطر
السوق، كما طبق األسلوب المعياري لتحديد متطلبات رأس المال للمخاطر التشغيلية. ويدل هذا على اقتناع السلطات الرقابية بأن إطار إدارة المخاطر في البنك يتوافق تماما مع الموجهات واالشتراطات المحددة من قبل مصرف البحرين
المركزي ولجنة بازل للرقابة المصرفية.اعتمد مصرف البحرين المركزي معايير بازل 3 بشأن رأس المال التنظيمي اعتبارا من 1 يناير
2015. يعيد إطار معايير بازل 3 تعريف رأس المال التنظيمي، غير أن تطبيق هذه المعايير لن يكون لها سوى تأثير محدود على معدالت رأس المال
التنظيمي في البنك.يبين المحور الثالث من اتفاقية بازل 3 الوارد في قسم الحق من هذا التقرير السنوي المزيد من التفاصيل حول المالءة الرأسمالية للبنك وإطار إدارة رأس المال. ويتضمن اإليضاح رقم 5-27 في البيانات المالية الموحدة شرحا لسياسات البنك فيما يتعلق بإدارة رأس المال. كما يبين
اإليضاح بمزيد من التفصيل أن من سياسة البنك المحافظة على قاعدة قوية لرأس المال
لكسب ثقة المستثمرين واألطراف األخرى والسوق وتعزيز النمو المستقبلي ألنشطة
البنك.
استعراض الوضع المالي تتمة

27 التقرير السنوي 2015
استثمارا في أحد صناديق السندات الحكومية لألسواق الناشئة والتي يديرها بنك الخليج
الدولي )المملكة المتحدة( المحدود. وقد حقق صندوق فرص األسواق الناشئة عائدا بنسبة
6,11 بالمائة في عام 2015. كما سجلت مصادر الدخل األخرى 23,6 مليون دوالر أمريكي خالل العام. يورد اإليضاح رقم
25 في البيانات المالية الموحدة تحليال لمصادر الدخل األخرى، والتي تتكون بشكل أساسي
من 12,6 مليون دوالر أمريكي من األرباح على االستثمار في األسهم المصنفة كقيمة عادلة
من خالل الدخل الشامل اآلخر و7,9 مليون دوالر أمريكي من المبالغ المستردة من األصول التي
سبق شطبها و2,7 مليون دوالر أمريكي من األرباح المتحصلة من بيع االستثمار في سندات
الدين ذات السعر الثابث توقعا الحتمال رفع أسعار الفائدة األمريكية على المدى المتوسط.
مصاريف التشغيلبلغت مصاريف التشغيل 192,1 مليون دوالر
أمريكي بزيادة 27,2 مليون دوالر أمريكي أو ما يعادل 16 بالمائة عن العام السابق. وتعزى هذه
الزيادة الى التكاليف المتعلقة بتنفيذ استراتيجية البنك الجديدة وتطبيق المنظومة المصرفية األساسية الجديدة وانظمة تقنية المعلومات
التي بدأ تشغيلها خالل عام 2015.بلغت مصاريف الموظفين 128,4 مليون دوالر أمريكي، أي أكثر من ثلثي مصاريف التشغيل،
بزيادة قدرها 13,0 مليون دوالر أمريكي أو ما يعادل 11 بالمائة عن العام السابق. وتعزى هذه
الزيادة إلى ازدياد عدد الموظفين خالل عام 2015، إضافة إلى الخبراء الذي تم توظيفهم مؤقتا
لدعم تنفيذ االستراتيجية الجديدة للبنك. وقد بلغ عدد موظفي البنك في 31 ديسمبر 2015
نحو 1,106 موظف بزيادة 72 موظفا عن الفترة
في نهاية عام 2014. وعكست هذه الزيادة في حجم عدد الموظفين تعزيز الموارد في مجاالت
األعمال وبعض وحدات الدعم، باإلضافة إلى فرق تنظيم األعمال بقسم الخدمات المصرفية
لألفراد الجديد. وتضمن عدد الموظفين 209 موظفين في 31 ديسمبر 2014 من موظفي
المكاتب األمامية في مجال الخدمات المصرفية لألفراد.
وبلغت مصاريف المباني 17,5 مليون دوالر أمريكي بزيادة قدرها 1,8 مليون دوالر أمريكي
أو ما يعادل 11 بالمائة عن العام السابق. ويرجع ذلك إلى تكاليف اإليجار واإلستهالك المتعلقة
بمباني البنك الجديدة في الظهران في المنطقة الشرقية بالمملكة العربية السعودية، فضال
عن المباني الجديدة لفرع أبوظبي ومكتب دبي التمثيلي الذي أفتتح خالل عام 2015.
سنة 2016 وما بعدهاسنة 2015العوامل
تم التخطيط لزيادة حجم القروض خالل سنة 2016 وما زيادة في حجم القروضحجم القروضبعدها لتصل لحد أقصاه 10 مليار دوالر أمريكي
زيادة هوامش المحفظة األساسية للقروض من خالل هوامش القروضإعادة توجيه أنشطة اإلقراض بالتركيز على تعزيز العالقات
مع الشركات الكبيرة والمتوسطة عوضا عن صفقات تمويل المشاريع والتمويل المهيكل طويل األجل
استمرار ارتفاع هوامش القروض من خالل استبدال القروض المنتهية ذات الهوامش المنخفضة باالقراض بهوامش أعلى
إلى المتوسطة الحجم وإخطار العمالء بإضطرابات السوق
الدخل من استثمار رأس المال الحر
زيادة حصيلة الفوائد فوق مستواها العام الماضي، مع استثمار صافي رأس المال الحر المتاح في أدوات قصيرة
األجل وبسعر فائدة ثابت، بحيث تدر عائدات معززة فوق أسعار الفائدة قصيرة األجل
ترتفع معدالت الفائدة في ظل ارتفاع التضخم، وتوفير الفرصة إلعادة االستثمار في فترات استحقاق تدر
عائدات أعلى
كلفة التمويل ألجل: كلفة مخاطر السيولة
انخفاض التمويل ألجل الناشئ عن حلول موعد استحقاق تسهيالت ألجل بقيمة 3,5 مليار ريال سعودي في شهر
أبريل، وتسديد تسهيالت ثانوية قيمتها 328 مليون دوالر أمريكي خالل شهر يونيو
تمويل جديد سيطرح على المدى القصير ولكن حلت محلها ودائع الخدمات المصرفية لألفراد في المدى المتوسط
إلى الطويل
التركيز على توفير تشكيلة سلع وخدمات غير مرتبطة دخل الرسوم والعموالتباالقراض مثل تمويل التجارة، األعمال المصرفية االستثمارية
وإدارة األصول
التركيز على توفير تشكيلة أكبر من الخدمات المالية غير المرتبطة باالقراض، مثل تمويل التجارة، األعمال المصرفية االستثمارية
وإدارة األصول
الدخل من عمليات الخزينة بالعمالء: صرف العمالت األجنبية ومشتقات
أسعار الفائدة
استمرار التركيز على تسويق وتطوير منتجات خدمات الخزينة الجديدة لكي تساعد عمالئنا من التحوط من تعرضهم
لمخاطر السوق
استمرار التركيز على تسويق وتطوير منتجات خدمات الخزينة الجديدة لكي تساعد عمالئنا من التحوط من تعرضهم لمخاطر
السوق
االستثمار المتواصل في الخدمات المصرفية الجديدة التكاليف الثابتة لألفراد، واألنظمة األساسية لتقنية المعلومات التي بدأ
تشغيلها خالل عام 2015
استمرار االستثمار المتعلق بإطالق الخدمات المصرفية لألفراد وتطورات استراتيجية البنك
يتم تغطية المخصصات المحددة بالتحويل من احتياطي الزيادة في رسوم مخصصات القروضمخصصات الخسائرالمخصصات الغير محددة
مفتاح العوامل المؤثرة على الربحية
الربحية الغير متغيرة انخفاض الربحيةارتفاع الربحية

بنك الخليج الدولي | اإلحتفال بمرور 40 عاما
التقرير السنوي 2015 26
201020112012201320142015
إيرادات المتاجرة، تحويل العمالت األجنبية وإيرادات
11.315.219.219.114.316.1أخرى
18.921.422.222.324.422.8إيرادات الرسوم والعموالت
69.863.458.658.661.361.1صافي دخل الفوائد
100.0100.0100.0100.0100.0100.0
100
80
60
40
20
0
الدخل من غير الفوائديتألف الدخل من غير الفوائد، من دخل الرسوم
والعموالت وصرف العمالت األجنبية ودخل المتاجرة والدخل من مصادر أخرى.
بلغت دخل الرسوم والعموالت 70,2 مليون دوالر أمريكي بارتفاع بلغ 7,3 مليون دوالر
أمريكي أو ما يعادل 12 عما كان عليه في العام السابق. يشتمل اإليضاح رقم 22 من البيانات
المالية الموحدة على تحليل لهذا الدخل من الرسوم العموالت مقارنة بدخل العام السابق.
وبلغت قيمة رسوم اإلدارة والخدمات المصرفية االستثمارية 38,3 مليون دوالر أمريكي، وشكلت
أكبر مصدر للدخل من الفوائد، أو ما يعادل 55 بالمائة من دخل الرسوم والعموالت خالل العام،
في حين بلغت قيمة العموالت على خطابات الضمان واالعتماد 28,6 مليون دوالر أمريكي أو
ما يعادل 41 بالمائة من الدخل.
تتكون رسوم اإلدارة والخدمات المصرفية االستثمارية من الرسوم المتولدة من أنشطة إدارة األصول، وإدارة الصناديق االستثمارية،
واستشارات الشركات، والتعامالت في أسواق الدين ورأس المال وأنشطة تعهد االكتتاب.
بلغت قيمة رسوم اإلدارة والخدمات المصرفية االستثمارية 10,4 مليون دوالر أمريكي بزيادة
نسبتها 37 بالمائة عن مستواها في العام السابق وشملت الرسوم المتحصلة من عدد
من صفقات أسواق الدين واألسهم ورأس المال التي أنجزها البنك خالل العام، على النحو الوارد بتفصيل أكثر في القسم المتعلق بتقرير
اإلدارة في هذا التقرير، حيث أسهمت في الدخل المشترك الذي سجل أكثر من ضعف مستواه
في العام السابق. وإلى ذلك ارتفعت رسوم إدارة األصول والصناديق في 2015 بنسبة 13 بالمائة
عن العام السابق في انعكاس لقوة رسوم اإلدارة
في الصناديق تحت إدارة البنك. وكما أشير إليه في اإليضاح رقم 35 من البيانات المالية
الموحدة، فقد بلغ حجم األصول المدارة لحساب العمالء 12,4 مليار دوالر أمريكي في 31 ديسمبر 2015. وسجل انخفاض سنوي بمقدار 3,5 مليون دوالر أمريكي أو 11 بالمائة في عموالت خطابات
االئتمان والضمان يعكس محاوالت الصناعة المصرفية للتأقلم مع التراجع خالل عام 2015
في أنشطة قطاعي التشييد والمقاوالت. وبلغت رسوم التزامات القروض 2,1 مليون
دوالر أمريكي بارتفاع 0,1 مليون دوالر أمريكي عن مستواها في العام السابق مع التركيز على
استفادة العمالء من تسهيالتهم االلتزامية.وبلغ الدخل من صرف العمالت األجنبية 19,8
مليون دوالر أمريكي للعام بزيادة 0,4 مليون دوالر أمريكي عن مستوى العام السابق.
ويتألف صرف العمالت األجنبية في األساس من الدخل المتحقق من معامالت صرافة
العمالت لحساب العمالء والتي تم تعويضها في األسواق مع المعامالت المماثلة وبالتالي
ال توجد مخاطر سوقية مرتبطة بهذه المعامالت التي تساهم في هذا المصدر الملموس للدخل.
وعكست اإليرادات القوية لصرافة العمالت النجاح الذي تحقق من بيع المنتجات المبتكرة
لتلبية احتياجات ومتطلبات العمالء، وتطوير منتجات جديدة لتلبية تلك االحتياجات. هذا وقد
شهد الطلب على المنتجات زيادة ملحوظة، حيث لمس العمالء الفوائد المتحصلة من المنتجات الجديدة في مساعدتهم على تحقيق إدارة فعالة
للتحوط من تعرضهم لمخاطر العملة. وخالل عام 2015 واصل البنك توسيع قاعدة عمالئه
وخلق المزيد من فرص العمل مع العمالء القائمين.
سجلت األنشطة التجارية المتنوعة للمجموعة أرباحا بلغت 6,2 مليون دوالر أمريكي عن العام مقارنة مع 2,4 مليون دوالر أمريكي في العام السابق. وتم تسجيل إيرادات المتاجرة شاملة
لجميع اإليرادات ذات الصلة، بما في ذلك إيرادات الفائدة، واألرباح والخسائر الناتجة عن
عمليات الشراء والبيع، وعن التغيرات في القيمة العادلة لتداول األوراق المالية، وفي أرباح
االستثمار في األسهم ومصروفات الفوائد، بما في ذلك جميع تكاليف التمويل ذات الصلة.
ويشتمل اإليضاح رقم 24 في البيانات المالية الموحدة على تحليل إليرادات المتاجرة. تتكون
إيرادات المتاجرة في عام 2015 أساسا من األرباح المحققة في الصناديق تحت اإلدارة ومن الدخل
من أسعار الفائدة على المشتقات المتعلقة بالعمالء. ومثل االستثمار في الصناديق المدارة
استعراض الوضع المالي تتمة
تكوين مجموع الدخل )٪(

25 التقرير السنوي 2015
شكل هامش الدخل من محفظة األوراق المالية االستثمارية 13 بالمائة من صافي إيرادات الفوائد قبل تكلفة التمويل ألجل. وكانت عائدات الفوائد
من محفظة األوراق المالية االستثمارية أقل بنسبة 2 بالمائة عن العام السابق. ويعزى هذا
االنخفاض السنوي إلى انخفاض سنوي بمقدار 5 نقاط أساس في متوسط هامش فوائد
المحفظة الناتج عن إعادة استثمار األوراق المالية التي حان موعد استحقاقها بهوامش فائدة أقل هي السائدة في السوق. وبقي االستثمار في
سندات الدين عند نفس مستواه في العام الماضي. وبالتالي فإن العوامل الرئيسية التي
تقوم عليها المحفظة هي السيولة العالية وجودتها وليس األرباح التي تحققها.
وتمثل عائدات التعامل بالودائع حصيلة الفروقات بين كلفة تمويل األصول المنتجة للفوائد اعتمادا على طرق التسعير الداخلية
وبين كلفة التمويل الفعلية التي يتكبدها البنك. وتشمل اإليرادات المكتسبات الناجمة عن
الفروقات في إعادة تسعير األصول والخصوم المنتجة للفوائد. شكلت إيرادات التعامل بالودائع
في عام 2015 ما نسبته 16 بالمائة من صافي إيرادات الفوائد قبل احتساب كلفة التمويل ألجل، وارتفعت بنسبة 38 بالمائة عن العام السابق. وخالل عام 2015، نجح البنك بزيادة
متوسط استحقاق الودائع وتقليل كلفة تمويلها بينما عزز من الدخل العائد من الفروقات في
تسعير معدالت الفائدة.سجلت عائدات استثمار رأس المال الحر للبنك،
والتي شكلت 11 بالمائة من صافي دخل الفوائد قبل حساب كلفة التمويل ألجل، زيادة بنسبة
19 بالمائة عن مستواها في العام السابق. وتم استثمار رأس المال الحر بشكل كبير في سندات
حكومية قصيرة األجل مما يعكس وجهة نظر البنك بأن األوضاع االقتصادية السائدة في
الواليات المتحدة األمريكية أصبحت مواتية أكثر لرفع سعر الفائدة األمريكية على المدى القصير،
في حين تتيح أدوات الدخل الثابت قصيرة األجل الفرصة عند استحقاقها إلعادة أستثمارها
بعائدات أكبر آلجال قصيرة إلى متوسطة. وفي نهاية عام 2015، تم استثمار أكثر من نصف
صافي رأس المال الحر للبنك في أدوات دخل ثابت ذات فترات استحقاق أقصر، مما ساهم
في تحقيق إيرادات أعلى مما توفره أسعار الفائدة قصيرة األجل. كما تأثرت اإليرادات من استثمار رأس المال الحر سلبا في عامي 2014
و2015 بسبب التراجع القياسي في أسعار الفائدة قصيرة األجل في الواليات المتحدة األمريكية
خاللهما. لذلك فإن ارتفاع أسعار الفائدة في الواليات المتحدة سوف يؤثر ايجابيا ومباشرة
على دخل البنك من الفوائد.انخفضت تكلفة التمويل ألجل في عام 2015
نتيجة حلول موعد استحقاق تسهيالت تمويل ألجل بقيمة 3,5 مليار ريال سعودي )933,3 مليون دوالر أمريكي( في أبريل 2015. وكان قد تم في 2014 إعادة تمويل السندات قبل
موعد استحقاقها في 2015، مما أدى إلى زيادة تكلفة التمويل ألجل في 2014. ويواصل البنك تخفيض اعتماده السابق على تمويل األصول
ذات االستحقاق طويل األجل مع إيداعات قصيرة األجل، وما يرتبط بها من مخاطر مرتبطة
بالسيولة وإعادة التمويل، مع اتخاذ إجراءات استباقية على مدى السنوات الخمس السابقة
لطرح تمويل جديد ألجل للحد من هذه المخاطر غير الضرورية. ونتيجة لذلك، شكل حجم األصول
غير السائلة أو األصول المستحقة بعد سنة واحدة، والتي كان يتم تمويلها بودائع غير ثابتة
أو قصيرة األجل، أقل من نسبة 15 بالمائة من ودائع العمالء سهلة البيع في 31 ديسمبر 2015. وبالتالي وفرت ودائع العمالء المتبقية
وكافة الودائع المصرفية التمويل لالستحقاقات القصير واألصول السائلة. يعالج على نحو فعال
أحد اوجه التركيز الرئيسية للمعايير التنظيمية الجديدة التفاقية بازل 3 والتى تحد من قدرة
البنوك على تمويل األصول طويلة األجل من الودائع التجارية قصيرة األجل. ونتج عن مبادرة البنك لخفض التعرض لمخاطر السيولة تراجع
في صافي دخل الفوائد بمقدار 38,7 مليون دوالر أمريكي أو ما يعادل 17 بالمائة في عام
.2015
صافي دخل الفوائدبلغ صافي دخل الفوائد 188,2 مليون دوالر،
بارتفاع قدره 30,2 مليون دوالر أو ما يعادل 19 بالمائة مقارنة بالعام الماضي.
وقد نتج صافي إيرادات الفوائد من أربعة مصادر رئيسية هي:
هامش الدخل من محفظة القروض التجارية •هامش الدخل من محفظة األوراق المالية •
االستثمارية )Money Book( أنشطة التعامل بالودائع •اإليرادات الناتجة عن استثمار رأس المال •
ويشمل صافي دخل الفوائد كلفة التمويل ألجل. تعزى الزيادة السنوية في صافي دخل الفوائد
إلى حد كبير إلى: )1( ارتفاع العائد من الفوائد من محفظة الخدمات المصرفية بالجملة )2( العائد
المرتفع ألنشطة التعامل بالودائع )3( ارتفاع عائدات فوائد استثمار رأس المال و)4( انخفاض
تكلفة التمويل ألجل. وقد سجلت هوامش دخل الفوائد في محفظة االستثمار انخفاضا طفيفا
قياسا على مستواها في العام الماضي. شكلت إيرادات الفوائد من محفظة القروض 80
بالمائة من صافي إيرادات الفوائد قبل تكلفة التمويل ألجل. وارتفع معدل الهوامش على القروض التجارية عن العام السابق بنسبة 9
بالمائة نتيجة الرتفاع متوسط حجم القروض منتظمة األداء وفوائدها وارتفع متوسط حجم
القروض منتظمة األداء خالل عام 2015 بنسبة 4 بالمائة مقارنة بعام 2014 في حين ارتفع متوسط هوامش القروض منتظمة األداء بواقع 8 نقاط
أساس مقارنة بالعام السابق. وتعكس الزيادة في حجم وفوائد القروض المنتظمة األداء
استمرار نجاح استراتيجية البنك في إعادة توجيه أنشطته االقراضية بالتركيز على تعزيز عالقاته مع الشركات الكبيرة والمتوسطة عوضا عن
صفقات تمويل المشاريع والتمويل المهيكل طويل األجل.

بنك الخليج الدولي | اإلحتفال بمرور 40 عاما
التقرير السنوي 2015 24
20102011201220132014201567.683.1105.6115.299.6119.8الدخل غير المرتبط بالفوائد
156.2143.8149.4163.1158.0188.2صافي دخل الفوائد
223.8226.9255.0278.3257.6308.0مجموع الدخل
350
300
250
200
150
100
50
0
استعراض الوضع الماليسجل بنك الخليج الدولي عاما آخر من األداء المالي القوي
خالل عام 2015، فقد بلغ صافي الدخل بعد استقطاع الضرائب 90,4 مليون دوالر مقابل 85,6 مليون دوالر خالل
العام الماضي، ممثال زيادة سنوية تبلغ 6 بالمائة.
بلغ إجمالي الدخل 308,0 مليون دوالر، بزيادة مقدارها 50,4 مليون دوالر أو ما يعادل 20 بالمائة
مقارنة بالعام 2014، مع زيادة في جميع فئات الدخل. وجاءت الزيادة في إجمالي الدخل بمقدار فاق الزيادة في إجمالي المصروفات التي بلغت
27,2 مليون دوالر والمرتبطة بتطوير خدمات بنك الخليج الدولي الجديدة المبتكرة لألفراد
وفي المنظومة المصرفية األساسية الجديدة وأنظمة الخزينة التي تم تطبيقها خالل عام 2015.
ولقد نتج عن ذلك ارتفاع صافي الدخل قبل احتساب المخصصات واستقطاع الضرائب إلى
23,2 مليون دوالر أو ما يعادل 25 بالمائة. شكل صافي دخل الفوائد أكبر مصدر دخل للبنك حيث بلغ 188,2 مليون، بارتفاع قدره
30,2 مليون دوالر أو ما يعادل 19 بالمائة مقارنة بالعام الماضي. ويعكس هذا النمو زيادة في كل مصادر دخل الفوائد، وبخاصة الزيادة في حجم وهوامش القروض، مع استمرار البنك
بنجاح في إعادة توجيه أنشطته االقراضية وذلك بالتركيز على تعزيز عالقاته مع الشركات
الكبيرة والمتوسطة عوضا عن صفقات تمويل المشاريع والتمويل المهيكل طويل األجل.
وبلغ الدخل من الرسوم والعموالت 70,2 مليون دوالر بزيادة 7,3 مليون دوالر أو ما يعادل 12 بالمائة قياسا على مستواه في العام 2014،
وشكل حوالي ربع إجمالي الدخل. وتعزى هذه الزيادة إلى استمرار نجاح التوجه اإلستراتيجي لبنك الخليج الدولي بالتركيز على المنتجات
والخدمات المالية المقدمة للعمالء وتعزيز الدخل من الرسوم. وبلغ الدخل من النقد االجنبي 19,8 مليون دوالر بزيادة 0,4 مليون دوالر أو ما يعادل 2 بالمائة مقارنة بالعام 2014. وشكل الدخل من
النقد االجنبي أغلبية االيرادات من األنشطة الموجهة للعمالء، وبشكل خاص االيرادات
من المنتجات المهيكلة التي صممت لتساعد العمالء في التحوط من المخاطر الناتجة من
تقلبات األسواق. وبلغت قيمة ايرادات المتاجرة 6,2 مليون دوالر بزيادة بمقدار 3,8 مليون دوالر عن مستواها في العام السابق. ويتكون العائد من عمليات المتاجرة بصورة رئيسية من أرباح
االستثمار في الصناديق التي يديرها بنك الخليج الدولي )المملكة المتحدة( المحدود، وهو شركة
تابعة لبنك الخليج الدولي مقرها في لندن، وكذلك من الدخل من مشتقات أسعار الفائدة
المتعلقة بالعمالء. كذلك بلغت االيرادات األخرى 23,6 مليون دوالر مقارنة بـمقدار 8,7 مليون
دوالر أو ما يعادل 58 بالمائة في العام 2014. أما باقي االيرادات األخرى خالل الفترة، فتكونت
بشكل كبير من أرباح االستثمارات في األسهم واسترداد األصول.
بلغ إجمالي المصروفات خالل العام 192,1 مليون دوالر بزيادة مقدارها 27,2 مليون دوالر أو ما يعادل 16 بالمائة مقارنة بالعام 2014. وتعزى
هذه الزيادة إلى استمرار بنك الخليج الدولي في االستثمار في تطوير خدماته المصرفية الجديدة
لألفراد وفي المنظومة المصرفية األساسية الجديدة وأنظمة الخزينة التي تم تطبيقها في
منتصف 2015. وتم رصد مخصصات للقروض بلغت قيمتها 21,3 مليون دوالر مقارنة مع 10,3
مليون دوالر خالل العام السابق.
تطور مجموع الدخل )ماليين الدوالرات األمريكية(

23 التقرير السنوي 2015
مايورعى بنك الخليج الدولي وشارك في المؤتمر
بأكثر من 1500 شخصية من المسؤولين اع السياسات وقادة من الحكوميين وصن
قطاعي التمويل واألعمال.
أكتوبرفي بادرة لدعم التوعية بسرطان الثدي قام
بنك الخليج الدولي بإنارة مبنى مقره الرئيسي باللون الوردي طوال شهر أكتوبر.
نوفمبرفاز فريق بنك الخليج الدولي بالمركز األول
في فئة المؤسسات المالية، وبالمركز الثالث في الترتيب العام من بين 177 فرقة مشاركة.
مؤتمر يوروموني السعودية العاشر، الرياض.
جمعية ثنك بنك البحرين وجمعية زهرة لسرطان الثدي
سباق ماراثون البحرين للتتابع

بنك الخليج الدولي | اإلحتفال بمرور 40 عاما
التقرير السنوي 2015 22
نظرة عامة على المسؤولية اإلجتماعية للشركة
يحمل بنك الخليج الدولي على عاتقه إلتزاما دائما بدعم تطوير الصناعة المصرفية اإلقليمية والمساهمة في رفاهية المجتمعات المحلية التي يمارس أعماله بها. ومن أهم التطورات الرئيسية في
هذا الصدد خالل 2015، إطالق برنامج المسئولية االجتماعية الجديد )واجب(، الذي يهدف إلى دعم المجتمعات المحلية في البحرين
والمملكة العربية السعودية. وفيما يلي تسليط للضوء على بعض األمثلة على مبادرات المسؤولية اإلجتماعية.
إطالق برنامج المسؤولية اإلجتماعية الجديدأطلق بنك الخليج الدولي في عام 2015 برنامج
المسؤولية اإلجتماعية الجديد )واجب( وهو مصمم لتمكين البنك من تحسين سبل دعمه
للمجتمعات المحلية في البحرين والمملكة العربية السعودية، من خالل الدعم المالي والعملي والفعاليات الخاصة بالمسؤولية
اإلجتماعية. وقد قدم بنك الخليج الدولي أول تبرع في إطار هذا البرنامج إلى الجمعية البحرينية
لمتالزمة داون التي تقدم الدعم لألفراد المتأثرين بمتالزمة داون وآلبائهم وأسرهم.
الوعي الصحيشارك بنك الخليج الدولي في مبادرات التوعية
بسرطان الثدي في البحرين والمملكة العربية السعودية خالل 2015، حيث قام موظفو البنك
بجمع األموال لدعم جمعية ثنك بنك البحرين وجمعية زهرة لسرطان الثدي بالمملكة العربية
السعودية. وفي بادرة لدعم التوعية بسرطان الثدي قام بنك الخليج الدولي بإنارة مبنى مقره
الرئيسي باللون الوردي طوال شهر أكتوبر. وباإلضافة إلى ذلك شارك الموظفون الذكور بالبنك في مبادرة “موفمبر” للتوعية بأمراض
السرطان عند الرجال. وشملت هذه المبادرة محاضرة حول التثقيف الصحي والتوعية الصحية
للرجال.المشاركة المجتمعية
يحث بنك الخليج الدولي الموظفين على المشاركة في األنشطة المجتمعية ويدعمهم في ذلك. وفي هذا الصدد يشارك البنك منذ سنوات عديدة في أثنين من سباقات التحمل السنوية وذلك لجمع األموال لألعمال الخيرية
في البحرين؛ وهما سباق ماراثون البحرين وسباق العوامات.
فقد شارك البنك في سباق ماراثون البحرين للتتابع 2015، الذي تنظمه جمعية المائدة
المستديرة بالتعاون مع اإلتحاد البحريني أللعاب القوى. والذي فاز فيه فريق البنك مرة أخرى بالمركز األول في فئة المؤسسات المالية،
وبالمركز الثالث في الترتيب العام من بين 177 فرقة مشاركة. كما شارك بنك الخليج الدولي
أيضا في سباق العوامات 2015 الذي نظمه نادي روتاري السلمانية، حيث شارك فريق من موظفي البنك في سباق البحر المفتوح لفئة
الرجال.رعاية الفعاليات
رعى بنك الخليج الدولي وشارك في مؤتمر يوروموني السعودية العاشر الذي عقد بالعاصمة
السعودية الرياض خالل شهر مايو 2015 بعنوان “الفرص واألسواق المالية”. وشارك في هذا
المؤتمر المالي واالستثماري الهام أكثر من 1500 اع شخصية من المسؤولين الحكوميين وصن
السياسات وقادة من قطاعي التمويل واألعمال لتبادل األفكار ووجهات النظر حول دور المملكة
في المنطقة واالقتصاد العالمي.ولقد افتتح معالي الدكتور إبراهيم العساف، وزير المالية هذه الفعالية التي تضمنت أيضا
مشاركات بارزة من كل من معالي السيد محمد الجدعان، رئيس هيئة السوق المالية؛ والسيد
عادل الغامدي، المدير التنفيذي للسوق المالية السعودية )تداول(؛ والسيد جين ليميير، رئيس
مجلس إدارة مجموعة بنك بي ان بي باريبا؛ والدكتور يحيى اليحيى، الرئيس التنفيذي لبنك
الخليج الدولي )من يناير 2009 إلى يناير 2016(. كما شارك الدكتور اليحيى أيضا في ندوة نقاش حول
“استراتيجية البنك” في حين شارك السيد خالد الغامدي، الرئيس التنفيذي المكلف لشركة جي
اي بي كابيتال في ندوة بعنوان “أسواق األسهم: االستراتيجية، الحوكمة الطرح العام األولي”.
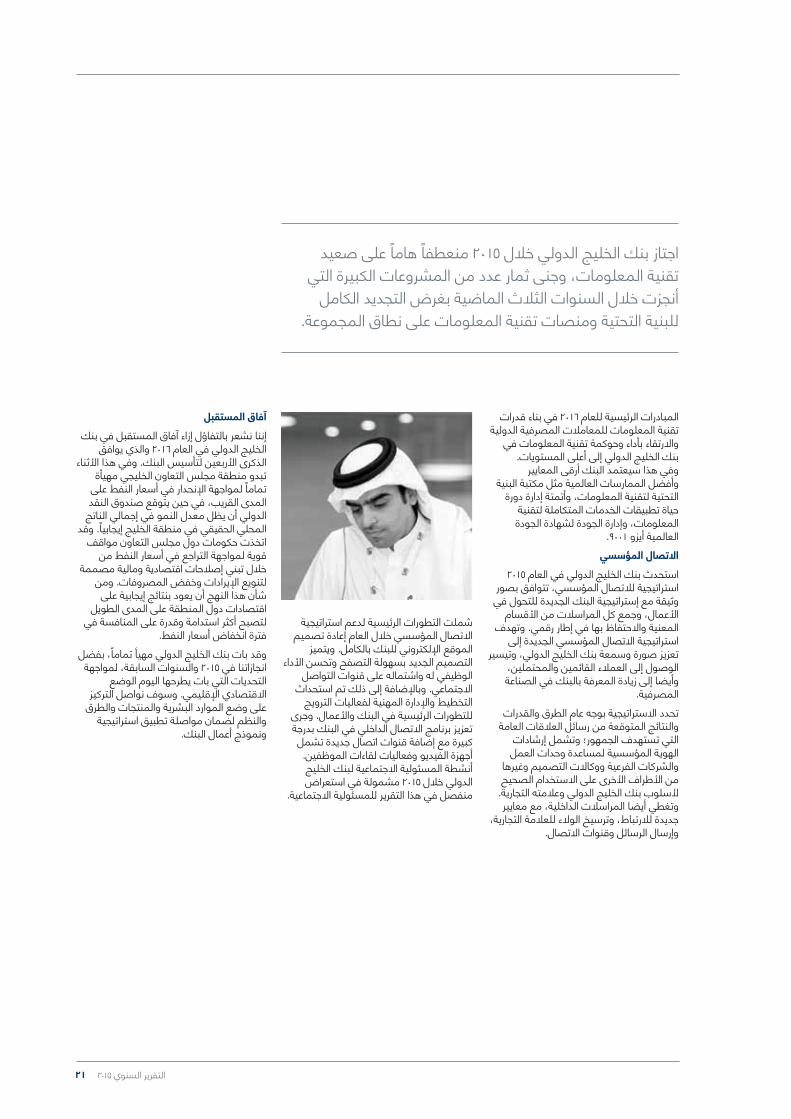
21 التقرير السنوي 2015
المبادرات الرئيسية للعام 2016 في بناء قدرات تقنية المعلومات للمعامالت المصرفية الدولية
واالرتقاء بأداء وحوكمة تقنية المعلومات في بنك الخليج الدولي إلى أعلى المستويات.
وفي هذا سيعتمد البنك أرقى المعايير وأفضل الممارسات العالمية مثل مكتبة البنية
التحتية لتقنية المعلومات، وأتمتة إدارة دورة حياة تطبيقات الخدمات المتكاملة لتقنية المعلومات، وإدارة الجودة لشهادة الجودة
العالمية أيزو 9001.االتصال المؤسسي
استحدث بنك الخليج الدولي في العام 2015 استراتيجية لالتصال المؤسسي، تتوافق بصور وثيقة مع إستراتيجية البنك الجديدة للتحول في
األعمال، وجمع كل المراسالت من األقسام المعنية واالحتفاظ بها في إطار رقمي. وتهدف
استراتيجية االتصال المؤسسي الجديدة إلى تعزيز صورة وسمعة بنك الخليج الدولي، وتيسير
الوصول إلى العمالء القائمين والمحتملين، وأيضا إلى زيادة المعرفة بالبنك في الصناعة
المصرفية. تحدد االستراتيجية بوجه عام الطرق والقدرات
والنتائج المتوقعة من رسائل العالقات العامة التي تستهدف الجمهور؛ وتشمل إرشادات الهوية المؤسسية لمساعدة وحدات العمل
والشركات الفرعية ووكاالت التصميم وغيرها من األطراف األخرى على االستخدام الصحيح
ألسلوب بنك الخليج الدولي وعالمته التجارية. وتغطي أيضا المراسالت الداخلية، مع معايير
جديدة لالرتباط، وترسيخ الوالء للعالمة التجارية، وإرسال الرسائل وقنوات االتصال.
شملت التطورات الرئيسية لدعم استراتيجية االتصال المؤسسي خالل العام إعادة تصميم
الموقع اإللكتروني للبنك بالكامل. ويتميز التصميم الجديد بسهولة التصفح وتحسن األداء
الوظيفي له واشتماله على قنوات التواصل االجتماعي. وباإلضافة إلى ذلك تم استحداث
التخطيط واإلدارة المهنية لفعاليات الترويج للتطورات الرئيسية في البنك واألعمال. وجرى تعزيز برنامج االتصال الداخلي في البنك بدرجة كبيرة مع إضافة قنوات اتصال جديدة تشمل أجهزة الفيديو وفعاليات لقاءات الموظفين. أنشطة المسئولية االجتماعية لبنك الخليج الدولي خالل 2015 مشمولة في استعراض
منفصل في هذا التقرير للمسئولية االجتماعية.
آفاق المستقبلإننا نشعر بالتفاؤل إزاء آفاق المستقبل في بنك
الخليج الدولي في العام 2016 والذي يوافق الذكرى األربعين لتأسيس البنك. وفي هذا األثناء
تبدو منطقة مجلس التعاون الخليجي مهيأة تماما لمواجهة اإلنحدار في أسعار النفط على المدى القريب، في حين يتوقع صندوق النقد
الدولي أن يظل معدل النمو في إجمالي الناتج المحلي الحقيقي في منطقة الخليج إيجابيا. وقد
اتخذت حكومات دول مجلس التعاون مواقف قوية لمواجهة التراجع في أسعار النفط من
خالل تبني إصالحات اقتصادية ومالية مصممة لتنويع اإليرادات وخفض المصروفات. ومن شأن هذا النهج أن يعود بنتائج إيجابية على
اقتصادات دول المنطقة على المدى الطويل لتصبح أكثر استدامة وقدرة على المنافسة في
فترة انخفاض أسعار النفط. وقد بات بنك الخليج الدولي مهيأ تماما، بفضل انجازاتنا في 2015 والسنوات السابقة، لمواجهة
التحديات التي بات يطرحها اليوم الوضع االقتصادي اإلقليمي. وسوف نواصل التركيز
على وضع الموارد البشرية والمنتجات والطرق والنظم لضمان مواصلة تطبيق استراتيجية
ونموذج أعمال البنك.
اجتاز بنك الخليج الدولي خالل 2015 منعطفا هاما على صعيد تقنية المعلومات، وجنى ثمار عدد من المشروعات الكبيرة التي
أنجزت خالل السنوات الثالث الماضية بغرض التجديد الكامل للبنية التحتية ومنصات تقنية المعلومات على نطاق المجموعة.

بنك الخليج الدولي | اإلحتفال بمرور 40 عاما
التقرير السنوي 2015 20
تم تجديد الطريقة المتكاملة في التوظيف تماما، وشمل ذلك تطبيق خدمات اوراكل تاليو
كالود سيرفس. وإلى ذلك أطلق البنك نظام اختيار المرشحين عن طريق الفيديو، وهي أول مرة تستخدم فيها مؤسسة خدمات مالية هذا النظام في البحرين. وقد وفرت هذه األدوات
إمكانية اختيار أفضل األشخاص أداء من الذين يتمتعون بالمهارات المناسبة وتوجيههم نحو
األهداف الرئيسية، مع تطوير نظام المكافآت المناسب لهم. وشملت المبادرات األخرى ذات الصلة تدشين آلية جديدة الكساب الموظفين
الجدد المعرفة الضرورية والمهارات الالزمة ليصبحوا أعضاء فعالين في البنك، والبرنامج
التعريفي بالشركة، والطريقة الموحدة لتخطيط القوى العاملة، والموقع اإللكتروني لمراجعة
المسارات المهنية. وباإلضافة إلى ذلك تم إطالق المرحلة األولي من سياسة تخطيط تقييم الواهب واستبدالها؛ إلى جانب أستحداث برنامج الكفاءات السلوكية الجديد باإلضافة إلى تدريب
إدارة األداء للمدراء المباشرين.
واصل البنك على استثماره الكبير في التدريب والتطوير خالل العام. ومن التطورات الرئيسية
في هذا الصدد تعزيز برنامج تنمية الشباب المهنيين، الذي تم إطالقه ألول مرة في عام
2013، وبات ينخرط فيه اآلن 40 مشاركا من الكوادر البارزة من خريجي الجامعات الخليجية
في دفعتين كل سنة. وشملت التحسينات في البرنامج مسارات مهنية جديدة ومراجعة المناهج
التي تركز كثيرا على التدريب الفني والشهادات المهنية مع استراتيجية محددة المعالم لالختيار
والتخريج وتقسيم المواهب.من المحركات الرئيسية لبرنامج بنك الخليج
الدولي المستمر بشأن التحول الثقافي نظام تنقل القيادات. وقد تم تطبيق المرحلة الثانية من هذا البرنامج التي تستهدف نواب رئيس
أوليين وبعض من نواب الرئيس الذين يشكلون الطبقة الثانية في اإلدارة العليا خالل العام 2015.
يحدد البرنامج القدرات السلوكية المتوقعة من قيادات البنك ويشمل ذلك االستعداد الذهني
إليجاد الحلول، واالهتمام بالتركيز على العميل، والنهج التعاوني، وااللتزام بتحويل االستراتيجية
إلى واقع ملموس.يركز البنك بصورة خاصة على التطور المؤسسي
- ترجمة االستراتيجية إلى هيكل تنظيمي - بغية دعم التوسع االستراتيجي في األعمال.
وتم خالل العام 2015 تكوين فريق عمل جديد للخدمات المصرفية لألفراد ليتولي قيادة
المرحلة القادمة من النمو؛ كذلك تأسس فريق لخدمة العمالء من الشركات المتوسطة في
إطار الخدمات المصرفية بالجملة؛ وتم إضافة إلى ذلك ألول مرة تطوير هيكل مؤسسي
للمعامالت المصرفية الدولية سيجري إطالقه في 2016، وعكف البنك على مهمة لتخطيط القوى العاملة تستغرق ثالث سنوات بهدف دعم جهود تحقيق األهداف االستراتيجية من
خالل التخطيط المتطور الحتياجات التوظيف خالل األشهر الـ12-36 المقبلة. وعلى الرغم من
المنافسة المتزايدة على المواهب البارزة في الصناعة المصرفية اإلقليمية، فقد نجح بنك الخليج الدولي في توظيف مختصين مهنيين
جدد لدعم تطوره االستراتيجي في خطوط األعمال األساسية. وفي نهاية العام 2014 نما
عدد موظفي البنك إلى أكثر من 1,000 موظف بحيث تضاعف تقريبا خالل الثالث سنوات
الماضية، مع تحقيق المزيد من التحسن في معدل االحتفاظ بالموظفين.
تقنية المعلوماتاجتاز بنك الخليج الدولي خالل 2015 منعطفا
هاما على صعيد تقنية المعلومات، وجنى ثمار عدد من المشروعات الكبيرة التي انجزت خالل
السنوات الثالث الماضية بغرض التجديد الكامل للبنية التحتية ومنصات تقنية المعلومات على
نطاق المجموعة. وشمل ذلك إقامة شبكة جديدة من فروع الخدمات المصرفية لألفراد،
وتدشين مراكز جديدة للبيانات؛ واستبدال عدد من األنظمة الرئيسية مثل المنظومة المصرفية
الرئيسية، ونظام مكتب الخزينة األمامي والخلفي، ونظام الدفع بالرسائل النصية. وشمل أيضا تطوير قدرات جديدة في تقنية المعلومات
خاضعة لحقوق الملكية لالستخدام في البنك الجديد للخدمات المصرفية لألفراد.
أنجز البنك هذه المشروعات، التي تتزامن مع تطبيق مع األنظمة الرئيسية، في نطاق عام وإطار زمني لم يسبق له مثيل في الصناعة
المصرفية اإلقليمية. وشملت االنجازات اإلضافية خالل 2015 تنفيذ بنية ونظم تقنية
المعلومات في الفرع الجديد في أبوظبي ومكتب دبي التمثيلي؛ والتوافق مع معايير المعلومات في صناعة بطاقات الدفع عند
إصدار البطاقات والحصول عليها. وستتمثل
تقرير اإلدارة تتمة

19 التقرير السنوي 2015
وخالل العام واصلت الخزينة دعم إستراتيجية األعمال الجديدة لبنك الخليج الدولي بتوفير
حلول للخزينة معدة حسب الطلب لقاعدة عمالء البنك، ودعم المبادرات االستراتيجية للبيع
المتبادل مع أعمال الخدمات المصرفية بالجملة. وإلى ذلك واصل مكتب حلول العمالء تطوير
وتنويع حلول الخزينة المتاحة لعمالء البنك تماشيا مع المتطلبات المتجددة في السوق.
ظلت محفظة التمويل قوية خالل العام 2015، في مؤشر على استمرار ثقة العمالء واألطراف
األخرى. وبقيت قيمة محفظة استثمارات البنك، وهي تتألف من سندات وصكوك عالية
التصنيف صادرة عن مؤسسات مالية عالمية ومؤسسات مالية وشركات في نفس مستواها
في العام 2014. وتم تعديل تركيبة محفظة السيولة على ضوء التغير في ظروف السوق
والتوجيهات الرقابية مع زيادة المخاطر على الشركات وانخفاض المخاطر على المؤسسات
المالية. إدارة المخاطر
تتكون مهمة إدارة المخاطر في البنك من وحدات متخصصة تغطي مجاالت إدارة مخاطر
المشروعات؛ ومخاطر االئتمان والتشغيل؛ والسوق والسيولة؛ وأمن المعلومات؛ والتحليل
االقتصادي والقانوني. وتجرى مراجعة إطار وطرق وإجراءات إدارة المخاطر سنويا لضمان
التأكد من مطابقة متطلبات السلطات الرقابية في مختلف الدول التي يمارس البنك أعماله
بها. ركز البنك بصورة رئيسية خالل العام 2015 على إدارة تأثير مخاطر البنك الناجمة عن التغيرات
في بيئة االقتصاد والسوق جراء التراجع الحاد في أسعار النفط وخفض اإلنفاق الحكومي في
منطقة دول مجلس التعاون الخليجي. بناء على ذلك قام بنك الخليج الدولي بمراجعة وتعزيز
سياسات االقراض؛ وخفض التشدد على بعض القطاعات المعينة التي تعتمد على اإلنفاق
الحكومي مثل قطاع اإلنشاءات.ظلت جودة أصول البنك عالية، وتم تحقيق
الزيادة في محفظة القروض خالل العام بدون تخفيف في المستوى المقدر للمخاطر. تعزز ذلك بتثبيت وكالة موديز إنفسترز سيرفيس
“موديز” لتصنيفها االئتماني لبنك الخليج الدولي فيما يتعلق بالدين الممتاز والودائع بالعمالت
األجنبية على المستوى “A3”، وتعديل تقدير النظرة المستقبلية لتصنيف ودائع البنك من درجة “سلبي” إلى “مستقر”. وأوضحت موديز
أن تثبيت التصنيف وتعديل النظرة المستقبلية “يعكس قوة رأس المال وغطاء مخاطر السيولة، والتحسن في مقاييس جودة األصول، وخفض
مستوى تركيزات قاعدة أصول البنك”. بعد تطبيق المنظومة المصرفية األساسية
الجديدة وأنظمة الخدمات المصرفية لالفراد، والخزينة، وغيرها من األنظمة، وضعت خطة
متابعة األعمال في البنك ونظام التعافي من الكوارث تحت دائرة الضوء في النصف الثاني من العام. وبناء على ذلك تولت وحدة مخاطر
التشغيل بالبنك إعداد تحليل التأثير على األعمال وقامت بتوثيق ومراجعة خطة استمرارية األعمال
وترتيبات التعافي من الكوارث في البنك.واصلت وحدة أمن المعلومات إنجازاتها بتصدر جهود اعتماد معاملة رقم التعريف الشخصي
وفقا للمعايير العالمية لبطاقات الدفع، وحافظت للعام الثاني على التوالي على شهادة
معايير أمن المعلومات في مجال بطاقات الدفع
التي حصل عليها بنك الخليج الدولي مؤخرا. كما قامت الوحدة بتكوين مجموعة اتصال جديدة )مجموعة الخدمات األمنية( لتكون أول جهة
لالتصال بشأن كافة األنشطة المتعلقة باألمن.الموارد البشرية
قام بنك الخليج الدولي خالل 2015 بخطوات إضافية لتوسيع إطار رأس المال البشري لتنفيذ
استراتيجية البنك وتحقيق رؤيته في أن يصبح “جهة العمل المفضلة” في الصناعة المصرفية
في المنطقة. وقام البنك بالعديد من المبادرات االستراتيجية لتحسين أداء الموارد البشرية في
العمل؛ وعرض مزيد من التدخالت االستراتيجية في نطاق الخدمات المقدمة، مثل التوظيف،
وتخطيط القوى العاملة، والتصميم المؤسسي، والتقويم الوظيفي، وتخطيط المكافآت،
والسياسات واإلجراءات، والتعلم والتطوير.
واصل بنك الخليج الدولي في تحقيق تقدم متميز خالل عام 2015 في مسعاه لتحويل وحدة الخدمات المصرفية بالجملة
إلى وحدة أعمال تستند على العالقات.

بنك الخليج الدولي | اإلحتفال بمرور 40 عاما
التقرير السنوي 2015 18
وفيما يتعلق بتطوير أعمال إدارة الصكوك المحلية في المملكة العربية السعودية،
تعاون بنك الخليج الدولي )المملكة المتحدة( المحدود وجي اي بي كابيتال، لتعزيز فهم أوضاع
السوق واستكشاف الفرص المتاحة فيها. وتم استحداث طريقة مشتركة لتوظيف فريق يتمتع
بقدرات تحليلية في المملكة ليعمل على دعم إدارة محفظة الصكوك؛ كما سيعمل الفريق
بصورة وثيقة مع تنفيذي المبيعات الجديد المتمركز في السعودية والذي تم توظيفه من قبل جي اي بي كابيتال والمتخصص في إدارة
أصول بنك الخليج الدولي. وحصل بنك الخليج الدولي )المملكة المتحدة( المحدود على تسجيل
لجنة األوراق المالية والبورصات في الواليات المتحدة األمريكية، وتبع ذلك حصول البنك على
تفويض إلدارة أدوات للدخل الثابت بقيمة 100 مليون دوالر من واحد من أكبر عشرة صناديق
أمريكية لمعاشات التقاعد. وأدت اإلنجازات التي حققها البنك في إدارة األصول في عام
2015 إلى فوز البنك بجوائز مرموقة في الصناعة المصرفية، شملت جائزة “أسرع بنك إدارة أصول
نموا في المملكة العربية السعودية” من مجلة “جلوبال بانكنج آند فاينانس ريفيو”. إضافة
إلى جائزتي “أفضل مدير لألصول في البحرين” و“أفضل مدير استثمار في األسهم” من مجلة “جلوبال انفستور”. كما حصل صندوق فرص
االستثمار في األسواق الناشئة التابع لبنك الخليج الدولي على جائزة “اختصاصي ائتمان”
من مجلة “آلت كريديت انتلجنس”.
الخدمات المصرفية لألفرادتم في يناير 2015 بنجاح اطالق البنك الرائد
للخدمات المصرفية لألفراد القائمة على التقنية الحديثة والمتوافقة مع الشريعة
تحت العالمة التجارية “م” مع باقة أولية من منتجات المطلوبات في الخبر بالمملكة العربية السعودية. وقد تم بث حفل تدشين البنك حيا
على قناة “يوتيوب” مستقطبا أكثر من 3000 مشاهد كما وصل إلى مليون مشاهد عبر
“تويتر”. وأكدت نتائج استطالع مستقل ألراء العمالء أجري خالل العام قوة إدراك العمالء
للعالمة التجارية والذي تعزز أيضا بالنمو المشجع في عدد العمالء الجدد خالل 2015.
وشملت التطورات الرئيسية الداعمة خالل العام التوسع في الشبكة المادية للخدمات
بافتتاح ثمانية “متاجر صغيرة” أخرى بالمجمعات التجارية ومنافذ أخرى منتقاة للبيع بالتجزئة
تتعلق بالتكنولوجيا؛ وبدء العمل بشبكة أجهزة الصراف اآللي. وباإلضافة إلى ذلك تم االنتهاء من وضع خطط إطالق منتجات أصول التجزئة
في 2016، والتي تشمل بطاقات االئتمان، والقروض الشخصية، والقروض إلى أجل
القائمة على هيكل التورق. وقد تم إطالق كل هذه المنتجات بنجاح خالل العام 2015 من
خالل طرح محدود للموظفين تاله طرح تجريبي للعمالء المؤسسين. تم خالل هذا العام تطوير
واختبار أنظمة تقنية المعلومات الضرورية لطرح منتجات األصول الجديدة؛ وهي تتوافق تماما مع متطلبات الشبكة السعودية للمدفوعات ومعايير أمن المعلومات في صناعة بطاقات الدفع. ولغرض دعم خطط التوسع الطموحة
لبنك خدمات األفراد الجديد تم تعيين عدد
إضافي من الموظفين؛ ودعم إدارة البنك بتعيين رئيس للخدمات التجارية والتسويق واالبتكار.
وباإلضافة إلى ذلك، أعيد تصميم إطار تقديم الخدمات لتعزيز وقت تقديم المنتجات المحسنة
والمنتجات والخدمات الجديد إلى السوق.الخزينة واالستثمارات
واصل بنك الخليج الدولي االستثمار في أعمال الخزينة األساسية خالل العام 2015. وشملت التطورات الجديدة في هذا الصدد النجاح في
تدشين نظام الخزينة الجديد وتوظيف عدد إضافي من الموظفين. وباإلضافة إلى ذلك أنشئت وحدة لكامل عمليات الخزينة بالفرع
الجديد للخدمات المصرفية بالجملة في أبوظبي بدولة اإلمارات العربية المتحدة، الذي يكمل عمل وحدات الخزينة في البحرين والمملكة
العربية السعودية ولندن.
تقرير اإلدارة تتمة

17 التقرير السنوي 2015
وإلى ذلك أحرز بنك الخليج الدولي تقدما ممتازا في تنفيذ الخطة الخمسية االستراتيجية الجديدة
والتي تميزت بتطورات رئيسية في أنشطة المبيعات والتسويق، وتطوير المنتجات، واختراق
السوق. وتم تشكيل فريق جديد للمبيعات مع تقديم عروض في المملكة العربية السعودية،
ودول مجلس التعاون الخليجي، وأوروبا، والواليات المتحدة األمريكية لتوسيع قاعدة انتشار العمالء؛ بينما تم تأسس فريق جديد
إلدارة العالقات لخدمة العمالء القائمين. ركز ل حديثا على فريق تطوير المنتجات الذي شك
تطوير قاعدة المنتجات القائمة مع تركيز خاص على منطقة الشرق األوسط وشمال أفريقيا
والحلول المتوافقة مع الشريعة في مجال األسهم العادية وأدوات الدخل الثابت. وشمل ذلك النجاح في إطالق خدمة متخصصة في إدارة محفظة الصكوك. وخالل العام حصلت إدارة األصول على أول تفويض من منطقة
الشرق األوسط وشمال أفريقيا لترتيب إصدار صكوك لشركة تأمين مقرها بالمملكة العربية
السعودية.
واالستحواذ، وحقوق اإلصدار، وإعادة الهيكلة المالية ومعامالت ترتيب الديون.
شملت المعامالت التي أجرتها وحدة أسواق رأس المال في 2015 إدارة اكتتاب في أسهم
حقوق أولوية بقيمة 200 مليون ريال سعودي للشركة العالمية للتأمين التعاوني، إلى جانب معاملتين للدمج واالستحواذ لشركتين آخرين مرموقتين. وشملت المعامالت التي أجرتها
وحدة أسواق الدين الرأسمالية إصدار صكوك بقيمة 1 مليار ريال سعودي لبنك التنمية
اإلسالمي، وإصدار صكوك بقيمة 1 مليار ريال سعودي لمجموعة بن الدن السعودية، وإصدار
آخر بقيمة 1 مليار ريال سعودي أيضا لشركة عبدالله العثيم لالستثمار والتطوير العقاري.
في حين شملت المعامالت التي أجرتها وحدة استشارات الدين ترتيب تسهيالت مرابحة بقيمة 700 مليون ريال سعودي لشركة خاصة مرموقة
في المملكة العربية السعودية، وتسهيالت
مجمعة للتمويل باإلجارة بقيمة 500 مليون دوالر لسلطة المرافق بدولة اإلمارات العربية المتحدة، وعملية إعادة هيكلة دين قيمته 137 مليون دوالر لشركة مدرجة في سوق البحرين لألوراق المالية.
وقد حصلت جي أي بي كابيتال على المزيد من التقدير من الصناعة المصرفية خالل العام 2015 حيث حازت على أربع جوائز تقديرية وهي
“أفضل اكتتاب عام أولي في الشرق األوسط” و“أفضل صفقة دمج واستحواذ” و”أفضل سندات سيادية” من مجلة “إيميا فايناس”؛
وجائزة “صفقة العام” من مجلة “ذا بانكر” وذلك عن المعامالت الهامة التي انجزتها خالل العام
الماضي.إدارة األصول
شهدت أعمال إدارة األصول في بنك الخليج الدولي التي يتوالها بنك الخليج الدولي
)المملكة المتحدة( المحدود عاما آخر من األداء القوي في 2015، على الرغم من ظروف
التقلبات المتزايدة في األسواق. فقد ارتفع إجمالي اإليرادات بمقدار 13,0 بالمائة مدفوعا
بأعمال أدوات الدخل الثابت التي تشمل إيرادات صندوق فرص االستثمار في األسواق الناشئة
الرئيسي الذي يديره البنك. استفادت أعمال األسهم الدولية التي تمثل غالبية األصول تحت
إدارة البنك من التقييم القوي في السوق في النصف األول من العام قبل ان تحدث حركة
تصحيحية في السوق في الربع الثالث من العام استقرارا في الدخل بصورة عامة. وبلغ إجمالي األموال تحت إدارة البنك في نهاية السنة 12,4 مليار دوالر أمريكي مقارنة مع 13,0 مليار دوالر
أمريكي في نهاية 2014.

بنك الخليج الدولي | اإلحتفال بمرور 40 عاما
التقرير السنوي 2015 16
تقرير اإلدارةيؤذن تدشين الفرع الجديد للخدمات المصرفية
بالجملة في أبوظبي ببداية تطبيق خطة االنتشار الجغرافي للبنك والتي تهدف إلى إرساء وجود
راسخ له في األسواق الرئيسية في دول مجلس التعاون الخليجي.
الخدمات المصرفية بالجملة واصل بنك الخليج الدولي في تحقيق تقدم
متميز خالل عام 2015 في مسعاه لتحويل وحدة الخدمات المصرفية بالجملة إلى وحدة أعمال
تستند على العالقات. وتركز هذه االستراتيجية على ثالثة دعائم تشمل استقطاب المزيد من
العمالء واالنتشار الجغرافي ألعمال البنك وتنويع منتجاته.
قاعدة العمالءواصل البنك التركيز على عمليات البيع المتقاطع
للخدمات المصرفية والخدمات المصرفية للشركات، ومنتجات الخزينة وتمويل التجارة،
والخدمات للقاعدة العريضة من العمالء، وأدى ذلك إلى زيادة في اإليرادات غير المرتبطة باألصول المتعلقة بالعمالء. وحقق بنك
الخليج الدولي أيضا نموا في محفظة القروض األساسية بمقدار الثلث من خالل النجاح الذي
حققه في إعادة توجيه أنشطته االقراضية بالتركيز على تعزيز عالقاته مع الشركات الكبيرة
والمتوسطة عوضا عن صفقات تمويل المشاريع والتمويل المهيكل طويل األجل.
وجدير باالهتمام أن صفقات التمويل المتوافقة مع الشريعة التي تم إقفالها خالل العام تشمل
ترتيب وتعهد تغطية االكتتاب في قرض سيادي بقيمة 1 مليار دوالر أمريكي لسلطنة عمان؛
وقيام البنك بدور المرتب الرئيسي المفوض ومتعهد تغطية اإلصدار لتسهيالت بقيمة 125
مليون دوالر أمريكي مدتها خمس سنوات لشركة البحرين للتسهيالت التجارية؛ وترتيب تسهيالت بقيمة 109 ماليين دوالر أمريكي
للشركة العربية البحرية لنقل البترول. وباإلضافة إلى ذلك قام بنك الخليج الدولي بترتيب
تسهيالت تمويل لالستحواذ على حصة في
مجموعة كبيرة في المملكة العربية السعودية، وتسهيالت تمويل بقيمة 157 مليون ريال
سعودي لشركة أجا للصناعات الدوائية، وهي شركة فرعية تابعة للشركة الكيميائية السعودية. كما قام البنك أيضا من خالل شركة جي اي بي
كابيتال، ذراعه االستثمارية، بترتيب تسهيالت مرابحة قيمتها 700 مليون ريال سعودي لتجمع
من الشركات الخاصة السعودية.شارك بنك الخليج الدولي في عدد من
الصفقات الهامة لتمويل شراء الطائرات لشركات النقل الكبرى في المنطقة؛ وعزز من
عالقاته مع شركة اإلمارات الوطنية للبترول بالمشاركة في تسهيالت مجمعة بلغت قيمتها 1,5 مليار دوالر أمريكي. وإضافة إلى ذلك قدم
البنك تسهيالت مرابحة متجددة قيمتها 150 مليون ريال سعودي إلى مجموعة عبد المحسن الحكير للسياحة والتنمية لتمويل متطلبات رأس
المال العامل.االنتشار الجغرافي
يؤذن تدشين الفرع الجديد للخدمات المصرفية بالجملة في أبوظبي ببداية تطبيق خطة االنتشار
الجغرافي للبنك والتي تهدف إلى إرساء وجود راسخ له في األسواق الرئيسية في دول مجلس
التعاون الخليجي. ومن شأن تحويل مكتب أبوظبي التمثيلي إلى فرع كامل للخدمات
المصرفية بالجملة أن يدعم المسعى الطموح لبنك الخليج الدولي ألن يصبح المصرف الرائد
في تقديم الخدمات المصرفية الشاملة في دول مجلس التعاون الخليجي بما يمتلك من خبرات إقليمية راسخة وما يتمتع به من انتشار دولي
وبما يقدمه من حلول مالية مبتكرة. كذلك تتعزز عمليات البنك في دولة اإلمارات العربية المتحدة
بالمكتب التمثيلي الذي تأسس حديثا في دبي.
تنويع المنتجاتفي تطور إستراتيجي هام بدأ بنك الخليج الدولي
تنفيذ مبادرة العروض المصرفية الجديدة ذات القيمة المضافة. وتم إعداد الخطط الستحداث
منتجات جديدة في العام 2016 تشمل إدارة النقد والتمويل المهيكل للتجارة، وتدشين بوابة جديدة للخدمات المصرفية اإللكترونية للشركات. وبدأ
البنك بتوظيف فريق جديد متخصص، مع تطوير شبكة الشركاء في األعمال؛ بينما قام بإنشاء ثالثة فروع جديدة للخدمات المصرفية
للشركات لغرض خدمة العمالء بالمناطق الشرقية والوسطى والغربية في المملكة العربية
السعودية. وإلى ذلك قام بنك الخليج الدولي بتعزيز تشكيلة المنتجات المتوافقة مع الشريعة
لكي تلبي الطلب المتنامي من العمالء، حيث قام بهيكلة وإطالق عدد من المنتجات الجديدة
المتوافقة مع الشريعة خالل العام.الخدمات المصرفية االستثمارية
على خلفية الصعوبات التي واجهت بيئة االقتصاد الكلي، سجلت شركة جي أي بي
كابيتال، وهي الذراع االستثمارية لبنك الخليج الدولي في المملكة العربية السعودية، مرة أخرى
أداء قويا في العام 2015. ونجحت كل أقسام األعمال الثالثة في الشركة - أسواق رأس المال،
وأسواق الدين الرأسمالية، واستشارات الديون - في إنجاز معامالت استثمارية هامة ونجحت
في الحصول على تفويضات جديدة. وشهد هذا العام أفضل أداء فيما يتعلق باإليرادات في تاريخ بنك الخليج الدولي، حيث أسهمت وحدة أسواق
رأس المال بأكبر نصيب في اإليرادات بينما حققت أسواق الدين الرأسمالية واستشارات
الديون أداء قويا. وشملت أعمال التفويض في غالبيتها مساعدة الشركات في أعمال الدمج
يحيى عبدالله اليحيى الرئيس التنفيذي
)من يناير 2009 إلى يناير 2016(

15 التقرير السنوي 2015
التوقعات المستقبلية لدول مجلس التعاون الخليجي
على الرغم من تحديات األوضاع المالية فإن منطقة مجلس التعاون الخليجي مهيأة تماما
لمواجهة اإلنحدار في أسعار النفط على المدى القريب. من المرجح أن يكون بوسع دول
المنطقة أن تمتص الرياح الخارجية غير المواتية في حين يتوقع أن يظل معدل النمو في إجمالي
الناتج المحلي الحقيقي لهذه الدول إيجابيا. ويدعم من هذه التوقعات المستقبلية المرضية الموقف الفاعل الذي اتخذه صناع السياسة في
دول مجلس التعاون الخليجي إزاء التراجع في أسعار النفط، بزيادة التركيز على الكفاءة، وترشيد
االنفاق )بخفض الدعم لتخفيف الضغوط المالية(، وعليه يتوقع فرض ضريبة القيمة المضافة بالمنطقة في المستقبل القريب.
أخذ معدل النمو االقتصادي )في القطاعين النفطي وغير النفطي( في التراجع غير أن
التوقعات تبقى إيجابية إلى العام 2017 حتى في ظل أكثر السيناريوهات تشاؤما. ويقدر، وفقا
لبيانات صندوق النقد الدولي، أن يبلغ متوسط النمو في إجمالي الناتج المحلي الحقيقي في منطقة الخليج حوالي 3,4 بالمائة في 2015 غير
أنه من المتوقع أن يسجل انخفاضا معتدال ليقل عن 3 بالمائة في 2016. ويعتبر إعالن دول
مجلس التعاون الخليجي حول إصدارات سندات الدين المحلية مع لجوء السعودية إلى أسواق السندات العالمية للمرة األولى تطورا إيجابيا إلدارة الموجودات والمطلوبات في المنطقة
على المدى البعيد. وسيترتب على ذلك مواءمة أفضل الحتياجات البنية التحتية مع التمويل
الطويل األجل بما سيؤدي إلى خفض السحب من احتياطيات النقد األجنبي وإلى اإلسهام أيضا
في تعميق األسواق الرأسمالية اإلقليمية.ومن ناحية ثانية، تصدت المنطقة لعدد من التحديات المرتبطة بتدني أسعار النفط. فقد
تعرضت األسواق المالية الخليجية لضغوط منذ أن بدأت أسعار النفط في الهبوط وأدى ذلك
إلى إثارة التكهنات مؤخرا بشأن استمرارية تثبيت العمالت الخليجية مقابل الدوالر األمريكي، وهو
أمر معتاد في فترات انخفاض األسعار. وفي خالل فترات تكهنات سابقة في المملكة العربية
السعودية بشأن تثبيت الريال السعودي مقابل الدوالر، تدخلت موسسة النقد العربي السعودي
)ساما( لتبديد المخاوف ويتوقع أن تفعل ذلك مجددا في هذه المرة.
برهن تثبيت الريال السعودي إلى الدوالر على جدواه خالل فترة من التكهنات الواسعة في السنوات 1993 و1998 و2004؛ بيد أن المملكة
العربية السعودية باتت تتمتع اآلن بوضع مالي أكثر قوة مع ضآلة في حجم المديونية بما يدل
على أنه ليس هناك احتماالت واقعية، رغم ضغوط انخفاض أسعار النفط، لتعديل أسعار
الصرف في أي وقت قريب سواء في المملكة أو غيرها من دول مجلس التعاون الخليجي.
يتوقع أن تواجه مؤسسات العقارات والبنية التحتية في منطقة الخليج ضعفا في بيئة التشغيل في 2016 على خلفية تدني أسعار
النفط، في حين أخذ حجم اإلنفاق الحكومي )رغم أنه ما زال في مستويات عالية( في التراجع وسط
تباطؤ النمو االقتصادي. وتملك غالبية دول مجلس التعاون الخليجي قدرات مالية إلدارة
الهبوط الحالي، غير أن طاقتها على التكيف مع هذا الوضع ستعتمد على ما ستعتمده به من سياسات رئيسية فيما يتعلق بأنماط اإلنفاق
الحكومة ومستويات الدين.يظل التأخر في انتعاش سوق النفط أكبر مخاطر هذا الهبوط الحاد في األسعار. وإذا بقيت أسعار
النفط متدنية لفترة أطول فإن من شأن ذلك أن يؤدي إلى استنزاف االحتياطيات المالية
واألجنبية بما يحدث المزيد من التأثير السلبي على االقتصاد. ويجب أن يتبع ذلك إجراء
تعديالت صارمة في السياسات، وبخاصة فيما يتعلق بخفض االنفاق المالي، وهو أمر يحتمل
أن يكون له تأثير غير موات على نمو القطاع غير النفطي وعلى الموازنات العمومية للبنوك
المحلية.
على الرغم من تحديات األوضاع المالية فإن منطقة مجلس التعاون الخليجي مهيأة تماما لمواجهة اإلنحدار في أسعار
النفط على المدى القريب.

بنك الخليج الدولي | اإلحتفال بمرور 40 عاما
التقرير السنوي 2015 14
االتجاهات االقتصادية والتوقعات المستقبلية في دول مجلس التعاون الخليجي
هيمن على مجريات أحداث العام التدهور الحاد في أسعار النفط، والتوقعات حول تأثير ذلك على اقتصادات منطقة دول مجلس التعاون الخليجي. ومن المؤكد أن يطرح التراجع الحاد
في أسعار النفط تحديات عديدة أمام دول الخليج حيث سجلت اإليرادات المالية والفوائض الخارجية انخفاضا كبيرا؛ كما أنه أدى إلى تقلبات
كبيرة في أسواق العمالت واألسواق الرأسمالية في المنطقة. غير أنه، وحسبما ظهر منذ تدهور أسعار النفط، أن لالقتصادات اإلقليمية مساحة
كافية من الحركة إلدارة التراجع في األسعار بفضل االحتياطيات الكبيرة من النقد األجنبي
وانخفاض مستوى الديون الذي يعزز أيضا تثبيت عمالت دول المنطقة بالدوالر األمريكي.
وعلى الرغم من ذلك، يظل عدم اليقين قائما بشأن الوقت الذي سيستغرقه الحال قبل أن تبدأ أوضاع المنطقة في التدهور، مع التركيز المباشر
على التحديات الهيكلية التي تواجه القطاع المصرفي. وعلى الرغم من أنه يتوقع أن تظل
األنظمة المصرفية في المنطقة سليمة إلى حد معقول على المدى القصير، فإن هناك مخاطر للتعرض لسحب مفاجئ حاد للودائع الحكومية،
من شأنه أن يحدث ضغوطا على السيولة في البنوك، إذا استمر االنخفاض في أسعار النفط
لفترة طويلة. وإضافة إلى ذلك فاقمت زيادة أسعار الفائدة األمريكية من المخاوف من أن
يؤدي ذلك إلى تشديد األوضاع المالية في مختلف دول مجلس التعاون الخليجي بسبب
تثبيت أسعار الصرف. وربما يؤدي ذلك في نهاية المطاف إلى تباطؤ في نمو االئتمان للقطاع
الخاص – حتى في حال حدوث ارتفاع معتدل في أسعار الفائدة األمريكية.
سيبقى الكثير معتمدا على مسار أسعار النفط والوقت الذي يبدأ فيه انعكاس االتجاه الهابط الحالي لألسعار. والعامل المهم هو امدادات
المعروض من النفط، وبخاصة التوقعات بشأن مصادر الهيدروكربونات غير التقليدية مثل النفط
الصخري األمريكي وعودة إيران إلى السوق – وقد ثبتت صعوبة التكهن باإلمدادات من
المصدرين.حاليا، ال يبدو أن انهيار أسواق النفط وشيكا. بل أن ديناميكية السوق توحي، على العكس
من ذلك، بأن بذور االزدهار النفطي المقبل قد تكون غرست بالفعل لثالثة أسباب رئيسية؛ أوال،
نتج عن قرار المملكة العربية السعودية بالتخلي عن دورها كمنتج مرن في إطار استراتيجية
بعيدة المدى للمحافظة على السوق انخفاض االستثمار في الطاقة في مختلف أنحاء العالم، وحد من ازدهار النفط الصخري األمريكي، وأثر
على قدرة التوسع في اإلنتاج من جانب منتجي النفط اآلخرين. ثانيا، على الرغم من تكلفته العالية، أثبت النفط الصخري األمريكي أنه
ضعيف على الرغم من االنخفاض الفائق في أسعار النفط. غير أن مستويات االنتاج أخذت في
االنخفاض، في حين أن السياسات األمريكية بشأن الطاقة والبيئة تحد أيضا من قدرة
الشركات األمريكية على المنافسة في التصدير. ثالثا، عززت شتى المخاطر األمنية والجيوسياسية
من احتماالت حدوث اضطراب مفاجئ في إمدادات النفط.
والواقع أن أجزاء كبيرة من منطقة الشرق األوسط تنتشر فيها النزاعات والتوترات، ويشمل
ذلك الحرب األهلية في سوريا وتأثير تداعياتها على األردن ولبنان المجاورين؛ وتوسع ما يسمى
بتنظيم الدولة اإلسالمية، الذي بات يسيطر على أراض شاسعة في سوريا والعراق؛ والثورات
المستمرة في ليبيا؛ والحرب في اليمن؛ والتحوالت السياسية الهشة في مصر وتونس؛
والشكوك المحيطة بسياسة التحرير في المغرب واألردن، التي أدت، بما صحبها من ضعف في
معطيات االقتصاد الكلي وإخفاق في إتمام برامج اإلصالح، إلى إبقاء األداء االقتصادي في
مستوى دون اإلمكانيات. وإضافة إلى ذلك ما زالت هناك تشعبات خفية في العالقات
السياسية واالقتصادية بين دول مجلس التعاون الخليجي وإيران في مرحلة ما بعد العقوبات.
استعراض الوضع االقتصادي تتمة

13 التقرير السنوي 2015
تزايد مخاطر عدم االستقرار المالي العالمي •الناجم عن التقلبات في األسواق المالية.
عدم اليقين بشأن أوضاع االقتصاد الصيني •ومخاطر انعكاس هذه األوضاع على األسواق
الناشئة.يزيد انخفاض أسعار النفط وغيره من السلع •
من تعقيد التوقعات المستقبلية بالنسبة لمصدري السلع وبات ينظر إليه على نحو
متزايد باعتبار أنه مؤشر على تذبذب الطلب العالمي وعلى الركود االقتصادي في مختلف
االقتصادات المتطورة والنامية.يهدد تصاعد التوترات الجيوسياسية بإحداث •
إضطراب في حركة التجارة العالمية وتدفقات رأس المال واالستثمارات.اتجاهات الصناعة المصرفية
استمر األداء الضعيف لالقتصاد العالمي في فترة تميزت بنقص النمو وانخفاض معدالت الفائدة في طرح تحديات ضخمة أمام الصناعة المصرفية. وعلى إثر االضطرابات التي أعقبت
بداية األزمة المالية االقتصادية، تعرضت البنوك لضغوط هائلة من المساهمين لتبني نماذج أعمال جديدة من شأنها أن تلبي المتطلبات
الصعبة للبيئة المصرفية الدولية. وباتت هناك اآلن اتجاهات رئيسية للصناعة تشمل التقنية
)الثورة الرقمية( وتزايد المتطلبات الرقابية التي تدفع باتجاه التغيير، وتجعل عملية المواكبة
صعبة على المتنافسين التقليديين. وفي حين
أدت التقنية إلى خفض الحواجز أمام دخول هذه الصناعة وزادت من حدة ضغوط المنافسة
وضخمت المتطلبات الرقابية بدرجة كبيرة من قاعدة التكلفة، وعليه لم يكن من المفاجئ أن تقلص العائد على األسهم في الصناعة أصبح
ضعيفا.وقد يؤدي التغير في قاعدة العمالء المتأثر بالتقنية والثورة الرقمية إلى خلق احتياجات مصرفية جديدة ومختلفة. فقد باتت هناك ضرورة لتخصيص استثمارات هائلة لتجديد
البنيات التحتية واألساليب المصرفية القديمة. وأصبح هناك اتجاه جديد للتركيز على العميل،
وعلى المزيد من الشفافية، وإضفاء الطابع الشخصي على المنتجات، واالنتقال السلس
بين القنوات، والتركيز على الحلول بدال عن المنتجات، وعلى تشكيلة من العروض الرقمية. كذلك تقوم البنوك بتغيير مواقع انتشارها التشغيلي من خالل تعزيز ترشيد
الكيان المؤسسي والتأدية الوظيفية والفعالية. وعلى ذلك تتجه األعمال المصرفية إلى المزيد
في التبسيط في نموذج األعمال واستحداث المنتجات.
اآلفاق المستقبلة الدوليةقدر صندوق النقد الدولي في أحدث توقعاته أن يرتفع معدل النمو العالمي من 3,1 بالمائة
في 2015 إلى 3,4 بالمائة في 2016 ومن ثم إلى 3,6 بالمائة في 2017. ومن المحتمل أن يتواصل
النشاط العالمي في التقدم بخطى تدريجية
وبخاصة في األسواق الناشئة واالقتصادات النامية، في حين سيستمر التعافي في
االقتصادات المتقدمة ولكن بوتيرة معتدلة وعلى نحو متفاوت. وقد الحظ صندوق النقد
الدولي أن المخاطر المستقبلية على المدى القريب تميل في اتجاه هابط وهي ترتبط
بالتحركات التصحيحية المستمرة في االقتصاد العالمي: وبالتباطؤ العام في اقتصادات
األسواق الناشئة، وإعادة التوازن في االقتصاد الصيني، وانخفاض أسعار السلع، والتخلص
التدريجي من أوضاع التيسير النقدي في الواليات المتحدة. وعليه فإن من المحتمل أن
ينحرف النمو العالمي عن مساره إذا لم تتم إدارة هذه التحديات الرئيسية بنجاح.
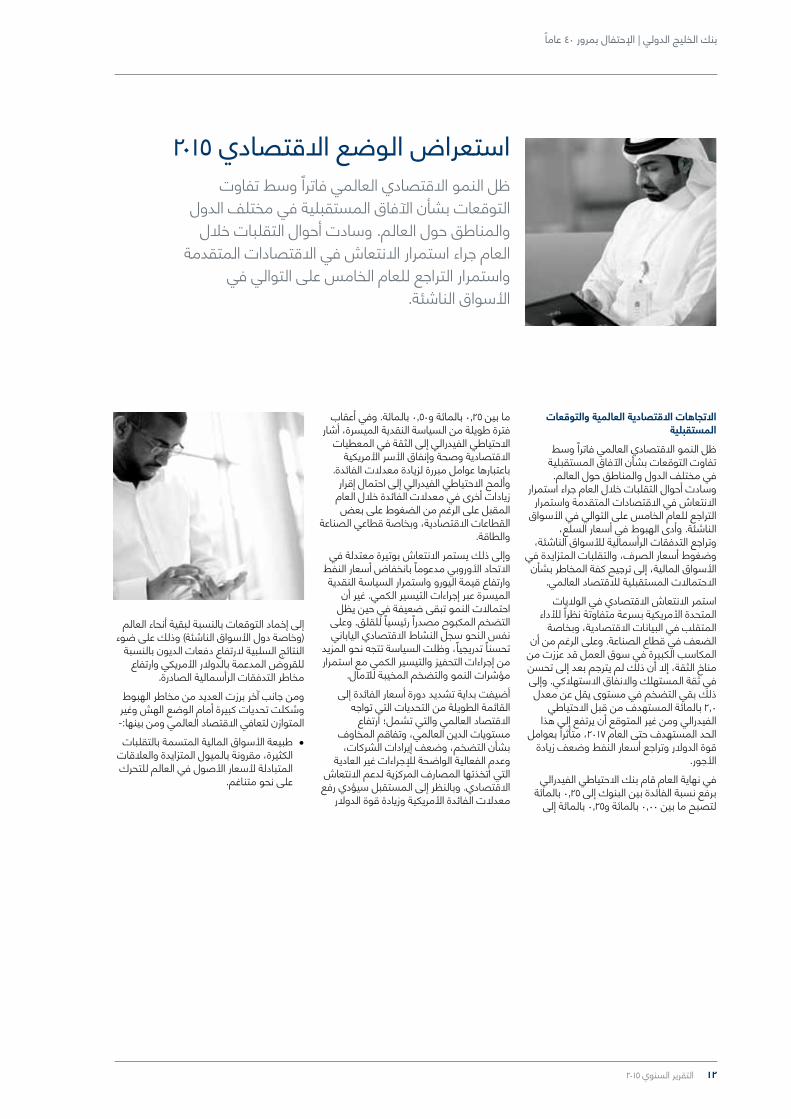
بنك الخليج الدولي | اإلحتفال بمرور 40 عاما
التقرير السنوي 2015 12
االتجاهات االقتصادية العالمية والتوقعات المستقبلية
ظل النمو االقتصادي العالمي فاترا وسط تفاوت التوقعات بشأن اآلفاق المستقبلية في مختلف الدول والمناطق حول العالم.
وسادت أحوال التقلبات خالل العام جراء استمرار االنتعاش في االقتصادات المتقدمة واستمرار
التراجع للعام الخامس على التوالي في األسواق الناشئة. وأدى الهبوط في أسعار السلع،
وتراجع التدفقات الرأسمالية لألسواق الناشئة، وضغوط أسعار الصرف، والتقلبات المتزايدة في األسواق المالية، إلى ترجيح كفة المخاطر بشأن
االحتماالت المستقبلية لالقتصاد العالمي.استمر االنتعاش االقتصادي في الواليات
المتحدة األمريكية بسرعة متفاوتة نظرا لألداء المتقلب في البيانات االقتصادية، وبخاصة
الضعف في قطاع الصناعة. وعلى الرغم من أن المكاسب الكبيرة في سوق العمل قد عززت من مناخ الثقة، إال أن ذلك لم يترجم بعد إلى تحسن في ثقة المستهلك واالنفاق االستهالكي. وإلى ذلك بقي التضخم في مستوى يقل عن معدل
2,0 بالمائة المستهدف من قبل االحتياطي الفيدرالي ومن غير المتوقع أن يرتفع إلى هذا
الحد المستهدف حتى العام 2017، متأثرا بعوامل قوة الدوالر وتراجع أسعار النفط وضعف زيادة
األجور.في نهاية العام قام بنك االحتياطي الفيدرالي
برفع نسبة الفائدة بين البنوك إلى 0,25 بالمائة لتصبح ما بين 0,00 بالمائة و0,25 بالمائة إلى
استعراض الوضع االقتصادي 2015ظل النمو االقتصادي العالمي فاترا وسط تفاوت
التوقعات بشأن اآلفاق المستقبلية في مختلف الدول والمناطق حول العالم. وسادت أحوال التقلبات خالل
العام جراء استمرار االنتعاش في االقتصادات المتقدمة واستمرار التراجع للعام الخامس على التوالي في
األسواق الناشئة.
ما بين 0,25 بالمائة و0,50 بالمائة. وفي أعقاب فترة طويلة من السياسة النقدية الميسرة، أشار
االحتياطي الفيدرالي إلى الثقة في المعطيات االقتصادية وصحة وإنفاق األسر األمريكية
باعتبارها عوامل مبررة لزيادة معدالت الفائدة. وألمح االحتياطي الفيدرالي إلى احتمال إقرار
زيادات أخرى في معدالت الفائدة خالل العام المقبل على الرغم من الضغوط على بعض
القطاعات االقتصادية، وبخاصة قطاعي الصناعة والطاقة.
وإلى ذلك يستمر االنتعاش بوتيرة معتدلة في االتحاد األوروبي مدعوما بانخفاض أسعار النفط وارتفاع قيمة اليورو واستمرار السياسة النقدية
الميسرة عبر إجراءات التيسير الكمي. غير أن احتماالت النمو تبقى ضعيفة في حين يظل
التضخم المكبوح مصدرا رئيسيا للقلق. وعلى نفس النحو سجل النشاط االقتصادي الياباني
تحسنا تدريجيا، وظلت السياسة تتجه نحو المزيد من إجراءات التحفيز والتيسير الكمي مع استمرار
مؤشرات النمو والتضخم المخيبة لآلمال.أضيفت بداية تشديد دورة أسعار الفائدة إلى
القائمة الطويلة من التحديات التي تواجه االقتصاد العالمي والتي تشمل؛ ارتفاع
مستويات الدين العالمي، وتفاقم المخاوف بشأن التضخم، وضعف إيرادات الشركات،
وعدم الفعالية الواضحة لإلجراءات غير العادية التي اتخذتها المصارف المركزية لدعم االنتعاش االقتصادي. وبالنظر إلى المستقبل سيؤدي رفع
معدالت الفائدة األمريكية وزيادة قوة الدوالر
إلى إخماد التوقعات بالنسبة لبقية أنحاء العالم )وخاصة دول األسواق الناشئة( وذلك على ضوء
النتائج السلبية الرتفاع دفعات الديون بالنسبة للقروض المدعمة بالدوالر األمريكي وارتفاع
مخاطر التدفقات الرأسمالية الصادرة.ومن جانب آخر برزت العديد من مخاطر الهبوط وشكلت تحديات كبيرة أمام الوضع الهش وغير المتوازن لتعافي االقتصاد العالمي ومن بينها:-طبيعة األسواق المالية المتسمة بالتقلبات •
الكثيرة، مقرونة بالميول المتزايدة والعالقات المتبادلة ألسعار األصول في العالم للتحرك
على نحو متناغم.

11 التقرير السنوي 2015
الطرق واإلجراءت التشغيلية المتكاملة في مختلف وحدات البنك. وواصلنا أيضا تعزيز
نظم الحوكمة المؤسسية وأطر إدارة المخاطر لضمان مواصلة االمتثال للقواعد الجديدة
ومتطلبات الجهات الرقابية في مختلف الدول التي يمارس بنك الخليج الدولي أعماله فيها.
وباإلضافة إلى ذلك أطلق بنك الخليج الدولي برنامج المسئولية اإلجتماعية الجديد “واجب”
لدعم المجتمعات المحلية في البحرين والمملكة العربية السعودية، وقام بتطبيق استراتيجية
جديدة لإلتصال المؤسسي.تغييرات في القيادة
تم خالل العام 2015 إعادة تعيين أعضاء مجلس اإلدارة لفترة ثالث سنوات جديدة. واستقال معالي الدكتور حمد بن سليمان البازعي من عضوية المجلس وحل محله كنائب لرئيس
المجلس معالي األستاذ سليمان بن عبدالله الحمدان. وأود بهذه المناسبة أن أتقدم، نيابة
عن زمالئي أعضاء مجلس اإلدارة، بالشكر الجزيل إلى الدكتور البازعي على إسهاماته القيمة منذ
العام 1999، وأن أرحب بالدكتور يحيى اليحيى الذي انضم إلى عضوية المجلس. وقد ترك
الدكتور اليحيى منصب الرئيس التنفيذي في نهاية يناير 2016، وحل محله السيد عبدالعزيز
الحليسي، الذي انضم إلى البنك بخبرة عقود من العمل المصرفي من شأنها أن توجه البنك في المرحلة المقبلة من تطوره االستراتيجي. وقد شغل الحليسي مؤخرا منصب وكيل المحافظ للرقابة في مؤسسة النقد العربي السعودي،
وشغل قبلها مناصب قيادية خالل مسيرة عمله التى استمرت على مدى 23 عاما مع العديد من
المؤسسات المصرفية في المملكة العربية السعودية.
لقد كانت الطاقة الهائلة للدكتور اليحيى وتركيزه والتزامه خالل السنوات السبع الماضية محل
تقدير عميق لمجلس اإلدارة، فقد قام بدور محوري في عودة البنك إلى تحقيق الربحية في
2010 بعد عامين من الخسائر، كما أنه قاد إطالق االستراتيجية الجديدة لبنك الخليج الدولي ليصبح
المصرف الرائد في تقديم الخدمات المصرفية الشاملة في دول مجلس التعاون الخليجي.
ويقف النجاح في إعادة هيكلة أنشطة الخدمات المصرفية بالجملة وتعزيز البنية األساسية
المساندة شاهدا على القيادة الملهمة للدكتور اليحيى.
النظرة المستقبليةوفي حين أننا نستعد للدخول في العقد الخامس
من عملياتنا، فإننا ندرك تماما أن العام 2016 سيكون حافال بتحديات كبيرة ويصعب التكهن بمجريات األمور فيه. ومن التحديات الرئيسية
التي تواجه دول الخليج انخفاض أسعار النفط، والتقلبات في األسواق، وانخفاض السيولة،
واإلصالحات المالية، مع استمرار التوترات الجغرافية السياسية في أنحاء المنطقة. غير أن
بنك الخليج الدولي مهيأ تماما لمواجهة كل التحديات المستقبلية، في حين أن لمجلس اإلدارة كل الثقة في استمرار إدارة البنك في تنفيذ استراتيجيتنا الجديدة وتحقيق أهدافنا
الطموحة في مجال األعمال. وكنا قد أرسينا خالل السنوات القليلة الماضية أساسا راسخا
ندعم من خالله أهدافنا االستراتيجية في تنمية وتطوير األعمال في دول مجلس التعاون
الخليجي. وعلى ذلك نبقى متفائلين إزاء احتماالت أداء بنك الخليج الدولي خالل العام
المقبل.
شكر وتقديريسرني نيابة عن مجلس اإلدارة أن أعبر عن
خالص تقديري للثقة والدعم الكبيرين من قبل المساهمين، والثقة والوالء غير المحدودين
من العمالء والتشجيع المستمر والتعاون من األطراف المقابلة، والمشورة والتوجيه
المستمرين من الهيئات التنظيمية والرقابية في مختلف الدول التي يزاول بنك الخليج الدولي
أعماله فيها. كما أود أن أنتهز هذه الفرصة لكي أشيد بوجه خاص بااللتزام الكبير واالحترافية
العالية اللتين تتمتع بهما إدارة وموظفي البنك، وتوجههم اإليجابي نحو تبني عملية التغيير
وتنفيذ االستراتيجية الجديدة للبنك.
جماز بن عبدالله السحيميرئيس مجلس اإلدارة
حظيت إنجازاتنا في مجال األعمال بتقدير إضافي من مطبوعات عالمية متخصصة في مجال التمويل، حيث حصد البنك على جوائز
“أفضل بنك في ترتيب طرح األسهم لالكتتاب في الشرق األوسط” و“أفضل بنك استثماري في البحرين و“البنك األكثر أمانا في
البحرين” من مجلة “جلوبال فاينانس”.

بنك الخليج الدولي | اإلحتفال بمرور 40 عاما
التقرير السنوي 2015 10
التمويل؛ وتحسين قيمة حقوق المساهمين. تكمل كل واحدة من هذه األولويات وتعزز
بمبادرات استراتيجية في إطار عملياتنا. ويتم تنفيذ استراتيجية البنك من خالل خمسة دعائم
تغطي مجاالت الخدمات المصرفية بالجملة، وعمليات الخزينة، والخدمات المصرفية
لألفراد، وإدارة األصول، والخدمات المصرفية االستثمارية. في حين يواصل بنك الخليج الدولي
تنمية هذه األعمال في كل األسواق الرئيسية في دول مجلس التعاون الخليجي.
تشمل أبرز اإلنجازات االستراتيجية خالل عام 2015 إطالق بنك الخدمات المصرفية لألفراد
القائمة على التقنية الحديثة في المملكة العربية السعودية تحت العالمة التجارية “م” والذي
يمثل بداية حقبة جديدة من التطور االستراتيجي في البنك. واإلضافة إلى ذلك دشن البنك فرع
الخدمات المصرفية بالجملة في أبوظبي، والذي من شأنه أن يدعم المسعى الطموح لبنك
الخليج الدولي ألن يصبح المصرف الرائد في تقديم الخدمات المصرفية الشاملة في دول
مجلس التعاون الخليجي بما يتمتع به من خبرات إقليمية راسخة. ولقد افتتح بنك الخليج الدولي
مكتبه التمثيلي في أبوظبي عام 1990، ومنذ ذلك الحين ساهمت إمارة أبوظبي بدور محوري
في مسيرة نمو البنك وتطوره المتواصل. كذلك تتعزز عملياتنا في دولة اإلمارات العربية المتحدة بالمكتب التمثيلي لبنك الخليج الدولي في دبي
والذي افتتح في عام 2014.
أداء األعمالواصلت انجازاتنا القوية في مجال األعمال خالل
عام 2015 دعم تطبيق استراتيجية البنك حيث ن تطوير العالقات مع الشركات الكبيرة مكوالمتوسطة في مجال الخدمات المصرفية للشركات وخدمات الخزينة في بنك الخليج الدولي من تنمية محفظة القروض؛ وزيادة اإليرادات الغير المرتبطة باألصول المتعلقة
بالعمالء؛ وزيادة الدخل من الرسوم والعموالت من خالل تحسين عمليات البيع المتقاطع؛
وتعزيز محفظة التمويل عن طريق استقطاب الودائع من عمالء جدد. وباإلضافة إلى ذلك شهدت أعمال البنك المتوافقة مع الشريعة عاما آخرا من األداء النشط، حيث أبرمت “جي
آي بي كابيتال” عدد من الصفقات الكبيرة في مجال االستثمارات المصرفية مع التركيز بصفة
خاصة على أسواق الدين الرأسمالية واستشارات الديون. وإلى ذلك حققت أعمال البنك في
إدارة األصول التي يتوالها بنك الخليج الدولي )المملكة المتحدة( المحدود أيضا أداءا جيدا حيث
شكلت أعمال الدخل الثابت المحرك لتحسين أداء الدخل. وبعد الحصول على تسجيل لجنة األوراق المالية والبورصات، حصل البنك على تفويض
إلدارة أدوات للدخل الثابت بقيمة 100 مليون دوالر من واحد من أفضل عشرة صناديق تقاعد
في الواليات المتحدة األمريكية.
القدرة المؤسسيةقمنا خالل العام 2015 بالتركيز مجددا على تعزيز
القدرة المؤسسية للبنك، بغية دعم جهود تنفيذ استراتيجيتنا ومواصلة تنمية األعمال. ويشمل ذلك التنظيم اإلستراتيجي للموارد
البشرية والمنتجات وطرق األعمال واألنظمة في مختلف وحدات البنك. وتشمل المبادرات
الرئيسية تطوير وتجربة برامج جديدة شاملة لتطوير الموارد البشرية؛ والتطبيق الكامل
للمنظومة المصرفية األساسية الجديدة مع تطبيق األنظمة الجديدة للخدمات المصرفية
بالجملة وخدمات الخزينة وإعادة هيكلة وتصميم
تقرير رئيس مجلس اإلدارة تتمة

9 التقرير السنوي 2015
ولقد طرأ تعزيز اضافي لهيكل تمويل البنك خالل 2015، حيث ارتفعت ودائع العمالء بمقدار 1,8 مليار دوالر أو ما يعادل 13,8 بالمائة. ونتيجة لذلك أصبحت ودائع العمالء تشكل نسبة 88,1
بالمائة من إجمالي الودائع. وارتفعت قيمة األوراق المالية المباعة بموجب اتفاقيات إعادة
الشراء بمقدار 1,5 مليار دوالر لتصل إلى 2,1 مليار دوالر. وتعكس الزيادة في اتفاقيات إعادة
الشراء مبادرة إستراتيجية ترمي لتمويل الجزء األكبر من محفظة االستثمار في األوراق المالية
عن طريق اتفاقيات إعادة الشراء بغية تقليل التكاليف المتعلقة بالتمويل. وإلى ذلك يعزى
انخفاض بمقدار 1,0 مليار دوالر في التمويالت التي لها أولوية السداد إلى حلول موعد استحقاق
إصدار من السندات مقوم بالريال السعودي في الربع الثاني من العام، في حين يعكس
انخفاض بمقدار 0,3 مليار دوالر في التمويالت
الثانوية عملية سداد إلصدار من سندات الدين المستحقة في سبتمبر 2015. ويوضح الوضع
التمويلي الممتاز لبنك الخليج الدولي مدى الثقة التي يتمتع بها البنك لدى العمالء واألطراف األخرى بفضل قوة مساهميه ومتانة وضعه
المالي. وفي نهاية العام 2015 بلغت نسبة كل من المالءة المالية الكلية وفقا لمتطلبات اتفاقية بازل الثالثة ونسبة مالءة الفئة األولى من رأس المال مستوى عالي بلغ 17,8 بالمائة
و16,8 بالمائة على التوالي. تصنيف وضع البنك في المجال المصرفي
وخالل 2015 أعربت وكاالت التصنيف االئتماني العالمية عن ثقتها في متانة الوضع المالي
لبنك الخليج الدولي. فقد ثبتت وكالة موديز إنفسترز سيرفيس “موديز” التصنيف االئتماني لبنك الخليج الدولي فيما يتعلق بالدين الممتاز
والودائع بالعمالت األجنبية على المستوى “A3”، عدلت الوكالة تقدير النظرة المستقبلية
لتصنيف ودائع البنك من درجة “سلبي” إلى “مستقر”. وأوضحت الوكالة أن تثبيت التصنيف
وتعديل النظرة المستقبلية “يعكس قوة رأس المال وغطاء مخاطر السيولة، والتحسن في
مقاييس جودة األصول، وخفض مستوى تركيزات قاعدة أصول البنك”. ونحن نرى في تثبيت التصنيف االئتماني للبنك تأكيدا على
التحسن في جودة األصول ومتانة رأسمال البنك، كما أننا على ثقة بأن التحسن في متانة
وضع البنك سيستمر في المستقبل مع التوسع الجغرافي على المستويين اإلقليمي والدولي
وسعيه إليجاد مصادر مستقرة للتمويل وتنويع موارد العائد على المساهمين.
وإلى جانب ذلك حظيت إنجازاتنا في مجال األعمال بتقدير إضافي من مطبوعات عالمية
متخصصة في مجال التمويل، حيث حصد البنك على جوائز “أفضل بنك في ترتيب طرح األسهم
لالكتتاب في الشرق األوسط” و“أفضل بنك استثماري في البحرين و“البنك األكثر أمانا في
البحرين” من مجلة “جلوبال فاينانس”. كما حصد البنك جائزة “أسرع بنك إدارة أصول نموا في
المملكة العربية السعودية” من مجلة “جلوبال بانكنج آند فاينانس ريفيو”. وحصل أيضا على
جائزة “أفضل مدير لألصول خالل العام في البحرين” من مجلة جلوبال انفستور”. كذلك
فاز البنك بجوائز “أفضل اكتتاب عام أولي في الشرق األوسط” و“أفضل سندات سيادية” و“أفضل صفقة دمج واستحواذ” من مجلة “إيميا فاينانس” وجائزة “صفقة العام” من
مجلة “ذا بانكر”. وإلى جانب ذلك حصل صندوق فرص االستثمار في األسواق الناشئة على جائزة
“اختصاصي ائتمان” من مجلة “ألت كريديت انتلجنس”.
التقدم االستراتيجييسعدني أن أخبركم أننا حققنا تقدما ممتازا
خالل العام في تنفيذ استراتيجيتنا، حيث واصلنا المسيرة في تحقيق رؤيتنا التي تمت صياغتها في 2010 لتحويل بنك الخليج الدولي إلى بنك
شامل رائد بمنطقة دول مجلس التعاون الخليجي إلى جانب اإلستراتيجية الرامية إلى
التمكين من تحقيق هذه الرؤية. وقد سبق لنا أن قمنا بتحديد ثالث أولويات مترابطة ومتساوية
في األهمية لمساعدتنا على تطبيق االستراتيجية وهي:- تنمية األعمال؛ تنمية وتنويع قاعدة

بنك الخليج الدولي | اإلحتفال بمرور 40 عاما
التقرير السنوي 2015 8
تقرير رئيس مجلس اإلدارة
معالي جماز بن عبدالله السحيميرئيس مجلس اإلدارة
يسرني نيابة عن مجلس اإلدارة، أن أقدم التقرير السنوي لبنك الخليج الدولي عن السنة المالية المنتهية في 31 ديسمبر 2015.
وعلى الرغم من التحديات العديدة التي واجهناها خالل هذه الفترة ومن بينها االنخفاض الحاد في أسعار النفط والتقلبات الشديدة في األسواق، فقد نجح بنك الخليج الدولي في تحقيق أداء عام قوي متمثال في نتائج األداء المالي وإدارة األعمال والعمليات واإلنجازات والتقدم الكبير المحرز في تنفيذ استراتيجية البنك.
األداء الماليسجل بنك الخليج الدولي عاما آخر من األداء
المالي القوي خالل عام 2015، فقد بلغ صافي الدخل بعد استقطاع الضرائب 90,4 مليون دوالر
مقابل 85,6 مليون دوالر خالل العام الماضي، ممثال زيادة سنوية تبلغ 5,6 بالمائة. بلغ إجمالي الدخل 308,0 مليون دوالر، بزيادة مقدارها 50,4
مليون دوالر أو ما يعادل 19,6 بالمائة مقارنة بالعام 2014، مع زيادة في جميع فئات الدخل.
وتعكس الزيادة في كل فئات الدخل األساسية إزدياد النجاح في تنفيذ استراتيجية البنك الجديدة
الهادفة إلى تعزيز بنك الخليج الدولي كبنك رائد في تقديم الخدمات المصرفية الشاملة
التي تركز على العمالء. وجاءت الزيادة في إجمالي الدخل بمقدار فاق الزيادة في إجمالي
المصروفات التي بلغت 27,2 مليون دوالر والمرتبطة بتطوير خدمات بنك الخليج الدولي
الجديدة المبتكرة لألفراد، ولقد نتج عن ذلك ارتفاع صافي الدخل قبل احتساب المخصصات واستقطاع الضرائب إلى 23,2 مليون دوالر أو ما
يعادل 25,0 بالمائة.بلغ صافي دخل الفوائد 188,2 مليون دوالر خالل 2015، بارتفاع قدره 30,2 مليون دوالر أو ما يعادل
19,1 بالمائة مقارنة بالعام الماضي. وتعكس هذه الزيادة أساسا في حجم القروض استمرار
البنك بنجاح في إعادة توجيه أنشطته االقراضية وذلك بالتركيز على تعزيز عالقاته مع الشركات
الكبيرة والمتوسطة عوضا عن صفقات تمويل المشاريع والتمويل المهيكل طويل األجل. وبلغ
الدخل من الرسوم والعموالت 70,2 مليون دوالر بزيادة 7,3 مليون دوالر أو ما يعادل 11,6
بالمائة قياسا على مستواه في العام 2014، حيث
تضمن 22,8 بالمائة من إجمالي الدخل. وتعزى هذه الزيادة إلى استمرار نجاح التوجه اإلستراتيجي
لبنك الخليج الدولي بالتركيز على المنتجات والخدمات المالية المقدمة للعمالء وتعزيز
الدخل من الرسوم.وبلغ الدخل من النقد االجنبي 19,8 مليون
دوالر بزيادة 0,4 مليون دوالر أو ما يعادل 2,1 بالمائة مقارنة بالعام 2014. وشكل الدخل من
النقد االجنبي أغلبية االيرادات من األنشطة الموجهة للعمالء، وبشكل خاص االيرادات
من المنتجات المهيكلة التي صممت لتساعد العمالء في التحوط من المخاطر الناتجة من
تقلبات األسواق. وبلغت قيمة ايرادات المتاجرة 6,2 مليون دوالر بزيادة بمقدار 3,8 مليون دوالر عن مستواها في العام السابق. ويتكون العائد من عمليات المتاجرة بصورة رئيسية من أرباح
االستثمار في الصناديق التي يديرها بنك الخليج الدولي )المملكة المتحدة( المحدود، وهو شركة
تابعة لبنك الخليج الدولي مقرها في لندن، وكذلك من الدخل من مشتقات أسعار الفائدة
المتعلقة بالعمالء. كذلك بلغت االيرادات األخرى 23,6 مليون دوالر مقارنة بـمقدار 8,7 مليون
دوالر أو ما يعادل 58,4 بالمائة في العام 2014. أما باقي االيرادات األخرى خالل الفترة، فتكونت بشكل كبير من أرباح االستثمارات في األسهم
واسترداد األصول. بلغ إجمالي المصروفات خالل العام 192,1
مليون دوالر بزيادة مقدارها 27,2 مليون دوالر أو ما يعادل 16,5 بالمائة مقارنة بالعام 2014. وتعزى هذه الزيادة إلى استمرار بنك الخليج الدولي في االستثمار في تطوير خدماته المصرفية الجديدة
لألفراد وفي المنظومة المصرفية األساسية الجديدة وأنظمة الخزينة التي تم تطبيقها في
منتصف 2015. وتم رصد مخصصات للقروض بلغت قيمتها 21,3 مليون دوالر مقارنة مع 10,3
مليون دوالر خالل العام السابق.وبلغ إجمالي قيمة األصول الموحدة في نهاية
عام 2015 نحو 24,2 مليار دوالر محققة زيادة مقدارها 2,9 مليار دوالر أو ما يعادل 13,6 بالمائة
قياسا على مستواها في نهاية العام السابق. وتعكس محفظة األصول مستوى عال من السيولة، في حين بلغ حجم النقد واألصول
السائلة األخرى والودائع القصيرة األجل 10,5 مليار دوالر تمثل ارتفاعا استثنائيا يعادل 43,6 بالمائة في إجمالي قيمة األصول. وبلغ حجم
األوراق المالية االستثمارية، وهي تتألف أساسا من سندات دين عالية التصنيف والسيولة
صادرة عن مؤسسات مالية عالمية ومؤسسات اقليمية شبه حكومية، 3,9 مليار دوالر. أما حجم القروض والسلف فبلغ 9,2 مليار دوالر محققا
ارتفاعا قدره 1,2 مليار دوالر أو ما يعادل 15,5 بالمائة عن مستواه في نهاية عام 2014، في انعكاس لمتانة العالقات االئتمانية الجديدة
مع الشركات الكبيرة والمتوسطة. وبلغ إجمالي حقوق المساهمين 2,43 مليار دوالر في نهاية
2015 مقارنة مع 2,35 مليار دوالر في نهاية العام السابق، في حين بلغ معدل العائد على حقوق المساهمين 3,8 بالمائة للعام 2015 مقابل 3,7
بالمائة في العام 2014. وقد انخفض معدل العائد على حقوق المساهمين نظرا للتغيير الحاصل على نمط عمل البنك والمتوقع أن يستمر على المدى القصير، غير أننا نتصور
تحسن معدل العائد بدرجة كبيرة بعد أن يصل البنك الجديد للخدمات المصرفية لالفراد إلى
نقطة التعادل المخطط لها خالل السنوات الثالث أو األربع المقبلة.

7 التقرير السنوي 2015
201520142013201220112010
إيرادات )مليون دوالر أمريكي(104.5100.4 117.9 121.5 85.6 90.4 صافي الدخل بعد الضرائب
143.8156.2 149.4 163.1 158.0 188.2 صافي إيرادات الفوائد48.542.2 56.7 62.962.0 70.2 إيرادات الرسوم والعموالت
119.8113.3 136.1 151.6 164.9 192.1 المصاريف التشغيلية
المركز المالي )مليون دوالر أمريكي(16788.915527.7 17704.8 21300.221156.9 24192.4مجموع األصول
6751.87510.1 8317.27110.3 7931.5 9161.4 القروض3151.73067.8 3560.1 3725.8 3944.5 3884.5 أوراق استثمارية
3690.33176.6 2432.7 2332.9 3372.9 2420.0التمويل األولي ألجل1962.81918.0 2130.2 2264.0 2350.7 2431.0 حقوق الملكية
نسبة )%(الربحية
5.45.4 5.8 5.5 3.7 3.8 العائد على متوسط حقوق المساهمين0.60.6 0.7 0.6 0.4 0.4 العائد على متوسط األصول
رأس المالنسبة مخاطر األصول )بازل 3(
– المجموع 17.7 19.618.920.1 23.324.3– الفئة األولى 16.8 18.116.917.4 19.218.7
11.712.4 12.0 10.7 11.0 10.0 نسبة حقوق الملكية من مجموع األصول
جودة األصول19.320.3 20.7 17.9 18.9 16.4 نسبة االستثمارات من مجموع األصول
40.248.4 40.2 37.239.3 37.9 نسبة القروض من مجموع األصول
السيولة58.250.0 57.9 58.8 60.9 60.0 نسبة سيولة األصول
2.01.6 2.22.12.0 2.1 تغطية الودائع للقروض )عدد المرات(1
1 الودائع تشمل التمويل األولي ألجل
المؤشرات المالية
تصنيف اإلئتمان
تصنيف موديزفتش
كابيتال إنتليجنس
+A Baa1 A تصنيف ودائع طويلة األجل
-AA3تصنيف ديون عليا غير مضمونة طويلة األجل
F1 P-2 A1تصنيف ودائع قصيرة األجل
- - -bbb االستمرارية
+BBB - - القوة المالية
مستقر تحت المراجعة مستقر النظرة المستقبلية

بنك الخليج الدولي | اإلحتفال بمرور 40 عاما
التقرير السنوي 2015 6
معالي جماز بن عبدالله السحيمي رئيس مجلس اإلدارة
المملكة العربية السعودية
معالي األستاذ سليمان بن عبدالله الحمداننائب رئيس مجلس اإلدارة
رئيس الهيئة العامة للطيران المدنيالمملكة العربية السعودية
البروفيسور عبدالله بن حسن العبدالقادرمستشار مستقل
المملكة العربية السعودية
األستاذ عبدالله بن محمد الزاملالرئيس التنفيذي
شركة الزامل لالستثمار الصناعيالمملكة العربية السعودية
األستاذ المهندس خالد بن صالح المديفرالرئيس التنفيذي وكبير المدراء التنفيذيينشركة التعدين العربية السعودية )معادن(
المملكة العربية السعودية
األستاذ عمر هدير الفارسيعضو إداري
شركة ديالى لالستشاراتالواليات المتحدة األمريكية
الدكتور يحيى عبدالله اليحيى رئيس مجلس اإلدارة، بنك الخليج الدولي
)المملكة المتحدة( المحدودالمملكة العربية السعودية
أعضاء مجلس اإلدارة

5 التقرير السنوي 2015
رؤيتنايهدف بنك الخليج الدولي إلى أن يكون المصرف الخليجي الذي
يتميز بخبرته اإلقليمية وعالقاته الممتدة عالميا ومنتجاته وخدماته المبتكرة، وذلك إلضافة القيمة للخدمات التي يقدمها لشركاء
أعماله عبر استخدام أحدث التقنيات وأفضل الموارد البشرية.

بنك الخليج الدولي | اإلحتفال بمرور 40 عاما
التقرير السنوي 2015 4
بنك الخليج الدولييعتبر بنك الخليج الدولي بنك رائد للخدمات المصرفية الشاملة في دول مجلس التعاون الخليجي
يتخصص في تقديم الخدمات المصرفية للشركات والخدمات المصرفية االستثمارية ولديه وجود متنام في مجال الخدمات المصرفية لألفراد.
ويوفر بنك الخليج الدولي، الذي تأسس في 1975، حلوال مبتكرة تركز على العمالء وتشمل الخدمات المصرفية بالجملة، وعمليات الخزينة، والخدمات المصرفية االستثمارية، وإدارة األصول، ومنتجات
سوق المال والخدمات المصرفية المتوافقة مع الشريعة. وفي يناير 2015، دشن البنك خدماته المصرفية لألفراد تحت العالمة التجارية “م من بنك الخليج الدولي” المتوافقة مع الشريعة في المملكة
العربية السعودية والتي تقدم مجموعة متكاملة من المنتجات المصرفية المبتكرة وغير التقليدية.
يوظف بنك الخليج الدولي أكثر من 1000 مهني بمكاتبه في أنحاء العالم. ولدى البنك شركتين رئيسيتين تابعتين له؛ بنك الخليج الدولي )المملكة المتحدة( المحدود ومقره بالمملكة المتحدة، وشركة جي آي
بي كابيتال التي يقع مقرها بالمملكة العربية السعودية. كما يوجد لدى البنك فروع في لندن ونيويورك وأبوظبي والظهران والرياض وجدة، إلى جانب مكاتب تمثيلية في دبي وبيروت.
يقع المقر الرئيسي لبنك الخليج الدولي في مملكة البحرين، وهو مرخص كبنك جملة تقليدي من قبل مصرف البحرين المركزي. وهو مملوك من قبل دول مجلس التعاون الخليجي الست، وتعود ملكية
غالبية أسهمه إلى صندوق االستثمارات العامة في المملكة العربية السعودية )97,2 بالمائة(.

3 التقرير السنوي 2015
المحتويات
6 أعضاء مجلس اإلدارة 7 المؤشرات المالية 8 تقرير رئيس مجلس اإلدارة 12 استعراض الوضع االقتصادي 16 تقرير اإلدارة 22 نظرة عامة على المسؤولية اإلجتماعية للشركة 24 استعراض الوضع المالي 34 تقرير حوكمة الشركات 48 نبذة عن أعضاء مجلس اإلدارة 50 نبذة عن أعضاء اإلدارة العليا 52 الهيكل التنظيمي وحوكمة الشركات 53 دليل الشركات

بنك الخليج الدولي | اإلحتفال بمرور 40 عاما

الخــــــبرة، القــــــوة، التطــــــور
بنك الخليـج الدولي
التقــــرير السنــــوي 2015