experience trends for income protection international congress of actuaries paris, france june 1,...
TRANSCRIPT

Experience Trends for Income Protection
International Congress of Actuaries
Paris, France
June 1, 2006

Experience Trends for Income Protection
Panelists
Daniel SkwireMilliman, Inc. (U.S.A.)[email protected]
Edward FabrizioGeneral Reinsurance Life Australia [email protected]
Denis GarandDenis Garand and Associates (Canada)[email protected]

Experience Trends in the United States
(Individual Disability Insurance)
Daniel D. Skwire, FSA
Principal and Consulting Actuary
Milliman, Inc.

1985 Commissioner’s Individual Disability A Table
(1985 CIDA)
• Most recent published table for individual disability
• Experience from 1970’s and early 1980’s
• Required table for some reserve calculations
• Expected basis for recent intercompany study

Characteristics of 1985 CIDA
• Sex-distinct
• Not smoker-distinct
• Four occupation classes– Class 1: Executive and Professional– Class 2: Clerical and Office– Class 3: Light manual duties– Class 4: Heavy manual duties
• Accident, sickness, and combined causes

Society of ActuariesIndividual Disability Experience Committee (IDEC)
1990-1999 Intercompany Study
• Twelve contributing companies
• About 64% of total inforce premium
• Incidence Study: Claims incurred 1990-1999
• Claim Termination Study: Claims paid 1990-1999
• Results show Actual-to-Expected (A/E) Ratios relative to 1985 CIDA

1990 – 1999 IDEC Study
A/E Claim Incidence Ratios - A&S ContractsExpected = 85 CIDA
40%
50%
60%
70%
80%
90%
100%
110%
120%
1990 1991 1992 1993 1994 1995 1996 1997 1998 1999
Calendar Year
Rat
ios
By Count
By Amount

1990 – 1999 IDEC Study
A/E Claim Incidence Ratios (by Amount) - A&S ContractsExpected = 85 CIDA
40%
50%60%
70%80%
90%100%
110%120%
130%
1990 1991 1992 1993 1994 1995 1996 1997 1998 1999
Calendar Year
Rat
ios
Occ Class 1
Occ Classes 2-4

1990 – 1999 IDEC Study
A/E Claim Incidence Ratios (by Amount)A&S Contracts - Occupation Class 1
Expected = 85 CIDA
40%
60%
80%
100%
120%
140%
160%
1990 1991 1992 1993 1994 1995 1996 1997 1998 1999
Calendar Year
Rat
ios
Medical Occs
Non-medical Occs

Claim Incidence Rates Trends by Elimination Period and Gender
0%
25%
50%
75%
100%
125%
150%
Under 30 30 60 90 180
Elimination Period
Rat
ios
Male
Female
1990 – 1999 IDEC Study

1990 – 1999 IDEC Study
A/E Claim Incidence (by Amount)By Benefit Period - Expected = 85 CIDA
40%
60%
80%
100%
120%
140%
160%
Occ Class 1 Occ Class 2-4
85 CIDA Occupation Class
Ratios Short-term
To Age 65-70
Lifetime

1990 – 1999 IDEC StudyClaim Incidence Rates
Non-Medical Occupations (ranked by exposure)
Occupation A/E Ratio
Executives & Managers 61%
Lawyers 63%
Other Sales 65%
Accountants 62%
Engineers 57%
Insurance Sales 101%
Stockbrokers 142%
Teachers 57%
Other Occupations 64%
Total Non-Medical Occupations 64%

1990 – 1999 IDEC StudyClaim Incidence Rates
Medical Occupations (ranked by exposure)Occupation A/E Ratio
Physicians & Surgeons 87%
Dentists 62%
Psychologists 53%
Nurses 100%
Pharmacists 51%
Chiropractors 139%
Veterinarians 60%
Podiatrists 73%
Other Medical Occupations 80%
Total Medical Occupations 88%

1990 – 1999 IDEC StudyClaim Termination Rates
• 1985 CIDA known to have outdated claim termination rates
• Regulators adopted 1985 CIDC table as temporary measure
• 1985 CIDC consists of adjustments to 1985 CIDA
Age of Claim AdjustmentMonths 1-6 36-44%Months 7-12 50-75%Months 13-18 80-102%Months 19-24 105-120%Year 3 137%Year 4 120%Year 5 120%Year 6+ 100%
• IDEC Study measures experience relative to 1985 CIDA

1990 – 1999 IDEC Study
A/E Claim Termination Ratios (by Amount)By 85 CIDA Occupation Class
Expected = 85 CIDA
0%20%40%60%80%
100%120%140%160%180%
Duration of Disablement
Rat
ios
Occ Cl 1
Occ Cl 2-4

1990 – 1999 IDEC Study
A/E Claim Termination Ratios (by Amount)A&S Contracts - To Age 65-70 and Lifetime BP - Occ Class 1
Medical vs. Non-medical Occupations
0%
20%
40%
60%
80%
100%
120%
140%
Yr 1 Yr 2 Yr 3 Yr 4-5 Yr 6-10 Yr 11+
Duration of Disablement
Rat
ios
Medical Occs
Non-med Occs

1990 – 1999 IDEC Study
A/E Claim Termination Rates (by Amount)A&S Contracts By Benefit Period
Expected = 85 CIDA
0%20%40%60%80%
100%120%140%160%180%200%
Yr 1 Yr 2 Yr 3 Yr 4-5 Yr 6-10 Yr 11+
Duration of Disablement
Rat
ios
Short-term
To Age 65-70
Lifetime
1990-1999 IDEC StudyKey Conclusions
• Medical occupations have distinct experience from Class 1
• Lifetime benefit periods have poor experience
• Incidence trends are favorable in aggregate, with lots of variation
• Claim termination rates are generally lower (less favorable) than those in 1985 CIDA

Australia & NZ
Disability Income Experience
Edward Fabrizio
Deputy General Manager and Chief Actuary
General Reinsurance Life Australia Ltd

Australian & NZ Market
• Benefit is a monthly annuity style benefit whilst person remains disabled
• Benefit based on income at time of underwriting (generally to max of 75% replacement) and is taxable
• Majority (90%) is annual renewal business (age rated based on age at renewal)
• Non-guaranteed rates
• Full offset if person earns income whilst disabled
• Agreed Value and Indemnity benefits are available

Australian & NZ Market
• Most common deferment periods are 30 and 90 day
• Benefit period is generally to Age 65, but 2 and 5 year periods also common for blue collar workers
• Many extras added :
– Hospital benefit (pays benefit whilst in hospital during deferment period)
– Rehabilitation benefits
– Payment of minimum benefit period on certain accidents / illnesses
IAD 89-93 Standard Table
• Experience Reports for Australia and New Zealand are done on basis of comparing actual results to a standard table – IAD89-93
• IAD89-93 developed by the IAAust based on the Australian disability income experience for this period
• Incidence rates graduated by age/sex and 4 occupation classes
• Termination rates based on % of the US CIDA85 termination rate tables

IAD 89-93 Standard Table
• 4 Occupation classes
– A : Professional and white collar
– B : Other sedentary (light manual technical)
– C : Light Manual (qualified trades persons)
– D : Moderate to Heavy Manual
Australian Experience
• WARNING
Experience results presented for Australia are preliminary only at this stage and are still going through a checking process which may alter the final results

Australia – Latest Experience
Experience – TrendsClaim cost in first 3 years of claim : 1 mth deferment
100
110
120
130
140
150
160
89-93 91-94 92-95 93-96 95-98 98-01
MaleFemale
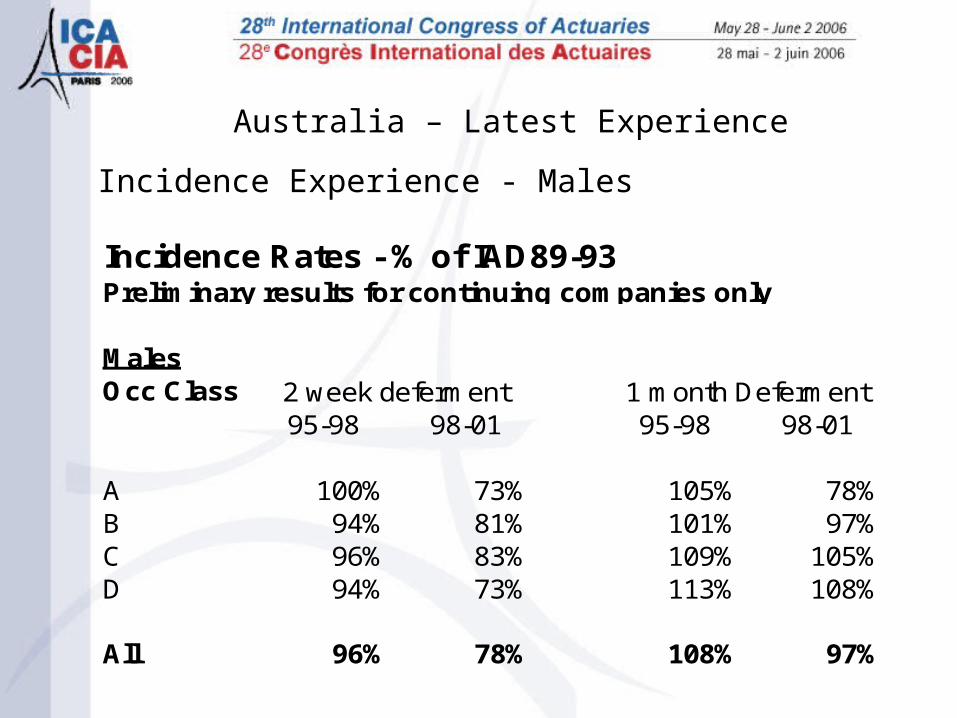
Australia – Latest Experience
Incidence Rates - % of IAD89-93Preliminary results for continuing companies only
MalesOcc Class
95-98 98-01 95-98 98-01
A 100% 73% 105% 78%B 94% 81% 101% 97%C 96% 83% 109% 105%D 94% 73% 113% 108%
All 96% 78% 108% 97%
2 week deferment 1 month Deferment
Incidence Experience - Males

Australia – Latest Experience
Incidence Experience - Females
Incidence Rates - % of IAD89-93Preliminary results for continuing companies only
FemalesOcc Class
95-98 98-01 95-98 98-01
A 96% 72% 97% 73%B 101% 96% 97% 79%C 93% 83% 93% 78%D 90% 73% 84% 53%
All 95% 74% 96% 74%
2 week deferment 1 month Deferment
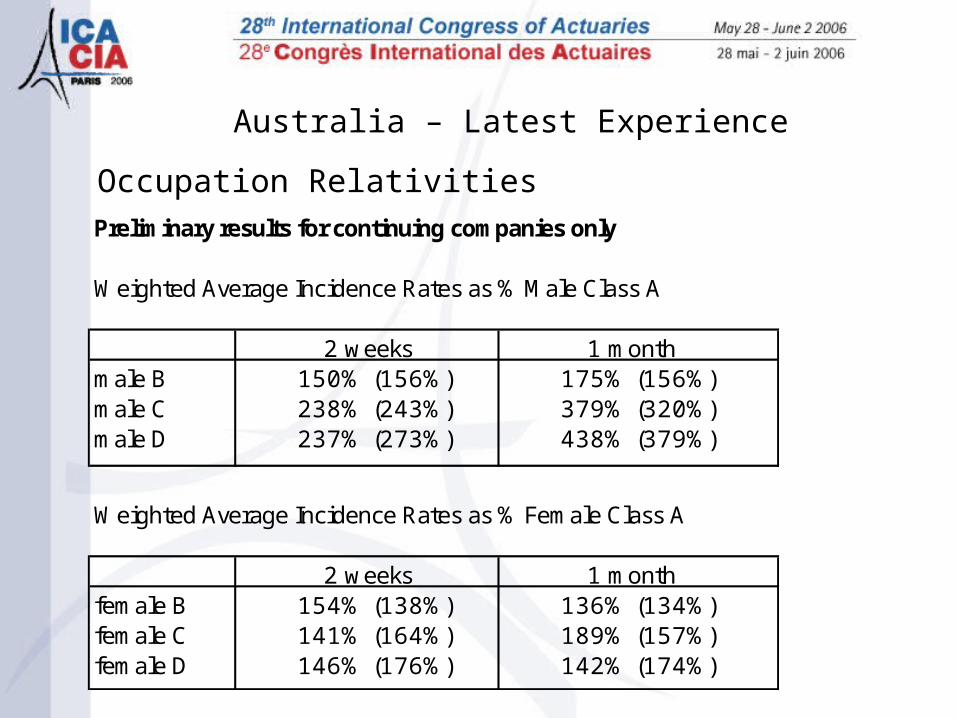
Australia – Latest Experience
Occupation RelativitiesPreliminary results for continuing companies only
Weighted Average Incidence Rates as % Male Class A
male B 150% (156%) 175% (156%)male C 238% (243%) 379% (320%)male D 237% (273%) 438% (379%)
Weighted Average Incidence Rates as % Female Class A
female B 154% (138%) 136% (134%)female C 141% (164%) 189% (157%)female D 146% (176%) 142% (174%)
2 weeks 1 month
2 weeks 1 month

Australia – Latest Experience
Amount vs Number of Claims
Preliminary results for continuing companies only
Ratio of A/E amounts versus A/E number for Incidence of Claim
Occ Class MALE FEMALE
A 108% 108%
B 104% 104%
C 109% 112%
D 113% 117%

Australia – Latest Experience
Termination Rates
Preliminary results for continuing companies only
Ratio of A/E Number of Terminations
Occ Class MALE FEMALE
95-98 98-01 95-98 98-01
A 81% 81% 77% 80%
B 73% 77% 72% 74%
C 84% 88% 77% 77%
D 88% 84% 72% 64%

Australia – Latest Experience
Termination Rates – Male: Occ A: 1 mth deferment
0
100
200
300
400
500
600
700
800
900
1000
4 wks
5 wks
6 wks
7 wks
8 wks
9 wks
10 w
ks
11 w
ks
12 w
ks
3 m
ths
4 m
ths
5 m
ths
6 m
ths
7 m
ths
8 m
ths
9 m
ths
10 m
ths
11 m
ths
12 m
ths
13 m
ths
14 m
ths
15 m
ths
16 m
ths
17 m
ths
18 m
ths
19 m
ths
20 m
ths
21 m
ths
22 m
ths
23 m
ths
24 m
ths
36 m
ths
95-9898-01

Australia – Latest Experience
Termination Rates – Female: Occ A: 1 mth deferment
0
100
200
300
400
500
600
700
800
900
1000
4 wks
5 wks
6 wks
7 wks
8 wks
9 wks
10 w
ks
11 w
ks
12 w
ks
3 m
ths
4 m
ths
5 m
ths
6 m
ths
7 m
ths
8 m
ths
9 m
ths
10 m
ths
11 m
ths
12 m
ths
13 m
ths
14 m
ths
15 m
ths
16 m
ths
17 m
ths
18 m
ths
19 m
ths
20 m
ths
21 m
ths
22 m
ths
23 m
ths
24 m
ths
36 m
ths
95-9898-01

Australia – Latest Experience
Termination Rates
95-98 98-01 RatioTermination Rate Male Female Male Female Male Female
Mths 1 to 3 0.491 0.490 0.468 0.475 95% 97%Mths 4 to 6 0.326 0.327 0.318 0.307 97% 94%Mths 7 to 12 0.341 0.315 0.303 0.299 89% 95%Mths 13 to 24 0.372 0.353 0.494 0.549 133% 155%Mths 25 to 36 0.197 0.243 0.313 0.383 158% 157%
Preliminary results for continuing companies only
Actual Termination Rates of Claim by duration of claim

Australia – Latest Experience
Amount vs Number of Terminations
Preliminary results for continuing companies only
Ratio of A/E amounts versus A/E number for Termination Rates of Claim
Occ Class MALE FEMALE
A 96% 98%
B 95% 95%
C 95% 95%
D 93% 97%

Australia – Latest Experience
Variation in Experience by Company
Preliminary results
50%
60%
70%
80%
90%
100%
40% 50% 60% 70% 80% 90% 100% 110% 120%
A/E Incidence
A/E
Ter
min
atio
ns

Summary for Australia
• Experience has improved significantly– Driven by lower incidence experience (although there are
concerns over quality of data used in the investigation)
• Termination rates during first year of claim continue to deteriorate, however, this is being compensated by better termination rates at later durations
• Incidence and termination rates by amounts are worse than by number (total claims cost by amounts about 15% higher than by number), need to be careful in setting pricing and reserving assumptions – especially for reinsurers on a surplus basis

New Zealand – Latest experience
0%
10%
20%
30%
40%
50%
60%
70%
80%
90%
100%
1997 1998 1999 2000 2001 2002
Event Year
Act
ual
vs.
Expec
ted
Male A/ E Female A/ E
Incidence Rate Experience

New Zealand – Latest experience
Termination Rate Experience
0%
20%
40%
60%
80%
100%
120%
1 2 3 4 5 6 7 8 9 101112 1314151617 18192021 222324
Month of disablement
2000- 02 1997- 99
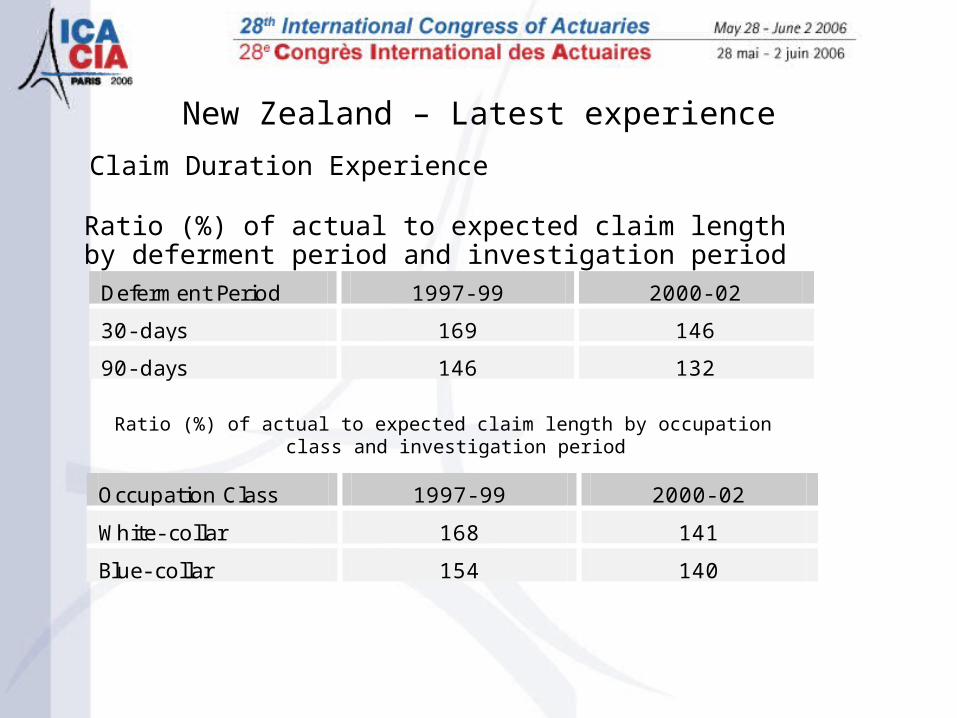
New Zealand – Latest experience
Claim Duration Experience
Deferment Period 1997- 99 2000- 02
30- days 169 146
90- days 146 132
Occupation Class 1997- 99 2000- 02
White- collar 168 141
Blue- collar 154 140
Ratio (%) of actual to expected claim length by deferment period and investigation period
Ratio (%) of actual to expected claim length by occupation class and investigation period

New Zealand – Latest experience
• Important feature of NZ Experience is the interaction with the government accident compensation scheme (ACC)
• ACC provides benefit up to 80% of taxable salary (with maximum dollar cap) in event a person is injured and unable to work
• Covers most forms of accidental injury (work and outside work) and can sometimes overlap with what would normally be considered a sickness

Paid ratio (%) by cause of claim and investigation period
Paid ratio by claim cause and occupation class in 2000-02
Cause of Claim 1997- 99 2000- 02
Accident 52 43
Sickness 79 81
All 72 70
Occupation Class Accident Sickness Total
A 41 83 76
B 43 82 74
C 57 76 71
D 43 80 63
E 44 77 60
New Zealand – Latest experience
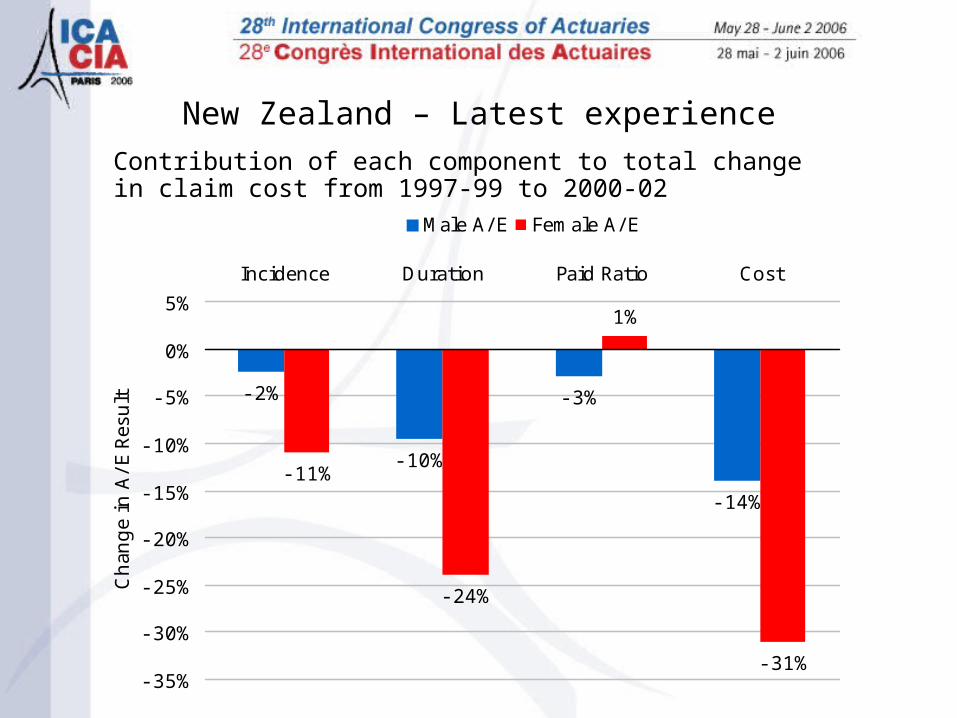
New Zealand – Latest experience
- 2%
- 10%
- 3%
- 14%
- 11%
- 24%
1%
- 31%- 35%
- 30%
- 25%
- 20%
- 15%
- 10%
- 5%
0%
5%
Incidence Duration Paid Ratio Cost
Chan
ge
in A
/E R
esult
Male A/ E Female A/ E
Contribution of each component to total change in claim cost from 1997-99 to 2000-02

New Zealand – Latest experience
0%
20%
40%
60%
80%
100%
120%
140%
160%
Incidence Duration Paid Ratio Cost
Numbers
Amounts
Comparison of ratios (%) of actual to expected results in 2000-02
weighted by numbers and amounts
New Zealand – Latest experience
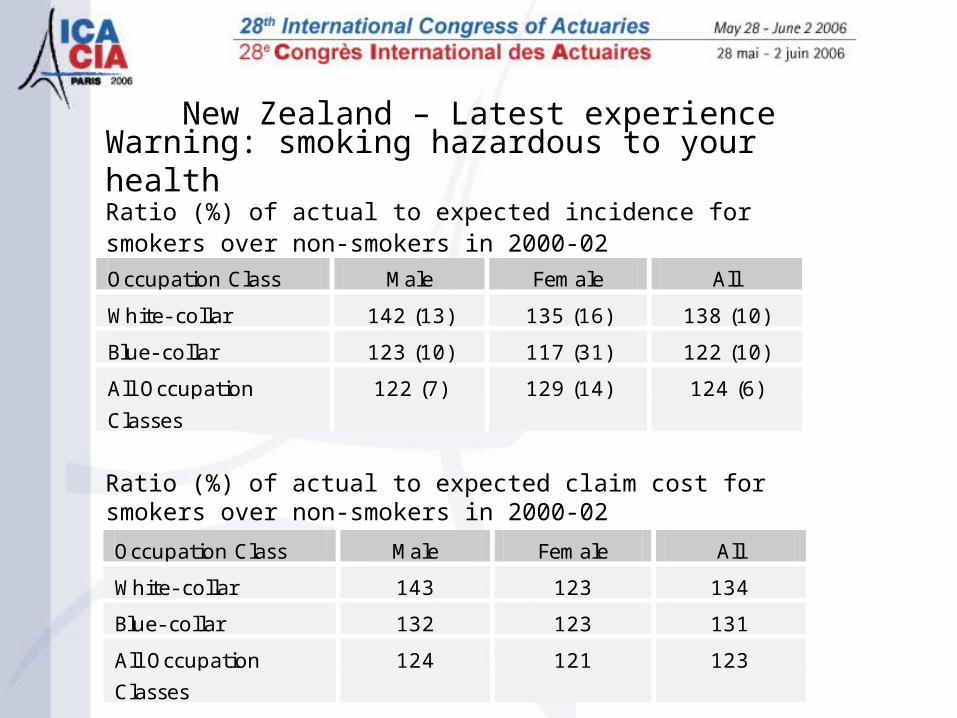
Warning: smoking hazardous to your health
Occupation Class Male Female All
White- collar 142 (13) 135 (16) 138 (10)
Blue- collar 123 (10) 117 (31) 122 (10)
All Occupation
Classes
122 (7) 129 (14) 124 (6)
Ratio (%) of actual to expected incidence for smokers over non-smokers in 2000-02
Ratio (%) of actual to expected claim cost for smokers over non-smokers in 2000-02
Occupation Class Male Female All
White- collar 143 123 134
Blue- collar 132 123 131
All Occupation
Classes
124 121 123

New Zealand – Latest experience
111%95%
106% 113%
0%
20%
40%
60%
80%
100%
120%
Incidence Duration Paid Ratio Cost
Agreed Value benefits versus Indemnity

New Zealand – Latest experience
Self-employed versus Employed
152%
102%80%
126%
0%
20%
40%
60%
80%
100%
120%
140%
160%
Incidence Duration Paid Ratio Cost
New Zealand – Latest experience
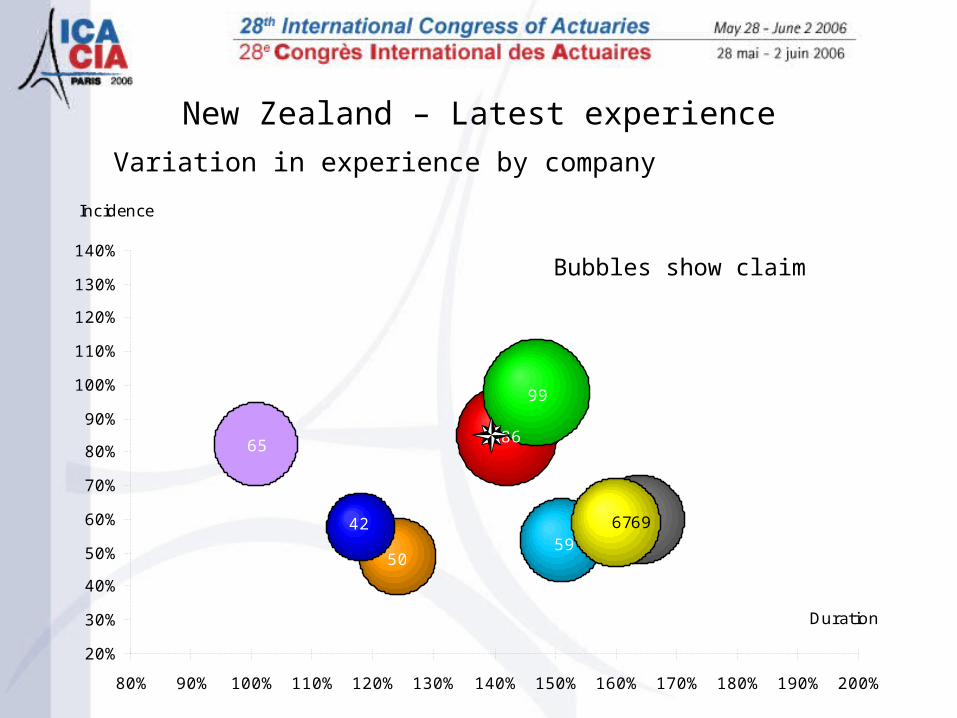
86
50
69
99
5942 67
65
20%
30%
40%
50%
60%
70%
80%
90%
100%
110%
120%
130%
140%
80% 90% 100% 110% 120% 130% 140% 150% 160% 170% 180% 190% 200%
Duration
Incidence
Variation in experience by company
Bubbles show claim cost

Summary for New Zealand
• Experience has improved– Driven by increased termination rates
• Difference between self-employed and employee can be an important rating variable – is just as important as smoker status
• Incidence and termination rates by amounts are worse than by number, need to be careful in setting pricing and reserving assumptions – especially for reinsurers on a surplus basis
• Experience varies greatly by company

Denis Garand
Denis Garand & Associates
Experience Trends in Canada

Fraser Garand 2000-2004 Study
• Proprietary study • Financial and technical support from:
– Munich Re– Optimum Re– RGA Re – SCOR Re– Swiss Re

• 13 companies– Small group market, average size 41 employees– 2,600,000 exposure from 2000 to 2004– 26,000 claims of which 18,000 terminate in first 2
years– one province Quebec, overrepresented
• These companies represent:– 34% of the market, groups less than 1000 employees
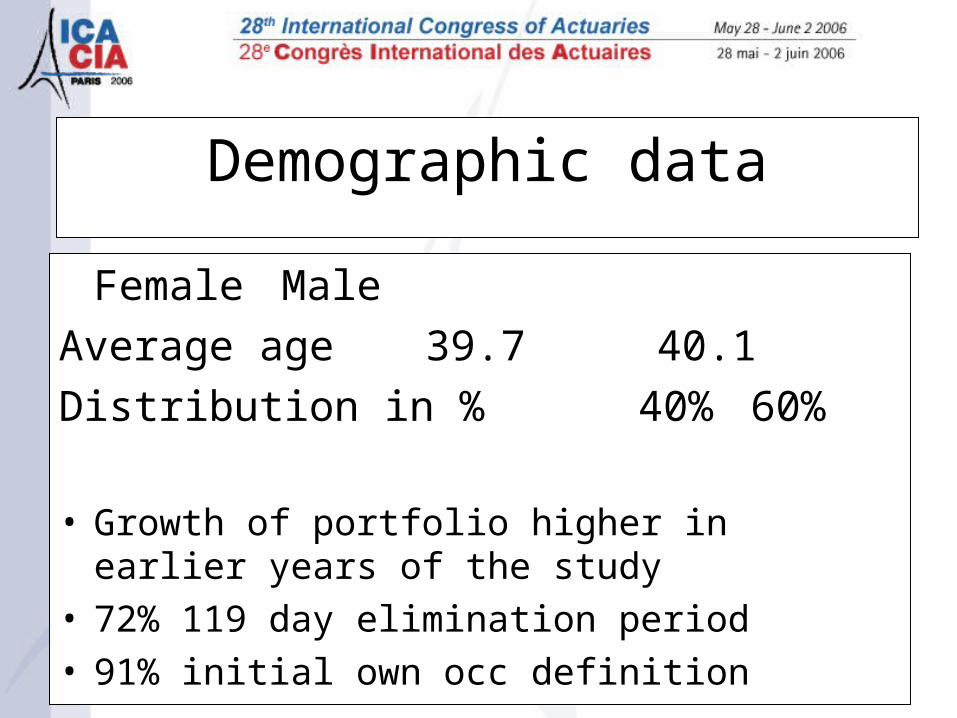
Demographic data
Female Male
Average age 39.7 40.1
Distribution in % 40% 60%
• Growth of portfolio higher in earlier years of the study
• 72% 119 day elimination period• 91% initial own occ definition

Fraser Garand 2000-2004 Table
• 4 month elimination
• Own Occupation
• Benefit to age 65
• Tables by 5 year age band and gender– Quebec,– Canada except Quebec

Incidence per 1000, study population
Canada 8.4
Canada, except Quebec 6.2
Quebec 15.1
SOA GLTD 1987 Basic “4 months” expected
4.6

Variation Actual /Expected (F-G)
• By age (compare to SOA 87)– Younger female higher incidence– Older males lower incidence
• By amount insured– Lower benefits higher incidence – Higher benefits lower incidence
• By industry (50% to 150%)

Variation Actual /Expected (F-G)
• By region– Some provinces better (no control on industry)
• By cause of disability– Variations by Mental and Nervous,
Musculoskeletal and all other causes
• By year of disability– 2000 highest, 2003 best
• By participating company (~70% to 125%)

Termination study
• 18,000 terminations within the first 24 months of duration.
• Produced termination rates for duration 4-12 months. – 159% versus SOA87 Basic 3 month
• Analysis of claims duration to 24 months by three major causes of disability.– Substantial variation in termination rates.

Caveats
• Study not adjusted for industry.
• Short period of study was in a favourable economic cycle.
• Termination study requires more data
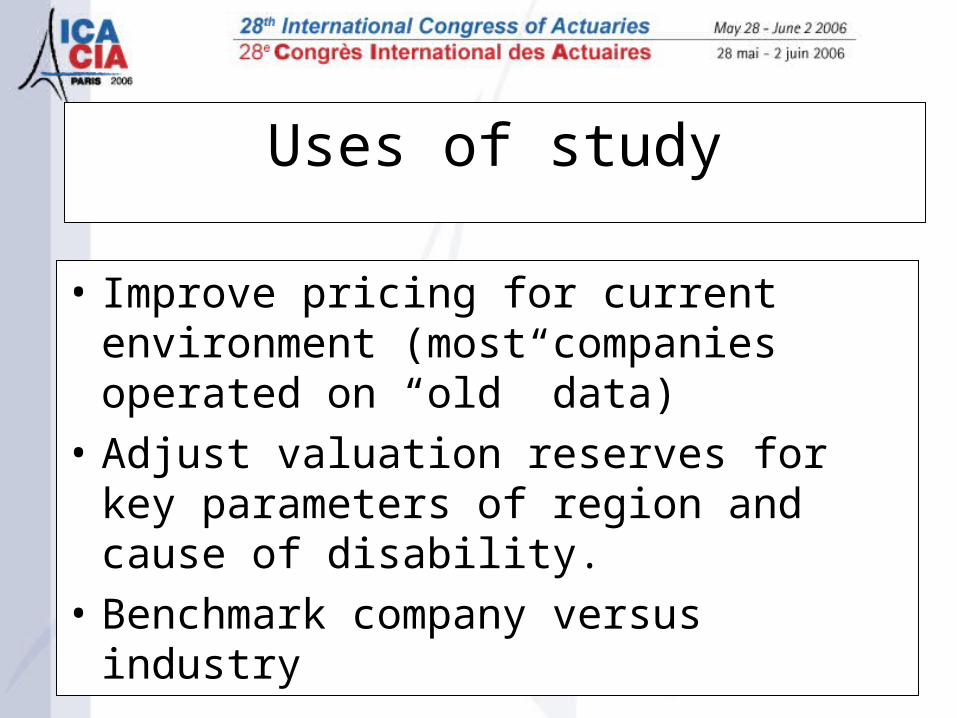
Uses of study
• Improve pricing for current environment (most companies operated on “old” data)
• Adjust valuation reserves for key parameters of region and cause of disability.
• Benchmark company versus industry