experiences and perspectives of young workers, december 2016
TRANSCRIPT

Experiences and Perspectives of Young Workers
December 2016
B O A R D O F G O V E R N O R S O F T H E F E D E R A L R E S E R V E S Y S T E M


Experiences and Perspectives of Young Workers
December 2016
B O A R D O F G O V E R N O R S O F T H E F E D E R A L R E S E R V E S Y S T E M

This and other Federal Reserve Board reports and publications are available online at
www.federalreserve.gov/publications/default.htm.
To order copies of Federal Reserve Board publications offered in print,
see the Board’s Publication Order Form (www.federalreserve.gov/pubs/orderform.pdf)
or contact:
Publications Fulfillment
Mail Stop N-127
Board of Governors of the Federal Reserve System
Washington, DC 20551
(ph) 202-452-3245
(fax) 202-728-5886
(e-mail) [email protected]

Preface ......................................................................................................................................... 1
Executive Summary ................................................................................................................ 3
Key Findings .............................................................................................................................. 4
Policy and Research Implications ................................................................................................ 6
Introduction ............................................................................................................................... 9 About the Survey ...................................................................................................................... 10
Profile of Respondents .............................................................................................................. 11
Outlook and Expectations .................................................................................................. 15
Outlook about Future Job Opportunities .................................................................................... 15
Steady Employment vs. Higher Pay ........................................................................................... 16
Parents’ Education .................................................................................................................... 17
Related Research on Young Workers’ Outlook and Expectations ................................................. 19
Value of Education ................................................................................................................ 21
Profile of Current Students ........................................................................................................ 21
Non-completers ........................................................................................................................ 23
Financing Postsecondary Education .......................................................................................... 23
Value of Postsecondary Education ............................................................................................. 24
Additional Educational Attainment ............................................................................................. 24
Barriers to Postsecondary Education ......................................................................................... 24
Related Research on the Value of Education .............................................................................. 26
Connecting Education and the Labor Market ............................................................. 27
Information about Jobs and Careers .......................................................................................... 27
Aligning Education and Work ..................................................................................................... 27
Early Work Experience .............................................................................................................. 27
Job Searches ........................................................................................................................... 28
Related Research on Connecting Education and the Labor Market .............................................. 29
Profile of Employees ............................................................................................................. 31
Permanent/Long-Term and Temporary Employment .................................................................... 31
Full-Time and Part-Time Employment ........................................................................................ 32
Underemployment .................................................................................................................... 33
Multiple Jobs ............................................................................................................................ 34
Job Qualifications ..................................................................................................................... 34
Related Research on Employment ............................................................................................. 35
iii
Contents

Self-Sufficiency ........................................................................................................................ 37
Income and Benefits ................................................................................................................. 37
Covering Household Expenses .................................................................................................. 37
External Financial Support ......................................................................................................... 38
Housing Arrangements .............................................................................................................. 38
Related Research on Self-Sufficiency ......................................................................................... 39
Policy and Research Implications ..................................................................................... 41
Aligning Education and the Labor Market ................................................................................... 41
Increasing Opportunities for Non-degree Education .................................................................... 41
The Pursuit of Steady Employment ............................................................................................ 42
Additional Job Growth Would Benefit Young Workers ................................................................. 42
Appendix A. Technical Appendix on Survey Methodology .................................... 43
Appendix B: Survey of Young Workers—Questionnaire ......................................... 45
A Introduction ........................................................................................................................... 45
B Education and Training ........................................................................................................... 59
C Current Job ........................................................................................................................... 72
D Expectations ......................................................................................................................... 84
Appendix C. Responses to Survey Questionnaire ....................................................... 89
Summary Demographics ......................................................................................................... 112
iv

Preface
The Federal Reserve Board’s Division of Consumer
and Community Affairs (DCCA) conducted the
2015 Survey of Young Workers and prepared this
report.
DCCA directs consumer- and community-related
functions performed by the Board, including con-
ducting research on labor market and financial ser-
vices policies and practices and their implications for
consumer financial stability, community develop-
ment, and neighborhood stabilization.
DCCA staff member Heidi Kaplan prepared this
report. Extensive comments, feedback, and technical
assistance were provided by the following DCCA
staff members: Sam Dodini, Jennifer Fernandez,
Christina Park, Jenny Schuetz, and Anna Tranfaglia.
Support and guidance from Federal Reserve Board
staff members Anna Alvarez Boyd, Joseph
Firschein, David Kaufmann, Ellen Levy, and Susan
Stawick are gratefully acknowledged. The Federal
Reserve also would like to thank the following orga-
nizations that provided insights on issues affecting
young workers: The Federal Reserve Bank of
Atlanta, the Federal Reserve Bank of Philadelphia,
and the John J. Heldrich Center for Workforce
Development.
Mention or display of a trademark, proprietary
product, or firm in this report does not constitute an
endorsement or criticism by the Federal Reserve
System and does not imply approval to the exclusion
of other suitable products or firms.
1


Executive Summary
Young adults in the United States have experienced
higher rates of unemployment and lower rates of
labor force participation than the general population
for at least two decades, and the Great Recession
exacerbated this phenomenon.1 Despite a substantial
labor market recovery from 2009 through 2014, vul-
nerable populations—including the nation’s young
adults—continue to experience higher rates of
unemployment.2
Changes in labor market conditions, including glo-
balization and automation, have reduced the avail-
ability of well-paid, secure jobs for less-educated per-
sons, particularly those jobs that provide opportu-
nity for advancement. Furthermore, data suggest
that young workers entering the labor market are
affected by a long-running increase in the use of
“contingent” or “alternative” work arrangements,
characterized by contracted, part-time, temporary,
and seasonal work.3
In light of these trends, the Federal Reserve Board’s
Division of Consumer and Community Affairs
began exploring the experiences and expectations of
18- to 30-year-old Americans entering the labor mar-
ket. Staff reviewed existing research and engaged
external research and policy experts to identify the
potential economic implications of these labor mar-
ket trends on young workers.
This initial exploration raised several questions about
the experiences of young workers that were not fully
explained by existing data. In response, the Federal
Reserve conducted its first Survey of Young Workers
over November and December 2013 to develop a
deeper understanding of the forces at play. The find-
ings from this report were published in 2014.4
In December 2015, the Federal Reserve conducted a
second Survey of Young Workers to further explore
labor market issues and trends among this popula-
tion. The 2015 Survey of Young Workers was admin-
istered by GfK using its Internet panel.5 The 2,035
survey respondents ranged in age from 18 to 30.
Details about the survey, its methodology, and limi-
tations can be found in the body of the report and in
a methodological appendix.
This report serves two principal purposes. First, it
summarizes insights from the 2015 Survey of Young
Workers and related research in the field. Second, it
frames policy and research issues for future consider-
ation by the Federal Reserve Board and others.
1 Bureau of Labor Statistics (2014), Current Population Survey (CPS), Unemployment by Age, Sex, and Marital Status, Season-ally Adjusted, table A-10, www.bls.gov/web/empsit/cpseea10.htm.
2 Heidi Shierholz, Natalie Sabadish, and Nicholas Finio, The Class of 2013: Young Graduates Still Face Dim Job Prospects, Economic Policy Institute briefing paper no. 360 (Washington: EPI, April 2013), www.epi.org/publication/class-of-2013-graduates-job-prospects/.
3 U.S. Department of Labor, Commission on the Future of Employee–Management Relations (Washington: Department of Labor, 1994), www.dol.gov/_sec/media/reports/dunlop/section5.htm. This report refers to contingent work and alternative work arrangements as “alternative work arrangements” and refers to contingent workers and alternative work arrangement workers as “alternative” workers. For a further discussion of “alternative work arrangements,” see Barbara J. Robles and Marysol McGee, “Exploring Online and Offline Informal Work: Findings from the Enterprising and Informal Work Activities (EIWA) Survey,” Finance and Economics Discussion Series 2016-089 (Washington: Board of Governors of the Fed-eral Reserve System, October 2016), www.federalreserve.gov/econresdata/feds/2016/files/2016089pap.pdf.
4 Board of Governors of the Federal Reserve System, In the Shadow of the Great Recession: Experiences and Perspectives of Young Workers (Washington: Board of Governors of the Fed-eral Reserve System, 2014), www.federalreserve.gov/econresdata/2013-experiences-and-perspectives-of-young-workers-201411.pdf.
5 KnowledgePanel® is a large-scale online panel based on a rep-resentative random sample of the U.S. population. GfK sup-plies a free computer and Internet service to participating households that lack Internet access. See www.gfk.com/us/Solutions/consumer-panels/Pages/GfK-KnowledgePanel.aspx.
3

Key Findings
Unless otherwise noted, this report presents findings
from the December 2015 survey. Key findings
include the following:
Outlook and Expectations
Young adults showed an increase in optimism about
future job opportunities from the 2013 survey to the
2015 survey.
• In 2015, the majority of young adults (61 percent)
are optimistic about their future job opportunities,
showing an increase in optimism from 2013
(45 percent).
• In the survey, the likelihood that a young adult is
optimistic about future job opportunities increases
with higher levels of educational attainment. Fur-
thermore, young adults who are enrolled in school
are more optimistic than young adults who are not
enrolled in school.
• Young adults with a paid job are more optimistic
than those without a paid job.
Among young adults, steady employment remains
more important than higher pay.
• In 2015, young adults continue to have a strong
preference for steady employment (62 percent) over
higher pay (36 percent). However, the percentage
of respondents who preferred steady employment
decreased from 2013 (67 percent).
• Among respondents who prefer steady employ-
ment, 80 percent would rather have one steady job
than a stream of steady jobs for the next five years.
Young adults whose parents have obtained a bachelor’s
degree are not confident their standard of living will be
higher than that of their parents.
• Most young adults are not sure how their standard
of living will compare with their parents’ standard
of living.
• Young adults with at least one parent with a bach-
elor’s degree (or higher) are more likely to believe
their standard of living will be lower than their
parents (4 percent) when compared with young
adults whose parents have a high school education
or less (1 percent).
Value of Education
Twenty-eight percent of respondents are currently
enrolled as students in a certificate or degree program.
• Most students are enrolled in degree programs,
including associate’s degrees (23 percent), bach-
elor’s degrees (55 percent), and graduate degrees
(9 percent). Furthermore, 8 percent of the students
are enrolled in a certificate or technical degree
program.
• In the survey, most undergraduate students are
identified “nontraditional” because they are over
age 23, enrolled in school part time, working full
time, and/or financially independent.6
Ten percent of respondents are “non-completers,”
meaning they are not currently enrolled in a certificate
or degree program they started.
• Most non-completers intend to re-enroll and com-
plete the certificate or degree program that they
started.
• Thirty-seven percent of non-completers withdrew
from their program more than two years ago.
Students use a variety of sources to finance postsec-
ondary education.7
• Sixty-two percent of respondents with postsecond-
ary education worked while in school to finance all
or part of their most recent education.
• Fifty-two percent of respondents with postsecond-
ary educational experience have parents that con-
tributed financially to their education.
• Forty-six percent of respondents incurred debt to
pay for some portion of their education or
training.
6 The National Center for Education Statistics uses the following definition: “The criteria chosen to identify nontraditional stu-dents pertain to choices and behavior that may increase stu-dents’ risk of attrition and, as such, are amenable to change or intervention at various stages in a student’s school life. With this intention, three sets of criteria were used to identify non-traditional students: (1) enrollment patterns, (2) financial and family status, and (3) high school graduation status. See https://nces.ed.gov/pubs/web/97578e.asp.
7 In this report, postsecondary education refers to experience in a certificate or technical degree program, associate’s degree pro-gram, bachelor’s degree program, master’s degree program, and/or professional or doctorate degree program. In this report, respondents with postsecondary education have not necessarily completed a certificate or degree.
4 Experiences and Perspectives of Young Workers

In 2015, young adults believe there is greater value in
their postsecondary education than those in 2013.
• Between 2013 and 2015, the portion of respon-
dents who believe the financial benefits of their
most recent postsecondary education outweigh the
cost increased from 43 percent to 54 percent.
• Furthermore, unlike in 2013, the analysis does not
show that the value placed on education is corre-
lated with whether or not a respondent completed
their certificate or degree, has a paid job, or has a
temporary or permanent job.
Forty-one percent of respondents believe they have the
level of education and training needed for the type of
job that they would like to hold in the next five years.
• Young adults with a graduate degree are the most
likely to believe they have the necessary level of
education.
• Meanwhile, young adults who lack postsecondary
credentials are less likely to believe they have the
necessary level of education.
Young adults report that the high cost of education
and a lack of information about connections to jobs
and careers are barriers to enrolling in postsecondary
educational programs.
• Among young adults who are interested in addi-
tional education but not enrolled, cost is the most
frequently cited reason for not enrolling.
• After cost, a lack of time and the schedule of
course offerings are noted as barriers to enrollment
in additional education.
Connecting Education and the
Labor Market
More than 30 percent of young adults did not receive
information about jobs and careers in high school and
college (if applicable).8
• Sixty-six percent of young adults received informa-
tion about jobs and careers during high school.
And, 69 percent of young adults received such
information in college (among those who attended
college).
• Among young adults who received information
about jobs and careers in high school, college or
both, the information most often came from teach-
ers and counselors.
Many employees are not employed in jobs aligned with
their education.9
• Less than half (45 percent) of employees work in a
career field that is closely related to their educa-
tional and training background.
• Employees engaged in some fields of study, includ-
ing engineering, are more likely to align their edu-
cation and work.
Many young adults gained early work experience dur-
ing high school, college, or both.
• Fifty-three percent of young adults had a paid job
during high school, and 77 percent of young adults
had a paid job during college (among those who
attended college).
• Twenty-six percent of young adults who held an
internship during college said that the internship
led to a paid job.
Young adults do not have a standard method of
searching for a job.
• At every level of educational attainment, the top
strategy for job searches was to contact the
employer directly.
• Young adults with a bachelor’s degree searched
more intensely, as they were far more likely to
employ this strategy (61 percent) than those with a
certificate or technical degree (44 percent).
Profile of Employees
Permanent employment that is long-term and not tem-
porary employment is correlated with a positive out-
look and job satisfaction.
• Seventy-eight percent of employees have a
permanent/long-term (“permanent”) job.
• Sixty-eight percent of employees with a permanent
job are optimistic about their future job opportu-
nities compared with 43 percent of employees with
a temporary job.
• Fifty-seven percent of employees with a permanent
job are very satisfied with the benefits they receive
8 In the survey, respondents with postsecondary education (including those who have not completed a certificate or degree) were asked about their “college” experience.
9 “Employees” refers to respondents who have a paid job and who are not enrolled in school full time. See Profile of Respon-dents in the Introduction for a more detailed description.
December 2016 5

from their employer compared with 29 percent of
employees with a temporary job.
Full-time employment is also correlated with a positive
outlook and job satisfaction.
• Seventy-five percent of employees in the survey
have a full-time job.
• Sixty-five percent of full-time employees are opti-
mistic about their job future compared with
54 percent of part-time employees.
• Full-time employees are more likely to consider
their main job to be a “career” or a “stepping
stone to a career” than their part-time
counterparts.
Many part-time employees would prefer more work
hours.
• Among part-time employees surveyed, 49 percent
were identified as underemployed, as they are
working part time because of economic condi-
tions.10
• Meanwhile, 42 percent of part-time employees pre-
fer part-time work.
Employees expect to have fewer paid jobs in the com-
ing year than they have held in the past year.
• Sixty-three percent of employees held one full-time
job in the past year, yet 80 percent of employees
expect to have only one full-time job in the coming
year.
• Among employees who have multiple jobs, these
employees would prefer to work more jobs simul-
taneously than they have experienced in the past
year.
Self-Sufficiency
Employees in 2015 are more satisfied with their pay
and benefits than in 2013.
• In 2015, employees are more likely to be “very” or
“somewhat” satisfied with their salary and wages
than respondents with a paid job in 2013.
• The percent of young workers who have health
insurance increased from 2013 (70 percent) to 2015
(82 percent).
• Likewise, the percent of young workers who
received paid time off for sick leave, holidays, or
both from any of their paid jobs increased from
2013 (59 percent) to 2015 (62 percent).
Although most employees can cover their household
expenses, many would struggle if faced with an
emergency.
• Seventy-three percent of employees are able to
cover their monthly household expenses with their
household income.
• Among young workers, the ability to go without a
paycheck temporarily improved between 2013 and
2015.
Many employees receive financial support from family.
• Many employees, including some employees who
report they cover their household expenses, receive
financial support from their families.
• In addition, 8 percent of employees use govern-
ment programs to support their households.
Young adults are forming new households.
• As adults, 43 percent of employees have formed a
new household with their immediate family (i.e.,
spouse/partner), and 20 percent have formed a new
household alone or with a roommate.
• Nearly half of employees are responsible for pay-
ing their full mortgage or rent.
Policy and Research Implications
Improve Alignment between Education
and the Labor Market
With the labor market’s growing demand for formal
educational attainment, choosing a postsecondary
program is the first substantial investment decision
for many young people.11 The survey highlights the
association between postsecondary education and
positive labor market outcomes, ranging from opti-
mism about one’s job future to higher earnings. 10 Underemployed, or “part time for economic reasons” or “invol-
untary part time,” includes persons who indicated that they would like to work full time but were working part time (one to 34 hours) because of an economic reason, such as their hours were cut back or they were unable to find full-time jobs. See http://www.bls.gov/cps/lfcharacteristics.htm.
11 Anthony Carnevale, Tamara Jayasundera, and Ban Cheah, The College Advantage: Weathering the Economic Storm (Washing-ton: Georgetown University, Georgetown Public Policy Insti-tute, August 2012), https://georgetown.app.box.com/s/vzqem30apzdt4e3vmo9n.
6 Experiences and Perspectives of Young Workers

Responses to the survey underscore the importance
of young workers receiving appropriate information
that enables them to select an educational program
that maximizes their job opportunities. Future work-
ers need quality information that is accessible and, if
possible, standardized for easy comparisons across
institutions. Additionally, strategies to track the
employment and earnings of program graduates over
time should also be considered.
Increase Opportunities for Non-degree
Education
Aside from college and university degrees, more
workers could gain cost- and time-efficient skills
through postsecondary career technical education
(CTE). However, young adults interested in CTE
face many challenges, including a lack of CTE high
schools, a decentralized CTE system, and a lack of
work-based learning programs.12
Despite these challenges, CTE in the United States
has some valuable assets, including comprehensive
high school and open-access community colleges.13
Providing students with information about CTE
options earlier could help them prepare to make the
most of their educational investment.
Provide Assistance and Protections for
Workers with Alternative Work
Arrangements
Despite young adults’ desires for long-term job
employment with a single employer, research shows
an increase in alternative work arrangements.
Because alternative work arrangements are increas-
ing in the face of young adults demanding more
financial security, policies and strategies that will
provide workers with stability under the changing
labor market conditions should be considered. Alter-
native workers are concerned with issues including,
but not limited to, income volatility, loss of benefits,
paid time off, opportunities for advancement, and
legal protections.
Seek Opportunities to Improve Job Growth
It is important to note that the high rate of unem-
ployment among young workers is not a result of
only education, job searches, or individual character-
istics. High rates of unemployment and low rates of
participation among segments of the population
could be improved by greater economic growth.
12 Malgorzata Kuczera and Simon Field, A Skills beyond School Review of the United States, OECD Reviews of Vocational Education Training (Paris: OECD Publishing, 2013), www.oecd.org/employment/askillsbeyondschoolreviewoftheunitedstates.pdf.
13 Ibid.
December 2016 7


Introduction
A changing labor market is driving questions about
how young workers prepare for shifts in the skills
demanded of workers, the location of work, and the
relationships between employers and employees.14 As
young adults enter the labor market, three significant
changes are creating a work environment that is
markedly different than the one their parents pre-
pared to enter.
First, the Great Recession exacerbated existing
trends of increased unemployment and declines in
labor market participation rates among young
adults. Since the recovery began in 2009, the unem-
ployment rate has not recovered to pre-recession lev-
els. Higher unemployment rates have affected young
adults more than older workers. Between Decem-
ber 2005 and December 2015, unemployment among
18- to 19-year-olds increased 18 percentage points to
15.2 percent, and for 20- to 24-year-olds unemploy-
ment increased 1.0 percentage points to 9.4 percent.
Yet unemployment for 35- to 44-year-olds increased
0.2 percentage points to 4.0 percent (table 1).15
Likewise, while labor market participation rates have
decreased overall for those 55 years and older, young
adults have experienced the greatest decline. Between
December 2005 and December 2015, participation
rates among 18- to 19-year-olds dropped 8.9 percent-
age points to 58.2 percent, and 20- to 24-year olds
the rate dropped 3.3 percentage points to 74.4 per-
cent, while the rate for 35- to 44-year-olds dropped
1.2 percentage points to 83.8 percent (table 1).16
Second, globalization, automation, and improved
efficiencies in the workplace are changing how
employment and training programs connect workers
to jobs, particularly those that require special skills
and provide for wage advancement. As employers
seek new ways to make the employment relationship
more flexible, they have increasingly relied on a vari-
ety of arrangements popularly known as alternative
work arrangements. Because of this increased use of
independent contractors, temporary, seasonal, and
leased employees, young workers are increasingly
acting as their own agents of employment, rather
than as employees of a particular firm. As the rela-
tionship between employers and employees shifts,
employers may be less likely to provide salaries and
traditional benefits to workers.
Third, the United States has experienced “job polar-
ization,” a steady decline in well-paid, secure jobs,
such as in manufacturing, and an increase in demand
for cognitive knowledge, skills, and abilities. This
change in the job market has meant a shift from jobs
14 In 2014, Federal Reserve Board Chair Yellen commented on shifts in the labor market since the Great Recession when she stated that “Along with cyclical influences, significant struc-tural factors have affected the labor market, including the aging of the workforce and other demographic trends, possible changes in the underlying degree of dynamism in the labor market, and the phenomenon of ‘polarization’—that is, the reduction in the relative number of middle-skill jobs.” Janet Yellen, “Labor Market Dynamics and Monetary Policy,” (speech at the Federal Reserve Bank of Kansas City Economic Symposium, Jackson Hole, Wyoming, August 22, 2014), www.federalreserve.gov/newsevents/speech/yellen20140822a.htm#f7.
15 U.S. Bureau of Labor Statistics. See www.bls.gov. 16 U.S. Bureau of Labor Statistics. See www.bls.gov.
Table 1. Labor force statistics from the Current Population Survey (August 2016)
AgeUnemployment
rate(percent)
Unemployment rate change (Aug. 2006–Aug. 2016)(percentage
points)
Labor force participation
(percent)
Labor force participation
change(Aug. 2006–Aug. 2016)(percentage
points)
18 to 19 years 15.2 +1.8 58.2 -8.9
20 to 24 years 9.4 +1.0 74.4 -3.3
25 to 34 years 5.3 +0.2 82.9 -2.2
35 to 44 years 4.0 +0.2 83.8 -1.2
45 to 54 years 3.6 +0.2 81.4 -1.8
55 years and over 3.2 No change 37.6 -2.2
Source: Bureau of Labor Statistics.
9
that require no more than a high school diploma to
jobs that require at least some postsecondary educa-
tion. As evidence of this shift, college-educated
workers continue to fare significantly better than
those without a postsecondary degree in the after-
math of the recession.17
As a result of economic changes, a large portion of
young adults are now “disconnected”—that is, nei-
ther enrolled in education nor employed. In 2014, the
“disconnection rate” for both young high school
graduates and young college graduates was 1.3 times
as high as before the recession began. This increase
represents an enormous loss of opportunity for work
experience or further education and will have a last-
ing negative impact on their lifetime earnings.18
Furthermore, since the Great Recession, college
graduates continue to be employed at greater rates
than high school graduates but at far lower rates
than historical norms. Young college graduates typi-
cally have a strong labor market attachment, yet the
employment-to-population ratio of young college
graduates has significantly declined from the average
of 89 percent during the 1990s and 87 percent during
the 2000s to 85 percent in 2015.19
In light of these changes, the Board seeks to describe
the perceptions and expectations of young Ameri-
cans in the labor market. Specifically, the Board aims
to identify workplace experience and expectations
for 18- to 30-year-olds.
In December 2013, the Federal Reserve Board’s
Division of Consumer and Community Affairs con-
ducted the inaugural Survey of Young Workers. The
survey was an initial inquiry into the work experi-
ences and expectations of young workers. In Decem-
ber 2015, the second survey, known as the 2015 Sur-
vey of Young Workers, was administered to the same
population of young adults nationwide. Unless oth-
erwise noted, the findings in this report represent the
2015 Survey of Young Workers.
The Survey of Young Workers aims to capture a
snapshot of the educational attainment, employment
experience, and labor market outlook of 18- to
30-year-olds across the United States. The survey
also collects information on young adults that is not
readily available from other sources or that is not
available in combination with other variables of
interest. The survey instrument was designed in con-
sultation with Federal Reserve System staff and out-
side academics with relevant research backgrounds.
The 2015 Survey of Young Workers focuses on a
range of topics, including
• outlook for future job opportunities;
• expectations for full-time and long-term work
arrangements;
• educational attainment;
• educational objectives;
• profile of current employment; and
• financial self-sufficiency.
About the Survey
The 2015 Survey of Young Workers was designed by
Board staff and administered by GfK, an online
consumer research company, on behalf of the Fed-
eral Reserve. In most cases, original questions are
asked of respondents, although occasionally ques-
tions mirror those from other surveys in order to
provide direct comparisons and understand how cer-
tain variables interact with others. In the 2015 sur-
vey, many of the questions from the 2013 survey are
repeated to enable longitudinal tracking, while new
questions are introduced as well.
The survey was conducted using a sample of adults
between the ages 18 to 30 from the Knowl-
edgePanel®, a proprietary, probability-based web
panel of more than 50,000 individuals from ran-
domly sampled households; the sample was designed
to be representative of the U.S. population. As
shown in table 1, e-mails were sent to 1,139 respon-
dents from the 2013 Survey of Young Workers who
remained part of the KnowledgePanel® and between
the ages of 18 and 30. A total of 815 respondents
from the 2013 Survey of Young Workers responded
to the 2015 survey, representing 72 percent of those
contacted. In addition, e-mails were sent to 2,996
17 Carnevale, Jayasundera, and Cheah, The College Advantage.18 Heidi Shierholz, Alyssa Davis, and Will Kimball, The Class of
2014: The Weak Economy is Idling Too Many Young Graduates, Economic Policy Institute Briefing Paper #377 (Washington: EPI, 2014), www.epi.org/publication/class-of-2014/.
19 Maria Canon, Marianna Kudlyak, and Yang Liu, Youth Labor Force Participation Rate Continues to Fall, but It Might Be for a Good Reason (St. Louis: Federal Reserve Bank of St. Louis, 2015), www.stlouisfed.org/~/media/Publications/Regional%20Economist/2015/January/PDFs/youth_labor.pdf.
10 Experiences and Perspectives of Young Workers

“fresh” individuals, yielding 1,120 complete surveys,
a 37 percent respondent rate.20
In total, 4,135 potential respondents were contacted
for the 2015 Survey of Young Workers, resulting in
2,035 completed surveys. The total response rate for
the 2015 survey was 49 percent. The median time to
complete the survey was approximately 15 minutes
(table 2).
Recognizing that the sample demographics may dif-
fer from that of the overall U.S. population, survey
results are weighted based on the demographic char-
acteristics of the respondents to match characteris-
tics from the 2015 March Current Population Survey
(CPS). Further details on the survey methodology
are included in appendix A.
As is the case with all surveys, some caution in inter-
preting the survey results is prudent. Although the
survey was designed to be nationally representative,
some degree of selection bias beyond that which can
be corrected through weighting is possible nonethe-
less (see appendix A). Further, the results are all self-
reported, and respondents’ knowledge and memory
may not always be completely accurate when answer-
ing survey questions.
The following sections of this report summarize key
findings from the Survey of Young Workers. Unless
otherwise noted, the numbers cited in this report are
derived from the survey and are weighted to yield
estimates for the U.S. adult population between ages
18 and 30 years old. Each section also concludes
with findings from research related to the subject
matter. Only a subset of questions in the survey are
discussed in the report; however, the complete survey
questionnaire is summarized in appendix B. The
responses to all the survey questions are presented in
appendix C in the order that the questions were
asked of respondents.
Profile of Respondents
Age
The 2015 Survey of Young Workers represents a
nationwide sample of 18- to 30-year-olds. The distri-
bution is slightly younger than the 2013 sample due
to a small increase in 22- to 26-year-olds and a small
decrease in 27- to 30-year-olds (table 3).
Race/Ethnicity
In the survey, 56 percent of the respondents are
white (non-Hispanic), 21 percent are Hispanic,
14 percent are black (non-Hispanic), 7 percent are
another race (non-Hispanic), and 2 percent represent
two or more races (non-Hispanic).
Geography
Eighty-seven percent of the survey respondents rep-
resent metropolitan areas, and 13 percent represent
non-metropolitan areas.
Education
The survey sample is weighted to reflect the educa-
tional attainment of 18- to 30-year-olds nationwide.
As such, 9 percent of the respondents have less than
a high school education, 24 percent have a high
school diploma or equivalent GED, 29 percent have
some college education (but no degree or certificate
to date), 4 percent have a certificate or technical
degree, 10 percent have an associate’s degree, 25 per-
cent have bachelor’s degree or higher (table 4).
In the survey, “business/management” is the most
popular field of study for all respondents with post-
secondary experience (15 percent) as well as respon-
dents with a bachelor’s degree or higher (20 percent). 20 Data provided by GfK.
Table 2. Key survey response statistics
Sample type Number sampled
Qualified completes
Completion rate
(percent)
2013 re-interviews 1,139 815 72
Fresh cases 2,996 1,120 37
Overall 4,135 2,035 49
Table 3. Age of respondents
Percent, except as noted
Age 2013 2015
18–21 years old 28 28
22–26 years old 38 41
27–30 years old 33 31
Number of responses 2,097 2,035
Note: Here and in subsequent figures and tables, percentages may not sum to 100 because of rounding and question nonresponse.
Note: In this table and in subsequent figures and tables, the number of responses reported is not weighted.
December 2016 11

“Health” was the second most popular field of study
for respondents with at postsecondary experience
(14 percent) while “engineering” was second most
popular field for those with a bachelor’s degree or
higher (14 percent) (table 5).
Students
Among the respondents, there was a decrease in the
proportion of students currently enrolled in an edu-
cation or training program from 2013 (32 percent) to
2015 (28 percent). Throughout this report, all of
these respondents are referred to as “students”
regardless of their employment status.
Employment
Respondents showed an increase in current paid
employment from 60 percent in 2013 to 69 percent
2015.
Employees
Among respondents, many young adults are both
students and paid employees. Furthermore, student
life and work life are no longer separate or sequential
for many young adults. So, although the report con-
siders all respondents currently enrolled in school as
students for the purposes of analysis, the report
attempts to identify those who have “launched” their
work life as “employees.” As a result, throughout
this report, Employee is used to describe respondents
who are currently working as paid employees and are
not currently enrolled in school full time (table 6).
Unemployment
The survey also showed a decrease in respondents
who are not working as a paid employee but report
they are currently seeking a paid job (“unemployed”)
from 2013 (19 percent) to 2015 (14 percent) (table 7).
The most frequently cited reasons that 2015 respon-
dents are not working and not looking for work are
that they are students (45 percent), they don’t need
to work (45 percent), and they are homemakers/
taking care of family (32 percent). Furthermore,
16 percent of these respondents are self-employed.
Table 4. What is the highest level of formal education you have completed?
Percent, except as noted
Education level 2013 2015
Less than high school 10 9
High school diploma or equivalent GED 29 24
Some college, no degree or certification (including currently enrolled) 30 29
Certificate or technical degree * 4
Associate degree 9 10
Bachelor’s degree 17 18
Master’s degree 4 5
Professional or doctorate degree 1 1
Number of responses 2,097 2,035
Note: “Certificate or technical degree” not asked in 2013.
Table 5. Which one of the following broad categories best describes your most recent educational program?
Percent, except as noted
Education program
2015 respondents
with postsecondary
experience
2015 respondents
with bachelor’s degree or higher
Business/management 15 20
Health 14 10
Engineering 9 14
Social/behavioral sciences 9 10
Computer/information sciences 7 6
Education 6 9
Humanities 5 7
Physical sciences/math 5 5
Vocational/technical training 5 <1
Life sciences 4 5
Law 4 4
Other 11 9
Number of responses 1,527 751
Table 6. Currently working as a paid employee
Percent, except as noted
Response 2013 2015
Currently enrolled in an education or training program, full time 22 17
Not currently enrolled in an education or training program OR enrolled, part time (“employee”) 78 83
Number of responses 1,386 1,468
Table 7. Are you currently looking for a paid job?
Percent, except as noted
Response 2013 2015
Yes 19 14
No 21 17
Currently working as a paid employee (not asked) 60 69
Number of responses 2,097 2,035
Note: Asked of respondents not currently working as a paid employee.
12 Experiences and Perspectives of Young Workers

Earning and Learning
The majority of respondents (51 percent) are work-
ing as paid employees and not enrolled school.
Younger respondents, 18- to 24-year-olds, are less
likely to be working with no enrollment (39 percent)
and older respondents, 25- to 30-year-olds, are more
likely to be working with no enrollment (64 percent)
(tables 8–10).
Eighteen percent of the respondents are students and
paid employees. Younger respondents are more likely
to be “earning and learning” (26 percent), and older
employees are much less likely to be “earning and
learning” (9 percent). Sixteen percent of younger
respondents are attending school with no paid
employment, while only 3 percent of older respon-
dents are attending school and not working (tables
8–10).
Table 8. Are you currently working as a paid employee?
Percent
Response Paid
employee Not paid
employee Total
Enrolled in an education or training program 18 10 28
Not enrolled in an education or training program 51 21 72
Total 69 31 100
Note: Number of responses is 2,035.
Table 9. Are you currently working as a paid employee? (ages 18- to 24-years-old)
Percent
Response Paid
employee Not paid
employee Total
Enrolled in an education or training program 26 16 42
Not enrolled in an education or training program 38 19 58
Total 64 36 100
Note: Number of responses is 776.
Twenty-one percent of the respondents are neither
attending school nor working as a paid employee.
Nineteen percent of younger respondents and
23 percent of older respondents are neither working
nor in school (tables 8–10).
Table 10. Are you currently working as a paid employee? (ages 25- to 30-years-old)
Percent
Response Paid
employee Not paid
employee Total
Enrolled in an education or training program 9 3 12
Not enrolled in an education or training program 64 23 88
Total 74 26 100
Note: Number of responses is 1,259.
December 2016 13


Outlook and Expectations
The survey was designed to gauge young workers’
attitudes and expectations about jobs and careers
over time. The 2015 survey reveals that optimism
among young workers increased in the past two
years. Although many factors contribute an indi-
vidual’s perspective, the survey is designed to meas-
ure shifts in young worker’s job outlook as the labor
market recovery from the Great Recession progresses
and job expectations as the alternative work arrange-
ments options grow.
Outlook about Future Job Opportunities
The 2013 survey was administered approximately
four years in to the economic recovery from the
Great Recession, and at a time when the job recovery
was still considered weak. The survey is designed to
measure changes in young workers’ outlook about
the labor market as the recovery becomes a part of
the past. For this purpose, the survey asks respon-
dents about their view of future job opportunities as
well as the personal and external economic factors
that contribute to their viewpoint.
The survey showed an increase in young adults’ opti-
mism about future job opportunities from 2013 (45 per-
cent) to 2015 (61 percent). Likewise, young adults dem-
onstrated a decrease in pessimism (from 21 percent to
10 percent) about future job opportunities as well as
uncertainty (from 34 percent to 28 percent) (figure 1).
As will be discussed throughout this report, educa-
tional attainment is correlated with young workers’
experiences and outlook. The survey data show that,
on average, respondents’ optimism increases with
higher levels of education. For example, 47 percent
of respondents with a high school education, 69 per-
cent with a bachelor’s degree, and 84 percent of
those with a professional or doctorate degree are
optimistic about their job future. The overall rise in
optimism is also evident in each level of educational
attainment from 2013 to 2015 (table 11).
In both years, respondents currently enrolled in
school are more optimistic than overall respondents
(57 percent in 2013 and 72 percent in 2015, com-
pared with 45 percent overall in 2013 and 61 percent
overall in 2015) (table 11).
Notably, respondents who are currently employed
are more likely to be optimistic about future job
opportunities (65 percent) than those who are not
currently employed (51 percent). Unemployment is
Figure 1. Would you say your expectations about future job opportunities are:
21%
34%
45%
10%
28%
61%
2013 2015
Optimistic
Not sure
Pessimistic
Note: Number of responses in 2013 is 2,097. Number of responses in 2015 is 2,035.
Table 11. “Optimistic” about future job opportunities (by educational attainment and current enrollment)
Percent
Response 2013 2015
Educational attainment
High school diploma or GED equivalent 35 47
Bachelor’s degree 59 69
Professional or doctorate degree 68 84
Currently enrolled in an education or training program 57 72
15

associated with pessimism as 23 percent of respon-
dents who are seeking a job (and not currently work-
ing) are pessimistic about their job future and 30 per-
cent are unsure (table 12).
Respondents who are optimistic about their future
job opportunities were asked to indicate the factors
that contribute to this feeling. Educational attain-
ment was the most frequently cited reason that
respondents were optimistic as 81 percent report “I
will have enough education and training in the
future,” and 78 percent report “my current level of
education and training.” Respondents also attribute
their optimism to the educational field they selected
as 77 percent said “there is demand for the type of
work I do” and 76 percent said “my field of study”
(figure 2).
Respondents who are pessimistic about their future
job opportunities were asked to indicate the factors
that contribute to this feeling. “Lack of work experi-
ence” was the most frequently cited reason for feel-
ing pessimistic (68 percent) followed by their “cur-
rent level of education” (67 percent). The third
ranked reason was a lack of opportunities in the
local job market (57 percent) (figure 3).
Respondents who are not sure about their future job
opportunities were asked about factors that contrib-
ute to this feeling. “My current level of education
and training” was the most frequently cited reason
for feeling not sure (51 percent) followed by their
“local labor market” (42 percent) (figure 4).
Steady Employment vs. Higher Pay
As the labor market continues to increase the use of
alternative work arrangements, it is important to
assess young workers’ appetite and tolerance for
volatility in their pay and work schedule. The survey
asked respondents whether they prefer “steady
employment” or “higher pay” to gauge their desire
for security when selecting a job. Although respon-
dents favored steady work over higher pay in both
2013 and 2015, the survey shows a decrease in the
preference for steady work from 2013 (67 percent) to
2015 (62 percent) (figure 5).
Respondents who had more than one paid job in the
past year were less likely to prefer steady employ-
ment (56 percent) than the total sample (62 percent).
That said, those who worked more than one job at
Table 12. Would you say your expectations about future job opportunities are: (by current work status)
Response Optimistic(percent)
Not sure(percent)
Pessimistic(percent)
Number of responses
Currently working as a paid employee 65 26 8 1,468
Not currently working
Currently looking for a paid job (“unemployed”) 47 30 23 257
Not currently looking for a paid job (not participating in labor force) 54 37 8 310
Figure 2. Please indicate whether any of the factors contributed to your feeling optimistic about your future job opportunities
My local labor market provides many job opportunities
My previous work experience
My field of study
There is demand for the type of work I do
My current level of education and training
I will have enough eduation and training in the future
57%
72%
76%
77%
78%
81%
Note: Number of responses is 1,230.
16 Experiences and Perspectives of Young Workers

the same time in the past year were nearly as likely
(60 percent) to prefer steady employment as the total
sample (table 13).
In 2015, the survey probed the respondents about
their definition of “steady work.” More specifically,
the 2015 survey asked respondents whether they
would prefer one job or multiple jobs for the next
five years, assuming the work is “steady.” Among
respondents who prefer steady work, 80 percent pre-
ferred one job for the next five years, 12 percent pre-
ferred multiple jobs (but only one job at a time), and
7 percent preferred multiple jobs (even if this meant
more than one job at a time) (table 14).
Respondents who have experience with more than
one job in the past year were slightly less likely to
prefer one job for the next five years (70 percent).
Respondents working more than one job at the same
time in the past year were much less likely to prefer a
single job for the next five years (62 percent)
(table 15).
The 2015 survey also probed respondents about the
ideal amount of time to remain at a single job. While
54 percent of respondents said that there is no ideal
amount of time to stay at a job, 6 percent favored no
more than two years, 5 percent favored no more than
10 years, and 21 percent said they do not know.
There was no difference in responses between the
total sample and those who have already joined the
workforce (table 16).
Parents’ Education
As noted throughout this report, there is sound evi-
dence that educational attainment has a positive
Figure 3. Please indicate whether any of the factors contributed to your feeling pessimistic about your future job opportunities
My field of study
Lack of demand for the type of work I do
Lack of opportunities for education and training
My local labor market does not provide many job opportunities
My current level of education and training
Lack of previous work experience 68%
67%
57%
51%
47%
47%
Note: Number of responses is 219.
Figure 4. Please indicate whether any of the factors contributed to your feeling not sure about your future job opportunities
My field of study
The demand for the type of work I do
Lack of previous work experience
Future opportunties for education and training
My local labor market
My current level of education and training
37%
36%
36%
37%
42%
51%
Note: Number of responses is 580.
December 2016 17

effect on labor market and financial outcomes. In
order to assess the likelihood of young adults
exceeding their parents in educational attainment
and labor market outcomes, the survey included
questions about both parental educational attain-
ment and the respondents’ belief about their future
standard of living.
When respondents were asked how they expect their
standard of living to compare with their parents’
standard of living, most respondents are not sure.
That said, respondents with a least one parent with a
bachelor’s degree or higher level of educational
attainment are more likely to believe they will have a
lower standard of living than their parents (4 per-
cent) when compared with respondents whose par-
ents have a high school education or less (1 percent).
Likewise, respondents whose parents have a high
school education or less are more likely to believe
they will have a higher standard of living than their
parents (19 percent) when compared with respon-
dents with at least one parent with a bachelor’s
degree or higher (17 percent) (figure 6).
Figure 5. Is it more important to have a job that pays more or a job that is more likely to provide steady employment?
67%
30%
62%
36%
Higher paySteady employment
2015
2013
Table 13. Is it more important to have a job that pays more or a job that is more likely to provide steady employment? (by prior work experience)
Percent, except as noted
Response Total
Respondents who had more than one
paid job in the past year
Respondents who had more than one
paid job AT THE SAME TIME in the
past year
Steady employment 62 56 60
Higher pay 36 42 39
Number of responses 2,035 796 333
Table 14. If you had steady work for the next five years, would you prefer to have one job or multiple jobs?
Percent
Response Prefer “steady employment”
One job for the next five years 80
Multiple jobs over the next five years (only one job at a time) 12
Multiple jobs over the next five years (okay with more than one job at a time) 7
Note: Number of responses is 1,290.
Table 15. If you had steady work for the next five years, would you prefer to have one job or multiple jobs? (by prior work experience)
Percent, except as noted
Response
Respondents who had more than one paid
job in the past year
Respondents who had more than one paid
job AT THE SAME TIME in the past year
One job for the next five years 70 62
Multiple jobs over the next five years (only one job at a time) 17 19
Multiple jobs over the next five years (okay with more than one job at a time) 12 19
Number of responses 796 333
Table 16. When you think about your job future, not including campus jobs and internships, what is the ideal amount of time to stay in the same job?
Response Percent
No more than one year 3
No more than two years 6
No more than five years 11
No more than 10 years 5
There is no ideal amount of time to stay at a job 54
I don’t know 21
Note: Number of responses is 2,035.
18 Experiences and Perspectives of Young Workers

Related Research on Young Workers’ Outlook and Expectations
Young adults worldwide generally perceive a promis-
ing future for themselves, including a successful
career. According to ManpowerGroup’s 2016 global
study of millennials, two-thirds of the respondents
are optimistic about their immediate job prospects
and 62 percent are confident that if they lost their
main source of income tomorrow they could find
equally good or better work within three months.21
In the United States, a 2014 Gallup poll of Ameri-
cans found that although national optimism about
the future decreased following the Great Recession,
young people remain more optimistic than the gen-
eral population. For example, 30 percent of all
respondents said it is a good time to find a quality
job compared with 46 percent of respondents aged
18- to 29-years-old.22
21 ManpowerGroup, Millennial Careers: 2020 Vision: Facts, Fig-ures, and Practical Advice from Workforce Experts (Milwaukee: ManpowerGroup, 2016), www.manpowergroup.com/wps/wcm/connect/660ebf65-144c-489e-975c-9f838294c237/
MillennialsPaper1_2020Vision_lo.pdf?MOD=AJPERES. The term “millennial” refers to those born between 1982 and 1996.
22 Gallup Polls, 2014. See www.gallup.com/poll/168704/americans-quality-jobs-outlook-improves-april.aspx.
Box 1. Optimism Is Similar acrossRace and Ethnicity
Despite black and Hispanic respondents laggingwhite respondents in education, job experience, andself-sufficiency, respondents do not show a signifi-cant difference in their outlook about the futureacross racial and ethnic lines. In 2015, optimismincreased across all racial and ethnic groups: Blackrespondents (63 percent) report as much in opti-mism as white respondents (64 percent). Hispanicrespondents also expressed an increase in optimismbut are not as optimistic as their black and whitecounterparts (figure A).
Figure A. Expectations about future job opportunitiesare “Optimistic” (by race)
44%
64%
44%
63%
45%
56%
20152013
HispanicBlackWhite
Figure 6. When you reach your parents' current age, how do you expect your standard of living to compare to their current standard of living? (by parents' educational attainment)
Bachelor's degree or higher
High school or less
HIGHER STANDARDof living than my parents
LOWER STANDARDof living than my parents
1%
4%
19%
17%
Box 2. Black Respondents More Likely to Expect a Higher Standard of Living than Their Parents
Black respondents overwhelmingly expect that they will have a higher standard of living than their parents (69 percent), while Hispanic respondents have lower expectations than black respondents about exceed-ing their parents’ standard of living (57 percent). White respondents have the lowest expectations of all three racial/ethnic groups about having a higher standard of living than their parents (46 percent).
December 2016 19


Value of Education
Whether an individual obtains postsecondary educa-
tion and completes a certificate or degree has long
been understood to be a major determinant of labor
market outcomes and financial self-sufficiency. Col-
lege enrollment has been growing nationwide. How-
ever, as college costs and the percentage of students
borrowing to pay for education both continue to rise,
many young adults must attempt to measure the
value of education in the labor market. The survey
asks respondents about their educational experience,
their perceptions of the value of their degree, and,
among those who believe they need more education,
why they did not continue their education.
Profile of Current Students
In the 2015 survey, 28 percent of respondents are
enrolled in an educational or training program. This
marks a slight decrease from the 2013 enrollment of
32 percent (table 17). The survey respondents’
decrease in enrollment coincides with a 1.3 percent
decrease in postsecondary enrollment nationally
between spring 2015 and spring 2016.23
In the 2015 survey, most students enrolled in degree
programs, including associate’s degrees (23 percent),
bachelor’s degrees (55 percent), and graduate degrees
(9 percent). Eight percent of the students are
enrolled in a certificate or technical degree program.
And, 4 percent of the students are not enrolled in
postsecondary studies, as they are working to obtain
their high school diploma or high school equivalent
rather than a postsecondary credential.
The 2015 survey data were analyzed to describe the
“traditional” or “nontraditional” characteristics to
describe the current postsecondary, undergraduate
population and to be able to monitor shifts going
forward. The National Center for Education Statis-
tics (NCES) describes the characteristics of “nontra-
ditional” postsecondary students by: (1) enrollment
patterns (enroll immediately after high school, full-
time enrollment); (2) financial and family status
(working full time, dependents or single parent,
financially independent); and (3) high school gradua-
tion status (lack a high school diploma).
First, nontraditional students may be identified by
their enrollment patterns by age, including when
there is a lag between high school graduation and
their postsecondary enrollment. In this report, tradi-
tionally aged students were identified as respondents
between ages 18 and 20 years old who are enrolled in
a certificate or technical degree program or associ-
ate’s degree program as well as respondents between
18 and 23 years who are enrolled in a bachelor’s
degree program. By this definition, 60 percent of the
students are traditionally aged and 40 percent are
nontraditionally aged (table 18).
Furthermore, nontraditional students may be identi-
fied by their enrollment status, that is, those who are
not enrolled full time. In the survey, 73 percent of
students are enrolled full time and 26 percent of stu-
dents are enrolled part time. Students in bachelor’s
degree programs are the most likely to be full-time
students (89 percent). Meanwhile, 60 percent of stu-
dents enrolled in associate’s degree programs and
33 percent of students enrolled in certificate and
technical degree programs are enrolled full time
(table 19).
23 National Student Clearinghouse Research Center, 2016, Term Enrollment Estimates: Spring 2016. See https://nscresearchcenter.org/wp-content/uploads/CurrentTermEnrollment-Spring2016.pdf.
Table 17. Are you currently enrolled in an education or training program?
Percent, except as noted
Response 2013 2015
Yes (“students”) 32 28
No 67 72
Number of responses 2,097 2,035
21

Second, the NCES identifies nontraditional students
by financial and family status including working full
time. In the survey, 64 percent of students have a
paid job, including 20 percent of all students with a
full-time job. Students enrolled in a certificate or
technical degree program are the most likely to be
working full time (31 percent). Students enrolled in
an associate’s degree or a bachelor’s degree program
are less likely to work full time (17 percent and
15 percent, respectively) (table 19).
Nontraditional students’ financial and family status
can also be identified by dependent children or
financial independence. The Survey of Young Work-
ers does not ask about respondents’ dependent chil-
dren. However, the survey does ask whether respon-
dents receive financial assistance from parents or
other family members for their living situation. Over-
all, 66 percent of students in the survey receive finan-
cial assistance for their living situation. Students
enrolled in an associate’s degree program are more
likely to receive assistance for their living situation
(76 percent) than those enrolled in a certificate or
technical degree program (66 percent) or those
enrolled in a bachelor’s program (68 percent)
(table 19). Please note, students enrolled in an associ-
ate’s degree program are also more likely to be under
21 years of age than those in other educational
programs.
Finally, the NCES identifies nontraditional postsec-
ondary students as those who did not receive a high
school diploma. The survey did not ask respondents
whether they received a high school diploma.
Table 18. Type of certificate or degree program currently enrolled in (by age)
Percent
Education level
Age in years
18 19 20 21 22 23 24 +
High school diploma or equivalent GED 1 0 0 0 0 0 2
Certificate or technical degree 1 0 0 1 1 0 4
Associate degree 5 4 4 3 2 1 5
Bachelor’s degree 6 11 10 9 6 4 10
Master’s, professional, or doctorate degree 0 0 0 0 1 1 7
Note: Number of responses is 478. "Traditionally aged" students (indicated in bold) represent 60 percent and "nontraditionally aged" students represent 40 percent of current students.
Table 19. Traditional (indicated in bold) and nontraditional students (by type of certificate or degree program enrolled in)
Percent, except as noted
Student characteristics Total
Type of certificate or degree program enrolled in
Certificate or technical degree
Associate’s degree Bachelor’s degree
Enrollment patterns (status)
Full time 73 33 60 89
Part time 26 61 39 11
Financial status (work status)
Full-time, paid employee 20 31 17 15
Part-time, paid employee 44 28 53 46
Not paid employee 36 41 30 39
Financial status (receive assistance from parents or otherfamily members for living situation)
Receive assistance 66 66 76 68
Do not receive assistance 33 30 24 32
Number of respondents 478 36 106 230
Note: Small sample size for certificate and technical degree students.
22 Experiences and Perspectives of Young Workers

Non-completers
Withdrawing from an educational program prior to
earning a certificate or degree leaves these “non-
completers” more vulnerable to poor labor market
outcomes than those who complete their educational
investment with a certificate or degree. In the survey,
10 percent of respondents are non-completers, iden-
tified as those who are not currently enrolled in a
certificate or degree program they started.
Among non-completers, 28 percent withdrew from
their educational or training program less than one
year ago, 32 percent withdrew one to two years ago,
and 37 percent withdrew more than two years ago.
The remaining 3 percent do not recall when they
were last enrolled in their program.
Most non-completers intend to re-enroll and com-
plete the certificate or degree program they started.
More specifically, 41 percent say they will “defi-
nitely” complete the program, and 20 percent say
they will “probably” complete the program. Mean-
while, 25 percent of non-completers are not sure if
they will complete the program they started. Finally,
some will “probably not” (5 percent) or “definitely
not” (9 percent) complete the certificate or degree
program.
Financing Postsecondary Education
Among young adults who obtain postsecondary edu-
cation, it is increasingly common that at least a por-
tion of their education will be financed through a
student loan or other forms of borrowing. The sur-
vey asks respondents with postsecondary experience
about how they financed their most recent educa-
tional experience.
Respondents reported four primary sources for
financing their most recent educational experience.
First, 62 percent of respondents with postsecondary
education worked while in school to finance all or
part of their most recent education. Second, 52 per-
cent of respondents have parents who contributed to
educational costs. Respondents were not asked to
specify whether their parents used loans, savings, or
other resources for their contributions. Third, 46 per-
cent received used financial-aid based grants (includ-
ing Pell Grants and Free Application for Federal Stu-
dent Aid (FAFSA) loans) to pay for their postsec-
ondary education.24 Fourth, 46 percent of
respondents also used financial-aid-based loans
(including FAFSA loans) to finance their most
recent postsecondary educational program (figure 7).
On a smaller scale, 39 percent of students received an
academic scholarship to finance all or part of their
most recent educational experience. Thirty-
eight percent of respondents used their own savings
to pay for their most recent educational experience.
Finally, 10 percent of respondents used tuition reim-
bursement from an employer (including military) to
pay for their education (figure 7).
When asked about their total postsecondary educa-
tional experience (rather than their most recent),
36 percent of respondents incurred some debt to pay
for their education. Students with higher levels of
24 The Free Application for Federal Student Aid (FAFSA) is a part of the U.S. Department of Education and is the largest provider of student financial aid in the nation. See https://fafsa.ed.gov/.
Figure 7. Please indicate whether you used any of the following forms of financing for your most recent educational program
62%
52%
46%
46%
39%
38%
10%Tuition reimbursement from employer (including military)
I paid with my own savings
Academic scholarship
Financial-aid based loans (including FAFSA loans)
Financial-aid based grant (including Pell Grant and FAFSA grants)
My parents contributed (with or without the use of loans)
I worked while in school
December 2016 23

educational attainment are more likely to have used
debt to finance some portion of their education.
Notably, 42 percent of those with a certificate or
technical degree used debt to finance their education
compared with 57 percent of respondents with a
bachelor’s degree and 67 percent of respondents
with a graduate degree.
Value of Postsecondary Education
In order to examine the perceived value of higher
education, the survey asks respondents with postsec-
ondary educational experience whether they believe
the financial benefits of their most recent postsec-
ondary experience outweigh the costs. The survey
aims to assess whether respondents perceive this
value by asking if they believe they have the level of
education they need for the type of job they would
like to hold.
Between 2013 and 2015, there was an increase in
the percent of respondents (from 41 percent to
50 percent) who believe the financial benefits of their
most recent educational program are larger than the
costs. Likewise, there was a decrease in the percent of
respondents (from 23 percent to 18 percent) who
believe that the financial benefits of their most recent
educational program are smaller than the costs
(figure 8).
In the analysis of the 2013 data, respondents who
had incurred debt to pay for their education were less
likely to report that the financial benefits of their
most recent educational experience were larger than
the costs of those who did not incur debt. However,
the analysis of the 2015 data did not support this
finding. Similarly, in 2015, there was no correlation
between the value placed on education between
certificate/degree holders and non-completers,
respondents with a job and those without a paid job,
or respondents with a temporary and permanent job.
Additional Educational Attainment
Overall, 41 percent of respondents believe they have
the level of education and training needed for the
type of job that they would like to hold in the next
five years. Respondents with a graduate degree are
the most likely to believe they have the necessary
level of education (76 percent of master’s degree and
90 percent for professional or doctorate degree).25
Respondents with a certificate or technical degree or
a bachelor’s degree also show a moderate degree of
confidence in their level of education (54 percent and
59 percent, respectively). Those who lack postsec-
ondary credentials are much less likely to believe they
have the necessary level of education (29 percent
with less than high school education, 35 percent with
high school, and 30 percent with some college)
(figure 9).
Barriers to Postsecondary Education
The survey probed respondents who are not cur-
rently enrolled in an educational program, but who
are interested about barriers to postsecondary enroll-
25 Sample size for respondents with a master’s degree and with a doctorate or professional degree is small.
Figure 8. Were the financial benefits of most recent educational program greater than the costs?
18%
21%
18%
23%
13%
15%
50%
41%
2015—Respondents with postsecondary education
2013—Respondents with postsecondary education
I don't know
The financial benefits are SMALLER than the costs
The financial benefits are ABOUT THE SAME as the costs
The financial benefits are LARGER than the costs
24 Experiences and Perspectives of Young Workers

ment. The cost of postsecondary education is the
most frequently cited reason for not enrolling in
postsecondary education. More specifically, 33 per-
cent of these respondents said “I don’t want to bor-
row money to enroll” very much describes why they
are not enrolled, and 31 percent said “I don’t want to
borrow money to enroll” somewhat describes why
they are not enrolled. Similarly, 33 percent reported
that “I cannot afford to enroll” very much describes
why they are not enrolled, and 28 percent said this
statement somewhat describes why they are not
enrolled (figure 10).
For many respondents, time and schedule are also
barriers to enrollment in additional education.
Twenty-five percent report that “family responsibili-
ties” very much describe why they are not enrolled,
and 23 percent report family responsibilities some-
what describes their reason(s). Seventeen percent
said that the program’s schedule very much describes
why they are not enrolled, and 31 percent said this
somewhat describes the reason (figure 10).
Additional reasons that describe why many respon-
dents who are interested in additional information
but are not enrolled include “I don’t know which
program will improve my job opportunities,” “I am
gaining work experience,” and “I am concerned that
even after the program, I will not land a job in my
field” (figure 10).
Finally, reasons that had less impact on enrollment
than those already mentioned include “I don’t know
where to enroll,” “I don’t meet the requirements to
enroll,” “I am concerned the programs will be too
Figure 9. Believe to have the level of education and training needed for the type of job that you would like to hold in the next five years
29%
35%30%
54%
38%
59%
76%
90%
Professional or doctorate degree
Master’s degree
Bachelor’s degree
Associate degree
Certificate or technical degree
Some college, no degree or certification
High school diplom
a or equivalent GED
Less than high schoolFigure 10. How much each reason describes why you are not enrolled (among those who are interested in additional education but are not currently enrolled)
Somewhat describes why not enrolled
Very much describes why not enrolled
I am in the process of applying
The program is not offered at my local institutions
I am concerned the programs will be too challenging
I don’t meet the requirements to enroll
I don’t know where to enroll
I am concerned that even after the program, I will not land a job in my field
I am gaining work experience
I don’t know which program will improve my job opportunities
The schedule does not work for me
I have family responsibilities
I can’t afford to enroll
I don’t want to borrow money to enroll 33% 31%
33% 28%
25% 23%
17% 31%
16% 29%
15% 29%
12% 29%
7% 26%
8% 22%
6% 23%
7% 21%
11% 15%
December 2016 25

challenging,” and “the program is not offered at my
local institutions” (figure 10).
Related Research on the Value of Education
Although unemployment rates and wages stagnated
in the immediate aftermath of the Great Recession,
workers with postsecondary credentials continued a
longstanding trend of faring better in the labor mar-
ket than the general population. Carnevale, Jayasun-
dera, and Gulish (2015) found that since the end of
the Great Recession, the number of jobs held by col-
lege graduates has steadily increased while jobs held
by workers with a high school diploma or less have
shown virtually no recovery.26
In order to meet the demand for postsecondary cre-
dentials, young adults are increasingly enrolling in
certificate and vocational training, in addition to tra-
ditional institutions of higher education. Carnevale,
Jayasundera, and Cheah (2012) found that the num-
ber of individuals obtaining certificates more than
tripled between 1994 and 2010 and that one in 10
workers now report a certificate as their highest level
of education. Likewise, on average, certificate hold-
ers earn 20 percent more than high school graduates
without any postsecondary education.27
26 Anthony Carnevale, Tamara Jayasundera, and Artem Gulish, Six Million Missing Jobs: The Lingering Pain of the Great
Recession (Washington: Georgetown University: Center on Education and the Workforce, 2015), https://cew.georgetown.edu/wp-content/uploads/Six-Million-Missing-Jobs.pdf.
27 Carnevale, Jayasundera, and Cheah, The College Advantage.
26 Experiences and Perspectives of Young Workers

Connecting Education and the Labor Market
Whether an individual attends college and completes
his or her degree has long been understood to be a
major determinant of lifetime income and financial
well-being. Because choosing a postsecondary pro-
gram is a substantial investment decision facing
many young adults, accurate information about the
risks and rewards associated with educational
options is in high demand.
Information about Jobs and Careers
The survey asks respondents whether they learned
about jobs and careers during high school or during
college.28 In the 2015 survey, 66 percent of respon-
dents received information about jobs and careers
during high school, representing a slight increase
over the 63 percent who received this information in
2013. Likewise, there was a small increase from 2013
(66 percent) to 2015 (69 percent) in the percent of
respondents who received information about jobs
and careers during college (figure 11).
In 2015, among those who received information
about jobs and careers during high school, most
received the information from their teachers or coun-
selors (76 percent). Also notable, 56 percent received
information from their parents, 49 percent received
information from other family (not parents) and
friends, and 41 percent found the information
through online research (figure 12).
In 2015, the sources of information about jobs and
careers during college were similar to those reported
during high school. Among those who received
information during college, most received the infor-
mation from their college professors or counselors
(71 percent). Furthermore, 57 percent received the
information from online research, 45 percent
received information through on-campus recruit-
ment, 43 percent received information from friends
and family, and 37 percent said they received infor-
mation from their parents (figure 12).
Aligning Education and Work
The survey probes respondents about whether their
paid job is aligned with their educational studies. The
survey shows that 45 percent of employees with post-
secondary education are employed in a career field
that is closely related to their education and training.
The employees most likely to be working in their
field of study have postsecondary education and
training in engineering (70 percent), education
(67 percent), vocational or technical fields, (65 per-
cent), computer/information sciences (64 percent),
and health (53 percent). Please note, the sample sizes
are very small for some fields of study (table 20).
Early Work Experience
In order to examine the relationship between early
work experience and labor market outcomes, the sur-
vey asked respondents about their work experience
during high school and college, if applicable. In the
28 In the survey, respondents with postsecondary education (including those who have not completed a certificate or degree) were asked about their “college” experience.
Figure 11. Received information about jobs and careers
2015
2013
During college (if applicable)During high school
63%66%66%
69%
27

survey, 53 percent of respondents held a paid job
while they were in high school. For respondents with
postsecondary education, 77 percent had a paid job
while they were enrolled in college. Further examina-
tion of correlation between early work experience
and labor market outcomes are discussed further in
the Profile of Employees section.
Many respondents also gained early work experience
through internships. Among respondents with post-
secondary education, 15 percent held a paid intern-
ship, 14 percent held an unpaid internship, and 3 per-
cent held both a paid and an unpaid internship. Most
respondents who held internships (89 percent) found
the experience to be worthwhile.29 More specifically,
26 percent said their internship led to a paid job,
58 percent said the internship improved their skills,
and 6 percent said the internship led to other benefits.
Job Searches
At every level of educational attainment, the most
frequently used strategy for job searches was to con-
tact the employer directly. However, those with a
bachelor’s degree or a high school education or less
were far more likely to employ this strategy (61 per-
cent and 64 percent, respectively) than those with a
certificate or technical degree (44 percent)
(figure 13).
After contacting an employer, employees were next
most likely to search electronic boards (e.g., Monster,
CareerBuilder) and post an online resume (e.g.,
LinkedIn, Twitter). Again the intensity was quite dif-
ferent between employees with a bachelor’s degree
(53 percent), a certificate or technical degree (42 per-
cent), and high school or less education (29 percent)
(figure 13).
The survey asks respondents with a paid job how
they searched for their current job. Analysis of the
29 In the survey, 551 respondents held an internship during college.
Figure 12. Where did you obtain information about jobs and careers?
During college (if applicable)During high schoolA business where I worked
Employment services agency
Career fair
Parent(s)
Friends and family
On-campus research
Online research
High school teacher/college professor or counselor
13%
7%
15%
11%
23%
37%
56%
43%
49%
45%
57%
41%
71%
76%
Table 20. Field of study of most recent educational program
Program
Employees working in a career field that is closely related to
education and training (respondents with postsecondary
education)(percent)
Number of responses
Engineering 70 84
Education 67 68
Vocational/technical training 65 54
Computer/information sciences 64 68
Life sciences 58 39
Physical sciences/math 56 38
Business/management 54 156
Health 53 143
Social/behavioral Sciences 51 88
Law 49 42
Humanities 38 52
Note: Small sample sizes.
28 Experiences and Perspectives of Young Workers

employee responses shows that search strategies dif-
fer by level of educational attainment. First, employ-
ees with a bachelor’s degree conduct a more intense
search (average of 2.68 strategies per respondent)
than employees with either a high school education
or less or employees with a certificate or technical
degree (average of 2.15 and 2.16 strategies per
respondent, respectively) (table 21).
Related Research on Connecting Education and the Labor Market
Like workers with postsecondary education, indi-
viduals with early work experience have been more
Figure 13. When you last searched for a job, please indicate whether you used each of the following strategies during the whole process
High school or less
Certificate or technical degree
Bachelor's degree
New job within company I was already employed by
Services from school, teacher, professor, or counselor
Services from an employment center
Career fair
My parents(s) provided a contact
Recruited by employer
Posted online resume / advertisement (e.g., LinkedIn, Twitter)
Family and friends (not parents) provided a contact
Searched electronic job boards (e.g., Monster, CareerBuilder)
I contacted the employer directly
61%
44%
64%
53%
42%
29%
27%
30%
29%
31%
36%
21%
22%
19%
18%
13%
7%
15%
21%
5%
12%
11%
6%
10%
17%
17%
8%
12%
10%
8%
Table 21. When you last searched for a job, please indicate whether you used each of the following strategies during the whole process:
Response
Educational attainment
High school or less
Certificate or technical degree
Bachelor's degree
Average number of strategies employed in job search 2.15 2.16 2.68
Number of responses 383 56 322
Note: Small sample size for respondents with certificate or technical degree.
December 2016 29

successful in the labor market. Notably, in a 2014
study by the Brookings Institution, teenage employ-
ment is associated with improved employment and
earnings outcomes later in life.30
Despite the important role of early job experience in
job readiness, employment opportunities for high
school students have been declining in recent years,
particularly among African American youth. The
Organisation for Economic Co-operation and
Development found that in 2007, 19 percent of low-
income African American teenagers worked com-
pared with nearly 50 percent of affluent white teen-
agers.31 Because teen and young adult unemploy-
ment is concentrated among less-educated and low-
income individuals, this phenomenon threatens the
upward mobility of already vulnerable populations.32
Furthermore, the system of school education for
youth followed by on-the-job learning in the work-
place has been replaced by an expectation of lifelong
learning and “credentialing” to upgrade skills and
adapt to occupational structures. Because the phases
of education and work are no longer linear, it is criti-
cal that workers are able to navigate the relationships
between educational programs and the labor
market.33
Research indicates that social capital and other
intangible factors play a role in the uneven labor
market outcomes between racial and ethnic groups.
A study by the Urban Institute found that while it is
unclear whether racially prejudiced employers, insuf-
ficient job networks, or limited work experience
cause the labor market differences, it is clear that
black youth (16- to 24-year-olds) are not obtaining
full-time, steady work.34
30 Andrew Sum, Ishwar Khatiwada, Mykhaylo Trubskyy, and Martha Ross with Walter McHugh and Sheila Palma, The Plummeting Labor Market Fortunes of Teens and Young Adults (Washington: The Brookings Institution, March 2014), www.brookings.edu/wp-content/uploads/2014/03/Youth_Workforce_Report_FINAL-1.pdf.
31 Kuczera and Field, A Skills beyond School Review.32 Sum, Khatiwada, Trubskyy, and Ross, The Plummeting Labor
Market Fortunes.
33 Anthony P. Carnevale, Andrew R. Hanson, and Artem Gulish, Failure to Launch: Structural Shift and the New Lost Generation (Washington: Georgetown University, 2013), https://cew.georgetown.edu/wp-content/uploads/2014/11/FTL_FullReport.pdf.
34 Margaret Simms and Marla McDaniel, The Black–White Job-less Gap, Urban Institute brief (Washington: Urban Institute, September 2010), www.urban.org/research/publication/black-white-jobless-gap.
Box 3. White Respondents Have More Early Work Experience than Black or Hispanic Respondents
In the survey, 62 percent of white respondents worked while in high school compared with 50 per-cent of black respondents and 39 percent of His-panic respondents. Similarly, 79 percent of white respondents worked while in college compared with 64 percent of black respondents and 70 percent of Hispanic respondents. Findings were similar for the 2013 Survey of Young Workers.
Box 4. White Respondents Are MoreLikely to Receive Job Informationfrom Friends and Family than Blackand Hispanic Respondents
During high school, white respondents were morelikely to receive information about jobs and careersfrom their parents (66 percent) and friends (53 per-cent) than black respondents (51 percent and49 percent, respectively) and Hispanic respondents(41 percent and 40 percent, respectively) (figure B).
Figure B. Where did you obtain information about jobsand careers? (by race and ethnicity)
66%
51%
41%
53%49%
40%
Received informationfrom parents
Received informationfrom friends
HispanicBlackWhite
30 Experiences and Perspectives of Young Workers

Profile of Employees
Survey respondents are asked a range of questions
about their employment status and job readiness,
and about their preference for traditional work, alter-
native work arrangements, and flexible work. The
survey also asks respondents whether they feel quali-
fied for their current job.
Permanent/Long-Term and Temporary Employment
In order to assess how young workers are being
affected by the increase in temporary jobs, the survey
asks about permanent/long-term (“permanent”) and
temporary job status. In the survey, 78 percent of
employees have a permanent job, 14 percent have
temporary job, and 7 percent do not know if their
job is permanent or temporary (figure 14).35
It is worth noting here that permanent employment
is not the same as stable or consistent employment.
To this point, 31 percent of employees with a perma-
nent job have work schedules that change daily,
weekly, or monthly. Temporary employees are even
more likely to have jobs with variable schedules as
55 percent have work schedules that change daily,
weekly, or monthly.
In the survey, employees with permanent jobs are
more likely to enjoy more positive labor outcomes
when compared with employees with temporary jobs.
For example, 68 percent of employees with a perma-
nent job are optimistic about their future job oppor-
tunities compared with 43 percent of employees with
a temporary job (table 22).
Permanent employees are more likely to be working
in a career field that is closely related to their educa-
tion and training (49 percent) than those with a tem-
porary job (26 percent). Furthermore, employees
with permanent jobs are more likely to describe their
job as a “career” than “just a job.” More specifically,
70 percent of those with permanent employment
describe their job as a “career” or a “stepping stone
to a career” compared with 37 percent of those with
temporary employment (table 22).
The survey asked a number of questions about
respondents’ employment benefits. Overall, 57 per-
35 In the survey, “job” refers the respondents’ main job, the job where they work the most hours.
Figure 14. Permanent and temporary job status (among employees)
Permanent/long-term, 78%
Temporary, 14%
I don't know, 7% Table 22. Labor market outcomes for permanent and temporary employees
Percent
Response Job is
permanent Job is
temporary
Optimistic about future job opportunities 68 43
Working in a career field closely related to education and training 49 26
Job is a “career” or “stepping stone to a career” 70 37
Very satisfied with benefits you currently receive from your employer(s) 57 29
Receive paid time off for sick leave and/or holidays from any of your paid jobs 71 24
Employer pays all or part of health-care premium 54 14
Training opportunities through an employer(s) 48 26
31

cent of employees with a permanent job are very or
somewhat satisfied with the benefits they receive
from their employer compared with 29 percent of
employees with a temporary job (table 22).
More specifically, 71 percent of employees with a
permanent job receive paid time off for sick leave,
holidays, or both compared with 24 percent of those
with a temporary job. In addition, 54 percent of
employees with a permanent job have an employer
that contributes to a health insurance plan (paying
all or part of the corresponding premium) compared
with 14 percent of temporary employees. Finally,
48 percent of permanent employees have training
opportunities through their employer compared with
26 percent of temporary employees (table 22).
The data were used to identify key characteristics of
employees who are more likely to hold permanent
jobs than the 78 percent of overall employees.
Eighty-four percent of employees with a bachelor’s
degree and 95 percent of employees with a master’s,
professional, or doctorate degree have a permanent
job (table 23).
In addition, 82 percent of employees who worked for
pay during high school and 83 percent of employees
who worked for pay during college have a permanent
job. Furthermore, 84 percent of those who held an
unpaid internship during college and 91 percent of
those who held a paid internship during college have
a permanent job (table 23).
Full-Time and Part-Time Employment
In order to assess how young workers are being
affected by the increase in part-time work, the survey
asks about full-time and part-time job status. In the
survey, 75 percent of employees have a full-time job
and 25 percent have a part-time job (figure 15).36
The survey data show that 24 percent of full-time
employees and 43 percent of part-time employees
have paid jobs with non-traditional hours. Further-
more, 29 percent of full-time employees and 56 per-
cent of part-time employees have schedules that
36 In the Survey of Young Workers, full-time jobs are defined as 35 hours per week or more.
Table 23. Characteristics of employees with permanent jobs
Employee characteristics Percent with
permanent job Number of responses
Total employees 78 1,027
Educational attainment
Bachelor’s degree 84 416
Master’s degree, professional, or doctorate 95 176
Early work experience
Worked for pay during high school 82 800
Worked for pay during college 83 847
Held one or more unpaid internship(s) during college 84 174
Held one or more paid internship(s) during college 91 174
Box 5. White Employees and Non-metropolitan Employees Are More Likely to Have Permanent Jobs
White employees are more likely to have a permanent job than black and Hispanic employees. In the sur-vey, 83 percent of white employees have a perma-nent job compared with 75 percent of Hispanic and 73 percent of black employees. Furthermore, employees in non-metropolitan areas are more likely to have a permanent job (88 percent) than those in metropolitan areas (77 percent).
Figure 15. Full-time and part-time job status (among employees)
Full time, 75%
Part time, 25%
32 Experiences and Perspectives of Young Workers

change daily, weekly, or monthly. In addition, 65 per-
cent of full-time employees are optimistic about their
job future compared with 54 percent of part-time
employees (table 24).
Employees with a full-time job are more likely to be
working in a career field that is closely related to
their education and training (51 percent) than part-
time employees (27 percent). Again, similar to per-
manent employees, full-time employees are more
likely to consider their main job to be a “career” or a
“stepping stone to a career” than their part-time
counterparts. More specifically, 72 percent of full-
time employees consider their main job to be a career
or a stepping stone to a career compared with
38 percent of part-time employees (table 24).
Overall, 60 percent of full-time employees are satis-
fied with the benefits their employer provides, while
25 percent of part-time employees are satisfied with
the benefits their employer provides. In the survey,
75 percent of full-time employees receive paid time
off for sick leave, holidays, or both compared with
24 percent of part-time employees. In addition,
64 percent of full-time employees have an employer
that contributes to a health insurance plan compared
with 9 percent of part-time employees. Finally,
49 percent of full-time employees have training
opportunities through their employer compared with
22 percent of part-time employees (table 24). Again,
the data were used to identify key characteristics of
employees who are more likely to hold full-time jobs
than the 75 percent of overall employees.
Higher levels of educational attainment are corre-
lated with full-time jobs. Notably, 85 percent of
employees with a bachelor’s degree and 90 percent of
employees with a master’s professional or doctorate
degree have a full-time job (table 25).
Early work experience is associated with many posi-
tive labor market outcomes. Seventy-nine percent of
employees who worked for pay during high school
and 90 percent of employees who worked for pay
during college have a full-time job. Furthermore,
94 percent of those who held a paid internship dur-
ing college have a full-time job. In terms of full-time
work, there was no correlation with unpaid intern-
ships during college (table 25).
Underemployment
In order to determine the rate of underemployment
among respondents, the survey asks the part-time
employees whether they would prefer more work
hours.37 Among part-time employees, 49 percent are
underemployed or working part time because of eco-
nomic conditions. More specifically, 42 percent of
part-time employees could only find part-time work,
and 17 percent had employers cut their hours
37 Underemployed, or “part time for economic reasons” or “invol-untary part time” includes persons who indicated that they would like to work full time but were working part time (one to 34 hours) because of an economic reason, such as their hours were cut back or they were unable to find full-time jobs. See http://www.bls.gov/cps/lfcharacteristics.htm.
Table 24. Labor market outcomes for full-time and part-time employees
Percent
Outcomes Job is
full time Job is
part time
Optimistic about future job opportunities 65 54
Working in a career field closely related to education and training 51 27
Job is a “career” or “stepping stone to a career” 72 38
Very satisfied with benefits you currently receive from your employer(s) 60 25
Receive paid time off for sick leave and/or holidays from any of your paid jobs 75 24
Employer pays all or part of health-care premium 64 9
Training opportunities through an employer(s) 49 22
Box 6. White, Black, and Non-metropolitan Employees Are More Likely to Have Full-Time Jobs
White and black employees are more likely to have a full-time job (76 percent for both) than Hispanic employees (69 percent). Also, employees in non-metropolitan locations are more likely to have a full-time job (87 percent) than those in metropolitan loca-tions (73 percent).
Table 25. Characteristics of employees with full-time jobs
Characteristics Percent with full-time job
Number of responses
Total employees 75 986
Educational attainment
Bachelor’s degree 85 416
Master’s degree, professional, or doctorate 90 176
Early work experience
Worked for pay during high school 79 800
Worked for pay during college 78 847
Held one or more paid internship(s) during college 94 174
December 2016 33

because of business conditions (11 percent reported
both reasons) (table 26).
However, 42 percent of part-time employees prefer
part-time work, including 39 percent who are
enrolled in school and 29 percent who work part
time because they have family responsibilities
(table 26).
Multiple Jobs
The survey asks questions to determine the respon-
dents’ expectations about working multiple jobs. In
the survey, employees expect to have fewer paid jobs
in the coming year than they have held in the past
year. For example, 63 percent of employees held one
full-time job in the past year, yet 80 percent of
employees expect to have just one full-time job in the
coming year. Likewise, 18 percent of employees had
held multiple full-time jobs in the past year, yet
8 percent expect to have multiple full-time jobs in the
coming year (figure 16).
The findings are similar for part-time work as 10 per-
cent of employees expect to have more than one
part-time job in the coming year, yet 17 percent held
multiple part-time jobs in the past year (figure 16).
Among employees who hold multiple jobs, most
would prefer to work more jobs at the same time
than they have experienced in the past year. In the
past year, 39 percent of employees with multiple jobs
worked at more than one job at the same time. Yet,
50 percent of employees expect to work more than
one job at the same time in the coming year (fig-
ure 16).
Job Qualifications
The survey asks respondents about whether they feel
qualified for their current job. Overall, 25 percent of
employees describe themselves as overqualified for
their job. In 2013, the data showed a correlation
between educational attainment level and overquali-
fication such that respondents with postsecondary
education were more likely to be overqualified for
their job.38 In 2015, the analysis did not show a corr-
38 The literature at this time suggested that because of a tight job market post-recession, many educated workers were being
Table 26. Please indicate whether each of the following is a reason that you are currently working part time rather than full time
Percent, except as noted
Economic reasons/involuntary (underemployed) 49
I could only find part-time work 42
My employer cut my hours due to business conditions 17
Personal preference
I prefer part-time work 42
I am enrolled in a school/training program 39
I have family responsibilities 29
I am caring for young children 21
I have health problems 10
Number of responses 270
Note: Respondents could select more than one reason.
Figure 16. Number of paid jobs in past year and number or paid jobs expect to have in coming year
Expect to work morethan one job simultaneously
(among respondents whohave had or expect to have
more than one job)
39%
50%
Three ormore
TwoOne
Part-time jobs
32% 32%
10%6% 6% 4%
Three ormore
TwoOne
Full-time jobs
63%
80%
15%
6%3% 2%
How many paid jobs do you expect to have in the next year?
How many paid jobs have you had in the past year?
34 Experiences and Perspectives of Young Workers

relation between educational attainment and being
overqualified for one’s job (table 27).
Related Research on Employment
A 2015 Aspen Institute survey of organizations that
provide workforce services to young adults revealed
that the top five job qualities for “good jobs” are:
(1) stable employment (not contract or temporary);
(2) full-time work; (3) predictable, set hours; (4) self-
sufficiency; and (5) opportunities for advancement
and pay increases (4 and 5 are discussed in the Self-
Sufficiency section of this report). While these “good
jobs” have grown the most in the recovery, it should
be noted that almost all good jobs have gone to col-
lege graduates.39
According to a 2015 study by ManpowerGroup, job
security is critical for millennials who want to ensure
they can maintain their standard of living.40 Today’s
young adults are generally not job hoppers, unless
there is an opportunity for advancement.41 Young
workers want standard work arrangements, which
typically offer higher wages, less income volatility,
and more benefits than contingent work.42
Despite young workers’ desire for secure employ-
ment, the labor market is shifting toward an
increased use of alternative work arrangements. A
2016 study by Katz and Krueger found the percent-
age of workers engaged in alternative work rose from
10.1 percent in February 2005 to 15.8 percent in late
2015. Furthermore, they estimate that all of the net
employment growth in the economy during this
period occurred in the form of alternative work
arrangements.43
Because alternative work arrangements are difficult
to classify and measure, the literature does not pro-
vide consistent findings about how the increase in
alternative work has affected young workers. Katz
and Krueger (2016) maintain that despite the noted
growth in alternative work incidences between 2005
and 2015, 16- to 24-year-old workers experienced no
growth in alternative work arrangements.44 However,
a 2015 study from the U.S. Government Account-
ability Office (GAO) found that compared with stan-
dard full-time workers, contingent workers are more
likely to be young.45
In addition, many workers who prefer full-time work
are still finding part-time work as their only option.
As a result, despite recent job growth, underemploy-
ment among young adults has risen, as job opportu-
nities often underutilize their availability to work.
“pushed down” to low-skill jobs while many low-skill workers were being pushed out of the labor market.
39 Ranita Jain, Maureen Conway, and Vickie Choitz, Connecting Young Adults to Employment: Results from a National Survey of Service Providers, Aspen Institute. (Washington: The Aspen Institute, 2015), www.aspenwsi.org/wordpress/wp-content/uploads/YAemploy.pdf.
40 ManpowerGroup, Millennial Careers.
41 Ibid.42 David S. Pedulla, The Hidden Costs of Contingency: Employers’
Use of Contingent Employees and Standard Employees’ Out-comes, Center for the Study of Social Organization, Working Paper #6. (Princeton, N.J.: Princeton University, Department of Sociology, 2011), www.princeton.edu/csso/working-papers/WP6.pdf.
43 Lawrence F. Katz and Alan B. Krueger, The Rise and Nature of Alternative Work Arrangements in the United States, 1995–2015. (Cambridge, Mass: Harvard University, 2016), http://scholar.harvard.edu/files/lkatz/files/katz_krueger_cws_v3.pdf?m=1459369766.
44 Ibid.45 U.S. Government Accountability Office, Contingent Workforce:
Size, Characteristics, Earnings, and Benefits, GAO—15-168R (Washington: GAO, May 20, 2015), www.gao.gov/products/GAO-15-168R.
Table 27. Employees who are “overqualified” for performing the tasks required of your main job (by educational attainment)
“Overqualified” employees 2015 (percent) Number of responses
Total “overqualified” 25 1,256
Educational attainment
Less than high school 22 35
High school or equivalent 21 221
Some college, no degree 28 219
Certificate or technical degree 26 56
Associate’s degree 24 127
Bachelor’s degree 30 416
Master’s degree 11 136
Professional or doctorate degree 11 40
Note: Small samples sizes for some levels of educational attainment.
December 2016 35


Self-Sufficiency
An important measure of self-sufficiency is whether
respondents have the household income to cover
their expenses to maintain their financial obligations
in the face of an emergency. In order to assess self-
sufficiency, the survey asks questions about covering
expenses, whether they receive family or other assis-
tance, and their current housing arrangements. This
analysis of financial self-sufficiency focuses on
employees, the subgroup most likely to be financially
prepared for independence
Income and Benefits
Young workers’ satisfaction with their total salary
and wages improved between 2013 and 2015. In
2015, employees are more likely to be “very” or
“somewhat” satisfied with their salary and wages
(19 percent and 42 percent, respectively) than
respondents with a paid job in 2013 (12 percent and
38 percent, respectively). In 2015, employees are also
more likely to be “very” or “somewhat” satisfied
with their job benefits (21 percent and 28 percent,
respectively) than the respondents with a paid job in
2013 (18 percent and 24 percent, respectively)
(figure 17).
The survey asks questions about which benefits
young workers find important and which benefits
they currently have from their employers. In both
2013 and 2015, young workers identified health
insurance (health care in 2013) and paid sick leave as
the most important and second most important ben-
efits to receive from an employer. In 2013, “matching
contributions to savings” was the third most impor-
tant, and in 2015, “contribution to tax deferred sav-
ings” was the third most important (table 28).
The percent of young workers who have health insur-
ance (from any source) increased from 2013 (70 per-
cent) to 2015 (82 percent). Likewise, the percent of
young workers who received paid time off for sick
leave, holidays, or both from any of their paid jobs
increased from 2013 (59 percent) to 2015 (62 per-
cent). Finally, training opportunities through
employer(s) remained flat at 43 percent from 2013 to
2015 (figure 18).
Covering Household Expenses
In the survey, 73 percent of employees are able to
cover their monthly household expenses with their
household income. Meanwhile, 22 percent of
employees report that they are sometimes able to
cover their monthly household expenses, and 4 per-
cent are not able to cover their monthly household
expenses at all.
Figure 17. Satisfaction with the total amount of salary or wages and benefits at the job or jobs you now hold
Salary and wages Benefits
Very satisfied
Somewhat satisfied
2015201320152013
38% 42%
24% 28%
12%
19%
18%
21%
Table 28. Rank the three benefits that are most important to you to receive from an employer
Rank 2013 2015
1 Health care Health insurance
2 Paid sick leave Paid sick leave
3Matching contributions to savings
Contribution to tax deferred savings
Number of responses 1,144 1,058
37

Among employees who are not able to cover their
household expenses some or all of the time, 64 per-
cent reduce their monthly expenses to meet the chal-
lenge, 56 percent do not pay some bills, 54 percent
borrow money from family, 46 percent use their
credit cards, 41 percent use savings, and 16 percent
borrow from friends.
A key consideration regarding self-sufficiency is the
ability of a household to withstand financial disrup-
tions. Among young workers, the ability to go with-
out a paycheck temporarily improved between 2013
and 2015. The percent of young workers who can
pay their living expenses if out of work for four
weeks improved from 38 percent in 2013 to 45 per-
cent in 2015. In addition, the percent of young work-
ers who can pay their living expenses if out of work
for three months improved from 24 percent in
2013 to 40 percent in 2015 (figure 19).
External Financial Support
Many employees—including some employees who
report that they cover their household expenses—re-
ceive financial support from their families. More spe-
cifically, many working respondents receive family
assistance for food and their living situation (e.g.,
mortgage, rent, or just living with parents or rela-
tives) (39 percent each). In addition, a substantial
portion of working respondents receive assistance
with miscellaneous bills (30 percent), health-care
costs (24 percent), and automobile payments and
maintenance (24 percent). Finally, a few receive assis-
tance with educational costs (16 percent), their chil-
dren (9 percent), and savings (7 percent).
Aside from family assistance, 8 percent of employees
use government programs, such as the Temporary
Assistance for Needy Families (TANF) or Housing
Choice Vouchers programs, to meet their financial
needs.46
Housing Arrangements
Housing represents one of the largest expenses for
most households, and the costs can be a challenge for
young adults looking to strike out on their own. The
survey asks respondents to describe their current liv-
46 The Temporary Assistance for Needy Families (TANF) pro-gram is designed to help needy families achieve self-sufficiency. States receive block grants to design and operate programs that accomplish one of the purposes of the TANF program. See www.acf.hhs.gov/ofa/programs/tanf. Housing Choice Vouchers allow very low-income families to choose and lease or purchase safe, decent, and affordable privately owned rental housing. See http://portal.hud.gov/hudportal/HUD?src=/program_offices/public_indian_housing/programs/hcv/about.
Figure 18. Access to benefits
2013 2015
Have health insurancefrom any source
Received paid time off forsick leave and/or holidaysfrom any of your paid jobs
Training opportunitiesthrough employer(s)
2013 2015
70%
82%
59% 62%
2013 2015
43% 43%
Figure 19. Would you be able to pay your living expenses?
2013 2015
If you were out of work for the next 4 weeks, would you ableto pay your living expenses?
If you were out of work for the next 3 months, would you able to pay your living expenses?
2013 2015
38%
45%
24%
40%
38 Experiences and Perspectives of Young Workers

ing arrangements as a broad measure of household
formation among young adults. In the survey, 43 per-
cent of employees have formed a new household
with their immediate family (i.e., spouse/partner),
and 20 percent have formed a new household alone
or with a roommate. The remaining 37 percent of
employees reside with their parents or extended
families.
From a financial standpoint, 49 percent of employ-
ees are responsible for paying their full mortgage or
rent, 20 percent contribute to their mortgage or rent,
and 29 percent report that they do not make any
mortgage or rent payments at all.
Related Research on Self-Sufficiency
Although the literature provides some variation
regarding the impact endured by workers entering
the job market during a downturn, there is agree-
ment that these workers experience negative impacts
for at least five to 10 years. For example, Oreopou-
los, von Wachter, and Heisz (2012) found that the
cost of recessions for new graduates is substantial
and unequal. Such graduates suffer persistent earn-
ing declines lasting 10 years. These workers start at
lower pay and then partly recover through a gradual
process of mobility toward better firms. They find
that more advantaged graduates suffer less from
graduating in recessions because they switch to bet-
ter firms quickly, while earnings of less advantaged
graduates can be permanently affected by a cyclical
downgrading.As a result, college graduates with the
lowest predicted annual earnings are most affected
by higher initial unemployment conditions and expe-
rience permanent earnings losses, while those at the
top experience losses that are short-lived.47
Furthermore, young people experience more income
volatility than older people, and income volatility is
hard to manage. Income volatility among individuals
under 30 is greater than the national average of
55 percent.48
47 Philip Oreopoulos, Till von Wachter, and Andrew Heisz, “The Short- and Long-Term Career Effects of Graduating in a Recession,” America Economic Journal: Applied Economics 4, no. 1 (January 2012): 1–29, http://dx.doi.org/10.1257/app.4.1.1.
48 Diana Farrell and Fiona Greig, Paychecks, Paydays, and the Online Platform Economy: Big Data on Income Volatility (New York: JPMorgan Chase Institute, 2016), www.jpmorganchase.com/corporate/institute/document/jpmc-institute-volatility-2-report.pdf.
December 2016 39


Policy and Research Implications
The Survey of Young Workers provides some
insights into the experiences of young workers, while
raising questions about others. The findings
described in this report are intended to help frame
future discussion among researchers, policymakers,
and practitioners working with young adults enter-
ing the labor market. This section identifies several
key policy and research implications of the study.
Aligning Education and the Labor Market
Connecting education and the labor market is
increasingly important for young workers. With the
labor market’s growing demand for formal educa-
tional attainment, choosing a postsecondary pro-
gram is the first substantial investment decision
many young people will make. Young adults need to
understand the risks and rewards associated with
their choice of a postsecondary institution and field
of study. As the cost of certificates and degrees
grows and the labor market demands shift, prospec-
tive students need more information to guide their
choices and to ensure higher returns on their invest-
ment. Furthermore, aligning education more closely
with careers promotes student success.49
Creating channels of communication that allow edu-
cational institutions to better meet the needs of a
changing labor market will provide better opportuni-
ties for young workers as well as employers. Further-
more, aligning education more closely with careers
promotes student success, as people with a sense of
where they are going are more likely to achieve their
desired goal.50
The survey highlights the association between post-
secondary education and positive labor market out-
comes, ranging from optimism about one’s job
future to higher earnings. Hence, it is key that young
workers receive quality information that enables
them to select an educational program that maxi-
mizes their job opportunities. The decision is further
complicated for the majority of potential students
who do not have the personal resources to pay for
their education upfront or lack the ability to earn a
full scholarship.
Therefore, policies and strategies should be consid-
ered to track the employment and earnings of pro-
gram graduates over time. Future workers need qual-
ity information that is accessible and, if possible,
standardized for easy comparisons across
institutions.
In light of the need for greater alignment between
education and the labor market, the Federal Reserve
Board will follow the quantitative research in the
Survey of Young Workers with a qualitative study.
The objective of the upcoming research is to gain a
more detailed and nuanced understanding of how
young adults gain information about jobs and career
as well as how they search for jobs. This study will
occur during 2017.
Increasing Opportunities for Non-degree Education
Aside from college and university degrees, more
workers could gain cost- and time-efficient skills
through postsecondary CTE. Unfortunately, young
adults interested in CTE face many challenges. First,
relatively few U.S. high schools offer vocational pro-
grams targeted for a particular profession or occupa-
tion. As a result, high school students tend to under-
take particular CTE courses as part of their general
high school diploma, rather than move directly to a
job.51
Second, compared with other countries, the CTE
programs in the United States are so highly decen-49 Carnevale, Jayasundera, and Cheah, The College Advantage.50 Ibid. 51 Kuczera and Field, A Skills beyond School Review.
41

tralized, it may not make sense to conceive of a CTE
“system.” Like other U.S. workforce programs, the
variety of diverse CTE institutions are difficult to
navigate because they are relatively autonomous,
ascribe to multiple accreditation bodies, lack
national skills or occupational standards, and are
substantially the role of the private for-profit
sector.52
Third, options for work-based learning, such as
apprenticeships, are weakly integrated into the U.S.
CTE offerings. For example, the apprenticeship
system only caters to a percentage of workers and is
seldom used outside of the construction sector.53
Despite these challenges, CTE in the United States
has some valuable assets that could be used to
develop more robust training options. For example,
the design of the CTE system is inclusive as high
schools are comprehensive and postsecondary CTE
in community colleges is normally open-access.54
Providing students with information early about
CTE options could help them prepare to make the
most of their educational investment.
The Pursuit of Steady Employment
The importance of steady employment was well-
documented in the Survey of Young Workers.
Despite young adults’ desires for long-term job
employment with a single employer, research shows
an increase in alternative work arrangements. In fact,
a 2016 study by Katz and Krueger contends that all
of the net employment growth between 2005 and
2015 occurred in alternative work arrangements,
with the greatest portion in hiring through contract
companies.55 Because contingent work can be
unstable, or may afford fewer worker protections
depending on a worker’s particular employment
arrangement, it tends to lead to lower earnings, fewer
benefits, and a greater reliance on public assistance
than standard work.56
Because alternative work arrangements are increas-
ing in the face of young adults demanding more
financial security, policies and strategies should be
considered that will provide workers with stability
under the changing labor market conditions. Contin-
gent workers are concerned with issues including, but
not limited to, income volatility, loss of benefits,
paid time off, opportunities for advancement, and
legal protections.
Additional Job Growth Would Benefit Young Workers
It is important to note that the high rate of unem-
ployment among young workers is not a result of
only education, job searches, or individual character-
istics. Rather, high rates of unemployment and low
rates of participation among segments of the popu-
lation could be improved by greater economic
growth.
Overall, labor market developments remain healthy.
However, despite strong job gains, the unemploy-
ment rate has flattened out at approximately 5 per-
cent over the past six months in part because of an
increase in the labor force participation rate. Trends
in labor force participation add another element of
uncertainty. The participation rate fell sharply after
the 2009 financial crisis, faster than its apparent
trend. It has been encouraging to see the participa-
tion rate improve over the past two years relative to
estimates of its trend. Despite this relative improve-
ment, the performance of the U.S. economy on this
dimension has been poor.57
52 Kuczera and Field, A Skills beyond School Review.53 Ibid.54 Ibid.55 Katz and Krueger, The Rise and Nature of Alternative Work
Arrangements.
56 U.S. Government Accountability Office, Contingent Workforce.57 Jerome H. Powell, “Recent Economic Development, the Pro-
ductive Potential of the Economy, and Monetary Policy” (speech at the Peterson Institute for International Economics, Washington, D.C., May 26, 2016), www.federalreserve.gov/newsevents/speech/powell20160526a.htm.
42 Experiences and Perspectives of Young Workers

Appendix A. Technical Appendix on Survey Methodology
The Survey of Young Workers was designed by Fed-
eral Reserve Board staff and administered by GfK,
an online consumer research company, on behalf of
the Board. In order to create a nationally representa-
tive probability-based sample, GfK’s Knowledge-
Panel® selected respondents based on both random
digit dialing and address-based sampling (ABS).
Since 2009, new respondents have been recruited
using ABS. To recruit respondents, GfK sends out
mailings to a random selection of residential postal
addresses. Out of 100 mailings, approximately 14
households contact GfK and express an interest in
joining the panel. Of those who contact GfK, three-
fourths complete the process and become members
of the panel.58 If the person contacted is interested
in participating but does not have a computer or
Internet access, GfK provides him or her with a lap-
top and access to the Internet. Panel respondents are
continuously lost to attrition and added to replenish
the panel, so the recruitment rate and enrollment
rate may vary over time.
There are several reasons that a probability-based
Internet panel was selected as the method for this
survey rather than an alternative survey method. The
first reason is that these types of Internet surveys
have been found to be representative of the popula-
tion.59 The second reason is that the ABS Internet
panel allows the same respondents to be
re-interviewed in subsequent surveys with relative
ease, as they remain in the panel for several years.
The third reason is that Internet panel surveys have
numerous existing data points on respondents from
previously administered surveys, including detailed
demographic and economic information. This allows
for the inclusion of additional information on
respondents without increasing respondent burden.
Last, collecting data through an ABS Internet panel
survey is cost-effective and can be done relatively
quickly.
A total of 4,135 KnowledgePanel® members
received e-mail invitations to complete this survey.
The e-mail invitations included 1,139 respondents
who participated in the Board’s 2013 Survey of
Young Workers (excluding those who exceeded the
age limit) and an additional 2,996 randomly selected
KnowledgePanel® respondents who did not partici-
pate in the previous survey. A total 2,035 people
responded to the e-mail request to participate and
completed the survey yielding a final stage comple-
tion rate of 49 percent.
To enhance the completion rate, GfK sent e-mail
reminders to non-responders over the course of the
field period.60 GfK maintains an ongoing modest
incentive program to encourage KnowledgePanel®
members to participate. Incentives take the form of
raffles and lotteries with cash and other prizes.
Significant resources and infrastructure are devoted
to the recruitment process for the KnowledgePanel®
so that the resulting panel can properly represent the
young adult population of the United States. Conse-
quently, the raw distribution of KnowledgePanel®
mirrors that of U.S. adults fairly closely, baring occa-
sional disparities that may emerge for certain sub-
groups because of differential attrition rates among
recruited panel members.
The selection methodology for general population
samples from the KnowledgePanel® ensures that the
resulting samples behave as an equal probability of
selection method (EPSEM) samples. This methodol-
ogy starts by weighting the entire KnowledgePanel®
to the benchmarks secured from the latest March
58 For further details on the KnowledgePanel® sampling method-ology and comparisons between KnowledgePanel® and tele-phone surveys, see www.knowledgenetworks.com/accuracy/spring2010/disogra-spring10.html.
59 David S. Yeager, Jon A. Krosnick, LinChiat Chang, Harold S. Javitz, Matthew S. Levendusky, Alberto Simpser, and Rui Wang, “Comparing the Accuracy of RDD Telephone Surveys and Internet Surveys Conducted with Probability and Non-Probability Samples,” Public Opinion Quarterly 75, no. 4 (Win-ter 2011): 709–47.
60 Additional e-mail reminders to non-responders were sent on day 6, 9, and 12 of the field period.
43

supplement of the Current Population Survey (CPS)
along several dimensions. This way, the weighted dis-
tribution of the KnowledgePanel® matches that of
U.S. adults. Typically, the geo-demographic dimen-
sions used for weighting the entire Knowl-
edgePanel® include gender, age, race/ethnicity, edu-
cation, census region, household income, homeown-
ership status, metropolitan area status, and Internet
access.
Using the above weights as the measure of size
(MOS) for each panel member, in the next step a
probability proportional to size (PPS) procedure is
used to select study specific samples. It is the applica-
tion of this PPS methodology with the above MOS
values that produces fully self-weighing samples from
KnowledgePanel®, for which each sample member
can carry a design weight of unity. Moreover, in
instances where the study design has required any
form of oversampling of specific subgroups, such
departures from an EPSEM design are corrected by
adjusting the corresponding design weights accord-
ingly with the CPS benchmarks serving as reference
points.
Once the sample has been selected and fielded, and
all the study data are collected and made final, a
post-stratification process is used to adjust for any
survey non-response as well as any non-coverage or
under- and oversampling resulting from the study
specific sample design. The following variables were
used for the adjustment of weights for this study:
gender, age, race/ethnicity, education, census region,
residence in a metropolitan area, household income,
and access to the Internet. Demographic and geo-
graphic distributions for the noninstitutionalized
civilian population ages 18 and over from the CPS
are used as benchmarks in this adjustment.
Although weights allow the sample population to
match the U.S. population based on observable char-
acteristics, similar to all survey methods, it remains
possible that non-coverage or non-response results in
differences between the sample population and the
U.S. population that are not corrected using weights.
44 Experiences and Perspectives of Young Workers

Appendix B: Survey of Young Workers—Questionnaire
Below is a reproduction of the survey instrument in its entirety. The bracketed text
are programming instructions that indicate whether the respondent can select only
a single response [S] or multiple responses [M]. Not all questions are shown to all
respondents, and the skip patterns used to reach each question are listed as the
“Base” above each question. The respondents only see the questions and response
options; they do not see the program code. Question numbers are not always
sequential in order to preserve continuity with question numbers from earlier sur-
veys where possible. Questions are listed below in the order in which they are
presented.
A Introduction
Base: All respondents
[S] [PROMPT]
Q3. What is the highest level of formal education you have completed?
1. Less than high school
2. High school diploma or equivalent GED
3. Some college, no degree or certification (including currently enrolled in college)
4. Certificate or technical degree
5. Associate degree
6. Bachelor's degree
7. Master's degree
8. Professional or Doctorate degree
9. Other: Specify [TEXTBOX]
IF Q3=REFUSED, TERMINATE, INSERT STANDARD CLOSE, AND MARK
AS QFLAG=2
45

Base: All respondents
[S] [PROMPT]
Q4. Are you currently working as a paid employee?
1. Yes
2. No
IF Q4=REFUSED, TERMINATE, INSERT STANDARD CLOSE, AND MARK
AS QFLAG=2
Base: Working as a paid employee (Q4=1)
[S] [PROMPT]
Q5. Are you currently employed full-time? That is, do you typically work 35 hours
or more per week at one job?
1. Yes
2. No
IF Q5=REFUSED, TERMINATE, INSERT STANDARD CLOSE, AND MARK
AS QFLAG=2
Base: (IF Q4=2)
[S] [PROMPT]
Q8A. Are you currently looking for a paid job?
1. Yes
2. No
IF Q8A=REFUSED, TERMINATE, INSERT STANDARD CLOSE, AND
MARK AS QFLAG=2
Base: Working as a paid employee (Q4=1 and Q5=1)
[Show Q6_A only if Q5=1]
[PROMPT IF Q6_A = 0 OR REFUSED WITH “You mentioned in a previous
question that you are currently employed full time. Please confirm the answer
below is correct before submitting your response.
[NUMBER BOX, RANGE 0-10]
Q6_A. How many full-time paid jobs did you work at this week?
46 Experiences and Perspectives of Young Workers

Base: Working as a paid employee (Q4=1 and Q5=2)
[PROMPT: “You mentioned in a previous question that you are currently
employed. Please confirm the answer below is correct before submitting your
response.”]
[NUMBER BOX, RANGE 0-10]
Q6_B. How many part-time paid jobs did you work at this week?
Base: Working as a paid employee (Q4=1)
[S]
Q7. For your main job, that is the job where you work the most hours, what type
of organization are you employed by?
1. Government
2. For profit
3. Non-profit
Base: Working as a paid employee (Q4=1)
[S]
Q7A. Is your main job, that is the job where you work the most hours, permanent/
long-term or temporary?
1. Permanent/long-term
2. Temporary
3. I don't know
December 2016 47

Base: Paid employee and main job temporary/don’t know ((IF Q4=1) and (Q7A=2 or 3))
[S]
Q7B. How did you find your main job?
1. I searched postings on my own
2. I used a temporary staffing agency
3. Career fair
4. Personal connection
5. Work study (or other student job)
6. Recruited by employer
7. Family business
8. Other: Specify [TEXTBOX]
48 Experiences and Perspectives of Young Workers

Base: (IF Q8A=2)
[GRID]
Q10. Please indicate whether each of the following reasons describes why you are
not looking for a paid job?
Down:
1. I am self-employed
2. I believe there is no work available for me
3. I need education / training to get a job
4. I am a student
5. I don't need or want a job
6. I have health problems
7. I am a homemaker / caring for family
8. I need transportation to get to and from work
9. I am disabled
10. I believe the work available does not pay enough to be worthwhile
11. Other: Specify [textbox]
Across:
1. Yes
2. No
Base: All qualified respondents
[S]
Q11. Do you currently:
1. Own a business
2. Run a non-profit enterprise
3. Neither
December 2016 49

Base: All qualified respondents
[S]
Q11A. Does anyone in your immediate family own a business or run a non-profit
enterprise?
1. Yes
2. No
3. I don't know
Base: Do not currently own a business or run a non-profit (Q11=3 OR refused)
[S]
Q12. Do you currently earn any money from activities where you are “your own
boss”?
1. Yes: Specify [TEXTBOX]
2. No
Base: All qualified respondents
[S]
Q13. Do you currently have an unpaid job, such as an internship or a volunteer
position?
1. Yes
2. No
Base: All qualified respondents
[S]
Q2. Would you say your expectations about future job opportunities are:
1. Optimistic
2. Pessimistic
3. Not sure
50 Experiences and Perspectives of Young Workers

Base: Expectations of future jobs are optimistic (Q2=1)
[GRID]
Q2aa. Please indicate whether any of the following factors listed below contribute
to your current feelings of optimism about your future job opportunities.
Down:
1. My current level of education and training
2. My field of study
3. I will have enough education and training in the future
4. My previous work experience
5. There is demand for the type of work I do
6. My local labor market provides many job opportunities
Across:
1. Yes
2. No
Base: Expectations of future jobs are optimistic (Q2=1)
[LARGE TEXTBOX]
Q2a. Please use the following textbox to describe in detail any additional factors
that make you feel optimistic about your future job opportunities.
December 2016 51

Base: Expectations of future jobs are pessimistic (Q2=2)
[GRID]
Q2bb. Please indicate whether any of the following factors contribute to your cur-
rent feelings of pessimism about your future job opportunities.
Down:
1. My current level of education and training
2. My field of study
3. Lack of opportunities for education and training
4. Lack of previous work experience
5. Lack of demand for the type of work I do
6. My local labor market does not provide many job opportunities
Across:
1. Yes
2. No
Base: Expectations of future jobs are pessimistic (Q2=2)
[LARGE TEXTBOX]
Q2b. Please use the following textbox to describe in detail any additional factors
that make you feel pessimistic about your future job opportunities.
52 Experiences and Perspectives of Young Workers

Base: Not sure about expectations of future jobs (Q2=3)
[GRID]
Q2cc. Please indicate whether any of the following factors contribute to your feel-
ings of being unsure about your future job opportunities.
Down:
1. My current level of education and training
2. My field of study
3. Future opportunities for education and training
4. My previous work experience
5. The demand for the type of work I do
6. My local labor market
Across:
1. Yes
2. No
Base: Not sure about expectations of future jobs (Q2=3)
[LARGE TEXTBOX]
Q2c. Please use the following textbox to describe in detail any additional factors
that make you feel unsure about your future job opportunities.
Base: Working as a paid employee (Q4=1)
[S]
Q16. How are you paid at your main job (the job where you currently work the
most hours)?
1. Hourly wage
2. Salary
3. Other [TEXTBOX]
December 2016 53

Base: Paid hourly wage (Q16=1)
[NUMBER BOX RANGE 1-99.99 (CREATE ONE NUMBER BOX, ALLOW
UP TO TWO ENTRIES TO THE RIGHT OF THE DECIMAL PLACE)]
Q17. Approximately what is your hourly wage, before taxes, at your main job
(include tips, overtime, and bonuses)?
Base: Paid salary/other (Q16=2, 3)
[SHOW Q18 AND Q18Y ON SAME PAGE]
[NUMBER BOX RANGE 1 – 999999]
Q18. Approximately what is your salary, before taxes, at your main job (include
tips, overtime, and bonuses)?
Base: Paid salary/other (Q16=2, 3)
[S]
Q18Y. Do you earn this amount:
1. weekly
2. bi-weekly
3. monthly
4. annually
Base: All qualified respondents
[S]
18X. Which one of the following BEST describes who you are living with?
1. Living alone
2. Living with your immediate family (i.e., spouse/partner and/or dependent
children)
3. Living with your parents (or your spouse/partner's parents)
4. Living with your extended family (e.g., siblings, cousins)
5. Living with roommate(s)
54 Experiences and Perspectives of Young Workers

Base: All qualified respondents
[S]
18Z. Do you (and your spouse or partner) pay rent or a mortgage at your current
living arrangement?
1. (My partner and) I pay the full mortgage or rent
2. (My partner and) I contribute to mortgage or rent
3. (My partner and) I do not pay the mortgage or rent
Base: All qualified respondents
[S]
Q18A. As a household, are you able to cover monthly expenses with your current
household income?
1. Yes, my household can always cover monthly expenses
2. No, sometimes my household is not able to cover monthly expenses
3. No, my household can never cover monthly expenses
December 2016 55
Base: Not able to cover monthly expenses (Q18A=2, 3)
[GRID]
Q18AA. In the months that you are unable to cover your monthly expenses, please
indicate whether you use any of the following resources to meet this monthly
challenge.
Down:
1. I borrow money from family
2. I borrow money from friends
3. I do not pay full balance on my credit card(s) / I increase my credit card balance
4. I do not pay some or all of my bills
5. I take out a loan (e.g., payday loan, home equity loan)
6. I use my savings
7. I reduce my monthly expenses
8. Other: Specify [TEXTBOX]
Across:
1. Yes
2. No
Base: All qualified respondents
[S]
Q18C. Did you incur debt to pay for any portion of your education or training?
1. Yes
2. No
56 Experiences and Perspectives of Young Workers

Base: All qualified respondents
[GRID]
Q18D. Please check off any of the following expenses that your parents or other
family members currently help you with financially (please do not include assis-
tance from your spouse/partner):
Down:
1. Living situation (e.g., mortgage, rent, or just living with parents or relatives)
2. Healthcare costs
3. Car payment / insurance / maintenance
4. Education tuition / loans
5. Food
6. Miscellaneous bills (e.g., cell phone bill, Amazon Prime)
7. Savings
8. Expenses for children
9. Other: Specify [TEXTBOX]
Across:
1. Yes
2. No
December 2016 57

Base: All qualified respondents
[S]
Q19A. What was the primary language spoken in your home when you were
growing up?
1. Arabic
2. Chinese
3. English
4. French
5. German
6. Korean
7. Russian
8. Spanish
9. Tagalog
10. Vietnamese
11. Other: Specify [TEXTBOX]
58 Experiences and Perspectives of Young Workers

Base: All qualified respondents
[S]
Q19B. What was the highest level of education achieved by your mother and
father? If not the same, please indicate the education achieved by the parent who
obtained the greatest level of education.
1. Less than high school
2. High school diploma or equivalent GED
3. Some college, no degree or certification (including currently enrolled in college)
4. Certificate or technical degree
5. Associate degree
6. Bachelor's degree
7. Master's degree
8. Professional or Doctorate degree
9. I don't know
B Education and Training
Base: At least some college (Q3 ge 3)
[SMALL TEXT BOX]
Q19Y.
1. [if Q3 = 3] What is the name of the school you are enrolled in, or were most
recently enrolled in?
2. [if Q3 = 4] What is the name of the school where you most recently earned a
certificate or technical degree?
3. [if Q3 = 5] What is the name of the school from which you received your Asso-
ciate degree?
4. [if Q3 = 6 - 8] What is the name of the school from which you received your
Bachelor’s degree?
December 2016 59

Base: At least some college (Q3 ge 3)
[S]
Q19X. Which one of the following broad categories best describes your most
recent educational program?
1. Humanities
2. Social/behavioral sciences
3. Life sciences
4. Physical sciences/math
5. Computer/information sciences
6. Engineering
7. Education
8. Business/management
9. Health
10. Law
11. Vocational/technical training
12. Undeclared
13. Other: Specify [TEXTBOX]
Base: All qualified respondents
[S]
Q20. Do you believe you now have the level of education and training needed for
the type of job that you would like to hold in the next 5 years?
1. Yes
2. No
3. I don't know
60 Experiences and Perspectives of Young Workers

Base: Need more education (Q20=2)
[GRID]
Q20A. Why do you believe you need more education?
Down:
1. I want to change job/career
2. I want greater opportunities for promotions and advancement
3. My family expects me to have a higher level of education
4. The labor market demands a higher level of education
5. My line of work requires more education
6. I need more education to land a job
7. Other: Specify [TEXTBOX]
Across:
1. Yes
2. No
Base: All qualified respondents
[S]
Q21. Are you currently enrolled in a certificate or degree program?
1. Yes
2. No
Base: Not currently enrolled in certificate/degree program (Q21=2)
[S]
Q21A. You just reported that you are not enrolled in a certificate or degree pro-
gram. Have you started a certificate or degree program that you have not yet
completed?
1. Yes
2. No
December 2016 61

Base: Started a certificate program but have not completed
(Q21A=1)
[S]
Q21B. How long has it been since you were enrolled in the certificate or degree
program that you started?
1. Less than one year
2. One to two years
3. More than two years
4. I don't know
Base: Started a certificate program but have not completed (Q21A=1)
[S]
Q21C. How likely are you to complete the certificate or degree program that you
started?
1. I definitely will complete the program
2. I probably will complete the program
3. I am not sure if I will complete the program
4. I probably will not complete the program
5. I definitely will not complete the program
62 Experiences and Perspectives of Young Workers

Base: Not sure/probably will not/definitely will not complete certification/degree program
(Q21C=3-5)
[GRID]
Q21CC. Please indicate whether any of the following reasons describe why you
may not complete the certificate or degree program you started.
Across:
1. I don't believe the program will improve my job opportunities
2. I need to work instead
3. I can't afford to complete
4. I don't want to borrow (more) money to complete
5. I have family responsibilities
6. The program is too challenging
7. I am concerned that even after the program, I will not land a job in my field of
interest
8. Other: Specify [TEXTBOX]
Down:
1. Yes
2. No
Base: Currently enrolled in certificate/degree program (Q21=1)
[S]
Q22. Are you currently enrolled full-time or part-time?
1. Full-time
2. Part-time
December 2016 63

Base: Currently enrolled in certificate/degree program (Q21=1)
[S]
Q23. What type of certification or degree program are you enrolled in?
1. High school diploma or equivalent GED
2. Certificate or technical degree
3. Associate degree
4. Bachelor's degree
5. Master's degree
6. Professional or Doctorate degree
7. Other: Specify [TEXTBOX]
Base: Currently enrolled in certificate/degree program (Q21=1)
[S]
Q23A. Do you attend classes in person or online?
1. In person
2. Online
3. Both
Base: All qualified respondents
[S]
Q23C. Are you currently enrolled in any training program that will not lead to a
certificate or degree?
1. Yes
2. No
Base: Enrolled in a training program (Q23C=1)
[TEXTBOX]
Q23D. What type of training program are you enrolled in?
64 Experiences and Perspectives of Young Workers

Base: At least some college education (Q3=3-8)
[GRID]
Q24. Please indicate whether you used any of the following forms of financing for
your most recent educational program.
Down:
1. I paid with my own savings
2. I worked while in school
3. My parents contributed (with or without the use of loans)
4. Financial-aid based grant (including Pell Grant and FAFSA grants)
5. Financial-aid based loans (including FAFSA loans)
6. Tuition reimbursement from employer (including military)
7. Academic scholarship
8. Other: Specify [textbox]
Across:
1. Yes
2. No
Base: All qualified respondents
[S]
Q24b. How would you say the lifetime financial benefits of your most recent edu-
cational program compare to the financial costs of this education?
1. The financial benefits are MUCH LARGER than the costs
2. The financial benefits are SOMEWHAT LARGER than the costs
3. The financial benefits are ABOUT THE SAME as the costs
4. The financial benefits are SOMEWHAT SMALLER than the costs
5. The financial benefits are MUCH SMALLER than the costs
6. I don't know
December 2016 65

Base: Currently enrolled in certificate or degree program and at least an Associate’s
degree
(Q21=1 and Q3=5-8)
[S]
Q24C. How would you say the financial benefits of your undergraduate educa-
tional program compare to the financial costs of this education?
1. The financial benefits are MUCH LARGER than the costs
2. The financial benefits are SOMEWHAT LARGER than the costs
3. The financial benefits are ABOUT THE SAME as the costs
4. The financial benefits are SOMEWHAT SMALLER than the costs
5. The financial benefits are MUCH SMALLER than the costs
6. I don't know
Base: Financial benefits MUCH LARGER/SOMEWHAT LARGER than the costs (24C=1-2)
[LARGE TEXTBOX]
Q24D. Please explain why you believe the financial benefits of your undergraduate
program are larger than the costs.
: Financial benefits ABOUT THE SAME/don’t know (24C=3 or 6)
[LARGE TEXTBOX]
Q24E. Please explain why you do not believe the financial benefits of your under-
graduate program are larger or smaller than the costs.
Base: Financial benefits SOMEWHAT SMALLER/MUCH SMALLER than the costs (24C=4-5)
[LARGE TEXTBOX]
Q24DD. Please explain why you believe the financial benefits of your undergradu-
ate program are smaller than the costs.
66 Experiences and Perspectives of Young Workers

Base: Not currently enrolled in certificate/degree program/refused (Q21=2 or refused)
[S]
Q25. Are you interested in obtaining additional education or training?
1. Yes
2. No
3. I don't know
Base: Interested in obtaining additional education/training/don’t know (Q25=1 or 3)
[S]
Q26. Seeing as you may be interested in additional education or training, please
indicate the primary reason you are not enrolled:
1. I don't know which program will improve my job opportunities
2. I don't know where to enroll
3. I can't afford to enroll
4. I don't want to borrow money to enroll
5. I don't meet the requirements to enroll
6. The schedule does not work for me
7. The program is not offered at my local institutions
8. I am concerned that the program will be too challenging
9. I am concerned that even after the program, I will not land a job in my field of
interest
10. I have family responsibilities
11. I am in the process of applying
12. I am gaining work experience
December 2016 67

Base: Interested in obtaining additional education/training/don’t know (Q25=1 or 3)
[GRID]
Q26A. Seeing as you may be interested in additional education, please indicate
how much each of these other reasons describe why you are not enrolled:
Down:
1. I don't know which program will improve my job opportunities
2. I don't know where to enroll
3. I can't afford to enroll
4. I don't want to borrow money to enroll
5. I don't meet the requirements to enroll
6. The schedule does not work for me
7. The program is not offered at my local institutions
8. I am concerned that the program will be too challenging
9. I am concerned that even after the program, I will not land a job in my field of
interest
10. I have family responsibilities
11. I am in the process of applying
12. I am gaining work experience
Across:
A. Very much describes why I am not enrolled
B. Somewhat describes why I am not enrolled
C. Does not describe why I am not enrolled
Base: All qualified respondents
[S]
Q27. During high school, did you work for pay?
1. Yes
2. No
68 Experiences and Perspectives of Young Workers

Base: All qualified respondents
[S]
Q28. During high school, did you receive information about jobs and careers?
1. Yes
2. No
3. I don't know
4. I did not attend high school
Base: Received info about jobs/careers in high school (Q28=1)
[M]
Q29. During high school, where did you obtain information about jobs and
careers?
1. Parent(s)
2. Friends and family
3. High school teacher or counselor
4. Online research
5. Employment services agency
6. A business where I worked
7. Other: Specify [TEXTBOX]
Base: Received info about jobs/careers in high school from high school teacher or coun-
selor
(Q28=1 and Q29=3)
[S]
Q30. Did the information you received from your high school help you get a job?
1. Yes
2. No
3. I don't know
December 2016 69

Base: At least some college education (Q3=3-8)
[S]
Q31. During college, did you work for pay?
1. Yes
2. No
Base: At least some college education (Q3=3-8)
[S]
Q32. During college, did you hold an internship(s)?
1. Yes, one or more paid internships
2. Yes, one or more unpaid internships
3. Yes, both paid and unpaid internships
4. No, I did not hold an internship
Base: Held an internship during college (Q32=1-3)
[S]
Q32A. Did you receive academic credit for the internship?
1. Yes
2. No
Base: Held an internship during college (Q32=1-3)
[S]
Q32B. Was the internship worthwhile?
1. Yes, it led to a job
2. Yes, it improved my skills
3. Yes, it led to other benefits: [TEXTBOX]
4. No, it was not worth it
5. I don't know
70 Experiences and Perspectives of Young Workers

Base: At least some college education and worked for pay/held one or more internships
during college ((Q3=3-8) and (Q31=1 OR Q32=1-3))
[S]
Q33. During college, did you work or intern during the school year?
1. Yes
2. No
Base: At least some college education (Q3=3-8)
[S]
Q34. During college, did you receive information about jobs and careers?
1. Yes
2. No
3. I don't know
Base: At least some college education and received info about jobs and careers in college
(Q3=3-8 AND Q34=1)
[M]
Q35. During college, where did you obtain information about jobs and careers?
1. Parent(s)
2. Friends and family
3. College professor or counselor
4. Online research
5. Employment services agency
6. A business where I worked
7. On-campus recruitment
8. Career fair (not sponsored by college)
9. Other: Specify [TEXTBOX]
December 2016 71

Base: At least some college education and received info about jobs and careers from col-
lege professor or counselor (Q3=3-8 AND Q34=1 AND Q35=3)
[S]
Q36. Did the information you received from your college help you get a job?
1. Yes
2. No
3. I don't know
C Current Job
Base: Working as a paid employee (Q4=1)
[S]
Q37. Are you working in a career field that is closely related to your education
and training?
1. Yes
2. No
3. I don't know
Base: Working as a paid employee and currently enrolled in a certificate or degree program
(Q4=1 and Q21=1)
[S]
Q37A. Are you currently working on campus (e.g., work study, Residents Assis-
tant, Research Assistant)?
1. Yes
2. No
72 Experiences and Perspectives of Young Workers

Base: Working as a paid employee (Q4=1)
[S]
Q38. How qualified would you describe yourself for performing the tasks required
of your main job (the job where you work the most hours)? Do you think you
are…
1. Overqualified
2. Adequately qualified
3. In need of additional training
Base: Working as a paid employee (Q4=1)
[S]
Q39. Do you consider your main job (the job where you work the most hours) to
be a career, a stepping stone to a career, or just a job to get you by?
1. Career
2. Stepping stone to a career
3. Just a job
December 2016 73

Base: Working as a paid employee (Q4=1)
[GRID]
Q40. When you last searched for a job, please indicate whether you used each of
the following strategies during the whole process:
Down:
1. I contacted the employer directly
2. My parent(s) provided a contact
3. Other family and friends provided a contact
4. Services from school, teacher, professor, or counselor
5. Services from an employment center
6. Searched electronic job boards (e.g., Monster, CareerBuilder, Craigslist, Indeed,
local government job board)
7. Posted online resume / advertisement (e.g., LinkedIn, Twitter, Facebook,
Craigslist)
8. Career fair
9. Recruited by employer
10. New job within company I was already employed by
11. Other: Specify [TEXTBOX]
Across:
1. Yes
2. No
Base: Working as a paid employee (Q4=1)
[S]
Q41. Have you been promoted with a pay increase since you started your main job
(the job where you work the most hours)?
1. Yes
2. No
74 Experiences and Perspectives of Young Workers
Base: Working as a paid employee and have not been promoted/refused (Q4=1 and Q41=2,
refused)
[S]
Q42. Are there opportunities for advancement with a pay increase at your main
job (the job where you work the most hours)?
1. Yes
2. No
3. I don't know
Base: Working as a paid employee and has opportunities for advancement (Q4=1 and
Q42=1)
[S]
Q43. How quickly do you expect to be promoted?
1. Within the next 6 months
2. Within the next year
3. Within the next 2 years
4. In more than 2 years
5. I do not expect to be promoted
6. I don't know
Base: Working as a paid employee (Q4=1)
[NUMBER BOX 0-168]
Q44. How many hours did you work last week at all of your paid jobs combined?
Base: Working as a paid employee (Q4=1)
[S]
Q45. Compared to the number of hours you worked last week, would you pre-
fer to:
1. Work more hours
2. Work about the same number of hours
3. Work less hours
December 2016 75

Base: Working as a paid employee and prefer to work more hours (Q4=1 and Q45=1)
[S]
Q46. What is the main reason you are seeking more hours?
1. To pay my living expenses
2. To pay off debt
3. To increase my savings
4. To gain more work experience
5. Other: Specify [TEXTBOX]
Base: Working as a paid employee (Q4=1)
[S]
Q48. Is your work schedule for your job or jobs:
1. Fairly consistent
2. Changes day-to-day
3. Changes week-to-week
4. Changes month-to-month
: Working as a paid employee (Q4=1)
[S]
Q48A. Are more than half of your work hours "non-standard" hours (e.g., night
shift, swing shift, weekends)?
1. Yes
2. No
3. I don't know
76 Experiences and Perspectives of Young Workers

Base: Working as a paid employee and not currently employed full time (Q4=1 and Q5=2)
[GRID]
Q49. Please indicate whether each of the following is a reason that you are cur-
rently working part-time rather than full-time:
Down:
1. I prefer part-time work
2. My employer cut my hours due to business conditions
3. I could only find part-time work
4. I am enrolled in school/training program
5. I am caring for young children
6. I have family responsibilities
7. I have health problems
8. Other: Specify [textbox]
Across:
1. Yes
2. No
Base: Working as a paid employee and not currently employed full time (Q4=1 and Q5=2)
[S]
Q50. A year from now, do you expect to have a full-time job (35 hours or more
per week) with a single employer?
1. Yes
2. No
3. I don't know
December 2016 77

Base: Working as a paid employee and not currently employed full time (Q4=1 and Q5=2)
[S]
Q51. A year from now do you expect to be working full-time (35 hours or more
per week), but for more than one employer?
1. Yes
2. No
3. I don't know
Base: Working as a paid employee (Q4=1)
[S]
Q52. How long have you been employed at your main job, the job where you work
the most hours?
1. Less than 2 months
2. 2 to 6 months
3. More than 6 months, but less than 1 year
4. 1 to 2 years
5. More than 2 years
Base: Working as a paid employee (Q4=1)
[S]
Q53. Do you think you can continue to work at your main job as long as you
wish?
1. Yes
2. No
3. I don't know
78 Experiences and Perspectives of Young Workers

Base: Working as a paid employee (Q4=1)
[S]
Q54. How much longer do you expect to be at your main job (the job where you
work the most hours)?
1. Less than 2 months
2. 2 to 6 months
3. More than 6 months, but less than 1 year
4. 1 to 2 years
5. More than 2 years
6. I don't know
Base: Working as a paid employee and expect to be in main job no more than 1 year or less
(Q4=1 and Q54=1-3)
[S][RANDOMIZE 1-9 ITEMS]
Q55. What is the most important reason you expect to leave your main job within
a year?
1. Job is temporary
2. Business conditions may cause my employer to cut back
3. New technology will eliminate my job
4. I want to be my own boss
5. I am moving
6. I will get another job
7. I will be attending school
8. Family responsibilities
9. I have health problems
10. Other: Specify [TEXTBOX]
December 2016 79

Base: Working as a paid employee (Q4=1)
[S]
Q57. Do you receive overtime pay, tips or commissions from any of your paid
jobs?
1. Yes
2. No
Base: Working as a paid employee (Q4=1)
[S]
Q58. How satisfied are you with the total amount of salary or wages you earn
from the paid job or jobs you now hold?
1. Very satisfied
2. Somewhat satisfied
3. Neither satisfied nor dissatisfied
4. Somewhat dissatisfied
5. Very dissatisfied
Base: Working as a paid employee (Q4=1)
[S]
Q59A. If you were out of work for the next 4 weeks, would you able to pay your
living expenses?
1. Yes
2. No
3. I don't know
80 Experiences and Perspectives of Young Workers

Base: Working as a paid employee (Q4=1 and Q59A = 1, 3))
[S]
Q59B. If you were out of work for the next 3 months, would you able to pay your
living expenses?
1. Yes
2. No
3. I don't know
Base: Working as a paid employee (Q4=1)
[S]
Q60. How satisfied are you with the benefits you currently receive from your
employer or employers?
1. Very satisfied
2. Somewhat satisfied
3. Neither satisfied nor dissatisfied
4. Somewhat dissatisfied
5. Very dissatisfied
Base: Working as a paid employee (Q4=1)
[S]
Q61. Do you receive paid time off for sick leave and/or holidays from any of your
paid jobs?
1. Yes
2. No
Base: Working as a paid employee (Q4=1)
[S]
Q62. Do you have health insurance from any source?
1. Yes
2. No
December 2016 81

Base: Working as a paid employee and have health insurance (Q4=1 and Q62=1)
[S]
Q63. Do you receive this health insurance either through an employer or employ-
ment agency?
1. Yes
2. No
Base: Working as a paid employee and receives health insurance through employer/
employment agency (Q4=1 and Q62=1 and Q63=1)
[S]
Q64. Does your employer pay for:
1. All of your health insurance premium
2. Part of your health insurance premium
3. None of your health insurance premium
Base: Working as a paid employee (Q4=1)
[S]
Q65. Do you have training opportunities through an employer or employers?
1. Yes
2. No
3. I don't know
82 Experiences and Perspectives of Young Workers

Base: Working as a paid employee (Q4=1)
[PROMPT ONCE IF THREE RESPONSES NOT PROVIDED; IF MORE
THAN THREE ENTRIES PROVIDED, PLEASE PROMPT WITH ERROR-
][SUPPRESS DEFAULT INSTRUCTIONS]
[NUMBER BOXES RANGE 1-3]
Q66. Please review the following benefits and rank the three benefits that are most
important to you to receive from an employer. If there is a benefit(s) that are not
provided in the list, there is room for you to write-in your own benefit preferences.
Please use “1” for the most important benefit, “2” for the second most important
benefit, and “3” for the third most important benefit.
1. [NUMBER BOX] Paid sick leave and/or holidays
2. [NUMBER BOX] Health insurance
3. [NUMBER BOX] Tuition reimbursement
4. [NUMBER BOX] Student loan repayment
5. [NUMBER BOX] Contribution to tax-deferred savings account (e.g., 401(k) or
retirement account)
6. [NUMBER BOX] Matching contributions to savings accounts
7. [NUMBER BOX] Professional training
8. [NUMBER BOX] Flexible schedule
9. [NUMBER BOX] Work-from-home capability
10. [NUMBER BOX] Other: Specify [TEXTBOX]
11. [NUMBER BOX] Other: Specify [TEXTBOX]
12. [NUMBER BOX] Other: Specify [TEXTBOX]
Base: Working as a paid employee (Q4=1)
[S]
Q67. Are you a member of a labor union or an employee association similar to a
union?
1. Yes
2. No
3. I don't know
December 2016 83

D Expectations
Base: All qualified respondents
[PROMPT IF Q68_A RESPONSE LT Q6_A RESPONSE]
[NUMBER BOX RANGE 0-99]
Q68A. How many full-time, paid jobs have you had during the past year?
Base: All qualified respondents
[PROMPT IF Q68_B RESPONSE LT Q6_B RESPONSE]
[NUMBER BOX RANGE 0-99]
Q68B. How many part-time, paid jobs have you had during the past year?
Base: More than one full time or part time job during the past year (Q68A and Q68B gt 1)
[S]
Q68C. Did you work at more than one of these jobs at the same time?
1. Yes
2. No
Base: More than one full time or part time job during the past year (Q68A and Q68B gt 1)
[S]
Q69D. How satisfied are you with your full- and part-time job arrangements over
the past year?
1. Very satisfied
2. Somewhat satisfied
3. Somewhat dissatisfied
4. Very dissatisfied
84 Experiences and Perspectives of Young Workers

Base: Very/somewhat satisfied with job arrangement (Q69D = 1-2)
[GRID]
69EE. Please indicate whether any of the following factors made you feel satisfied
with your job arrangements over the past five years.
Down:
1. Wages or Salary (including any bonus and tips)
2. Number of hours
3. Regular schedule
4. Flexible schedule
5. Opportunities for promotion/advancement
6. Friendly environment
7. Long-term position
8. Health insurance
9. Convenient location / easy commute
10. Good work experience for resume
11. Other: Specify [TEXTBOX]
Across:
1. Yes
2. No
December 2016 85

Base: Somewhat/very dissatisfied with job arrangement (Q69D = 3-4)
[GRID
69FF. Please indicate whether any of the following factors made you feel dissatis-
fied with your job arrangements over the past five years.
Down:
1. Wages or Salary (including any bonus and tips)
2. Too many hours
3. Too few hours
4. Schedule changes
5. Lack of opportunities for promotion/advancement
6. Stressful work environment
7. Temporary position
8. Lack of benefits
9. Location
10. Lack of job security
11. Other: Specify [TEXTBOX]
Across:
1. Yes
2. No
Base: All qualified respondents
[NUMBER BOX RANGE 0-99]
Q70A. Looking to the future, approximately how many full-time, paid jobs do you
expect to have in the next year?
Base: All qualified respondents
[NUMBER BOX RANGE 0-99]
Q70B Looking to the future, approximately how many part-time, paid jobs do you
expect to have in the next year?
86 Experiences and Perspectives of Young Workers

Base: Expect to have more than one job in the next year (Q70A and Q70B ge 2)
[S]
Q70C. Do you expect to work at more than one of these jobs at the same time?
1. Yes
2. No
Base: All qualified respondents
[S]
Q56. If you had to choose, is it more important to have a job that pays more or a
job that is more likely to provide steady employment?
1. Higher pay
2. Steady employment
Base: All qualified respondents
[S]
Q56A. If you had steady work for the next five years, would you prefer to have
one job or multiple jobs?
1. One job for the next five years
2. Multiple jobs over the next five years (Only one job at a time)
3. Multiple jobs over the next five years (Okay with more than one job at a time)
December 2016 87

Base: All qualified respondents
[S]
Q56B. When you think about your job future, not including campus jobs and
internships, what is the ideal amount of time to stay in the same job?
1. No more than one year
2. No more than two years
3. No more than five years
4. No more than ten years
5. There is no ideal amount of time to stay at a job
6. I don't know
Base: All qualified respondents
[S]
Q56D. When you reach your parents' current age, how do you expect your stan-
dard of living to compare to their current standard of living?
1. I expect to have a HIGHER STANDARD of living than my parents
2. I expect to have the SAME STANDARD of living as my parents
3. I expect to have a LOWER STANDARD of living than my parents
4. I don't know
END OF QUESTIONNAIRE
88 Experiences and Perspectives of Young Workers

Appendix C. Responses to Survey Questionnaire
The question numbers noted here correspond to the
numbering in the survey database. Although some
numbers have been skipped or reordered, it is impor-
tant to keep the numbering consistent for future
database users.
3. What is the highest level of formal education you have completed?
Q3 response Percent,
except as noted
Less than high school 8.73
High school diploma or equivalent GED 23.93
Some college, no degree or certification 28.92
Certificate or technical degree 3.63
Associate degree 9.74
Bachelor's degree 18.28
Master's degree 4.89
Professional or doctorate degree 1.45
Other: Specify 0.43
Number of responses 2,035
4. Are you currently working as a paid employee?
Q4 response Percent,
except as noted
Yes 68.69
No 31.31
Number of responses 2,035
5. Are you currently employed full time? That is, do you typically work 35 hours or more per week at one job?
Q5 response Percent,
except as noted
Yes 66.04
No 33.96
Number of responses 1,468
8A. Are you currently looking for a paid job?
Q8A response Percent,
except as noted
Yes 44.29
No 55.71
Number of responses 567
6A. How many full-time paid jobs did you work at this week?
Q6A response Percent,
except as noted
Refused 0.1
1 96.75
2 1.52
4 0.34
5 0.23
6 0.56
7 0.02
8 0.35
10 0.12
Number of responses 1,054
6B. How many part-time paid jobs did you work at this week?
Q6B response Percent,
except as noted
0 1.69
1 81.78
2 11.45
3 2.01
4 0.73
5 1.01
6 0.57
8 0.26
10 0.49
Number of responses 414
89

7. For your main job, that is the job where you work the most hours, what type of organization are you employed by?
Q7 response Percent,
except as noted
Refused 0.5
Government 12.45
For profit 73.15
Nonprofit 13.9
Number of responses 1,468
7A. Is your main job, that is the job where you work the most hours, permanent/long-term or temporary?
Q7A response Percent,
except as noted
Refused 0.43
Permanent/long-term 71.09
Temporary 20.6
I don't know 7.89
Number of responses 1,468
7B. How did you find your main job?
Q7B response Percent,
except as noted
I searched postings on my own 24.21
I used a temporary staffing agency 3.11
Career fair 3.42
Personal connection 33.05
Work study (or other student job) 19.7
Recruited by employer 5.82
Family business 2.29
Other: Specify 8.4
Number of responses 343
10. Please indicate whether each of the following reasons describes why you are not looking for a paid job:
Questionnaire number
Question and response Percent,
except as noted
10_1 I am self-employed
Refused 5.96
Yes 15.62
No 78.42
Number of responses 310
10_2 I believe there is no work available for me
Refused 7.92
Yes 7.48
No 84.59
(continued)
10. Please indicate whether each of the following reasons describes why you are not looking for a paid job:—continued
Questionnaire number
Question and response Percent,
except as noted
Number of responses 310
10_3 I need education/training to get a job
Refused 7.48
Yes 20.48
No 72.04
Number of responses 310
10_4 I am a student
Refused 4.91
Yes 45.47
No 49.62
Number of responses 310
10_5 I don't need or want a job
Refused 7.73
Yes 25.02
No 67.26
Number of responses 310
10_6 I have health problems
Refused 5.76
Yes 14.65
No 79.59
Number of responses 310
10_7 I am a homemaker/caring for family
Refused 5.38
Yes 32.26
No 62.37
Number of responses 310
10_8 I need transportation to get to and from work
Refused 7.28
Yes 10.96
No 81.76
Number of responses 310
10_9 I am disabled
Refused 6.6
Yes 14.03
No 79.37
Number of responses 310
10_10 I believe the work available does not pay enough to be worthwhile
Refused 7.73
Yes 9.81
No 82.46
Number of responses 310
10_11 Other: Specify
Refused 42.65
(continued)
90 Experiences and Perspectives of Young Workers

10. Please indicate whether each of the following reasons describes why you are not looking for a paid job:—continued
Questionnaire number
Question and response Percent,
except as noted
Yes 5.48
No 51.88
Number of responses 310
11. Do you currently
Q11 response Percent,
except as noted
Refused 0.33
Own a business 4.04
Run a nonprofit enterprise 1.66
Neither 93.97
Number of responses 2,035
11A. Does anyone in your immediate family own a business or run a nonprofit enterprise?
Q11A response Percent,
except as noted
Refused 0.05
Yes 16.07
No 78.02
I don't know 5.86
Number of responses 2,035
12. Do you currently earn any money from activities where you are “your own boss”?
Q12 response Percent,
except as noted
Refused 0.03
Yes: specify 8.76
No 91.22
Number of responses 1,928
13. Do you currently have an unpaid job, such as an internship or a volunteer position?
Q13 response Percent,
except as noted
Refused 0.31
Yes 10.83
No 88.87
Number of responses 2,035
2. Would you say your expectations about future job opportunities are
Q2 response Percent,
except as noted
Refused 0.28
Optimistic 60.9
Pessimistic 10.44
Not sure 28.38
Number of responses 2,035
2AA. Please indicate whether any of the following factors listed below contribute to your current feelings of optimism about your future job opportunities:
Questionnaire number
Question and response Percent,
except as noted
2AA_1 My current level of education and training
Refused 0.4
Yes 77.61
No 21.99
Number of responses 1,230
2AA_2 My field of study
Refused 0.59
Yes 75.52
No 23.89
Number of responses 1,230
2AA_3 I will have enough education and training in the future
Refused 0.58
Yes 81.14
No 18.28
Number of responses 1,230
2AA_4 My previous work experience
Refused 0.68
Yes 72.43
No 26.88
Number of responses 1,230
2AA_5 There is demand for the type of work I do
Refused 0.71
Yes 77.38
No 21.91
Number of responses 1,230
2AA_6 My local labor market provides many job opportunities
Refused 1.22
Yes 57.04
No 41.74
Number of responses 1,230
December 2016 91

2A. Please use the following text box to describe in
detail any additional factors that make you feel opti-
mistic about your future job opportunities.
[TEXT BOX]
2BB. Please indicate whether any of the following factors contribute to your current feelings of pessimism about your future job opportunities:
Questionnaire number
Question and response Percent,
except as noted
2BB_1 My current level of education and training
Refused 0.84
Yes 66.96
No 32.20
Number of responses 219
2BB_2 My field of study
Refused 1.36
Yes 47.43
No 51.22
Number of responses 219
2BB_3 Lack of opportunities for education and training
Refused 1.36
Yes 51.11
No 47.53
Number of responses 219
2BB_4 Lack of previous work experience
Refused 0.65
Yes 68.24
No 31.11
Number of responses 219
2BB_5 Lack of demand for the type of work I do
Refused 1.17
Yes 46.52
No 52.32
Number of responses 219
2BB_6 My local labor market does not provide many job opportunities
Refused 0.04
Yes 56.88
No 43.08
Number of responses 219
2B. Please use the following text box to describe in
detail any additional factors that make you feel pessi-
mistic about your future job opportunities.
[TEXT BOX]
2CC. Please indicate whether any of the following factors contribute to your feelings of being unsure about your future job opportunities:
Questionnaire number
Question and response Percent,
except as noted
2CC_1 My current level of education and training
Refused 0.47
Yes 50.89
No 48.64
Number of responses 580
2CC_2 My field of study
Refused 0.91
Yes 34.28
No 64.81
Number of responses 580
2CC_3 Future opportunities for education and training
Refused 0.65
Yes 37.4
No 61.95
Number of responses 580
2CC_4 My previous work experience
Refused 0.71
Yes 35.72
No 63.57
Number of responses 580
2CC_5 The demand for the type of work I do
Refused 0.81
Yes 35.5
No 63.69
Number of responses 580
2CC_6 My local labor market
Refused 1.67
Yes 42.19
No 56.14
Number of responses 580
2C. Please use the following text box to describe in
detail any additional factors that make you feel
unsure about your future job opportunities.
[TEXT BOX]
92 Experiences and Perspectives of Young Workers

16. How are you paid at your main job (the job where you currently work the most hours)?
Q16 response Percent,
except as noted
Refused 0.05
Hourly wage 70.99
Salary 25.59
Other 3.37
Number of responses 1,468
17. Approximately what is your hourly wage, before taxes, at your main job (include tips, overtime, and bonuses)?
Q17 response Dollars
Mean 14.09
Minimum 1
Maximum 99.99
Standard deviation 10.01
Number of responses 912
18. Approximately what is your salary, before taxes, at your main job (include tips, overtime, and bonuses)?
Q18 response Dollars
Mean 38,174.81
Minimum 1
Maximum 215,000
Standard deviation 34,678.77
Number of responses 475
18Y. Do you earn this amount
Q18Y response Percent,
except as noted
Refused 1.11
Weekly 14.11
Bi-weekly 26.41
Monthly 13.34
Annually 45.03
Number of responses 516
18X. Which one of the following BEST describes who you are living with?
Q18X response Percent,
except as noted
Refused 0.37
Living alone 8.31
(continued)
18X. Which one of the following BEST describes who you are living with?—continued
Q18X response Percent,
except as noted
Living with your immediate family (i.e., spouse/partner and/or dependent children) 36.65
Living with your parents (or your spouse/partner’s parents) 38.58
Living with your extended family (e.g., siblings, cousins) 2.8
Living with roommate(s) 13.29
Number of responses 2,035
18Z. Do you (and your spouse or partner) pay rent or a mortgage at your current living arrangement?
Q18Z response Percent,
except as noted
Refused 2.55
(My partner and) I pay the full mortgage or rent 40.61
(My partner and) I contribute to mortgage or rent 17.43
(My partner and) I do not pay the mortgage or rent 39.41
Number of responses 2,035
18A. As a household, are you able to cover monthly expenses with your current household income?
Q18A response Percent,
except as noted
Refused 1.39
Yes, my household can always cover monthly expenses 73.8
No, sometimes my household is not able to cover monthly expenses 20.24
No, my household can never cover monthly expenses 4.56
Number of responses 2,035
December 2016 93

18AA. In the months that you are unable to cover your monthly expenses, please indicate whether you use any of the following resources to meet this monthly challenge:
Questionnaire number
Question and response Percent,
except as noted
18AA_1 I borrow money from family
Refused 1.24
Yes 55.17
No 43.59
Number of responses 529
18AA_2 I borrow money from friends
Refused 1.78
Yes 17.23
No 80.99
Number of responses 529
18AA_3 I do not pay full balance on my credit card(s)/I increase my credit card balance
Refused 1.48
Yes 41.31
No 57.21
Number of responses 529
18AA_4 I do not pay some or all of my bills
Refused 0.41
Yes 51.07
No 48.52
Number of responses 529
18AA_5 I take out a loan (e.g., payday loan, home-equity loan)
Refused 1.42
Yes 16.81
No 81.78
Number of responses 529
18AA_6 I use my savings
Refused 1.13
Yes 40.87
No 57.99
Number of responses 529
18AA_7 I reduce my monthly expenses
Refused 0.43
Yes 64.13
No 35.43
Number of responses 529
18AA_8 Other: specify
Refused 43.7
Yes 4.07
No 52.23
Number of responses 529
18C. Did you incur debt to pay for any portion of your education or training?
Q18C response Percent,
except as noted
Refused 0.36
Yes 36.44
No 63.2
Number of responses 2,035
18D. Please check off any of the following expenses that your parents or other family members currently help you with financially (please do not include assistance from your spouse/partner):
Questionnaire number
Question and response Percent,
except as noted
18D_1 Living situation (e.g., mortgage, rent, or just living with parents or relatives)
Refused 0.48
Yes 47.56
No 51.96
Number of responses 2,035
18D_2 Health-care costs
Refused 0.36
Yes 36.01
No 63.63
Number of responses 2,035
18D_3 Car payment/insurance/maintenance
Refused 0.58
Yes 30.76
No 68.66
Number of responses 2,035
18D_4 Education tuition/loans
Refused 0.46
Yes 26.06
No 73.47
Number of responses 2,035
18D_5 Food
Refused 0.63
Yes 48.05
No 51.32
Number of responses 2,035
18D_6 Miscellaneous bills (e.g., cell phone bill, Amazon Prime)
Refused 0.4
Yes 40.11
No 59.48
(continued)
94 Experiences and Perspectives of Young Workers

18D. Please check off any of the following expenses that your parents or other family members currently help you with financially (please do not include assistance from your spouse/partner):—continued
Questionnaire number
Question and response Percent,
except as noted
Number of responses 2,035
18D_7 Savings
Refused 1.05
Yes 12.38
No 86.57
Number of responses 2,035
18D_8 Expenses for children
Refused 1.45
Yes 10.27
No 88.28
Number of responses 2,035
18D_9 Other: specify
Refused 32.86
Yes 2.15
No 65
Number of responses 2,035
18E. Do you use government programs to help you financially (e.g., TANF, Housing Voucher)? Please do not include student loans or grants here.
Q18E response Percent,
except as noted
Refused 0.15
Yes 9.45
No 90.4
Number of responses 2,035
19A. What was the primary language spoken in your home when you were growing up?
Q19A response Percent,
except as noted
Refused 0.29
Arabic 0.39
Chinese 1.67
English 85.82
French 0.06
German 0.18
Korean 0.54
Russian 0.26
Spanish 7.55
Tagalog 0.43
Vietnamese 0.46
Other: specify 2.34
Number of responses 2,035
19B. What was the highest level of education achieved by your mother and father?
If not the same, please indicate the education achieved by the parent who obtained the greatest level of education.
Q19B response Percent,
except as noted
Refused 0.19
Less than high school 6.85
High school diploma or equivalent GED 24.31
Some college, no degree or certification 13.28
Certificate or technical degree 5.53
Associate degree 8.6
Bachelor's degree 19.89
Master's degree 12.78
Professional or doctorate degree 5.36
I don't know 3.21
Number of responses 2,035
19Y.
1. [if Q3 = 3] What is the name of the school you
are enrolled in, or were most recently enrolled in?
2. [if Q3 = 4] What is the name of the school where
you most recently earned a certificate or technical
degree?
3. [if Q3 = 5] What is the name of the school from
which you received your associate degree?
4. [if Q3 = 6 - 8] What is the name of the school
from which you received your bachelor’s degree?
19X. Which one of the following broad categories best describes your most recent educational program?
Q19X response Percent,
except as noted
Refused 0.59
Humanities 5.07
Social/behavioral sciences 9.41
Life sciences 4.3
Physical sciences/math 4.82
Computer/information sciences 7.07
Engineering 8.76
Education 6.41
Business/management 14.64
Health 13.46
Law 4.06
Vocational/technical training 4.72
Undeclared 5.64
Other: Specify 11.04
Number of responses 1,527
December 2016 95

20. Do you believe you now have the level of education and training needed for the type of job that you would like to hold in the next five years?
Q20 response Percent,
except as noted
Refused 0.12
Yes 41.45
No 40.42
Don't know 18.01
Number of responses 2,035
20A. Why do you believe you need more education?
Questionnaire number
Question and response Percent,
except as noted
Q20A_1 I want to change job/career
Refused 1.27
Yes 53.44
No 45.29
Number of responses 741
Q20A_2 I want greater opportunities for promotions and advancement
Refused 0.45
Yes 75.8
No 23.76
Number of responses 741
Q20A_3 My family expects me to have a higher level of education
Refused 1.04
Yes 49
No 49.96
Number of responses 741
Q20A_4 The labor market demands a higher level of education
Refused 1.45
Yes 72.01
No 26.53
Number of responses 741
Q20A_5 My line of work requires more education
Refused 0.71
Yes 61.1
No 38.19
Number of responses 741
Q20A_6 I need more education to land a job
(continued)
20A. Why do you believe you need more education?—continued
Questionnaire number
Question and response Percent,
except as noted
Refused 0.95
Yes 67.96
No 31.1
Number of responses 741
Q20A_7 Other: specify
Refused 44.98
Yes 4.66
No 50.35
Number of responses 741
21. Are you currently enrolled in a certificate or degree program?
Q21 response Percent,
except as noted
Refused 0.33
Yes 28.1
No 71.57
Number of responses 2,035
21A. You just reported that you are not enrolled in a certificate or degree program. Have you started a certificate or degree program that you have not yet completed?
Q21A response Percent,
except as noted
Refused 0.56
Yes 13.46
No 85.98
Number of responses 1,550
21B. How long has it been since you were enrolled in the certificate or degree program that you started?
Q21B response Percent,
except as noted
Less than one year 27.65
One to two years 31.62
More than two years 37.28
I don't know 3.45
Number of responses 179
96 Experiences and Perspectives of Young Workers

21C. How likely are you to complete the certificate or degree program that you started?
21C response Percent,
except as noted
I definitely will complete the program 40.9
I probably will complete the program 20.04
I am not sure if I will complete the program 24.97
I probably will not complete the program 5.14
I definitely will not complete the program 8.95
Number of responses 179
21CC. Please indicate whether any of the following reasons describe why you may not complete the certificate or degree program you started:
Questionnaire number
Question and response Percent,
except as noted
21CC_1 I don't believe the program will improve my job opportunities
Refused 0.95
Yes 34.11
No 64.95
Number of responses 88
21CC_2 I need to work instead
Refused 0.95
Yes 60.68
No 38.37
Number of responses 88
21CC_3 I can't afford to complete
Refused 0.95
Yes 56.34
No 42.71
Number of responses 88
21CC_4 I don't want to borrow (more) money to complete
Refused 0.95
Yes 50.57
No 48.48
Number of responses 88
21CC_5 I have family responsibilities
Refused 0.95
Yes 48.05
No 51
Number of responses 88
21CC_6 The program is too challenging
Refused 0.95
Yes 14.72
No 84.34
Number of responses 88
(continued)
21CC. Please indicate whether any of the following reasons describe why you may not complete the certificate or degree program you started:—continued
Questionnaire number
Question and response Percent,
except as noted
21CC_7 I am concerned that even after the program, I will not land a job in my field of interest
Refused 0.95
Yes 45.46
No 53.59
Number of responses 88
21CC_8 Other: specify
Refused 43.12
Yes 17.48
No 39.4
Number of responses 88
22. Are you currently enrolled full time or part time?
Q22 response Percent,
except as noted
Refused 0.75
Full time 73.22
Part time 26.03
Number of responses 478
23. What type of certification or degree program are you enrolled in?
Q23 response Percent,
except as noted
Refused 0.29
High school diploma or equivalent GED 3.59
Certificate or technical degree 7.77
Associate degree 22.76
Bachelor's degree 55.49
Master's degree 5.07
Professional or doctorate degree 3.75
Other: Specify 1.29
Number of responses 478
23A. Do you attend classes in person or online?
Q23A response Percent,
except as noted
Refused 0.35
In person 70.6
Online 9.79
Both 19.26
Number of responses 478
December 2016 97

23C. Are you currently enrolled in any training program that will not lead to a certificate or degree?
Q23C response Percent,
except as noted
Refused 0.5
Yes 4.96
No 94.54
Number of responses 2,035
23D. What type of training program are you enrolled
in? [TEXT BOX]
24. Please indicate whether you used any of the following forms of financing for your most recent educational program:
Questionnaire number
Question and response Percent,
except as noted
24_1 I paid with my own savings
Refused 1.15
Yes 37.62
No 61.23
Number of responses 1,527
24_2 I worked while in school
Refused 1.36
Yes 62.42
No 36.22
Number of responses 1,527
24_3 My parents contributed (with or without the use of loans)
Refused 1.75
Yes 52.25
No 46
Number of responses 1,527
24_4 Financial-aid based grant (including Pell Grant and FAFSA grants)
Refused 1.23
Yes 45.56
No 53.21
Number of responses 1,527
24_5 Financial-aid based loans (including FAFSA loans)
Refused 1.41
Yes 46.06
No 52.53
Number of responses 1,527
24_6 Tuition reimbursement from employer (including military)
Refused 2.36
Yes 10.09
(continued)
24. Please indicate whether you used any of the following forms of financing for your most recent educational program:—continued
Questionnaire number
Question and response Percent,
except as noted
No 87.55
Number of responses 1,527
24_7 Academic scholarship
Refused 1.71
Yes 39.34
No 58.96
Number of responses 1,527
24_8 Other: specify
Refused 38.89
Yes 2.77
No 58.35
Number of responses 1,527
FAFSA Free Application for Federal Student Aid.
24B. How would you say the lifetime financial benefits of your most recent educational program compare to the financial costs of this education?
24B response Percent,
except as noted
Refused 0.68
The financial benefits are MUCH LARGER than the costs 22.66
The financial benefits are SOMEWHAT LARGER than the costs 18.28
The financial benefits are ABOUT THE SAME as the costs 11.96
The financial benefits are SOMEWHAT SMALLER than the costs 7.82
The financial benefits are MUCH SMALLER than the costs 6.86
I don't know 31.73
Number of responses 2,035
24C. How would you say the financial benefits of your undergraduate educational program compare to the financial costs of this education?
24C response Percent,
except as noted
Refused 1.81
The financial benefits are MUCH LARGER than the costs 26.6
The financial benefits are SOMEWHAT LARGER than the costs 24.3
The financial benefits are ABOUT THE SAME as the costs 22.42
The financial benefits are SOMEWHAT SMALLER than the costs 10.57
The financial benefits are MUCH SMALLER than the costs 4.43
I don't know 9.87
Number of responses 168
98 Experiences and Perspectives of Young Workers

24D. Please explain why you believe the financial
benefits of your undergraduate program are larger
than the costs. [TEXT BOX]
24E. Please explain why you do not believe the finan-
cial benefits of your undergraduate program are
larger or smaller than the costs. [TEXT BOX]
24DD. Please explain why you believe the financial
benefits of your undergraduate program are smaller
than the costs. [TEXT BOX]
25. Are you interested in obtaining additional education or training?
Q25 response Percent,
except as noted
Refused 0.23
Yes 49.55
No 26.48
I don't know 23.75
Number of responses 1,557
26. Seeing as you may be interested in additional education or training, please indicate the primary reason you are not enrolled:
Q26 response Percent,
except as noted
Refused 2.91
I don't know which program will improve my job opportunities 12.72
I don't know where to enroll 2.22
I can't afford to enroll 20.88
I don't want to borrow money to enroll 9.35
I don't meet the requirements to enroll 3.55
The schedule does not work for me 7.25
The program is not offered at my local institutions 1.68
I am concerned that the program will be too challenging 0.67
I am concerned that even after the program, I will not land a job in my field of interest 2.46
I have family responsibilities 13.48
I am in the process of applying 9.44
I am gaining work experience 13.38
Number of responses 1,123
26A. Seeing as you may be interested in additional education, please indicate how much each of these other reasons describe why you are not enrolled:
Questionnaire number
Question and response Percent,
except as noted
26A_1 I don't know which program will improve my job opportunities
Refused 4.25
Very much describes why I am not enrolled 16.03
Somewhat describes why I am not enrolled 29.12
Does not describe why I am not enrolled 46.80
Number of responses 1,123
26A_2 I don't know where to enroll
Refused 4.43
Very much describes why I am not enrolled 6.86
Somewhat describes why I am not enrolled 26.34
Does not describe why I am not enrolled 62.37
Number of responses 1,123
26A_3 I can't afford to enroll
Refused 4.4
Very much describes why I am not enrolled 32.97
Somewhat describes why I am not enrolled 27.63
Does not describe why I am not enrolled 35
Number of responses 1,123
26A_4 I don't want to borrow money to enroll
Refused 4.11
Very much describes why I am not enrolled 32.84
Somewhat describes why I am not enrolled 30.59
Does not describe why I am not enrolled 32.46
Number of responses 1,123
26A_5 I don't meet the requirements to enroll
Refused 4.81
Very much describes why I am not enrolled 8.28
Somewhat describes why I am not enrolled 21.91
Does not describe why I am not enrolled 65
Number of responses 1,123
26A_6 The schedule does not work for me
Refused 4.71
Very much describes why I am not enrolled 17.44
Somewhat describes why I am not enrolled 31.06
Does not describe why I am not enrolled 46.08
Number of responses 1,123
26A_7 The program is not offered at my local institutions
Refused 4.78
Very much describes why I am not enrolled 7.08
Somewhat describes why I am not enrolled 21.45
(continued)
December 2016 99

26A. Seeing as you may be interested in additional education, please indicate how much each of these other reasons describe why you are not enrolled:—continued
Questionnaire number
Question and response Percent,
except as noted
Does not describe why I am not enrolled 66.69
Number of responses 1,123
26A_8 I am concerned that the program will be too challenging
Refused 4.69
Very much describes why I am not enrolled 5.87
Somewhat describes why I am not enrolled 22.72
Does not describe why I am not enrolled 66.72
Number of responses 1,123
26A_9 I am concerned that even after the program, I will not land a job in my field of interest
Refused 4.65
Very much describes why I am not enrolled 11.79
Somewhat describes why I am not enrolled 29.01
Does not describe why I am not enrolled 54.55
Number of responses 1,123
26A_10 I have family responsibilities
Refused 3.97
Very much describes why I am not enrolled 25.47
Somewhat describes why I am not enrolled 23.16
Does not describe why I am not enrolled 47.4
Number of responses 1,123
26A_11 I am in the process of applying
Refused 4.73
Very much describes why I am not enrolled 10.83
Somewhat describes why I am not enrolled 14.75
Does not describe why I am not enrolled 69.69
Number of responses 1,123
26A_12 I am gaining work experience
Refused 4.22
Very much describes why I am not enrolled 14.69
Somewhat describes why I am not enrolled 28.62
Does not describe why I am not enrolled 52.47
Number of responses 1,123
27. During high school, did you work for pay?
Q27 response Percent,
except as noted
Refused 0.37
Yes 53.49
No 46.15
Number of responses 2,035
28. During high school, did you receive information about jobs and careers?
Q28 response Percent,
except as noted
Refused 0.28
Yes 66.43
No 21.49
I don't know 10.25
I did not attend high school 1.55
Number of responses 2,035
29. During high school, where did you obtain information about jobs and careers?
Questionnaire number
Question and response Percent,
except as noted
29_1 Parent(s)
No 43.68
Yes 56.32
Number of responses 1,316
29_2 Friends and family
No 51.35
Yes 48.65
Number of responses 1,316
29_3 High school teacher or counselor
No 24.26
Yes 75.74
Number of responses 1,316
29_4 Online research
No 58.58
Yes 41.42
Number of responses 1,316
29_5 Employment services agency
No 89.26
Yes 10.74
Number of responses 1,316
29_6 A business where I worked
No 93.32
Yes 6.68
Number of responses 1,316
29_7 [Other: specify] During high school, where did you obtain information about jobs?
No 97.47
Yes 2.53
Number of responses 1,316
100 Experiences and Perspectives of Young Workers
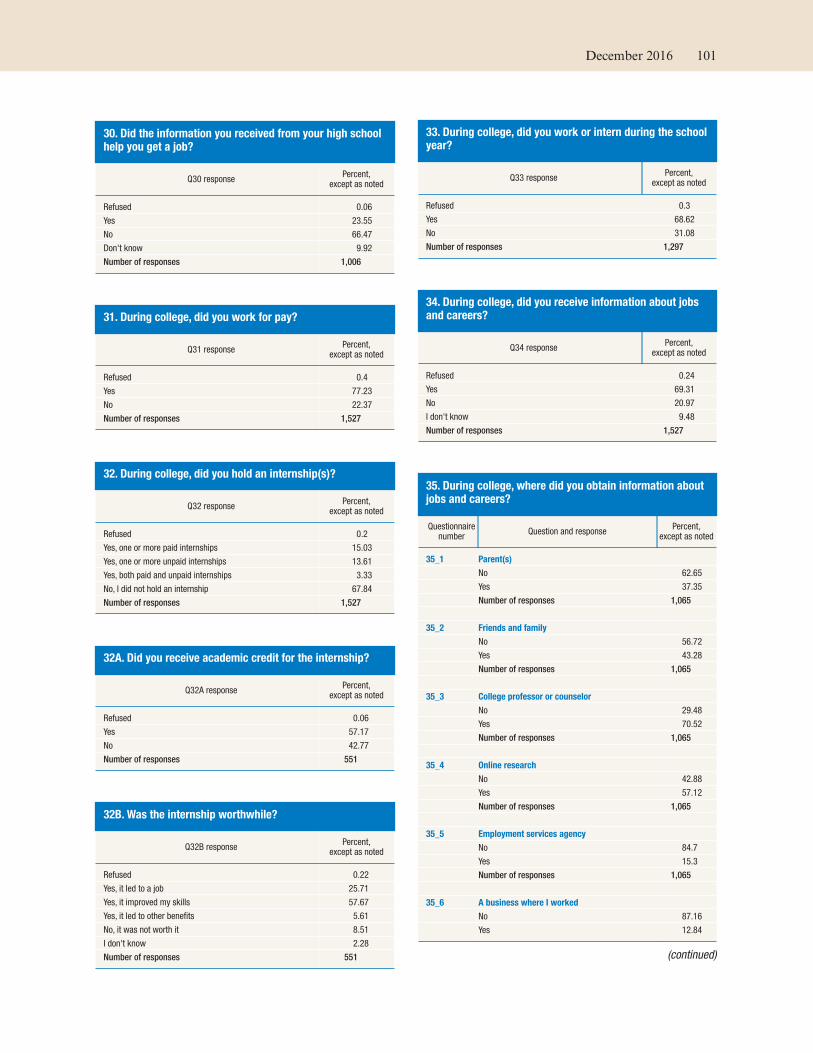
30. Did the information you received from your high school help you get a job?
Q30 response Percent,
except as noted
Refused 0.06
Yes 23.55
No 66.47
Don't know 9.92
Number of responses 1,006
31. During college, did you work for pay?
Q31 response Percent,
except as noted
Refused 0.4
Yes 77.23
No 22.37
Number of responses 1,527
32. During college, did you hold an internship(s)?
Q32 response Percent,
except as noted
Refused 0.2
Yes, one or more paid internships 15.03
Yes, one or more unpaid internships 13.61
Yes, both paid and unpaid internships 3.33
No, I did not hold an internship 67.84
Number of responses 1,527
32A. Did you receive academic credit for the internship?
Q32A response Percent,
except as noted
Refused 0.06
Yes 57.17
No 42.77
Number of responses 551
32B. Was the internship worthwhile?
Q32B response Percent,
except as noted
Refused 0.22
Yes, it led to a job 25.71
Yes, it improved my skills 57.67
Yes, it led to other benefits 5.61
No, it was not worth it 8.51
I don't know 2.28
Number of responses 551
33. During college, did you work or intern during the school year?
Q33 response Percent,
except as noted
Refused 0.3
Yes 68.62
No 31.08
Number of responses 1,297
34. During college, did you receive information about jobs and careers?
Q34 response Percent,
except as noted
Refused 0.24
Yes 69.31
No 20.97
I don't know 9.48
Number of responses 1,527
35. During college, where did you obtain information about jobs and careers?
Questionnaire number
Question and response Percent,
except as noted
35_1 Parent(s)
No 62.65
Yes 37.35
Number of responses 1,065
35_2 Friends and family
No 56.72
Yes 43.28
Number of responses 1,065
35_3 College professor or counselor
No 29.48
Yes 70.52
Number of responses 1,065
35_4 Online research
No 42.88
Yes 57.12
Number of responses 1,065
35_5 Employment services agency
No 84.7
Yes 15.3
Number of responses 1,065
35_6 A business where I worked
No 87.16
Yes 12.84
(continued)
December 2016 101

35. During college, where did you obtain information about jobs and careers?—continued
Questionnaire number
Question and response Percent,
except as noted
Number of responses 1,065
35_7 On-campus recruitment
No 55.05
Yes 44.95
Number of responses 1,065
35_8 Career fair (not sponsored by college)
No 77.09
Yes 22.91
Number of responses 1,065
35_9 Other: specify
No 98.46
Yes 1.54
Number of responses 1,065
36. Did the information you received from your college help you get a job?
Q36 response Percent,
except as noted
Refused 0.54
Yes 38.24
No 43.78
I don't know 17.44
Number of responses 770
37. Are you working in a career field that is closely related to your education and training?
Q37 response Percent,
except as noted
Refused 0.72
Yes 43.31
No 50.18
I don't know 5.79
Number of responses 1,468
37A. Are you currently working on campus (e.g., work study, residents assistant, research assistant)?
Q37A response Percent,
except as noted
Yes 21.68
No 78.32
Number of responses 317
38. How qualified would you describe yourself for performing the tasks required of your main job (the job where you work the most hours)? Do you think you are…
Q38 response Percent,
except as noted
Refused 0.39
Overqualified 25.86
Adequately qualified 62.82
In need of additional training 10.93
Number of responses 1,468
39. Do you consider your main job (the job where you work the most hours) to be a career, a stepping stone to a career, or just a job to get you by?
Q39 response Percent,
except as noted
Refused 0.31
Career 27.24
Stepping stone to a career 32.61
Just a job 39.84
Number of responses 1,468
40. When you last searched for a job, please indicate whether you used each of the following strategies during the whole process:
Questionnaire number
Question and response Percent,
except as noted
40_1 I contacted the employer directly
Refused 1.2
Yes 60.19
No 38.62
Number of responses 1,468
40_2 My parent(s) provided a contact
Refused 2.12
Yes 13.53
No 84.35
Number of responses 1,468
40_3 Other family and friends provided a contact
Refused 1.99
Yes 25.55
No 72.46
Number of responses 1,468
40_4 Services from school, teacher, professor, or counselor
Refused 1.98
Yes 13.62
No 84.4
(continued)
102 Experiences and Perspectives of Young Workers

40. When you last searched for a job, please indicate whether you used each of the following strategies during the whole process:—continued
Questionnaire number
Question and response Percent,
except as noted
Number of responses 1,468
40_5 Services from an employment center
Refused 2.1
Yes 12.03
No 85.87
Number of responses 1,468
40_6 Searched electronic job boards (e.g., Monster, CareerBuilder, Craigslist, Indeed)
Refused 1.71
Yes 37.98
No 60.3
Number of responses 1,468
40_7 Posted online resume/advertisement (e.g., LinkedIn, Twitter, Facebook, Craigslist)
Refused 2.12
Yes 22.88
No 75
Number of responses 1,468
40_8 Career fair
Refused 2.25
Yes 13.15
No 84.6
Number of responses 1,468
40_9 Recruited by employer
Refused 2.33
Yes 17.39
No 80.29
Number of responses 1,468
40_10 New job within company I was already employed by
Refused 2.53
Yes 9.83
No 87.64
Number of responses 1,468
40_11 Other: specify
Refused 34.81
Yes 2.32
No 62.86
Number of responses 1,468
41. Have you been promoted with a pay increase since you started your main job (the job where you work the most hours)?
Q41 response Percent,
except as noted
Refused 0.93
Yes 50.99
No 48.07
Number of responses 1,468
42. Are there opportunities for advancement with a pay increase at your main job (the job where you work the most hours)?
Q42 response Percent,
except as noted
Refused 0.94
Yes 47.93
No 29.25
I don't know 21.88
Number of responses 684
43. How quickly do you expect to be promoted?
Q43 response Percent,
except as noted
Within the next six months 21.58
Within the next year 25.1
Within the next two years 15.01
In more than two years 4.68
I do not expect to be promoted 15.34
I don't know 18.3
Number of responses 326
44. How many hours did you work last week at all of your paid jobs combined?
Q44 response Hours
Mean 39.23
Standard deviation 14.91
Minimum 0
Maximum 168
Number of responses 1,225
December 2016 103

45. Compared to the number of hours you worked last week, would you prefer to:
Q45 response Percent,
except as noted
Refused 0.55
Work more hours 25.08
Work about the same number of hours 58.01
Work less hours 16.36
Number of responses 1,468
46. What is the main reason you are seeking more hours?
Q46 response Percent,
except as noted
Refused 0.11
To pay my living expenses 40.07
To pay off debt 15.37
To increase my savings 35.3
To gain more work experience 3.37
Other: specify 5.77
Number of responses 326
48. Is your work schedule for your job or jobs:
Q48 response Percent,
except as noted
Refused 0.4
Fairly consistent 63.06
Changes day-to-day 14.24
Changes week-to-week 18.82
Changes month-to-month 3.48
Number of responses 1,468
48A. Are more than half of your work hours "non-standard" hours (e.g., night shift, swing shift, weekends)?
Q48A response Percent,
except as noted
Refused 0.61
Yes 29.5
No 64.06
I don't know 5.82
Number of responses 1,468
49. Please indicate whether each of the following is a reason that you are currently working part time rather than full time:
Questionnaire number
Question and response Percent,
except as noted
49_1 I prefer part-time work
Refused 3.17
Yes 51.27
No 45.56
Number of responses 414
49_2 My employer cut my hours due to business conditions
Refused 3.01
Yes 12.36
No 84.62
Number of responses 414
49_3 I could only find part-time work
Refused 3.29
Yes 33.9
No 62.81
Total 100
Number of responses 414
49_4 I am enrolled in school/training program
Refused 1.57
Yes 58.49
No 39.93
Number of responses 414
49_5 I am caring for young children
Refused 2.68
Yes 14.21
No 83.1
Number of responses 414
49_6 I have family responsibilities
Refused 2.77
Yes 20.4
No 76.83
Number of responses 414
49_7 I have health problems
Refused 3.37
Yes 7.31
No 89.32
Number of responses 414
49_8 Other: Specify
(continued)
104 Experiences and Perspectives of Young Workers

49. Please indicate whether each of the following is a reason that you are currently working part time rather than full time:—continued
Questionnaire number
Question and response Percent,
except as noted
Refused 38.52
Yes 3.92
No 57.56
Number of responses 414
50. A year from now, do you expect to have a full-time job (35 hours or more per week) with a single employer?
Q50 response Percent,
except as noted
Refused 0.32
Yes 40.59
No 38.93
I don't know 20.16
Number of responses 414
51. A year from now do you expect to be working full time (35 hours or more per week) but for more than one employer?
Q51 response Percent,
except as noted
Refused 0.48
Yes 17.05
No 61.03
I don't know 21.45
Number of responses 414
52. How long have you been employed at your main job, the job where you work the most hours?
Q52 response Percent,
except as noted
Refused 0.46
Less than two months 8.36
Two to six months 19.42
More than six months, but less than one year 12.88
One to two years 21.77
More than two years 37.12
Number of responses 1,468
53. Do you think you can continue to work at your main job as long as you wish?
Q53 response Percent,
except as noted
Refused 0.42
Yes 75.51
No 9.97
I don't know 14.1
Number of responses 1,468
54. How much longer do you expect to be at your main job (the job where you work the most hours)?
Q54 response Percent,
except as noted
Refused 0.3
Less than two months 5.04
Two to six months 10.1
More than six months, but less than one year 12.01
One to two years 18.86
More than two years 29.92
I don't know 23.76
Number of responses 1,468
55. What is the most important reason you expect to leave your main job within a year?
Q55 response Percent,
except as noted
Job is temporary 14.46
Business conditions may cause my employer to cut back 3.57
New technology will eliminate my job 0.69
I want to be my own boss 3.50
I am moving 11.18
I will get another job 40.16
I will be attending school 14.66
Family responsibilities 6.05
I have health problems 0.53
Other: Specify 5.20
Number of responses 366
December 2016 105

57. Do you receive overtime pay, tips or commissions from any of your paid jobs?
Q57 response Percent,
except as noted
Refused 0.67
Yes 41.08
No 58.25
Number of responses 1,468
58. How satisfied are you with the total amount of salary or wages you earn from the paid job or jobs you now hold?
Q58 response Percent,
except as noted
Refused 0.37
Very satisfied 18.83
Somewhat satisfied 42.22
Neither satisfied nor dissatisfied 17.61
Somewhat dissatisfied 14.06
Very dissatisfied 6.91
Number of responses 1,468
59A. If you were out of work for the next four weeks, would you able to pay your living expenses?
Q59A response Percent,
except as noted
Refused 0.44
Yes 46.59
No 37.94
I don't know 15.03
Number of responses 1,468
59B. If you were out of work for the next three months, would you able to pay your living expenses?
Q59B response Percent,
except as noted
Refused 0.52
Yes 44.68
No 29.03
I don't know 25.77
Number of responses 893
60. How satisfied are you with the benefits you currently receive from your employer or employers?
Q60 response Percent,
except as noted
Refused 0.79
Very satisfied 21.13
Somewhat satisfied 27.86
Neither satisfied nor dissatisfied 30.17
Somewhat dissatisfied 8.62
Very dissatisfied 11.43
Number of responses 1,468
61. Do you receive paid time off for sick leave and/or holidays from any of your paid jobs?
Q61 response Percent,
except as noted
Refused 0.49
Yes 56.31
No 43.2
Number of responses 1,468
62. Do you have health insurance from any source?
Q62 response Percent,
except as noted
Refused 0.47
Yes 82.78
No 16.74
Number of responses 1,468
63. Do you receive this health insurance either through an employer or employment agency?
Q63 response Percent,
except as noted
Refused 0.36
Yes 58.48
No 41.16
Number of responses 1,238
106 Experiences and Perspectives of Young Workers

64. Does your employer pay for:
Q64 response Percent,
except as noted
Refused 1.03
All of your health insurance premium 21.62
Part of your health insurance premium 62.45
None of your health insurance premium 14.9
Number of responses 796
65. Do you have training opportunities through an employer or employers?
Q65 response Percent,
except as noted
Refused 0.65
Yes 42.52
No 37.8
I don't know 19.02
Number of responses 1,468
66. Please review the following benefits and rank the three benefits that are most important to you to receive from an employer. If there is a benefit(s) that are not provided in the list, there is room for you to write in your own benefit preferences. Please use “1” for the most important benefit, “2” for the second most important benefit, and “3” for the third most important benefit.
Questionnaire number
Question and response Percent,
except as noted
66_1 Paid sick leave and/or holidays
Refused 1.42
1 26.66
2 27.29
3 19.86
Not selected 24.76
Number of responses 1,468
66_2 Health insurance
Refused 1.42
1 40.93
2 22.97
3 12.19
Not selected 22.49
Number of responses 1,468
66_3 Tuition reimbursement
Refused 1.42
1 4.59
2 5.13
3 8.46
Not selected 80.4
Number of responses 1,468
(continued)
66. Please review the following benefits and rank the three benefits that are most important to you to receive from an employer. If there is a benefit(s) that are not provided in the list, there is room for you to write in your own benefit preferences. Please use “1” for the most important benefit, “2” for the second most important benefit, and “3” for the third most important benefit.—continued
Questionnaire number
Question and response Percent,
except as noted
66_4 Student loan repayment
Refused 1.42
1 4.99
2 5.3
3 6.91
Not selected 81.38
Number of responses 1,468
66_5 Contribution to tax-deferred savings account (e.g., 401(k) or retirement account)
Refused 1.42
1 7.81
2 15.12
3 18.46
Not selected 57.19
Number of responses 1,468
66_6 Matching contributions to savings accounts
Refused 1.42
1 2.87
2 5.47
3 7.82
Not selected 82.43
Number of responses 1,468
66_7 Professional training
Refused 1.42
1 4.57
2 5.9
3 8.29
Not selected 79.83
Number of responses 1,468
66_8 Flexible schedule
Refused 1.42
1 14.46
2 13.74
3 16.55
Not selected 53.84
Number of responses 1,468
66_9 Work-from-home capability
Refused 1.42
1 3.48
2 3.36
3 5.33
Not Selected 86.41
Number of responses 1,468
66_10 Other: specify
(continued)
December 2016 107

66. Please review the following benefits and rank the three benefits that are most important to you to receive from an employer. If there is a benefit(s) that are not provided in the list, there is room for you to write in your own benefit preferences. Please use “1” for the most important benefit, “2” for the second most important benefit, and “3” for the third most important benefit.—continued
Questionnaire number
Question and response Percent,
except as noted
Refused 1.42
1 1.4
2 2.09
3 1.83
Not Selected 93.27
Number of responses 1,468
67. Are you a member of a labor union or an employee association similar to a union?
Q67 response Percent,
except as noted
Refused 0.57
Yes 7.48
No 88.08
I don't know 3.87
Number of responses 1,468
68A. How many full-time, paid jobs have you had during the past year?
Q68A response Percent,
except as noted
Refused 2.56
0 38.47
1 46.27
2 9.9
3 1.53
4 0.5
5 0.17
6 0.27
8 0.06
10 0.11
20 0.04
40 0.09
67 0.01
99 0.02
Number of responses 2,035
68B. How many part-time, paid jobs have you had during the past year?
Q68B response Percent,
except as noted
Refused 2.32
0 51.54
1 29.75
2 10.3
3 3.17
4 1.11
5 0.9
6 0.45
7 0.05
8 0.15
10 0.13
12 0.06
18 0.01
20 0.04
25 0.03
Number of responses 2,035
68C. Did you work at more than one of these jobs at the same time?
Q68C response Percent,
except as noted
Refused 0.09
Yes 38.28
No 61.63
Number of responses 796
69D. How satisfied are you with your full- and part-time job arrangements over the past year?
Q69D response Percent,
except as noted
Refused 0.78
Very satisfied 24.31
Somewhat satisfied 49.72
Somewhat dissatisfied 17.41
Very dissatisfied 7.78
Number of responses 796
108 Experiences and Perspectives of Young Workers

69EE. Please indicate whether any of the following factors made you feel satisfied with your job arrangements over the past five years:
Questionnaire number
Question and response Percent,
except as noted
69EE_1 Wages or salary (including any bonus and tips)
Refused 2.44
Yes 71.7
No 25.86
Number of responses 597
69EE_2 Number of hours
Refused 2.51
Yes 81.83
No 15.66
Number of responses 597
69EE_3 Regular schedule
Refused 3.05
Yes 71.69
No 25.26
Number of responses 597
69EE_4 Flexible schedule
Refused 2.35
Yes 72.85
No 24.8
Number of responses 597
69EE_5 Opportunities for promotion/advancement
Refused 4.09
Yes 45.63
No 50.28
Total 100
Number of responses 597
69EE_6 Friendly environment
Refused 3.45
Yes 78.01
No 18.53
Number of responses 597
69EE_7 Long-term position
Refused 3.38
Yes 58.56
No 38.06
Number of responses 597
69EE_8 Health insurance
Refused 3.2
Yes 41.23
No 55.57
Number of responses 597
69EE_9 Convenient location/easy commute
Refused 3.02
Yes 72.1
No 24.88
(continued)
69EE. Please indicate whether any of the following factors made you feel satisfied with your job arrangements over the past five years:—continued
Questionnaire number
Question and response Percent,
except as noted
Number of responses 597
69EE_10 Good work experience for resume
Refused 3.55
Yes 72.83
No 23.62
Number of responses 597
69EE_11 Other: specify
Refused 52.48
Yes 2.82
No 44.71
Number of responses 597
69FF. Please indicate whether any of the following factors made you feel dissatisfied with your job arrangements over the past five years.
Questionnaire number
Question and response Percent,
except as noted
69FF_1 Wages or salary (including any bonus and tips)
Refused 1.59
Yes 66.16
No 32.26
Number of responses 193
69FF_2 Too many hours
Refused 1.53
Yes 35.78
No 62.68
Number of responses 193
69FF_3 Too few hours
Refused 0.94
Yes 46.41
No 52.66
Number of responses 193
69FF_4 Schedule changes
Refused 2.64
Yes 56.43
No 40.94
Number of responses 193
69FF_5 Lack of opportunities for promotion/advancement
Refused 0.94
Yes 64.91
No 34.16
Number of responses 193
(continued)
December 2016 109

69FF. Please indicate whether any of the following factors made you feel dissatisfied with your job arrangements over the past five years.—continued
Questionnaire number
Question and response Percent,
except as noted
69FF_6 Stressful work environment
Refused 0.65
Yes 67.07
No 32.28
Number of responses 193
69FF_7 Temporary position
Refused 1.82
Yes 37.7
No 60.48
Number of responses 193
69FF_8 Lack of benefits
Refused 1.82
Yes 58.8
No 39.37
Number of responses 193
69FF_9 Location
Refused 2.86
Yes 30.83
No 66.31
Number of responses 193
69FF_10 Lack of job security
Refused 1.53
Yes 47.47
No 51
Number of responses 193
69FF_11 Other: specify
Refused 49.25
Yes 5.4
No 45.35
Number of responses 193
70A. Looking to the future, approximately how many full-time, paid jobs do you expect to have in the next year?
Q70A response Percent,
except as noted
Refused 3.95
0 23.39
1 63.66
2 7.1
3 0.95
4 0.36
5 0.25
6 0.04
(continued)
70A. Looking to the future, approximately how many full-time, paid jobs do you expect to have in the next year?—continued
Q70A response Percent,
except as noted
8 0.08
12 0.12
14 0.01
16 0.08
Number of responses 2,035
70B. Looking to the future, approximately how many part-time, paid jobs do you expect to have in the next year?
Q70B Percent,
except as noted
Refused 4.74
0 49.27
1 34.68
2 7.89
3 1.67
4 0.97
5 0.29
6 0.04
7 0.12
8 0.09
9 0.02
10 0.06
12 0.01
15 0.05
19 0.08
90 0.01
Number of responses 2,035
70C. Do you expect to work at more than one of these jobs at the same time?
Q70C response Percent,
except as noted
Refused 0.12
Yes 44.54
No 55.34
Number of responses 732
110 Experiences and Perspectives of Young Workers

56. If you had to choose, is it more important to have a job that pays more or a job that is more likely to provide steady employment?
Q56 response Percent,
except as noted
Refused 2.03
Higher pay 35.53
Steady employment 62.45
Number of responses 2,035
56A. If you had steady work for the next five years, would you prefer to have one job or multiple jobs?
Q56A response Percent,
except as noted
Refused 1.38
One job for the next five years 77
Multiple jobs over the next five years (only one job at a time) 13.72
Multiple jobs over the next five years (okay with more than one job at a time) 7.9
Number of responses 2,035
56B. When you think about your job future, not including campus jobs and internships, what is the ideal amount of time to stay in the same job?
Q56B response Percent,
except as noted
Refused 1.17
(continued)
56B. When you think about your job future, not including campus jobs and internships, what is the ideal amount of time to stay in the same job?—continued
Q56B response Percent,
except as noted
No more than one year 2.5
No more than two years 6.06
No more than five years 10.93
No more than 10 years 4.82
There ideal amount of time to stay at a job 53.78
I don't know 20.74
Number of responses 2,035
56D. When you reach your parents' current age, how do you expect your standard of living to compare to their current standard of living?
Q56D response Percent,
except as noted
Refused 1.01
I expect to have a HIGHER STANDARD of living than my parents 52.18
I expect to have the SAME STANDARD of living than my parents 26.32
I expect to have a LOWER STANDARD of living than my parents 6.62
I don't know 13.86
Number of responses 2,035
December 2016 111
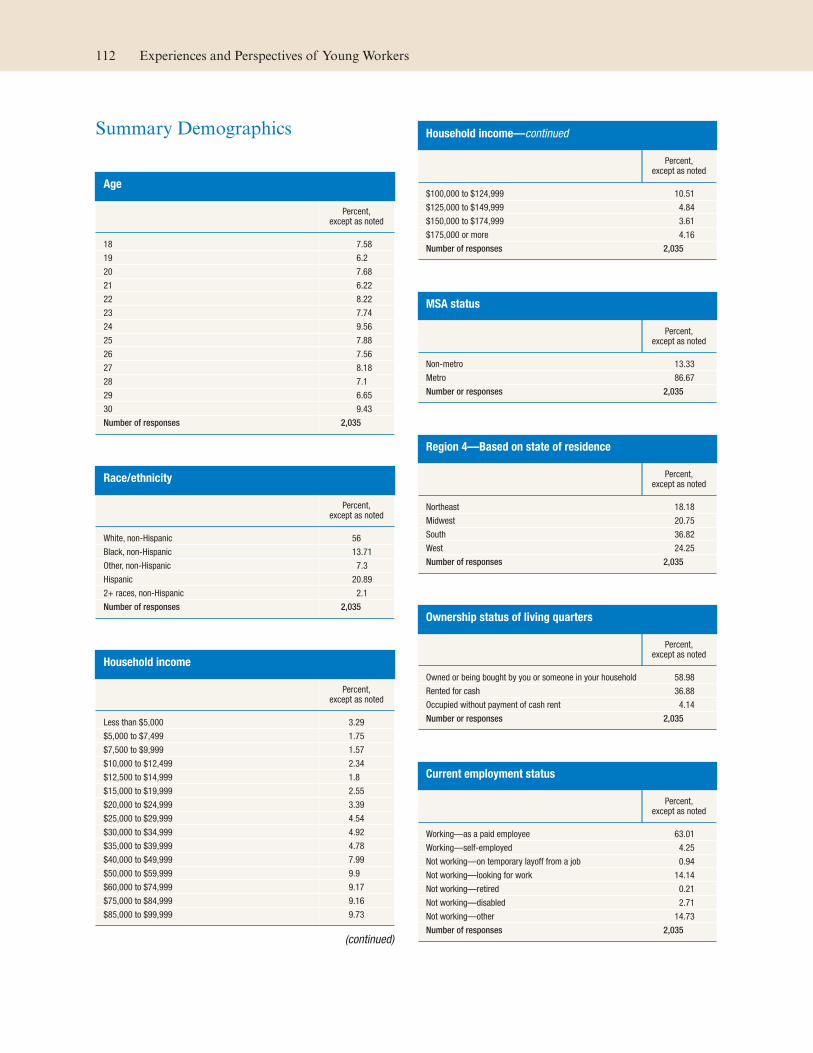
Summary Demographics
Age
Percent,except as noted
18 7.58
19 6.2
20 7.68
21 6.22
22 8.22
23 7.74
24 9.56
25 7.88
26 7.56
27 8.18
28 7.1
29 6.65
30 9.43
Number of responses 2,035
Race/ethnicity
Percent,except as noted
White, non-Hispanic 56
Black, non-Hispanic 13.71
Other, non-Hispanic 7.3
Hispanic 20.89
2+ races, non-Hispanic 2.1
Number of responses 2,035
Household income
Percent,except as noted
Less than $5,000 3.29
$5,000 to $7,499 1.75
$7,500 to $9,999 1.57
$10,000 to $12,499 2.34
$12,500 to $14,999 1.8
$15,000 to $19,999 2.55
$20,000 to $24,999 3.39
$25,000 to $29,999 4.54
$30,000 to $34,999 4.92
$35,000 to $39,999 4.78
$40,000 to $49,999 7.99
$50,000 to $59,999 9.9
$60,000 to $74,999 9.17
$75,000 to $84,999 9.16
$85,000 to $99,999 9.73
(continued)
Household income—continued
Percent,except as noted
$100,000 to $124,999 10.51
$125,000 to $149,999 4.84
$150,000 to $174,999 3.61
$175,000 or more 4.16
Number of responses 2,035
MSA status
Percent,except as noted
Non-metro 13.33
Metro 86.67
Number or responses 2,035
Region 4—Based on state of residence
Percent,except as noted
Northeast 18.18
Midwest 20.75
South 36.82
West 24.25
Number of responses 2,035
Ownership status of living quarters
Percent,except as noted
Owned or being bought by you or someone in your household 58.98
Rented for cash 36.88
Occupied without payment of cash rent 4.14
Number or responses 2,035
Current employment status
Percent,except as noted
Working—as a paid employee 63.01
Working—self-employed 4.25
Not working—on temporary layoff from a job 0.94
Not working—looking for work 14.14
Not working—retired 0.21
Not working—disabled 2.71
Not working—other 14.73
Number of responses 2,035
112 Experiences and Perspectives of Young Workers

