experiment 1 synthesis of “copper carbonate”:...
TRANSCRIPT

Experiment 1Synthesis of “Copper Carbonate”: What is it?
Chemistry 132Spring 2013
BackgroundA careful reading of an advanced inorganic chemistry text will convince you that
CuCO3 can only be made under a high pressure of CO2. What we call copper carbonate is a complex salt referred to as a basic copper carbonate, basic because the material has hydroxide groups as well as carbonate groups. There is more than one basic copper carbonate and several have been known since ancient times. These include the following:
name color formula
malachite green Cu(OH)2Cu(CO3)azurite blue Cu(OH)2Cu2(CO3)2
Synthesis Your synthesis is on the surface a straightforward metathesis (double displacement) reaction:
CuSO4(aq) + Na2CO3(aq) → CuCO3(s) + Na2SO4(aq)
The isolation step succeeds because only the desired product “CuCO3” is insoluble and can be isolated by filtration.
Chemical AnalysisAs you will discover when you complete the Preparation page for this experiment,
“CuCO3”, malachite and azurite all have different mass percent Cu. This difference is the basis for your analysis of the material you make in the lab. Copper carbonates, hydroxides, and oxides can all be converted to metallic copper by treatment with H2(g) or CH4(g) at elevated temperatures. The laboratory gas tap serves as a convenient source of natural gas, which is chiefly CH4. You will construct an apparatus for the reduction of copper salts. By weighing the material put in the reactor and weighing the copper present after reduction, you will be able to determine the mass percent copper of the original sample.
com
mon
s.w
ikim
edia
.org
(Ra'
ike)

Statistical AnalysisHow accurate is the value you obtain for % Cu? This is a difficult question to answer
with just your data alone, but statistical treatment of the class data will allow you to make a good estimate of the accuracy of the average of the class data.
ReferencesC. Zidick, T. Weismann: “The Reduction of CuO with Burner Gas and without a Fume Hood.” J. Chem. Ed. 1973, 50, 717-718.A. B. Hoffman, A. J. Hoffman: “Reduction of Copper(II) Oxide by Alkanes of Low Molecular Weight.” J. Chem. Ed. 1974, 51, 418-420.D. Sheeran: “Copper Content in Synthetic Copper Carbonate: A Statistical Comparison of Experimental and Expected Results.” J. Chem. Ed. 1998, 75, 453-456.
Experimental Procedure
Weigh all reactants and products accurately on the analytical balances! Always record all the digits of the mass reading from the balance.
Synthesis of “CuCO3.” Prepare a solution of copper sulfate by adding 3.8 g (0.015 mol) CuSO4·5H2O to 40 mL of H2O. Prepare a solution of Na2CO3 (2.0 g, 0.019 mol) in 60 mL H2O. Slowly add the copper solution to the sodium carbonate solution. Note any observations.
Warm the resulting mixture to 55-60 °C on a hot plate. Stir gently. Note any color change or other observations. Cool the reaction mixture by immersing the beaker in a room temperature water bath.
Once the mixture has reached room temperature, collect the product by filtration with a Büchner funnel. When the product looks dry, carefully disconnect the vacuum hose. The product has the consistency of modeling clay at this point and is difficult to get off of the filter paper. Slowly, pour 20 mL acetone onto the precipitate, disturbing the precipitate as little as possible. Wait about 30 seconds, then reconnect the aspirator hose and allow all the acetone to be pulled through the product. Repeat with another 20 mL portion of acetone. Continue to apply suction. The layer of product should begin to crack irregularly, like a dry lake bed. After a minute or so, disconnect vacuum and collect your product. Pulverize any clumps in your product and dry under a heat lamp for 5 minutes. Weigh your product. Assuming the product to be CuCO3, what is your percent yield?
Caution: Acetone is highly flammable. Keep it well away from open flames.
Analysis of “CuCO3.” Construct an apparatus for reduction of the product similar to the diagram below. Determine the weight of a clean dry 18 × 150 mm test tube. To this tube, add approximately 0.4 g of product, weighed with milligram precision. Take care to concentrate the material at the bottom of the tube—keep the walls of the tube clean! Weigh the tube and copper carbonate together to determine the exact mass of copper carbonate. Once the copper carbonate
2

has been reduced to metallic copper some of the copper will adhere to the test tube walls, which makes it necessary to weigh by difference.
Once the test tube is loaded with material, reassemble the reduction apparatus. Begin a gentle flow of gas through the test tube, being careful not to disturb the solid with the flow of gas. Attempt to light the gas exiting the test tube. If it does not light, slowly increase the gas flow. When it does light, adjust the gas flow so that the flame height is 5–7 cm tall. This flame serves to burn off the excess methane not used to reduce the copper carbonate and will also oxidize any carbon monoxide formed in the reduction to carbon dioxide.
Now, light a Bunsen burner and, using the hottest part of the flame, heat the area of the test tube that contains the copper carbonate. Heat for at least 5 minutes and be sure to note any color changes or other changes that occur during the reduction. After reduction is complete remove the Bunsen burner but allow the flame to burn from the mouth of the test tube for 5 minutes or until the copper in the test tube is cool. Next, turn off the burner gas to extinguish the flame and, once the entire test tube is at room temperature, disassemble the apparatus. Weigh the tube to determine how much copper it contains. Tap the tube and scrape the inside with a spatula to remove some copper. Does it have metallic properties?
Chemical Analysis! Report your results as directed by the lab instructor. You might write them on an erasable marker board or enter them into a spreadsheet program on a computer in the laboratory. The instructor will inform you how to retrieve the class data.
From the class data, obtain an average, a standard deviation (SD), and a 95 % confidence interval. Use the Q-test to discard outliers (see Appendix).
3

Use Student's t-test (Appendix) to decide, at the 95 % confidence level, whether or not the formulation CuCO3 can be ruled out. Can one of the formulas for basic copper carbonate also be ruled out?
4
Laboratory Report Instructions1. Write your name and Slayter box number at the top of the first page of your report.2. Write a balanced equation for the reaction of CuSO4 and Na2CO3 based upon the
knowledge you gained from this experiment. Your equation should have water as a reactant (both reactants are aqueous after all!).
3. (a) Write a balanced equation for the reaction of basic copper carbonate to give copper oxide (CuO). (b) Write a balanced equation for the reaction of CuO with methane to give Cu. Assume for reactions (a) and (b) that the only carbon containing product formed is CO2.
4. Do you have any experimental observations to suggest that the reduction you performed occurred in two steps as described in question (2)? If so, state them.
5. Report your percent yield for the synthesis of “CuCO3” (assume product is malachite or azurite based on your % Cu data)
6. Your observed mass % Cu in basic copper carbonate and the class average mass % Cu in basic copper carbonate (with standard deviation and 95% CI)
7. Apply Student’s t-test to the class data and judge which (if any) of the formulae for (basic) copper carbonate can be ruled out based on the t-value and the 95% confidence level.
5

6Ap
pen
dix
B
B-1
EV
AL
UA
TIO
N O
F E
XP
ER
IME
NT
AL
UN
CE
RT
AIN
TY
A.
Rep
eate
d M
easu
rem
ents
Do
No
t L
ead
to
Id
enti
cal
Ob
serv
ati
on
s
Ex
per
imen
tal
chem
ists
are
co
nti
nu
ally
fac
ed w
ith
th
e fa
ct t
hat
rep
eate
d m
easu
rem
ents
do
no
t le
ad t
o a
set
of
iden
tica
l o
bse
rvat
ion
s. N
o c
hem
istr
y s
tuden
t w
ou
ld b
e su
rpri
sed
to
ob
tain
th
e fo
llo
win
g d
ata
in T
able
1:
Ta
ble
1.
Th
ree
con
secu
tiv
e m
easu
rem
ents
of
a N
i sa
mp
le
usi
ng
a t
op
lo
adin
g b
alan
ce.
Tri
al
Ma
ss o
f N
i S
am
ple
1
5.0
18
g
2
5.0
14
g
3
5.0
19
g
Wh
y i
s a
dif
fere
nt
resu
lt o
bta
ined
up
on
eac
h w
eig
hin
g o
f th
e N
i sa
mp
le?
Wh
at i
s th
e m
ass
of
the
Ni
sam
ple
?
Ho
w d
o w
e ta
lk a
bo
ut
and
rep
ort
th
ese
exp
erim
enta
l re
sult
s?
B.
Ra
nd
om
an
d S
yst
ema
tic
Err
or
(wh
y d
iffe
ren
t re
sult
s a
re o
bta
ined
)
Th
ese
resu
lts
sho
w t
hat
ev
ery
ex
per
imen
tal
mea
sure
men
t is
su
bje
ct t
o a
cer
tain
am
ou
nt
of
erro
r.
Th
is e
rro
r ca
n b
e sy
stem
atic
an
d/o
r ra
nd
om
in
nat
ure
.
Sys
tem
ati
c er
ror
resu
lts
fro
m a
co
nsi
sten
t o
ffse
t in
a m
easu
rem
ent
dev
ice
or
a co
nsi
sten
t
mis
tak
e in
pro
ced
ure
. F
or
exam
ple
, in
mak
ing
th
e m
easu
rem
ent
des
crib
ed a
bo
ve,
syst
emat
ic e
rro
r ca
n b
e in
tro
du
ced
if
the
bal
ance
zer
o s
hif
ts i
n b
etw
een
mea
sure
men
ts.
Dif
fere
nt
resu
lts
wil
l b
e o
bta
ined
if
the
Ni
sam
ple
is
han
dle
d w
ith
wet
fin
ger
s in
bet
wee
n
sub
seq
uen
t m
easu
rem
ents
. I
n t
heo
ry,
syst
emat
ic e
rro
r ca
n (
and
sh
ou
ld!)
be
avo
ided
.
Ra
nd
om
err
or
aris
es f
rom
co
mp
lete
ly r
and
om
flu
ctu
atio
ns
in t
he
mea
sure
men
t p
roce
ss.
Th
is t
yp
e o
f er
ror
is u
nav
oid
able
: A
ll m
easu
rem
ents
, n
o m
atte
r h
ow
"g
oo
d"
are
sub
ject
to s
om
e ra
nd
om
err
or.
T
his
is
wh
y,
even
wit
h a
dev
ice
such
as
the
elec
tro
nic
an
aly
tica
l
bal
ance
an
d e
ven
hav
ing
eli
min
ated
all
so
urc
es o
f sy
stem
atic
err
or,
we
wil
l o
bta
in
dif
fere
nt
(alb
eit
on
ly s
lig
htl
y)
resu
lts
up
on
rew
eig
hin
g t
he
Ni
sam
ple
. F
ort
un
atel
y t
his
typ
e o
f ra
nd
om
flu
ctu
atio
n i
s, i
n g
ener
al,
pre
dic
tab
le,
and
can
be
des
crib
ed
mat
hem
atic
ally
. T
her
efo
re,
we
can
arr
ive
at a
sin
gle
"b
est"
val
ue
wh
ich
rep
rese
nts
th
e
mas
s o
f th
e N
i sa
mp
le.
We
are
equ
all
y co
nce
rned
wit
h h
ow
"g
oo
d"
that
val
ue
is a
nd
ran
do
m e
rro
r th
eory
all
ow
s u
s to
det
erm
ine
this
as
wel
l.
Ap
pen
dix
B
B-2
C.
Pre
cisi
on
an
d A
ccu
racy
(th
e tr
ue
ma
ss o
f th
e N
i sa
mp
le)
Th
e am
ou
nt
of
ran
do
m e
rro
r is
ex
pre
ssed
as
the
pre
cisi
on o
f th
e m
easu
rem
ent.
PR
EC
ISIO
N i
s th
e q
ual
ity
of
agre
emen
t am
on
g t
he
mem
ber
s o
f a
set
of
mea
sure
men
ts.
It i
s im
po
rtan
t to
rea
lize
th
at p
reci
sio
n i
s n
ot
the
sam
e as
acc
ura
cy.
We
can
(an
d o
ften
do
!) o
bta
in a
pre
cise
bu
t in
accu
rate
res
ult
. T
he
"clo
ser"
th
e v
alu
es,
the
mo
re p
reci
se t
he
dat
a. A
CC
UR
AC
Y i
s th
e q
ual
ity
of
agre
emen
t b
etw
een
th
e ex
per
imen
tal
resu
lt a
nd
th
e
tru
e v
alu
e.
Th
e co
mm
on
sen
se m
ean
ing
s o
f th
ese
term
s ar
e sh
ow
n i
n t
he
foll
ow
ing
ill
ust
rati
on
:
Acc
ura
te a
nd
pre
cise
A
ccu
rate
bu
t n
ot
pre
cise
Pre
cise
bu
t n
ot
accu
rate
Nei
ther
acc
ura
te n
or
pre
cise
D.
Rep
ort
ing
Mea
sure
men
ts (
ho
w w
e ta
lk a
bo
ut
ou
r ex
per
imen
tal
resu
lts)
W
e u
se t
he
foll
ow
ing
co
nce
pts
to
rep
ort
ou
r ex
per
imen
tal
resu
lts
wh
en w
e h
ave
mu
ltip
le
mea
sure
men
ts o
f th
e sa
me
qu
anti
ty.
Eac
h c
on
cep
t w
ill
be
dis
cuss
ed i
n d
etai
l in
th
e
rem
ain
der
of
this
Ap
pen
dix
.
T
he
Av
era
ge
of
the
mea
sure
men
ts i
s th
e b
est
way
to
sim
ply
rep
ort
yo
ur
dat
a.
W
hen
we
wan
t to
pro
vid
e in
form
atio
n o
n t
he
var
iab
ilit
y o
f o
ur
dat
a, w
e u
se t
he
Sta
nd
ard
Dev
iati
on
of
ou
r m
easu
rem
ents
. W
e al
so c
alcu
late
th
e C
on
fid
ence
In
terv
al
to i
nd
icat
e
the
var
iab
ilit
y w
e ex
pec
t if
we
mea
sure
d t
he
qu
anti
ty a
gai
n.
W
e u
se t
he
Q T
est
to d
eter
min
e if
we
hav
e an
err
on
eou
s re
sult
an
d t
he
t te
st t
o d
eter
min
e
if o
ur
mea
sure
d v
alu
e if
sta
tist
ical
ly d
iffe
ren
t th
an t
he
tru
e v
alu
e.

7Appen
dix
B
B-3
E.
Aver
age
G
iven
that
we
get
dif
fere
nt
exper
imen
tal
val
ues
when
we
repea
t a
mea
sure
men
t, a
s
illu
stra
ted i
n T
able
1, w
hat
is
the
bes
t w
ay t
o r
eport
our
resu
lts?
In
gen
eral
, th
e "b
est"
val
ue
is s
imply
the
ave
rage
of
a se
t of
dat
a. F
or
the
dat
a in
Tab
le 1
, th
e av
erag
e m
ass
of
the
Ni
sam
ple
is
F.
Sta
nd
ard
Dev
iati
on
An i
ndic
atio
n o
f how
“good”
or
repro
duci
ble
or
pre
cise
the
exper
imen
tal
resu
lt i
s ca
n b
e
obta
ined
by f
indin
g t
he
standard
dev
iati
on, s,
of
the
dat
a se
t. T
he
stan
dar
d d
evia
tion i
s a
mea
sure
of
pre
cisi
on a
nd i
s ty
pic
ally
use
d t
o s
how
how
clo
sely
dat
a fa
ll a
round t
he
aver
age
val
ue
of
a m
easu
rem
ent.
The
foll
ow
ing f
orm
ula
is
use
d t
o c
alcu
late
the
stan
dar
d
dev
iati
on o
f sm
all
sets
of
dat
a, l
ike
those
we
ord
inar
ily d
eal
wit
h i
n t
his
lab
ora
tory
:
in t
his
equat
ion, x i
is
each
indiv
idual
dat
a poin
t,
is t
he
aver
age
of
the
dat
a se
t, !
is
the
sum
mat
ion s
ym
bol,
and n
is
the
num
ber
of
indiv
idual
mea
sure
men
ts m
ade.
F
or
rela
tivel
y
smal
l dat
a se
ts (
10 o
r fe
wer
mea
sure
men
ts),
this
cal
cula
tion c
an b
e per
form
ed u
sing a
n
ord
inar
y c
alcu
lato
r. O
rgan
izin
g t
he
calc
ula
tions
in a
tab
le c
an h
elp a
void
confu
sion (
and
mis
takes
!):
x i
5.0
18
g
5.0
17
g
0.0
01
g
1 x
10
-6 g
2
5.0
14
g
5.0
17
g
-0.0
03
g
9 x
10
-6 g
2
5.0
19
g
5.0
17
g
0.0
02
g
4 x
10
-6 g
2
1
4.
x 1
0-6
g2
So
s =
2.6
x 1
0-3
g.
Roundin
g o
ff g
ives
a f
inal
val
ue
of
3 x
10
-3g.
Man
y c
alcu
lato
rs a
re p
repro
gra
mm
ed t
o p
erfo
rm t
his
cal
cula
tion. C
hec
k y
ours
to s
ee i
f
this
is
the
case
: I
t ca
n s
ave
you a
lit
tle
num
ber
cru
nch
ing. M
ost
com
pute
r sp
read
shee
ts
can b
e use
d t
o f
ind t
he
stan
dar
d d
evia
tion o
f a
dat
a se
t as
wel
l. W
e w
ill
show
you h
ow
to
use
Exce
l, b
ut
you a
re w
elco
me
to u
se a
ny s
pre
adsh
eet
you h
ave
avai
lable
.
Appen
dix
B
B-4
Ad
dit
ion
al
illu
stra
tion
of
aver
age
an
d s
tan
dard
dev
iati
on
.
An a
nal
ysi
s w
as c
arri
ed o
ut
to d
eter
min
e th
e num
ber
of
pie
ces
of
pep
per
oni
on a
typic
al
slic
e of
piz
za f
rom
tw
o d
iffe
rent
piz
za d
eliv
ery p
lace
s (A
and B
). T
wo p
izza
s, h
avin
g t
en
slic
es e
ach, w
ere
exam
ined
and t
he
dat
a ar
e sh
ow
n b
elow
.
Rem
ember
in g
ener
al, th
e bes
t w
ay t
o r
eport
dat
a co
nta
inin
g m
easu
rem
ents
rep
eate
d
mult
iple
tim
es i
s to
rep
ort
the
ave
rage,
or
mea
n o
f a
set
of
dat
a. T
he
aver
age
den
ote
s a
val
ue
that
we
regar
d a
s ty
pic
al f
or
the
mea
sure
men
t. I
n t
his
anal
ysi
s, w
e dis
cover
that
the
aver
age
num
ber
of
pep
per
oni
pie
ces
per
sli
ce, fi
ve,
is
the
sam
e fo
r both
piz
zas.
B
oth
del
iver
y p
lace
s w
ould
see
m l
ike
a good p
lace
to o
rder
fro
m.
Now
let
’s a
sk a
ques
tion. I
f you w
ere
to s
har
e a
piz
za w
ith y
our
frie
nds
and w
ante
d t
o
ensu
re t
hat
ever
yone
get
s th
eir
fair
shar
e of
pep
per
oni,
whic
h p
izza
would
you f
eel
bet
ter
about
ord
erin
g, piz
za A
or
B?
You w
ould
pro
bab
ly c
hoose
A, but
why?
Wel
l, i
f w
e lo
ok
a bit
clo
ser
at t
he
gra
phs,
we
see
that
the
dat
a fo
r piz
za A
are
more
clo
sely
clu
ster
ed
around t
he
aver
age
val
ue.
T
his
mea
ns
the
slic
es i
n p
izza
A a
re m
ore
lik
ely t
o b
e si
mil
ar
than
the
slic
es i
n p
izza
B. T
he
dis
trib
uti
on o
f pep
per
oni
on t
he
gra
phs
above
illu
stra
tes
a
term
we
call
the
stan
dar
d d
evia
tion.
The
standard
dev
iati
on o
f a
mea
sure
men
t in
dic
ates
the
repro
duci
bil
ity o
f a
resu
lt.
It i
s ea
sy t
o s
ee t
hat
the
stan
dar
d d
evia
tion f
or
piz
za A
is
much
sm
alle
r th
an t
hat
for
piz
za
B. T
he
smal
ler
the
dev
iati
on o
f poin
ts a
bout
the
aver
age
val
ue,
the
more
cer
tain
we
tend
to b
e ab
out
the
val
ue
of
our
mea
sure
men
t. F
or
piz
za B
, th
e dev
iati
on i
s la
rge
(com
par
ed
to A
) w
hic
h l
eads
to a
deg
ree
of
unce
rtain
ty a
bout
the
piz
za. I
f you s
har
e piz
za B
, you
may
or
may
not
get
an e
qual
shar
e of
pep
per
oni.
Pie
ces
per
sli
ce
Piz
za A
5
4
4
6
6
4
5
5
5
6
Av
erag
e =
5
Std
Dev
= 0
.8
Pie
ces
per
sli
ce
Piz
za B
2
6
9
5
5
8
7
1
3
4
Av
erag
e =
5
Std
Dev
= 2
.5
Nu
mb
er o
f p
epp
ero
ni
pie
ces
per
sli
ce o
f p
izza
Data Point
All
sli
ces
hav
e b
etw
een
0 a
nd
10
pie
ces
of
pep
per
on
i
Nu
mb
er o
f p
epp
ero
ni
pie
ces
per
sli
ce o
f p
izza
Data Point

8Appen
dix
B
B-5
Exam
ple
: U
sing t
he
dat
a fo
r piz
za B
Aver
age:
= 5
Sta
ndar
d D
evia
tion:
Rev
iew
:
The
aver
age
of
a m
easu
rem
ent
pro
vid
es u
s th
e “b
est”
or
most
typic
al v
alue.
The
stan
dard
dev
iati
on
tel
ls u
s how
clo
se m
ult
iple
mea
sure
men
ts f
it t
hat
aver
age
val
ue.
G.
Con
fid
ence
In
terv
als
Whil
e th
e st
andar
d d
evia
tion p
rovid
es a
mea
sure
of
the
var
iabil
ity i
n t
he
indiv
idual
mea
sure
men
ts a
nd t
hus
the
pre
cisi
on o
f th
e ex
per
imen
t, a
n e
ven
more
use
ful
quan
tity
is
the
confi
den
ce i
nte
rval.
T
he
confi
den
ce i
nte
rval
(C
.I.)
pro
vid
es a
mea
sure
of
how
much
var
iabil
ity w
e w
ould
expec
t in
mea
suri
ng t
he
aver
age
val
ue
of
the
sam
e quan
tity
agai
n. I
t
is r
elat
ed t
o s
but
is n
ot
equal
to s
. T
he
mat
hem
atic
al f
orm
ula
is
In t
his
equat
ion, s
is t
he
stan
dar
d d
evia
tion, n i
s th
e num
ber
of
indep
enden
t m
easu
rem
ents
use
d t
o c
alcu
late
the
aver
age
and t
is
the
appro
pri
ate
choic
e fr
om
a r
efer
ence
tab
le (
see
the
nex
t pag
e). B
e ca
refu
l th
at t
he
table
you u
se i
s w
ritt
en i
n t
erm
s of
n t
he
num
ber
of
mea
sure
men
ts a
nd n
ot
the
var
iable
know
n a
s deg
rees
of
free
dom
.
So, fo
r th
e N
i ex
ample
, t
(fro
m t
he
table
) =
4.3
03 a
nd
x i
2
5
-3
9
9
5
4
16
5
5
0
0
…
…
…
…
4
5
-1
1
Appen
dix
B
B-6
Sig
nif
ican
t F
igu
res
an
d t
he
Con
fid
ence
In
terv
al
To e
xpre
ss t
he
num
ber
of
signif
ican
t fi
gure
s in
the
aver
age
corr
ectl
y, th
e co
nfi
den
ce
inte
rval
should
alw
ays
be
rounded
to o
ne
signif
ican
t dig
it a
nd t
hen
aver
age
val
ue
rounded
to a
gre
e w
ith t
he
confi
den
ce l
imit
. (
One
exce
pti
on i
s w
hen
the
signif
ican
t dig
it i
n t
he
C.I
.
is o
ne,
then
a s
econd d
igit
may
be
reta
ined
and t
he
aver
age
rounded
acc
ord
ingly
.) F
or
our
exam
ple
the
appro
pri
ate
way
to r
eport
the
exper
imen
tal
wei
ght
of
a nic
kel
is:
5.0
17 ±
0.0
07 g
Note
a c
ouple
of
thin
gs
about
the
size
of
the
C.I
.
a.
As
s dec
reas
es, so
does
C.I
.
b.
As
n i
ncr
ease
s, t
dec
reas
es, yie
ldin
g a
sm
alle
r C
.I. T
he
den
om
inat
or
incr
ease
s w
ith n
so C
.I. get
s sm
alle
r due
to t
his
too.
A
sm
all
er v
alu
e fo
r th
e C
.I. in
dic
ate
s m
ore
pre
cisi
on i
n t
he
data
.
For
the
nic
kel
dat
a you w
ould
expre
ss t
he
exper
imen
tal
resu
lt a
s 5.0
17 ±
0.0
07 g
. T
his
tell
s us
that
the
act
ual
wei
ght
of
this
par
ticu
lar
nic
kel
sam
ple
has
a 9
5%
pro
bab
ilit
y o
f
bei
ng i
n t
he
inte
rval
fro
m 5
.010 g
to 5
.024 g
. N
oti
ce t
wo t
hin
gs:
F
irst
, th
ere
is s
till
a 5
%
chan
ce t
hat
the
actu
al w
eight
of
the
sam
ple
is
outs
ide
this
ran
ge.
T
his
lev
el o
f
unce
rtai
nty
is
consi
der
ed a
ccep
table
for
most
sci
enti
fic
work
. S
econd, th
e poss
ibil
ity o
f
syst
emati
c er
ror
has
not
bee
n a
ccounte
d f
or.
Tab
le 2
. V
alues
of
Stu
den
t’s
t at
var
ious
confi
den
ce l
evel
s fo
r n (
num
ber
of
mea
sure
men
ts)
C
onfi
den
ce L
evel
n
t (5
0%
) t
(90%
) t
(95%
) t
(99%
)
2
1.0
00
6.3
14
12.7
06
63.6
57
3
0.8
16
2.9
20
4.3
03
9.9
25
4
0.7
65
2.3
53
3.1
82
5.8
41
5
0.7
41
2.1
32
2.7
76
4.6
04
6
0.7
27
2.0
15
2.5
71
4.0
32
7
0.7
18
1.9
43
2.4
47
3.7
07
8
0.7
11
1.8
95
2.3
65
3.5
00
9
0.7
06
1.8
60
2.3
06
3.3
55
10
0.7
03
1.8
33
2.2
62
3.2
50
11
0.7
00
1.8
12
2.2
28
3.1
69
12
0.6
97
1.7
96
2.2
01
3.1
06
!
0.6
74
1.6
45
1.9
60
2.5
76

9Ap
pen
dix
B
B-7
Th
e p
izza
ex
am
ple
als
o i
llu
stra
tes
con
fid
ence
in
terv
als
Usi
ng
ag
ain t
he
dat
a fo
r o
ur
two
piz
zas,
we
kn
ow
th
at t
he
aver
age
nu
mb
er o
f p
epp
ero
ni
pie
ces
per
sli
ce o
f p
izza
is
5.
Bu
t is
th
at t
he
real
or
tru
e v
alu
e fo
r al
l o
f th
e p
epp
ero
ni
piz
zas?
A
re t
her
e re
ally
5-p
iece
s o
f p
epp
ero
ni
per
sli
ce?
Th
e av
erag
e p
rov
ides
th
e
typ
ical
or
bes
t v
alu
e th
at w
e ca
n d
eter
min
e u
sin
g o
ur
met
ho
d o
f m
easu
rem
ent.
T
he
on
ly
way
to
kn
ow
th
e tr
ue
or
exac
t n
um
ber
of
pep
per
on
i p
er s
lice
wo
uld
be
to m
easu
re e
ach
and
ev
ery
pie
ce o
f p
epp
ero
ni,
on
eac
h a
nd
ev
ery
sli
ce,
for
ever
y p
izza
th
at i
s m
ade.
N
ot
even
co
lleg
e st
ud
ents
can
eat
th
at m
uch
piz
za!
In r
eali
ty,
the
bes
t w
e ca
n d
o i
s to
pro
vid
e an
est
imat
e b
ased
on
th
e m
easu
rem
ents
we
ob
tain
.
Th
e tr
ick
is,
ho
w d
o w
e co
nv
ince
oth
ers
that
ou
r es
tim
ate,
ou
r av
erag
e v
alu
e, i
s
rep
rese
nta
tiv
e o
f al
l p
izza
s?
We
had
dec
ided
th
at w
e w
ere
fair
ly c
on
fid
ent
that
if
yo
u a
te
a sl
ice
fro
m p
izza
A,
ther
e w
as a
go
od
ch
ance
yo
u w
ere
go
ing
to
hav
e 5
pie
ces
of
pep
per
on
i.
Wh
y?
Bec
ause
, th
e st
and
ard
dev
iati
on
of
the
dat
a fo
r p
izza
A i
s sm
all
and
all
dat
a fa
ll c
lose
ly a
bo
ut
the
aver
age
nu
mb
er o
f 5
. O
n t
he
oth
er h
and
, o
ur
con
fid
ence
fo
r
the
sam
e m
easu
rem
ent
for
piz
za B
is
pre
tty
lo
w b
ecau
se o
f th
e la
rge
dev
iati
on
. F
or
piz
za
A y
ou
wo
uld
sta
te t
hat
yo
u a
re c
on
fid
ent
that
th
e tr
ue
valu
e (a
bso
lute
rea
l n
um
ber
of
pie
ces
per
sli
ce f
or
all
piz
zas)
is
clo
se t
o t
he
ave
rag
e va
lue
of
5.
Co
nfi
den
ce I
nte
rva
l:
Pro
vid
es a
mea
sure
of
ho
w m
uch
var
iab
ilit
y w
e ex
pec
t in
th
e
aver
age
val
ue
wh
en m
easu
rin
g a
qu
anti
ty m
ult
iple
tim
es.
Wh
ile
we
may
be
con
fid
ent
in o
ur
mea
sure
men
ts f
or
piz
za A
an
d n
ot
so c
on
fid
ent
for
piz
za B
, h
ow
co
nfi
den
t ar
e w
e?
Ho
w c
lose
is
ou
r m
easu
red
av
erag
e to
th
e tr
ue
(an
d
un
kn
ow
n)
val
ue?
L
et’s
co
mb
ine
the
gra
ph
ical
dat
a fo
r p
izza
s A
an
d B
an
d u
se t
his
fo
r an
exam
ple
.
Fo
r p
izza
B,
in u
nit
s o
f p
erce
nt
(%),
ho
w c
on
fid
ent
are
yo
u t
hat
th
e n
um
ber
of
pep
per
on
i
pie
ces
per
an
y “
mea
sure
d”
slic
e fa
lls
bet
wee
n 1
an
d 9
? (b
ar (
a))
Yo
ur
esti
mat
e m
igh
t b
e
clo
se t
o 9
0 -
95
% b
ecau
se t
he
dat
a sh
ow
th
at a
ll o
ur
slic
es h
ave
a n
um
ber
in
th
is r
ang
e.
(We
can
nev
er b
e 1
00
% s
ure
!)
(a)
*C
on
fid
ence
Piz
za B
– 9
5%
(b)
*C
on
fid
ence
Piz
za A
– 9
5%
*
Co
nfi
den
ce P
izza
B –
50
%
Nu
mb
er o
f p
epp
ero
ni
pie
ces
per
sli
ce o
f p
izza
Fig
ure
1
Co
mb
ined
Dat
a
Piz
za A
Piz
za B
* e
stim
ates
on
ly
Av
erag
e
Data Point
Ap
pen
dix
B
B-8
An
oth
er w
ay o
f as
kin
g t
he
abo
ve
qu
esti
on
is
ho
w c
on
fid
ent
are
yo
u t
hat
th
e re
al o
r tr
ue
nu
mb
er o
f p
iece
s p
er s
lice
fal
ls i
n t
he
ran
ge:
5
±
4 p
iece
s
Ag
ain
, if
yo
ur
esti
mat
e is
aro
un
d 9
5%
, th
is i
mp
lies
th
at y
ou
are
95
% c
on
fid
ent
tha
t th
e
tru
e va
lue
fall
s w
ith
in +
4 a
nd
-4
un
its
of
the
ave
rag
e va
lue
of
5 p
iece
s p
er s
lice
.
Co
mp
are
this
wit
h b
ar (
b)
on
th
e g
rap
h.
Fo
r p
izza
B,
ho
w c
erta
in a
re y
ou
th
at t
he
tru
e
val
ue
fall
s in
th
e ra
ng
e o
f 4
to
6 (
5 ±
1)?
Y
ou
r es
tim
ate
sho
uld
no
w b
e m
uch
lo
wer
, 4
0%
may
be
50
%?
Wh
at y
ou
sh
ou
ld n
oti
ce i
s th
at b
y d
ecre
asin
g t
he
inte
rval
, th
e ce
rtai
nty
th
at
the
tru
e v
alu
e fa
lls
in t
hat
ran
ge
of
val
ues
bec
om
es l
ess.
Y
ou
r co
nfi
den
ce i
n t
he
mea
sure
men
t is
sm
alle
r.
Wh
at i
f b
ar (
b)
was
ap
pli
ed t
o t
he
dat
a fo
r p
izza
A?
F
or
piz
za A
, h
ow
cer
tain
are
yo
u t
hat
the
tru
e n
um
ber
of
pep
per
on
i p
iece
s fa
lls
in t
he
inte
rval
bet
wee
n 4
an
d 6
?
Yo
ur
esti
mat
e
in t
his
in
stan
ce m
igh
t b
e as
hig
h a
s 9
0 o
r 9
5%
. M
uch
hig
her
th
an t
he
esti
mat
e fo
r p
izza
B.
(* s
ee F
igu
re 1
)
Bu
t w
hy
is
this
so
?
Wh
at i
nfo
rmat
ion
do
we
hav
e th
at m
akes
us
mo
re c
on
fid
ent
the
tru
e v
alu
e fa
lls
in t
he
ran
ge
of
5 ±
1,
for
piz
za A
, b
ut
no
t so
co
nfi
den
t it
fal
ls i
n t
his
ran
ge
for
piz
za B
?
Her
e is
wh
ere
stan
dar
d d
evia
tio
n a
nd
co
nfi
den
ce i
nte
rval
s co
me
into
pla
y.
Let
’s g
o b
ack
to
ou
r fo
rmu
la f
or
the
con
fid
ence
in
terv
al (
C.I
.):
t
= t
val
ue,
s =
sta
nd
ard
dev
iati
on
, an
d n
= n
um
ber
of
mea
sure
men
ts
If w
e lo
ok
at
the
equ
atio
n w
e se
e th
at t
he
con
fid
ence
in
terv
al i
s d
irec
tly
pro
po
rtio
nal
to
the
stan
dar
d d
evia
tio
n.
Th
is i
mp
lies
th
at a
s th
e st
an
da
rd d
evia
tio
n o
f a
mea
sure
men
t
bec
om
es s
ma
ller
, th
e co
nfi
den
ce i
nte
rva
l a
lso
bec
om
es s
ma
ller
. U
sin
g o
ur
esti
mat
es i
n
Fig
ure
1,
we
see
that
we
are
95
% c
on
fid
ent
that
th
ere
wil
l b
e 5
± 4
pie
ces
of
pep
per
on
i
per
sli
ce o
n p
izza
B.
Bu
t fo
r p
izza
A,
we
are
95
% c
on
fid
ent
that
th
ere
wil
l b
e 5
± 1
pie
ces
of
pep
per
on
i p
er s
lice
. T
his
is
so b
ecau
se t
he
dev
iati
on
of
po
ints
is
so m
uch
smal
ler
for
piz
za A
. W
ith
a s
mal
ler
stan
dar
d d
evia
tio
n,
we
can
rep
ort
, w
ith
th
e sa
me
con
fid
ence
, th
at t
he
tru
e v
alu
e w
ill
be
actu
ally
clo
ser
to t
he
aver
age
val
ue
for
piz
za A
than
fo
r p
izza
B.
Th
e se
con
d i
mp
ort
ant
fact
or
in d
eter
min
ing
co
nfi
den
ce i
nte
rval
is
the
nu
mb
er o
f
ind
ivid
ual
mea
sure
men
ts m
ade
(n).
It
is
log
ical
to
th
ink
th
at t
he
mo
re t
imes
we
mak
e a
mea
sure
men
t, t
he
bet
ter
ou
r re
po
rted
av
erag
e w
ill
be,
an
d t
he
mo
re c
on
fid
ent
we
wil
l b
e
in o
ur
mea
sure
d v
alu
e.
Fro
m t
he
equ
atio
n w
e o
bse
rve
that
th
e co
nfi
den
ce i
nte
rval
is
inv
erse
ly p
rop
ort
ion
al t
o t
he
nu
mb
er o
f m
easu
rem
ents
. A
s n
in
crea
ses,
th
e C
.I.
bec
om
es
sma
ller
an
d t
he
cert
ain
ty t
ha
t th
e tr
ue
valu
e is
clo
se t
o t
he
ave
rag
e in
crea
ses.
Av
erag
e
Inte
rval
10
Appen
dix
B
B-9
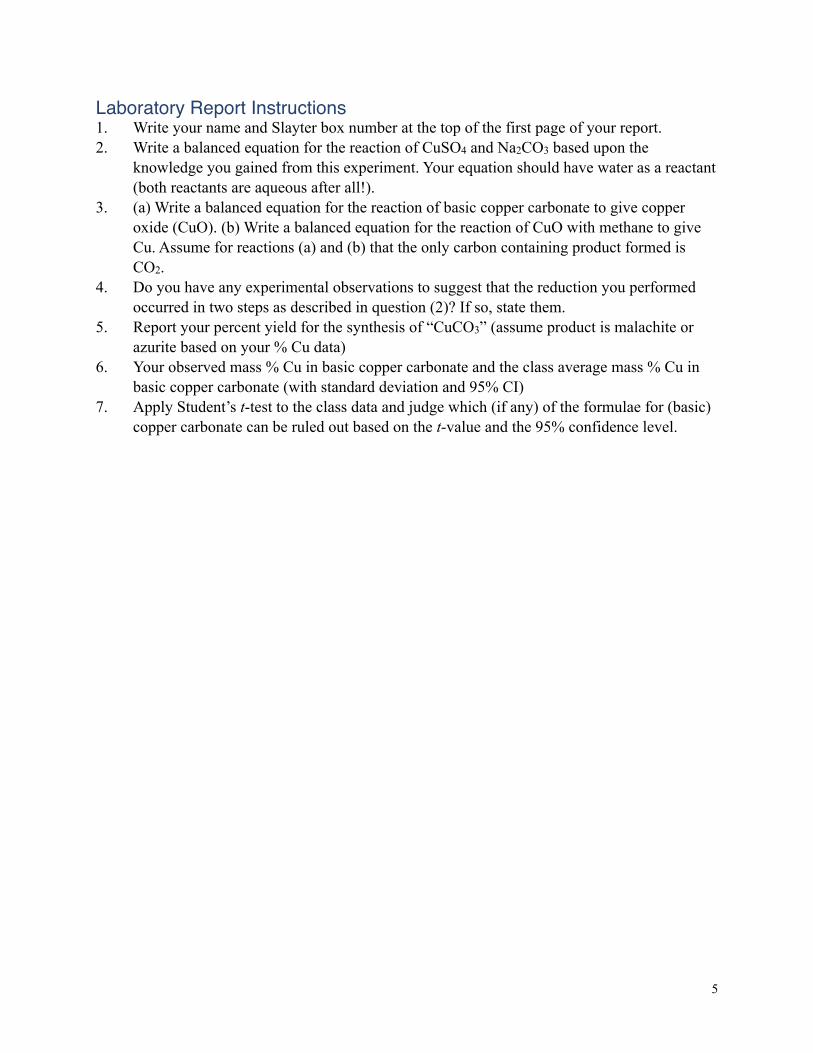
The
thir
d v
aria
ble
is
call
ed t
he
t val
ue.
T
he
t val
ue
is a
const
ant
found i
n a
tab
le o
f val
ues
and h
elps
us
def
ine
the
range
of
the
inte
rval
. N
oti
ce t
hat
the
t val
ue
dep
ends
on t
he
num
ber
of
mea
sure
men
ts m
ade.
L
et’s
exam
ine
piz
za B
agai
n, use
the
t val
ues
in T
able
2, an
d c
alc
ula
te t
he
act
ual
confi
den
ce i
nte
rvals
.
Dat
a fo
r piz
za B
: n
= 1
0 s
= 2
.5 p
iece
s a
ver
age
= 5
pie
ces
For
n =
10 a
t 50%
confi
den
ce:
"
0.5
5
5.0
± 0
.6 p
iece
s at
the
50%
C.I
.
For
n =
10 a
t 95%
confi
den
ce:
"
1.8
5.0
± 1
.8 p
iece
s at
the
95%
C.I
.
What
do t
he
above
resu
lts
tell
us
and d
o t
hey
mak
e se
nse
? T
he
resu
lts
say t
hat
we
are
50%
confi
den
t th
at t
he
true
val
ue
fall
s w
ithin
± 0
.6 p
iece
s of
the
aver
age
val
ue
of
5.0
, an
d 9
5%
confi
den
t th
e tr
ue
val
ue
fall
s w
ithin
± 1
.8 p
iece
s of
the
aver
age.
A
s bef
ore
, if
we
hav
e a
larg
er r
ange
of
val
ues
, our
cert
ainty
(C
.I.)
bec
om
es l
arger
(hen
ce a
lar
ger
t v
alue)
. T
his
is
exac
tly w
hat
we
should
expec
t.
The
calc
ula
tion f
oll
ow
s th
e sa
me
tren
d a
s our
earl
ier
esti
mat
e of
the
95%
and 5
0%
confi
den
ce i
nte
rval
s fo
r piz
za B
. I
n o
ur
esti
mat
e, w
e w
ere
95%
confi
den
t th
at t
he
num
ber
of
pie
ces
of
pep
per
oni
on a
noth
er s
lice
of
piz
za f
rom
del
iver
y p
lace
B w
ould
be
in t
he
range
of
5 ±
4 p
iece
s. H
ow
ever
, fo
r th
e ex
act
sam
e dat
a, o
ur
esti
mat
e w
as t
hat
we
wer
e only
50%
confi
den
t th
at t
he
num
ber
of
pie
ces
of
pep
per
oni
would
be
in t
he
range
of
5 ±
1 p
iece
s. F
or
thes
e dat
a th
e val
ue
of
n a
nd s
are
const
ant
and h
ave
not
chan
ged
, but
the
range
of
num
ber
of
pie
ces
of
pep
per
oni
has
chan
ged
. F
rom
the
equat
ion w
e ca
n s
ee t
hat
if
s an
d n
are
const
ant,
then
the
t val
ue
must
be
dif
fere
nt
for
dif
fere
nt
confi
den
ce i
nte
rval
s.
Aver
age
50%
Confi
den
ce i
nte
rval
95%
Confi
den
ce i
nte
rval
Fig
ure
2
Act
ual
Confi
den
ce
Inte
rval
s
for
Piz
za B
Nu
mb
er o
f p
epp
ero
ni
pie
ces
per
sli
ce o
f p
izza
Data Point
Appen
dix
B
B-1
0
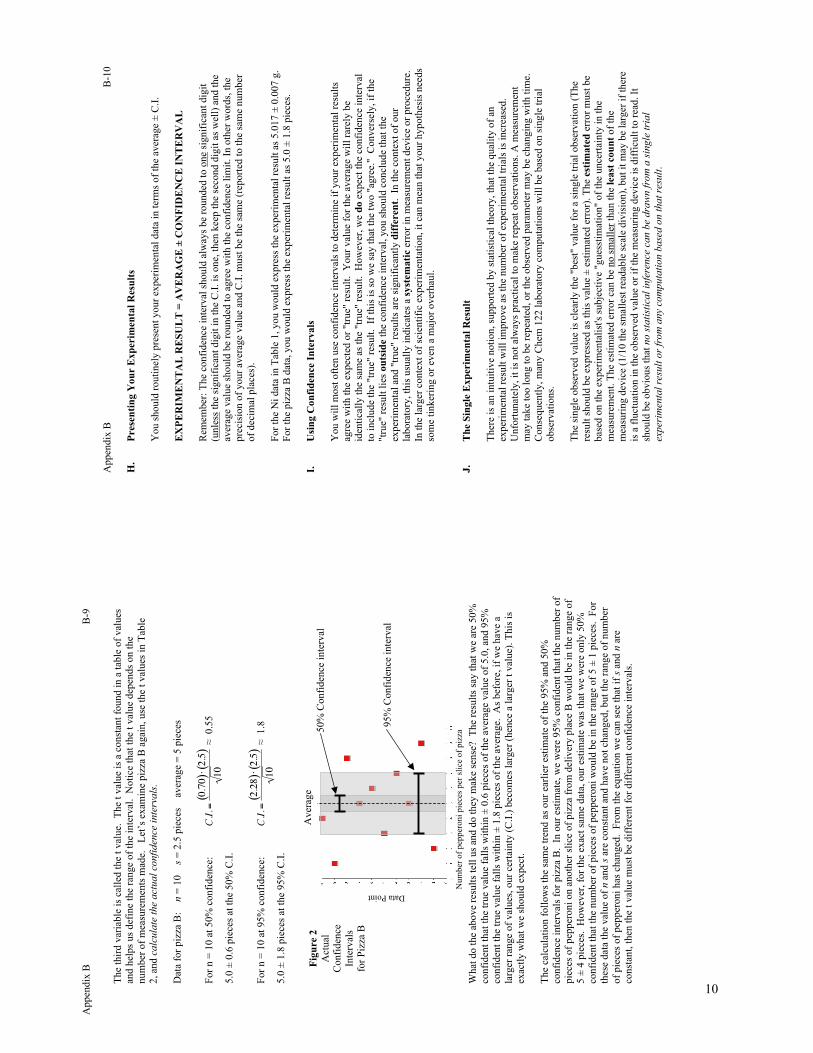
H.
Pre
sen
tin
g Y
ou
r E
xp
erim
enta
l R
esu
lts
You s
hould
routi
nel
y p
rese
nt
your
exper
imen
tal
dat
a in
ter
ms
of
the
aver
age
± C
.I.
EX
PE
RIM
EN
TA
L R
ES
UL
T =
AV
ER
AG
E ±
CO
NF
IDE
NC
E I
NT
ER
VA
L
Rem
ember
: T
he
confi
den
ce i
nte
rval
should
alw
ays
be
rounded
to o
ne
signif
ican
t dig
it
(unle
ss t
he
signif
ican
t dig
it i
n t
he
C.I
. is
one,
then
kee
p t
he
seco
nd d
igit
as
wel
l) a
nd t
he
aver
age
val
ue
should
be
rounded
to a
gre
e w
ith t
he
confi
den
ce l
imit
. In
oth
er w
ord
s, t
he
pre
cisi
on o
f your
aver
age
val
ue
and C
.I. m
ust
be
the
sam
e (r
eport
ed t
o t
he
sam
e num
ber
of
dec
imal
pla
ces)
.
For
the
Ni
dat
a in
Tab
le 1
, you w
ould
expre
ss t
he
exper
imen
tal
resu
lt a
s 5.0
17 ±
0.0
07 g
.
For
the
piz
za B
dat
a, y
ou w
ould
expre
ss t
he
exper
imen
tal
resu
lt a
s 5.0
± 1
.8 p
iece
s.
I.
Usi
ng C
on
fid
ence
In
terv
als
Yo
u w
ill
most
oft
en u
se c
onfi
den
ce i
nte
rval
s to
det
erm
ine
if y
our
exper
imen
tal
resu
lts
agre
e w
ith t
he
expec
ted o
r "t
rue"
res
ult
. Y
our
val
ue
for
the
aver
age
wil
l ra
rely
be
iden
tica
lly t
he
sam
e as
the
"tru
e" r
esult
. H
ow
ever
, w
e d
o e
xpec
t th
e co
nfi
den
ce i
nte
rval
to i
ncl
ude
the
"tru
e" r
esult
. I
f th
is i
s so
we
say t
hat
the
two "
agre
e."
Conver
sely
, if
the
"tru
e" r
esult
lie
s ou
tsid
e th
e co
nfi
den
ce i
nte
rval
, you s
hould
concl
ude
that
the
exper
imen
tal
and "
true"
res
ult
s ar
e si
gnif
ican
tly d
iffe
ren
t. In
the
conte
xt
of
our
labora
tory
, th
is u
sual
ly i
ndic
ates
a s
yst
emati
c er
ror
in m
easu
rem
ent
dev
ice
or
pro
cedure
.
In t
he
larg
er c
onte
xt
of
scie
nti
fic
exper
imen
tati
on, it
can
mea
n t
hat
your
hypoth
esis
nee
ds
som
e ti
nker
ing o
r ev
en a
maj
or
over
hau
l.
J.
Th
e S
ingle
Exp
erim
enta
l R
esu
lt
Ther
e is
an i
ntu
itiv
e noti
on, su
pport
ed b
y s
tati
stic
al t
heo
ry, th
at t
he
qual
ity o
f an
exper
imen
tal
resu
lt w
ill
impro
ve
as t
he
num
ber
of
exper
imen
tal
tria
ls i
s in
crea
sed.
Unfo
rtunat
ely, it
is
not
alw
ays
pra
ctic
al t
o m
ake
repea
t obse
rvat
ions.
A m
easu
rem
ent
may
tak
e to
o l
ong t
o b
e re
pea
ted, or
the
obse
rved
par
amet
er m
ay b
e ch
angin
g w
ith t
ime.
Conse
quen
tly, m
any C
hem
122 l
abora
tory
com
puta
tions
wil
l be
bas
ed o
n s
ingle
tri
al
obse
rvat
ions.
The
single
obse
rved
val
ue
is c
lear
ly t
he
"bes
t" v
alue
for
a si
ngle
tri
al o
bse
rvat
ion (
The
resu
lt s
hould
be
expre
ssed
as
this
val
ue
± e
stim
ated
err
or)
. T
he
esti
mate
d e
rror
must
be
bas
ed o
n t
he
exper
imen
tali
st's
subje
ctiv
e "g
ues
stim
atio
n"
of
the
unce
rtai
nty
in t
he
mea
sure
men
t. T
he
esti
mat
ed e
rror
can b
e no s
mal
ler
than
the
least
cou
nt
of
the
mea
suri
ng d
evic
e (1
/10 t
he
smal
lest
rea
dab
le s
cale
div
isio
n),
but
it m
ay b
e la
rger
if
ther
e
is a
flu
ctuat
ion i
n t
he
obse
rved
val
ue
or
if t
he
mea
suri
ng d
evic
e is
dif
ficu
lt t
o r
ead. It
should
be
obvio
us
that
no s
tati
stic
al
infe
rence
can b
e dra
wn f
rom
a s
ingle
tri
al
exper
imen
tal
resu
lt o
r fr
om
any
com
puta
tion b
ase
d o
n t
hat
resu
lt.

11
Appen
dix
B
B-1
1
K.
Th
e Q
Tes
t fo
r R
ejec
tin
g a
Su
spec
t O
bse
rvati
on
Suppose
we
atte
mpte
d t
o i
mpro
ve
the
Tab
le 1
res
ult
by a
ddin
g a
fourt
h m
easu
rem
ent,
obta
inin
g v
alues
of
5.0
18, 5.0
14, 5.0
19 a
nd 5
.045 g
for
the
mas
s of
our
nic
kel
. O
ur
intu
itio
n l
eads
us
to s
usp
ect
the
5.0
45 g
val
ue.
Per
hap
s th
e bal
ance
zer
o s
hif
ted. P
erhap
s a
read
ing e
rror
was
mad
e. P
erhap
s th
e nic
kel
was
han
dle
d w
ith w
et f
inger
s.
Cle
ar e
vid
ence
of
a non-r
andom
err
or
is s
uff
icie
nt
cause
to e
lim
inat
e a
susp
ect
val
ue.
Sin
ce t
he
oth
er v
alues
are
so c
lose
to o
ne
anoth
er, it
is
tem
pti
ng s
imply
to t
hro
w o
ut
the
5.0
45 g
res
ult
. H
ow
ever
, th
e hig
h v
alue
could
be
the
resu
lt o
f an
im
pro
bab
le, but
not
imposs
ible
, co
mbin
atio
n o
f ra
ndom
err
ors
. If
this
is
the
case
, th
e m
easu
rem
ent
is v
alid
and s
hould
be
inco
rpora
ted i
n t
he
exper
imen
tal
resu
lt. A
sta
tist
ical
tes
t ca
lled
the
Q
TE
ST
is
oft
en u
sed t
o e
stab
lish
a c
rite
rion f
or
dis
tinguis
hin
g b
etw
een a
n e
rroneo
us
resu
lt
and a
n i
mpro
bab
le c
om
bin
atio
n o
f ra
ndom
err
ors
.
The
Q F
AC
TO
R i
s co
mpute
d a
s fo
llow
s:
The
gap
is
the
dif
fere
nce
bet
wee
n t
he
susp
ect
val
ue
and t
he
nea
rest
val
ue.
T
he
ran
ge
is
the
dif
fere
nce
bet
wee
n t
he
hig
hes
t an
d l
ow
est
val
ues
incl
udin
g t
he
susp
ect
resu
lt. I
n o
ur
four
tria
l ex
per
imen
t,
Tab
le 3
. V
alues
of
Q f
or
90%
Rej
ecti
on Q
uoti
ent
The
com
pute
d Q
fac
tor
is n
ow
com
par
ed w
ith t
he
90%
rej
ecti
on q
uoti
ent
in T
able
3. W
e co
ncl
ude
that
the
5.0
45 g
res
ult
is
not
val
id, si
nce
its
ran
ge
quoti
ent
of
0.8
4 i
s G
RE
AT
ER
than
the
0.7
6
reje
ctio
n q
uoti
ent
for
a fo
ur
tria
l ex
per
imen
t. S
ince
we
are
dea
ling w
ith a
90%
rej
ecti
on q
uoti
ent,
we
say t
hat
ther
e is
a 9
0%
pro
bab
ilit
y t
hat
the
5.0
45 g
tria
l w
ould
not
resu
lt f
rom
any c
om
bin
atio
n o
f
ran
dom
err
ors
. T
her
efore
, w
e ca
n c
oncl
ude
that
a
syst
emati
c er
ror
was
inad
ver
tentl
y i
ntr
oduce
d a
nd
we
rem
ove
the
5.0
45 g
val
ue
from
the
dat
a se
t
bef
ore
the
aver
age
is c
om
pute
d.
TH
E Q
TE
ST
MA
Y B
E A
PP
LIE
D O
NL
Y O
NC
E T
O
A G
IVE
N S
ET
OF
DA
TA
n
Q (
Rej
ecti
on Q
uoti
ent,
90%
)
2
----
3
0.9
4
4
0.7
6
5
0.6
4
6
0.5
6
7
0.5
1
8
0.4
7
9
0.4
4
10
0.4
1
11
0.3
9
12
0.3
8
!
----
Appen
dix
B
B-1
2
L.
Th
e t
Tes
t
The
t te
st i
s use
d t
o d
eter
min
e w
het
her
an e
xper
imen
tall
y d
eter
min
ed v
alue
is s
tati
stic
all
y
dif
fere
nt
than
the
know
n t
rue
val
ue.
Suppose
you a
re g
iven
a s
ample
of
man
gan
ese-
conta
inin
g s
teel
. T
he
label
rea
ds
11.0
0 %
Mn. B
eing a
n e
xper
imen
tal
chem
ist,
you c
hoose
to d
eter
min
e th
e %
Mn f
or
yours
elf.
You t
ake
5 s
ample
s an
d d
eter
min
e %
Mn o
f ea
ch s
ample
. Y
our
resu
lts
are
sum
mar
ized
bel
ow
:
ex
perim
en
t #
% M
n
1
9
.95
2
1
0.1
7
3
1
0.2
2
4
1
0.4
8
5
1
0.3
1
Intu
itiv
ely, it
sure
looks
like
this
bott
le i
s m
isla
bel
ed. H
ow
sure
are
you?
The
t te
st
allo
ws
you t
o p
ote
nti
ally
rule
out
this
bott
le a
s th
e 11.0
0 %
Mn s
ample
. Y
ou’l
l se
ek t
o
reje
ct t
he
foll
ow
ing h
ypoth
esis
:
This
bott
le c
onta
ins
stee
l w
ith 1
1.0
0 %
Mn. T
he
dif
fere
nce
bet
wee
n t
his
tru
e va
lue
and
the
exper
imen
tal
resu
lt i
s pure
ly d
ue
to r
andom
err
or.
Fir
st, get
the
stat
isti
cal
info
rmat
ion a
lrea
dy d
escr
ibed
in t
his
appen
dix
. Y
ou s
hould
fin
d:
Aver
age
()
Sta
ndar
d d
evia
tion (
s)
95%
C.I
.
10.2
3
0.1
94
0.2
41
Acc
ord
ing t
o t
he
rule
s fo
r si
gnif
ican
t fi
gure
s, t
he
resu
lt i
s re
port
ed %
Mn =
10.2
± 0
.2 %
.
Now
, you t
est
the
hypoth
esis
by c
alcu
lati
ng t
he
t st
atis
tic
(tca
lc)
and c
om
par
ing i
t to
the
crit
ical
val
ue
of
t (t
crit)
in T
able
2 (
n =
5, 95%
, t
= 2
.776).
If
tca
lc >
tcrit t
hen
th
e
hyp
oth
esis
is
reje
cted
. S
tep b
y s
tep:
1.
Cal
cula
te t
:
wher
e
=
av
erag
e %
Mn =
10.2
3
µ =
tr
ue
val
ue
of
% M
n =
11.0
0 (
assu
med
for
this
tes
t)
s =
s
tandar
d d
evia
tion =
0.1
94
2.
Com
par
e t c
alc
wit
h t
crit. H
ere
t cal
c(8.8
7)
> t
crit(2
.776).
3.
Concl
ude
that
the
hypoth
esis
can
be
reje
cted
wit
h a
t le
ast
95%
cer
tain
ty.