experiment design: feel the beat - porter school · · 2015-04-061 experiment design, feel the...
TRANSCRIPT

1 Experiment Design, Feel the Beat Science Performance Task, Connecticut
Name _______________________ Period ________ Due: ___________
Curriculum-Embedded Performance Task Grade 7 Science Content Standard 7.2
Experiment Design:
Feel the Beat
Connecticut State Department of Education 2011 Edition
Modified: B.Kleinman, 2/2014
2 Experiment Design, Feel the Beat Science Performance Task, Connecticut
Methods for Measuring Pulse Rate
There are two methods for measuring pulse. You should sit quietly for several minutes before
measuring your “resting” pulse rate. You are to take your own pulse rate. Your partner may
time you. Try both ways, and then decide which way works best for you:
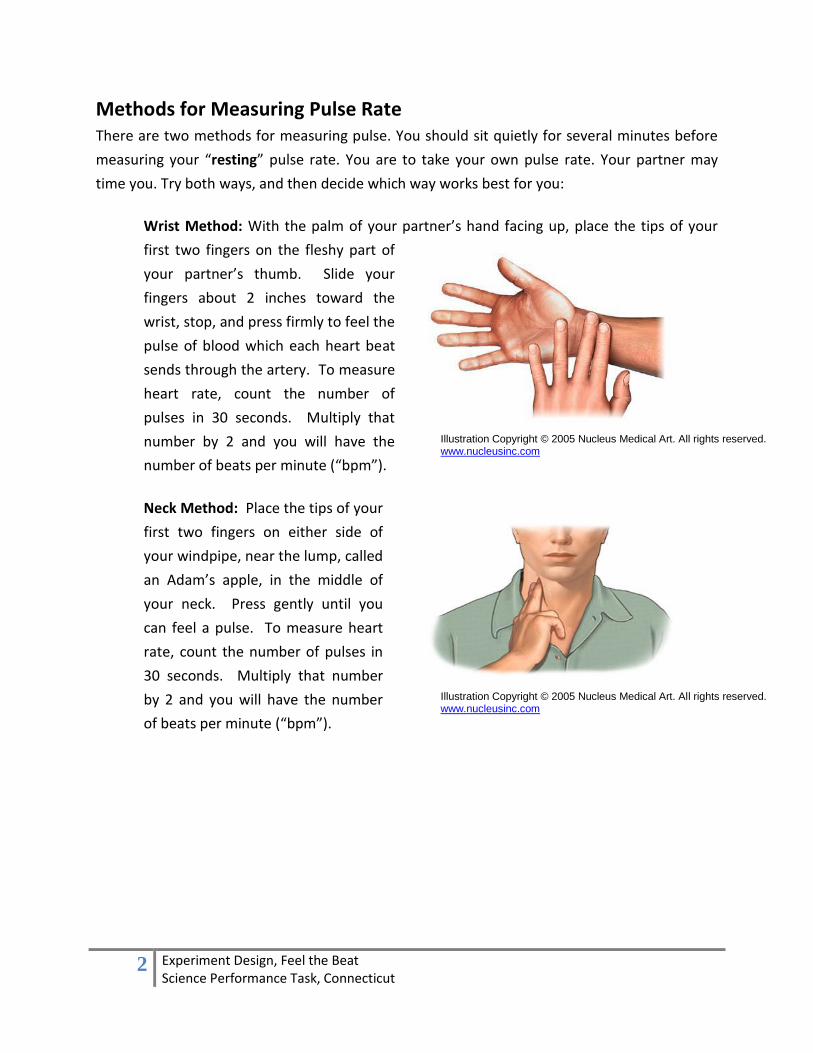
Wrist Method: With the palm of your partner’s hand facing up, place the tips of your
first two fingers on the fleshy part of
your partner’s thumb. Slide your
fingers about 2 inches toward the
wrist, stop, and press firmly to feel the
pulse of blood which each heart beat
sends through the artery. To measure
heart rate, count the number of
pulses in 30 seconds. Multiply that
number by 2 and you will have the
number of beats per minute (“bpm”).
Neck Method: Place the tips of your
first two fingers on either side of
your windpipe, near the lump, called
an Adam’s apple, in the middle of
your neck. Press gently until you
can feel a pulse. To measure heart
rate, count the number of pulses in
30 seconds. Multiply that number
by 2 and you will have the number
of beats per minute (“bpm”).
Illustration Copyright © 2005 Nucleus Medical Art. All rights reserved. www.nucleusinc.com
Illustration Copyright © 2005 Nucleus Medical Art. All rights reserved. www.nucleusinc.com

3 Experiment Design, Feel the Beat Science Performance Task, Connecticut
Inquiry--Exploration
Explore 1. Practice finding your pulse on your wrist or neck (Use 2 fingers and press down lightly).
Count the beats for 10 seconds and jot it down.
_________
2. How can you determine your pulse rate per minute?
__________________________________________________________________
3. How many beats did you have per minute? __________________
4. What is bpm? _______________________________________
5. What is “resting rate?”
__________________________________________________________________
__________________________________________________________________
6. Why will you take your resting rate in your experiment?
____________________________________________________________________
____________________________________________________________________
4 Experiment Design, Feel the Beat Science Performance Task, Connecticut
Inquiry-Raising Questions
INVESTIGATION: EFFECT ON PULSE RATE
Recall your initial heart rate observations and consider what you have learned about the
circulatory and respiratory systems in the Human Body Unit.
We already know that physical activity causes heart rate to increase.
What other variables might cause the heart to beat faster or slower? You might consider
height or body position (lying down, standing, sitting) or you might be interested in exploring
environmental factors, such as temperature, sound, or lighting.
With your partner, list out some possible factors you would like to explore:
________________________________________________
________________________________________________
________________________________________________
________________________________________________
With your partner, choose TWO comparative factors that can be investigated through a
scientific experiment in THIS classroom. (For example: Reading silently vs. reading aloud).
______________________________________________________________________________

5 Experiment Design, Feel the Beat Science Performance Task, Connecticut
Inquiry-Experiment Design
EFFECT OF DIFFERENT VARIABLES ON PULSE RATE
Work with your partner(s) to plan a controlled experiment.
PLAN YOUR EXPERIMENT
Using your selected activities…
Write the question you are investigating: ______________________________________________
________________________________________________________________________________
DEPENDENT VARIABLE (data): ____________________________________
INDEPENDENT VARIABLE (experimenter decides): __________________________________
CONTROLLED VARIABLES (keep the same throughout):
_________________________________________________________________________________
_________________________________________________________________________________
HYPOTHESIS (If…(IV), then…(DV)):
_________________________________________________________________________________
_________________________________________________________________________________
I made this hypothesis because
_________________________________________________________________________________
_________________________________________________________________________________
MATERIALS LIST:
______________________
______________________
______________________
______________________

6 Experiment Design, Feel the Beat Science Performance Task, Connecticut
Inquiry-Experiment Design II
DESIGN AN EXPERIMENT PROCEDURE to explore how different types of activity affect pulse rate.
Using your selected activities, describe how you will change the independent variable, measure the
dependent variable, and keep the other factors constant in your experiment. Include enough detail
so that you or someone else could repeat your experiment and get similar outcomes. You will
conduct at least 3 trials of each activity (including your resting rate). PROCEDURE Write in numbered step form. _________________________________________________________________________________
_________________________________________________________________________________
_________________________________________________________________________________
_________________________________________________________________________________
_________________________________________________________________________________
_________________________________________________________________________________
_________________________________________________________________________________
_________________________________________________________________________________
_________________________________________________________________________________
_________________________________________________________________________________
_________________________________________________________________________________
_________________________________________________________________________________
_________________________________________________________________________________
_________________________________________________________________________________
_________________________________________________________________________________
_________________________________________________________________________________
_________________________________________________________________________________
_________________________________________________________________________________
_________________________________________________________________________________
_________________________________________________________________________________
_________________________________________________________________________________
*Get your teacher’s approval before you begin your experiment.________________

7 Experiment Design, Feel the Beat Science Performance Task, Connecticut
Inquiry-Data Collection
Recording Data
DATA TABLE
Create a data table either on the following grid page. Make sure to include
the following:
Use a ruler for the lines
A title (The Effect of the IV on the DV)
Labels
o Trials—3 for each activity including resting rate
o Average for each activity
o Units (bpm)
Conduct your experiment and collect data.
Remember to ask yourself:
Do your data seem reasonable?
If not, go back and retest that trial!
8 Experiment Design, Feel the Beat Science Performance Task, Connecticut
9 Experiment Design, Feel the Beat Science Performance Task, Connecticut
Inquiry-Data Analysis
Analyzing Data: Graphing
GRAPH
Look at your data table. Determine what information you will graph and
what style graph* best represents this type of data. Use the following grid
page for your graph.
Make sure to include the following:
Use a ruler for the lines
A title (The Effect of the IV on the DV)
Label the x-axis and y-axis
o Include units where appropriate
Reasonable y-axis scale
Key
o Color coded (colored pencils)—one color per person
*Line Graph—shows a change over time.
Bar Graph—compare things.
Plot appropriate and accurate data that will lead you to a
scientific conclusion!
10 Experiment Design, Feel the Beat Science Performance Task, Connecticut

11 Experiment Design, Feel the Beat Science Performance Task, Connecticut
Inquiry-Communicating Conclusions
CONCLUSIONS What conclusion can you make based on your data? Write a draft report describing your experiment on the pages provided. Each paragraph should be 5 or more sentences. Then, in your lab group, peer edit each others’ papers. Make any changes necessary. **No fluff!** (Extra stuff that is written to take up space to meet paragraph requirements.) Your report should include: Paragraph 1
Was your hypothesis supported by the data? Why or why not?
Summarize your experiment. What were you testing? Paragraph 2
How did the activity affect heart rate? Use specific data points to support your statement.
Explain your results in scientific terms based on what you know about the human body and the cardiovascular system.
Paragraph 3
Error analysis: Compare your written procedure to what actually occurred during data collection. What errors occurred? If you were to do this experiment again, what could you do to avoid errors?
What new questions do you have about changes in heart rate? What ideas do you have for new experiments on heart rate (if you didn’t have the limitations of the classroom)?
______________________________________________________________________________
______________________________________________________________________________
______________________________________________________________________________
______________________________________________________________________________
______________________________________________________________________________
______________________________________________________________________________
______________________________________________________________________________
______________________________________________________________________________
______________________________________________________________________________
______________________________________________________________________________
______________________________________________________________________________
______________________________________________________________________________

12 Experiment Design, Feel the Beat Science Performance Task, Connecticut
______________________________________________________________________________
______________________________________________________________________________
______________________________________________________________________________
______________________________________________________________________________
______________________________________________________________________________
______________________________________________________________________________
______________________________________________________________________________
______________________________________________________________________________
______________________________________________________________________________
______________________________________________________________________________
______________________________________________________________________________
______________________________________________________________________________
______________________________________________________________________________
______________________________________________________________________________
______________________________________________________________________________
______________________________________________________________________________
______________________________________________________________________________
______________________________________________________________________________
______________________________________________________________________________
______________________________________________________________________________
______________________________________________________________________________
______________________________________________________________________________
______________________________________________________________________________
______________________________________________________________________________
______________________________________________________________________________
______________________________________________________________________________
______________________________________________________________________________
______________________________________________________________________________
______________________________________________________________________________

13 Experiment Design, Feel the Beat Science Performance Task, Connecticut
______________________________________________________________________________
______________________________________________________________________________
______________________________________________________________________________
______________________________________________________________________________
______________________________________________________________________________
______________________________________________________________________________
______________________________________________________________________________
______________________________________________________________________________
______________________________________________________________________________
______________________________________________________________________________
______________________________________________________________________________
______________________________________________________________________________
______________________________________________________________________________
______________________________________________________________________________
______________________________________________________________________________
______________________________________________________________________________
______________________________________________________________________________
______________________________________________________________________________
______________________________________________________________________________
______________________________________________________________________________
______________________________________________________________________________
______________________________________________________________________________
______________________________________________________________________________
______________________________________________________________________________
______________________________________________________________________________
______________________________________________________________________________
______________________________________________________________________________

14 Experiment Design, Feel the Beat Science Performance Task, Connecticut
Formal Lab Report Directions:
1. You are to TYPE up a formal lab report.
Use the font, Calibri, size 11 (default settings).
Set the line spacing to 2.0 for the written sections.
2. Write using complete sentences.
Use proper conventions: punctuation, spelling, and grammar.
REVISE—content, wording.
EDIT—fix conventions.
Avoid using personal pronouns in science writing—NO I, me, or we. You would instead
say, the subject(s) or the student(s).
3. Each section should be separate and identifiable by its header which is to be underlined. See
below.
*************************************************************************
Name Date Due
Title Block #
Purpose (5 sentences minimum)
What you are investigating—rephrase your scientific question into a statement.
Write a statement describing each of the variables—three sentences total. One for the
independent variable, the dependent variable, and the controlled variables.
Write a sentence describing the control for this experiment.
Hypothesis (2 sentences minimum)
State your hypothesis.
Explain your reasoning (from the “because” section on your plan sheet).
Materials
List out the materials necessary to carry out the experiment.
Use a bulleted format.
Procedure
Step by step instructions to do your experiment.
Must be replicable!
Use a numbered format:
1.
2.
3.…

15 Experiment Design, Feel the Beat Science Performance Task, Connecticut
Results
Recreate your data table either in Word (using the chart tools) or in Excel. Make sure the table
has a proper title and labels.
For the graph, you may either do it by hand neatly using a ruler OR on the computer in Word or
Excel (only if you already know how). Make sure your graph has a proper title and labels. If your
original graph is exceptionally done, you may remove it from the packet and include into the
formal report.
Conclusion (3 paragraph minimum, at least 5 sentences per paragraph)
Use the paragraph guidelines from page 11.
Remember to indent each new paragraph—hit the ‘Tab’ key once.
See me with any specific questions or to set up a time for extra help writing
your formal lab report.