experimental analysis and modeling of biomass gasification
TRANSCRIPT

i
Experimental Analysis and Modeling of Biomass Gasification using a
Downdraft Gasifier
by
Ravindra Shrestha
A thesis submitted to the Graduate Faculty of
Auburn University
in partial fulfillment of the
requirements for the Degree of
Master of Science
Auburn, Alabama
December 13, 2014
Keywords: gasification, biomass blends, downdraft gasifier, modeling
Copyright 2014 by Ravindra Shrestha
Approved by
Sushil Adhikari, Chair, Associate Professor of Biosystems Engineering
Oladiran Fasina, Professor of Biosystems Engineering
Timothy McDonald, Associate Professor of Biosystems Engineering

ii
Abstract
The call for the use of renewable energy is an urgent one, for not the future but the present.
Concerns over depletion of fossil fuels and their negative impact on the global climate have led
to much research in this sector. Gasification of biomass for energy production is not only
environmentally sustainable but also economically beneficial as it reduces the dependence on
imported fuel. Through this thermo-chemical process, biomass is converted into a mixture of
combustible gases known as syngas (a.k.a. producer gas) which can be directly used for heat or
power, and also synthesized into liquid fuels.
The major objective of this study was to understand the effect of different biomass feedstock on
the quality of syngas produced through gasification in a downdraft gasifier. Hardwood, loblolly
pine, switchgrass, yellow pine and torrefied pine pellets, pine chips and bark were used as the
feedstocks for experiments. Compositions of major gases (H2, CO, CO2 and CH4) and
contaminants (tar and H2S) were determined, and mass, energy and exergy analyses were
performed to substantiate the experimental results. Switchgrass had the highest ash content of
4.66% (d.b.) followed by pine bark (1.59% d.b.) while other feedstocks had lower ash content.
Carbon content ranged from 47 to 56% (d.b.), hydrogen from 6.50 to 7.50% (d.b.) and sulfur
from 0.32 to 0.40% (d.b.) for all the feedstocks. The higher heating values (HHV) of biomass
types ranged from 19 MJ/kg (switchgrass) to 23 MJ/kg (torrefied pine). Syngas obtained from
yellow pine showed the highest hydrogen (17.35%) and carbon monoxide (25.05%) fraction and
the highest HHV (6 MJ/Nm3), while switchgrass and loblolly pine had significantly lower
concentration of H2 and CO as well as lower HHV. Loblolly pine showed the highest total tar

iii
concentration (2.54g/m3) along with higher concentration of condensable tar compound, indene
(>0.1 g/m3). The hydrogen sulfide concentration was found to be above 70 ppmv for all the
feedstocks, which is higher than the tolerable limit for many syngas applications.
Furthermore, biomass feedstocks that have higher ash content were blended with other lower ash
content biomass (switchgrass w/ yellow pine and pine bark w/ pine chips) and similar
gasification experiments were carried out. Owing to reduced ash content, gasification of
switchgrass/yellow pine blends did not show any ash agglomeration. The hydrogen and carbon
monoxide concentrations in syngas obtained from yellow pine/switchgrass blends were higher
compared to switchgrass alone, while those from pine chips/bark blends were not significantly
different from individual runs. The 75:25 and 50:50 blends of yellow pine and switchgrass
showed a total tar concentration of 1.97 g/m3 and 1.86 g/m3, respectively, while the
concentrations for the 75:25 and 50:50 blends of pine chips and bark were 1.66 g/m3 and 1.57
g/m3, respectively. The hydrogen sulfide concentration was found to be above 65 ppmv for both
the yellow pine/switchgrass and pine chips/bark blends.
In addition, commercial software, Comprehensive Simulator of Fluidized and Moving Bed
Equipment (CeSFaMB), was applied to simulate the gasification process. It was able to
reproduce the syngas composition within 5-10% deviation for all the major gases except
methane. Moreover, a parametric study was conducted to evaluate the effect of factors such as
mass flow rate and moisture content of feeding fuel, injected gas/air flow rate, elemental
composition and proximate analyses of biomass feedstocks on the program.
iv
Acknowledgments
My deepest gratitude goes to Dr. Sushil Adhikari for his constant support and guidance
throughout this research. It was really my good fortune to work under his supervision and I have
gained much insight from his knowledge and expertise in this field.
I really appreciate the immense effort put in by Christian Brodbeck, James Johnson and Jonathan
Griffith to help me during the experiments. Without their assistance, the gasification work would
not have been possible. I would also like to thank the Center for Bioenergy and Bioproducts at
Auburn University for provision of the commercial downdraft gasifier and other laboratory
equipment. I am grateful for the funding provided by Integrated Biomass Supply Systems (IBSS)
partnership and the United States Department of Agriculture (USDA), National Institute of Food
and Agriculture. I would also like to acknowledge the Department of Biosystems Engineering
and the most wonderful fellow graduate students.
Lastly, I want to thank my parents and sisters, and all my friends for their relentless love and
support.

v
Table of Contents
Abstract ......................................................................................................................................................... ii
Acknowledgments ........................................................................................................................................ iv
List of Tables ............................................................................................................................................... ix
List of Figures ............................................................................................................................................... x
1. INTRODUCTION ................................................................................................................................ 1
1.1 Rationale ....................................................................................................................................... 1
1.2 Sources of Biomass ....................................................................................................................... 2
1.3 Biomass Properties ........................................................................................................................ 3
1.4 Goals and Objectives .................................................................................................................... 5
1.4.1 Specific Objectives ............................................................................................................... 5
1.4.2 Structure of Thesis ................................................................................................................ 5
1.5 References ..................................................................................................................................... 6
2. LITERATURE REVIEW ..................................................................................................................... 8
2.1 Introduction ................................................................................................................................... 8
2.2 Biomass Energy Conversion: Gasification ................................................................................. 10
2.2.1 Drying ................................................................................................................................. 11
2.2.2 Pyrolysis .............................................................................................................................. 12
2.2.3 Char Gasification/Combustion ............................................................................................ 12
2.3 Types of Gasifiers ....................................................................................................................... 12
2.3.1 Updraft Gasifier .................................................................................................................. 13
2.3.2 Downdraft Gasifier ............................................................................................................. 14
2.3.3 Fluidized Bed Gasifier ........................................................................................................ 15
2.4 Syngas Quality Considerations ................................................................................................... 17
2.4.1 Biomass Feedstock .............................................................................................................. 17
2.4.2 Moisture Content................................................................................................................. 18
2.4.3 Temperature ........................................................................................................................ 19
2.4.4 Equivalence Ratio ............................................................................................................... 20

vi
2.4.5 Particle Size ........................................................................................................................ 20
2.5 Syngas Contaminants .................................................................................................................. 21
2.5.1 Sulfur ................................................................................................................................... 21
2.5.2 Nitrogen .............................................................................................................................. 21
2.5.3 Chlorine ............................................................................................................................... 22
2.5.4 Particulate Matter ................................................................................................................ 22
2.5.5 Tar ....................................................................................................................................... 23
2.6 Comprehensive Simulator of Fluidized and Moving Bed Equipment (CeSFaMB) .................... 25
2.6.1 Background ......................................................................................................................... 25
2.6.2 Working Principle ............................................................................................................... 26
2.7 References .................................................................................................................................. 27
3. GASIFICATION OF DIFFERENT BIOMASS FEEDSTOCKS ....................................................... 34
3.1 Abstract ....................................................................................................................................... 34
3.2 Introduction ................................................................................................................................. 35
3.3 Experimental Setup ..................................................................................................................... 36
3.4 Data Collection ........................................................................................................................... 38
3.4.1 Characterization of Biomass ............................................................................................... 38
3.4.2 Syngas Composition ........................................................................................................... 40
3.4.3 Carbon, Energy and Exergy Analyses ................................................................................ 40
3.4.4 Ash Composition Analysis .................................................................................................. 44
3.4.5 Syngas Contaminants .......................................................................................................... 44
3.4.6 Experimental Design and Statistical Analysis .................................................................... 47
3.5 Results and Discussion ............................................................................................................... 47
3.5.1 Analyses of Feedstock ........................................................................................................ 47
3.5.2 Gasification Results ............................................................................................................ 50
3.6.2 Carbon, Energy and Exergy Analyses ................................................................................ 54
3.6.3 Tar Concentration ............................................................................................................... 55
3.6.4 Hydrogen Sulfide Concentration......................................................................................... 56
3.7 Conclusions and Remarks ........................................................................................................... 57
3.8 References ................................................................................................................................... 58
4. GASIFICATION OF BLENDED BIOMASS FEEDSTOCKS .......................................................... 62
4.1 Abstract ....................................................................................................................................... 62

vii
4.2 Introduction ................................................................................................................................. 63
4.3 Experimental Setup ..................................................................................................................... 64
4.4 Data Collection ........................................................................................................................... 64
4.5 Results and Discussion ............................................................................................................... 65
4.5.1 Analyses of Feedstock ........................................................................................................ 65
4.5.2 Gasification of Biomass Blends .......................................................................................... 67
4.5.3 Carbon, Energy and Exergy Analyses ................................................................................ 70
4.5.4 Tar Concentration ............................................................................................................... 70
4.5.5 Hydrogen Sulfide Concentration......................................................................................... 72
4.6 Conclusions and Remarks ........................................................................................................... 74
4.7 References ................................................................................................................................... 74
5. COMPREHENSIVE SIMULATOR APPLIED TO DOWNDRAFT GASIFICATION .................... 76
5.1 Abstract ....................................................................................................................................... 76
5.2 Introduction ................................................................................................................................. 77
5.3 Methodology ............................................................................................................................... 79
5.3.1 Model Assumptions for a Downdraft Gasifier ................................................................... 79
5.3.2 Program Input ..................................................................................................................... 80
5.4 Results and Discussion ............................................................................................................... 85
5.4.1 Calibration of Reaction Kinetics ......................................................................................... 86
5.4.2 Application of Calibrated Program to Other Feeding Fuels ............................................... 91
5.5 Parametric Study ......................................................................................................................... 92
5.5.1 Equivalence Ratio (E.R.) .................................................................................................... 92
5.5.2 Moisture Content................................................................................................................. 93
5.5.3 Biomass Feed Rate .............................................................................................................. 94
5.5.4 Properties of Biomass: Proximate and Ultimate Analyses .................................................. 95
5.6 Conclusions ................................................................................................................................. 97
5.7 References ................................................................................................................................... 98
6. SUMMARY AND FUTURE WORK .............................................................................................. 100
6.1 Concluding Remarks ................................................................................................................. 100
6.2 Limitations and Recommendations for Future Work ................................................................ 101
APPENDIX A: SUPPLEMENTAL (LABVIEW) DATA FROM GASIFIER ........................................ 103
A.1 Syngas composition data generated by CAI gas analyzer (torrefied pine pellets) .................... 103
viii
A.2 Temperature profile inside the reactor (torrefied pine pellets gasification) .............................. 105
APPENDIX B: SAMPLE CALCULATIONS ......................................................................................... 109
B.1 Higher Heating Value (HHV) of Syngas .................................................................................. 109
B.2 Carbon, Energy and Exergy Analyses ...................................................................................... 109
B.2.1 Carbon Conversion ............................................................................................................... 110
B.2.2 Hot and Cold Gas Efficiency ................................................................................................ 111
B.2.3 Exergy ................................................................................................................................... 113
APPENDIX C: TAR COMPOUNDS ....................................................................................................... 115
APPENDIX D: CESFAMB MODEL PARAMETERS ............................................................................ 116
D.1 Input Parameters ....................................................................................................................... 116
D.2 Output Parameters ..................................................................................................................... 117
ix
List of Tables
Table 1.1 Classification of biomass ............................................................................................................. 2
Table 1.2 Proximate analysis of common biomass (w.b.%) ......................................................................... 4
Table 1.3 Elemental analysis of common biomass (as received) .................................................................. 5
Table 2.1 Syngas composition from different gasifiers .............................................................................. 13
Table 2.2 Classification of tar compounds .................................................................................................. 24
Table 3.1 Empirical coefficients of gases ................................................................................................... 42
Table 3.2 Properties of syngas constituents ................................................................................................ 43
Table 3.3 Proximate analysis of biomass (d.b.%) ....................................................................................... 48
Table 3.4 Elemental (ultimate) analysis of biomass (ash free d.b.%) ......................................................... 48
Table 3.5 Higher heating value (d.b.) and density of biomass .................................................................... 49
Table 3.6 Major inorganic composition (mg/kg biomass) .......................................................................... 50
Table 3.7 Determination of alkali index (AI) and bed agglomeration index (BAI) .................................... 50
Table 3.8 Experimental conditions for different feedstocks ....................................................................... 51
Table 3.9 Composition and higher heating value of syngas from different feedstocks .............................. 52
Table 3.10 Carbon, energy and exergy analyses of different biomass (%) ................................................. 54
Table 4.1 Proximate analysis of biomass blends (d.b.%) ........................................................................... 65
Table 4.2 Ultimate analysis of biomass blends (ash free d.b.%) ................................................................ 66
Table 4.3 Higher heating values (d.b.) and densities of feedstock.............................................................. 66
Table 4.4 Experimental conditions for different feedstocks ....................................................................... 67
Table 4.5 Composition of syngas from different biomass blends ............................................................... 68
Table 4.6 Carbon, energy and exergy analyses ........................................................................................... 70
Table 5.1 Gasifier data ................................................................................................................................ 81
Table 5.2 Characteristics of feeding fuel .................................................................................................... 82
Table 5.3 Particle size distributions of loblolly, hardwood and switchgrass pellets ................................... 83
Table 5.4 Particle size distributions of yellow and torrefied pine pellets, and pine chips and bark ........... 84
Table 5.5 Syngas composition (molar d.b. %) produced from loblolly pine pellets obtained during
gasification and respective simulation results obtained without calibration .............................. 86
Table 5.6 Kinetic parameters of reactions .................................................................................................. 87
Table 5.7 Syngas composition (molar d.b.%) produced from loblolly pine pellets obtained during
gasification and respective simulation results obtained after calibration ................................... 87
Table 5.8 Proximate analysis (w.b.%) of switchgrass samples ................................................................... 96
Table 5.9 Ultimate analysis (ash free d.b.%) of switchgrass samples ........................................................ 96
Table B.1 Syngas composition (yellow pine) midway through the test………………………………………….….….109
Table B.2 Properties of syngas constituents……………………………………………………………………………….….…....112
Table B.3 Empirical coefficients of gases…………………………………………………………………………………….…..….113
Table B.4 Properties of constituent gases……………………………………………………………………………..……….…....114
Table C.1 Retention time of tar compounds.............................................................................................115

x
List of Figures
Figure 2.1 Energy consumption scenario in the United States, 2013 ........................................................... 9
Figure 2.2 Updraft gasifier………….. ............................................................................................................. 14
Figure 2.3 Downdraft gasifier…………………………………………………………………………………………………………………14
Figure 2.4 Bubbling fluidized bed gasifier ................................................................................................. 16
Figure 2.5 Circulating fluidized bed gasifier .............................................................................................. 17
Figure 3.1 BioMax downdraft gasifier ........................................................................................................ 37
Figure 3.2 CAI gas analyzer ....................................................................................................................... 37
Figure 3.3 Biomass feedstocks used for gasification .................................................................................. 38
Figure 3.4 Tar collection set up .................................................................................................................. 45
Figure 3.5 Agilent GC FID ......................................................................................................................... 45
Figure 3.6 Syngas collection setup for H2S ................................................................................................ 47
Figure 3.7 Agilent GC FPD ........................................................................................................................ 47
Figure 3.8 Effect of E.R. on higher heating value of syngas ...................................................................... 53
Figure 3.9 Effect of ash content of biomass on higher heating value of syngas ......................................... 53
Figure 3.10 Tar concentration in syngas from gasification of feedstocks .................................................. 56
Figure 3.11 H2S concentration in syngas from different biomass feedstock .............................................. 57
Figure 4.1 Concrete mixer for blending biomass ........................................................................................ 64
Figure 4.2 HHV of syngas from blends of yellow pine and switchgrass .................................................... 69
Figure 4.3 HHV of syngas from blends of pine chips and bark .................................................................. 69
Figure 4.4 Tar concentration in syngas from yellow pine/switchgrass blends ........................................... 71
Figure 4.5 Tar concentration in syngas from pine chips/bark blends ......................................................... 72
Figure 4.6 H2S concentration in syngas from yellow pine and switchgrass blends .................................... 73
Figure 4.7 H2S concentration in syngas from pine chips and bark blends .................................................. 73
Figure 5.1 Molar fraction profiles of CO, CO2 and O2 throughout the reactor ........................................... 88
Figure 5.2 Molar fraction profiles of CO, CO2 and O2 (Y-logarithmic).................................................... 89
Figure 5.3 Molar fraction profiles of H2O, H2 and CH4 throughout the reactor ......................................... 89
Figure 5.4 Reaction rates of homogeneous reactions throughout the reactor ............................................. 90
Figure 5.5 Reaction rates of reactions throughout the reactor .................................................................... 90
Figure 5.6 Syngas composition: hardwood….. ............................................................................................ 91
Figure 5.7 Syngas composition: switchgrass……………………………………………………………………………………….….91
Figure 5.8 Syngas composition: pine chips….. .......................................................................................... ..91
Figure 5.9 Syngas composition: yellow pine…………………………………………………………………………….………..….92
Figure 5.10 Syngas composition: torrefied pine….. .................................................................................. ..92
Figure 5.11 Syngas composition: pine bark……………………………………………………………………….……….….…..….92
Figure 5.12 Effect of equivalence ratio on the concentration of syngas constituents ................................. 93
Figure 5.13 Effect of moisture content of biomass on the concentration of syngas constituents ............... 94

xi
Figure 5.14 Effect of biomass flow rate on the concentration of syngas constituents ................................ 95
Figure 5.15 Simulation of syngas composition from switchgrass samples................................................. 97
Figure A.1 Hydrogen concentration over time……………………………………………………………………………………...103
Figure A.2 Carbon monoxide concentration over time……………………………………………………………………….…104
Figure A.3 Carbon dioxide concentration over time………………………………………………………………………….….104
Figure A.4 Methane concentration over time………………………………………………………………………………………..105
Figure A.5 Temperature profile recorded by thermocouple T1………………………………………………………….….105
Figure A.6 Temperature profile recorded by thermocouple T2………………………………………………………….….106
Figure A.7 Temperature profile recorded by thermocouple T3………………………………………………………….….106
Figure A.8 Temperature profile recorded by thermocouple T4……………………………………………………………..107
Figure A.9 Temperature profile recorded by thermocouple T5……………………………………………………………..107
Figure A.10 Temperature profile recorded at grate…………………………………………………………………………..……108

1
CHAPTER ONE
INTRODUCTION
1.1 Rationale
Biomass can be a viable replacement of fossil fuels whether it is used as a feedstock for fuels,
materials or chemicals production. Although fossil fuels such as oil, coal and gas are easily
available and provide a large share of energy at present. However, their finite and non-renewable
nature makes them unreliable for the distant future. Adverse effects of fossil fuel use on the
environment and high dependence on foreign oil have shifted the focus on to alternative sources
of energy. Not only does biomass reduce dependence on imported fuel, it also does not
contribute any net carbon to the atmosphere. The Energy Independence and Security Act (EISA)
of 2007 has mandated that by 2022, the transportation fuels in the United States must contain at
least 36 billion gallons of renewable fuels [1]. Under Title II of the same act, energy security
through increased production of biofuels has been significantly emphasized. Development of
cellulosic biofuels has been greatly focused to ensure availability of adequate feedstocks to
sustain a bioenergy industry.
The purpose of gasification is not just conversion of solid or liquid fuel into syngas; production
of chemical feedstocks is also an important application. Another major attraction is the
conversion of low cost, and at times waste biomass into high value fuels. Hence, biomass
gasification for production of liquid transportation fuels and synthetic chemicals (such as
methanol) has been the subject of much research. The process needs to overcome barriers such as

2
removal of tars and contaminants, issues related to production, logistics, and pretreatment of
biomass feedstocks [2]. Production of quality syngas is the most crucial aspect of gasification.
The composition and quantity of syngas mainly depends on biomass properties and gasifier
operating conditions [3].
1.2 Sources of Biomass
Basically, biomass is grouped according to the sources which include all plants and plant-derived
materials. Table 1.1 shows the two major groups of biomass and their subdivisions. Most
common sources are from agricultural and forestry operations.
Table 1.1 Classification of biomass [4]
Virgin Waste
Terrestrial: Forest wood, plants and leaves
(lignocellulose), grasses, cultivated and
energy crops
Aquatic: Algae, water plant
Municipal waste: Solid wastes, sewage
landfill gas
Agricultural solid waste: Livestock manure,
crop residue
Forestry residues: Bark, leaves
Industrial wastes: Sawdust, waste oil or fat
There is a growing interest in cultivation of lignocellulosic biomass such as miscanthus,
switchgrass, willow, and poplar for the sole purpose of energy production [4]. In addition to
having a short growth period and high yields, they usually require little to no fertilizer at all, thus
providing a quick return on investment. Lignocellulosic material is the non-starch, fibrous part of
plants and trees which is not consumable, and thus, its use for bioenergy does not affect the food
supply. Short rotation crops of hardwood tree and conifer species in temperate regions have been
studied for feasibility of energy plantations [5]. Loblolly pine (Pinus taeda L.) is one of the few
species that has shown strong economic potential through its rapid growth and established

3
genetic improvement [1]. According to recent research, advances in loblolly pine breeding and
selection has substantially improved the species’ productivity for use as bioenergy feedstock [6].
1.3 Biomass Properties
Being derived from diverse sources, biomass materials do not have single unique property that
make them suitable for thermal conversion processes. All physical, chemical and biological
properties are taken into account and almost always the biomass needs to undergo pretreatment
or preprocessing [7]. Physical properties basically deal with geometric and gravimetric
characteristics such as shape and size, surface area, density and volume, porosity, etc. of
biological materials [8]. The most important physical properties include particle and bulk
density, particle size and particle size distribution. In terms of thermal processes, the proximate
and ultimate analyses, and the heating values are most significant. For biomass with high ash
content such as switchgrass, the fusion temperature or the eutectic point is an essential factor
related to slagging and fouling problems in biomass thermal conversion equipment. For
biological or biochemical conversion, the amount of lignin, carbohydrates and extractives are
important factors.
Particle and bulk density: Particle density is the measure of the biomass particle mass per unit
volume (kg/m3 or lb/ft3) occupied by that particle. It includes the volume of all closed pores with
the exception of externally connected pores [9]. The measure of bulk density however, includes
the void spaces occupied by the biomass. Depending on the species and form, woody biomass
has a wide range of density. For example, hardwood (oak) chips has a bulk density of roughly
200 kg/m3 [3] while dry wood shavings’ bulk density is about 80-100 kg/m3 [7].
Particle size and particle size distribution: Almost all types of biomass materials need to be
size-reduced after being harvested before they can be used in any conversion process. Particle
4
size of solid fuels largely influences the residence time and the reactions taking place during
gasification [10]. In general, biomass materials are ground to less than 10 mm in size for various
conversion processes and their particle size distribution is measured using standard sieves [7].
Heating value analysis: It is one of the most important characteristics of biomass which
basically gives its energy content. By using a calorimeter, the biomass is combusted in pure
oxygen and the energy released during that process is measured. This value is highly dependent
on the presence of moisture in biomass. It is recommended to report the heating value of
feedstock on dry basis (excludes moisture).
Proximate analysis: It includes the measurement of moisture content, volatile matter, fixed
carbon and ash. Moisture is very critical for biomass transportation as well as for any conversion
process. In most cases, drying is a pre-requisite since moisture content can be as high as 99% for
some aquatic biomass such as algae. Volatiles lead to more combustible gases during thermal
conversion. Ash is an inorganic constituent of biomass which contributes to adverse effects such
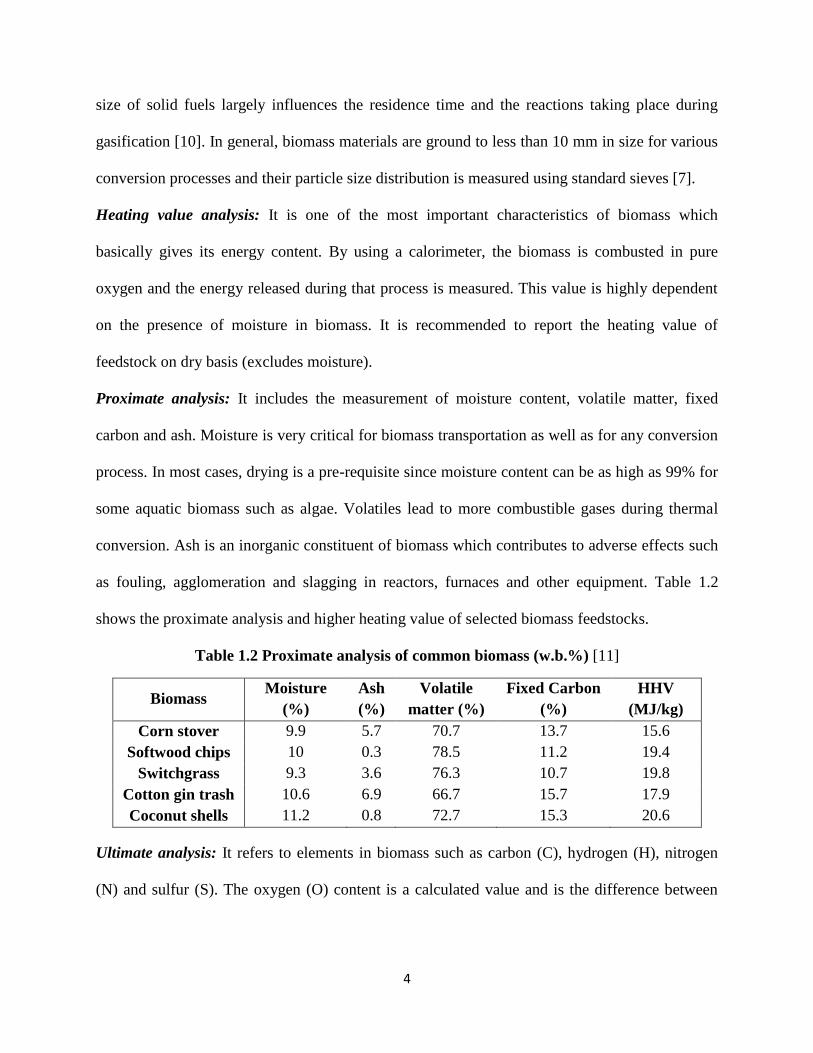
as fouling, agglomeration and slagging in reactors, furnaces and other equipment. Table 1.2
shows the proximate analysis and higher heating value of selected biomass feedstocks.
Table 1.2 Proximate analysis of common biomass (w.b.%) [11]
Biomass Moisture
(%)
Ash
(%)
Volatile
matter (%)
Fixed Carbon
(%)
HHV
(MJ/kg)
Corn stover 9.9 5.7 70.7 13.7 15.6
Softwood chips 10 0.3 78.5 11.2 19.4
Switchgrass 9.3 3.6 76.3 10.7 19.8
Cotton gin trash 10.6 6.9 66.7 15.7 17.9
Coconut shells 11.2 0.8 72.7 15.3 20.6
Ultimate analysis: It refers to elements in biomass such as carbon (C), hydrogen (H), nitrogen
(N) and sulfur (S). The oxygen (O) content is a calculated value and is the difference between

5
100% and the sum of the previous elements. Ultimate analysis of common biomass is shown in
Table 1.3.
Table 1.3 Elemental analysis of common biomass (as received) [11, 12]
Biomass C (%) H (%) N (%) S (%) O (%) Ash (%)
Alabama oak 49.5 5.7 0.2 0.0 41.3 3.3
Softwood chips 46.1 6.6 0.2 0.1 46.6 0.4
Switchgrass 42 6.1 0.4 0.1 57.4 4.0
Pine bark 52.3 5.8 0.2 0.0 38.8 2.9
Coconut shells 46.9 6.1 0.3 0.2 45.7 0.9
1.4 Goals and Objectives
The overall goal of this research was to evaluate the effect of different biomass types in
gasification, and validate the commercial software - Comprehensive Simulator for Fluidized and
Moving Bed Equipment (CeSFaMB), for simulation of a gasification process.
1.4.1 Specific Objectives
To study the effect of different biomass types and form on syngas composition and
contaminants;
To evaluate the effect of biomass blends having different ash contents on syngas
composition and contaminants;
To simulate the gasification process of different biomass feedstocks using CeSFaMB and
compare the model results with experimental; and
To identify the effect of key parameters such as equivalence ratio, biomass feed rate and
moisture content on the model.
1.4.2 Structure of Thesis
The thesis has been organized into chapters in order of the studies that were carried out. A brief
description of the remaining chapters is as follows:

6
Chapter two comprises the literature review carried out beforehand in order to develop
fundamental understanding of the processes that will be applied in this study. It also
includes the present scenario in the field of gasification along with description and results
from some of the most important studies performed.
Chapter three covers the experimental study of gasification performed using different
biomass feedstocks in a downdraft gasifier. It includes results and analyses from
characterization of biomass, composition, heating value and contaminants of syngas, and
mass and energy balances.
Chapter four encompasses the experimental study of gasification using blended biomass
feedstock. The methodology and analyses carried out were the same as in chapter three.
Chapter five incorporates the application of CeSFaMB, the software to simulate the
gasification process using the feedstocks discussed in chapter three.
Appendices include sample calculations, tabulated data for figures and additional
information from the downdraft gasification process.
1.5 References
[1] R. Kantavichai, T. V. Gallagher and L. D. Teeter, "Assessing the economic feasibility of
short rotation loblolly biomass plantations," Forest Policy and Economics, vol. 38, pp. 126-
131, 2014.
[2] M. Lapuerta, J. J. Hernandez, A. Pazo and J. Lopez, "Gasification and co-gasification of
biomass wastes: Effect of the biomass origin and the gasifier operating conditions," Fuel
Processing Technology , vol. 89, pp. 828-837, 2008.
[3] L. Wei, J. A. Thomasson, R. M. Bricka, R. Sui, J. R. Wooten and E. P. Columbus, "Syngas
quality evaluation for biomass gasification with a downdraft gasifier," Transactions of the

7
ASABE, vol. 52, no. 0001-2351, pp. 21-37, 2009.
[4] P. Basu, Biomass Gasification and Pyrolysis, Burlington, MA: Academic Press/Elsevier,
2010.
[5] D. I. Dickman, "Silviculture and biology of short rotation woody crops in temperate regions:
then and now," Biomass and Bioenergy, vol. 30, pp. 696-705, 2006.
[6] J. M. F. Johnson, M. D. Coleman, R. Gesch, A. Jaradat, R. B. Mitchell, D. Reicosky and W.
W. Wilhelm, "Biomass-bioenergy crops in the United States: a changing paradigm," The
Americas Journal of Plant Science and Biotechnology, vol. 1, pp. 1-28, 2007.
[7] S. C. Capareda, Introduction to Biomass Energy Conversions, Boca Raton, FL: CRC Press,
Taylor & Francis Group, 2014.
[8] N. N. Mohsenin, Physical Properties of Plant and Animal materials, New York: Gorden and
Breach Publishers, 1986.
[9] M. S. Rahman, "Mass-Volume-Area Related Properties of Foods," in Engineering
Properties of Foods, Taylor and Francis Group, 2005, pp. 1-40.
[10] J. J. Hernandez, G. Aranda-Almansa and A. Bula, "Gasification of biomass wastes in an
entrained flow gasifier: Effect of particle size and the residence time," Fuel Processing
Technology, vol. 91, pp. 681-692, 2010.
[11] "BioEnergy Testing and Analysis Laboratory," Texas A&M University, [Online].
Available: http://betalab.tamu.edu.
[12] W. A. LePori and E. J. Soltes, "Thermochemical conversion for energy and fuel," in
Biomass Energy: A Monograph (E.A. Hiler amd B.A. Stout, eds.), College Station, The
Texas A&M University Press, 1985.

8
CHAPTER TWO
LITERATURE REVIEW
2.1 Introduction
Two phrases synonymous with the world’s present energy scenario are energy conservation and
environmental impact. Driven by industrial growth in the developing countries, the world energy
consumption is expected to increase by 56% over the next three decades [1]. It was highlighted
in the International Energy Outlook 2013 report [1] that renewable energy and nuclear power are
the world's fastest-growing energy sources, both increasing by 2.5 % every year. However, fossil
fuels would continue to supply almost 80 percent of the world energy use through 2040.
Depletion of conventional fossil fuels, which have proved to be hazardous to the environment,
has led to much research on finding better alternatives. There have been some vivid changes in
the energy market over the last decade. After the oil prices skyrocketed in 2008, there was a lot
of speculation of renewable energy sources taking over a larger share of the energy consumption.
However, by the end of the same year, the oil prices plummeted and the exponential growth of
renewable energy was not actually realized. Even so, the growth of the renewable energy sector
has been slow yet steady. Research and development efforts have been focused on different
renewable resources owing to dwindling fossil fuels, need of energy security and environmental
concerns [2].
Biomass refers to a variety of living species, from grasses to trees, from insects to animal wastes
and the products derived from these [3]. Primary sources include forest- and agriculture-derived

9
biomass, such as logging residues, biomass from forest thinnings, crop residues, and perennially
grown grasses and trees. They are known to have the greatest potential to supply large and
sustainable quantities of biomass [2]. Biomass, if converted into energy through a pathway that is
economical and efficient, has shown promising future. It could help in promoting energy
independence, economic growth and reducing the negative impact to the environment. The
health impact of air pollution is a significant problem in the developing countries, where fuel
wood is burnt inefficiently in open fires for domestic cooking and space heating [4].
Figure 2.1 Energy consumption scenario in the United States, 2013 [1]
The use of biomass for power supply has been extensive in the developing countries, especially
in remote areas untouched by the grid. For renewable energy utilization and solving partially the
environmental issues, biomass energy has been marked as an economical and efficient
alternative to conventional fuel sources [5]. As shown in Figure 2.1, biomass currently accounts
for approximately 3% of the total energy consumption in the United States. Moreover, the supply
of biofuels is projected to rise from 1 million barrels/day in 2010 to 3.4 million barrels/day in
Liquid Fuels & Petroleum
37.55%
Natural Gas, 26.87%
Coal, 19.02%
Nuclear, 8.42%
Hydropower, 2.75%
Biomass, 2.91%
Other Renewables, 2.13%
Other , 0.35%

10
2035, meeting 37% of road transport demand in Brazil, 19% in the US and 16% in the European
Union [6]. Efforts to produce more ethanol from nonfood resources (lignocellulosic materials)
are being made so as not to hamper the food supply in any way [3].
2.2 Biomass Energy Conversion: Gasification
Basically, there are four biomass conversion technologies: direct combustion, thermochemical
process, biochemical process and chemical conversion process. Among them, the
thermochemical conversion process which includes gasification and pyrolysis has been
extensively studied and proven to have a promising future. Biomass gasification has been studied
to show higher efficiencies among the thermochemical processes and is attracting a lot of
research interest [7]. Gasification is a partial combustion process which converts solid
carbonaceous fuel into a mixture of combustible gas, primarily carbon monoxide, hydrogen,
methane, carbon dioxide and nitrogen. This gas mixture, known as syngas (or producer gas), can
be used for fuel or power production [8]. One of the major advantages of syngas is that it burns
more efficiently, with fewer emissions, thus giving it an edge over direct combustion of biomass.
It also means that syngas can be run directly into engines or turbines for transportation or power
generation.
The process of gasification comprises of a series of high temperature conversions of the
carbonaceous material, some of which are presented in Equations 2.1-2.8. The major difference
between gasification and combustion is that the former packs energy into chemical bonds in the
product gas while the latter breaks those bonds to release the energy. A typical gasification
process follows the sequence of dehydration or drying, thermal decomposition or pyrolysis,
partial combustion and finally reduction of decomposition products [3]. The process requires a

11
gasifying medium like air, steam or oxygen to convert the solid feed into gases or liquids, at the
same time adding hydrogen to the product.
Oxidation reaction: 𝐶 + 𝑂2 ↔ 𝐶𝑂2, 𝛥𝐻298 = −394 𝑘𝐽/𝑚𝑜𝑙 (2.1)
Carbon reaction: 𝐶 + 0.5𝑂2 ↔ 𝐶𝑂, 𝛥𝐻298 = −111 𝑘𝐽/𝑚𝑜𝑙 (2.2)
Boudouard reaction: 𝐶 + 𝐶𝑂2 ↔ 2𝐶𝑂, 𝛥𝐻298 = +172 𝑘𝐽/𝑚𝑜𝑙 (2.3)
Water-gas reaction: 𝐶 + 𝐻2𝑂 ↔ 𝐶𝑂 + 𝐻2, 𝛥𝐻298 = +131 𝑘𝐽/𝑚𝑜𝑙 (2.4)
Hydrogenation reaction: 𝐶 + 2𝐻2 → 𝐶𝐻4, 𝛥𝐻298 = −74.8 𝑘𝐽/𝑚𝑜𝑙 (2.5)
Water-gas shift reaction: 𝐶𝑂 + 𝐻2𝑂 ↔ 𝐻2 + 𝐶𝑂2, 𝛥𝐻298 = −41.2 𝑘𝐽/𝑚𝑜𝑙 (2.6)
Methanation reaction: 𝐶𝑂 + 3𝐻2 ↔ 𝐶𝐻4 + 𝐻2𝑂, 𝛥𝐻298 = −206 𝑘𝐽/𝑚𝑜𝑙 (2.7)
Steam reforming reaction: 𝐶𝐻4 + 𝐻2𝑂 ↔ 𝐶𝑂 + 3𝐻2, 𝛥𝐻298 = +206 𝑘𝐽/𝑚𝑜𝑙 (2.8)
Exothermic reactions (2.1) and (2.2) are allowed in the gasifier to provide the required heat for
drying and pyrolysis. But the extent of these reactions depends on temperature [3]. The processes
that occur during gasification are described in detail as follows:
2.2.1 Drying
Pre-drying of biomass is necessary to remove as much moisture from the biomass as possible to
obtain a fuel gas with high heating value [9]. The feed is dried completely as it enters the gasifier
where it receives heat at 100oC from the hot zone downstream. As the temperature rises, the low
molecular weight extractives start volatilizing until the temperature of approximately 150-200oC
is reached.
12
2.2.2 Pyrolysis
It occurs between 200 and 700oC depending upon the amount of oxygen present in the gasifier.
Larger hydrocarbon molecules in the biomass feed are thermally broken down into smaller gas
molecules (H2, CH4 and tars) and solid carbon residue (char) [10]. Tar is basically a sticky liquid
formed through condensation of condensable vapor produced during the process. Cracking or
reforming of tar is an important aspect alongside this process since it creates a nuisance in
industrial applications of the end use products. To some extent, the volatiles and char react with
oxygen to form carbon dioxide and release heat which is required to sustain the pyrolysis process
and cause subsequent thermochemical reactions.
2.2.3 Char Gasification/Combustion
The oxygen or gasifying medium supplied to the gasifier allows further chemical reactions
among the hydrocarbons in the fuel as well as the gases formed during pyrolysis. Among them,
char-oxidation is considered to be the most significant for gasification. Biomass char contains a
certain amount of hydrocarbon and is generally more porous and reactive than coke. Gasification
of char involves several reactions, some of which are mentioned as follows [3]:
𝐶ℎ𝑎𝑟 + 𝑂2 → 𝐶𝑂2 𝑎𝑛𝑑 𝐶𝑂 (2.9)
𝐶ℎ𝑎𝑟 + 𝐶𝑂2 → 𝐶𝑂 (2.10)
𝐶ℎ𝑎𝑟 + 𝐻2𝑂 → 𝐶𝐻4 𝑎𝑛𝑑 𝐶𝑂 (2.11)
𝐶ℎ𝑎𝑟 + 𝐻2 → 𝐶𝐻4 (2.12)
2.3 Types of Gasifiers
Developing appropriate gasifiers that can process variety of biomass feedstocks to produce high
quality syngas is crucial for meeting industrial demand. In the late 1970s, Payne et al. [11]
discussed three types of gasifiers – updraft, downdraft and cross-draft, based on the agricultural
13
applications at the time. Broadly, gasification systems can be classified into three categories:
moving bed, fluidized bed, and entrained flow [12]. Moving bed, sometimes also referred to as
fixed bed, gasification is the oldest and simplest of all gasification technologies and is generally
more suitable for heat applications (<10 MWt) and small‐scale energy generation (<1 MWe)
[13]. Among the types of available gasifiers, studies have shown that downdraft, updraft,
bubbling bed, circulating fluidized bed and entrained flow gasifiers are the most common ones
[14]. Furthermore, fluidized bed gasifiers can be classified into bubbling bed and circulating
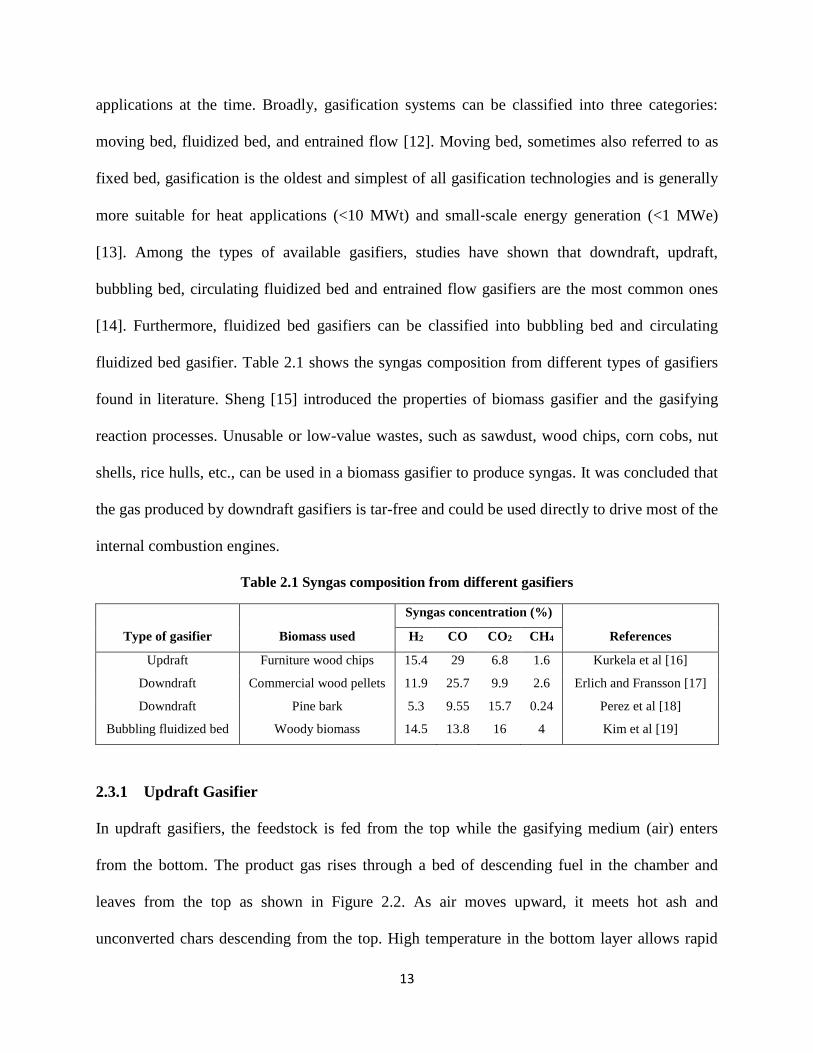
fluidized bed gasifier. Table 2.1 shows the syngas composition from different types of gasifiers
found in literature. Sheng [15] introduced the properties of biomass gasifier and the gasifying
reaction processes. Unusable or low-value wastes, such as sawdust, wood chips, corn cobs, nut
shells, rice hulls, etc., can be used in a biomass gasifier to produce syngas. It was concluded that
the gas produced by downdraft gasifiers is tar-free and could be used directly to drive most of the
internal combustion engines.
Table 2.1 Syngas composition from different gasifiers
Syngas concentration (%)
Type of gasifier Biomass used H2 CO CO2 CH4 References
Updraft Furniture wood chips 15.4 29 6.8 1.6 Kurkela et al [16]
Downdraft Commercial wood pellets 11.9 25.7 9.9 2.6 Erlich and Fransson [17]
Downdraft Pine bark 5.3 9.55 15.7 0.24 Perez et al [18]
Bubbling fluidized bed Woody biomass 14.5 13.8 16 4 Kim et al [19]
2.3.1 Updraft Gasifier
In updraft gasifiers, the feedstock is fed from the top while the gasifying medium (air) enters
from the bottom. The product gas rises through a bed of descending fuel in the chamber and
leaves from the top as shown in Figure 2.2. As air moves upward, it meets hot ash and
unconverted chars descending from the top. High temperature in the bottom layer allows rapid

14
combustion, consuming most of the oxygen. As the available oxygen is reduced further up, the
combustion reaction changes into partial combustion, thus releasing CO and a moderate amount
of heat. Thus, it effectively utilizes combustion heat and achieves high cold gas efficiency. It is
more suitable for direct firing where the gas is burnt in a furnace or boiler with no cleaning or
cooling required. These gasifiers can handle high ash (up to 25%) and high moisture (up to 60%)
biomass [13].
Figure 2.2 Updraft gasifier [20] Figure 2.3 Downdraft gasifier [21]
2.3.2 Downdraft Gasifier
In downdraft gasifiers, the gasifying medium is injected from the top of the chamber along with
the biomass, and the syngas is pulled out from the bottom portion. Pyrolysis and combustion
products flow downward, where the hot gas reacts with the remaining char resulting in
gasification. Figure 2.3 shows a throated downdraft gasifier which forces all the pyrolysis gas to
pass through the narrow combustion zone. The high temperature zone of hot ash near the bottom
15
provides favorable conditions for tar cracking, resulting in lower tar production as compared to
other gasifiers. Stratified throatless or open top gasifiers have vertical walls throughout the
reactor, without any constriction in the vessel. Downdraft gasifiers are preferred for small scale
power generation. The moisture content of fuel needs to be lower than 25%. Although the quality
of produced syngas is quite high, the heating value is lower as compared to that from an updraft
gasifiers.
2.3.3 Fluidized Bed Gasifier
Fluidized bed gasifiers generally contain bed materials made of granular solids that are fluidized
with a gasifying medium at certain velocities. These gasifiers are known for excellent mixing
and temperature uniformity throughout the reactor [22]. There are basically two types of
fluidized bed gasifiers: bubbling and circulating.
In a bubbling fluidized bed gasifier, the fuel is fed from either the top or the sides and the bed
material like sand/silica is fluidized with gasifying medium. As seen in Figure 2.4, the air is
introduced through the grate at the bottom of the vessel. The biomass is pyrolyzed in the hot bed
to form char with gaseous compounds and high tar cracking is fairly achieved [9]. It allows
higher rates of throughput which results in good mixing and heat transfer. It is also known to
have higher carbon conversion rate and the syngas is rich in particulates [3].

16
Figure 2.4 Bubbling fluidized bed gasifier [23]
Circulating fluidized bed gasifiers provide long gas residence time, which is suitable for fuels
with high volatiles. Cyclones and other separators are employed in CFBs to capture and recycle
solids to extend their residence time [24]. The fluidization velocity in CFB is much higher (3.5-
5.5 m/s) than that in a bubbling bed (0.5-1.0 m/s). The bed material is circulated between the
reaction vessel and a cyclone separator, where the ash is removed as shown in Figure 2.5, and the
bed material and char returned to the reaction vessel. Owing to advantages in terms of mass
conversion efficiency and higher quality syngas, many commercial gasifiers of this type have
been installed in the paper industry for gasification of bark and other forest residues around the
world [22, 9].

17
Figure 2.5 Circulating fluidized bed gasifier [25]
2.4 Syngas Quality Considerations
For any biomass gasification system, syngas composition varies with different operating
conditions, gasifier type, feedstock and gasifying medium [26]. Other output parameters that are
affected by operating conditions include carbon conversion, tar formation and reduction, and
energy efficiency. Zainal et al. [5] reported the average gas composition of syngas as: 14% H2,
24% CO, 15% CO2, 2% CH4 and 44% N2 from downdraft gasification of wood chips. The effect
of various parameters affecting the syngas quality and the gasification process are discussed in
the sections below:
2.4.1 Biomass Feedstock
Physicochemical properties of biomass such as shape, size, porosity, and chemical compounds
contained largely affect the gasifier’s performance. The feedstock that have too small size, low
porosity may cause some problems such as feedstock bridging, lumping, collapsing or clogging

18
inside the reaction chambers of fixed-bed downdraft gasifiers during gasification. Fluidized bed
gasifiers have higher throughput capacity but they only allow use of feedstock with less than
0.15 mm particle size [22]. Chopped switchgrass has similar ash content and elemental
composition as most of the crop residues [27]. But its low bulk density poses major challenge to
ensure proper material flow in the reactor and the hopper. Patil et al. [28] used agitators to
facilitate the material flow in the biomass hopper and the gasification reactor. Lucas et al. [29]
carried out gasification of wood pellets using preheated air and vapor as gasifying agents. It was
observed that as temperature increased, the performance and the lower heating value of the
produced dry combustible gas also increased.
Updraft gasifiers can handle feedstock with wide variation in particle size [13]. No significant
differences in composition, heating value, tar and particle concentrations were observed in
syngas produced from gasification of hardwood chips, softwood chips, and switchgrass pellets
with a pilot scale (15 kW) fixed-bed downdraft gasifier [10]. Gasification of hardwood chips
mixed with 20% of liquid crude glycerol in a downdraft gasifier produced syngas with
significant higher CH4 content, low heating value and tar concentration than those of regular
hardwood chips [30]. Moutsouglou [31] used a bubbling fluidized bed gasifier for gasification of
cordgrass and switchgrass, the latter showing greater concentration of hydrogen and carbon
monoxide.
2.4.2 Moisture Content
High moisture content is known to be detrimental to gasification process but drying prior to
gasification increases overall gasification efficiency. Zainal et al. [32] used an equilibrium model
for gasification of wood chips and predicted an increase in hydrogen percentage from 20 to 25%
for increase in moisture content from 0 to 40%. At the same time, CO reduced from about 28%

19
to 15% for the same variation of moisture content. Owing to water-gas shift reaction, higher
moisture content leads to increase in CO2 concentration as well as H2 concentration. Moreover, a
consequent decrease in temperature improves the water-gas shift reaction and forms more CO2.
The small gain in H2 (as well as CH4) is not sufficient to compensate the loss of significant
amount of CO. As a result, the calorific value and exergy of the gas decreases almost linearly
with increase of moisture in biomass [33, 34]. The constraint of moisture content of feedstock
depends on gasifier types, with updraft gasifiers allowing biomass with higher moisture content.
But the acceptable upper limit for downdraft gasifiers is around 40% (d.b.) [35].
2.4.3 Temperature
Operating temperature has a significant impact on the output of syngas and biomass gasification
on the whole. Li et al. [36] observed an approximately 10% increase in HHV of syngas for an
increase in operating temperature from 700 to 800oC. Amount of CO increases with increase in
temperature because endothermic reactions like the Boudouard reaction are more favored at
higher temperatures [37]. Increase in temperature reduces the tar content as well as decreases
char inside the gasifier, which eventually leads to increase in gas yield due to higher tar cracking.
Depending upon the type of gasifier, tar cracking temperatures are usually around 1000-1100 oC
[38]. Hernandez et al. [39] reported that the decrease in tar production in the case steam
gasification was non-linear and much more notable when increasing the temperature from 750 to
1050oC than an increase from 1050 to 1200oC. However, for gasification with air/steam mixture,
the reduction of tar was significant only at temperatures higher than 1050oC.
Temperature of the reactor is basically an output variable which depends on factors like moisture
content of feedstock, air flow, amount of steam added, and heat loss from the system [40]. It has

20
been well observed that the gasification process can benefit from better thermal insulation and
preheating of air or gasifying medium.
2.4.4 Equivalence Ratio
Equivalence ratio (ER) is the ratio of the actual amount of air used during gasification process to
the total amount of air required for complete combustion. An ER plays a critical role in
accelerating pyrolysis and fast heat transfer, thus affecting the biomass consumption rate [8].
Due to the amount of oxygen and ash elementally present in the biomass, the optimum ER varies
for different types of biomass. Gautam et al. [41] reported that an increase in ER increases the
temperature inside the gasifier while decrease in ER increases char formation. Zainal et al. [5]
suggested an optimal equivalence ratio of 0.38 after variation of the calorific value of syngas was
observed around that peak value. Sharma et al. [42] reported gas composition of H2 (9.3±0.8 %)
and CO (16.5±1.1 %) at optimum ER of 0.32 from gasification of switchgrass in a fluidized bed
gasifier. However, a low ER of 0.2 was reported to be optimum by both Skoulou et al. [43] and
Sheth et al. [8] for downdraft gasification of olive kernels and tree cuttings and furniture wood,
respectively.
2.4.5 Particle Size
Arising questions on the effects of biomass particle size on the combustion behavior have led to
much research work on assessing the optimum pellet size from technical and economic point of
view [44]. Pinewood fuel is easy to prepare and can be preprocessed into different sizes and
shapes and is a good simulation of pelletized biomass fuels. Erlich et al. [45] carried out
pyrolysis and gasification of wood and sugarcane bagasse pellets of different shapes and sizes.
They concluded that the rate of gasification is slower for bigger pellets, while the size has little
impact on pyrolysis. It was also found that bagasse was less reactive than wood. Horttanainen et

21
al. [46] experimented with pellets and mixtures of woodchips and sawdust and showed that the
range of usable airflow rates increased when the density and size of particles increased. They
also found that the mixture between small and large particles was advantageous for combustion.
2.5 Syngas Contaminants
Biomass feedstock contains inorganic impurities like sulfur, nitrogen, chlorine and ash which
eventually find their way into syngas and interfere with downstream applications. Moreover,
undesirable organic compounds (tar) and particulate char are also found in raw syngas in cases of
incomplete gasification [47].
2.5.1 Sulfur
Hydrogen sulfide (H2S) is the most commonly occurring sulfur contaminant in syngas, followed
by carbonyl sulfide (COS) in somewhat lesser amounts. Biomass has significantly less sulfur
than coal, containing only 0.1-0.5 g/kg compared to as much as 50 g/kg for some coal-derived
syngas [48]. In some biomass, especially few grasses, the sulfur content can exceed 1 g/kg [49,
50]. The primary concern with sulfur contaminants is corrosion of metal surfaces, which
basically means the electrochemical oxidation of metals. It also causes catalyst poisoning, and
pollution when oxidized to sulfur dioxide (SO2) [51]. Sharma et al. [42] reported sulfur
concentration of less than 0.3% (d.b.) in switchgrass. Sulfur removal to parts per billion levels is
often required since even small amounts can poison catalysts used to produce liquid fuels from
syngas [51].
2.5.2 Nitrogen
Nitrogen contaminants in syngas usually occur as ammonia (NH3) with trace amounts of
hydrogen cyanide (HCN) [47]. Protein structures or aromatic compounds in the feedstock release
22
nitrogen in the pyrolysis stage of gasification and combustion [52]. Intrinsic properties such as
nitrogen content and particle size of fuel as well as operating conditions determine the amount of
NH3 and HCN released. Although the nitrogen content of many biomass feedstocks can produce
ammonia concentrations of several weight percent, up to two thirds of this ammonia decomposes
to molecular nitrogen at typical gasification temperatures [47]. Thus, the concentration of
ammonia is no more than several hundred to a few thousand parts per million. Even these low
concentrations can be detrimental in applications like gas turbines, which demand ammonia
concentrations less than 500 ppm [53]. Gautam et al. [41] reported high nitrogen content of
3.39% (d.b.) for poultry pellets while that for sawdust and peanut hull pellets ranged from 0.34-
0.82%.
2.5.3 Chlorine
Chlorine in biomass occurs as alkali metal salts, which readily vaporize in high temperature
environment of gasifiers and react with water vapor to form HCl [54]. Chlorine levels as low as
0.024 μL L-1 can create serious problems like hot corrosion of gas turbine blades [55]. Reactions
occurring between HCl and other contaminant species create compounds such as NH4Cl and
NaCl, which can cause fouling and create deposits when they condense in cooler downstream
piping and equipment.
2.5.4 Particulate Matter
Inorganic compounds and residual solid carbon from the gasification of biomass constitutes the
bulk of the particulate matter. The inorganic content includes alkali metals (K, Na), alkaline
earth metals (Ca), silica and other metals such as iron and magnesium. Many syngas applications
require greater than 99% particulate removal [47]. Common issues with particulate matter are
fouling, corrosion and erosion, which can cause efficiency and safety concerns [56]. Fouling in

23
gasification usually occurs when small amounts of inorganic components and volatile species are
condensed and deposited on refractory or heat transfer surfaces. Fouling deposits are formed
mainly in the convective parts of the reactor [57]. Erosion is a direct result of the gradual layer-
by-layer destruction of metallic surface due to corrosion.
2.5.5 Tar
Tars are condensable organic compounds (with molecular weight larger than benzene) which
vary from primary oxygenated products to heavier deoxygenated hydrocarbons and polycyclic
aromatic hydrocarbons (PAHs) [48]. Among several contaminants of syngas, tars are the main
technical hurdle for commercial implementation of biomass gasification [58]. Tar condensation
causes plugging and fouling problems in engines while tar polymerization at high temperatures
produces polycyclic compounds and soot [59].
Thermochemical conversion creates a large number of tar species in response to the operating
parameters, which can be differentiated as shown in Table 2.2. Mostly, tars of class 1, 4 and 5
are responsible for severe fouling and clogging in gasification systems because they readily
condense even at high temperatures [60]. Particularly, the most important operating parameters
are feedstock composition and processing conditions, especially temperature, pressure, type and
amount of oxidant and feedstock residence time. Furthermore, a downdraft gasifier is known to
yield lesser amount of tar as compared to an updraft gasifier. The compounds are grouped into
primary, secondary and tertiary tars. Primary tars are organic compounds released from
devolatilizing feedstock. Higher temperatures and longer residence times result in secondary tars,
including phenolics and olefins. Further increase in reaction time and temperature leads to
formation of tertiary tars, such as PAHs [49].

24
Table 2.2 Classification of tar compounds [61]
Class Description Properties Representative compounds
1 GC-undetectable Very heavy tars
Determined by subtracting the
GC-detectable tars from the total
gravimetric tar
2 Heterocyclic
aromatics
Tars containing hetero atoms,
highly water soluble
Pyridine, phenol, quinolone,
dibenzophenol cresols
3 Light aromatic
(1 ring)
Light hydrocarbons, no
problem regarding
condensation or solubility
BTEX compounds like toluene,
ethylbenzene, xylenes, styrene
4
Light PAH
compounds
(2-3 rings)
Condense at low temperatures
even with low concentrations
Indene, naphthalene, biphenyl,
fluorine, phenanthrene,
anthracene
5
Heavy PAH
compounds
(4-7 rings)
Condensation at high
temperatures even with low
concentrations
Fluoranthene, pyrene, chrysene,
perylene
Tar analysis
Many institutes around the world have been developing on-line and off-line methods for the
sampling and analysis of tars for a few decades. The most common methods of analysis are gas
chromatography (GC) and gravimetric analysis (which involves weighing of collected tars, after
careful evaporation of the solvent and condensed water). The sampling part is based on trapping
the tar by condensation on cold surfaces or filters, by absorption in a cold organic solvent or by
adsorption on suitable sorbents. The European tar protocol has been widely accepted as the “tar
standard” to provide technical specifications for sampling and analysis of tars. This guideline
was designed to provide a consistent basis of tar measurement globally among researchers [62,
63]
25
European tar protocol
Given the diversity of methods and definitions for organic contaminants and their resulting
problems, the members of the Gasification Task of the IEA Bioenergy Agreement, the US DoE
and DGXVII of the European Commission jointly came up with two sampling and analysis
protocols; one to be used for small scale, fixed bed, engine-based systems and the other for larger
utility scale plants. Known as the Wurzburg Protocols (discussed in the 10th European Biomass
Conference in Wurzburg), they were further developed and standardized into one ‘Tar Protocol’
by the EU fifth framework project [64, 65]. The guideline provides a set of procedures for the
measurement of organic contaminants and particles in producer gases from biomass gasifiers.
These procedures are designed to cover different gasifier types such as updraft and downdraft
fixed bed, and fluidized bed gasifiers and operating conditions and concentration ranges.
2.6 Comprehensive Simulator of Fluidized and Moving Bed Equipment (CeSFaMB)
2.6.1 Background
Operations of gasifiers or any other similar equipment dealing with combustion or gasification
phenomena involve a number of simultaneous processes, such as heat, mass and momentum
transfers; chemical kinetics of several homogeneous and heterogeneous reactions; drying,
pyrolysis, etc. Several mathematical models have been built for such equipment and they
continue to provide excellent reproductions and predictions of industrial scale operational
conditions. The present comprehensive mathematical model and simulation program is an
optimum compromise in simulation accuracy, computational resources and processing time [66].
The first successful version of CeSFaMB (previous acronym CSFB) came out in 1987 which was
capable of reproducing operational conditions of Babcock and Wilcox boiler unit in USA as well
operations of National Coal Board (UK) boilers [67]. Since then the software’s mathematical
26
model and respective simulation program has improved constantly and been applied to various
classes of equipment consuming a wide range of fuels [68, 69, 70]. De Souza-Santos [71] carried
out simulation tests with a gasification unit at University of California at Davis and reported that
the concentration of species in the produced gas and temperature profiles within the bed were
simulated within acceptable deviations.
Enden and Lora [70] applied the CSFB code for the design of a 250 kW thermal output
laboratory gasifier for sugarcane bagasse and explained the relation between the performance
and the operational and design parameters. The simulator also evaluated other values assumed or
calculated in the preliminary sizing, such as the pressure drop in the bed, composition of
producer gas, bubble diameters and gas velocities in the bed. Yang et al. [72] studied the
combustion process of wood chips in packed beds through experimentation and modeling. They
also reported the effect of de-volatilization kinetics, fuel moisture content, primary air rate, fuel
heating value, fuel size and density, and bed void fraction on the biomass combustion process.
2.6.2 Working Principle
The model assumes all variable changes occurring in the vertical direction. The one-dimensional
approach is followed in almost all modeling of gas-solid packed systems [66, 73]. It is believed
to provide the highest cost-benefit ratio among all possible levels of modeling. It has been
successfully adopted by many, especially for moving bed gasifiers or combustors [73, 74].
Though it may seem simple initially, the first order model assumption for such reactors may
involve up to five physical phases, chemical reactions in all phases, dynamics of each phase, heat
and mass transfers among all phases, and heat transfer between phases and the internal (tubes
and walls) parts of the reactor [66]. For gasifiers, one-dimensional steady state model seems to
be the optimum choice. Zero-dimensional (0D-S) model does not allow description or evaluation

27
of temperature, velocity or concentration profiles inside the equipment. Also, two-dimensional
steady state model seems unnecessary since the variation in concentration and temperature in the
radial direction is negligible compared to that in the axial direction.
2.7 References
[1] U.S. Department of Energy, "International Energy Outlook 2013," U.S. Energy Information
Association, Washington DC, 2013.
[2] U.S. Department of Energy, "U.S. Billion-Ton Update: Biomass Supply for a Bioenergy and
Bioproducts Industry," Oak Ridge National Laboratory, Oak Ridge, Tennessee, 2011.
[3] P. Basu, Biomass Gasification and Pyrolysis, Burlington, MA: Academic Press, Elsevier
Inc., 2010.
[4] A. Demirbas, "Bioresource facilities and biomass conversion processing for fuels and
chemicals," Energy Conversion and Management, vol. 42, pp. 1357-1378, 2001.
[5] Z. A. Zainal, A. Rifau, G. A. Quadir and K. N. Seetharamu, "Experimental investigation of
a downdraft biomass gasifier," Biomass and Bioenergy, vol. 23, pp. 283-289, 2002.
[6] International Energy Agency, "World Energy Outlook 2012: Renewable energy outlook,"
2012.
[7] B. Babu, "Biomass Pyrolysis: a state-of-the-art review," Biofuels, Bioproducts and
Biorefining , vol. 2, pp. 393-414, 2008.
[8] P. N. Sheth and B. V. Babu, "Experimental studies on producer gas generation from wood
waste in a downdraft biomass gasifier," Bioresource Technology, vol. 100, pp. 3127-3133,
2009.
[9] P. McKendry, "Energy production from biomass (part 3): gasification technologies,"
Bioresource technology, vol. 83, pp. 55-63, 2002.
[10] L. Wei, J. A. Thomasson, R. Sui, R. M. Bricka, J. R. Wooten and E. P. Columbus, "Syngas
quality evaluation for biomass gasification with a downdraft gasifier," Transactions of the
ASABE, vol. 52, no. 0001-2351, pp. 21-37, 2009.
[11] F. A. Payne, I. J. Ross and J. N. Walker, "Forced fed biomass gasification for drying grain,"
in ASAE, St. Joseph, MI 49085, 1979.

28
[12] R. Warnecke, "Gasification of biomass: Comparison of fixed bed and fluidized bed
gasifier," Biomass and Bioenergy, vol. 18, pp. 489-497, 2000.
[13] A. A. C. M. Beenackers, "Biomass gasification in moving beds: A review of European
technologies," Renewable Energy, vol. 16, no. 1, pp. 1180-1186, 1999.
[14] H. A. M. Knoef, "Inventory of biomass gasifier manufacturers and installations: Final report
to the European Commission," Biomass Technology Group BV, University of Twente,
Enshede, Netherlands, 2000.
[15] G. X. Sheng, "Biomass gasifiers: From waste to energy production.," Biomass, vol. 20, pp.
3-12, 1989.
[16] E. Kurkela, P. Stahlberg, P. Simell and J. Leppalahti, "Updraft gasification of peat and
biomass," Biomass, vol. 19, pp. 37-46, 1989.
[17] C. Erlich and T. H. Fransson, "Downdraft gasification of pellets made of wood, palm-oil
residues respective bagasse: Experimental study," Appllied Energy, vol. 88, pp. 899-908,
2011.
[18] J. F. Perez, A. Melgar and P. N. Benjumea, "Effect of operating and design parameters on
the gasification/combustion process of waste biomass in fixed bed downdraft reactors: An
experimental study," Fuel, vol. 96, pp. 487-496, 2012.
[19] Y. Kim, C. W. Yang, B. J. Kim, K. S. Kim, J. W. Lee, J. H. Moon, W. Yang, T. U. Yu and
U. D. Lee, "Air-blown gasification of woody biomass in a bubbling fluidized bed gasifier,"
Applied Energy, vol. 112, pp. 414-420, 2013.
[20] "www.gbgasifired.com," GB Gasifired, 2014. [Online]. Available:
http://www.gbgasifired.com/model.
[21] "http://www.renewablesplus.com," Renewables Plus, 2014. [Online]. Available:
http://www.renewablesplus.com/technology/process.
[22] P. Basu, in Combustion and Gasification in Fluidized Beds, Boca Raton, FL, Taylor and
Francis Group, 2006, pp. 355-357.
[23] "http://www.andritz.com," Andritz, 2014. [Online]. Available:
http://www.andritz.com/products-and-services.
[24] X. T. Li, J. R. Grace, C. J. Lim, A. P. Watkinson, H. P. Chen and J. R. Kim, "Biomass
gasification in a circulating fluidized bed," Biomass and Bioenergy, vol. 26, no. 2, pp. 171-

29
193, 2004.
[25] "http://biofuelsacademy.org/," Biofuels academy, 2014. [Online]. Available:
http://www.biofuelsacademy.org/.
[26] J. M. Prins, Thermodynamic analysis of biomass gasification and torrefaction, Eindhoven:
Ridderprint bv, 2005.
[27] T. B. Reed, Biomass gasification: Principles and Technology, New Jersey: Noyes Data
Corporation, 2001.
[28] K. N. Patil, R. L. Huhnke and D. D. Bellmer, "Gasification of switchgrass using a unique
downdraft reactor," in ASABE Annual International Meeting, Providence, Rhode Island,
2008.
[29] C. Lucas, D. Szewczyk, W. Blasiak and S. Mochida, "High temperature air and steam
gasification of densified biofuels," Biomass and Bioenergy, vol. 27, pp. 563-575, 2004.
[30] L. Wei, L. O. Pordesimo, S. D. Filip To, J. R. Wooten, A. Haryanto and E. P. Columbus,
"Effects of feedstock properties on the performance of a downdraft gasifier," in ASABE
Annual International Meeting , Reno, Nevada, 2009.
[31] A. Moutsouglou, "A comparison of prairie cordgrass and switchgrass as biomass for syngas
production," Fuel, vol. 95, pp. 573-577, 2012.
[32] Z. A. Zainal, R. Ali, C. H. Lean and K. N. Seetharamu, "Prediction of performance of a
downdraft gasifier using equilibrium modeling for different biomass materials," Energy
Conversion and Management , vol. 42, pp. 1499-1515, 2001.
[33] P. C. Roy, A. Datta and N. Chakraborty, "Modelling of a downdraft biomass gasifier with
finite rate kinetics in the reduction zone," International Journal of Energy Research, vol.
33, pp. 833-851, 2009.
[34] R. Karamarkovic and V. Karamarkovi, "Energy and exergy analysis of biomass gasification
at different temperatures," Energy, vol. 35, pp. 537-549, 2010.
[35] M. Dogru, C. R. Howrath , G. Akay, B. Keskinler and A. A. Malik, "Gasification of
hazelnut shells in a downdraft gasifier," Energy, vol. 27, pp. 415-427, 2002.
[36] X. T. Li, J. R. Grace, C. J. Lima, A. P. Watkinson, H. P. Chen and J. R. Kim, "Biomass
gasification in a circulating fluidized bed," Biomass and Bioenergy, vol. 26, pp. 171-193,
2004.
30
[37] A. Zabaniotou, O. Ioannidou and V. Skoulou, "Rapeseed residues utilization for energy and
second generation biofuels," Fuel, vol. 87, pp. 1492-1502, 2008.
[38] T. A. Milne and R. J. Evan, "Biomass gasification "tars"; their nature, formation and
conversion," National Renewable Energy Laboratory , Golden, CO, 1998.
[39] J. J. Hernandez, R. Ballesteros and G. Aranda, "Characterization of tars from biomass
gasification: Effect of the operating conditions," Energy, vol. 50, pp. 333-342, 2013.
[40] J. Corella, J. M. Toledo and G. Molina, "Calculations of the conditions to get less than 2 g
tar/m3 in a fluidized bed biomass gasifier," Fuel Processing Technology, vol. 87, pp. 841-
846, 2006.
[41] G. Gautam, S. Adhikari, C. Brodbeck, S. Bhavnani, O. Fasina and S. Taylor, "Gasification
of wood chips, agricultural residues, and waste in a commercial downdraft gasifier,"
Transactions of the ASABE, vol. 54, no. 5, pp. 1801-1807, 2011.
[42] A. M. Sharma, K. N. Patil, R. L. Huhnke and A. Kumar, "Performance evaluation of a lab
scale fluidized bed gasifier using switchgrass as feedstock," Transactions of the ASABE, pp.
2259-2266, 2011.
[43] V. Skoulou, A. Zabaniotou, G. Stavropoulos and G. Sakelaropoulos, "Syngas production
from olive tree cuttings and olive kernels in a downdraft fixed bed gasifier," International
Journal of Hydrogen Energy, vol. 33, pp. 1185-1194, 2008.
[44] Y. B. Yang, C. Ryu, A. Khor, V. N. Sharifi and J. Swithenbank, "Fuel size effect on
pinewood combustion in a packed bed," Fuel, vol. 84, pp. 2026-2038, 2005.
[45] C. Erlich, E. Bjornbom, D. Bolado, M. Giner and T. Fransson, "Pyrolysis and gasification of
pellets from sugar cane bagasse and wood," Fuel, vol. 85, pp. 1535-1540, 2006.
[46] M. Horttanainen, J. Saastamoinen and P. Sarkomaa, "Operational limits of ignition front
propagation against airflow in packed beds of different wood fuels," Energy Fuels, vol. 16,
pp. 676-686, 2002.
[47] P. J. Woolcock and R. C. Brown, "A review of cleaning technologies for biomass-derived
syngas," Biomass and Bioenergy, vol. 52, pp. 54-84, 2013.
[48] D. Stevens, "Hot gas conditioning: Recent progress with larger-scale biomass systems,"
NREL subcontractor. Report no.NREL/SR-510-29952., 2001.
[49] W. Torres, S. S. Pansare and J. G. Goodwin, "Hot gas removal of tars, ammonia, and
31
hydrogen sulfide from biomass gasification," Catal Rev Sci Eng, vol. 49, no. 4, pp. 407-456,
2007.
[50] M. Jazbec, K. Sendt and B. S. Haynes, "Kinetic and thermodynamic analysis of the fate of
sulfur compounds in gasification products," Fuel, vol. 83, no. 16, pp. 2133-2138, 2004.
[51] B. L. Dou, M. C. Zhang, J. S. Gao, W. Q. Shen and X. Z. Sha, "High temperature removal
of NH3, organic sulfur, HCl, and tar component from coal derived gas," Ind Eng Chem Res,
vol. 41, no. 17, pp. 4195-4200, 2002.
[52] K. Hansson, J. Samuelsson, C. Tullin and L. E. Amand, "Formation of HNCO, HCN, and
NH3 from the pyrolysis of bark and nitrogen containing model compounds," Combustion
Flame, vol. 137, no. 3, pp. 265-277, 2004.
[53] J. Zhou, S. M. Masutani, D. M. Ishimura, S. Q. Turn and C. M. Kinoshita, "Release of fuel
bound nitrogen in biomass during high temperature pyrolysis and gasification," in 32nd
Intersociety energy conversion engineering conference July 22 - August 1, 1997.
[54] B. L. Dou, W. G. Pan, J. X. Ren, B. B. Chen, J. H. Hwang and T. U. Yu, "Single and
combined removal of HCl and alkali metal vapor from high-temperature gas by solid
sorbents," Energy Fuel, vol. 21, no. 2, pp. 1019-1023, 2007.
[55] S. Q. Turn, "Chemical equilibrium prediction of potassium sodium, and chlorine
concentrations in the product gas from biomass gasification," Ind Eng Chem Res, vol. 46,
no. 26, pp. 8928-8937, 2007.
[56] R. A. Newby, W. C. Yang and R. L. Bannister, "Fuel gas cleanup parameters in air-blown
IGCC," J Eng Gas Turbines Power, vol. 122, no. 2, pp. 247-254, 2000.
[57] A. L. Maglinao and S. C. Capareda, "Predicting fouling and slagging behavior of dairy
manure (DM) and cotton gin trash (CGT) during thermal conversion," Transactions of the
ASABE, vol. 53, no. 3, pp. 903-909, 2009.
[58] C. Higman and M. van der Burgt, Gasification, 2nd ed., GPP-Elsevier, 2008.
[59] L. Devi, K. J. Ptasinski and F. J. Janssen, "A review of the primary measures for tar
elimination in biomass gsaification processes," Biomass and Bioenergy, vol. 24, pp. 125-
140, 2003.
[60] D. Elliot, "Relation of reaction time and temperature to chemical composition of pyrolysis
oils," in American Chemistry Society symposium series, Denver, CO, 1988.

32
[61] C. Li and K. Suzuki, "Tar property, analysis, reforming mechanism and model for biomass
gasification-an overview," Renew Sustain Energy Rev, vol. 13, no. 3, pp. 594-604, 2009.
[62] J. Good, L. Ventress, H. Knoef, U. Zielke, P. L. Hansen and W. van de Kamp, "Sampling
and analysis of tar and particles in biomass producer gases," Eur Comm EFTA, 2005.
[63] CEN, "Biomass Gasification: Tar and particles in product gases - sampling and analysis,"
European Commission and the European Free Trade Association, 2005.
[64] H. Knoef and H. J. Koele, "Survey of tar measurement protocols," Biomass and Bioenergy ,
vol. 18, pp. 55-59, 2000.
[65] N. Abatzouglou, N. Barker, P. Hasler and H. Knoef, "The development of a draft protocol
for the sampling and analysis of particulate and organic contaminants in the gas from small
biomass gasifiers," Biomass and Bioenergy, vol. 18, no. 1, pp. 5-17, 2000.
[66] M. L. de Souza-Santos, Solid Fuels Combustion and Gasification, Boca Raton, FL: CRC
Press, Taylor and Francis Group, 2010.
[67] M. L. de Souza-Santos, "Comprehensive modelling and simulation of fluidized-bed boilers
and gasifiers," Fuel, vol. 68, pp. 1507-1521, 1989.
[68] M. L. deSouza-Santos, "Application of comprehensive simulation of fluidized bed reactors
to the pressurized gasification of biomass," J Braz Soc Mech Sci, vol. 16, no. 4, pp. 376-383,
1994.
[69] M. L. deSouza-Santos, "A feasibility study on an alternative power generation system based
on biomass gasification/gas turbine concept," Fuel, vol. 78, pp. 529-538, 1999.
[70] P. J. van den Enden and E. S. Lora, "Design approach for a biomass fed fluidized bed
gasifier using the simulation software CSFB," Biomass and Bioenergy, vol. 26, pp. 281-287,
2004.
[71] M. L. deSouza-Santos, "CSFB applied to fluidized bed gasification of special fuels," Fuel,
vol. 88, pp. 826-833, 2009.
[72] Y. A. Yang, H. Yamauchi, V. Nasserzadeh and J. Swithenbank, "Effects of fuel
devolatilization on the combustion of wood chips and incineration of simulated municipal
solid wastes in a packed bed," Fuel, vol. 82, pp. 2205-2221, 2003.
[73] M. L. Hobbs, P. T. Radulovic and L. D. Smoot, "Combustion and gasification of coals in
fixed beds," Prog. Energy Combust. Sci., vol. 19, pp. 505-556, 1993.

33
[74] M. L. de Souza-Santos, "Study of Energy Alternative Sources; Use of Biomass and Crop
Residues as Energy Source: Part B: Development of a Mathematical Model and Simulation
program for Up-stream and Down-stream Moving Bed Gasifiers," Institute for
Technological Research of Sao Paulo, Sao Paulo, Brazil, 1982.

34
CHAPTER THREE
GASIFICATION OF DIFFERENT BIOMASS FEEDSTOCKS
3.1 Abstract
A study was conducted to determine syngas composition and contaminants from gasification of
different biomass feedstocks (viz. hardwood or oak, loblolly pine, switchgrass, southern yellow
pine and torrefied pine pellets, pine chips and bark). A mobile downdraft gasifier developed by
the Community Power Corporation and stationed at Auburn University Center for Bioenergy and
Bioproducts was used to conduct the experiments. Switchgrass had the highest ash content of
4.66% (d.b.) followed by pine bark (1.59% d.b.) while other feedstocks had lower ash content.
Carbon content ranged from 47 to 56% (d.b.), hydrogen from 6.50 to 7.50% (d.b.) and sulfur
from 0.32 to 0.40% (d.b.) for all the feedstocks. The higher heating values (HHVs) ranged from
19 MJ/kg (switchgrass) to 23 MJ/kg (torrefied pine). The alkali index (AI) and Bed
Agglomeration Index (BAI) were calculated using inorganic ash composition but only AI could
accurately predict that fouling/slagging would occur during switchgrass gasification. Syngas
obtained from yellow pine showed the highest hydrogen (17.35%) and carbon monoxide
(25.05%) fraction, and the highest HHV (6 MJ/Nm3), while switchgrass and loblolly pine had
significantly lower concentration of H2 and CO as well as lower HHV. Loblolly pine showed the
highest total tar concentration (2.54 g/m3) along with higher concentration of condensable tar
compound, indene (>0.1 g/m3). The hydrogen sulfide concentration was found to be 70 ppmv or
greater in syngas from all the feedstocks; the highest being from hardwood (84 ppmv) and
torrefied pine (83 ppmv).

35
Keywords: syngas, downdraft gasifier, higher heating value, carbon balance, exergy, tar,
hydrogen sulfide
3.2 Introduction
The process of gasification has been used for over a hundred years to produce energy. Biomass
gasification is a thermo-chemical process which converts biomass into combustible gases
through a number of chemical reactions [1]. One of the advantages of biomass gasification
process is its carbon neutrality under sustainable conditions. It means that all CO2 emitted during
the process is only what was absorbed during the growth of the biomass. Hence, the use of
biomass for efficient energy production is on the rise in the developed countries [1].
Depleting fossil fuels, their rising cost and environmental concerns are some of the major factors
driving interests in gasification of different types of available biomass. Other major
considerations in using syngas for energy purposes are its heating value, composition and
contamination level. The composition and quality of syngas depends on various factors such as
biomass properties, operating conditions and gasification approach [2]. The occurrence of
gasification reactions depends on temperatures in the reactor and the oxidant: air, steam or pure
oxygen used. Mainly, the LHV and syngas composition are affected by the type of gasifying
agent. Gasification with pure O2 has been found to give syngas with greater mixture of CO and
H2 and the LHV could range from 10 to 20 MJ/ Nm3 [3].
Most downdraft gasification studies are focused on the use of wood as fuel, influence of pressure
drop in the system on the gas flow rate and the increased hydrogen yield from air to steam
gasification in comparison to pure air gasification [4]. Sheth and Babu [5] studied the effect of
moisture content in waste wood from carpentry and equivalence ratio on the reaction zone
temperature during downdraft gasification. Skoulou et al. [6] reported an optimum equivalence

36
ratio of 0.42 while using olive tree kernels and olive tree cuttings in a downdraft gasifier as well
as studied the impact of temperature on syngas quality.
This chapter includes the results obtained from gasification of seven different biomass feedstocks
in a downdraft gasifier. The composition and heating value of syngas from different experiments
as well as the results from carbon (mass), energy and exergy balance analyses are reported here.
Also, the concentrations of hydrogen sulfide and tars from different biomass are included in this
chapter.
3.3 Experimental Setup
Gasification of different biomass was conducted with a mobile downdraft gasifier developed by
the Community Power Corporation (Littleton, CO). Figure 3.1 shows the gasifier/reactor unit,
which is housed inside a truck. The total height and inside diameter of the reactor are 1200 mm
and 350 mm, respectively. The interface between the controls and the gasifier was created using
LABVIEW. A seven-inch thick layer of fiber glass is used to insulate the reactor from outside. A
hopper and screw feeder was used to inject biomass into the gasifier, and the feeding rate was
controlled based on a specified level of biomass in the gasifier. Primary air was supplied from
the open top of the gasifier while secondary air injection nozzles were located at five different
levels of the gasifier. Secondary air was supplied to improve combustion reactions and maintain
uniform temperatures. The air injection rate was controlled and adjusted by the computer
software according to the temperature inside the gasifier. The grate at the bottom of the gasifier
was shaken at regular interval to remove ash formed during the gasification runs as well as to
facilitate smooth flow of biomass and prevent bridging. Biomass was fed only when temperature
at any three locations inside the gasifier reaches 800oC, which indicated the steady state of the
system. It took approximately 30 minutes to an hour to attain steady state. After reaching the

37
steady state, the differential pressure in the heat exchanger and syngas exit temperature from the
heat exchanger were the significant parameters to be considered during gasification runs.
At the beginning of each experiment, a pre-run checklist was followed. It included checking
leaks, hose connections, motors and electrical devices, charcoal level inside the gasifier, flare,
etc. After preheating the heat exchangers and filters to 40oC, the igniter inside the gasifier was
turned on. The charcoal was thus heated to avoid condensation and the temperature inside the
gasifier increased. Five pairs of K-type thermocouples were used to measure the temperature
distribution inside the gasifier which was automatically logged at 15 second intervals. A heat
exchanger was used to cool the hot syngas coming out of the gasifier from 500-700 °C to about
100 °C. The cooled gas was then passed through parallel bag filters to remove fine char and
particulates. After passing through the filters, the syngas was sampled with a gas analyzer
(California Analytical Instruments, NDIR) system as shown in Figure 3.2.
Seven types of biomass feedstocks were selected for gasification viz. hardwood (oak), loblolly
pine, switchgrass, yellow pine and torrefied pine pellets, pine chips and pine bark. Figure 3.3
Figure 3.1 BioMax downdraft gasifier Figure 3.2 CAI gas analyzer

38
shows the images of the feedstocks which were obtained from the southeast region, mainly
Alabama, Georgia, Mississippi and Tennessee. Approximately 200 lbm of biomass feedstock was
used for each experiment. Most experiments with pellets were carried out for three to three and
half hours while those with pine chips and bark were performed for at least four hours. Three
replications for each feedstock were performed consecutively and not randomized since it was
not practical to clean out the reactor at the end of each experiment.
Figure 3.3 Biomass feedstocks used for gasification
3.4 Data Collection
Properties of the different biomass feedstocks were determined through various characterization
processes. Results for syngas composition, higher heating value, carbon, energy and exergy
analyses, and contaminants’ concentration were obtained from the gasification experiments. The
description of the methodology applied for all the analyses are described in this section.
3.4.1 Characterization of Biomass
Proximate and ultimate analyses were carried out for each biomass feedstock. Moisture content
was measured on the day of the test following ASTM standard E871-82. A known amount
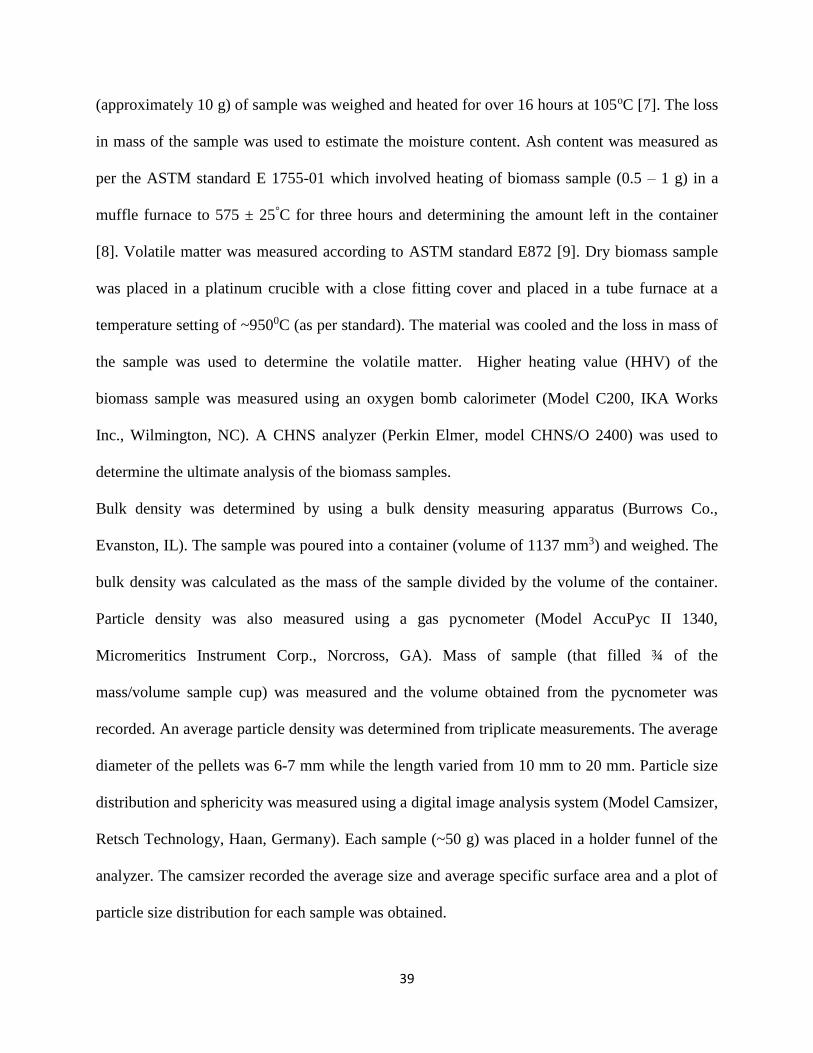
39
(approximately 10 g) of sample was weighed and heated for over 16 hours at 105oC [7]. The loss
in mass of the sample was used to estimate the moisture content. Ash content was measured as
per the ASTM standard E 1755-01 which involved heating of biomass sample (0.5 – 1 g) in a
muffle furnace to 575 ± 25°C for three hours and determining the amount left in the container
[8]. Volatile matter was measured according to ASTM standard E872 [9]. Dry biomass sample
was placed in a platinum crucible with a close fitting cover and placed in a tube furnace at a
temperature setting of ~9500C (as per standard). The material was cooled and the loss in mass of
the sample was used to determine the volatile matter. Higher heating value (HHV) of the
biomass sample was measured using an oxygen bomb calorimeter (Model C200, IKA Works
Inc., Wilmington, NC). A CHNS analyzer (Perkin Elmer, model CHNS/O 2400) was used to
determine the ultimate analysis of the biomass samples.
Bulk density was determined by using a bulk density measuring apparatus (Burrows Co.,
Evanston, IL). The sample was poured into a container (volume of 1137 mm3) and weighed. The
bulk density was calculated as the mass of the sample divided by the volume of the container.
Particle density was also measured using a gas pycnometer (Model AccuPyc II 1340,
Micromeritics Instrument Corp., Norcross, GA). Mass of sample (that filled ¾ of the
mass/volume sample cup) was measured and the volume obtained from the pycnometer was
recorded. An average particle density was determined from triplicate measurements. The average
diameter of the pellets was 6-7 mm while the length varied from 10 mm to 20 mm. Particle size
distribution and sphericity was measured using a digital image analysis system (Model Camsizer,
Retsch Technology, Haan, Germany). Each sample (~50 g) was placed in a holder funnel of the
analyzer. The camsizer recorded the average size and average specific surface area and a plot of
particle size distribution for each sample was obtained.

40
3.4.2 Syngas Composition
Syngas composition was measured using California Analytical Instruments’ gas analyzer (CAI
ZRE NDIR) which is shown in Figure 3.2. The analyzer is based on the infrared absorption
characteristics of gases and uses non-dispersive infrared (NDIR) detector for CO, CO2 and CH4.
Before the start of experiments, the analyzer was calibrated at least two hours or a day earlier
using calibration syngas. The readings for CO, CO2, CH4 and H2 were zeroed with air and
spanned with calibration gas, while that for O2 was zeroed with calibration gas and spanned with
air. Once the gasifier reached a steady state temperature, syngas constituents’ data i.e. molar
concentration of CO, CO2, H2, CH4 and O2 were recorded in a computer at 15 second interval via
the gas analyzer’s data logging software. Nitrogen was assumed to be the remainder of the
volumetric proportion of syngas. Air flow rate was calculated assuming that the source of
nitrogen was air alone. As shown in Equation 3.1, the overall higher heating value of syngas was
calculated by adding up the products of the volumetric fraction of syngas constituents (Yi) and
their respective higher heating values (HHVi). The HHV of H2, CO and CH4 are 12.76 MJ/m3,
12.6 MJ/m3 and 39.8 MJ/m3, respectively [10].
𝐻𝐻𝑉𝑠𝑦𝑛𝑔𝑎𝑠 = 𝐻𝐻𝑉𝐻2 𝑌𝐻2
+ 𝐻𝐻𝑉𝐶𝑂𝑌𝐶𝑂 + 𝐻𝐻𝑉𝐶𝐻4𝑌𝐶𝐻4
(3.1)
3.4.3 Carbon, Energy and Exergy Analyses
Mass (carbon), energy and exergy balance analyses were performed for all gasification runs. The
input stream consisted of biomass feed, dry air and moisture in fuel while the output stream
comprised of dry syngas and water present in the gas. It was assumed that the charcoal residues
inside the gasifier after each run amounted to the same.
𝐶𝑎𝑟𝑏𝑜𝑛 𝑖𝑛 =% 𝑜𝑓 𝑐𝑎𝑟𝑏𝑜𝑛 𝑖𝑛 𝑏𝑖𝑜𝑚𝑎𝑠𝑠 𝑥 𝑏𝑖𝑜𝑚𝑎𝑠𝑠 𝑓𝑒𝑒𝑑 𝑟𝑎𝑡𝑒 (
𝑘𝑔
ℎ)
100 (3.2)

41
𝐶𝑎𝑟𝑏𝑜𝑛 𝑜𝑢𝑡 =(
𝛴(𝐶𝑂+𝐶𝑂2+𝐶𝐻4)
100)𝑥 𝑚𝑜𝑙 𝑑𝑒𝑛𝑠𝑖𝑡𝑦 (𝑘𝑔.
𝑚𝑜𝑙
𝑁𝑚3)𝑥 𝑚𝑜𝑙 𝑤𝑡.𝑜𝑓 𝐶 (𝑘𝑔
𝑘𝑔.𝑚𝑜𝑙)𝑥 𝑓𝑙𝑜𝑤 𝑟𝑎𝑡𝑒 (
𝑁𝑚3
ℎ)
1000 (𝑚𝑜𝑙
𝑘𝑔.𝑚𝑜𝑙)
(3.3)
The temperature and pressure of the dead and standard states were assumed to be 25°C and 1
atm, respectively since the gasifier was operated at atmospheric pressure and the pressure drop
across the gasifier was not significant. Gases can be treated as ideal at low pressure and high
temperature. In the dead state, materials are in thermal, mechanical and chemical equilibrium
with the surroundings and incapable of performing any work while the standard state refers to
pure chemical species being able to perform work [11].
Applying the first law of thermodynamics to the gasification process can be illustrated as
𝛴(𝐸𝑖𝑛) = 𝛴(𝐸𝑜𝑢𝑡) (3.4)
where, 𝛴(𝐸𝑖𝑛) = energy of biomass feedstock given by its heating value obtained from
characterization
𝛴(𝐸𝑜𝑢𝑡) = energy of syngas constituents = ∑(𝐸𝑖) (3.5)
The energy content of the syngas produced is determined at two locations - the exit of the
gasifier (Eout, hot) at approximately 800oC and the exit of the heat exchanger (Eout, cold) after the
gas is cooled to ambient temperature (25oC). The efficiencies thus calculated are the hot gas
efficiency (ηhot) and cold gas efficiency (ηcold), respectively [11]. Mathematically,
𝜂ℎ𝑜𝑡 =𝐸𝑜𝑢𝑡,ℎ𝑜𝑡
𝐸𝑖𝑛=
𝐸𝑡𝑜𝑡𝑎𝑙+𝐸ℎ𝑜𝑡
𝐸𝑖𝑛 (3.6)
𝜂𝑐𝑜𝑙𝑑 =𝐸𝑜𝑢𝑡,𝑐𝑜𝑙𝑑
𝐸𝑖𝑛=
𝐸𝑡𝑜𝑡𝑎𝑙
𝐸𝑖𝑛 (3.7)
where Etotal is the enthalpy of the syngas at ambient temperature and Ehot is the enthalpy of gases
at higher temperature.
𝐸𝑡𝑜𝑡𝑎𝑙 = ∑ 𝐸𝑖𝑖 (3.8)

42
where, 𝐸𝑖 = 𝑚𝑖𝑥 𝐻𝐻𝑉 is the enthalpy of each component of syngas
𝑚𝑖 = % 𝑜𝑓𝑐𝑜𝑚𝑝𝑜𝑛𝑒𝑛𝑡
100 𝑥 𝑑𝑒𝑛𝑠𝑖𝑡𝑦 𝑜𝑓 𝑐𝑜𝑚𝑝𝑜𝑛𝑒𝑛𝑡 (𝜌𝑖) (
𝑘𝑔
𝑁𝑚3) 𝑥 𝑓𝑙𝑜𝑤 𝑟𝑎𝑡𝑒 (𝑁𝑚3
ℎ) (3.9)
HHV = Higher heating value of the components of syngas obtained from reference [10].
𝐸ℎ𝑜𝑡 =∑ 𝐶𝑝𝑖(𝑇−298)𝑥𝑖 𝑚𝑖
1000 (3.10)
where Cp is the specific heat in kJ/kg K at constant pressure and is expressed by the following
equation
Cp = co + c1θ + c2θ2 + c3θ
3 (3.11)
Here, co, c1, c2, c3 are the coefficients of specific heat capacity and the values for these
coefficients are listed in Table 3.1.
Table 3.1 Empirical coefficients of gases [31]
Empirical coefficients
Gases co c1 c2 c3
CO 1.1 -0.46 1 -0.454
CO2 0.45 1.67 -1.27 0.39
CH4 1.2 3.25 0.75 -0.71
N2 1.11 -0.48 0.96 -0.42
O2 0.88 -0.0001 0.54 -0.33
H2 13.46 4.6 -6.85 3.79
Exergy is generally defined as the measure of a system’s potential to perform useful work. It
considers irreversible increase in entropy to analyze energy conversion processes [12]. From the
second law of thermodynamics, qualitative expression of the law of conservation and conversion
of energy to the gasification process gives the entropy balance.
Exergy of dry biomass is given by the following equation:
𝐸𝑥𝑖𝑛 = 𝛽. (𝐿𝐻𝑉𝑏𝑖𝑜𝑚𝑎𝑠𝑠). 𝑚𝑑𝑟𝑦 (3.12)

43
where 𝛽 ={1.044+0.016 (
𝐻
𝐶)−
0.3493
𝐶[1+0.0531(
𝐻
𝐶)]+0.0493(
𝑁
𝐶)}
[1−0.4124(𝑂
𝐶)]
(3.13)
β is the ratio of chemical exergy of the biomass to the lower heating value of the organic fraction
of biomass (LHVbiomass).
𝐿𝐻𝑉𝑏𝑖𝑜𝑚𝑎𝑠𝑠 =𝐻𝐻𝑉−22604 𝐻
1000 (3.14)
where, LHVbiomass is in MJ/kg, HHV is in kJ/kg and H is the fraction by weight of hydrogen in
the biomass.
The exergy of the individual gases in syngas is given by
𝐸𝑥𝑖 = 𝐸𝑥𝑐ℎ𝑖 + ∫ [𝐶𝑝 (1 −𝑇𝑑
𝑇)] 𝑑𝑇
𝑇
𝑇𝑑 (3.15)
where Exi is the exergy of the gas in MJ/kg at temperature T (K), Exchi is the chemical exergy of
the gases at reference or dead state (298 K). The values of Exchi are given in Table 3.2, taken
from the corresponding reference [11].
Table 3.2 Properties of syngas constituents
Gases Gas constant, R
(kJ/kg-K)
Density at STP, ρ
(kg/m3)
Heating value
(kJ/kg)
Chemical
Exergy (Exchi)
N2 0.297 1.249 0.000 0
CO 0.297 1.250 10.081 9.9
CO2 0.189 1.964 0.000 0
CH4 0.518 0.716 55.470 39.8
H2 4.124 0.090 141.824 68.9
Now,
𝐸𝑥𝑔𝑎𝑠 = exergy of syngas constituents = ∑(𝐸𝑥𝑖) (3.16)
The exergetic efficiency is thus given by

44
𝜂𝑥 =𝐸𝑥𝑔𝑎𝑠
𝐸𝑥𝑖𝑛 (3.17)
3.4.4 Ash Composition Analysis
At high reaction temperatures, the inorganic components in biomass feedstocks tend to melt and
cause slagging, fouling, bed agglomeration and corrosion [13]. Vamvuka and Zografos [14]
evaluated the slagging and fouling potential of biomass residues using alkali index (AI), base-to-
acid ratio (Rb/a), and the bed agglomeration index (BAI). The alkali index (AI) gives the quantity
of alkali oxide in the fuel per unit of fuel energy (kg/GJ) and is computed as:
𝐴𝐼 =(𝐾2𝑂+ 𝑁𝑎2𝑂)
𝐻𝐻𝑉
𝑘𝑔
𝐺𝐽 (3.18)
Condition for slagging or fouling:
AI = 0.17-0.34 kg/GJ; may or may not occur
AI > 0.34; certain to occur
Bed agglomeration index (BAI) is used to relate agglomeration to ash composition in fluidized
bed reactors [15], and given by:
𝐵𝐴𝐼 =(𝐹𝑒2𝑂3)%
(𝐾2𝑂+𝑁𝑎2𝑂)% (3.19)
Condition for bed agglomeration to occur: BAI < 0.15 [14].
3.4.5 Syngas Contaminants
Tar Analysis
Collection of moisture and tar is performed in a series of six impinger bottles (as shown in Fig
3.4) referred to as “Peterson column”. Moisture and tar are condensed from the process gas by
absorption in isopropanol in the first bottle. After that, the gas is passed through a series of four
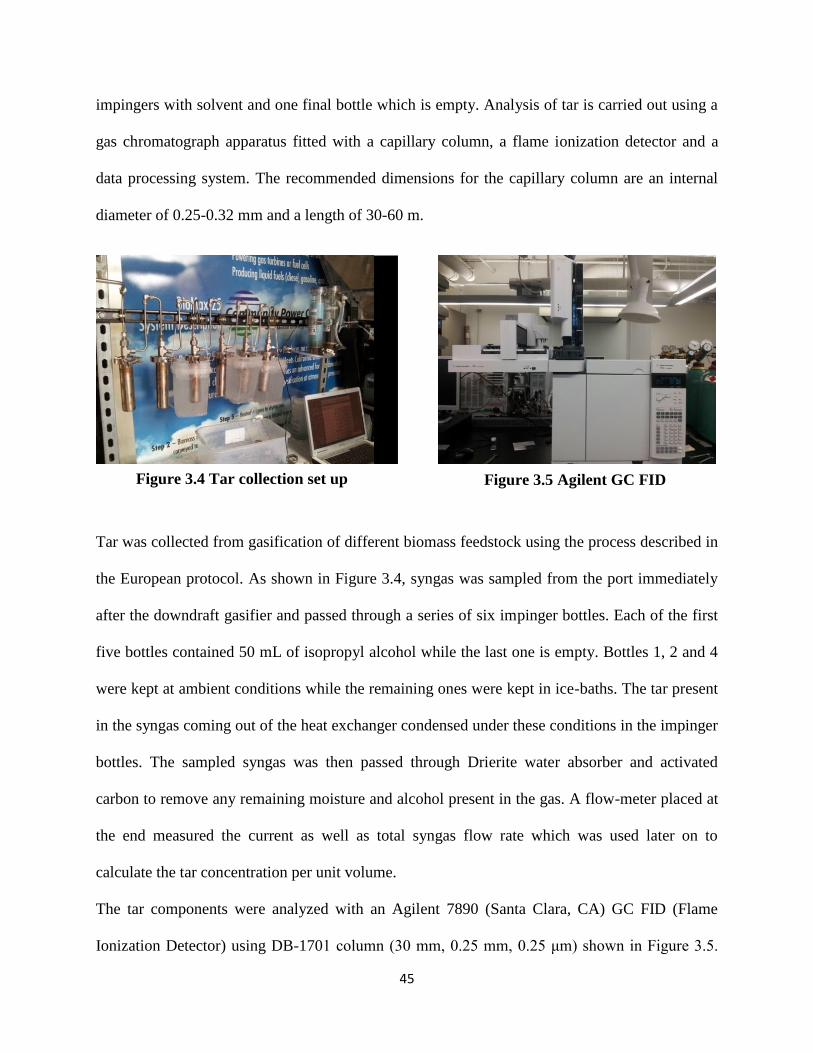
45
impingers with solvent and one final bottle which is empty. Analysis of tar is carried out using a
gas chromatograph apparatus fitted with a capillary column, a flame ionization detector and a
data processing system. The recommended dimensions for the capillary column are an internal
diameter of 0.25-0.32 mm and a length of 30-60 m.
Tar was collected from gasification of different biomass feedstock using the process described in
the European protocol. As shown in Figure 3.4, syngas was sampled from the port immediately
after the downdraft gasifier and passed through a series of six impinger bottles. Each of the first
five bottles contained 50 mL of isopropyl alcohol while the last one is empty. Bottles 1, 2 and 4
were kept at ambient conditions while the remaining ones were kept in ice-baths. The tar present
in the syngas coming out of the heat exchanger condensed under these conditions in the impinger
bottles. The sampled syngas was then passed through Drierite water absorber and activated
carbon to remove any remaining moisture and alcohol present in the gas. A flow-meter placed at
the end measured the current as well as total syngas flow rate which was used later on to
calculate the tar concentration per unit volume.
The tar components were analyzed with an Agilent 7890 (Santa Clara, CA) GC FID (Flame
Ionization Detector) using DB-1701 column (30 mm, 0.25 mm, 0.25 μm) shown in Figure 3.5.
Figure 3.4 Tar collection set up
Figure 3.5 Agilent GC FID

46
The front inlet temperature of the GC was maintained at 250oC, and the oven was programmed
with the following temperature regime: hold at 40oC for 2 min, heat to 250oC at 5oC/min, and
hold at 250oC for 8 min. A split ratio of 50:1 was set for injection, and He (99.999 pure) was
used as the carrier gas at a flow rate of 1.25 mL/min. Compounds were identified using the
National Institute of Standards and Technology (NIST) mass spectral library and were quantified
based on their consistency of appearance. Quantification was done by injecting calibration
standards initially and the slope of the calibration line was taken as the quantification factor in
calculation. Analyses were carried out in triplicates and the average values are reported. BTEX
compounds (benzene, toluene and ethyl benzene), PAHs (Indene, Napthalene) and hetero-
aromatic compounds (phenol) were few of the compounds that were selected for quantification.
Hydrogen Sulfide Analysis
Syngas coming out of the gasifier was pressurized up to 500 psi and collected in bottles using a
compressor and booster system during the course of experiments. For each experiment, the
samples of syngas were collected at three different times: half an hour into the test, one and half
hour and finally at two and half hours. The bottles were taken to the chemical lab to get the
samples analyzed before the next test. H2S was analyzed with Agilent GC FPD (Santa Clara,
CA) using CP-Sil 8 CB column. The front inlet temperature was kept at 250oC, and the oven at
35oC. A split ratio of 20:1 was set for injection and He was used as the carrier gas at a flow rate
of 1.1 mL/min.

47
3.4.6 Experimental Design and Statistical Analysis
Different biomass feedstocks were the predictors while the results from characterization of
biomass, syngas composition, its higher heating value and concentration of contaminants were
the response variables. All the experiments were carried out in triplicates. Statistical significance
test (α = 0.05) was performed using Proc GLM procedure in the statistical software SAS 9.3
(SAS Institute Inc., Cary, NC). Tukey test was also used to compare the means of the values
obtained from different biomass analyses, and composition, higher heating value and
contaminants’ concentration of syngas.
3.5 Results and Discussion
3.5.1 Analyses of Feedstock
A summary of the proximate analysis is presented in Table 3.3. Switchgrass showed the highest
ash content (4.66% d.b.) among the feedstocks. Sharma et al. [28] reported similar ash content
(4.62% d.b.) for chopped Kanlow switchgrass. Torrefied pine and pine bark had significantly
higher ash content compared to hardwood, loblolly pine, yellow pine pellets and pine chips but
significantly lower than switchgrass. Pine chips had the lowest ash content (0.25% d.b.), which
made it a suitable feedstock from the point of smooth operation of the gasifier. Hardwood and
Figure 3.6 Syngas collection setup for H2S
Figure 3.7 Agilent GC FPD
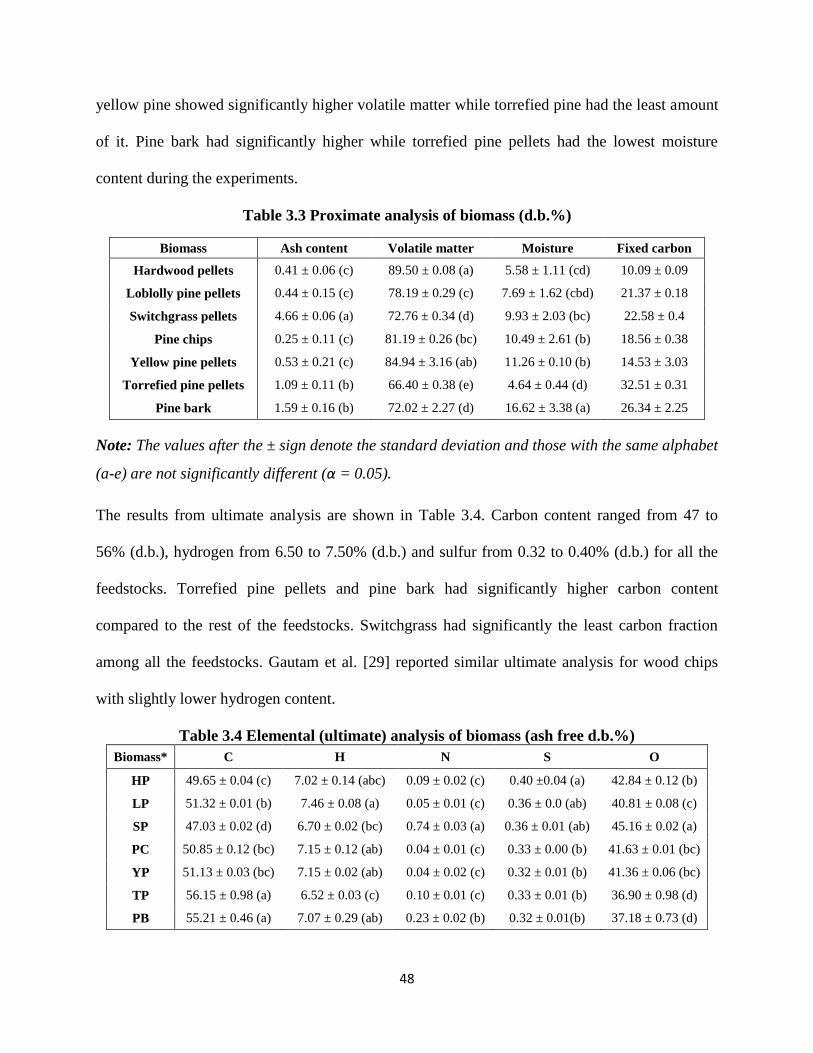
48
yellow pine showed significantly higher volatile matter while torrefied pine had the least amount
of it. Pine bark had significantly higher while torrefied pine pellets had the lowest moisture
content during the experiments.
Table 3.3 Proximate analysis of biomass (d.b.%)
Biomass Ash content Volatile matter Moisture Fixed carbon
Hardwood pellets 0.41 ± 0.06 (c) 89.50 ± 0.08 (a) 5.58 ± 1.11 (cd) 10.09 ± 0.09
Loblolly pine pellets 0.44 ± 0.15 (c) 78.19 ± 0.29 (c) 7.69 ± 1.62 (cbd) 21.37 ± 0.18
Switchgrass pellets 4.66 ± 0.06 (a) 72.76 ± 0.34 (d) 9.93 ± 2.03 (bc) 22.58 ± 0.4
Pine chips 0.25 ± 0.11 (c) 81.19 ± 0.26 (bc) 10.49 ± 2.61 (b) 18.56 ± 0.38
Yellow pine pellets 0.53 ± 0.21 (c) 84.94 ± 3.16 (ab) 11.26 ± 0.10 (b) 14.53 ± 3.03
Torrefied pine pellets 1.09 ± 0.11 (b) 66.40 ± 0.38 (e) 4.64 ± 0.44 (d) 32.51 ± 0.31
Pine bark 1.59 ± 0.16 (b) 72.02 ± 2.27 (d) 16.62 ± 3.38 (a) 26.34 ± 2.25
Note: The values after the ± sign denote the standard deviation and those with the same alphabet
(a-e) are not significantly different (α = 0.05).
The results from ultimate analysis are shown in Table 3.4. Carbon content ranged from 47 to
56% (d.b.), hydrogen from 6.50 to 7.50% (d.b.) and sulfur from 0.32 to 0.40% (d.b.) for all the
feedstocks. Torrefied pine pellets and pine bark had significantly higher carbon content
compared to the rest of the feedstocks. Switchgrass had significantly the least carbon fraction
among all the feedstocks. Gautam et al. [29] reported similar ultimate analysis for wood chips
with slightly lower hydrogen content.
Table 3.4 Elemental (ultimate) analysis of biomass (ash free d.b.%)
Biomass* C H N S O
HP 49.65 ± 0.04 (c) 7.02 ± 0.14 (abc) 0.09 ± 0.02 (c) 0.40 ±0.04 (a) 42.84 ± 0.12 (b)
LP 51.32 ± 0.01 (b) 7.46 ± 0.08 (a) 0.05 ± 0.01 (c) 0.36 ± 0.0 (ab) 40.81 ± 0.08 (c)
SP 47.03 ± 0.02 (d) 6.70 ± 0.02 (bc) 0.74 ± 0.03 (a) 0.36 ± 0.01 (ab) 45.16 ± 0.02 (a)
PC 50.85 ± 0.12 (bc) 7.15 ± 0.12 (ab) 0.04 ± 0.01 (c) 0.33 ± 0.00 (b) 41.63 ± 0.01 (bc)
YP 51.13 ± 0.03 (bc) 7.15 ± 0.02 (ab) 0.04 ± 0.02 (c) 0.32 ± 0.01 (b) 41.36 ± 0.06 (bc)
TP 56.15 ± 0.98 (a) 6.52 ± 0.03 (c) 0.10 ± 0.01 (c) 0.33 ± 0.01 (b) 36.90 ± 0.98 (d)
PB 55.21 ± 0.46 (a) 7.07 ± 0.29 (ab) 0.23 ± 0.02 (b) 0.32 ± 0.01(b) 37.18 ± 0.73 (d)

49
Note: The values after the ± sign denote the standard deviation and those with the same alphabet
(a-d) are not significantly different (α = 0.05).
*Abbreviations for the biomass used: HP – Hardwood pellets, LP – Loblolly pine pellets, SP –
Switchgrass pellets, PC – Pine chips, YP – Yellow pine pellets, TP – Torrefied pine pellets and
PB – Pine bark
Table 3.5 shows the physical properties and higher heating value of biomass. The HHV of all the
feedstocks were found to be significantly different than each other. The effect of torrefaction can
be clearly seen in the high HHV of torrefied pine pellets. Switchgrass had the lowest HHV
among other biomass types. The pellets show comparable bulk densities in the range of 610-690
kg/m3, while that for pine chips and bark are quite lower as expected. Similarly, the particle
densities of pellets are also similar but much higher than pine chips and bark.
Table 3.5 Higher heating value (d.b.) and density of biomass
Biomass Higher Heating Value
(MJ/kg)
Bulk density
(kg/m3)
Particle density
(kg/m3)
Hardwood pellets 19.73 ± 0.14 (a) 667.51 ± 5.75 1462.83 ± 3.2
Loblolly pine pellets 20.85 ± 0.14 (b) 684.35 ± 5.37 1456.07 ± 2.4
Switchgrass pellets 18.96 ± 0.03 (c) 635.46 ± 3.52 1476.20 ± 3.2
Pine chips 19.56 ± 0.19 (d) 225.33 ± 4.54 1350.12 ± 1.87
Yellow pine pellets 20.17 ± 0.02 (e) 611.15 ± 3.87 1434.47 ± 0.89
Torrefied pine pellets 22.54 ± 0.14 (f) 685.39 ± 3.08 1424.47 ± 1.66
Pine bark 21.48 ± 0.06 (g) 153.17 ± 3.52 1079.47 ± 0.06
Note: The values after the ± sign denote the standard deviation and those with the same alphabet
(a-g) are not significantly different (α = 0.05).
Table 3.6 shows the inorganic composition of biomass as obtained from ash composition
analysis conducted at University of Tennessee, Knoxville. The data were used to compute the
Alkali Index (AI) and the Bed Agglomeration Index (BAI) for predicting the slagging/fouling
and agglomeration behavior of the biomass. As seen in Table 3.7, the AI for switchgrass was
0.85 (>0.34), which meant fouling/slagging certainly occurs. The AI being less than 0.17 for the

50
rest of the feedstocks showed that phenomenon would not occur. BAI was determined to be
lower than 0.15 for hardwood, loblolly pine, switchgrass and pine chips showing that
agglomeration would occur. However, ash agglomeration was actually seen only during
switchgrass gasification.
Table 3.6 Major inorganic composition (mg/kg biomass)
Biomass Fe Ca Mg K Na Ti Al
HP 67.18±1.3 1017.39±21.6 51.71±2.5 777.15±29.3 15.72±1.3 0.74±0.01 0.00
LP 14.33±0.6 801.62±26.9 277.95±10.0 901.14±35.1 23.29±0.9 0.00 17.95±1.8
SP 315.74±5.7 2747.25±42.9 1305.74±19.7 6497.26±0.21 166.14±1.0 35.28±0.4 292.93±8.3
PC 32.69±1.5 481.07±11.2 169.32±4.4 419.99±16.5 0.00 0.75±0.0 23.93±2.6
YP 575.11±23.1 768.57±10.8 281.25±6.5 654.29±3.4 40.17±1.9 1.184±0.0 23.70±0.9
TP 341.09±14.5 1556.44±0.9 273.84±0.4 509.27±3.1 168.95±1.1 2.88± 0.2 55.64±2.2
PB 916.38±9.1 1373.28±40.4 436.71±9.7 938.99±18.2 23.19±0.9 20.33±1.8 612.98±8.1
Note: The values after the ± sign denote the standard deviation.
Table 3.7 Determination of alkali index (AI) and bed agglomeration index (BAI)
Biomass AI (kg/GJ) BAI
Hardwood 0.09 0.10
Loblolly pine 0.11 0.02
Switchgrass 0.85 0.06
Pine chips 0.05 0.09
Yellow pine 0.09 0.98
Torrefied pine 0.08 0.58
Pine bark 0.13 1.13
3.5.2 Gasification Results
The values of moisture content and mass flow rate of biomass, and the equivalence ratio (E.R.)
obtained for the gasification experiments are shown in Table 3.8. Pine bark had the highest
moisture content (17%) while torrefied pine (5%) was the driest among all. The average dry
biomass flow rate was 23-26 kg/hr for all feedstocks except pine bark which had a low mass

51
flow rate of approximately 19 kg/hr. The E.R. for the experiments ranged from 0.26 for yellow
pine to 0.35 for pine bark gasification.
Table 3.8 Experimental conditions for different feedstocks
Moisture
(d.b.%)
Dry biomass
flowrate (kg/hr)
Equivalence
ratio (ER) Biomass
Hardwood pellets 5.58 ± 1.11 25.88 ± 0.58 0.28
Switchgrass pellets 9.93 ± 2.03 25.31 ± 0.45 0.34
Loblolly pine pellets 7.69 ± 1.62 24.11 ± 0.69 0.30
Pinewood chips 10.49 ± 2.61 23.59 ± 0.00 0.32
Yellow Pine pellets 11.26 ± 0.10 24.46 ± 1.58 0.26
Torrefied Pine pellets 4.64 ± 0.44 23.01 ± 0.21 0.28
Pine Bark 16.62 ± 3.38 18.75 ± 0.08 0.35
Note: The values after the ± sign denote the standard deviation.
The average composition and higher heating value (HHV) of syngas from gasification of
different biomass feedstock is reported in Table 3.9. The gas composition data for one of the
torrefied pine gasification experiments generated by the gas analyzer over time and the
temperature profile inside the reactor during the same experiment are shown in Appendix A.1
and A.2. Yellow pine which had the lowest E.R. (0.26) during gasification showed the highest
fraction of CO as well as H2. It suggests that there was lesser oxygen available for the oxidation
reactions which ultimately produce more CO2 and H2O. Higher carbon fraction in yellow and
torrefied pine, pine bark and chips also contributed to the syngas being rich in carbon monoxide.
Wan et al. [30] performed gasification in a similar model of Bio-Max 25 downdraft gasifier
using oak wood chips and reported syngas composition as 18% H2, 21% CO, 10% CO2, 2% CH4
and 48% N2. Gautam et al. [29] reported the concentration of 20% H2 and 21% CO from
gasification of pine wood chips. Sharma et al. [28] used switchgrass in a lab-scale fluidized bed
gasifier and reported slightly lower concentration of H2 (9%) and CO (16%).

52
The sample calculation for determination of HHV is given in Appendix B.1. The values for all
the feedstock ranged from 4.81-6 MJ/Nm3. Syngas from switchgrass, which had the highest ash
content and lowest carbon content, showed the least HHV among others. There was no direct
correlation between the higher heating values of the solid fuel, properties such as particle and
bulk density to the HHV of syngas. Gautam et al. [29] reported a similar syngas HHV of 5.7
MJ/Nm3 from wood chips but Sharma et al. [28] achieved higher syngas HHV of 6.6 MJ/Nm3
from gasification of switchgrass in a fluidized bed gasifier.
Table 3.9 Composition and higher heating value of syngas from different feedstocks
Syngas composition (Molar %) Higher heating
value (MJ/Nm3) Biomass H2 CO CO2 CH4
HP 16.77 ± 0.25 (ac) 21.13 ± 0.60 (ab) 11.60 ± 2.12 (bcd) 1.94 ± 0.72 (c) 5.57 ± 0.05 (acd)
SP 14.97 ± 0.74 (a) 18.50 ± 0.52 (b) 12.00 ± 1.23 (bc) 1.43 ± 0.61 (bc) 4.81 ± 0.13 (b)
LP 14.33 ± 0.08 (b) 18.40 ± 0.78 (b) 10.54 ± 1.85 (bcd) 1.94 ± 0.78 (c) 4.92 ± 0.07 (b)
PC 15.74 ± 0.62 (abc) 20.10 ± 1.65 (ab) 11.05 ± 1.71 (bcd) 1.57 ± 0.51 (bc) 5.16 ± 0.03 (bc)
YP 17.35 ± 1.67 (c) 25.05 ± 1.67 (c) 9.59 ± 2.24 (ad) 1.56 ± 0.58 (bc) 5.99 ± 0.48 (ad)
TP 15.13 ± 0.25 (a) 24.51 ± 0.62 (c) 7.88 ± 1.33 (a) 1.49 ± 0.54 (b) 5.61 ± 0.06 (acd)
PB 15.19 ± 0.51 (a) 22.95 ± 1.77 (ac) 10.85 ± 1.23 (bcd) 0.94 ± 0.26 (a) 5.20 ± 0.19 (bc)
Note: The values after the ± sign denote the standard deviation and those with the same alphabet
(a-d) are not significantly different (α = 0.05).
The effect of equivalence ratio (E.R.) on the higher heating value of dry syngas produced from
different biomass is presented in Figure 3.8. It was observed that syngas produced at higher E.R.
had lower HHV. Gasification of switchgrass and loblolly pine pellets, pine chips and pine bark
were carried out at E.R. ranging from 0.30 to 0.35 and the HHV of syngas from those feedstocks
ranged from 4.81 to 5.20 MJ/Nm3. These values were significantly lower than the HHV of
syngas from yellow pine (6 MJ/Nm3), the E.R. being 0.26. Figure 3.9 shows the correlation of
ash content in biomass to the HHV of syngas produced from it. Although there is no clear trend
in HHV for ash content 0.25-0.53%, it can be seen that the HHV decreases gradually for ash

53
content 0.53 to 4.66%. It should also be noted that there was no significant difference in the ash
content values 0.25-0.53 among the feedstocks, as discussed in Table 3.3.
Figure 3.8 Effect of E.R. on higher heating value of syngas
Figure 3.9 Effect of ash content of biomass on higher heating value of syngas
0
1
2
3
4
5
6
7
0.26 0.28 0.30 0.32 0.34 0.35
HH
V (
MJ/
m3)
E.R.
0
1
2
3
4
5
6
7
0.25 0.41 0.44 0.53 1.09 1.59 4.66
HH
V (
MJ/
m3 )
Ash content (d.b.%)

54
3.6.2 Carbon, Energy and Exergy Analyses
Charcoal was used to start up the experiment and was refilled to the same level before every
other run. Hence, the residues inside the gasifier were considered to be the same after each run.
The ash and tars trapped inside the gasification system were neglected when doing these
analyses. Table 3.10 shows the results from the three experiments carried out for each biomass
feedstock. The sample calculations for these analyses are given in Appendix B.2. Carbon
conversion of approximately 0.77-0.98 was achieved for different feedstocks, with pine bark
showing the highest carbon conversion of 0.98. Operational difficulties due to the size of the
system were a factor in not having very accurate carbon conversion values. Gautam et al. [31]
reported a carbon closure greater than 0.89 with gasification of wood chips in the same
downdraft gasifier as used in this experiment. Wan et al. [32] also used a BioMax 25 system for
gasification of oak wood chips and calculated a carbon conversion rate of approximately 0.92.
Zainal et al. [33] used furniture wood and wood chips in a downdraft gasifier and reported
maximum carbon closure of 0.98 at an ER of 0.27. The hot and cold gas efficiency and exergy
for loblolly pine and switchgrass pellets was found to be lower than other feedstocks due to
lower concentration of carbon monoxide in syngas. Similarly, loblolly pine showed the lowest
and pine bark had the highest exergy ratio.
Table 3.10 Carbon, energy and exergy analyses of different biomass (%)
Biomass Carbon
closure
Hot gas
efficiency
Cold gas
efficiency Exergy ratio
Hardwood pellets 0.80 ± 0.01 0.75 ± 0.04 0.62 ± 0.03 0.50 ± 0.01
Loblolly pine pellets 0.77 ± 0.01 0.71 ± 0.01 0.57 ± 0.01 0.46 ± 0.01
Switchgrass pellets 0.82 ± 0.03 0.71 ± 0.02 0.57 ± 0.02 0.47 ± 0.02
Pine chips 0.83 ± 0.01 0.78 ± 0.01 0.66 ± 0.02 0.53 ± 0.01
Yellow pine pellets 0.86 ± 0.02 0.87 ± 0.01 0.80 ± 0.02 0.61 ± 0.01
Torrefied pine pellets 0.79 ± 0.01 0.77 ± 0.01 0.66 ± 0.01 0.55 ± 0.01
Pine bark 0.98 ± 0.05 0.97 ± 0.04 0.82 ± 0.03 0.71 ± 0.03

55
Note: The values after the ± sign denote the standard deviation.
3.6.3 Tar Concentration
Loblolly pine pellets showed the highest total concentration of 2.54 g/m3 of tar compounds
among the used biomass feedstock, while pine bark and pine chips had lower concentrations
(0.91 and 1.36 g/m3 respectively) as compared to pellets. This can be attributed to the higher
bulk density of pellets than pine chips and bark. Benzene, toluene and 3-methyl phenol were the
most commonly occurring non-condensable compounds in all of the samples collected from
different biomass as seen in Figure 3.10. However, the concentration of indene (light,
condensable PAH) was found to be higher than 0.1 g/m3 in loblolly pine, which can be a cause of
concern in syngas applications. Phuphuakrat et al. [34] reported a maximum tar concentration of
3.3 g/m3 produced from gasification of dried sewage sludge in a downdraft gasifier. However,
the major components in that case were light, non-condensable aromatic hydrocarbon tar such as
benzene, toluene, xylene, styrene, indene and naphthalene, which are not harmful to engines. The
retention times for the detected compounds are included in Appendix C.

56
Figure 3.10 Tar concentration in syngas from gasification of feedstocks
Hernandez et al. [35] reported that in air gasification, the most abundant compounds at 750oC
were benzene, xylenes and phenol, while PAHs were the least abundant compounds (less than
0.3 g/m3) regardless of the operating temperature. Passen and Kiel [36] studied the impact of
feedstock properties and gasifier operating conditions on tar formation in a fluidized bed gasifier.
The gasifier temperature was reported to have the largest influence on tar composition. Class 2
tars almost decomposed at 850oC while class 4 and 5 (heavy) tars continuously increased with
increasing temperature.
3.6.4 Hydrogen Sulfide Concentration
As shown in Figure 3.11, syngas from hardwood pellets had the highest concentration of H2S
(83.71 ppmv), followed by torrefied pine pellets (82.92 ppmv). It was expected since the
hardwood pellets had the highest sulfur content (0.4%) as seen in Table 3.4. Syngas samples
from all the biomass runs had higher concentration of H2S than the maximum limit for different
0
0.2
0.4
0.6
0.8
1
1.2
1.4
1.6
Benzene Toluene Ethylbenzene
O-xylene Styrene Indene Phenol 3 methylphenol
Napthalene 2 methylnapthalene
Biphenyl
Tar
con
cen
trat
ion
(g/
m3 )
Yellow pine Loblolly pine Torrefied pine Switchgrass
Hardwood Pine bark Pine chips

57
applications such as gas turbines (< 20 ppmv) and Fischer-Trope synthesis (< 10-8 ppmv). Gupta
et al. [37] reported an approximate H2S concentration of 28000 ppmv in syngas from gasification
of black liquor produced by the pulp and paper industry. Unfortunately, the H2S data for loblolly
pine and pine chips could not be collected because the GC FPD was under maintenance during
the gasification of these biomass feedstocks.
Figure 3.11 H2S concentration in syngas from different biomass feedstock
3.7 Conclusions and Remarks
Seven biomass feedstocks were selected and characterized for gasification experiments in the
CPC mobile downdraft gasifier. Syngas produced from the experiments was analyzed in terms of
composition and contaminants. Analyses for carbon closure, hot and cold gas efficiency, and
exergy were performed. The following conclusions were drawn from this study:
0
10
20
30
40
50
60
70
80
90
100
Hardwoodpellets
Switchgrasspellets
Yellow Pinepellets
Torrefied Pinepellets
Pine Bark
Sulf
ur
con
cen
trat
ion
(p
pm
v)
58
Among the biomass feedstock used in the experiments, yellow pine pellets showed the
most potential in terms of producing syngas with higher H2 and CO content, and thus
higher HHV.
Switchgrass due to its low carbon content and high ash content produces syngas with
relatively lower heating value. Although the switchgrass pellets showed good flow
characteristics in the reactor, there was frequent ash build up in the grate of the gasifier.
Loblolly pine pellets had the highest total tar concentration along with higher than
acceptable limit of condensable compound indene (light PAH). Most commonly
occurring compounds were non-condensable, water soluble compounds such as benzene,
toluene and phenol.
Hydrogen sulfide concentration was higher than 70 ppmv for all the feedstocks, which
means that the syngas is unsuitable for direct use in many applications.
3.8 References
[1] P. Basu, Biomass Gasification and Pyrolysis, Burlington, MA: Academic Press/ Elsevier,
2010.
[2] L. Wei, J. A. Thomasson, R. M. Bricka, R. Sui, J. R. Wooten and E. P. Columbus, "Syngas
quality evaluation for biomass gasification with a downdraft gasifier," Transactions of the
ASABE, vol. 52, no. 0001-2351, pp. 21-37, 2009.
[3] D. J. Stevens, "Hot gas conditioning: Recent progress with larger scale biomass gasification
system, update and summary of recent progress.," NREL Publication RS-510-29952,
Golden, CO.: National Renewable Energy Laboratory, 2001.
[4] T. Hanaoka, S. Inoue, S. Uno, T. Ogi and T. Minowa, "Effect of woody biomass
components on air-steam gasification," Biomass Bioenergy, vol. 28, pp. 69-76, 2005.
[5] P. N. Sheth and B. V. Babu, "Experimental studies on producer gas generation from wood
waste in a downdraft biomass gasifier," Bioresource Technology, vol. 100, pp. 3127-3133,
2009.

59
[6] V. Skoulou, A. Zabaniotou, G. Stavropoulos and G. Sakelaropoulos, "Syngas production
from olive tree cuttings and olive kernels in a downdraft fixed-bed gasifier," International
Journal of Hydrogen Energy, vol. 33, pp. 1185-1194, 2008.
[7] ASTM, "ASTM Standard test method for moisture analysis of particulate wood fuels,"
ASTM International, West Conshohocken, PA, 2013.
[8] ASTM, "Standard test method for ash in biomass," ASTM International, West
Conshohocken, PA, 2007.
[9] ASTM, "Standard test methods for analysis of wood fuels," ASTM International, West
Conshohocken, PA, 2006.
[10] L. Waldheim and T. Nilsson, "Thermal gasification of biomass," IEA Bioenergy
Agreement, 2001.
[11] M. Rao, S. P. Singh, M. S. Sodha, A. K. Dubey and M. Shyam, "Stoichiometric, mass,
energy and exergy balance analysis of countercurrent fixed-bed gasification of post-
consumer residues," Biomass and Bioenergy, vol. 27, pp. 155-171, 2004.
[12] R. Karamarkovic and V. Karamarkovic, "Energy and exergy analysis of biomass
gasification at different temperatures," Energy, vol. 35, pp. 537-549, 2010.
[13] R. W. Bryers, "Fireside slagging, fouling, and high-temperature corrosion of heat transfer
surface due to impurities in steam-raising fuels," Progress in Energy and Combustion Sci.,
vol. 22, no. 1, pp. 29-120, 1996.
[14] D. Vamvuka and D. Zografos, "Predicting the behavior of ash from agricultural wastes
during combustion," Fuel, vol. 83, no. 14-15, pp. 2051-2057, 2004.
[15] B. J. Skrifvars, M. Hupa and M. Hiltunen, "Predicting bed agglomeration tendencies for
biomass fuels and fired in FBC boilers," Energy and Fuels, vol. 13, no. 2, pp. 359-363,
1998.
[16] L. Devi, K. J. Ptasinski and F. J. Janssen, "A review of the primary measures for tar
elimination in biomass gasification processes," Biomass Bioenergy, vol. 24, pp. 125-140,
2003.
[17] J. Han and H. Kim, "The reduction and control technology of tar during biomass
gasification/pyrolysis: An overview," Renewable and Sustainable Energy Reviews, vol. 12,
pp. 397-416, 2008.

60
[18] D. C. Elliott, E. Soltes and T. Milne, "Relation of reaction time and temperature to chemical
composition of pyrolysis oils," in American Chemistry Society (ACS) Symposium Series,
Denver, CO, 1988.
[19] T. Milne, R. J. Evans and N. Abatzouglou, "Biomass gasifier 'tars': their nature, formation,
destruction, and tolerance limits in energy conversion devices," in 3rd Biomass Conference
of the Americas, 1997.
[20] D. Stevens, "Hot gas conditioning: Recent progress with larger-scale biomass systems,"
NREL/SR-510-29952, 2001.
[21] W. Torres, S. S. Pansare and J. G. Goodwin, "Hot gas removal of tars, ammonia, and
hydrogen sulfide from biomass gasification gas," Catal Rev Sci Eng, vol. 49, no. 4, pp. 407-
456, 2007.
[22] J. Good, L. Ventress, H. Knoef, U. Zielke, P. L. Hansen and W. van de Kamp, "Sampling
and analysis of tar and particles in biomass producer gases," Eur Comm EFTA, 2005.
[23] CEN, "Biomass Gasification: Tar and particles in product gases - sampling and analysis,"
European Commission and the European Free Trade Association, 2005.
[24] H. Knoef and H. J. Koele, "Survey of tar measurement protocols," Biomass and Bioenergy ,
vol. 18, pp. 55-59, 2000.
[25] N. Abatzouglou, N. Barker, P. Hasler and H. Knoef, "The development of a draft protocol
for the sampling and analysis of particulate and organic contaminants in the gas from small
biomass gasifiers," Biomass and Bioenergy, vol. 18, no. 1, pp. 5-17, 2000.
[26] R. Lovell, S. Dylewski and C. Peterson, "Control of sulfur emissions from oil share retorts,"
EPA; Report no. 600/7-82-016, Cincinnati, OH, 1981.
[27] B. L. Dou, M. C. Zhang, J. S. Gao, W. Q. Shen and X. Z. Sha , "High temperature removal
of ammonia and organic sulfur, HCl, and tar component from coal derived gas," Ind Eng
Chem Res, vol. 41, no. 17, pp. 4195-4200, 2002.
[28] A. Sharma, A. Kumar, K. N. Patil and R. L. Huhnke, "Performance evaluation of a lab-scale
fluidized bed gasifier using switchgrass as feedstock," Transactions of the ASABE,
American Society of Agricultural and Biological Engineers , vol. 54, no. 6, pp. 2259-2266,
2011.
[29] G. Gautam, S. Adhikari, C. Brodbeck, S. Bhavnani, O. Fasina and S. Taylor, "Gasification
of wood chips, agricultural residues, and waste in a commercial downdraft gasifier,"

61
Transactions of the ASABE, vol. 54, no. 5, pp. 1801-1807, 2011.
[30] C. Wan, Y. Zhang, Q. Li and J. Wooten, "Material balance and energy balance analysis for
syngas generation by a pilot plant scale downdraft gasifier," Biobased Materials and
Bioenergy, vol. 7, pp. 690-695, 2013.
[31] G. Gautam, "Parametric study of a commercial-scale biomass downdraft gasifier:
Experiments and equilibrium modeling," Auburn University, Department of Mechanical
Engineering, Auburn, AL, 2010.
[32] C. Wan, F. Yu, Y. Zhang, Q. Li and J. Wooten, "Material balance and energy balance
analysis for syngas generation by a pilot plant scale downdraft gasifier," Biobased Materials
and Bioenergy, vol. 7, pp. 690-695, 2013.
[33] Z. A. Zainal, A. Rifau, G. A. Quadir and K. N. Seetharamu, "Experimental investigation of
a downdraft biomass gasifier," Biomass and Bioenergy, vol. 23, pp. 283-289, 2002.
[34] T. Phuphuakrat, N. Nipattummakul, T. Namioka, S. Kerdsuwan and K. Yoshikawa,
"Characterization of tar content in the syngas produced in a downdraft type fixed bed
gasification system from dried sewage sludge," Fuel, vol. 89, pp. 2278-2284, 2010.
[35] J. J. Hernandez, R. Ballesteros and G. Aranda, "Characterization of tars from biomass
gasification: Effect of the operating conditions," Energy, vol. 50, pp. 333-342, 2013.
[36] S. V. B. Passen and J. H. A. Kiel, "Tar formation in a fluidized bed gasifier: Impact of fuel
properties and operating parameters," in 2nd World Conference and Technological
Exhibition on Biomass for Energy, 2004.
[37] R. P. Gupta, B. S. Turk, J. W. Portzer and D. C. Cicero, "Desulfurization of syngas in a
transport reactor," Environmental Progress, vol. 20, no. 3, pp. 187-195, 2001.
62
CHAPTER FOUR
GASIFICATION OF BLENDED BIOMASS FEEDSTOCKS
4.1 Abstract
A study was conducted to evaluate the effect of blending a biomass that has higher ash content
with a biomass that has lower ash content. Switchgrass was blended with yellow pine pellets and
pine bark with pine chips in two different ratios of 25:75 and 50:50. A mobile downdraft gasifier
developed by the Community Power Corporation and stationed at Auburn University Center for
Bioenergy and Bioproducts was used to conduct the experiments. Ash content for the yellow
pine/switchgrass blends was reduced to 1.6% for 75:25 and 2.6% for 50:50, while for pine
chips/bark blends it was down to 0.6% for 75:25 and 0.9% for 50:50 blends. No ash
agglomeration was experienced during gasification of the yellow pine/switchgrass blends. The
hydrogen and carbon monoxide concentrations in syngas obtained from yellow pine/switchgrass
blends were higher compared to switchgrass alone, while those from pine chips/bark blends were
not significantly different from individual runs. The 75:25 and 50:50 blends of yellow pine and
switchgrass showed a total tar concentration of 1.97 g/m3 and 1.86 g/m3, respectively, while the
concentrations for the 75:25 and 50:50 blends of pine chips and bark were 1.66 g/m3 and 1.57
g/m3, respectively. The hydrogen sulfide concentration was found to be above 65 ppmv for both
the yellow pine/switchgrass and pine chips/bark blends.
Keywords: ash content, biomass blends, yellow pine, switchgrass, pine chips, pine bark

63
4.2 Introduction
Biomass has certain advantages over fossil fuels in terms of renewability and abundance.
Agricultural biomass resources have proven to be viable feedstocks in thermal conversion
facilities for heat and electrical power production [1]. However, there are challenges in the usage
of biomass residues due to high ash content of certain biomass. In case of direct combustion, the
inorganic constituents (K, Cl, S and Ca) of biomass can cause fouling on reactors, furnaces, heat
exchangers, turbines and other downstream equipment [2]. The inorganic components of
biomass cause problems such as slagging, bed agglomeration and corrosion [3]. Deposit
formation on heat transfer surfaces is one of the biggest problems for solid fuel fired boilers,
especially in biomass combustion [4].
Ash agglomeration is a major issue in gasification when using a biomass feedstock with
particularly high ash content. Among the previously selected feedstocks, switchgrass pellets and
pine bark were found to have higher ash content as compared to oak, pine pellets and pine chips.
Sharma et al. [5] reported high ash content of 4.62% (d.b.) for chopped switchgrass as feedstock
for fluidized bed gasification. Liu and Bi [2] found the ash content of switchgrass to vary from
4.31% for 0.95 mm to 10.53% for 0.15 mm particle size. They reported that the finer fractions of
ground switchgrass contained substantially higher ash content than the coarser fractions.
Similarly, the ash content for pine bark varied from 2.38% to 4.93% for the same particle size
distribution. Another major advantage of using blended biomass for gasification is that different
biomass available within a certain geographic area can be used and dependency on a particular
feedstock can be reduced.
The results from blending of switchgrass with yellow pine pellets, and pine bark with pine chips
for use in gasification are reported in this chapter. Composition, heating value and contaminants’

64
concentration of syngas from the different blends are compared with results from individual
feedstock gasification reported in the previous chapter. Similarly, carbon closure, hot and cold
gas efficiency and exergy analysis are also included.
4.3 Experimental Setup
The experimental setup was the same as reported in the previous chapter except for the fact that
blended biomass was used for gasification. The total amount of biomass used for each
experiment was 200 lb. Pellets of yellow pine and switchgrass were blended using a concrete
mixer in the mass ratio of 75:25 and 50:50. Pine chips and bark were blended in the same
manner. The pellets were fed into the gasifier using an external hopper while the mixture of pine
chips and bark was fed using the on-board hopper.
Figure 4.1 Concrete mixer for blending biomass
4.4 Data Collection
Characterization of biomass was performed in the same way described in the previous chapter
for different biomass feedstocks. Three replicates of each blend’s gasification were performed.
One-way ANOVA (α = 0.05) was carried out to check for significant differences in

65
concentrations of syngas constituent gases and higher heating value among the blends and their
respective pure feedstocks.
4.5 Results and Discussion
4.5.1 Analyses of Feedstock
Table 4.1 shows a summary of the proximate analysis of different blends of biomass.
Switchgrass pellets which had high ash content (4.66% d.b.) were blended with yellow pine
pellets (0.53% d.b. ash) in two different ratios of 75:25 and 50:50, respectively. The ash content
of the blends was found to be significantly lower than pure switchgrass. Also, pine bark (1.59%
d.b. ash) was blended with pine chips (0.25% d.b. ash) and similar results were obtained. During
gasification, the moisture content of the yellow pine and switchgrass pellets’ blends was similar
to that of their individual run.
Table 4.1 Proximate analysis of biomass blends (d.b.%)
Biomass blend* Ash content Volatile matter Moisture Fixed carbon
YP 0.53 ± 0.21 (a) 84.94 ± 3.16 (a) 11.26 ± 0.10 (a) 14.53 ± 3.03
YP/SG 75:25 1.56 ± 0.15 (b) 81.89 ± 2.45 (ab) 8.49 ± 1.14 (a) 16.55 ± 2.37
YP/SG 50:50 2.59 ± 0.09 (c) 78.85 ± 1.74 (b) 9.42 ± 1.20 (a) 18.56 ± 1.7
SG 4.66 ± 0.06 (d) 72.76 ± 0.34 (c) 9.93 ± 2.03 (a) 22.58 ± 0.4
PC 0.25 ± 0.11 (c) 81.19 ± 0.26 (a) 10.49 ± 2.61 (b) 18.56 ± 0.38
PC/PB 75:25 0.59 ± 0.12 (bc) 78.91 ± 0.67 (ab) 12.36 ± 1.18 (ab) 20.50 ± 0.62
PC/PB 50:50 0.92 ± 0.13 (b) 76.63 ± 1.20 (b) 15.65 ± 2.95 (ab) 22.44 ± 1.24
PB 1.59 ± 0.16 (a) 72.02 ± 2.27 (c) 16.62 ± 3.38 (a) 26.34 ± 2.25
Note: The values after the ± sign denote the standard deviation and those with the same alphabet
(a-d) are not significantly different (α = 0.05).
*Abbreviations used for the biomass: YP – yellow pine, SG – switchgrass, PC – pine chips and
PB – pine bark
The results from ultimate analysis of the blends are shown in Table 4.2. Yellow pine/switchgrass
blends had significantly higher carbon and hydrogen content than switchgrass. Pine chips/bark

66
blends were found to have significantly higher carbon content than pine bark while the hydrogen
content was similar.
Table 4.2 Ultimate analysis of biomass blends (ash free d.b.%)
Biomass
blends C H N S O
YP 51.13 ± 0.03 (a) 7.15 ± 0.02 (a) 0.04 ± 0.02 (a) 0.32 ± 0.01 (a) 41.36 ± 0.06 (a)
YP/SG 75:25 50.10 ± 0.02 (b) 7.04 ± 0.02 (b) 0.22 ± 0.01 (b) 0.33 ± 0.02 (a) 42.31 ± 0.04 (b)
YP/SG 50:50 49.08 ± 0.01 (c) 6.93 ± 0.02 (c) 0.39 ± 0.02 (c) 0.34 ± 0.01 (a) 43.26 ± 0.05 (c)
SG 47.03 ± 0.02 (d) 6.70 ± 0.02 (d) 0.74 ± 0.03 (d) 0.36 ± 0.01 (b) 45.16 ± 0.02 (d)
PC 50.85 ± 0.12 (a) 7.15 ± 0.12 (a) 0.04 ± 0.01 (a) 0.33 ± 0.00 (a) 41.63 ± 0.01 (a)
PC/PB 75:25 51.94 ± 0.031 (b) 7.13 ± 0.16 (a) 0.09±0.01 (ab) 0.33 ± 0.01 (a) 40.51 ± 0.18 (ab)
PC/PB 50:50 53.03 ± 0.17 (c) 7.11 ± 0.20 (a) 0.13±0.02 (b) 0.32 ± 0.01 (a) 39.40 ± 0.36 (b)
PB 55.21 ± 0.46 (d) 7.07 ± 0.29 (a) 0.23 ± 0.02 (c) 0.32 ± 0.01 (a) 37.18 ± 0.73 (c)
Note: The values after the ± sign denote the standard deviation and those with the same alphabet
(a-d) are not significantly different (α = 0.05).
*Abbreviations used for the biomass: YP – yellow pine, SG – switchgrass, PC – pine chips and
PB – pine bark
Table 4.3 shows the physical properties and higher heating value of the biomass blends. The
blends for yellow pine and switchgrass pellets had significantly lower HHV than yellow pine but
significantly higher HHV than switchgrass. Pine chips/bark blends showed significantly lower
HHV compared to pine bark alone.
Table 4.3 Higher heating values (d.b.) and densities of feedstock
Biomass blends HHV (MJ/kg) Bulk density
(kg/m3)
Particle density
(kg/m3)
YP 20.17 ± 0.02 (a) 611.15 ± 3.87 1434.47 ± 0.89
YP/SG 75:25 19.86 ± 0.06 (b) 617.23 ± 3.78 1444.90 ± 1.46
YP/SG 50:50 19.56 ± 0.10 (c) 623.31 ± 3.69 1455.33 ± 2.04
SG 18.96 ± 0.03 (d) 635.46 ± 3.52 1476.20 ± 3.2
PC 19.56 ± 0.19 (c) 225.33 ± 4.54 1350.12 ± 1.87
PC/PB 75:25 20.04 ± 0.14 (bc) 207.29 ± 4.28 1289.13 ± 2.85
PC/PB 50:50 20.52 ± 0.08 (b) 189.25± 4.03 1228.12 ±4.85
PB 21.48 ± 0.06 (a) 153.17 ± 3.52 1079.47 ± 0.06
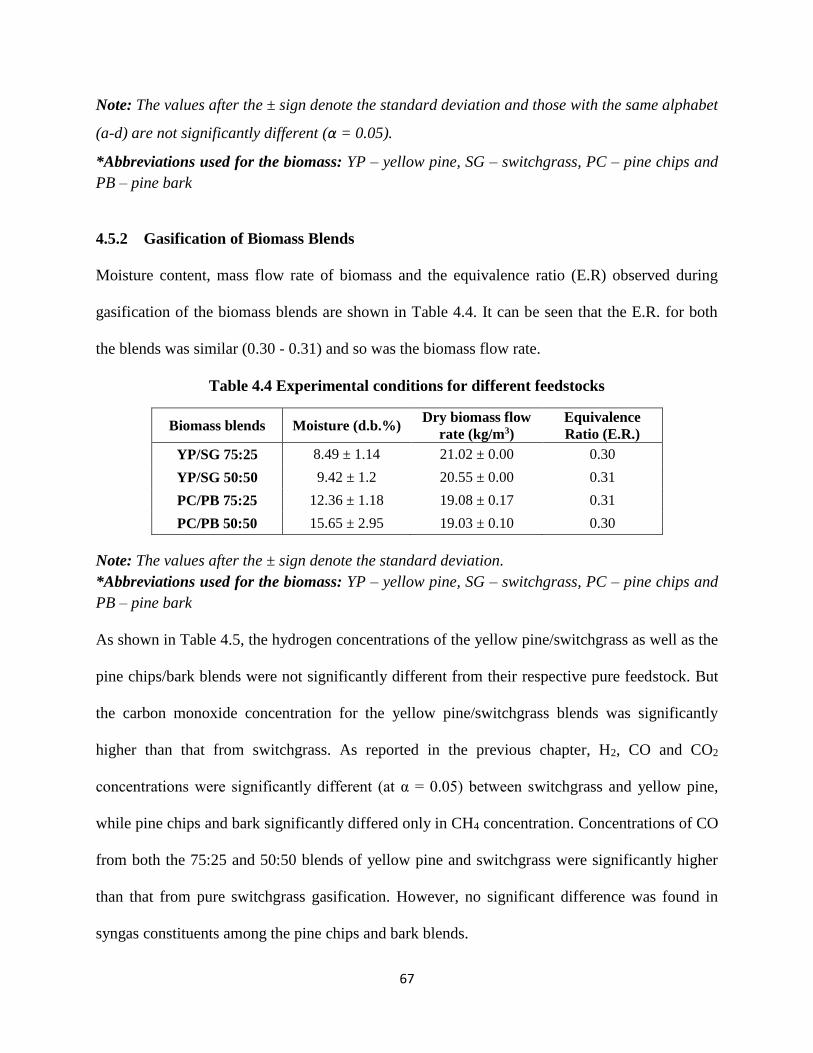
67
Note: The values after the ± sign denote the standard deviation and those with the same alphabet
(a-d) are not significantly different (α = 0.05).
*Abbreviations used for the biomass: YP – yellow pine, SG – switchgrass, PC – pine chips and
PB – pine bark
4.5.2 Gasification of Biomass Blends
Moisture content, mass flow rate of biomass and the equivalence ratio (E.R) observed during
gasification of the biomass blends are shown in Table 4.4. It can be seen that the E.R. for both
the blends was similar (0.30 - 0.31) and so was the biomass flow rate.
Table 4.4 Experimental conditions for different feedstocks
Biomass blends Moisture (d.b.%) Dry biomass flow
rate (kg/m3)
Equivalence
Ratio (E.R.)
YP/SG 75:25 8.49 ± 1.14 21.02 ± 0.00 0.30
YP/SG 50:50 9.42 ± 1.2 20.55 ± 0.00 0.31
PC/PB 75:25 12.36 ± 1.18 19.08 ± 0.17 0.31
PC/PB 50:50 15.65 ± 2.95 19.03 ± 0.10 0.30
Note: The values after the ± sign denote the standard deviation.
*Abbreviations used for the biomass: YP – yellow pine, SG – switchgrass, PC – pine chips and
PB – pine bark
As shown in Table 4.5, the hydrogen concentrations of the yellow pine/switchgrass as well as the
pine chips/bark blends were not significantly different from their respective pure feedstock. But
the carbon monoxide concentration for the yellow pine/switchgrass blends was significantly
higher than that from switchgrass. As reported in the previous chapter, H2, CO and CO2
concentrations were significantly different (at α = 0.05) between switchgrass and yellow pine,
while pine chips and bark significantly differed only in CH4 concentration. Concentrations of CO
from both the 75:25 and 50:50 blends of yellow pine and switchgrass were significantly higher
than that from pure switchgrass gasification. However, no significant difference was found in
syngas constituents among the pine chips and bark blends.

68
Table 4.5 Composition of syngas from different biomass blends
Biomass type
Syngas composition from different biomass
Volume (%)
H2 CO CO2 CH4
YP 17.35 ± 1.67 (a) 25.05 ± 1.67 (a) 9.59 ± 2.24 (a) 1.56 ± 0.58 (a)
YP/SG 75:25 15.27 ± 0.25 (ab) 25.24 ± 1.21 (a) 11.02 ± 0.35 (ab) 1.65 ± 0.20 (a)
YP/SG 50:50 16.14 ± 0.64 (ab) 21.97 ± 1.28 (a) 11.19 ± 0.07 (ab) 1.54 ± 0.13 (a)
SG 14.97 ± 0.74 (b) 18.50 ± 0.52 (b) 12.00 ± 1.23 (b) 1.43 ± 0.61 (a)
PC 15.74 ± 0.62 (c) 20.10 ± 1.65 (c) 11.05 ± 1.71 (c) 1.57 ± 0.51 (c)
PC/PB 75:25 17.02 ± 0.07 (c) 19.91 ± 0.63 (c) 11.22 ± 0.59 (c) 1.48 ± 0.13 (c)
PC/PB 50:50 16.07 ± 0.76 (c) 21.28 ± 0.90 (c) 10.69 ± 0.56 (c) 1.26 ± 0.12 (cd)
PB 15.19 ± 0.51 (c) 22.95 ± 1.77 (c) 10.85 ± 1.23 (c) 0.94 ± 0.26 (d)
Note: The values after the ± sign denote the standard deviation and those with the same alphabet
(a-d) are not significantly different (α = 0.05).
*Abbreviations used for the biomass: YP – yellow pine, SG – switchgrass, PC – pine chips and
PB – pine bark
Figure 4.2 shows the comparison of the higher heating value of syngas achieved from yellow
pine and switchgrass pellets with their blends. It clearly shows that the 75:25 (YP: SG) blend has
higher HHV than the 50:50 (YP: SG) blend since the HHV of syngas from yellow pine itself is
greater than that from switchgrass. However, the HHVs of syngas from pine chips and bark were
not significantly different with each other and hence their blends were not different either, as
seen in Figure 4.3.

69
Figure 4.2 HHV of syngas from blends of yellow pine and switchgrass
Figure 4.3 HHV of syngas from blends of pine chips and bark
The ash agglomeration that was seen during gasification of switchgrass alone was not an issue
anymore with either of the two blends of switchgrass and yellow pine. As observed in the
proximate analysis, the ash content of the blends was significantly reduced and as a result, the
0
1
2
3
4
5
6
7
YP YP/SG 75:25 YP/SG 50:50 SG
HH
V o
f sy
nga
s (M
J/N
m3 )
0
1
2
3
4
5
6
PC PC/PB 75:25 PC/PB 50:50 PB
HH
V o
f sy
nga
s (M
J/N
m3 )

70
gasification run was smooth and uninterrupted. Also, unlike the gasification runs of pine pellets,
there was no clogging of filter bags during the blended material runs.
4.5.3 Carbon, Energy and Exergy Analyses
High carbon closure values of above 0.95 were achieved for both the yellow pine and
switchgrass pellets’ blends as seen in Table 4.6. Although carbon closure is ideally supposed to
be unity, it was found to be greater than one for the 75:25 yellow pine and switchgrass blend.
This might be due to some technical errors and also the fact that there was some residual biomass
inside the reactor which could not be accounted for due to operational difficulties. The hot and
cold gas efficiency for the blends was also quite high, ranging from 0.92-0.95 and 0.76-0.79
respectively. Exergy ratio for the blends was found to be ~0.62-0.67.
Table 4.6 Carbon, energy and exergy analyses
Biomass blends Carbon
closure
Hot gas
efficiency
Cold gas
efficiency
Exergy
ratio
YP/SG 75:25 1.02 ± 0.10 0.94 ± 0.01 0.79 ± 0.01 0.66 ± 0.01
YP/SG 50:50 0.99 ± 0.03 0.92 ± 0.01 0.76 ± 0.02 0.62 ± 0.01
PC/PB 75:25 0.95 ± 0.10 0.94 ± 0.02 0.77 ± 0.02 0.63 ± 0.01
PC/PB 50:50 0.96 ± 0.10 0.93 ± 0.01 0.76 ± 0.02 0.65 ± 0.01
Note: The values after the ± sign denote the standard deviation.
*Abbreviations used for the biomass: YP – yellow pine, SG – switchgrass, PC – pine chips and
PB – pine bark
4.5.4 Tar Concentration
Tar content of syngas was analyzed by the GC-FID and the results for yellow pine/switchgrass
and pine chips/bark blends are shown in Figures 4.5 and 4.6, respectively. There was a
substantial presence of BTX compounds, mainly benzene and toluene in all the blends. Some
tertiary condensed tar products were also observed due to thermal cracking inside the gasifier.
The 75:25 and 50:50 blends of yellow pine and switchgrass showed a total concentration of 1.97

71
g/m3 and 1.86 g/m3, respectively. As expected, these values were lower compared to yellow pine
alone (2.27 g/m3) but higher than switchgrass (1.5 g/m3), which are reported in the previous
chapter. However, blends of pine chips and bark showed higher concentrations (1.66 g/m3 in
75:25 and 1.57 g/m3 in 50:50) as compared to pine chips (1.36 g/m3) and pine bark (0.91 g/m3).
Figure 4.4 Tar concentration in syngas from yellow pine/switchgrass blends
0
0.2
0.4
0.6
0.8
1
1.2
1.4
1.6
Benzene Toluene Ethylbenzene
O-xylene Styrene Indene Phenol 3 methylphenol
Napthalene 2 methylnapthalene
Biphenyl
Tar
con
cen
trat
ion
(g/
m3 )
YP YP-SG 75:25 YP-SG 50:50 SG
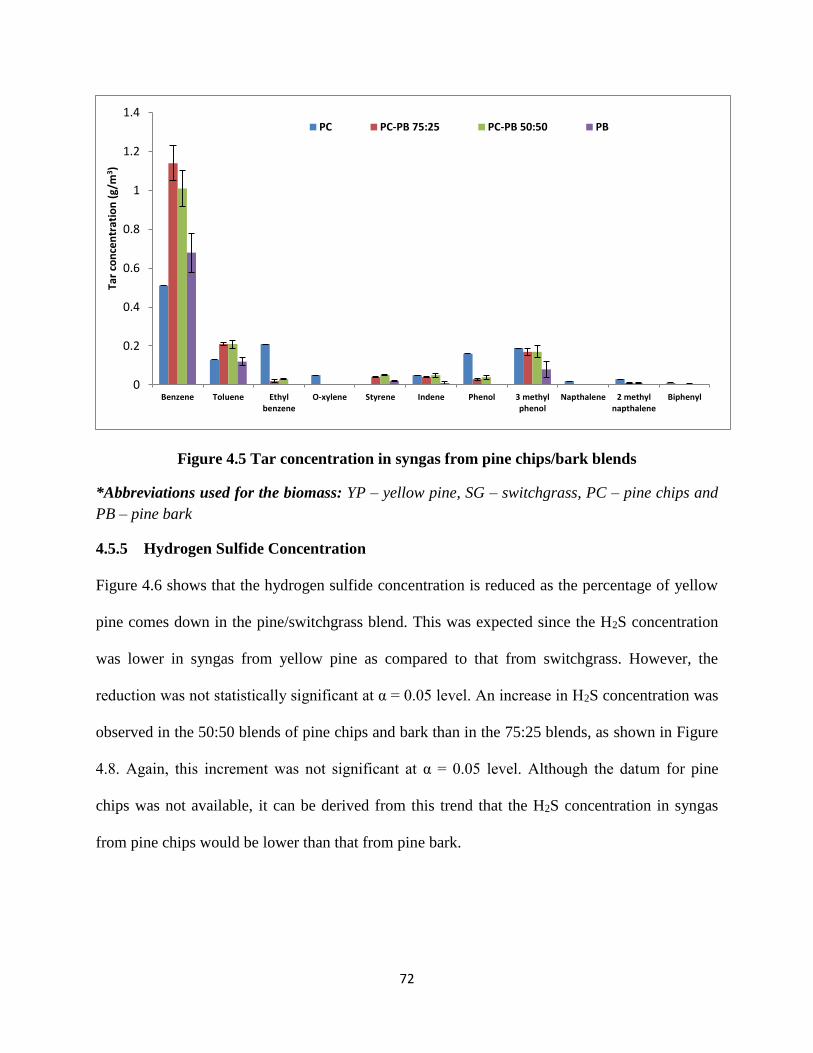
72
Figure 4.5 Tar concentration in syngas from pine chips/bark blends
*Abbreviations used for the biomass: YP – yellow pine, SG – switchgrass, PC – pine chips and
PB – pine bark
4.5.5 Hydrogen Sulfide Concentration
Figure 4.6 shows that the hydrogen sulfide concentration is reduced as the percentage of yellow
pine comes down in the pine/switchgrass blend. This was expected since the H2S concentration
was lower in syngas from yellow pine as compared to that from switchgrass. However, the
reduction was not statistically significant at α = 0.05 level. An increase in H2S concentration was
observed in the 50:50 blends of pine chips and bark than in the 75:25 blends, as shown in Figure
4.8. Again, this increment was not significant at α = 0.05 level. Although the datum for pine
chips was not available, it can be derived from this trend that the H2S concentration in syngas
from pine chips would be lower than that from pine bark.
0
0.2
0.4
0.6
0.8
1
1.2
1.4
Benzene Toluene Ethylbenzene
O-xylene Styrene Indene Phenol 3 methylphenol
Napthalene 2 methylnapthalene
Biphenyl
Tar
con
cen
trat
ion
(g/
m3 )
PC PC-PB 75:25 PC-PB 50:50 PB

73
Figure 4.6 H2S concentration in syngas from yellow pine and switchgrass blends
Figure 4.7 H2S concentration in syngas from pine chips and bark blends
0
10
20
30
40
50
60
70
80
YP YP-SG 75/25 YP-SG 50/50 SG
Sulf
ur
con
cen
trat
ion
(p
pm
)
0
10
20
30
40
50
60
70
80
PC-PB75/25 PC-PB 50/50 Pine Bark
Sulf
ur
con
cen
trat
ion
(p
pm
)

74
4.6 Conclusions and Remarks
Yellow pine and switchgrass pellets, and pine chips and bark were blended in the ratio 75:25 and
50:50 to study the effects of blending biomass for gasification, especially to cope with problems
related to ash agglomeration. Syngas produced from the experiments was analyzed in terms of
composition and contaminants. Analyses for carbon closure, hot and cold gas efficiency, and
exergy were performed. The following conclusions were drawn from this study:
Both the blends for pellets showed higher hydrogen and carbon monoxide concentration
compared to switchgrass alone but lower compared to yellow pine alone.
Both the blends for chips and bark showed higher hydrogen concentration compared to
both the individual runs of pine chips and bark.
The HHVs of syngas from the blends of pine chips and bark were not significantly
different from each other as well as from the individual runs of pine chips and bark.
Both the blends of pine chips and bark showed higher tar concentration than their
individual runs.
The ash agglomeration seen in the gasifier grate during switchgrass gasification was not
experienced during any of the blended runs of yellow pine and switchgrass.
4.7 References
[1] A. L. Maglinao and S. C. Capareda, "Predicting fouling and slagging behavior of dairy
manure (DM) and cotton gin trash (CGT) during thermal conversion," Transactions of the
ASABE, vol. 53, no. 3, pp. 903-909, 2010.
[2] X. Liu and X. T. Bi, "Removal of inorganic constituents from pine barks and switchgrass,"
Fuel Processing Technology, vol. 92, pp. 1273-1279, 2011.
[3] R. W. Bryers, "Fireside slagging, fouling, and high-temperature corrosion of heat transfer
surface due to impurities in steam-raising fuels," Progress in Energy and Combustion Sci.,
75
vol. 22, no. 1, pp. 29-120, 1996.
[4] A. Tortosia-Masia, F. Ahnert, H. Spliethoff, J. Loux and K. Hein, "Slagging and fouling in
biomass co-combustion," Thermal Sci., vol. 9, no. 3, pp. 85-98, 2005.
[5] A. M. Sharma, K. N. Patil, R. L. Huhnke and A. Kumar, "Performance evaluation of a lab
scale fluidized bed gasifier using switchgrass as feedstock," Transactions of the ASABE, pp.
2259-2266, 2011.
[6] D. Nutalapati, R. Gupta, B. Moghtaderi and T. F. Wall, "Assessing slagging and fouling
during biomass combustion: A thermodynamic approach allowing for alkali/ash reactions,"
Fuel Proc. Tech, vol. 88, no. 11, pp. 1044-1052, 2007.

76
CHAPTER FIVE
COMPREHENSIVE SIMULATOR APPLIED TO DOWNDRAFT GASIFICATION
5.1 Abstract
Comprehensive Simulator of Fluidized and Moving Bed Equipment (CeSFaMB), a simulation
program, has been used to predict the effect of operational conditions on syngas composition and
validate experimental tests conducted in a mobile downdraft gasifier using a number of biomass
feedstock. Accuracy in determining the composition of major constituents of syngas viz.
hydrogen (H2), carbon monoxide (CO), carbon dioxide (CO2) and methane (CH4) serves as the
yardstick for usefulness of the model. Experiments were carried out at atmospheric pressure and
air was used as the gasifying agent. The model was calibrated according to the nature of feeding
fuel before its application, using results from gasification of loblolly pine pellets. After
calibration, deviations between the experimental and simulation results for the composition of
hydrogen, carbon monoxide and carbon dioxide were within 5-10% but greater than that for
methane in all the cases. Effects of equivalence ratio (E.R.), moisture content and flow rate of
biomass were also studied by means of a parametric analysis in the model. The concentration of
H2, CO and CH4 decreased while CO2 increased with increasing E.R.; H2 and CO2 increased
while CO and CH4 decreased with increasing moisture content; and H2, CO and CH4 increased
while CO2 decreased with increasing biomass flow rate as well as increasing carbon and
hydrogen content in biomass.
Keywords: simulation, CeSFaMB, equivalence ratio, parametric analysis
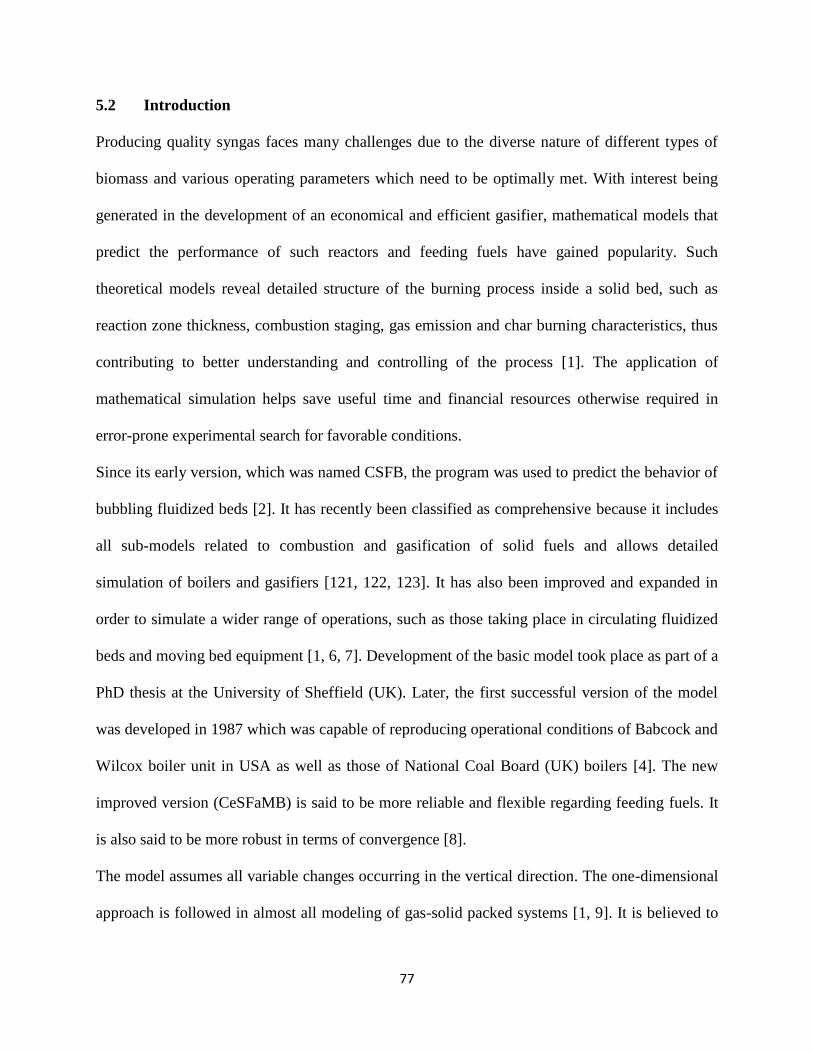
77
5.2 Introduction
Producing quality syngas faces many challenges due to the diverse nature of different types of
biomass and various operating parameters which need to be optimally met. With interest being
generated in the development of an economical and efficient gasifier, mathematical models that
predict the performance of such reactors and feeding fuels have gained popularity. Such
theoretical models reveal detailed structure of the burning process inside a solid bed, such as
reaction zone thickness, combustion staging, gas emission and char burning characteristics, thus
contributing to better understanding and controlling of the process [1]. The application of
mathematical simulation helps save useful time and financial resources otherwise required in
error-prone experimental search for favorable conditions.
Since its early version, which was named CSFB, the program was used to predict the behavior of
bubbling fluidized beds [2]. It has recently been classified as comprehensive because it includes
all sub-models related to combustion and gasification of solid fuels and allows detailed
simulation of boilers and gasifiers [121, 122, 123]. It has also been improved and expanded in
order to simulate a wider range of operations, such as those taking place in circulating fluidized
beds and moving bed equipment [1, 6, 7]. Development of the basic model took place as part of a
PhD thesis at the University of Sheffield (UK). Later, the first successful version of the model
was developed in 1987 which was capable of reproducing operational conditions of Babcock and
Wilcox boiler unit in USA as well as those of National Coal Board (UK) boilers [4]. The new
improved version (CeSFaMB) is said to be more reliable and flexible regarding feeding fuels. It
is also said to be more robust in terms of convergence [8].
The model assumes all variable changes occurring in the vertical direction. The one-dimensional
approach is followed in almost all modeling of gas-solid packed systems [1, 9]. It is believed to
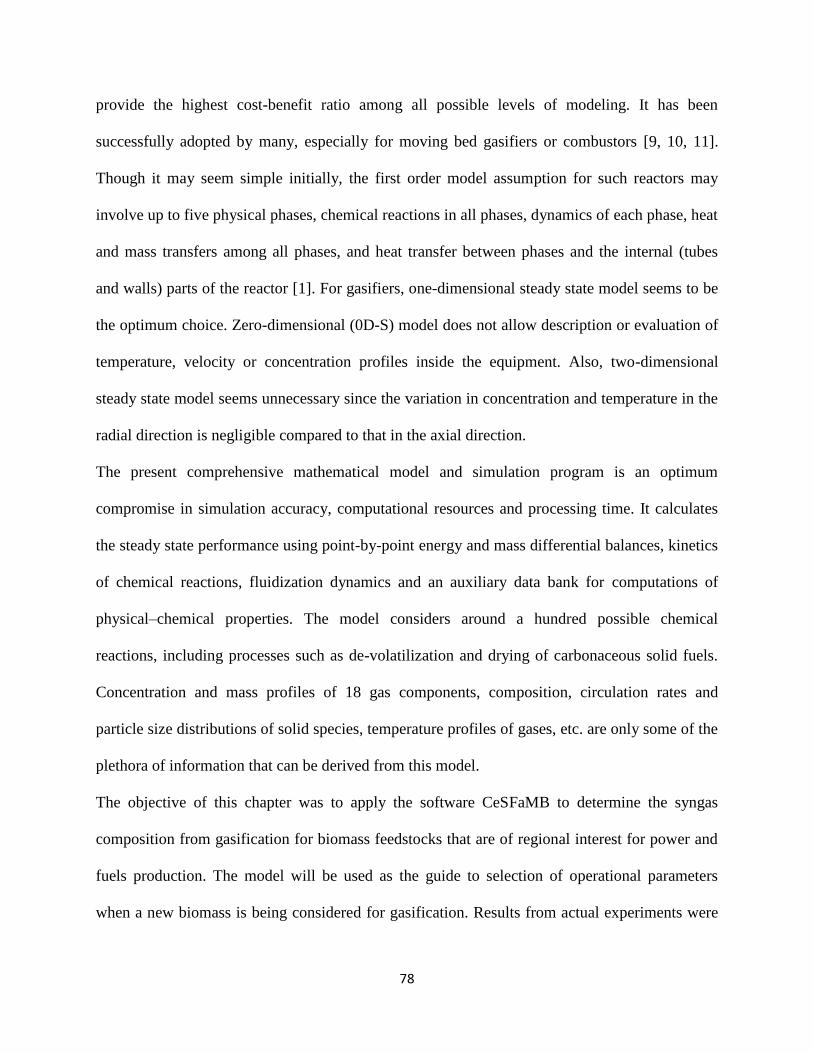
78
provide the highest cost-benefit ratio among all possible levels of modeling. It has been
successfully adopted by many, especially for moving bed gasifiers or combustors [9, 10, 11].
Though it may seem simple initially, the first order model assumption for such reactors may
involve up to five physical phases, chemical reactions in all phases, dynamics of each phase, heat
and mass transfers among all phases, and heat transfer between phases and the internal (tubes
and walls) parts of the reactor [1]. For gasifiers, one-dimensional steady state model seems to be
the optimum choice. Zero-dimensional (0D-S) model does not allow description or evaluation of
temperature, velocity or concentration profiles inside the equipment. Also, two-dimensional
steady state model seems unnecessary since the variation in concentration and temperature in the
radial direction is negligible compared to that in the axial direction.
The present comprehensive mathematical model and simulation program is an optimum
compromise in simulation accuracy, computational resources and processing time. It calculates
the steady state performance using point-by-point energy and mass differential balances, kinetics
of chemical reactions, fluidization dynamics and an auxiliary data bank for computations of
physical–chemical properties. The model considers around a hundred possible chemical
reactions, including processes such as de-volatilization and drying of carbonaceous solid fuels.
Concentration and mass profiles of 18 gas components, composition, circulation rates and
particle size distributions of solid species, temperature profiles of gases, etc. are only some of the
plethora of information that can be derived from this model.
The objective of this chapter was to apply the software CeSFaMB to determine the syngas
composition from gasification for biomass feedstocks that are of regional interest for power and
fuels production. The model will be used as the guide to selection of operational parameters
when a new biomass is being considered for gasification. Results from actual experiments were

79
compared with the simulation output to validate the accuracy of the program. Moreover, a
parametric study was conducted to identify the effect of key operating parameters viz.
equivalence ratio, moisture content and mass flow rate of biomass on the output of the program
as well as the gasification process.
5.3 Methodology
5.3.1 Model Assumptions for a Downdraft Gasifier [129, 130]
a.) Steady state operation: For reactors that operate for long periods with almost no
interruptions, a steady state operation can be assumed. However, the assumption does not
include the starting-up and shutting-down periods. For the downdraft gasifier, the rates of
biomass feeding and withdrawal of syngas were relatively constant (with low
fluctuations).
b.) Plug-flow regime of gas and solid particles: Due to absence of rotational velocity and all
variables being uniformly distributed, angular components can be neglected. Only axial
velocity component is present in the solid phase as the radial flow is zero. The overall
combination of gas streams being forced to pass through small corridors or channels
between particles mimic a plug-flow. Assuming the gas velocity to be even throughout
the bed cross-section, the temperature and concentration profiles can also be modeled as
flat profiles. Hence, the rates of gas-solid reactions do not vary much in the radial or
horizontal direction.
c.) Negligible momentum transfer between solid and gas phase: Velocity profile of one
phase is not affected by the flow of the other phase. Since the velocities in moving bed
gasifiers are found to be very small for both solid and gas phase, the momentum transfer
between them can be neglected.

80
d.) Inviscid flow: The layers of gases between solid particles are thin enough to assume that
there is no turbulent flow. Also, there are no shear stresses between layers if plug-flow
regimes are assumed.
e.) Flat temperature and concentration profiles: Given the thin layers of solid particles in
the gasifier, it can be assumed that the heat transfer within each particle is fast enough to
equalize the temperature throughout its volume. Thus, the difference between the
temperatures of gas and solid phase can be neglected. Also, if the total mass flow in the
vertical (main) direction is much higher than the flow exchanged between phases, the flat
temperature and concentration profiles can be assumed.
f.) No heat transfer by radiation: Since the gas layers between particles are small, heat
transfer by radiation inside each phase and between phases can be neglected.
5.3.2 Program Input
The present mathematical model is an approximation of reality. The objective of simulation
results is to reproduce existing real operation variables with small deviations. The degree of
deviation between real operational data and simulation results depends strongly on the accuracy
of entered data as well as that of the model. The better the accuracy, the better are the chances of
applying CeSFaMB to simulate exiting operating unit or help designing future installation. The
program requires reliable and detailed description of reactor geometry as well as information
regarding rates and characteristics of injected gas streams and particulate solids fed into the
gasifier. The most significant input and output parameters are listed in detail in Appendix D.
The information regarding the geometry of the gasifier and operating conditions are given in
Table 5.1. Primary air was delivered from the open top of the gasifier at atmospheric temperature
and pressure. Secondary air was injected through five different ports at 0.4 m, 0.53 m, 0.66 m,

81
0.79 m and 0.92 m along the height of the gasifier. Biomass was fed into the gasifier at a rate of
25-30 kg per hour depending upon the type of feedstock. The gasifier was insulated on the
outside with fiberglass. The properties of the different biomass feedstock are given in Table 5.2.
Table 5.1 Gasifier data
Detail Input values
Class description
Operating mode Gasification
Equipment type Downdraft moving bed
Basic geometry
Shape of bed cross section Circular
Hydraulic internal diameter (m) 0.35
Bed depth (m) 1.2
Position of fuel feeding (m) 1.2
Average operational pressure (kPa) 101.3
Thermal insulation of reactor
Thickness (m) 0.18
Average thermal conductivity (W/mK) [14] 0.04
Average emissivity 0.75
The targeted syngas outflow was 65 m3/hr in the actual experiments. However, due to presence
of certain amount of base air flow in the system, the actual value varied between 52-57 m3/hr.
The actual value was easily obtained from generated lab-view data of the system and thus
applied. The inlet air flow for different experiments is listed in Table 5.2. The feeding rate of
biomass was adjusted according to the type of biomass and whilst maintaining the syngas flow
rate. Pine bark has the lowest flowability among the biomass feedstock used in these
experiments, as shown by its low flow rate in Table 5.2. Sphericity for the biomass was
measured using the RETSCH Camsizer, which was also used to determine the particle size
distribution given in Tables 5.3 and 5.4.

82
Table 5.2 Characteristics of feeding fuel
Details Biomass*
LP HP SP PC YP TP PB
Proximate analysis (w.b. %)
Moisture 7.13 5.28 9.01 9.46 9.09 4.55 14.41
Volatile 84.96 88.00 78.59 84.17 86.95 74.85 78.16
Fixed carbon 7.47 6.32 7.95 6.12 3.44 19.51 5.86
Ash 0.44 0.41 4.45 0.25 0.53 1.09 1.57
Ultimate analysis (d.b. %)
C 50.85 50.02 46.79 51.80 50.98 57.40 53.33
H 7.25 6.97 7.33 7.32 7.15 6.14 6.66
N 0.08 0.11 0.74 0.10 0.09 0.15 0.40
O 41.26 42.38 40.33 40.44 40.86 34.91 37.66
S 0.12 0.12 0.15 0.09 0.40 0.30 0.36
Ash 0.44 0.41 4.66 0.25 0.53 1.10 1.59
Physical properties
HHV (MJ/kg) 20.85 19.73 18.96 19.56 18.55 21.54 18.59
Inlet mass flow rate (kg/s) x 102 0.72 0.76 0.77 0.72 0.76 0.67 0.61
Bulk density (kg/m3) 684.35 667.51 635.46 225.33 611.15 685.00 154.00
Particle density (kg/m3) 1456.00 1462.83 1476 1416.50 1434 1424 1079
Sphericity 0.75 0.69 0.78 0.53 0.68 0.75 0.51
Operational condition
Primary air mass flow (kg/s) x
102 0.85 0.67 0.81 0.77 0.60 0.73 0.65
Intermediate air flow (kg/s) x
102 0.52 0.52 0.52 0.52 0.52 0.52 0.52
*Abbreviations for the biomass used: LP – Loblolly pine pellets, HP – Hardwood pellets, SP –
Switchgrass pellets, PC – Pine chips, YP – Yellow pine pellets, TP – Torrefied pine pellets and
PB – Pine bark. (Note: The properties of biomass are shown as used in the model. Their
respective standard deviations are informed in the previous chapter.)

83
Table 5.3 Particle size distributions of loblolly, hardwood and switchgrass pellets
Biomass Particle size distribution
Sieve opening
(mm)
Retained mass
(%)
Loblolly pine pellets 6.36 94.50
5.05 3.70
4.01 1.40
3.18 0.40
Hardwood pellets 8.01 98.50
6.36 1.20
5.05 0.20
0.25 0.10
Switchgrass pellets 10.09 0.70
8.01 88.60
6.36 9.40
5.05 1.10
4.01 0.20

84
Table 5.4 Particle size distributions of yellow and torrefied pine pellets, and pine chips and
bark
Biomass Particle size distribution Biomass Particle size distribution
Sieve opening
(mm)
Retained mass
(%) Sieve opening
(mm)
Retained mass
(%)
Pine chips 1000.00 17.70 Torrefied pine
pellets 10.50 2.20
16.00 12.80
10.00 0.10
12.70 16.50
8.50 0.90
10.09 27.10
8.25 13.90
8.01 11.20
8.00 39.70
6.36 10.70
7.75 27.60
5.05 2.20
7.50 8.20
4.01 1.30
7.25 1.80
3.18 0.40
7.00 2.50
2.01 0.10
6.50 1.10
Yellow pine
pellets 10.50 0.30
6.25 0.40
10.00 0.20
6.00 0.30
9.75 0.50
5.75 0.50
9.50 0.50
5.50 0.30
9.25 4.40
5.25 0.20
9.00 23.10
5.00 0.30
8.50 13.30 Pine bark 22.50 3.90
8.25 12.60
20.00 3.00
8.00 6.80
17.00 14.70
7.75 3.20
15.00 8.90
7.50 3.20
13.00 16.50
7.25 3.40
11.20 15.60
7.00 7.20
9.50 12.00
6.50 2.80
8.00 9.50
6.25 2.10
6.70 2.70
6.00 2.40
6.30 4.10
5.75 2.40
5.60 2.90
5.50 2.70
4.75 2.80
5.25 2.30
4.00 1.40
5.00 3.00
3.35 1.00
4.50 1.30
2.80 0.40
4.25 0.80
2.36 0.20
4.00 0.60
2.00 0.10
3.75 0.30
1.70 0.10
3.50 0.40
1.00 0.10
3.00 0.20
0.21 0.10

85
5.4 Results and Discussion
Initially, the program was not able to reproduce the results from gasification of pine pellets in the
mobile downdraft gasifier, mainly due to the difference in reactivity of feeding fuel as well as
limitations of the simulator. It can also be due to the fact that many fuels contain components
that even at very low concentrations tend to act as catalysts or poisons to various reactions [12].
Different kinetic parameters can be found in literature even for a single reaction. If specific
kinetics of key reactions is not available for a given fuel, the alternative is to calibrate the
simulator based on data from one experimental test [13]. Similar approach was adopted by de
Souza-Santos [13] while simulating results for experiments carried out using coal in a bubbling
fluidized bed gasifier at the National University of Colombia (UNC). The usefulness of the
simulator would be assured if it is capable of reproducing other tests consuming fuels with
similar composition.
The effect of reactivity on the model can be seen illustrated in Table 5.4. Gasification of loblolly
pine pellets was carried out using the CPC mobile downdraft gasifier. The simulation results
related to the composition of produced syngas are shown in Table 5.5. Large deviations in
concentrations of syngas components, especially carbon monoxide and hydrogen can be seen
between the simulation and experimental outputs. It shows that the reactivity of loblolly pine was
considerably different from bituminous coals that were used as standards by the program [2, 14].
Using the syngas data obtained from the runs, the values of kinetic coefficients were set
accordingly to simulate the experimental results more accurately.

86
Table 5.5 Syngas composition (molar d.b. %) produced from loblolly pine pellets obtained
during gasification and respective simulation results obtained without calibration
Syngas Composition (molar %)
Gases Experimental Simulation
H2 14.3 5.9
CO 18.4 10.9
CO2 10.5 17.6
CH4 1.9 11.5
N2 54.8 53.8
H2S n.d. 280 ppm
NH3 n.d. 340 ppm
NO n.d. 260 ppm
SO2 n.d. 70 ppm
HCN n.d. 210 ppm
C2H4 n.d. 480 ppm
C3H6 n.d. 20 ppm
n.d.: not determined
5.4.1 Calibration of Reaction Kinetics
The reactivity of different chemical reactions occurring in the gasifier varies according to
carbonaceous fuel used. In some cases, the difference in reactivity of fuels is so significant that it
is almost impossible to set a completely general bank of kinetic coefficients [4]. There is an
extensive data bank of kinetic coefficients which is automatically applied once the type of fuel is
entered as input. In addition, the model allows the user to enter specifically laboratory-
determined kinetic coefficients to calibrate the simulation for special cases where the fuel or
absorbent might present different kinetics.
The reactions that were found to have a significant impact on our gasification process and the
program are shown in Table 5.6.

87
Table 5.6 Kinetic parameters of reactions
Reaction
number
Reaction Kinetic coefficient
(k) from reference
Value of k used
in the model
Unit of k
R. 41 𝐶𝑂 + 𝐻2𝑂 ↔ 𝐶𝑂2 + 𝐻2 2.778 x 10³ 2.778 x 10⁵ kmol-1 m3 s-1
R. 42 2𝐶𝑂 + 𝑂2 ↔ 2𝐶𝑂2 1.3 x 10¹¹ 1.3 x 10⁹ kmol-0.75 m2.25 s-1
R. 50 𝑇𝑎𝑟 → 𝐺𝑎𝑠𝑒𝑠 4.0 x 10⁴ 4.0 x 10⁵ s-1
R. 71 𝐶𝐻4 + 𝐻2𝑂 ↔ 𝐶𝑂 + 3𝐻2 3.0 x 10⁻⁹ 8.0 x 10⁻⁷ kmol-1 m3 s-1
Using the simulation trial setting from Table 5.6, noticeable decreases in deviations between
simulation and experimental results were achieved, as presented in Table 5.7. The program
predicts the concentration of H2, CO and CO2 to a satisfactory level of accuracy, indicated by the
fact that the simulated values fall in the range of the standard deviations seen in the experiments.
However, the simulation shows the CH4 concentration to be 5.26% while that achieved from
experiment was only 1.94%.
Table 5.7 Syngas composition (molar d.b.%) produced from loblolly pine pellets obtained
during gasification and respective simulation results obtained after calibration
Syngas Composition (%)
Gases Experimental Simulation
H2 14.3 (2.8) 14.9
CO 18.4 (3.2) 20.1
CO2 10.5 (2.3) 10.5
CH4 1.9 (0.9) 5.3
N2 54.8 49.1
H2S n.d. 140 ppm
NH3 n.d. 80 ppm
NO n.d. 550 ppm
SO2 n.d. 170 ppm
HCN n.d. 100 ppm
C2H4 n.d. 370 ppm
C3H6 n.d. 10 ppm

88
Figure 5.1 shows a steady level of CO in the upper half of the reactor and then a slight decrease
in the lower half. Logarithmic representation of the concentration in Figure 5.2 shows small
surges of oxygen at the intermediate air injection positions of the reactor. The concentration of
CO2 remains more or less constant throughout the reactor. This trend can also be substantiated by
Figure 5.4 where the rate of shift-reaction (R. 41) seems to slightly increase in the middle of the
reactor. The concentration of H2 increases up to one third of the reactor height and stabilizes for
the most part, as seen in Figure 5.3. In the same figure, the concentration of CH4 is dropping
throughout the reactor. Steam reforming reaction (R.71) is shown to be prevalent in Figure 5.5. It
shows a steady decline in methane throughout the reactor, thus leading to formation of more
carbon monoxide and hydrogen.
Figure 5.1 Molar fraction profiles of CO, CO2 and O2 throughout the reactor

89
Figure 5.2 Molar fraction profiles of CO, CO2 and O2 (Y-logarithmic)
Figure 5.3 Molar fraction profiles of H2O, H2 and CH4 throughout the reactor

90
Figure 5.4 Reaction rates of homogeneous reactions throughout the reactor
Figure 5.5 Reaction rates of reactions throughout the reactor
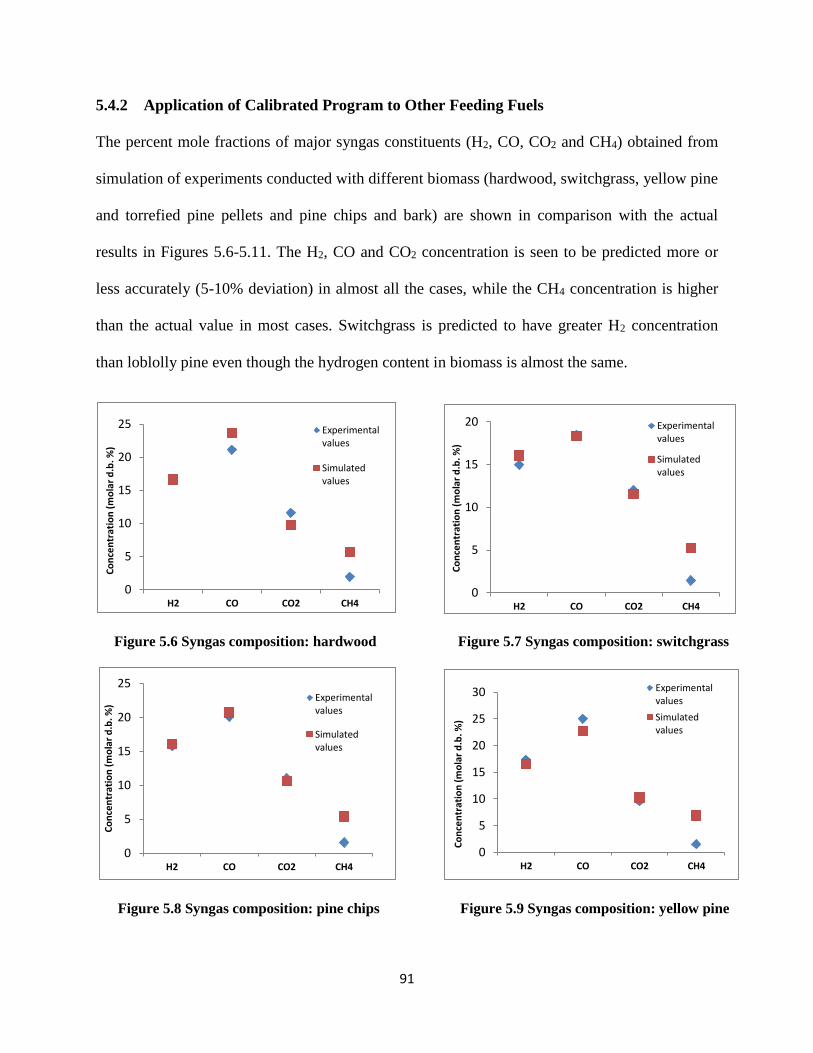
91
5.4.2 Application of Calibrated Program to Other Feeding Fuels
The percent mole fractions of major syngas constituents (H2, CO, CO2 and CH4) obtained from
simulation of experiments conducted with different biomass (hardwood, switchgrass, yellow pine
and torrefied pine pellets and pine chips and bark) are shown in comparison with the actual
results in Figures 5.6-5.11. The H2, CO and CO2 concentration is seen to be predicted more or
less accurately (5-10% deviation) in almost all the cases, while the CH4 concentration is higher
than the actual value in most cases. Switchgrass is predicted to have greater H2 concentration
than loblolly pine even though the hydrogen content in biomass is almost the same.
Figure 5.6 Syngas composition: hardwood Figure 5.7 Syngas composition: switchgrass
Figure 5.8 Syngas composition: pine chips Figure 5.9 Syngas composition: yellow pine
0
5
10
15
20
25
H2 CO CO2 CH4
Co
nce
ntr
atio
n (
mo
lar
d.b
. %)
Experimentalvalues
Simulatedvalues
0
5
10
15
20
H2 CO CO2 CH4
Co
nce
ntr
atio
n (
mo
lar
d.b
. %)
Experimentalvalues
Simulatedvalues
0
5
10
15
20
25
H2 CO CO2 CH4
Co
nce
ntr
atio
n (
mo
lar
d.b
. %)
Experimentalvalues
Simulatedvalues
0
5
10
15
20
25
30
H2 CO CO2 CH4
Co
nce
ntr
atio
n (
mo
lar
d.b
. %)
Experimentalvalues
Simulatedvalues
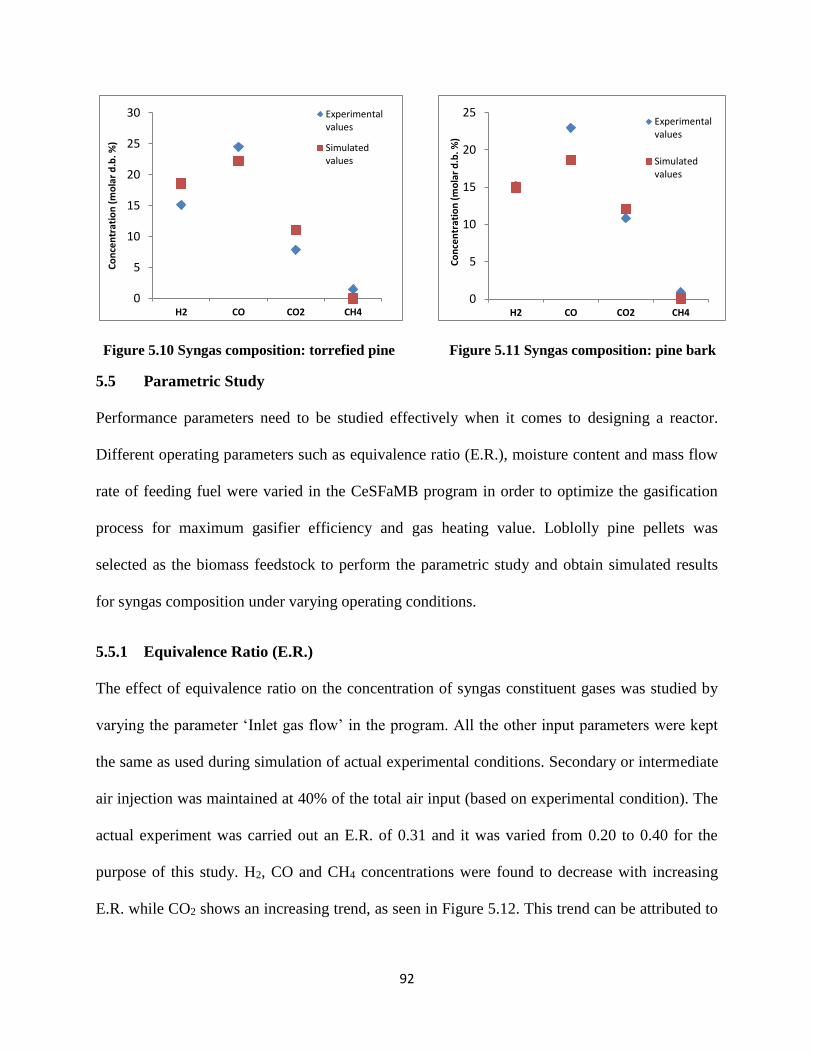
92
Figure 5.10 Syngas composition: torrefied pine Figure 5.11 Syngas composition: pine bark
5.5 Parametric Study
Performance parameters need to be studied effectively when it comes to designing a reactor.
Different operating parameters such as equivalence ratio (E.R.), moisture content and mass flow
rate of feeding fuel were varied in the CeSFaMB program in order to optimize the gasification
process for maximum gasifier efficiency and gas heating value. Loblolly pine pellets was
selected as the biomass feedstock to perform the parametric study and obtain simulated results
for syngas composition under varying operating conditions.
5.5.1 Equivalence Ratio (E.R.)
The effect of equivalence ratio on the concentration of syngas constituent gases was studied by
varying the parameter ‘Inlet gas flow’ in the program. All the other input parameters were kept
the same as used during simulation of actual experimental conditions. Secondary or intermediate
air injection was maintained at 40% of the total air input (based on experimental condition). The
actual experiment was carried out an E.R. of 0.31 and it was varied from 0.20 to 0.40 for the
purpose of this study. H2, CO and CH4 concentrations were found to decrease with increasing
E.R. while CO2 shows an increasing trend, as seen in Figure 5.12. This trend can be attributed to
0
5
10
15
20
25
30
H2 CO CO2 CH4
Co
nce
ntr
atio
n (
mo
lar
d.b
. %)
Experimentalvalues
Simulatedvalues
0
5
10
15
20
25
H2 CO CO2 CH4
Co
nce
ntr
atio
n (
mo
lar
d.b
. %)
Experimentalvalues
Simulatedvalues

93
the oxidation reactions (Equations 5.1-5.4) which give carbon dioxide in the presence of excess
oxygen.
𝐶 + 𝑂2 ↔ 𝐶𝑂2, 𝛥𝐻298 = −394 𝑘𝐽/𝑚𝑜𝑙 (5.1)
𝐶𝑂 + 0.5𝑂2 → 𝐶𝑂2, ∆𝐻298 = −284 𝑘𝐽/𝑚𝑜𝑙 (5.2)
𝐶𝐻4 + 2𝑂2 ↔ 𝐶𝑂2 + 2𝐻2𝑂, ∆𝐻298 = −803 𝑘𝐽/𝑚𝑜𝑙 (5.3)
𝐻2 + 0.5𝑂2 → 𝐻2𝑂, ∆𝐻298 = −242 𝑘𝐽/𝑚𝑜𝑙 (5.4)
Figure 5.12 Effect of equivalence ratio on the concentration of syngas constituents
5.5.2 Moisture Content
Figure 5.13 shows the effect of moisture content on the concentration of syngas species.
Moisture content of loblolly pine pellets was found to be 7.13% during experiments. CO
concentration showed significant reduction while H2 and CO2 had a slight increasing trend with
increasing moisture content in biomass. This phenomenon can also be justified by considering
the water gas shift reaction in which carbon monoxide reacts with water to give carbon dioxide
0
5
10
15
20
25
30
0.20 0.25 0.30 0.35 0.40
Mo
lar
con
cen
trat
ion
(%
)
E.R.
H2
CO
CO2
CH4

94
and hydrogen. Reduction in methane can be related to the methane reforming reaction in which
methane reacts with water to give carbon monoxide and hydrogen.
Figure 5.13 Effect of moisture content of biomass on the concentration of syngas
constituents
5.5.3 Biomass Feed Rate
The actual feeding rate of the loblolly pine pellets during experiments was 26 kg/hr and the
equivalence ratio (E.R.) was observed to be 0.30. As seen in Figure 5.14, the concentration of
H2, CO and CH4 increased gradually as the biomass feed rate was varied from 15 to 35 kg/hr,
while CO2 concentration showed a slight decrease. The equivalence ratio (E.R.) was found to be
decreasing from 0.51 to 0.21 with increasing biomass flow rate since the air required for
complete combustion kept increasing but the inlet air flow rate was kept constant in the program.
0.00
0.05
0.10
0.15
0.20
0.25
0.30
0.35
0.40
0
5
10
15
20
25
5 10 15 20
Equ
ival
en
ce r
atio
(E.
R.)
Mo
lar
con
cen
trat
ion
(%
)
Moisture content (%)
H2 CO CO2 CH4 E.R.
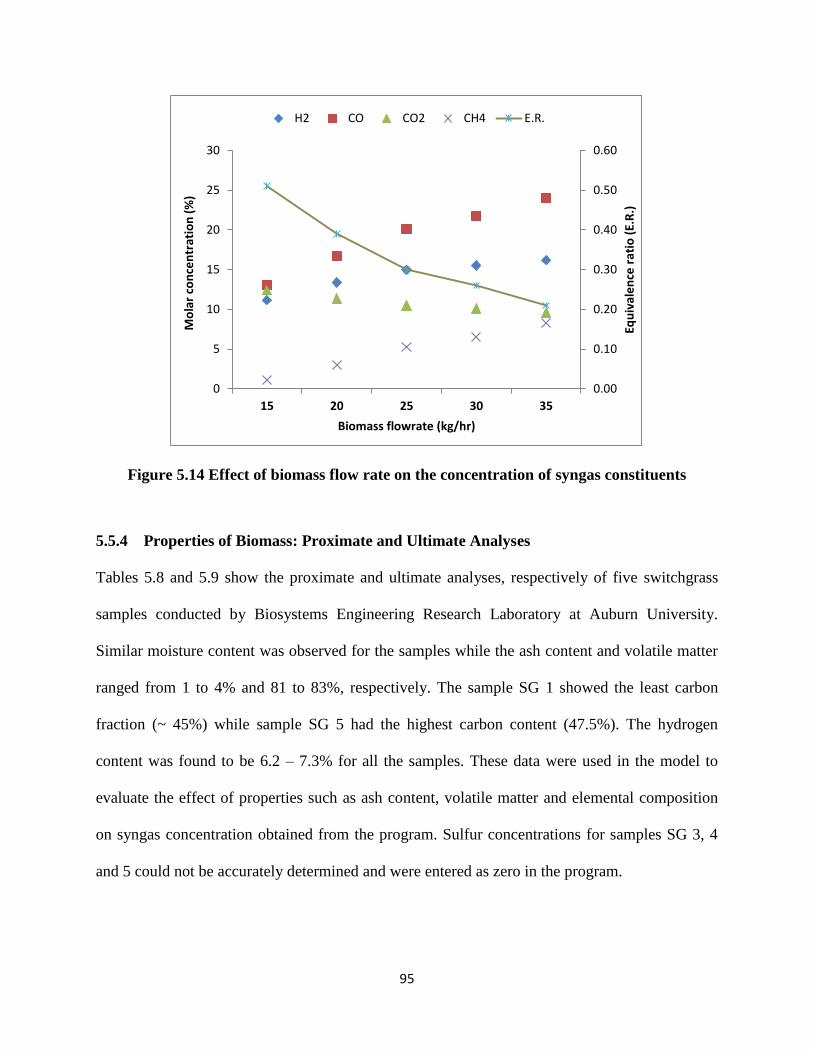
95
Figure 5.14 Effect of biomass flow rate on the concentration of syngas constituents
5.5.4 Properties of Biomass: Proximate and Ultimate Analyses
Tables 5.8 and 5.9 show the proximate and ultimate analyses, respectively of five switchgrass
samples conducted by Biosystems Engineering Research Laboratory at Auburn University.
Similar moisture content was observed for the samples while the ash content and volatile matter
ranged from 1 to 4% and 81 to 83%, respectively. The sample SG 1 showed the least carbon
fraction (~ 45%) while sample SG 5 had the highest carbon content (47.5%). The hydrogen
content was found to be 6.2 – 7.3% for all the samples. These data were used in the model to
evaluate the effect of properties such as ash content, volatile matter and elemental composition
on syngas concentration obtained from the program. Sulfur concentrations for samples SG 3, 4
and 5 could not be accurately determined and were entered as zero in the program.
0.00
0.10
0.20
0.30
0.40
0.50
0.60
0
5
10
15
20
25
30
15 20 25 30 35
Equ
ival
en
ce r
atio
(E.
R.)
Mo
lar
con
cen
trat
ion
(%
)
Biomass flowrate (kg/hr)
H2 CO CO2 CH4 E.R.

96
Table 5.8 Proximate analysis (w.b.%) of switchgrass samples
Sample Moisture Ash Volatile
matter
Fixed
carbon
SG 1 7.67 2.55 81.77 8.01
SG 2 7.14 2.54 83.05 7.27
SG 3 6.16 1.84 82.29 9.71
SG 4 6.94 3.64 81.64 7.78
SG 5 6.62 2.29 81.97 9.12
Table 5.9 Ultimate analysis (ash free d.b.%) of switchgrass samples
Sample C H N S O
SG 1 44.98 6.35 0.47 0.07 48.13
SG 2 45.35 6.20 0.56 0.12 47.77
SG 3 45.94 6.42 0.46 0.00 47.18
SG 4 46.75 7.21 0.73 0.00 45.31
SG 5 47.45 7.33 0.61 0.00 44.61
Figure 5.15 shows the syngas composition from five switchgrass samples as obtained from the
program. The concentrations of H2 and CO showed an increasing trend for samples SG 1 to SG
5, which are in order of increasing carbon content. On the contrary, CO2 concentrations were
found to be decreasing for that order. This trend can be attributed to Boudouard and Water-gas
reactions as given by Equations 5.5 and 5.6, respectively, which show that presence of more
carbon produces more CO and H2. The increase in CH4 can also be justified by the
Hydrogenation reaction given by Equation 5.7. Sample SG 1 which had lower hydrogen content
as compared to SG 3, was found to have higher H2 concentration than SG 3. It was also observed
that SG 1 had the highest moisture content (7.67%) which caused a spike in the H2 concentration.
Boudouard reaction: 𝐶 + 𝐶𝑂2 ↔ 2𝐶𝑂, 𝛥𝐻298 = +172 𝑘𝐽/𝑚𝑜𝑙 (5.5)

97
Water-gas reaction: 𝐶 + 𝐻2𝑂 ↔ 𝐶𝑂 + 𝐻2, 𝛥𝐻298 = +131 𝑘𝐽/𝑚𝑜𝑙 (5.6)
Hydrogenation reaction: 𝐶 + 2𝐻2 → 𝐶𝐻4, 𝛥𝐻298 = −74.8 𝑘𝐽/𝑚𝑜𝑙 (5.7)
Figure 5.15 Simulation of syngas composition from switchgrass samples
5.6 Conclusions
Syngas composition from gasification of various feedstocks obtained through simulation was
compared to the experimental results. The program was unable to reproduce experimental results
initially and calibration was needed to adjust the model to the properties of feeding fuel. After
calibration of reaction kinetics, it was capable of providing reasonable reproduction of
experimental tests after calibration of reaction kinetics. However, the concentration of methane
was significantly higher than the actual experimental value.
0
5
10
15
20
25
H2 CO CO2 CH4
Mo
lar
con
cen
trat
ion
(%
)
SG 1 SG 2 SG 3 SG 4 SG 5

98
The parametric study concluded that the model is most sensitive to inlet air or gas flow, moisture
content, mass flow rate and elemental composition of feeding fuel. Higher concentration of
hydrogen and carbon monoxide was achieved in the model output at lower equivalence ratio and
higher biomass flow rate. In order to produce syngas with greater higher heating value, these
parameters need to be controlled accordingly.
5.7 References
[1] M. L. de Souza-Santos, Solid Fuels Combustion and Gasification: Modeling, Simulation
and Equipment Operations, New York: CRC Press, 2010.
[2] M. L. de Souza-Santos, "Comprehensive Modeling and Simulation of Fluidized Bed Boilers
and Gasifiers," Fuel, vol. 68, pp. 1507-1521, 1989.
[3] A. Gomez-Barea and B. Leckner, "Modeling of biomass gasification in fluidized bed,"
Prog. Energy. Combust. Sci., vol. 36, pp. 444-509, 2010.
[4] M. L. de Souza-Santos, "A new version of CSFB. comprehensive simulator for fluidized
bed equipment," Fuel, vol. 86, pp. 1684-1709, 2007.
[5] M. L. de Souza-Santos, "A feasilbility study on an alternative power generation system
based on biomass gasification/gas turbine concept," Fuel, vol. 78, pp. 529-538, 1999.
[6] M. L. de Souza-Santos, "CSFB applied to fluidized-bed gasification of special fuels," Fuel,
vol. 88, pp. 826-833, 2009.
[7] M. L. de Souza-Santos, "Comprehensive simulator (CSFMB) applied to circulating
fluidized bed boilers and gasifiers," Open Chem. Eng. J., vol. 2, pp. 106-118, 2008.
[8] M. L. de Souza-Santos, "Comprehensive Simulator of Fluidized and Moving Bed
Equipment," 2012.
[9] M. L. Hobbs, P. T. Radulovic and L. D. Smoot, "Combustion and gasification of coals in
fixed- beds," Prog. Energy Combust. Sci., vol. 19, pp. 505-556, 1993.
[10] M. L. de Souza-Santos, "Study of Energy Alternative Sources; Use of Biomass and Crop
Residues as Energy Source: Part B: Development of a Mathematical Model and Simulation
program for Up-stream and Down-stream Moving Bed Gasifiers," Institute for
99
Technological Research of Sao Paulo, Sao Paulo, Brazil, 1982.
[11] L. C. Jen and M. L. de Souza-Santos, "Modeling and simulation of fixed bed gasifiers for
charcoal," Brazilian Journal of Chemical Engineering , vol. 7, no. 3-4, pp. 18-23, 1984.
[12] K. H. van Heek and H. J. Muhlen, "Kinetic studies of steam gasification of char in the
presence of H2, CO2 and CO," Fuel, vol. 64, pp. 1405-1414, 1985.
[13] M. L. de Souza-Santos, "Comprehensive simulator applied to fluidized bed coal
gasification," The Open Chemical Engineering Journal, vol. 4, pp. 68-79, 2010.
[14] S. Kasaoka, Y. Sakata and C. Tong, "Kinetic evaluation of the reactivity of various coal
chars for gasification with carbon dioxide in comparison with steam," Int. Chem. Eng., vol.
25, pp. 160-175, 1985.
[15] P. J. van den Enden and E. S. Lora, "Design approachfor a biomass fed fluidized bed
gasifier using the simulation software CSFB," Biomass and Bioenergy, vol. 26, pp. 281-287,
2004.

100
CHAPTER SIX
SUMMARY AND FUTURE WORK
6.1 Concluding Remarks
The thesis was able to establish the effect of different biomass feedstocks on the quality of
syngas produced from downdraft gasification in terms of the composition of major gases and
contaminants. Among the seven types of biomass feedstocks, yellow pine pellets produced
syngas with the highest HHV. Although the tar content was relatively high, the syngas from
yellow pine showed lower hydrogen sulfide concentration. Gasification of switchgrass was not
promising due to frequent ash agglomeration in the reactor. Switchgrass and pine bark both of
which have high ash content were blended with yellow pine pellets and pine chips to inhibit the
problem of ash fusion. Gasification of the blended biomass showed no ash agglomeration at all
and the operation of the gasifier was smooth as usual.
The CeSFaMB program was calibrated with new kinetic coefficient parameters to reproduce
experimental results for syngas composition from different feedstocks. However, the output for
the temperature profile inside the reactor was not as accurate as compared to the actual measured
values in experiments. The inlet air flow, moisture content, mass flow rate and elemental
composition of feeding fuel were the most sensitive factors in the model. Low equivalence ratio,
high biomass flow rate and high carbon content showed to yield syngas with high concentration
of hydrogen and carbon monoxide.

101
6.2 Limitations and Recommendations for Future Work
The mobile downdraft gasifier system is operated in such a way that it allows us to control only
the temperatures inside the reactor and the output flow rate of syngas coming out of the gasifier.
These two factors then determine other parameters such as inlet air flow rate and biomass flow
rate. Thus, the effect of equivalence ratio (E.R.) on the downdraft gasification process could not
be studied in detail due to limitations imposed by this control system. It is suggested that the
configuration should be modified to accommodate control of important parameters such as the
inlet air flow rate and fuel feed rate.
Before the start of the actual experiments, charcoal was used as the feed until the temperatures
inside the reactor reached steady state. The biomass feedstock was then fed up to the top of the
gasifier to start the experiment. At the end of the experiment, some amount of biomass would
remain inside the gasifier to be used to start up the next run, thus practically nullifying the mass
balance. This practice caused some inconsistencies in the determination of carbon conversion
from the process. Moreover, the effect of the remaining char inside the gasifier on syngas
composition could not be studied due to impracticality of obtaining the char after every other
run.
One of the major issues faced was ash build up at the bottom of the reactor during switchgrass
gasification. The gasifier operates at very high temperatures (800-1000oC) and ash
agglomeration can occur since the ash fusion temperature of switchgrass is ~1016oC. Hence,
gasification of biomass having high ash content such as switchgrass would cause agglomeration
and slagging/fouling problems. As concluded in Chapter Four, agglomeration was not
experienced with the switchgrass/yellow pine blends’ gasification due to decreased ash content

102
in the feedstock. Thus, it is recommended that switchgrass or any other high ash content biomass
should be blended with a biomass that has lower ash content for use in the gasifier.
The CeSFaMB model should be able to incorporate diverse types of feeding fuels without the
need of calibration of the program. Kinetic coefficients of different reactions involving various
fuels are not always available for use. Keeping this in mind, proper laboratorial work to obtain
major gasification kinetics as well as pyrolysis parameters should be conducted in order to feed
the simulator data bank and achieve better reproductions.

103
APPENDIX A
SUPPLEMENTAL (LABVIEW) DATA FROM GASIFIER
A.1 Syngas composition data generated by CAI gas analyzer (torrefied pine pellets)
Figure A.1 Hydrogen concentration over time
0
5
10
15
20
25
0:00 0:30 1:00 2:09 2:39 3:09
H2
co
nce
ntr
atio
n (
%)
Time (hh:mm)

104
Figure A.2 Carbon monoxide concentration over time
Figure A.3 Carbon dioxide concentration over time
0
5
10
15
20
25
30
0:00 0:30 1:00 2:09 2:39 3:09
CO
co
nce
ntr
atio
n (
%)
Time (hh:mm)
0
5
10
15
0:00 0:30 1:00 2:09 2:39 3:09
CO
2co
nce
ntr
atio
n (
%)
Time (hh:mm)
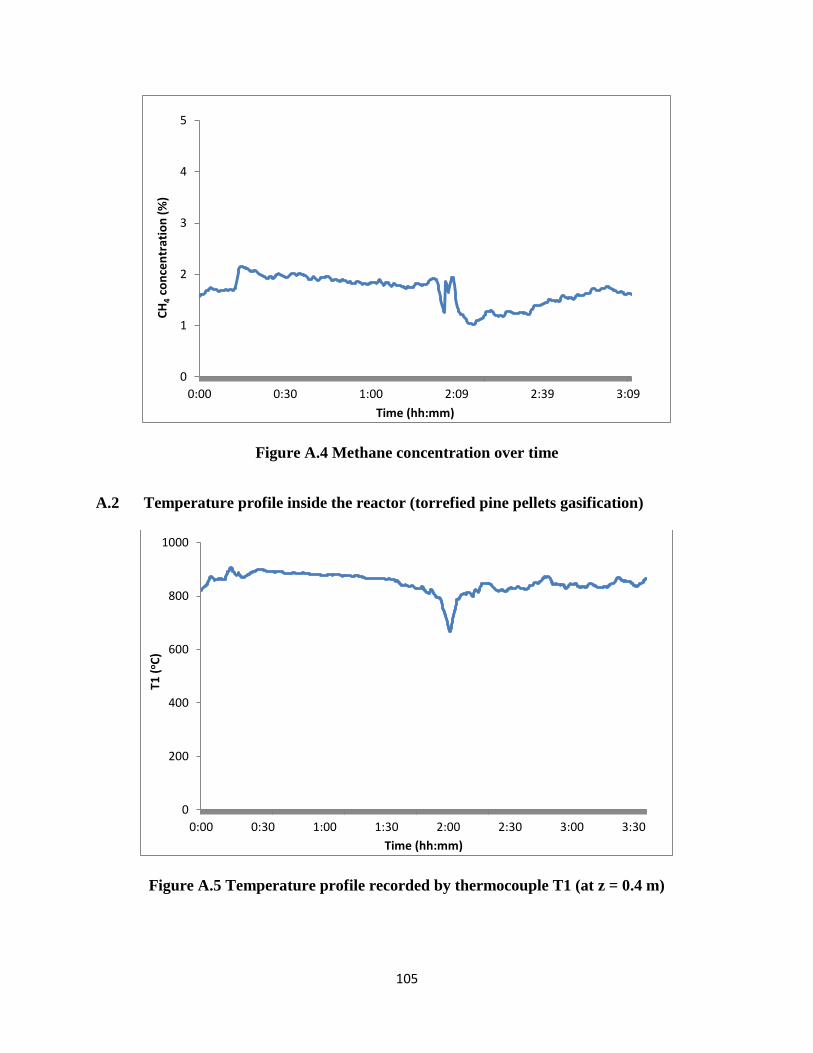
105
Figure A.4 Methane concentration over time
A.2 Temperature profile inside the reactor (torrefied pine pellets gasification)
Figure A.5 Temperature profile recorded by thermocouple T1 (at z = 0.4 m)
0
1
2
3
4
5
0:00 0:30 1:00 2:09 2:39 3:09
CH
4co
nce
ntr
atio
n (
%)
Time (hh:mm)
0
200
400
600
800
1000
0:00 0:30 1:00 1:30 2:00 2:30 3:00 3:30
T1 (
oC
)
Time (hh:mm)

106
Figure A.6 Temperature profile recorded by thermocouple T2 (at z = 0.53 m)
Figure A.7 Temperature profile recorded by thermocouple T3 (at z = 0.66 m)
0
200
400
600
800
1000
1200
0:00 0:30 1:00 1:30 2:00 2:30 3:00 3:30
T2 (
oC
)
Time (hh:mm)
0
200
400
600
800
1000
1200
0:00 0:30 1:00 1:30 2:00 2:30 3:00 3:30
T3 (
oC
)
Time (hh:mm)

107
Figure A.8 Temperature profile recorded by thermocouple T4 (at z = 0.79 m)
Figure A.9 Temperature profile recorded by thermocouple T5 (at z = 0.92 m)
0
200
400
600
800
1000
0:00 0:30 1:00 1:30 2:00 2:30 3:00 3:30
T4 (
oC
)
Time (hh:mm)
0
200
400
600
800
1000
0:00 0:30 1:00 1:30 2:00 2:30 3:00 3:30
T5 (
oC
)
Time (hh:mm)

108
Figure A.10 Temperature profile recorded at grate
0
200
400
600
800
1000
0:00 0:30 1:00 1:30 2:00 2:30 3:00 3:30
Gra
te t
em
pe
ratu
re (
oC
)
Time (hh:mm)

109
APPENDIX B
SAMPLE CALCULATIONS
B.1 Higher Heating Value (HHV) of Syngas
As shown in Eq. B.1, the overall higher heating value of syngas was calculated by adding up the
products of the volumetric fraction of syngas constituents (Yi) and their respective higher heating
values (HHVi).
𝐻𝐻𝑉𝑠𝑦𝑛𝑔𝑎𝑠 = 𝐻𝐻𝑉𝐻2 𝑌𝐻2
+ 𝐻𝐻𝑉𝐶𝑂𝑌𝐶𝑂 + 𝐻𝐻𝑉𝐶𝐻4𝑌𝐶𝐻4
(B.1)
The HHV of H2, CO and CH4 are 12.76 MJ/m3, 12.6 MJ/m3 and 39.8 MJ/m3 respectively [1].
So, 𝐻𝐻𝑉𝑠𝑦𝑛𝑔𝑎𝑠 = 12.76 𝑋 0.175 + 12.6 𝑋 0.256 + 39.8 𝑋 0.015 = 6.05 𝑀𝐽/𝑚3
B.2 Carbon, Energy and Exergy Analyses
Table B.1 shows the syngas composition obtained from a gasification run of yellow pine pellets,
at a certain point of time midway through the test. The table also presents the biomass flow rate,
carbon and moisture content, grate temperature and the actual syngas flow rate observed in the
experiment.
Table B.1 Syngas composition (yellow pine) midway through the test
Carbon
content
(%, d.b.)
Biomass
flow rate,
mwet (kg/hr)
Moisture,
m.c. (%)
Syngas constituents (molar %,
d.b.)
Actual syngas
flowrate
(m3/hr)
H2 CO CO2 CH4
51.13 27.85 10.12 17.5 25.6 9.76 1.48 55*

110
Note*: Although the syngas flow rate was set to be 65 m3/hr for each experiment, the actual flow
was found to be lower (55 m3/hr in this run) due to presence of certain base flow in the system.
This base flow is determined from the LABVIEW data extracted from the onboard computer and
subtracted from the set flow rate.
B.2.1 Carbon Conversion
Dry biomass flow rate (mdry) was calculated simply by subtracting the amount of moisture (%)
present in the biomass:
𝑚𝑑𝑟𝑦 = 𝑚𝑤𝑒𝑡 − 𝑚. 𝑐. = 27.85 − (10.12
100) 𝑋 27.85 = 25.03 𝑘𝑔/ℎ𝑟
Total amount of carbon in the feedstock (Cin) is given by multiplying the dry biomass flow rate
with its carbon content (%):
𝐶𝑖𝑛 = 25.03 𝑋 (51.13
100) = 12.79 𝑘𝑔/ℎ𝑟
Equation (B.2) gives the total carbon coming out with syngas:
𝐶𝑜𝑢𝑡 = (𝑌𝐶𝑂 + 𝑌𝐶𝑂2+ 𝑌𝐶𝐻4
) . 𝜌𝑚𝑜𝑙 . 𝑀𝐶 . 𝐴𝐹 (B.2)
where, 𝑌𝐶𝑂 , 𝑌𝐶𝑂2, 𝑌𝐶𝐻4
: molar fractions of CO, CO2 and CH4
ρmol : molar density of ideal gas = 44.615 mol/m3 at STP
MC : molecular weight of carbon, kg/mol
AF: Actual syngas flow rate, m3/hr
Thus,
𝐶𝑜𝑢𝑡 = (0.256 + 0.098 + 0.015)𝑋 44.615 𝑋12
1000𝑋 55 = 10.87 𝑘𝑔/ℎ𝑟
Carbon closure is given by the ratio of Cout to Cin
𝐶𝐶 =𝐶𝑜𝑢𝑡
𝐶𝑖𝑛=
10.87
12.79= 0.85
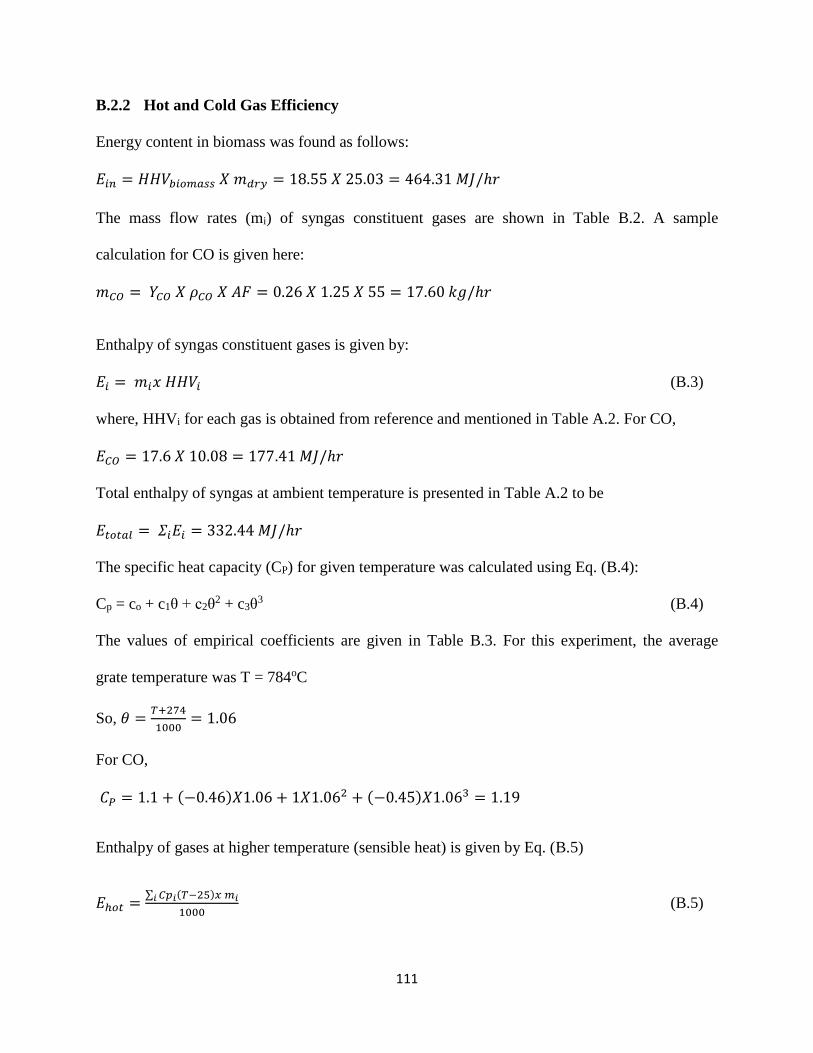
111
B.2.2 Hot and Cold Gas Efficiency
Energy content in biomass was found as follows:
𝐸𝑖𝑛 = 𝐻𝐻𝑉𝑏𝑖𝑜𝑚𝑎𝑠𝑠 𝑋 𝑚𝑑𝑟𝑦 = 18.55 𝑋 25.03 = 464.31 𝑀𝐽/ℎ𝑟
The mass flow rates (mi) of syngas constituent gases are shown in Table B.2. A sample
calculation for CO is given here:
𝑚𝐶𝑂 = 𝑌𝐶𝑂 𝑋 𝜌𝐶𝑂 𝑋 𝐴𝐹 = 0.26 𝑋 1.25 𝑋 55 = 17.60 𝑘𝑔/ℎ𝑟
Enthalpy of syngas constituent gases is given by:
𝐸𝑖 = 𝑚𝑖𝑥 𝐻𝐻𝑉𝑖 (B.3)
where, HHVi for each gas is obtained from reference and mentioned in Table A.2. For CO,
𝐸𝐶𝑂 = 17.6 𝑋 10.08 = 177.41 𝑀𝐽/ℎ𝑟
Total enthalpy of syngas at ambient temperature is presented in Table A.2 to be
𝐸𝑡𝑜𝑡𝑎𝑙 = 𝛴𝑖𝐸𝑖 = 332.44 𝑀𝐽/ℎ𝑟
The specific heat capacity (CP) for given temperature was calculated using Eq. (B.4):
Cp = co + c1θ + c2θ2 + c3θ
3 (B.4)
The values of empirical coefficients are given in Table B.3. For this experiment, the average
grate temperature was T = 784oC
So, 𝜃 =𝑇+274
1000= 1.06
For CO,
𝐶𝑃 = 1.1 + (−0.46)𝑋1.06 + 1𝑋1.062 + (−0.45)𝑋1.063 = 1.19
Enthalpy of gases at higher temperature (sensible heat) is given by Eq. (B.5)
𝐸ℎ𝑜𝑡 =∑ 𝐶𝑝𝑖(𝑇−25)𝑥𝑖 𝑚𝑖
1000 (B.5)

112
For CO,
𝐸ℎ𝑜𝑡,𝐶𝑂 =1.19𝑋(1058−298)𝑋17.6
1000= 15.96 𝑀𝐽/ℎ𝑟
Total sensible heat was calculated as the sum of individual sensible heats and is presented in
Table B.2 to be
𝐸ℎ𝑜𝑡 = 66.09 𝑀𝐽/ℎ𝑟
The energy content of the syngas produced is determined at two locations - the exit of the
gasifier (Eout, hot) and the exit of the heat exchanger (Eout, cold) after the gas is cooled to ambient
temperature. The efficiencies thus calculated are the hot gas efficiency (ηhot) and cold gas
efficiency (ηcold).
𝜂ℎ𝑜𝑡 =𝐸𝑜𝑢𝑡,ℎ𝑜𝑡
𝐸𝑖𝑛=
𝐸𝑡𝑜𝑡𝑎𝑙+𝐸ℎ𝑜𝑡
𝐸𝑖𝑛=
332.44+66.09
464.31= 0.86
𝜂𝑐𝑜𝑙𝑑 =𝐸𝑜𝑢𝑡,𝑐𝑜𝑙𝑑
𝐸𝑖𝑛=
𝐸𝑡𝑜𝑡𝑎𝑙
𝐸𝑖𝑛=
332.44
464.31= 0.72
Table B.2 Properties of syngas constituents
Gases
ρ at STP
(kg/m3)
Gas fraction
(Yi)
Cp
(MJ/kgK)
Mass flow rate,
mi (kg/hr)
HHVi of gas
(MJ/kg)
Etotal (i)
(MJ/hr)
Ehot (i)
(MJ/hr)
CO 1.25 0.26 1.20 17.60 10.08 177.41 15.96
CO2 1.96 0.10 1.26 10.54 0.00 0.00 10.06
CH4 0.72 0.01 4.64 0.58 55.47 32.32 2.05
H2 0.09 0.18 15.15 0.87 141.82 122.72 9.95
N2 1.25 0.46 1.18 31.37 0.00 0.00 28.08
Σ 332.44 66.10
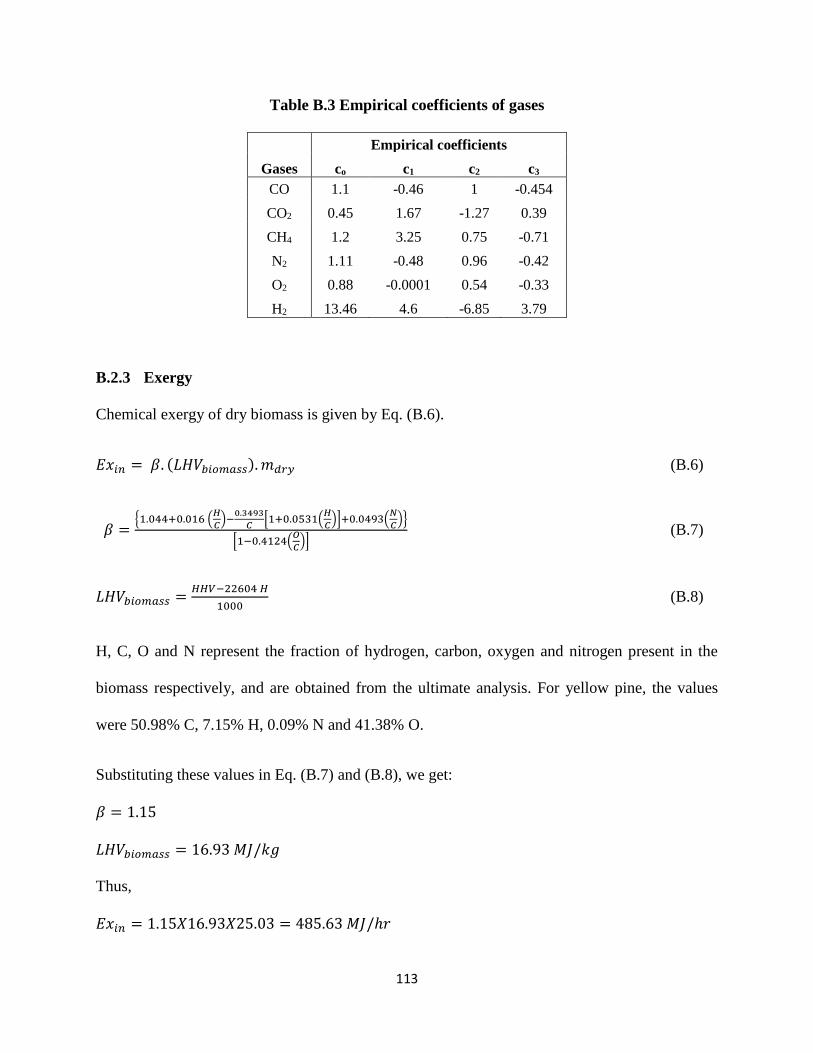
113
Table B.3 Empirical coefficients of gases
Empirical coefficients
Gases co c1 c2 c3
CO 1.1 -0.46 1 -0.454
CO2 0.45 1.67 -1.27 0.39
CH4 1.2 3.25 0.75 -0.71
N2 1.11 -0.48 0.96 -0.42
O2 0.88 -0.0001 0.54 -0.33
H2 13.46 4.6 -6.85 3.79
B.2.3 Exergy
Chemical exergy of dry biomass is given by Eq. (B.6).
𝐸𝑥𝑖𝑛 = 𝛽. (𝐿𝐻𝑉𝑏𝑖𝑜𝑚𝑎𝑠𝑠). 𝑚𝑑𝑟𝑦 (B.6)
𝛽 ={1.044+0.016 (
𝐻
𝐶)−
0.3493
𝐶[1+0.0531(
𝐻
𝐶)]+0.0493(
𝑁
𝐶)}
[1−0.4124(𝑂
𝐶)]
(B.7)
𝐿𝐻𝑉𝑏𝑖𝑜𝑚𝑎𝑠𝑠 =𝐻𝐻𝑉−22604 𝐻
1000 (B.8)
H, C, O and N represent the fraction of hydrogen, carbon, oxygen and nitrogen present in the
biomass respectively, and are obtained from the ultimate analysis. For yellow pine, the values
were 50.98% C, 7.15% H, 0.09% N and 41.38% O.
Substituting these values in Eq. (B.7) and (B.8), we get:
𝛽 = 1.15
𝐿𝐻𝑉𝑏𝑖𝑜𝑚𝑎𝑠𝑠 = 16.93 𝑀𝐽/𝑘𝑔
Thus,
𝐸𝑥𝑖𝑛 = 1.15𝑋16.93𝑋25.03 = 485.63 𝑀𝐽/ℎ𝑟
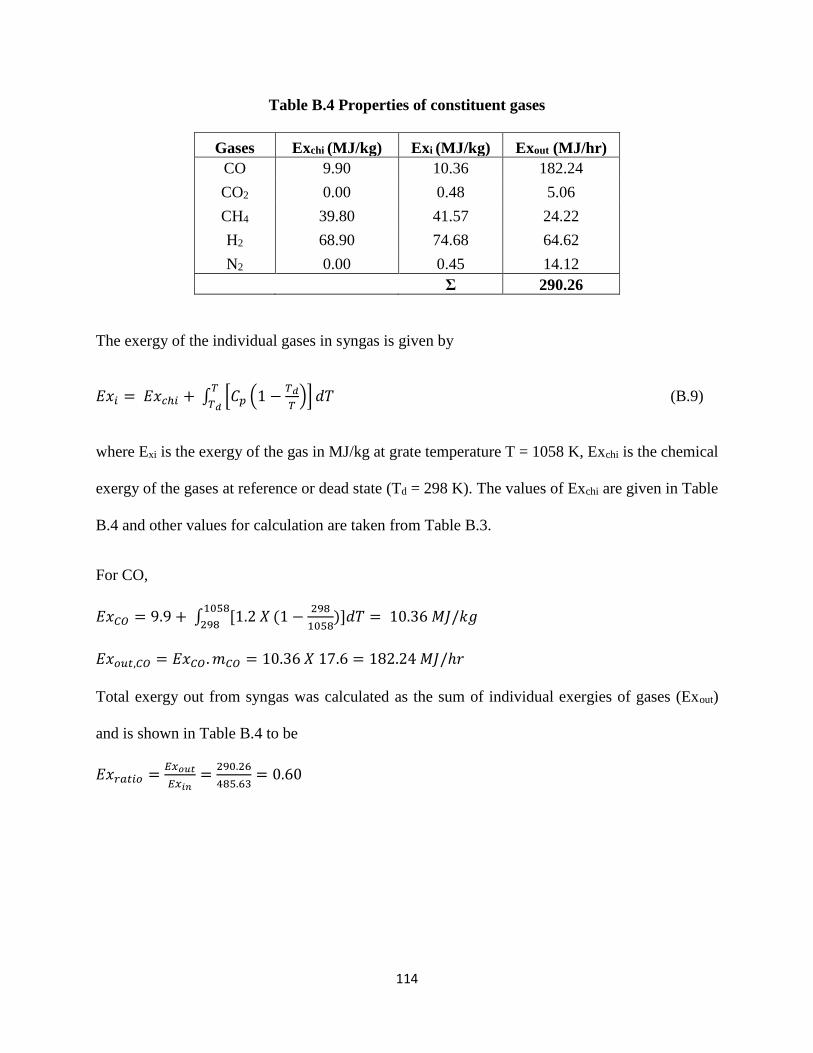
114
Table B.4 Properties of constituent gases
Gases Exchi (MJ/kg) Exi (MJ/kg) Exout (MJ/hr)
CO 9.90 10.36 182.24
CO2 0.00 0.48 5.06
CH4 39.80 41.57 24.22
H2 68.90 74.68 64.62
N2 0.00 0.45 14.12
Σ 290.26
The exergy of the individual gases in syngas is given by
𝐸𝑥𝑖 = 𝐸𝑥𝑐ℎ𝑖 + ∫ [𝐶𝑝 (1 −𝑇𝑑
𝑇)] 𝑑𝑇
𝑇
𝑇𝑑 (B.9)
where Exi is the exergy of the gas in MJ/kg at grate temperature T = 1058 K, Exchi is the chemical
exergy of the gases at reference or dead state (Td = 298 K). The values of Exchi are given in Table
B.4 and other values for calculation are taken from Table B.3.
For CO,
𝐸𝑥𝐶𝑂 = 9.9 + ∫ [1.2 𝑋1058
298(1 −
298
1058)]𝑑𝑇 = 10.36 𝑀𝐽/𝑘𝑔
𝐸𝑥𝑜𝑢𝑡,𝐶𝑂 = 𝐸𝑥𝐶𝑂 . 𝑚𝐶𝑂 = 10.36 𝑋 17.6 = 182.24 𝑀𝐽/ℎ𝑟
Total exergy out from syngas was calculated as the sum of individual exergies of gases (Exout)
and is shown in Table B.4 to be
𝐸𝑥𝑟𝑎𝑡𝑖𝑜 =𝐸𝑥𝑜𝑢𝑡
𝐸𝑥𝑖𝑛=
290.26
485.63= 0.60

115
APPENDIX C
TAR COMPOUNDS
Table C.1 Retention time of tar compounds
Tar compound Retention time (s)
Benzene 2.53
Toluene 4.33
Ethyl benzene 7.71
O-xylene 8.75
Styrene 9.03
Indene 14.63
Phenol 17.64
3-methyl phenol 19.15
Napthalene 19.39
2-methyl napthalene 22.38
Biphenyl 24.61

116
APPENDIX D
CESFAMB MODEL PARAMETERS
D.1 Input Parameters
The simulator input list includes various equipment geometry and operational characteristics
which allow proper description of the unit. The list is organized according to groups of data as
follows:
Equipment geometry data
Along with the shape of the cross section of bed, hydraulic diameter according to the
height of the equipment can be entered. Also, positions of the bed top, freeboard top,
solid particle and gas injections, position of tube banks (if used) in the bed or freeboard
along with their aspects are available. Moreover, material quality and thickness of vessel
walls, water or gas-jacket geometries (if used), insulations, thickness and quality (thermal
conductivity and emissivity), cyclone system design, etc. are some of the geometry input
data in the program.
Feeding fuels characterization
Flow rates and characteristics of feeding of carbonaceous particles have a significant
impact on the output results of the program. Type of fuel, proximate and ultimate
analysis, higher heating value, bulk and particle densities, shape and sphericity, particle
size distribution and water fraction in slurry (if any) are used to characterize the fuel. In
addition, if any absorbents (limestone, dolomite, etc.) or inert particles (sand, aluminum,

117
etc.) are used in the process, similar information as for carbonaceous fuel can be
provided.
Stream characterization
The mass flow rates and characteristics of primary injected gas/steam streams with any
composition and within a wide range of temperature and pressure can be entered into the
program. Liquid streams are also allowed. Moreover, the flow rates and characteristics of
eventually injected intermediate gas streams and intermediate gas withdrawals can also
be informed along with the position of injections and withdrawals respectively.
Special kinetic parameters related to fuels
For each fuel, the values of reaction pre-exponential parameter and the exponential one
can be entered which will eventually replace the default values internally set in the
model. It allows user to interfere in the rate of up to ten different reactions in order to
calibrate the program according to a particular carbonaceous fuel or sulfur absorbents.
D.2 Output Parameters
Equipment performance parameters: Overall aspects of the unit operation such as:
flow rates of gases and solids leaving the equipment, carbon conversion, residence time
of solid species, flow rates of tar or oil leaving with gases, etc.
Devolatilization parameters: Rates, composition of released gases and average time for
complete pyrolysis
Composition, flow rates and thermodynamic properties of gas streams
Composition, particle size distribution and flow rates of solids or liquids at each point
inside the equipment as well as those streams leaving the equipment.
Overall elemental mass balance verification

118
Temperature profiles of each gas and solid throughout the entire equipment
Rate profiles of reactions at each phase throughout the equipment
Overall exergy analysis of the unit operation
General warnings to the user related to possible operational problems