experimental analysis of a photovoltaic concentrator...
TRANSCRIPT
Experimental analysis of a photovoltaic concentrator based on a single reflective stage immersed in an optical fluid Marta Victoria , César Domínguez, Stephen Askins, Ignacio Antón and Gabriel Sala
ABSTRACT
This article reviews all the experimental tests carried out to analyze the performance of a FluidReflex photovoltaic concentrator. This novel concentrator concept consists of a single reflective stage immersed in an optical fluid. The presence of the fluid entails significant advantages. It not only allows a high system optical efficiency and increases the attainable concentration but also enhances the heat dissipation from the cell. In addition, the electrical insulation is improved, and the problem of water vapor condensation inside the module is avoided. A complete characterization is addressed in this paper. Among the experimental results, a measured optical efficiency of 83.5% for a concentration of 1035 x stands out.
KEYWORDS
concentrators; mirrors; multijunction solar cells; fluids; optical characterization; antireflective coatings
1. INTRODUCTION
Concentrating photovoltaics (CPV) is one of the technologies proposed to obtain cheap solar-generated electricity. The idea behind concentration consists in taking advantage of high-efficiency solar cells and using optical systems to concentrate light on their surface. Evidently, high-efficiency solar cells are more expensive, but if the concentration level is high enough and the optics is affordable enough, the final system becomes cost competitive. CPV was proposed several decades ago mainly on the basis of high-efficiency silicon solar cells; during those years, several research centers have been working on this technology, and significant results have been achieved [1]. Nowadays, the recent development of multijunction (MJ) solar cells, whose efficiencies reach up to 43.5% [2], together with the new situation in the energy generation markets worldwide, brings a renewed interest in CPV.
Currently, systems with different concentration levels and optical designs, based on both lenses and mirrors, are being developed, the most common configuration being the one based on using a Fresnel lens with or without a secondary optical element [3,4]. However, the existence of such a wide variety of concepts currently
under development shows that no single architecture has yet emerged as the most cost competitive. The aim of this article is to introduce a new concentrator concept as well as to present a complete experimental characterization to prove the validity of this concept.
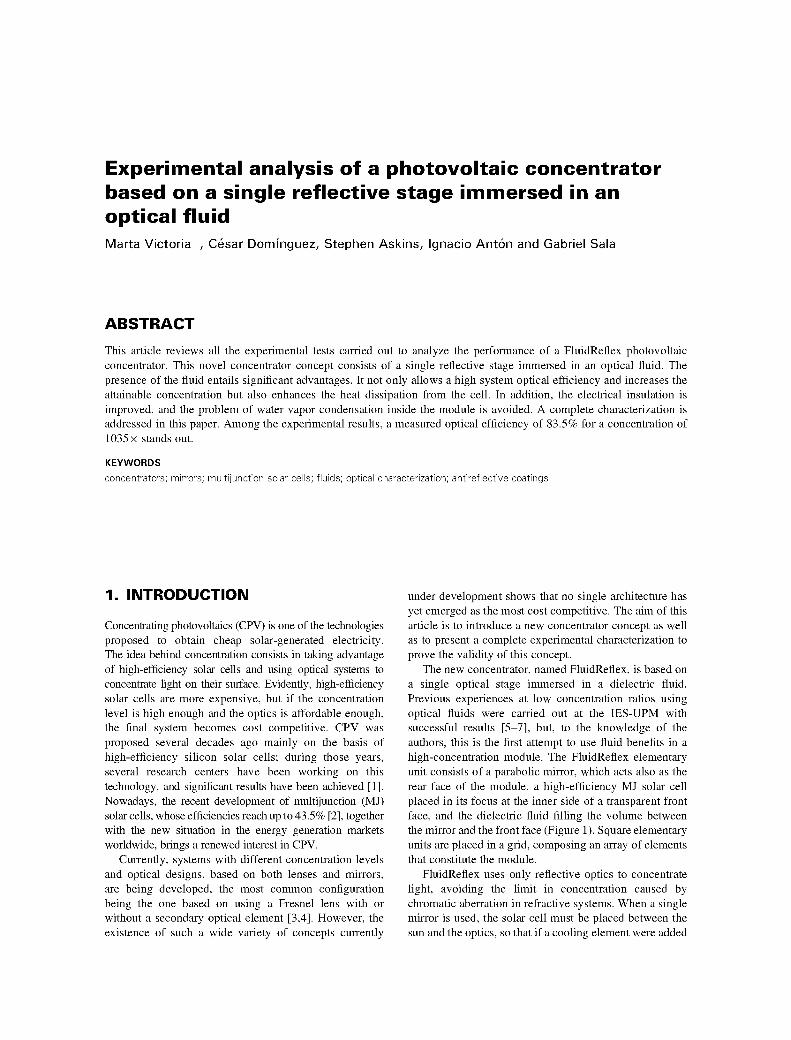
The new concentrator, named FluidReflex, is based on a single optical stage immersed in a dielectric fluid. Previous experiences at low concentration ratios using optical fluids were carried out at the IES-UPM with successful results [5-7], but, to the knowledge of the authors, this is the first attempt to use fluid benefits in a high-concentration module. The FluidReflex elementary unit consists of a parabolic mirror, which acts also as the rear face of the module, a high-efficiency MJ solar cell placed in its focus at the inner side of a transparent front face, and the dielectric fluid filling the volume between the mirror and the front face (Figure 1). Square elementary units are placed in a grid, composing an array of elements that constitute the module.
FluidReflex uses only reflective optics to concentrate light, avoiding the limit in concentration caused by chromatic aberration in refractive systems. When a single mirror is used, the solar cell must be placed between the sun and the optics, so that if a cooling element were added
• IffWUl •
Figure 1 . Cassegrain configuration (left) a'
next to the cell, it would cast a shadow, reducing the system efficiency. A common solution to this problem is to add a secondary mirror to redirect light through a hole in the primary mirror to a solar cell on the back surface of the module [8] (Figure 1). The drawback of this configuration, known as Cassegrain, arises from the fact that the light is now reflected twice, and as reflection is not ideal, light losses become more significant and optical efficiency decreases. On the contrary, in the FluidReflex concept, the fluid presence improves the thermal management within the module, avoiding the need of external cooling fins and enabling the use of a single reflective stage. Moreover, the fluid enhances the optical efficiency by reducing Fresnel losses in several interfaces, and it increases the concentration-acceptance angle product (CAP) [9], as will be explained in detail in Section 2.
The heat concentrated in the solar cell is transported to the module walls by convection (natural or forced) and conduction in the fluid. Contrary to conventional CPV modules, where only the rear wall contributes significantly to heat dissipation, in a FluidReflex concentrator, all the walls are heated to a similar temperature and exchange heat with the atmosphere. As a consequence, there is no need of a metallic heat sink thermally connected to the cell, typically consisting of a metallic plate and optionally cooling fins. The thermal management in conventional CPV modules must include a thin electrical insulator layer that provides a low thermal drop at the same time. This is a very critical element in terms of cost and long-term reliability, which is unnecessary in the FluidReflex concept.
Another advantage of this concentrator has to do with degradation due to water vapor condensation. In conventional CPV modules, air expansion inside the module makes hermetical sealing not practical in most cases. Air and humidity exchange cycles over the day cause water vapor condensation inside when dew point is reached. However, this new concept considerably simplifies the problem. Because expansion in fluids is at least one order of magnitude lower than in gases, adding a small expansion volume is sufficient to account for it. Therefore, the FluidReflex modules may be completely sealed after they are filled with fluid, and there is no air exchange with the atmosphere. In addition, once the fluid has been proven to be harmless to the cell and the rest of the module components, it acts as an encapsulant protecting the components inside the module from degradation. Finally, some authors [10-12] have shown how the immersion of solar cells in certain fluids can improve surface passivation and increase efficiency.
FluidReflex new concept (right) schemes.
In the next section, the optical performance of this new concept is theoretically and experimentally analyzed. The maximum attainable efficiency and acceptance angle for different concentration ratios are shown. In order to corroborate them, several single-unit prototypes have been built. Optical efficiency, angular transmission curve, and cell positioning tolerance have been measured for different concentrations.
The results of the characterization of the optical fluid are presented in Section 3. Additionally, a deeper study can be found in [13]. The FluidReflex compact design (f-number of 0.23, which translates into a total depth of around 3 cm) requires a wide cone of light impinging over the solar cell (with the current design, the light cone semi-angle is 65°). An adequate optimization of the materials and thicknesses of the antirefiection coating (ARC) over the cell becomes compulsory to reduce Fresnel losses at the cell entrance. The method developed to optimize ARC for a wide-angle ray bundles and the experimental results for some of the ARC manufactured are briefly presented in Section 4 although a detailed description can be found in [14]. Issues regarding optics manufacturing and the method used to characterize its quality are addressed in Section 5. Finally, the effects of non-uniform irradiance distribution over the solar cell created by the mirror are also studied (Section 6).
FluidReflex thermal analysis is not covered in this work although a detailed description of modeling and experiments carried out can be found in [15].
2. OPTICAL PERFORMANCE
For a rough idea of the potential of the FluidReflex concept, attainable efficiency can be compared with that of an equivalent Cassegrain configuration. In the latter, light goes through two air-glass interfaces where transmission is 0.96, and it is reflected twice (by the primary and secondary mirrors). If a reflectivity of 0.93 is assumed (which can be obtained using high-quality silver mirrors, as Figure 10 shows), the theoretical attainable optical efficiency of this system is 0.80. Antirefiective coatings in the inner side of the front transparent face and the mirrors could improve this figure but add cost to the system. In a FluidReflex configuration, only one air-glass interface needs to be considered (Fresnel losses at the glass-fluid interface are negligible because the refractive indexes of both materials are almost equal). If the same reflectivity, 0.93, is considered for the single mirror and light transmittance in the fluid is
considered to be 0.98 (which has been experimentally measured for a fluid width similar to the optical path within the fluid and for the wavelengths of interest, Figure 7), the theoretical attainable optical efficiency reaches 0.87 in this case. It should be noted that, although this simple calculation neglects Fresnel losses at the cell entrance for both cases, they will be higher in the Cassegrain configuration (as refractive index changes from n = 1 to n ~ 4) than in FluidReflex (where it changes from n ~ 1.5 to n ~ 4). The losses at the cell entrance are covered more fully in Section 4.
The étendue conservation theorem limits the product of concentration X and the sine of acceptance angle 6 squared. This concentration-acceptance angle product, or CAP, can be understood as a figure of merit for CPV systems because maximizing the concentration will reduce the cell area, whereas maximizing the acceptance angle will reduce the assembling and tracking tolerance requirements, both decreasing the system cost. When a parabolic mirror is used, the étendue conservation leads to Equation (1) where Zand 6 are limited by an expression depending on the parabola f-number/and the refractive index of the medium surrounding the cell n.
Xsm2e = -^ -2 (1) 4/ 2 ( l+^)
Two important conclusions arise from that expression. First, there is an optimum f-number that maximizes system performance (fopt = 0.5). FluidReflex design f-number at the mirror diagonal is slightly lower than the optimum (/design = 0.23), and it was chosen as a trade-off between being small enough to obtain a compact system (reducing fluid volume) and large enough to avoid significant Fresnel losses at the solar cell entrance. Additionally, the selected f-number reduces the thermal sensitivity of the optical performance (see Section 3.2). Second, the fact that there is fluid surrounding the cell multiplies the attainable CAP by n . Figure 5 shows the theoretical acceptance angle as a function of concentration for the f-number of design/design = 0.23 and the refractive index of the fluid 1.475 (at 587.5 nm, 25 °C). Theoretical acceptance angle is defined as the maximum angular cone at the optics entrance that reaches the solar cell.
2 .1 . Optical characterization of the elementary unit
Several elementary-unit prototypes were built to measure the FluidReflex optical performance. They were composed of the same circular parabolic mirror (58 mm in diameter) manufactured by diamond turning and cells with different sizes obtaining different concentration ratios.
Optical efficiency was measured indoors, illuminating the concentrator with collimated light from a xenon solar simulator [16] and using solar cells previously
calibrated as light sensors to determine irradiance both inside and outside the concentrator. Optical efficiency r/opt is defined as
/0UT/1N(1) %pt / O U T ^ I N ^ ' W
where the superscripts "EST" and "OUT" refer to the concentrator. That is, I^}11 is the photocurrent of a solar cell at the output of the concentrator and í¡£ is the photocurrent of a solar cell placed next to the concentrator entrance and it represents the light going into the concentrator. Because the solar cells are used as an irradiance sensor, the values of the photocurrents generated by them under uniform illumination at one sun, /°UT(1) and / ^ ( l ) , need also to be introduced in Equation (2). /£UT(1) was measured with the solar cell covered by a thin layer of fluid to reproduce the fact that the cell is immersed in fluid in the concentrator. In that way, the light transmission at the solar cell entrance is similar under uniform illumination and when it is illuminated by the FluidReflex concentrator. The angular distribution of the light remains different between both situations. Xgs,0
is the system geometrical concentration, which is defined as the ratio between the optics aperture Aentrance and the solar cell area Acell.
Y ^entrance , ^ A g e o — — (Ó)
Acell
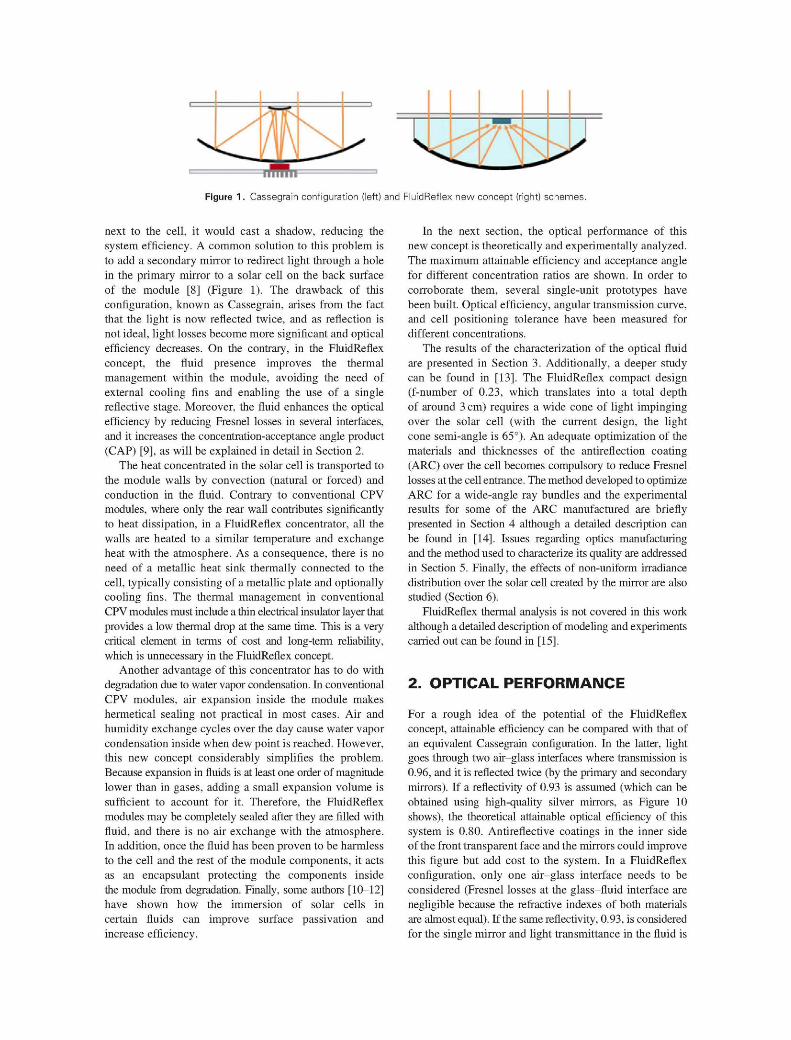
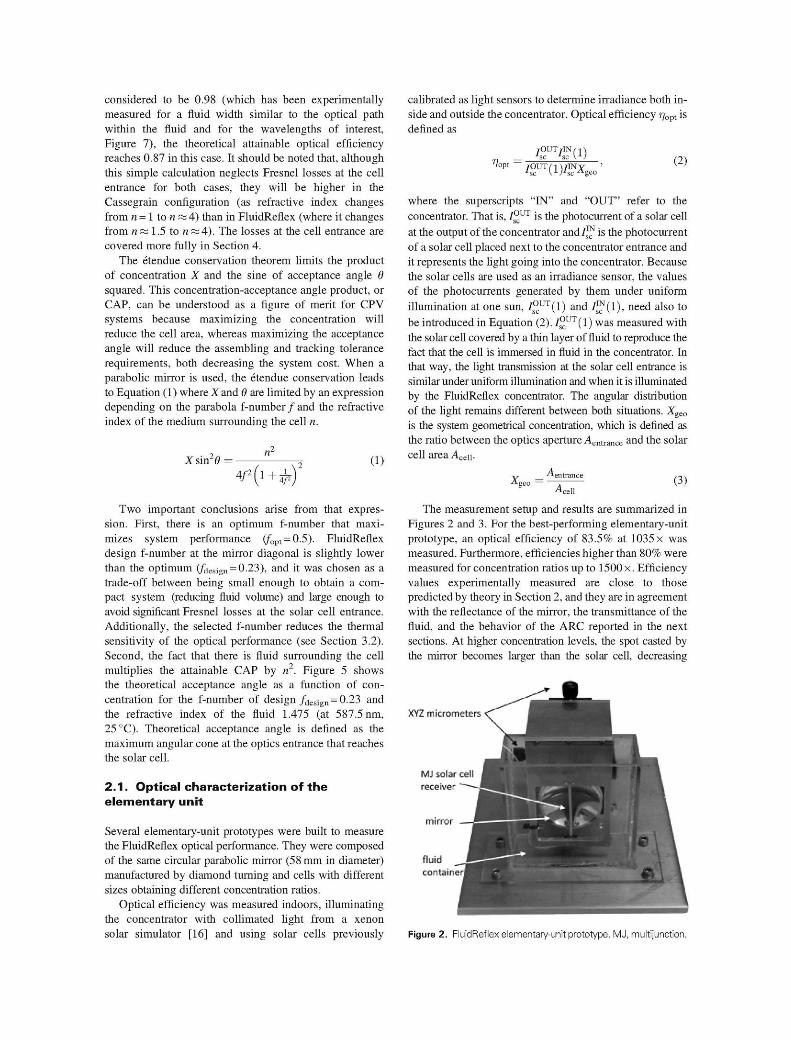
The measurement setup and results are summarized in Figures 2 and 3. For the best-performing elementary-unit prototype, an optical efficiency of 83.5% at 1035 x was measured. Furthermore, efficiencies higher than 80% were measured for concentration ratios up to 1500 x. Efficiency values experimentally measured are close to those predicted by theory in Section 2, and they are in agreement with the reflectance of the mirror, the transmittance of the fluid, and the behavior of the ARC reported in the next sections. At higher concentration levels, the spot casted by the mirror becomes larger than the solar cell, decreasing
Figure 2. FluidReflex elementary-unit prototype. MJ, multijunction.
solar cell d i a m e t e r [ m m j 1.0
0.85
P 0.80
£ 0.7S
% 0.70 "5 •« 0.65 Q. O
0.60
1 0
T T
1-2 1 4 1.6 l .S
spol casted &¥ tria mirror (CCO measureme Mi
.
¥
1000 1500 2000 3500 5000
geometrical concentration, X fleo
Figure 3. Measured optical efficiency (measurement error is
within ±5%). Different concentration ratios were obtained using
the same mirror and different size solar cells.
dramatically system efficiency. As Figure 3 shows, this result is in agreement with the spot size measured during the mirrors' optical characterization (Section 5). Two main developments enabled these high efficiency figures. First, a high reflectivity silver mirror was used for the prototype. Second, a bilayer ARC over the cell had been optimized for the particular angular light distribution casted by FluidReflex optics (Section 4). Given an optical efficiency of 83.5%, currently available 40% efficient MJ solar cells, and considering 5% assembly mismatch losses, a total CPV system conversion efficiency of higher than 31.5% is predicted.
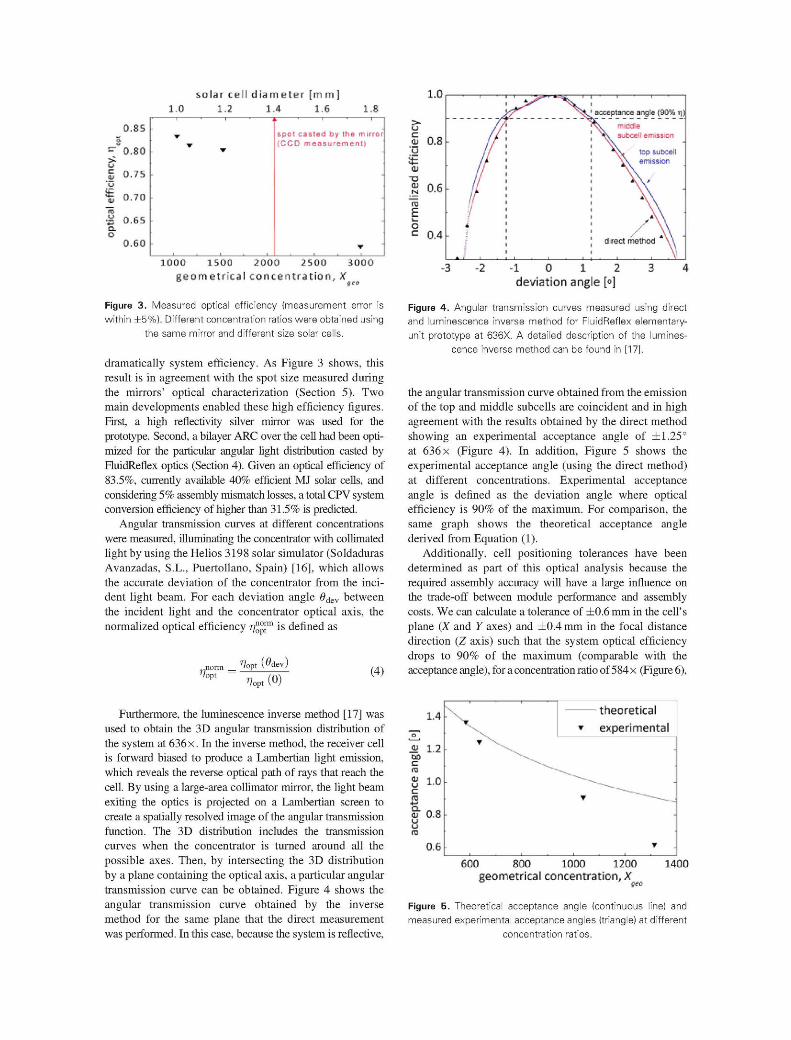
Angular transmission curves at different concentrations were measured, illuminating the concentrator with collimated light by using the Helios 3198 solar simulator (Soldaduras Avanzadas, S.L., Puertollano, Spain) [16], which allows the accurate deviation of the concentrator from the incident light beam. For each deviation angle #dev between the incident light and the concentrator optical axis, the normalized optical efficiency r/"°™ is defined as
/opt
*7opt ("dev.
»?apt (0) (4)
Furthermore, the luminescence inverse method [17] was used to obtain the 3D angular transmission distribution of the system at 636 x. In the inverse method, the receiver cell is forward biased to produce a Lambertian light emission, which reveals the reverse optical path of rays that reach the cell. By using a large-area collimator mirror, the light beam exiting the optics is projected on a Lambertian screen to create a spatially resolved image of the angular transmission function. The 3D distribution includes the transmission curves when the concentrator is turned around all the possible axes. Then, by intersecting the 3D distribution by a plane containing the optical axis, a particular angular transmission curve can be obtained. Figure 4 shows the angular transmission curve obtained by the inverse method for the same plane that the direct measurement was performed. In this case, because the system is reflective,
u QJ
y
r3
E
O.S
0.6
'
if
ll
i
I
M .
•i^r^ ^ ^ v
• . ¡ . i
acceptance angle (90% n)
i>\ mridte V . subcel> emission
*sv to& au&&eli Y \ emission
AVVy
* \ \
/ \V direct method * \ \
i i . V
= 0.4
- 3 - 2 - 1 0 1 2 3 4 deviation angle [°]
Figure 4. Angular transmission curves measured using direct
and luminescence inverse method for FluidReflex elementary-
unit prototype at 636X. A detailed description of the lumines
cence inverse method can be found in [17].
the angular transmission curve obtained from the emission of the top and middle subcells are coincident and in high agreement with the results obtained by the direct method showing an experimental acceptance angle of ±1.25° at 636 x (Figure 4). In addition, Figure 5 shows the experimental acceptance angle (using the direct method) at different concentrations. Experimental acceptance angle is defined as the deviation angle where optical efficiency is 90% of the maximum. For comparison, the same graph shows the theoretical acceptance angle derived from Equation (1).
Additionally, cell positioning tolerances have been determined as part of this optical analysis because the required assembly accuracy will have a large influence on the trade-off between module performance and assembly costs. We can calculate a tolerance of ±0.6 mm in the cell's plane (X and Y axes) and ±0.4 mm in the focal distance direction (Z axis) such that the system optical efficiency drops to 90% of the maximum (comparable with the acceptance angle), for a concentration ratio of 584 x (Figure 6),
c
•z.
1.4
1.2
1.0
0.8
0.6
Y ^ - ^
i - |
tneoreticai » experimental
-
• ~~~~—-—
-
i . i .
600 800 1000 1200 1400 geometrical concentration, X
:r:-r;
Figure 5. Theoretical acceptance angle (continuous line) and
measured experimental acceptance angles (triangle) at different
concentration ratios.
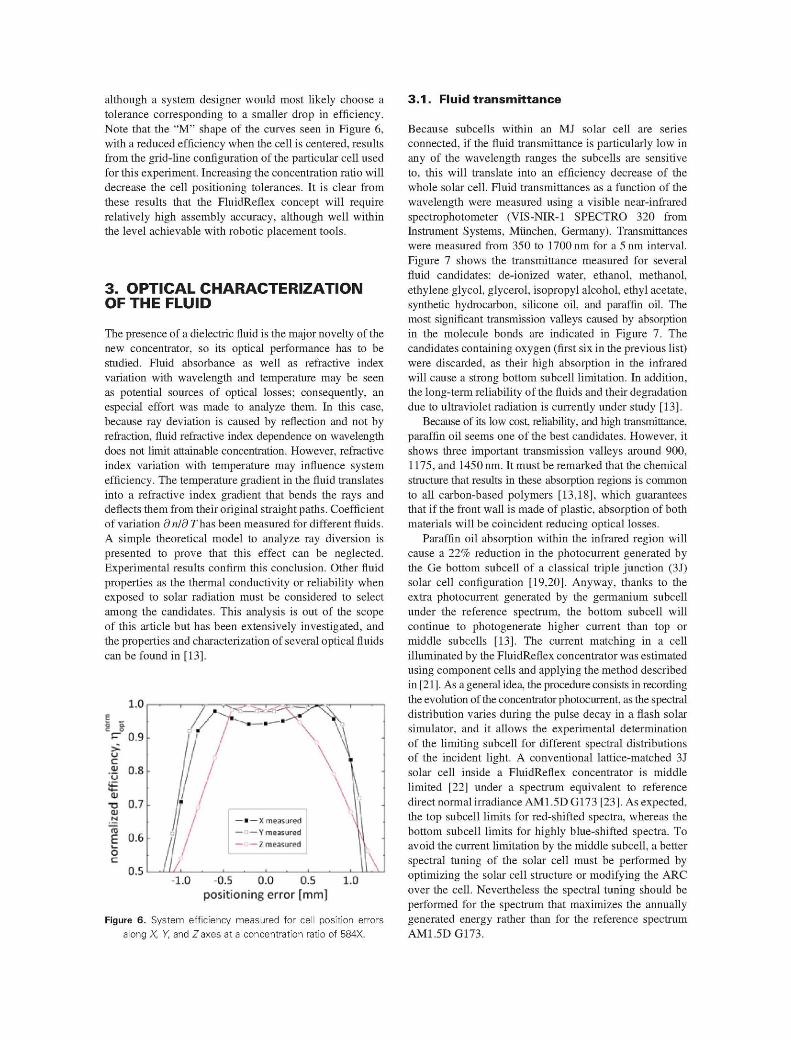
although a system designer would most likely choose a tolerance corresponding to a smaller drop in efficiency. Note that the "M" shape of the curves seen in Figure 6, with a reduced efficiency when the cell is centered, results from the grid-line configuration of the particular cell used for this experiment. Increasing the concentration ratio will decrease the cell positioning tolerances. It is clear from these results that the FluidRefiex concept will require relatively high assembly accuracy, although well within the level achievable with robotic placement tools.
3. OPTICAL CHARACTERIZATION OF THE FLUID
The presence of a dielectric fluid is the major novelty of the new concentrator, so its optical performance has to be studied. Fluid absorbance as well as refractive index variation with wavelength and temperature may be seen as potential sources of optical losses; consequently, an especial effort was made to analyze them. In this case, because ray deviation is caused by reflection and not by refraction, fluid refractive index dependence on wavelength does not limit attainable concentration. However, refractive index variation with temperature may influence system efficiency. The temperature gradient in the fluid translates into a refractive index gradient that bends the rays and deflects them from their original straight paths. Coefficient of variation d nld Thas been measured for different fluids. A simple theoretical model to analyze ray diversion is presented to prove that this effect can be neglected. Experimental results confirm this conclusion. Other fluid properties as the thermal conductivity or reliability when exposed to solar radiation must be considered to select among the candidates. This analysis is out of the scope of this article but has been extensively investigated, and the properties and characterization of several optical fluids can be found in [13].
1.0 E
i I c- 0.9
t % 0.8 u i t •a;
T3 Ol ti
£ i -o •z.
0,7
0.6
0,5 -1.0 -0.5 0.0 0.S
positioning error [mm]
Figure 6. System efficiency measured for cell position errors
along X, V, and Zaxes at a concentration ratio of 584X.
3 .1 . Fluid transmittance
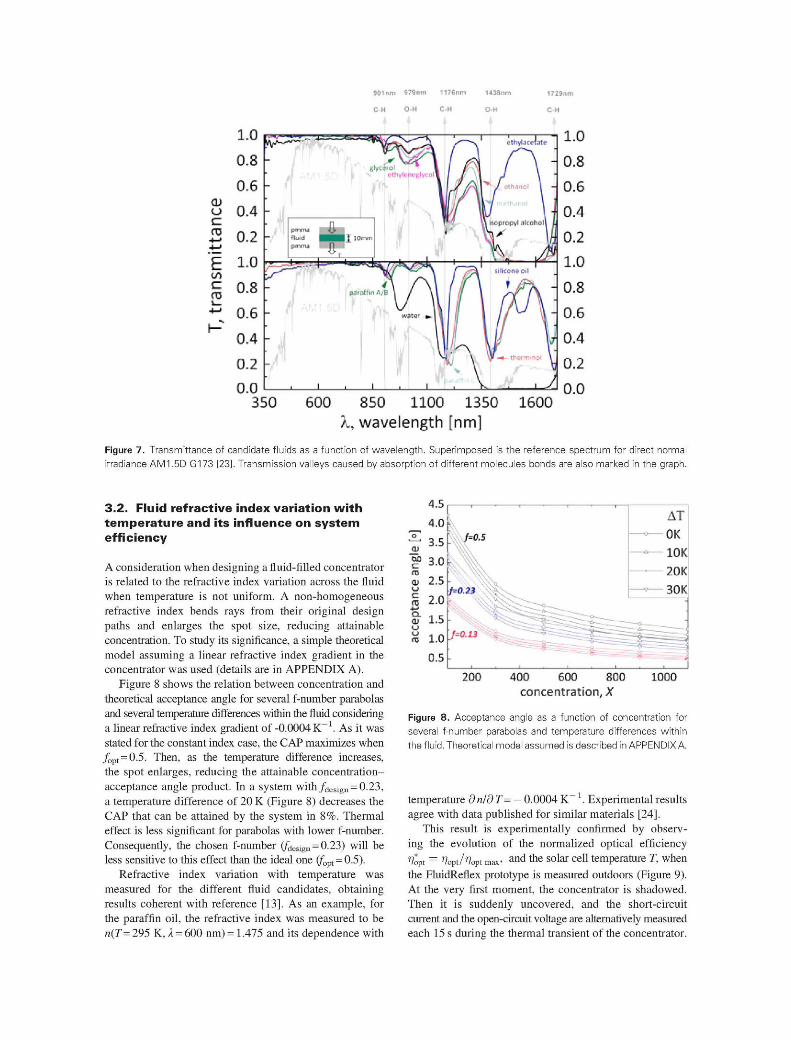
Because subcells within an MJ solar cell are series connected, if the fluid transmittance is particularly low in any of the wavelength ranges the subcells are sensitive to, this will translate into an efficiency decrease of the whole solar cell. Fluid transmittances as a function of the wavelength were measured using a visible near-infrared spectrophotometer (VIS-NIR-1 SPECTRO 320 from Instrument Systems, Miinchen, Germany). Transmittances were measured from 350 to 1700 nm for a 5 nm interval. Figure 7 shows the transmittance measured for several fluid candidates: de-ionized water, ethanol, methanol, ethylene glycol, glycerol, isopropyl alcohol, ethyl acetate, synthetic hydrocarbon, silicone oil, and paraffin oil. The most significant transmission valleys caused by absorption in the molecule bonds are indicated in Figure 7. The candidates containing oxygen (first six in the previous list) were discarded, as their high absorption in the infrared will cause a strong bottom subcell limitation. In addition, the long-term reliability of the fluids and their degradation due to ultraviolet radiation is currently under study [13].
Because of its low cost, reliability, and high transmittance, paraffin oil seems one of the best candidates. However, it shows three important transmission valleys around 900, 1175, and 1450 nm. It must be remarked that the chemical structure that results in these absorption regions is common to all carbon-based polymers [13,18], which guarantees that if the front wall is made of plastic, absorption of both materials will be coincident reducing optical losses.
Paraffin oil absorption within the infrared region will cause a 22% reduction in the photocurrent generated by the Ge bottom subcell of a classical triple junction (3J) solar cell configuration [19,20]. Anyway, thanks to the extra photocurrent generated by the germanium subcell under the reference spectrum, the bottom subcell will continue to photogenerate higher current than top or middle subcells [13]. The current matching in a cell illuminated by the FluidRefiex concentrator was estimated using component cells and applying the method described in [21]. As a general idea, the procedure consists in recording the evolution of the concentrator photocurrent, as the spectral distribution varies during the pulse decay in a flash solar simulator, and it allows the experimental determination of the limiting subcell for different spectral distributions of the incident light. A conventional lattice-matched 3J solar cell inside a FluidRefiex concentrator is middle limited [22] under a spectrum equivalent to reference direct normal irradiance AMI.5DG173 [23]. As expected, the top subcell limits for red-shifted spectra, whereas the bottom subcell limits for highly blue-shifted spectra. To avoid the current limitation by the middle subcell, a better spectral tuning of the solar cell must be performed by optimizing the solar cell structure or modifying the ARC over the cell. Nevertheless the spectral tuning should be performed for the spectrum that maximizes the annually generated energy rather than for the reference spectrum AM1.5DG173.
QJ O C to
E
501 i n WSlffl»
C-H O H
11J«nm
C-H
HJSnm
O H
17 ¡3 fl IH
C-H
n 1.0
350 600 850 1100 1350 X, wavelength [nmj
1600
Figure 7. Transmittance of candidate fluids as a function of wavelength. Superimposed is the reference spectrum for direct norma
irradiance AM1.5D G173 [23]. Transmission valleys caused by absorption of different molecules bonds are also marked in the graph.
3.2. Fluid refractive index variation with temperature and its influence on system efficiency
A consideration when designing a fluid-filled concentrator is related to the refractive index variation across the fluid when temperature is not uniform. A non-homogeneous refractive index bends rays from their original design paths and enlarges the spot size, reducing attainable concentration. To study its significance, a simple theoretical model assuming a linear refractive index gradient in the concentrator was used (details are in APPENDIX A).
Figure 8 shows the relation between concentration and theoretical acceptance angle for several f-number parabolas and several temperature differences within the fluid considering a linear refractive index gradient of -0.0004 K~~ . As it was stated for the constant index case, the CAP maximizes when ^ p t = 0.5. Then, as the temperature difference increases, the spot enlarges, reducing the attainable concentration-acceptance angle product. In a system with /design = 0.23, a temperature difference of 20 K (Figure 8) decreases the CAP that can be attained by the system in 8%. Thermal effect is less significant for parabolas with lower f-number. Consequently, the chosen f-number (/design = 0.23) will be less sensitive to this effect than the ideal one (fopt = 0.5).
Refractive index variation with temperature was measured for the different fluid candidates, obtaining results coherent with reference [13], As an example, for the paraffin oil, the refractive index was measured to be n(T= 295 K, X = 600 nm) = 1.475 and its dependence with
200 400 600 800 concentration, X
1000
Figure 8. Acceptance angle as a function of concentration for
several f-number parabolas and temperature differences within
the fluid. Theoretical model assumed is described in APPENDIX A.
temperature d nld T= — 0.0004 K~ l . Experimental results agree with data published for similar materials [24].
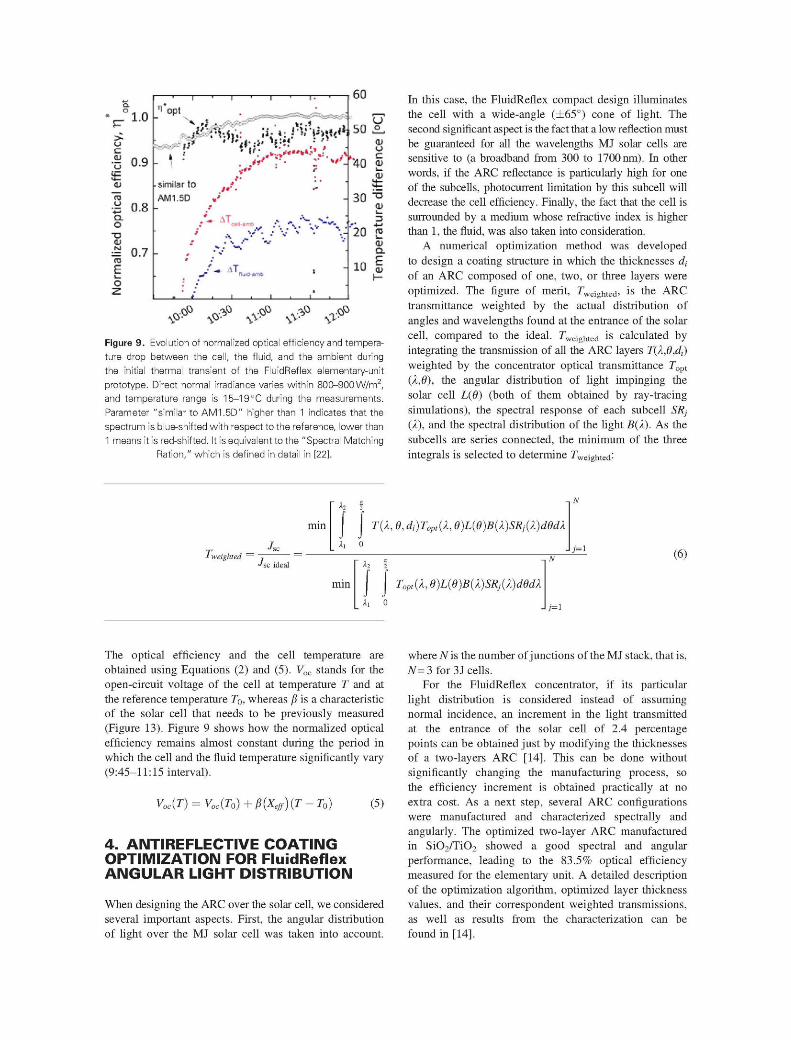
This result is experimentally confirmed by observing the evolution of the normalized optical efficiency '/apt ~ 'Jopt/'Jopt max' a nd m e solar cell temperature T, when the FluidReflex prototype is measured outdoors (Figure 9). At the very first moment, the concentrator is shadowed. Then it is suddenly uncovered, and the short-circuit current and the open-circuit voltage are alternatively measured each 15 s during the thermal transient of the concentrator.
ir I 0.9 £ (TJ
•y o.s o "a
= 0.7 ra £ o
opt
* : • '
similar to
AM1.5D
* / * . . • "
/ - AT
/ - -.1.
_« i I I I 1_
60
50 £ . c u c
4 0 a>
¡g 30 ^
ai
20 £
10 I
^ ¿p J? ¿p Jfi Figure 9. Evolution of normalized optical efficiency and tempera
ture drop between the cell, the fluid, and the ambient during
the initial thermal transient of the FluidReflex elementary-unit
prototype. Direct normal irradiance varies within 800-900W/m2,
and temperature range is 15-19°C during the measurements.
Parameter "similar to AM1.5D" higher than 1 indicates that the
spectrum is blue-shifted with respect to the reference, lower than
1 means it is red-shifted. It is equivalent to the "Spectral Matching
Ration," which is defined in detail in [22].
In this case, the FluidReflex compact design illuminates the cell with a wide-angle (±65°) cone of light. The second significant aspect is the fact that a low reflection must be guaranteed for all the wavelengths MJ solar cells are sensitive to (a broadband from 300 to 1700 nm). In other words, if the ARC reflectance is particularly high for one of the subcells, photocurrent limitation by this subcell will decrease the cell efficiency. Finally, the fact that the cell is surrounded by a medium whose refractive index is higher than 1, the fluid, was also taken into consideration.
A numerical optimization method was developed to design a coating structure in which the thicknesses d¡ of an ARC composed of one, two, or three layers were optimized. The figure of merit, rweighted, is the ARC transmittance weighted by the actual distribution of angles and wavelengths found at the entrance of the solar cell, compared to the ideal. rweighted is calculated by integrating the transmission of all the ARC layers T(X,8,d¡) weighted by the concentrator optical transmittance T0„t
{XJf), the angular distribution of light impinging the solar cell L(8) (both of them obtained by ray-tracing simulations), the spectral response of each subcell SRj (X), and the spectral distribution of the light B{X). As the subcells are series connected, the minimum of the three integrals is selected to determine rweighted:
* 2 2
T{X,8,di)Topt{X,8)L{8)B{X)SRj{X)d8dX
h o ' weighted —
-I 7-1
•¿2 2
Topt{X,8)L{8)B{X)SRj{X)d8dX
Xi 0 ; = i
m
The optical efficiency and the cell temperature are obtained using Equations (2) and (5). Voc stands for the open-circuit voltage of the cell at temperature T and at the reference temperature T0, whereas f} is a characteristic of the solar cell that needs to be previously measured (Figure 13). Figure 9 shows how the normalized optical efficiency remains almost constant during the period in which the cell and the fluid temperature significantly vary (9:45-11:15 interval).
Voe(T)=Voc(To)+P(X^)(T-To) (5)
4. ANTIREFLECTIVE COATING OPTIMIZATION FOR FluidReflex ANGULAR LIGHT DISTRIBUTION
When designing the ARC over the solar cell, we considered several important aspects. First, the angular distribution of light over the MJ solar cell was taken into account.
where N is the number of junctions of the MJ stack, that is, N= 3 for 3J cells.
For the FluidReflex concentrator, if its particular light distribution is considered instead of assuming normal incidence, an increment in the light transmitted at the entrance of the solar cell of 2.4 percentage points can be obtained just by modifying the thicknesses of a two-layers ARC [14]. This can be done without significantly changing the manufacturing process, so the efficiency increment is obtained practically at no extra cost. As a next step, several ARC configurations were manufactured and characterized spectrally and angularly. The optimized two-layer ARC manufactured in Si02/Ti02 showed a good spectral and angular performance, leading to the 83.5% optical efficiency measured for the elementary unit. A detailed description of the optimization algorithm, optimized layer thickness values, and their correspondent weighted transmissions, as well as results from the characterization can be found in [14].
5. MANUFACTURING OF CONCENTRATING OPTICS
This section summarizes different issues related to FluidReflex optics manufacturing. Prototype mirrors for FluidReflex concentrator were manufactured by plastic injection, as this is a promising low-cost technology that may, in the future, enable the fabrication of the complete module rear wall (including the array of parabolas) in a single injection. Later, the injected pieces were mirrored by evaporating aluminum or silver.
5.1 . Silver and aluminum mirrors
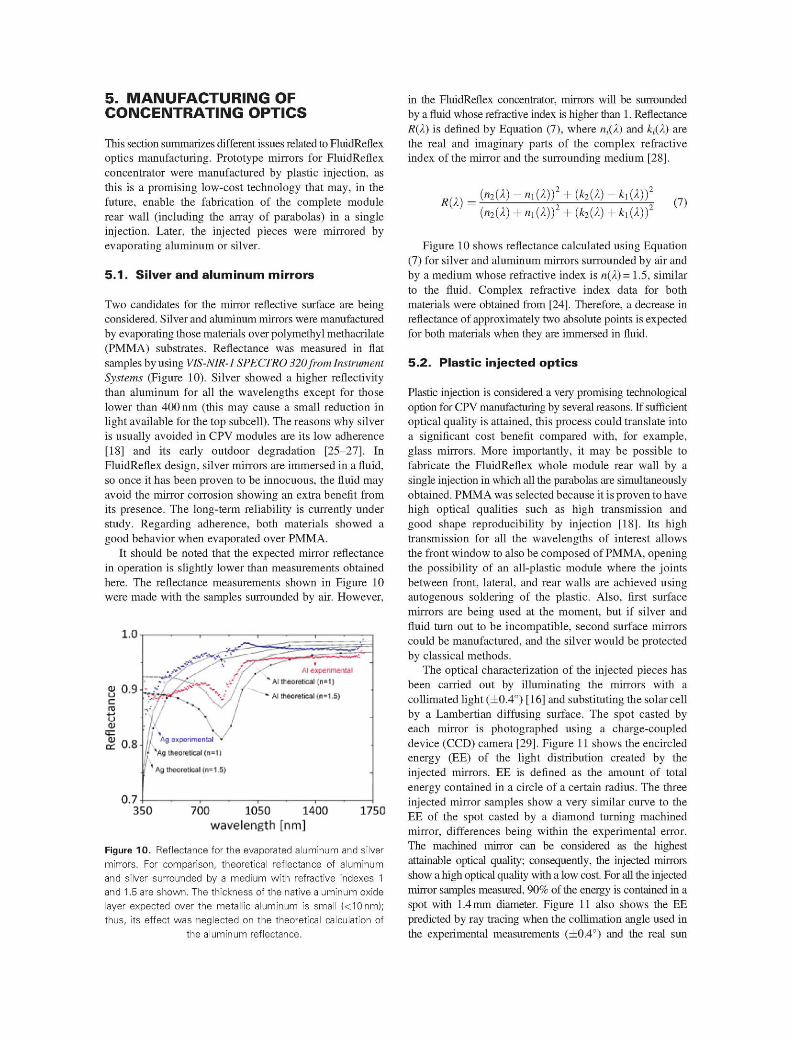
Two candidates for the mirror reflective surface are being considered. Silver and aluminum mirrors were manufactured by evaporating those materials over polymethyl methacrilate (PMMA) substrates. Reflectance was measured in flat samples by using VlS-NlR-1 SPECTRO 320 from Instrument Systems (Figure 10). Silver showed a higher reflectivity than aluminum for all the wavelengths except for those lower than 400 nm (this may cause a small reduction in light available for the top subcell). The reasons why silver is usually avoided in CPV modules are its low adherence [18] and its early outdoor degradation [25-27]. In FluidReflex design, silver mirrors are immersed in a fluid, so once it has been proven to be innocuous, the fluid may avoid the mirror corrosion showing an extra benefit from its presence. The long-term reliability is currently under study. Regarding adherence, both materials showed a good behavior when evaporated over PMMA.
It should be noted that the expected mirror reflectance in operation is slightly lower than measurements obtained here. The reflectance measurements shown in Figure 10 were made with the samples surrounded by air. However,
0.7
wtnsorMiüi(n-i,5)
111 Ag ejperimerral
If lAji|iMra|iral(i|=1)
theoretical (n=1.5) I 'AgK
350 700 1050 1400 wavelength [nm]
1750
Figure 10. Reflectance for the evaporated aluminum and silver
mirrors. For comparison, theoretical reflectance of aluminum
and silver surrounded by a medium with refractive indexes 1
and 1.5 are shown. The thickness of the native aluminum oxide
layer expected over the metallic aluminum is small (<10nm);
thus, its effect was neglected on the theoretical calculation of
the aluminum reflectance.
in the FluidReflex concentrator, mirrors will be surrounded by a fluid whose refractive index is higher than 1. Reflectance R(X) is defined by Equation (7), where n¡(X) and k¡(Á) are the real and imaginary parts of the complex refractive index of the mirror and the surrounding medium [28].
R(X) (n2(l) + ni(l))
2 + (k2(l) + hiX))2 (7)
Figure 10 shows reflectance calculated using Equation (7) for silver and aluminum mirrors surrounded by air and by a medium whose refractive index is n{X) = 1.5, similar to the fluid. Complex refractive index data for both materials were obtained from [24]. Therefore, a decrease in reflectance of approximately two absolute points is expected for both materials when they are immersed in fluid.
5.2. Plastic injected optics
Plastic injection is considered a very promising technological option for CPV manufacturing by several reasons. If sufficient optical quality is attained, this process could translate into a significant cost benefit compared with, for example, glass mirrors. More importantly, it may be possible to fabricate the FluidReflex whole module rear wall by a single injection in which all the parabolas are simultaneously obtained. PMMA was selected because it is proven to have high optical qualities such as high transmission and good shape reproducibility by injection [18]. Its high transmission for all the wavelengths of interest allows the front window to also be composed of PMMA, opening the possibility of an all-plastic module where the joints between front, lateral, and rear walls are achieved using autogenous soldering of the plastic. Also, first surface mirrors are being used at the moment, but if silver and fluid turn out to be incompatible, second surface mirrors could be manufactured, and the silver would be protected by classical methods.
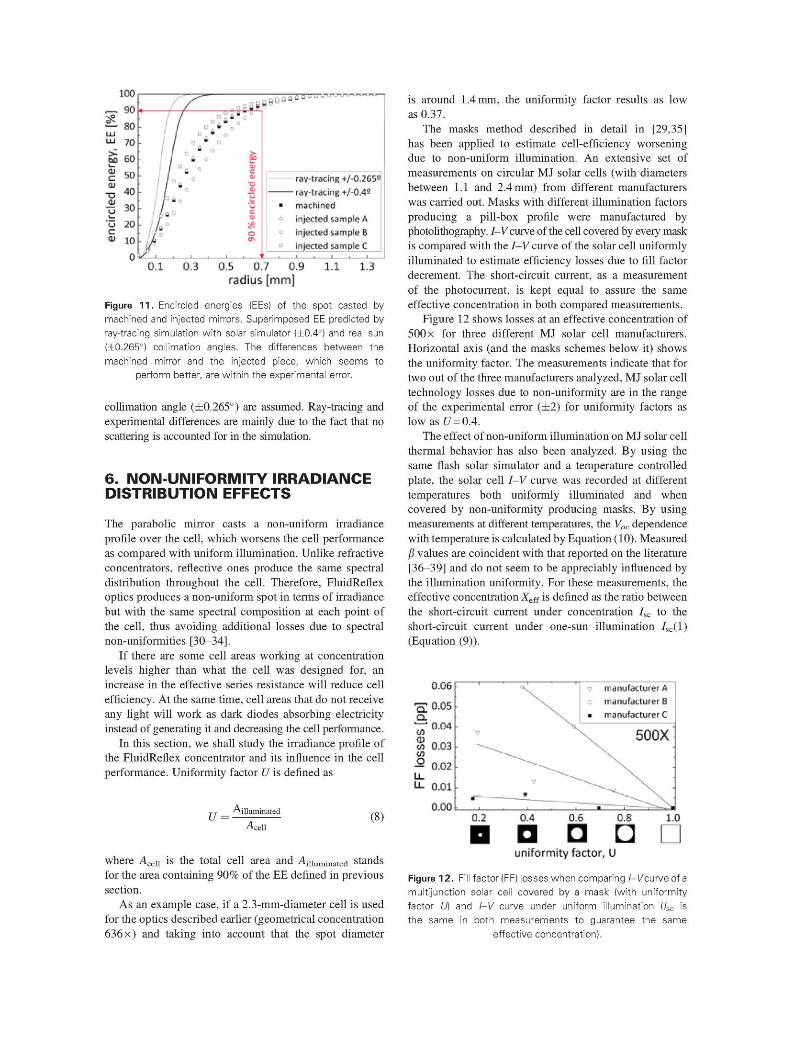
The optical characterization of the injected pieces has been carried out by illuminating the mirrors with a collimated light (±0.4°) [16] and substituting the solar cell by a Lambertian diffusing surface. The spot casted by each mirror is photographed using a charge-coupled device (CCD) camera [29]. Figure 11 shows the encircled energy (EE) of the light distribution created by the injected mirrors. EE is defined as the amount of total energy contained in a circle of a certain radius. The three injected mirror samples show a very similar curve to the EE of the spot casted by a diamond turning machined mirror, differences being within the experimental error. The machined mirror can be considered as the highest attainable optical quality; consequently, the injected mirrors show a high optical quality with a low cost. For all the injected mirror samples measured, 90% of the energy is contained in a spot with 1.4 mm diameter. Figure 11 also shows the EE predicted by ray tracing when the collimation angle used in the experimental measurements (±0.4°) and the real sun
g g o a H S ^ 1 ™
ray-tracing +/-0.2S5^ -ray-tracing +/-0.4S machined injected sample A injected sample B injected sample C
0.5 0.7 0.9 radius [mm]
1.1 1.3
Figure 11 . Encircled energies (EEs) of the spot casted by
machined and injected mirrors. Superimposed EE predicted by
ray-tracing simulation with solar simulator (±0.4°) and real sun
(±0.265°) collimation angles. The differences between the
machined mirror and the injected piece, which seems to
perform better, are within the experimental error.
collimation angle (±0.265°) are assumed. Ray-tracing and experimental differences are mainly due to the fact that no scattering is accounted for in the simulation.
6. NON-UNIFORMITY IRRADIANCE DISTRIBUTION EFFECTS
The parabolic mirror casts a non-uniform irradiance profile over the cell, which worsens the cell performance as compared with uniform illumination. Unlike refractive concentrators, reflective ones produce the same spectral distribution throughout the cell. Therefore, FluidRefiex optics produces a non-uniform spot in terms of irradiance but with the same spectral composition at each point of the cell, thus avoiding additional losses due to spectral non-uniformities [30-34].
If there are some cell areas working at concentration levels higher than what the cell was designed for, an increase in the effective series resistance will reduce cell efficiency. At the same time, cell areas that do not receive any light will work as dark diodes absorbing electricity instead of generating it and decreasing the cell performance.
In this section, we shall study the irradiance profile of the FluidRefiex concentrator and its influence in the cell performance. Uniformity factor U is defined as
U-- (8)
where Acell is the total cell area and Ailluminated stands for the area containing 90% of the EE defined in previous section.
As an example case, if a 2.3-mm-diameter cell is used for the optics described earlier (geometrical concentration 636 x) and taking into account that the spot diameter
is around 1.4 mm, the uniformity factor results as low as 0.37.
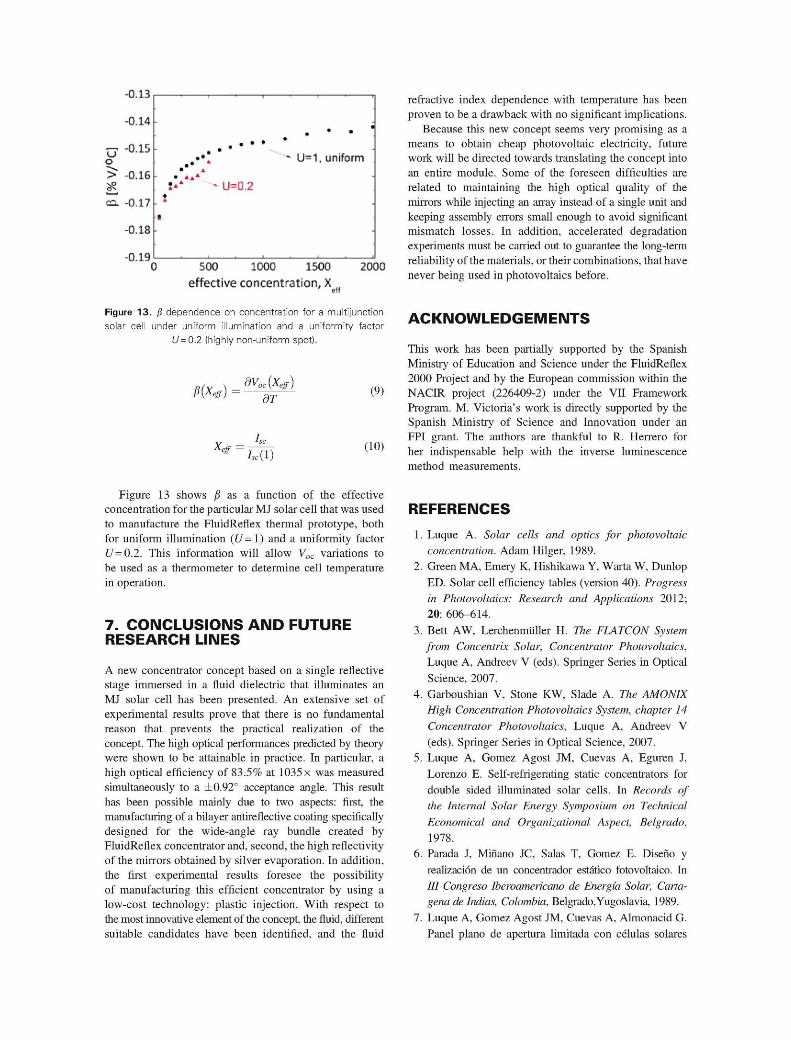
The masks method described in detail in [29,35] has been applied to estimate cell-efficiency worsening due to non-uniform illumination. An extensive set of measurements on circular MJ solar cells (with diameters between 1.1 and 2.4 mm) from different manufacturers was carried out. Masks with different illumination factors producing a pill-box profile were manufactured by photolithography. I-V curve of the cell covered by every mask is compared with the I-V curve of the solar cell uniformly illuminated to estimate efficiency losses due to fill factor decrement. The short-circuit current, as a measurement of the photocurrent, is kept equal to assure the same effective concentration in both compared measurements.
Figure 12 shows losses at an effective concentration of 500x for three different MJ solar cell manufacturers. Horizontal axis (and the masks schemes below it) shows the uniformity factor. The measurements indicate that for two out of the three manufacturers analyzed, MJ solar cell technology losses due to non-uniformity are in the range of the experimental error (±2) for uniformity factors as low as /7=0.4.
The effect of non-uniform illumination on MJ solar cell thermal behavior has also been analyzed. By using the same flash solar simulator and a temperature controlled plate, the solar cell I-V curve was recorded at different temperatures both uniformly illuminated and when covered by non-uniformity producing masks. By using measurements at different temperatures, the Voc dependence with temperature is calculated by Equation (10). Measured /? values are coincident with that reported on the literature [36-39] and do not seem to be appreciably influenced by the illumination uniformity. For these measurements, the effective concentration Xeff is defined as the ratio between the short-circuit current under concentration /sc to the short-circuit current under one-sun illumination /sc(l) (Equation (9)).
0 0 6
D. Q.
tf> U t/J tn O
LL Li_
0.05
004
U.Uá
0.02
0.01
0.00
V
• •7
-
•
manufacturer A manufacturer B manufacturare
500X'
"i r N 0.2 0.4 0.6 0.8 1.0
D • • • uniformity factor, U
Figure 12. Fill factor (FF) losses when comparing /- l /curveof a
multijunction solar cell covered by a mask (with uniformity
factor U) and I-V curve under uniform illumination (/sc is
the same in both measurements to guarantee the same
effective concentration).
-0.14
77 -0-15 «J o > -0.16 £jv
fia- -0.17
-0.18
-0 1Q
. • • " " . • *
. • ' A *
» i . '
. :** • u=o.2 . Í
i
i i • i
. * • * * U=1, uniform
-
•
500 1000 1500 effective concentration, X
2000
en
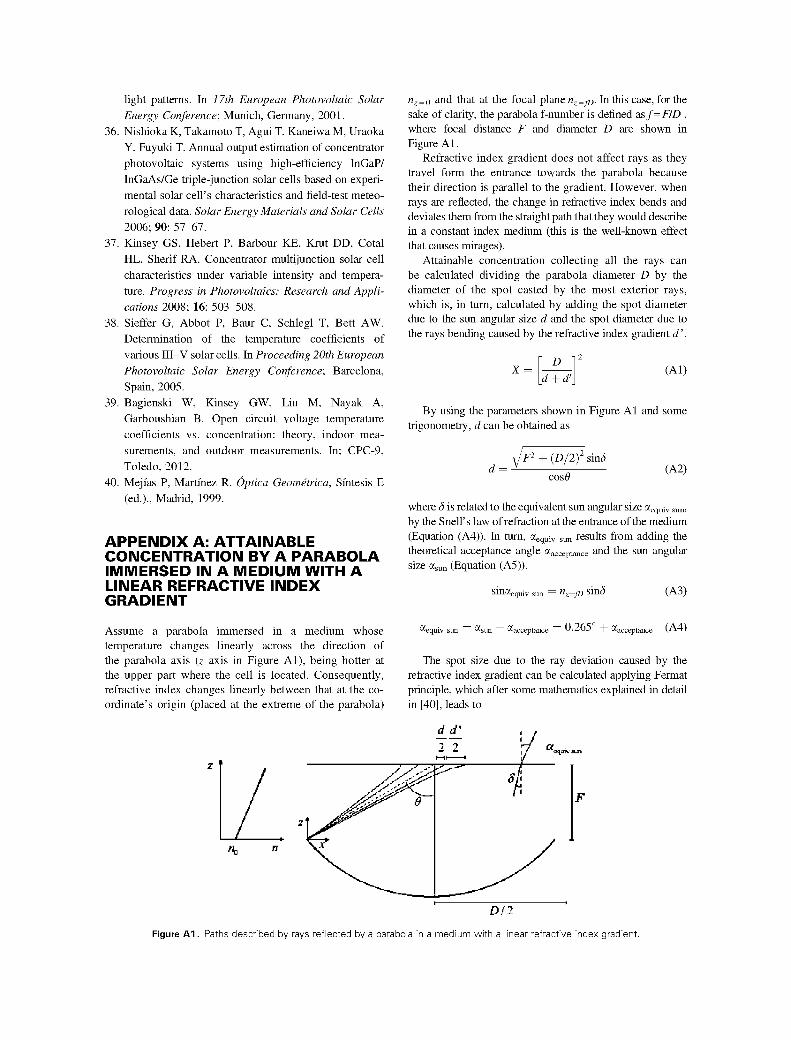
Figure 13. ¡¡ dependence on concentration for a multijunction
solar cell under uniform illumination and a uniformity factor
U = 0.2 (highly non-uniform spot).
P(X-dVocM
dT
X eff
(9)
(10)
refractive index dependence with temperature has been proven to be a drawback with no significant implications.
Because this new concept seems very promising as a means to obtain cheap photovoltaic electricity, future work will be directed towards translating the concept into an entire module. Some of the foreseen difficulties are related to maintaining the high optical quality of the mirrors while injecting an array instead of a single unit and keeping assembly errors small enough to avoid significant mismatch losses. In addition, accelerated degradation experiments must be carried out to guarantee the long-term reliability of the materials, or their combinations, that have never being used in photovoltaics before.
ACKNOWLEDGEMENTS
This work has been partially supported by the Spanish Ministry of Education and Science under the FluidReflex 2000 Project and by the European commission within the NACIR project (226409-2) under the VII Framework Program. M. Victoria's work is directly supported by the Spanish Ministry of Science and Innovation under an FPI grant. The authors are thankful to R. Herrero for her indispensable help with the inverse luminescence method measurements.
Figure 13 shows f} as a function of the effective concentration for the particular MJ solar cell that was used to manufacture the FluidReflex thermal prototype, both for uniform illumination (U= 1) and a uniformity factor [/=0.2. This information will allow Voc variations to be used as a thermometer to determine cell temperature in operation.
7. CONCLUSIONS AND FUTURE RESEARCH LINES
A new concentrator concept based on a single reflective stage immersed in a fluid dielectric that illuminates an MJ solar cell has been presented. An extensive set of experimental results prove that there is no fundamental reason that prevents the practical realization of the concept. The high optical performances predicted by theory were shown to be attainable in practice. In particular, a high optical efficiency of 83.5% at 1035x was measured simultaneously to a ±0.92° acceptance angle. This result has been possible mainly due to two aspects: first, the manufacturing of a bilayer antirefiective coating specifically designed for the wide-angle ray bundle created by FluidReflex concentrator and, second, the high reflectivity of the mirrors obtained by silver evaporation. In addition, the first experimental results foresee the possibility of manufacturing this efficient concentrator by using a low-cost technology: plastic injection. With respect to the most innovative element of the concept, the fluid, different suitable candidates have been identified, and the fluid
REFERENCES
1. Luque A. Solar cells and optics for photovoltaic concentration. Adam Hilger, 1989.
2. Green MA, Emery K, Hishikawa Y, Warta W, Dunlop ED. Solar cell efficiency tables (version 40). Progress in Photovoltaics: Research and Applications 2012; 20: 606-614.
3. Bett AW, Lerchenmüller H. The FLATCON System from Concentrix Solar, Concentrator Photovoltaics, Luque A, Andreev V (eds). Springer Series in Optical Science, 2007.
4. Garboushian V, Stone KW, Slade A. The AMONIX High Concentration Photovoltaics System, chapter 14 Concentrator Photovoltaics, Luque A, Andreev V (eds). Springer Series in Optical Science, 2007.
5. Luque A, Gomez Agost JM, Cuevas A, Eguren J, Lorenzo E. Self-refrigerating static concentrators for double sided illuminated solar cells. In Records of the Internal Solar Energy Symposium on Technical Economical and Organizational Aspect, Belgrado, 1978.
6. Parada J, Miñano JC, Salas T, Gomez E. Diseño y realización de un concentrador estático fotovoltaico. In 111 Congreso Iberoamericano de Energía Solar, Cartagena de Indias, Colombia, Belgrado,Yugoslavia, 1989.
7. Luque A, Gomez Agost JM, Cuevas A, Almonacid G. Panel plano de apertura limitada con células solares

bifaciales de alta eficiencia. In // Seminario Internacional sobre Energías no Convencionales con énfasis en Energía Solar, Miami (Florida), 1982.
8. Mauk CE, Prengle HW, Sun EC-H. Optical and thermal analysis of a Cassegrainian solar concentrator. Solar Energy 1979; 23: 157-167.
9. Winston R, Miñano JC, Benitez P. Nonimaging Optics, 2005.
10. Ugumori T, Ikeya M. Efficiency increase of solar cells operated in dielectric liquid. Japanese Journal of Applied Physics 1981; 20: 77-80.
11. Abrahamyan YA, Serago VI, Aroutiounian VM, Anisimova ID, Stafeev VI, Karamian GG, Martoyan GA, Mouradyan AA. The efficiency of solar cells immersed in liquid dielectrics. Solar Energy Materials and Solar Cells 2002; 73: 367-375.
12. Sheldon MT, Eisler CN, Atwater HA. Gaas passivation with trioctylphosphine sulfide for enhanced solar cell efficiency and durability. Advanced Energy Materials 2012; 2: 339-344.
13. VictoriaM, Askins S, Domínguez CC, Antón I, Sala G. Durability of dielectric fluids for concentration photovoltaic systems, submitted to Solar Energy Materials & Solar Cells June 2013; 113: 31-36
14. Victoria M, Domínguez C, Antón I, Sala G. Antireflective coatings for multijunction solar cells under wide-angle ray bundles. Optics Express 2012; 20: 8136.
15. Victoria M, Chiappori E, Askins S, Domínguez D, Antón I, Sala G. Finite elements model for thermal analysis of FluidReflex CPV system. In 25th EPVSEC & 5th WCPEC, Valencia, 2010.
16. Domínguez C, Antón I, Sala G. Solar simulator for concentrator photovoltaic systems. Optics Express 2008; 16: 14894-14901.
17. Herrero R, Domínguez C, Askins S, Antón I, Sala G. Two-dimensional angular transmission characterization of CPV modules. Optics Express 2010; 18: A499-A505.
18. Baurner S. Handbook of Plastics Optics. Wiley-Vch, 2005.
19. King RR, Boca A, Hong WP, Liu XQ, Bhusari D, Larrabee D, Edmondson KM, Law DC, Fetzer CM, Mesropian S. Band-gap-engineered architectures for high-efficiency multijunction concentrator solar cells. In Proceedings of the 24th European Photovoltaic Solar Energy Conference; 2009; 55-61.
20. Guter W, Schone J, Philipps SP, Steiner M, Siefer G, Wekkeli A, Welser E, Oliva E, Bett AW, Dimroth F. Current-matched triple-junction solar cell reaching 41.1% conversion efficiency under concentrated sunlight. Applied Physics Letters 2009; 94: 223504.
21. Domínguez C, Antón I, Sala G, Askins S. Current-matching estimation for multijunction cells within
a CPV module by means of component cells. Progress in Photovoltaics: Research and Applications 2012, n/a-n/a. DOI: 10.1002/pip.2227
22. Victoria M, Domínguez C, Askins S, Antón I, Sala G. Characterizing FluidReflex optical transfer function. Japanese Journal of Applied Physics 2012; 51: 10ND06.
23. ASTM G173 standard tables for reference solar spectral irradiances. AM15D.
24. Weber MJ. Handbook of Optical Materials. CRC Press, 2003.
25. Jorgensen G, Kennedy CE, King C, TerwiUiger K. Optical durability testing of candidate solar mirrors. 2000.
26. Kennedy CE, TerwiUiger K. Optical durability of candidate solar reflectors. Journal of Solar Energy Engineering 2005; 127: 262.
27. Spencer M, Finot M. Field testing for reliability assessment of new CPV. In Proceedings ICSC-5.; Palm Desert, EEUU, 2008.
28. Hecht E. Optics. Addison-Wesley, 2002. 29. Herrero R, Victoria M, Domínguez C, Askins S, Antón
I, Sala G. Concentration photovoltaic optical system irradiance distribution measurements and its effect on multi-junction solar cells. Progress in Photovoltaics: Research and Applications 2011; 20: 423^-30.
30. Garcia I, Algora C, Rey-Stolle I, Galiana B. Study of non-uniform light profiles on high concentration solar cells using quasi-3D distributed models. In 33rd IEEE Photovoltaic Specialists Conference; 2008; 1-6.
31. Kurtz SR, Friedman DJ, Olson JM. The effect of chromatic aberrations on two-junction, two-terminal, devices on a concentrator system. In Conference Record of the Twenty Fourth IEEE Photovoltaic Specialists Conference; 1994; Vol. 2, pp. 1791-1794 vol.2.
32. Cotal H, Sherif R. The effects of chromatic aberration on the performance of GalnP/GaAs/Ge concentrator solar cells from Fresnel optics. In Conference Record of the 31st IEEE Photovoltaic Specialist Conference; 2005; pp. 747-750.
33. Kurtz SR, O'Neill MJ. Estimating and controlling chromatic aberration losses for two-junction, two-terminal devices in refractive concentrator systems. In Conference Record of the 25th IEEE Photovoltaic Specialists Conference; 1996; pp. 361-364.
34. Victoria M, Herrero R, Domínguez C, Antón I, Askins S, Sala G. Characterization of the spatial distribution of irradiance and spectrum in concentrating photovoltaic systems and their effect on multi-junction solar cells. Progress in Photovoltaics: Research and Applications 2011. DOI: 10.1002/pip.ll83
35. Antón I, Solar R, Sala G, Pachón G. I-V testing of concentration modules and cells with non-uniform
light patterns. In 17th European Photovoltaic Solar Energy Conference; Munich, Germany, 2001.
36. Nishioka K, Takamoto T, Agui T, Kaneiwa M, Uraoka Y, Fuyuki T. Annual output estimation of concentrator photovoltaic systems using high-efficiency InGaP/ InGaAs/Ge triple-junction solar cells based on experimental solar cell's characteristics and field-test meteorological data. Solar Energy Materials and Solar Cells 2006; 90: 57-67.
37. Kinsey GS, Hebert P, Barbour KE, Krut DD, Cotal HL, Sherif RA. Concentrator multijunction solar cell characteristics under variable intensity and temperature. Progress in Photovoltaics: Research and Applications 2008; 16: 503-508.
38. Sieffer G, Abbot P, Baur C, Schlegl T, Bett AW. Determination of the temperature coefficients of various III-V solar cells. In Proceeding 20th European Photovoltaic Solar Energy Conference; Barcelona, Spain, 2005.
39. Bagienski W, Kinsey GW, Liu M, Nayak A, Garboushian B. Open circuit voltage temperature coefficients vs. concentration: theory, indoor measurements, and outdoor measurements. In; CPC-9, Toledo, 2012.
40. Mejías P, Martínez R. Optica Geométrica, Síntesis E (ed.)., Madrid, 1999.
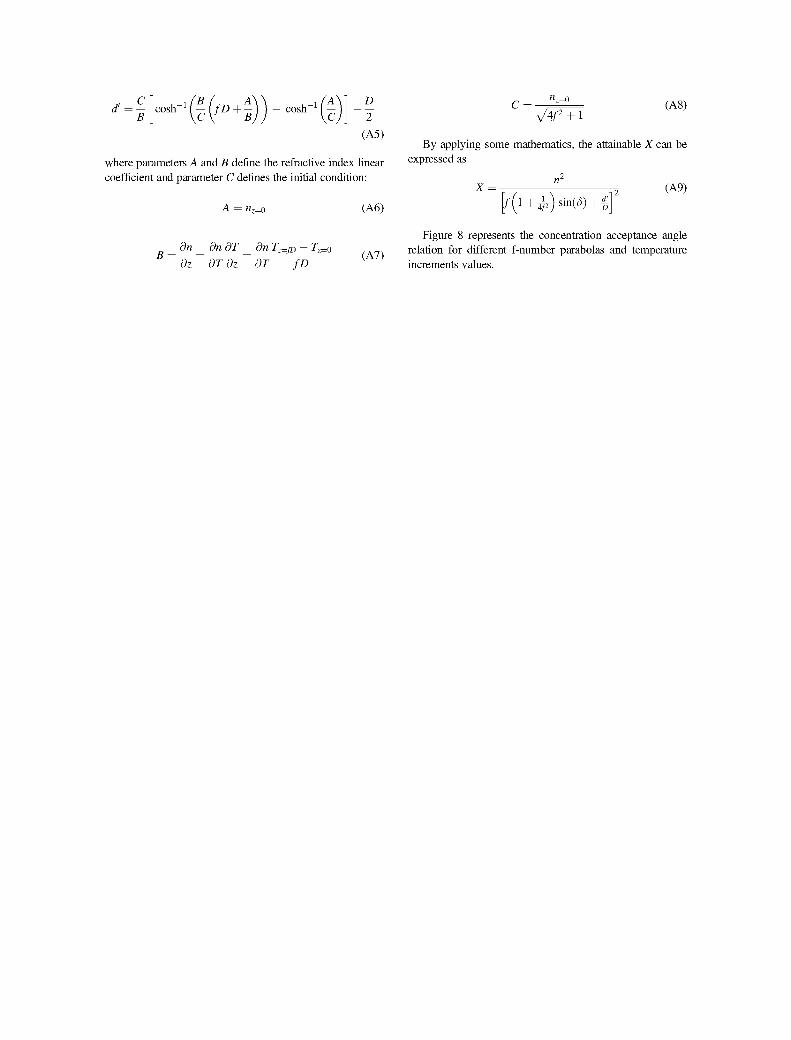
APPENDIX A: ATTAINABLE CONCENTRATION BY A PARABOLA IMMERSED IN A MEDIUM WITH A LINEAR REFRACTIVE INDEX GRADIENT
nz = 0 and that at the focal plane WZ=/E>. In this case, for the sake of clarity, the parabola f-number is defined asf=F/D , where focal distance F and diameter D are shown in Figure Al.
Refractive index gradient does not affect rays as they travel form the entrance towards the parabola because their direction is parallel to the gradient. However, when rays are reflected, the change in refractive index bends and deviates them from the straight path that they would describe in a constant index medium (this is the well-known effect that causes mirages).
Attainable concentration collecting all the rays can be calculated dividing the parabola diameter D by the diameter of the spot casted by the most exterior rays, which is, in turn, calculated by adding the spot diameter due to the sun angular size d and the spot diameter due to the rays bending caused by the refractive index gradient d'.
X = D
d + d' (Al)
By using the parameters shown in Figure Al and some trigonometry, d can be obtained as
d = F2 + (D/2)2 sin<5
cos6 (A2)
where c5 is related to the equivalent sun angular size a ^ v sum by the Snell's law of refraction at the entrance of the medium (Equation (A4)). In turn, a, equiv sun results from adding the theoretical acceptance angle «acceptance and the sun angular size aSun (Equation (A5)).
-^equiv sun ^z—fD Sine) (A3)
Assume a parabola immersed in a medium whose temperature changes linearly across the direction of the parabola axis (z axis in Figure Al), being hotter at the upper part where the cell is located. Consequently, refractive index changes linearly between that at the coordinate's origin (placed at the extreme of the parabola)
^equiv sun ^sun T ^acceptance U . Z t D T ^acceptance \^^f
The spot size due to the ray deviation caused by the refractive index gradient can be calculated applying Fermat principle, which after some mathematics explained in detail in [40], leads to
D/2
Figure A l . Paths described by rays reflected by a parabola in a medium with a linear refractive index gradient.
B cosh"1 - (fD+-\ - cosh"1 -
D
(A5)
where parameters A and B define the refractive index linear coefficient and parameter C defines the initial condition:
A — n z=0 (A6)
C = nz=0
VW+l (A8)
By applying some mathematics, the attainable X can be expressed as
n1
X = j ( A 9 >
[/(l+^)sin(á)+§]
dn^ dndT ^ dn Tz=fD - Tz=0
~ dz~ dTdz~ dT fD { '
Figure 8 represents the concentration acceptance angle relation for different f-number parabolas and temperature increments values.