experimental and numerical analysis of dust resuspension ... · in case of lova a pressure...
TRANSCRIPT
Abstract— A recognized safety issue for future fusion reactors
fueled with deuterium and tritium is the generation of sizeable
quantities of dust. Several mechanisms like plasma disruptions, Edge
Localized Modes (ELM) and Vertical Displacement Events (VDE)
resulting from material response to plasma bombardment in normal
and off-normal conditions are responsible for generating dust of
micron and sub-micron length scales inside the VV (Vacuum Vessel)
of experimental fusion reactors like the International Thermonuclear
Experimental Reactor (ITER). The loss of coolant accidents (LOCA),
loss of coolant flow accidents (LOFA) and loss of vacuum accidents
(LOVA) are types of accidents expected in experimental fusion
reactors like ITER, which may jeopardize the components and the
plasma vessel integrity and cause dust mobilization risk for workers
and public. In particular the mobilization of the dust and its release
outside the VV threatening public safety because it may contain
tritium, may be radioactive from activation products, and may be
chemically reactive and/or toxic. Understanding of the behavior of
dust in an accident scenario will be essential in order to support the
prevention and protection activities. A small facility, Small Tank for
Aerosol Removal and DUST (STARDUST), was set up to perform
experiments concerning the dust mobilization in a volume with the
initial condition similar to those existing in ITER VV. The aim of this
work was to reproduce a low pressurization rate (300 Pa/s) LOVA
event in ITER due to a small air leakage, for two different positions
of the leak (equatorial port level and at the divertor port level) in
order to evaluate a first re-suspension numerical model by the
analysis of the:
Influence of obstacles and temperature on dust
resuspension during both maintenance and operative
conditions;
The velocity field inside STARDUST.
P.Gaudio is with University of Rome ―Tor Vergata‖, Faculty of
Engineering, Department of Mechanical Engineering, Quantum Electronics
and Plasma Physics Research Group, Via del Politecnico 1, 00133 Rome, Italy
(corresponding author phone: 0039 0672597209; fax: 0039 0672597207; e-mail: [email protected]).
A.Malizia is with University of Rome ―Tor Vergata‖, Faculty of
Engineering, Department of Mechanical Engineering, Quantum Electronics and Plasma Physics Research Group, Via del Politecnico 1, 00133 Rome, Italy
(corresponding author phone: 0039 0672597196; fax: 0039 0672597207; e-
mail: [email protected]). I.Lupelli is with University of Rome ―Tor Vergata‖, Faculty of
Engineering, Department of Mechanical Engineering, Quantum Electronics
and Plasma Physics Research Group, Via del Politecnico 1, 00133 Rome, Italy
(corresponding author phone: 0039 0672597196; fax: 0039 0672597207; e-
mail: [email protected]).
For the first experimental purpose the dusts used were tungsten
(W), stainless steel (SS) and carbon (C), similar to those produced
inside the vacuum chamber in a fusion reactor when the plasma
facing materials vaporizes due to the high energy deposition. The
experimental campaign has been carried out by introducing inside
STARDUST facility an obstacle that simulates the presence of
objects, like divertor and the limiter-divertor gap inside ITER VV.
The walls of the tank are heated at two different temperatures, 25°C
110°C in order to reproduce the maintenance conditions and
operative conditions. For the second experimental purpose, local
measurements of velocity have been acquired by a capacitive
transducer. A two-dimensional (2D) modelling of STARDUST has
been set up by using a commercial CFD code (FLUENT), in order to
get a preliminary overview of the fluid dynamics behavior during a
LOVA event. The results of these simulations were compared against
the experimental data for the CFD code validation. For validation
purposes, the CFD simulation data were extracted at the same
locations as the experimental data were collected. In this work, the
computer-simulation data and the comparison with data collected
during the laboratory studies will be presented and discussed.
Keywords—Dust mobilization, nuclear fusion safety, LOVA,
CFD.
I. INTRODUCTION
A recognized safety issue for future fusion reactors (like
ITER) fueled with deuterium and tritium is the generation of
sizeable quantities of dust [1-3]. The loss of coolant accidents
(LOCA), loss of coolant flow accidents (LOFA) and loss of
vacuum accidents (LOVA) are types of accidents that may
jeopardize the components and the plasma vessel integrity and
cause dust mobilization, risky for workers and public [4]. In
order to analyze this problems a small facility STARDUST
was set up at University of Rome ―Tor Vergata‖ in
collaboration with the ENEA Frascati National Laboratory
Fusion Technology Department that reproduce a LOVA event
postulated in ITER. Several experiments have been conducted
with STARDUST facility in order to reproduce a low
pressurization rate (300 Pa/s due to a 0,02 m2 wide breach
defined by Generic Site Specific Report (GSSR) [5]) LOVA
event in ITER for two different positions of the leak, at the
equatorial port level and at the divertor port level, in order to
perform:
Dust resuspension experiments (with tungsten (W),
stainless steel (SS) and carbon (C), similar to those
P.Gaudio, A.Malizia, I.Lupelli
Experimental and numerical analysis of dust
resuspension for supporting chemical and
radiological risk assessment in a nuclear fusion
device
Mathematical Models for Engineering Science
ISBN: 978-960-474-252-3 134
produced inside the vacuum chamber in a fusion
reactor. These experiments are carried out with
STARDUST facility in order to analyze both the
influence of obstacles like the divertor or particular
geometrical configuration inside the VV (like the
LDG1), and the influence of temperature on dust
resuspension during maintenance and operative
conditions. All the experimental results will be
analyzed and discussed;
Punctual velocity evaluation in order to study the
flow field in case of LOVA and its connection with
dust mobilization phenomena.
FLUENT was used to simulate the flow behavior for the same
LOVA scenarios used during the experimental tests. For the
design and licensing of the nuclear fusion power plant
Computational Fluid Dynamics (CFD) codes are considered
an essential tool [6]. Therefore, experimental activities and
numerical simulation campaigns have been carried out in
strong correlation in order both to understand the capabilities
of computational codes and to predict correctly the
characteristics of the flows during a LOVA event. A model
which could predicts the velocity magnitude for different
conditions during a LOVA event in the whole domain is an
important tool to support regulatory approval of a fusion
device. A two-dimensional (2D) modeling of STARDUST,
made with the CFD commercial code FLUENT, will be
carried out. A comparison of the experiments data in
STARDUST with the numerical simulation results will be
shown for CFD code validation. For validation purposes, the
CFD simulation data will be extracted at the same locations as
the experimental data will be collected. In this paper the
computer-simulation data and the comparison with data
collected during the laboratory studies will be discussed and
presented in order to evaluate a first resuspension numerical
model.
II. EXPERIMENTAL SET-UP
STARDUST Facility and LOVA reproduction
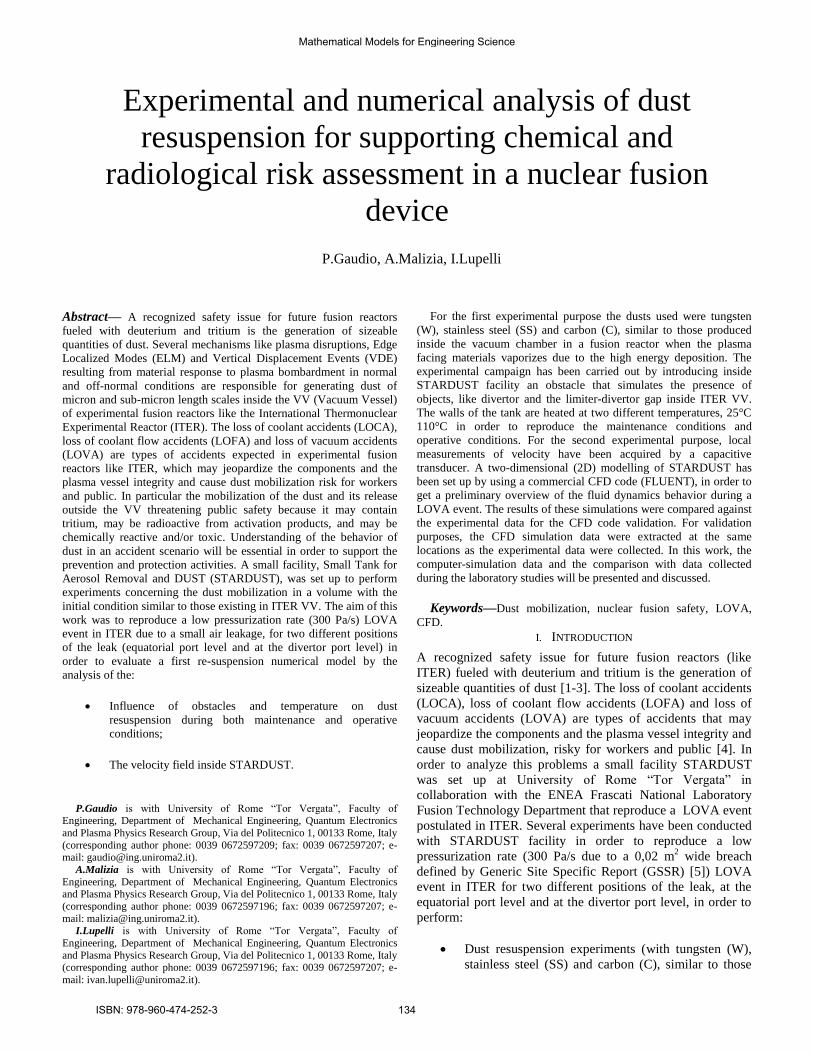
The main dimensions of STARDUST(Fig.1) are reported in
the following table (Tab.1):
Fig. 1 STARDUST facility
External length of the tank (mm) 920
External diameter of the tank (mm) 506
External diameter of the lids (mm) 570
Thickness of the tank’s wall (mm) 5
Thickness of the lid (mm) 14
Quartz lateral windows : distance from the pipe
inlet (center of the window) (mm)
182
Diameter of the lateral quartz windows (mm) 84
Diameter of the frontal quartz window in the
mobile lid (mm)
79
Internal volume of the tank (m3) 0,17
Tab. 1 main dimensions of STARDUST [7,8]
A labview software has been developed in order to control all
the hardware and to storage automatically the data. These are
the steps of program:
Switch on the heaters (only for 110 °C test)
The pneumatic-valve is open;
The vacuum pump is turned on;
The user can monitor the temperature and pressure
conditions and the flow rate during the achievement
of the test initial conditions;
When the initial conditions are reached the program
automatically closes the pneumatic-valve and
vacuum pump is turned off.
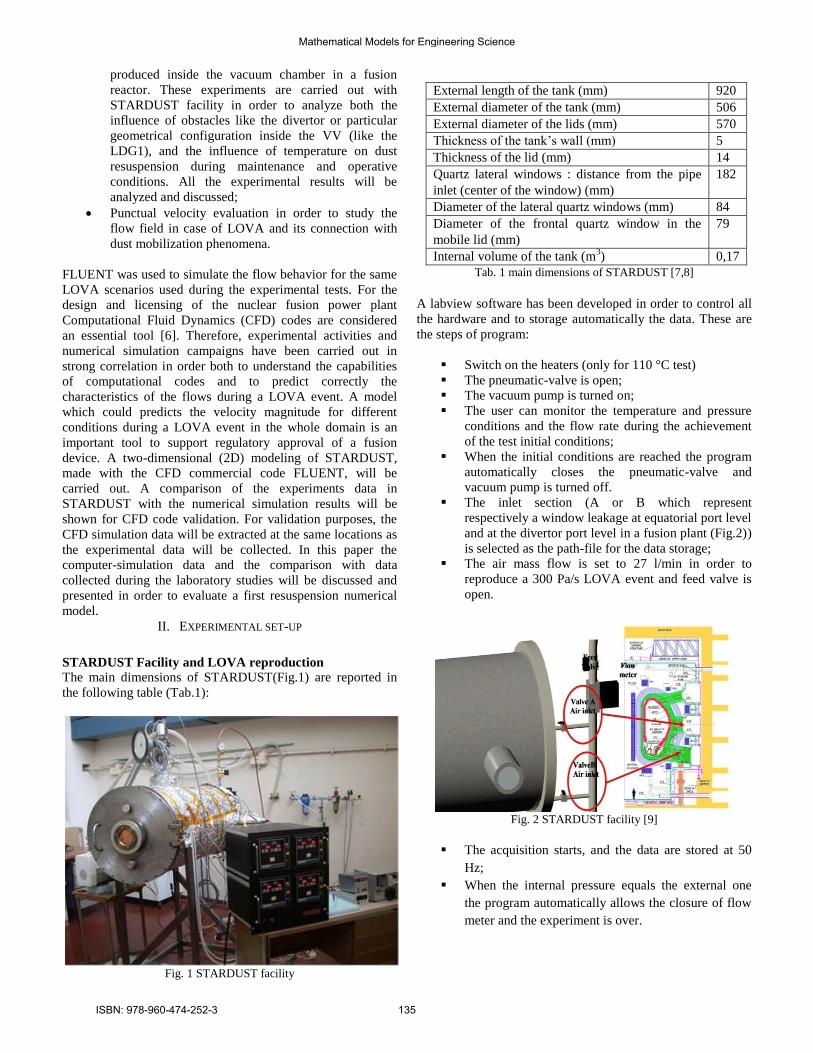
The inlet section (A or B which represent
respectively a window leakage at equatorial port level
and at the divertor port level in a fusion plant (Fig.2))
is selected as the path-file for the data storage;
The air mass flow is set to 27 l/min in order to
reproduce a 300 Pa/s LOVA event and feed valve is
open.
Fig. 2 STARDUST facility [9]
The acquisition starts, and the data are stored at 50
Hz;
When the internal pressure equals the external one
the program automatically allows the closure of flow
meter and the experiment is over.
Mathematical Models for Engineering Science
ISBN: 978-960-474-252-3 135

Quantitative measurements of dust resuspension
The dusts used in STARDUST are:
- W powder, pure at 99.95%, (mean diameter 0.6 -0.9 m)
- SS powder of AISI 316, (mean diameter 45 m)
- C powder (mean diameter 4.5 m)
5 g of dust has been used in order to achieve a concentration
of about 30 g/m3 in case of complete mobilization. The dusts
have been putted on a little aluminium tray of 25 cm2 by using
a sieve in order to avoid heaps. In order to study the effects on
the dust mobilization and resuspension due to structures inside
the VV of ITER an obstacle was putted inside STARDUST
tank (Fig.3) [9]. The obstacle simulates the presence of
divertor and the bridge inside the obstacle represents the
divertor dome . The obstacle was made in stainless steel.
Fig. 3 The obstacle
The main dimensions are length 39.1 cm and width 30 cm.
After a first set of experiments, a slit on the obstacle has been
realized in order to analyze the possible variations of the flow
field caused by the limiter-divertor gap (Fig.4) [10].
Fig. 4 Slit position on obstacle
The experiments have been performed with an air inlet from
the valve A and the valve B, at 110°C and 25°C, in the
following configurations:
Tray without obstacle (Fig.5a) ;
Tray under obstacle at the bottom part of the tank
(Fig.5b);
Tray inside obstacle, under the bridge (Fig.5c);
Tray inside obstacle, over the bridge (Fig.5d). [11]
Fig. 5 Different position of tray.
Velocity measurements
In order to analyze the velocity magnitude inside STARDUST
in case of LOVA a pressure transducer has been used. The
pressure transducer used is a XCQ-093-2PSI Kulite
instruments (Fig.6).
Fig. 6 Pressure transducer
The pressure transducer allows the punctual characterization
of velocity flow field values [12]. During these experimental
campaign the pressure transducer has been placed where dusts
have been placed in the previous experiment:
Tray without obstacle ;
Tray under obstacle at the bottom part of the tank;
Tray inside obstacle, under the bridge;
Tray inside obstacle, over the bridge.
The experiments have been conducted only at 25°C in order to
preserve the sensor integrity [13].
Mathematical Models for Engineering Science
ISBN: 978-960-474-252-3 136
III. EXPERIMENTAL RESULTS
Quantitative measurements of dust resuspension
In this section the experimental results will be analyzed and
discussed. In the following table (Tab.2) the acronyms to
identify the experiments are shown:
1th
Letter
W-C-SS Dust’s type
(W:Tungsten, C:Carbon, SS :
Stainless Steel)
2th
Letter
A - B Inlet position
a : equatorial level
b : divertor level
3th
Letter
UO – UB –
OB
Tray positions
UO (Under Obstacle) : tray under
obstacle
UB (Under Bridge) : tray inside
obstacle, under bridge
OB (Over Bridge) : tray inside
obstacle, on the bridge
4th
Letter
h - c Wall temperature
h (hot) : wall heated up to 110 °C
(operative conditions)
c (cold) : wall at 25 °C
(maintenance condition)
5th
letter
s Experiments done with a slit at
bridge level to simulate the space
between the limiter and the divertor
inside ITER
Notes NoObstacole Experiments without obstacle Tab. 2 Dust resuspension experimental setup acronyms
Four test have been performed for each
configuration;
For each configuration the tray has been in order to
take in account an imperfect tray cleaning;
A 10% error was considered for each experiment in
order to take in account the movements due to
weighting operations.
Resuspended dust fraction has been calculated with a
differential weighed:
%R_d = (Diw
-Dfw
)*100/Diw
• %R_d = Percentage of dust resuspended.
• Dfw
= Final Dust Weighted;
• Diw
= Initial Dust Weighted.
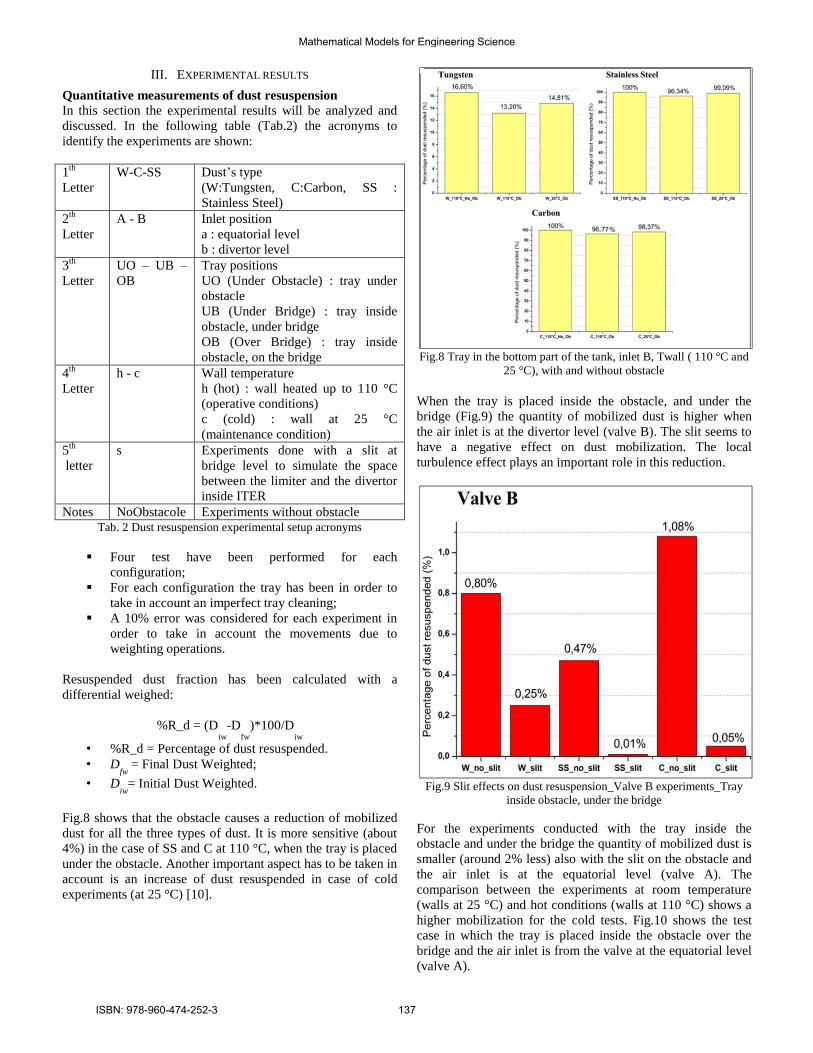
Fig.8 shows that the obstacle causes a reduction of mobilized
dust for all the three types of dust. It is more sensitive (about
4%) in the case of SS and C at 110 °C, when the tray is placed
under the obstacle. Another important aspect has to be taken in
account is an increase of dust resuspended in case of cold
experiments (at 25 °C) [10].
Fig.8 Tray in the bottom part of the tank, inlet B, Twall ( 110 °C and
25 °C), with and without obstacle
When the tray is placed inside the obstacle, and under the
bridge (Fig.9) the quantity of mobilized dust is higher when
the air inlet is at the divertor level (valve B). The slit seems to
have a negative effect on dust mobilization. The local
turbulence effect plays an important role in this reduction.
Fig.9 Slit effects on dust resuspension_Valve B experiments_Tray
inside obstacle, under the bridge
For the experiments conducted with the tray inside the
obstacle and under the bridge the quantity of mobilized dust is
smaller (around 2% less) also with the slit on the obstacle and
the air inlet is at the equatorial level (valve A). The
comparison between the experiments at room temperature
(walls at 25 °C) and hot conditions (walls at 110 °C) shows a
higher mobilization for the cold tests. Fig.10 shows the test
case in which the tray is placed inside the obstacle over the
bridge and the air inlet is from the valve at the equatorial level
(valve A).
Mathematical Models for Engineering Science
ISBN: 978-960-474-252-3 137
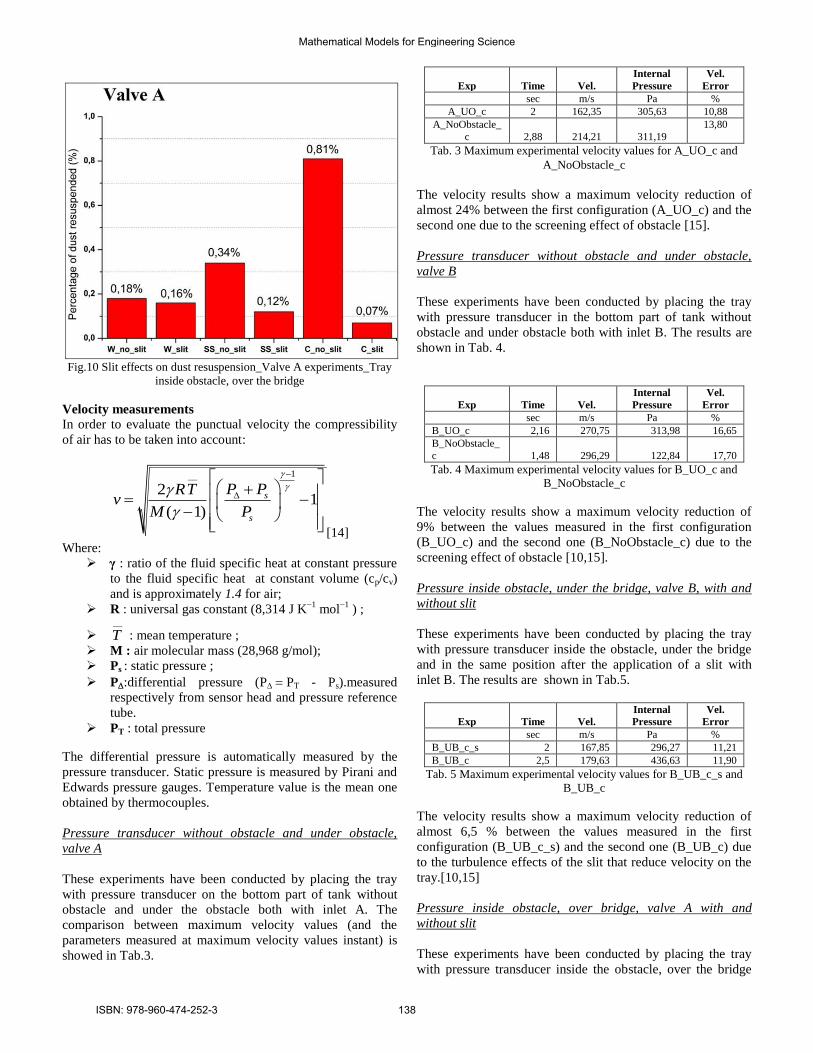
Fig.10 Slit effects on dust resuspension_Valve A experiments_Tray
inside obstacle, over the bridge
Velocity measurements
In order to evaluate the punctual velocity the compressibility
of air has to be taken into account:
1__
21
( 1)
s
s
P PRTv
M P
[14]
Where:
γ : ratio of the fluid specific heat at constant pressure
to the fluid specific heat at constant volume (cp/cv)
and is approximately 1.4 for air;
R : universal gas constant (8,314 J K−1
mol−1
) ;
__
T : mean temperature ;
M : air molecular mass (28,968 g/mol);
Ps : static pressure ;
P:differential pressure (PPT - Ps).measured
respectively from sensor head and pressure reference
tube.
PT : total pressure
The differential pressure is automatically measured by the
pressure transducer. Static pressure is measured by Pirani and
Edwards pressure gauges. Temperature value is the mean one
obtained by thermocouples.
Pressure transducer without obstacle and under obstacle,
valve A
These experiments have been conducted by placing the tray
with pressure transducer on the bottom part of tank without
obstacle and under the obstacle both with inlet A. The
comparison between maximum velocity values (and the
parameters measured at maximum velocity values instant) is
showed in Tab.3.
Exp Time Vel.
Internal
Pressure
Vel.
Error
sec m/s Pa %
A_UO_c 2 162,35 305,63 10,88
A_NoObstacle_
c 2,88 214,21 311,19
13,80
Tab. 3 Maximum experimental velocity values for A_UO_c and
A_NoObstacle_c
The velocity results show a maximum velocity reduction of
almost 24% between the first configuration (A_UO_c) and the
second one due to the screening effect of obstacle [15].
Pressure transducer without obstacle and under obstacle,
valve B
These experiments have been conducted by placing the tray
with pressure transducer in the bottom part of tank without
obstacle and under obstacle both with inlet B. The results are
shown in Tab. 4.
Exp Time Vel.
Internal
Pressure
Vel.
Error
sec m/s Pa %
B_UO_c 2,16 270,75 313,98 16,65
B_NoObstacle_
c 1,48 296,29 122,84 17,70
Tab. 4 Maximum experimental velocity values for B_UO_c and
B_NoObstacle_c
The velocity results show a maximum velocity reduction of
9% between the values measured in the first configuration
(B_UO_c) and the second one (B_NoObstacle_c) due to the
screening effect of obstacle [10,15].
Pressure inside obstacle, under the bridge, valve B, with and
without slit
These experiments have been conducted by placing the tray
with pressure transducer inside the obstacle, under the bridge
and in the same position after the application of a slit with
inlet B. The results are shown in Tab.5.
Exp Time Vel.
Internal
Pressure
Vel.
Error
sec m/s Pa %
B_UB_c_s 2 167,85 296,27 11,21
B_UB_c 2,5 179,63 436,63 11,90
Tab. 5 Maximum experimental velocity values for B_UB_c_s and
B_UB_c
The velocity results show a maximum velocity reduction of
almost 6,5 % between the values measured in the first
configuration (B_UB_c_s) and the second one (B_UB_c) due
to the turbulence effects of the slit that reduce velocity on the
tray.[10,15]
Pressure inside obstacle, over bridge, valve A with and
without slit
These experiments have been conducted by placing the tray
with pressure transducer inside the obstacle, over the bridge
Mathematical Models for Engineering Science
ISBN: 978-960-474-252-3 138
and in the same position after the application of a slit at the
bridge level that reproduce the space between limiter and
divertor with inlet A. The results are shown in Tab.6.
Exp Time Vel.
Internal
Pressure
Vel.
Error
sec m/s Pa %
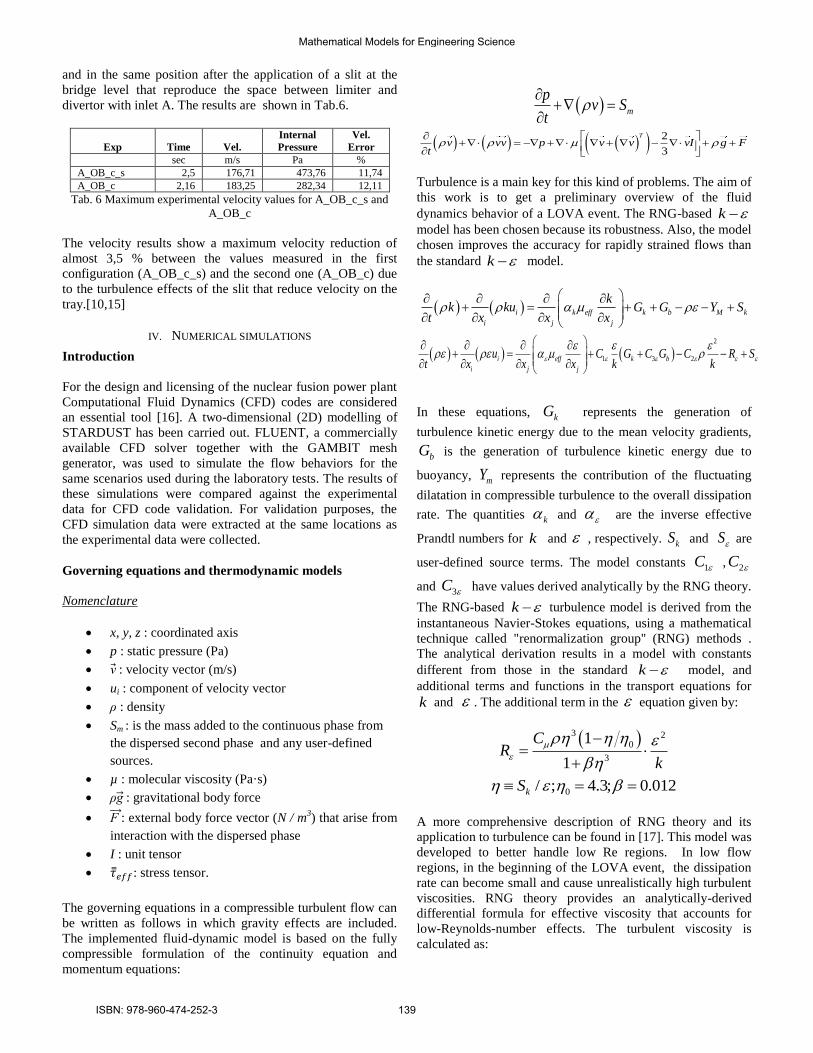
A_OB_c_s 2,5 176,71 473,76 11,74
A_OB_c 2,16 183,25 282,34 12,11
Tab. 6 Maximum experimental velocity values for A_OB_c_s and
A_OB_c
The velocity results show a maximum velocity reduction of
almost 3,5 % between the values measured in the first
configuration (A_OB_c_s) and the second one (A_OB_c) due
to the turbulence effects of the slit that reduce velocity on the
tray.[10,15]
IV. NUMERICAL SIMULATIONS
Introduction
For the design and licensing of the nuclear fusion power plant
Computational Fluid Dynamics (CFD) codes are considered
an essential tool [16]. A two-dimensional (2D) modelling of
STARDUST has been carried out. FLUENT, a commercially
available CFD solver together with the GAMBIT mesh
generator, was used to simulate the flow behaviors for the
same scenarios used during the laboratory tests. The results of
these simulations were compared against the experimental
data for CFD code validation. For validation purposes, the
CFD simulation data were extracted at the same locations as
the experimental data were collected.
Governing equations and thermodynamic models
Nomenclature
x, y, z : coordinated axis
p : static pressure (Pa)
v : velocity vector (m/s)
ui : component of velocity vector
ρ : density
Sm : is the mass added to the continuous phase from
the dispersed second phase and any user-defined
sources.
µ : molecular viscosity (Pa·s)
ρg : gravitational body force
: external body force vector (N / m3) that arise from
interaction with the dispersed phase
I : unit tensor
: stress tensor.
The governing equations in a compressible turbulent flow can
be written as follows in which gravity effects are included.
The implemented fluid-dynamic model is based on the fully
compressible formulation of the continuity equation and
momentum equations:
m
pv S
t
2
3
T
v vv p v v vI g Ft
Turbulence is a main key for this kind of problems. The aim of
this work is to get a preliminary overview of the fluid
dynamics behavior of a LOVA event. The RNG-based k
model has been chosen because its robustness. Also, the model
chosen improves the accuracy for rapidly strained flows than
the standard k model.
i k eff k b M k
i j j
kk ku G G Y S
t x x x
2
1 3 2i eff k b
i j j
u C G C G C R St x x x k k
In these equations, kG represents the generation of
turbulence kinetic energy due to the mean velocity gradients,
bG is the generation of turbulence kinetic energy due to
buoyancy, mY represents the contribution of the fluctuating
dilatation in compressible turbulence to the overall dissipation
rate. The quantities k and are the inverse effective
Prandtl numbers for k and , respectively. kS and S are
user-defined source terms. The model constants 1C , 2C
and 3C have values derived analytically by the RNG theory.
The RNG-based k turbulence model is derived from the
instantaneous Navier-Stokes equations, using a mathematical
technique called "renormalization group'' (RNG) methods .
The analytical derivation results in a model with constants
different from those in the standard k model, and
additional terms and functions in the transport equations for
k and . The additional term in the equation given by:
3 20
3
1
1
CR
k
0/ ; 4.3; 0.012kS
A more comprehensive description of RNG theory and its
application to turbulence can be found in [17]. This model was
developed to better handle low Re regions. In low flow
regions, in the beginning of the LOVA event, the dissipation
rate can become small and cause unrealistically high turbulent
viscosities. RNG theory provides an analytically-derived
differential formula for effective viscosity that accounts for
low-Reynolds-number effects. The turbulent viscosity is
calculated as:
Mathematical Models for Engineering Science
ISBN: 978-960-474-252-3 139

2
3
1.72
1v
k v d vd
v C
where μ is again the molecular viscosity, Cν is a constant, and
v
is the ratio of turbulent to molecular viscosity.
tv
, 100vC
2
t
kC
where Cμ is an empirical constant. Therefore, the turbulence
will vary with the eddy scale. Effective use of this feature
does, however, depend on an appropriate treatment of the
near-wall region. Traditionally, there are two approaches to
modeling the near-wall region. In one approach, the viscosity-
affected inner region (viscous sublayer and buffer layer) is not
resolved. Instead, semi-empirical formulas called "wall
functions'' are used to bridge the solution variables at the near-
wall cells and the corresponding quantities on the wall, or in
other therms the viscosity-affected region between the wall
and the fully-turbulent region. In another approach, the
turbulence models are modified to enable the viscosity-
affected region to be resolved with a mesh all the way to the
wall, including the viscous sublayer. This is called the "near-
wall modeling'' approach. In most high-Reynolds-number
flows, the wall function approach substantially saves
computational resources, because the viscosity-affected near-
wall region, in which the solution variables change most
rapidly, does not need to be resolved. The wall-function
approach, however, is inadequate in situations where the low-
Reynolds-number effects are pervasive and the assumptions
underlying the wall functions cease to be valid. Such
situations require near-wall models that are valid in the
viscosity-affected region and accordingly integrable all the
way to the wall. In this case a enhanced wall treatment, with
near wall refinement, has been chosen. Enhanced wall
treatment is a near-wall modeling method that combines a
two-layer model with enhanced wall functions. The two-layer
approach is used to specify both and the turbulent
viscosity in the near-wall cells. In this approach, the whole
domain is subdivided into a viscosity-affected region and a
fully-turbulent region. In the fully turbulent region the RNG-
based k model is employed. In the viscosity-affected
near-wall region the one-equation model of Wolfstein [18] is
employed. The demarcation of the two regions is determined
by a wall-distance-based, turbulent Reynolds number:
Re y
y k
where y is the wall-normal distance calculated at the cell
centers. The two-layer formulation for turbulent viscosity is
used as a part of the enhanced wall treatment, in which the
two-layer definition is smoothly blended with the high-
Reynolds-number t definition from the outer region, as
proposed by Jongen [19]. To have a method that can extend its
applicability throughout the near-wall region (i.e., viscous
sub-layer, buffer region, and fully-turbulent outer region) it is
necessary to formulate the law-of-the wall as a single wall law
for the entire wall region. The code achieves this by blending
the logarithmic (turbulent) laws-of-the-wall using a function
suggested by Kader [20]. This approach allows the fully
turbulent law to be easily modified and extended to take into
account other effects such as pressure gradients or variable
properties. The enhanced turbulent law-of-the-wall for
compressible flow with heat transfer and pressure gradients
has been derived by combining the approaches of White and
Cristoph [21] and Huang et al. [22]. The production of
turbulence kinetic energy, is computed using the velocity
gradients that are consistent with the enhanced law-of-the-wall
ensuring a formulation that is valid throughout the near-wall
region.
The implemented CFD model solves the energy equation in
the following form:
effeff j j h
j
E v E p k T h J v St
where effk is the effective conductivity, and jJ is the
diffusion flux of species . The first three terms on the right
hand side of equation represent energy transfer due to
conduction, species diffusion, and viscous dissipation,
respectively, includes the heat of chemical reaction, and any
other volumetric heat sources. Heat transfer has been
modelled using the Reynolds analogy, but for the RNG model,
the effective thermal conductivity used in the energy equation
is eff p effk c where (inverse of the turbulent Prandtl
number) is calculated from Eq:
0,6231 0,3679
0 0
1,3929 2,3929
1,3929 2,3929 eff
with 0 / Pr / pi k c
Therefore, the turbulent Prandtl number is not constant as in
the standard k–ε model, but it depends on the molecular
Prandtl number. Developed analyses have been conducted in
transitory regime with an real gas assumption according to the
Aungier-Redlich-Kwong real gas model [23]. Thermo-
physical properties of the air are assumed to be varying with
the kinetic theory assumption.
Gas model
Some engineering problems involve fluids that do not behave
as ideal gases. For example, at very high-pressure or very low-
temperature conditions the flow cannot typically be modeled
accurately using the ideal-gas assumption. Therefore, the real
gas model allows to solve accurately for the fluid flow and
heat transfer problems where the working fluid behavior
deviate from the ideal-gas assumption. An equation of state is
Mathematical Models for Engineering Science
ISBN: 978-960-474-252-3 140
a thermodynamic equation, which provides a mathematical
relationship between two or more state functions associated
with the matter, such as its temperature, pressure, volume, or
internal energy. One of the simplest equations of state for this
purpose is the ideal gas law, which is roughly accurate for
gases at low pressure gas region of the PT and PV diagrams.
Ideal gas behavior can be expected when .
Introduced in 1949, the Redlich-Kwong equation of state was
a considerable improvement over other equations of that time.
It is an analytic cubic equation of state and is still of interest
primarily due to its relatively simple form. The original form
is
R= universal gas constant divided by molecular
weight;
V=specific volume;
T=temperature;
=reduced temperature;
e are constants related directly to the fluid
critical pressure and temperature.
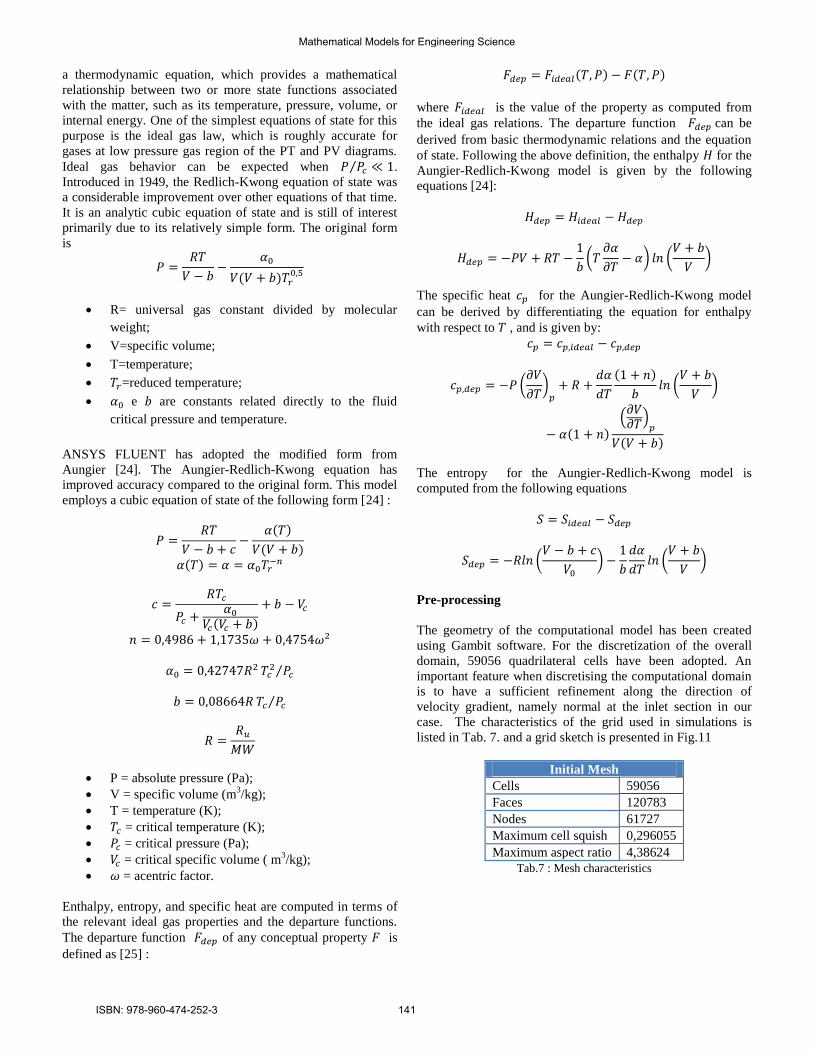
ANSYS FLUENT has adopted the modified form from
Aungier [24]. The Aungier-Redlich-Kwong equation has
improved accuracy compared to the original form. This model
employs a cubic equation of state of the following form [24] :
P = absolute pressure (Pa);
V = specific volume (m3/kg);
T = temperature (K);
= critical temperature (K);
= critical pressure (Pa);
= critical specific volume ( m3/kg);
= acentric factor.
Enthalpy, entropy, and specific heat are computed in terms of
the relevant ideal gas properties and the departure functions.
The departure function of any conceptual property is
defined as [25] :
where is the value of the property as computed from
the ideal gas relations. The departure function can be
derived from basic thermodynamic relations and the equation
of state. Following the above definition, the enthalpy for the
Aungier-Redlich-Kwong model is given by the following
equations [24]:
The specific heat for the Aungier-Redlich-Kwong model
can be derived by differentiating the equation for enthalpy
with respect to , and is given by:
The entropy for the Aungier-Redlich-Kwong model is
computed from the following equations
Pre-processing
The geometry of the computational model has been created
using Gambit software. For the discretization of the overall
domain, 59056 quadrilateral cells have been adopted. An
important feature when discretising the computational domain
is to have a sufficient refinement along the direction of
velocity gradient, namely normal at the inlet section in our
case. The characteristics of the grid used in simulations is
listed in Tab. 7. and a grid sketch is presented in Fig.11
Initial Mesh
Cells 59056
Faces 120783
Nodes 61727
Maximum cell squish 0,296055
Maximum aspect ratio 4,38624
Tab.7 : Mesh characteristics
Mathematical Models for Engineering Science
ISBN: 978-960-474-252-3 141
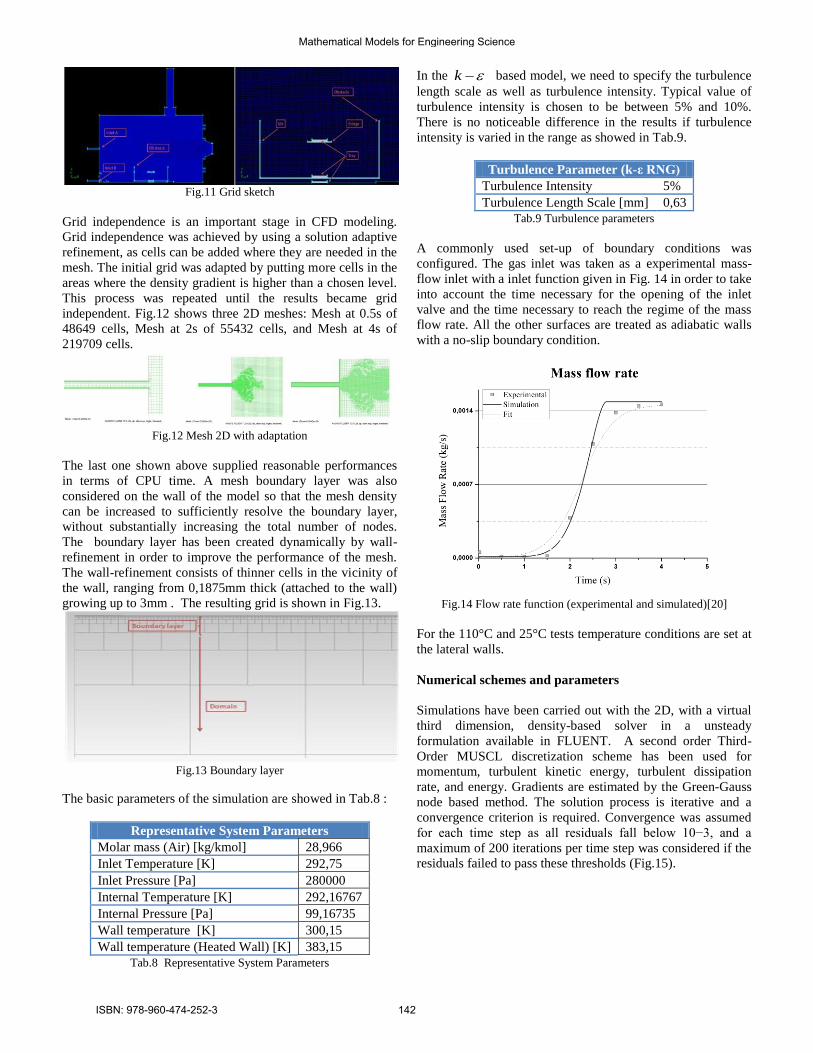
Fig.11 Grid sketch
Grid independence is an important stage in CFD modeling.
Grid independence was achieved by using a solution adaptive
refinement, as cells can be added where they are needed in the
mesh. The initial grid was adapted by putting more cells in the
areas where the density gradient is higher than a chosen level.
This process was repeated until the results became grid
independent. Fig.12 shows three 2D meshes: Mesh at 0.5s of
48649 cells, Mesh at 2s of 55432 cells, and Mesh at 4s of
219709 cells.
Fig.12 Mesh 2D with adaptation
The last one shown above supplied reasonable performances
in terms of CPU time. A mesh boundary layer was also
considered on the wall of the model so that the mesh density
can be increased to sufficiently resolve the boundary layer,
without substantially increasing the total number of nodes.
The boundary layer has been created dynamically by wall-
refinement in order to improve the performance of the mesh.
The wall-refinement consists of thinner cells in the vicinity of
the wall, ranging from 0,1875mm thick (attached to the wall)
growing up to 3mm . The resulting grid is shown in Fig.13.
Fig.13 Boundary layer
The basic parameters of the simulation are showed in Tab.8 :
Representative System Parameters
Molar mass (Air) [kg/kmol] 28,966
Inlet Temperature [K] 292,75
Inlet Pressure [Pa] 280000
Internal Temperature [K] 292,16767
Internal Pressure [Pa] 99,16735
Wall temperature [K] 300,15
Wall temperature (Heated Wall) [K] 383,15
Tab.8 Representative System Parameters
In the k based model, we need to specify the turbulence
length scale as well as turbulence intensity. Typical value of
turbulence intensity is chosen to be between 5% and 10%.
There is no noticeable difference in the results if turbulence
intensity is varied in the range as showed in Tab.9.
Turbulence Parameter (k-ε RNG)
Turbulence Intensity 5%
Turbulence Length Scale [mm] 0,63
Tab.9 Turbulence parameters
A commonly used set-up of boundary conditions was
configured. The gas inlet was taken as a experimental mass-
flow inlet with a inlet function given in Fig. 14 in order to take
into account the time necessary for the opening of the inlet
valve and the time necessary to reach the regime of the mass
flow rate. All the other surfaces are treated as adiabatic walls
with a no-slip boundary condition.
Fig.14 Flow rate function (experimental and simulated)[20]
For the 110°C and 25°C tests temperature conditions are set at
the lateral walls.
Numerical schemes and parameters
Simulations have been carried out with the 2D, with a virtual
third dimension, density-based solver in a unsteady
formulation available in FLUENT. A second order Third-
Order MUSCL discretization scheme has been used for
momentum, turbulent kinetic energy, turbulent dissipation
rate, and energy. Gradients are estimated by the Green-Gauss
node based method. The solution process is iterative and a
convergence criterion is required. Convergence was assumed
for each time step as all residuals fall below 10−3, and a
maximum of 200 iterations per time step was considered if the
residuals failed to pass these thresholds (Fig.15).
Mathematical Models for Engineering Science
ISBN: 978-960-474-252-3 142

Fig.15 Residuals
While time steps of 0.02s would have been sufficient in order
to account the transient and compare the simulation with the
experimental data, convergence concerns implied to use a time
step no greater than 1e-5s in all simulations.
V. NUMERICAL RESULTS-SIMULATION WITH AND WITHOUT
OBSTACLE
Fig.16 illustrates the velocity magnitude in the whole domain
at the end of simulation when the flow is totally expanded:
Fig.16 Velocity magnitude
The maximum velocity was about 600m/s. At the end of the
inlet tube an expanding airflow with Mach Number M =
3÷3.66 (for the different tests) was realized. In the following
table (Tab.10) the velocity magnitude values at 2s in different
experimental configuration are showed.
Tray Position No
Obstacle
(25C)
Obstacle
no Slit
(25C)
Obstacle
and Slit
(25C)
No
Obstacle
(110C)
Obstacle
no Slit
(110C)
Obstacle
and Slit
(110C)
Velocity
Magnitude
Inlet
Valve A
[m/s]
Over bridge 69,259 68,554 90,116 89,240
Under Bridge 32,84 32,92 44,79 44,90
Under
Obstacle
See
Bottom
of the
Tank
131,183 131,709 See
Bottom of
the Tank
163,342 163,99
Bottom of the
Tank
150,868 187,853
Velocity
Magnitude
Inlet
Valve B
[m/s]
Over bridge 30,124 29,561 39,214 38,481
Under Bridge 59,279 59,122 86,221 73,616
Under
Obstacle
See
Bottom
of the
Tank
147,599 147,807 See
Bottom of
the Tank
201,284 201,568
Bottom of the
Tank
384,997 - - 413,573 - -
Tab.9 Velocity magnitude at 2s for different positions
Static pressure output
The models used for the simulation were:
Real gas based Standard k-;
Ideal gas based k-;
RNG-based k- turbulence.
Each pressure static trend obtained by the different models has
been compared with the experimental one is shown in Fig.17:
Fig.17 Pressurization rate (experimental and simulated)[15]
It can be seen that the coupling of real gas assumption and
RNG-based k- turbulence model could be used to simulate
the LOVA event better than the real gas based Standard k-
and the ideal gas based k- because the numerical pressure
static numerical results match with the experimental ones
better than the other models.
VI. NUMERICAL AND EXPERIMENTAL DATA COMPARISON
Obstacle influence in dust mobilization
The experimental results obtained at an assigned temperature,
for both the valve A and the valve B, show a reduction of dust
resuspended when the tray is placed under the obstacle. Hence
it is possible to state that the divertor causes the diminution of
mobilized dust for W and C for a leakage from both the
equatorial and the divertor port level. In case of a leakage at
the divertor port level the influence of the obstacle is bigger
than at the equatorial one. The effect of the presence of the
obstacle on the mobilization, i.e. the reduction of the
resuspension due to the divertor, is shown in Fig. 18 for the
valve A and the valve B. All the variations of the velocity
magnitude and the mobilization shown in this section refer to
the configuration with the tray under the obstacle (Tab.10).
Mathematical Models for Engineering Science
ISBN: 978-960-474-252-3 143
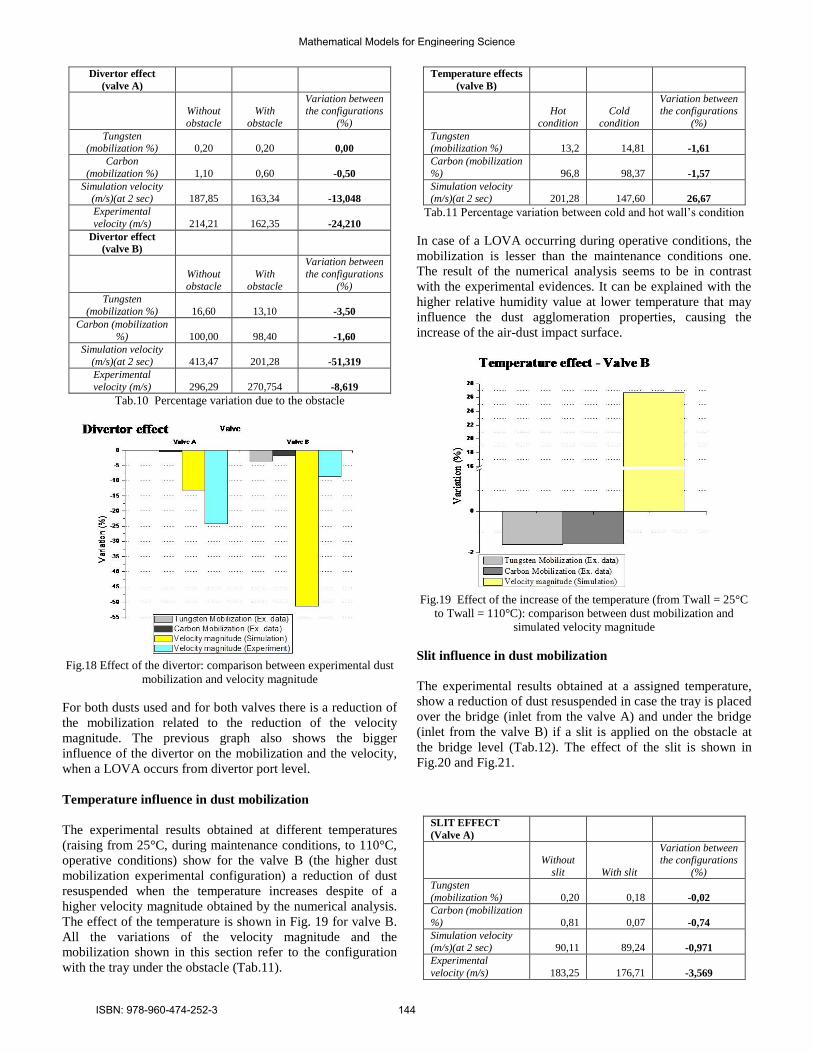
Divertor effect
(valve A)
Without
obstacle
With
obstacle
Variation between the configurations
(%)
Tungsten (mobilization %) 0,20 0,20 0,00
Carbon
(mobilization %) 1,10 0,60 -0,50
Simulation velocity (m/s)(at 2 sec) 187,85 163,34 -13,048
Experimental
velocity (m/s) 214,21 162,35 -24,210
Divertor effect
(valve B)
Without
obstacle
With
obstacle
Variation between
the configurations
(%)
Tungsten
(mobilization %) 16,60 13,10 -3,50
Carbon (mobilization
%) 100,00 98,40 -1,60
Simulation velocity
(m/s)(at 2 sec) 413,47 201,28 -51,319
Experimental
velocity (m/s) 296,29 270,754 -8,619
Tab.10 Percentage variation due to the obstacle
Fig.18 Effect of the divertor: comparison between experimental dust
mobilization and velocity magnitude
For both dusts used and for both valves there is a reduction of
the mobilization related to the reduction of the velocity
magnitude. The previous graph also shows the bigger
influence of the divertor on the mobilization and the velocity,
when a LOVA occurs from divertor port level.
Temperature influence in dust mobilization
The experimental results obtained at different temperatures
(raising from 25°C, during maintenance conditions, to 110°C,
operative conditions) show for the valve B (the higher dust
mobilization experimental configuration) a reduction of dust
resuspended when the temperature increases despite of a
higher velocity magnitude obtained by the numerical analysis.
The effect of the temperature is shown in Fig. 19 for valve B.
All the variations of the velocity magnitude and the
mobilization shown in this section refer to the configuration
with the tray under the obstacle (Tab.11).
Temperature effects
(valve B)
Hot
condition
Cold
condition
Variation between the configurations
(%)
Tungsten (mobilization %) 13,2 14,81 -1,61
Carbon (mobilization
%) 96,8 98,37 -1,57
Simulation velocity (m/s)(at 2 sec) 201,28 147,60 26,67
Tab.11 Percentage variation between cold and hot wall’s condition
In case of a LOVA occurring during operative conditions, the
mobilization is lesser than the maintenance conditions one.
The result of the numerical analysis seems to be in contrast
with the experimental evidences. It can be explained with the
higher relative humidity value at lower temperature that may
influence the dust agglomeration properties, causing the
increase of the air-dust impact surface.
Fig.19 Effect of the increase of the temperature (from Twall = 25°C
to Twall = 110°C): comparison between dust mobilization and
simulated velocity magnitude
Slit influence in dust mobilization
The experimental results obtained at a assigned temperature,
show a reduction of dust resuspended in case the tray is placed
over the bridge (inlet from the valve A) and under the bridge
(inlet from the valve B) if a slit is applied on the obstacle at
the bridge level (Tab.12). The effect of the slit is shown in
Fig.20 and Fig.21.
SLIT EFFECT
(Valve A)
Without
slit With slit
Variation between the configurations
(%)
Tungsten
(mobilization %) 0,20 0,18 -0,02
Carbon (mobilization
%) 0,81 0,07 -0,74
Simulation velocity (m/s)(at 2 sec) 90,11 89,24 -0,971
Experimental
velocity (m/s) 183,25 176,71 -3,569
Mathematical Models for Engineering Science
ISBN: 978-960-474-252-3 144

SLIT EFFECT
(ValveB)
Without
slit
With
slit
Variation between the configurations
(%)
Tungsten (mobilization %) 0,80 0,25 -0,55
Carbon (mobilization
%) 1,08 0,05 -1,03
Simulation velocity (m/s)(at 2 sec) 86,22 73,62 -14,619
Experimental
velocity (m/s) 179,63 167,85 -6,555
Tab.12 Slit influence
Fig.20 Effect of the slit: comparison between experimental dust
mobilization and simulated and experimental velocity magnitude –
Valve A
Fig.21 Effect of the slit: comparison between experimental dust
mobilization and simulated and experimental velocity magnitude –
Valve B
The limiter-divertor gap seems to have a negative effect on the
dust mobilization. The local turbulence effect appears to play
an important role in this reduction as shown in numerical
results.
VII. CONCLUSION
By means of STARDUST facility a simulated low
pressurization rate (300 Pa/s) LOVA event in ITER due to a
small air leakage for two different positions of the leak has
been carried out in order to evaluate the influence of obstacles
and different temperature conditions on dust resuspension. For
the experiments done with the dust inside the tank (with and
without obstacle) the most important evidences were:
The obstacle causes a diminution of mobilized dust
for all the three types of dust. It is more sensitive
(about 4%) in the case of SS and C at 110 °C, when
the tray is placed under the obstacle.
When the tray is placed inside the obstacle and under
the bridge the quantity of mobilized dust is up to 3%
maximum when the air inlet is at the divertor level
(valve B). The slit seems to have a negative effect on
the dust mobilization. From the experiments
conducted with the tray inside the obstacle and in
both configuration (under and over the bridge, Valve
A) the quantity of mobilized dust is smaller also in
the case when there is the slit on the obstacle. The
local turbulence effect plays an important role in this
reduction;
Another important aspect that has to be taken into
account is an increase of dust resuspended in case of
cold experiments (at 25 °C), made to simulate a
LOVA during maintenance conditions.
By placing the pressure transducer in the same position of the
tray (in maintenance conditions) the variation of the velocity
measured in different experimental configurations is in
accordance with the dust mobilization which means that the
previous considerations are correct. A two-dimensional (2D)
modeling of STARDUST has been carried out. For validation
purposes (the correspondence between dust and flow lines is
guaranteed by the Stokes Number only for Tungsten and
Carbon), the CFD simulation data were extracted at the same
locations as the experimental data were collected. The velocity
variations of the numerical simulation are in accordance with
the velocity experimental variations and the dust resuspended
variations [except for the case of the tray under the obstacle],
valve B, at different temperatures (raising from 25°C to
110°C) that show a reduction of dust resuspended when the
temperature increases despite of a higher velocity magnitude
obtained by the numerical analysis. The result of the
numerical analysis seems to be in contrast with the
experimental evidences. It can be explained with the higher
relative humidity value at lower temperature that may
influence the dust agglomeration properties, causing the
increase of the air-dust impact surface. It is possible to
conclude by saying that:
For both dusts used and for both valves there is a
reduction of the mobilization related to the reduction
of the velocity magnitude. The previous graph also
shows the bigger influence of the divertor on the
Mathematical Models for Engineering Science
ISBN: 978-960-474-252-3 145
mobilization and the velocity, when a LOVA occurs
from divertor port level ;
In case of a LOVA occurring in operative conditions,
the mobilization is lesser than the maintenance
conditions one;
The limiter-divertor gap seems to have a negative
effect on the dust mobilization. The local turbulence
effect appears to play an important role in this
reduction.
ACKNOWLEDGMENT
We would like to thank the personnel of Dipartimento di
Ingegneria Meccanica of ―Tor Vergata‖ University for their
support. We know we have found a lot of new friends during
this season. Special thanks to Riccardo Quaranta, fundamental
one to conclude this task and special friend. I would like to
thank the complete staff of the Dottorato di Ricerca di
Elettronica Quantistica e Plasmi. They were fantastic and very
patient to attend and help solving our several requests. Special
thanks to Professor Carlo Bellecci, Professor Sergio
Martellucci, Dr.Maria Richetta, Dr.Michela Gelfusa, Renato
Marchetti and Eugenio Penco for all the support. We would
like to thank our colleagues of the ENEA Frascati, specials
thanks to Dr.Maria Teresa Porfiri and Rodolfo Borelli. We
would like to thank also our colleagues of the Joint European
Torus.
REFERENCES
[1] J.P. Sharpe, D.A. Petti, H.-W. Bartels, A review of dust in fusion devices:
implications for safety and operational performance, Fusion Eng. Des. 63–64
(2002) 153–163.
[2] J.Winter, Dust: a new challenge in nuclear fusion research, Phys. Plasmas
7 (2000) 3862–3866. [3] J.P. Sharpe, P.W. Humrickhouse, Dust mobilization studies in the TDMX
facility, Fusion Engineering and Design 81 (2006) 1409–1415.
[4] E. Eberta, J. Raeder, LOCA, LOFA and LOVA analyses pertaining to NET/ITER safety design guidance, Fusion Engineering and Design 17, (1991)
Pages 307-312.
[5] ITER-JCT Generic Site Safety Report N84 Garching (Germany), July 2001
[6] C.Bellecci, P.Gaudio, I.Lupelli, A.Malizia, M.T.Porfiri, R.Quaranta, M.
Richetta. “Charaterization of divertor influence in case of LOVA: Analysis stardust facility and thermofluidodynamics simulation”, EPS2009
Proceedings, 36th EPS Conference on Plasma Phys. Sofia-Bulgaria, 29 June-
3 July 2009, ECA Vol.33E, P1.086. [7] M.T. Porfiri, N. Forgione, S. Paci, A. Rufoloni, Dust mobilization
experiments in the context of the fusion plants—STARDUST facility, Fusion
Engineering and Design 81 (2006) 1353–1358.
[8] M. T. Porfiri, S. Libera, S. Paci, A. Rufoloni, L. Verdini, STARDUST
facility : first series of the tungsten dust mobilization experiments, FUS-TN-
SA-SE-R-94, 2003. [9] R. Mugavero, P. Gaudio, A. Malizia, I.Lupelli, R. Quaranta, Il rischio
radiologico negli impianti industriali e di ricerca: Caratterizzazione delle
dinamiche di moto di polveri radioattive in ambiente confinato, Tesi di Laurea Specialistica,Facoltà di Ingegneria per l’Ambiente ed il Territorio, Università
degli Studi di Roma ―Tor Vergata‖ (2008-2009).
[10] C. Bellecci, P. Gaudio, I. Lupelli, A. Malizia, M.T. Porfiri, M. Richetta. Dust mobilization and transport measures in the STARDUST facility,
EPS2008 Proceedings, 35th EPS Conference on Plasma Phys. Hersonissos, 9 -
13 June 2008 ECA Vol.32, P-1.175 (2008). [11] C. Bellecci, P. Gaudio, I.Lupelli, A.Malizia, M.T.Porfiri, M. Richetta.
Misure di mobilizzazione e trasporto nella facility STARDUST, Società
Italiana di Fisica , XCIV Congresso Nazionale, Genova 22-27 Settembre 2008, Lunedì 22 Settembre Sezione V – Fisica Applicata (2008).
[12] Kulite Technical chart for Pressure Transducer XCQ-093-2PSI-D
[13] C.Bellecci, P.Gaudio, I.Lupelli, A.Malizia, M.T.Porfiri, R.Quaranta, M. Richetta. ―Charaterization of divertor influence in case of LOVA: Analysis
stardust facility and thermofluidodynamics simulation‖, EPS2009
Proceedings, 36th EPS Conference on Plasma Phys. Sofia-Bulgaria, 29 June- 3 July 2009, ECA Vol.33E, P1.086.
[14] A.Kurtz, J. VanDWeert, B.Kochman, ―Pitot-Static Transducer, Kulite
Semiconductor Product, Inc. [15] C.Bellecci, P.Gaudio, I.Lupelli, A.Malizia, M.T.Porfiri, R.Quaranta, M.
Richetta. ―Velocity flow field characterization inside stardust experimental
facility: comparison between experimental campaign and numerical simulation results‖, ICENES2009 Proceedings, 14th International Conference
on Emerging Nuclear Energy Systems. Ericeira-Portugal, 29 June – 3 July,
ICENES Proceedings. [16] FLUENT 6.2 User’s Guide, January 2005.
[17] S.A. Orszag, V. Yakhot, W.S. Flannery, F. Boysan, D. Choudhury, J.
Maruzewski, and B. Patel, Renormalization Group Modeling and Turbulence Simulations, International Conference on Near-Wall Turbulent Flows, Tempe
Arizona (1993).
[18] ] M. Wolfstein, The Velocity and Temperature Distribution of One-Dimensional Flow with Turbulence Augmentation and Pressure Gradient, Int.
J. Heat Mass Transfer, 12:301-318, 1969.
[19] T. Jongen, Simulation and Modeling of Turbulent Incompressible Flows, PhD thesis, EPF Lausanne, Lausanne, Switzerland, 1992.
[20] B. Kader, Temperature and Concentration Profiles in Fully Turbulent
Boundary Layers, Int. J. Heat Mass Transfer, 24(9):1541-1544, 1981. [21] F. White and G. Christoph, A Simple New Analysis of Compressible
Turbulent Skin Friction Under Arbitrary Conditions, Technical Report
AFFDL-TR-70-133, February 1971. [22] P. Huang, P. Bradshaw, and T. Coakley, Skin Friction and Velocity
Profile Family for Compressible Turbulent Boundary Layers, AIAA Journal, 31(9):1600-1604, September 1993.
[23] R. W. Johnson, The handbook of fluid dynamics, Cambridge University
Press (1998). [24] R. H. Aungier. A Fast, Accurate Real Gas Equation of State for Fluid
Dynamic Analysis Applications. Journal of Fluids Engineering, 117:277-281,
1995. [25] B.E. Poling, J.M. Prausnitz, and J.P. O Connell. The properties of Gases
and Liquids. McGraw-Hill, International Edition, 5th edition, 2007.
P.Gaudio
From 1994 to 1995
Research job started with an international collaboration in LITE (LIDAR In-
Space Technology Experiment 10-19 September 1994) mission. During this period, in joint with the LITE
mission, he was involved in an intensive Lidar
Measurements campaign in Potenza and Napoli. As INFM student he worked for two years on absorption coefficient
problems. During these years he projected and developed
an absorption cell to study the interaction of a laser beam with samples of pollutants gases. He collected a wide absorption data base on
several pollutants gases as: Freon 11, Freon 12, Methane, Ethylene, etc.
From 1996 to July 1998 INFM (National Institute on the Phisic Matter now CNR) Researcher. He was
involved in project, development and improvement of a ground based CO2
Lidar/Dial system. He made several measurements campaign to study water vapour and ozono cycle and Planetary Boundary Layer (PBL) height
measurements
From July 1998 to March 2000 CRATI s.c.r.l. Researcher. In this period, in collaboration with the Quantum
Electronic and Plasma Laboratory of the University of Rome "Tor Vergata",
he worked to the project and development of a mobile Lidar/Dial setup. He made several measurements campaigns to test the mobile system and to study
diffusion into the atmosphere of a plume emitted from factory chimneys. In
this period he studied the possibility to inject a CW CO2 Laser into a TE laser at the aim of future Lidar doppler applications.
From March 2000-2006
Research technician at University of Rome "Tor Vergata". He worked to develop and improve a Lidar/Dial setup and he is involved in the
measurements of water vapour cycle and columnar atmospheric contents. He
studies aerosol plume emitted by forest fire and its interaction with laser beams. He also studies how to improve the performances of laser sources
adopted for Lidar/Dial applications. He studied the possibility to use the
Lidar/Dial systems to detect forest fire and reduce the false alarm. At this aim
he projected a compact mobile Lidar Dial setup. He begins to work in the field
of laser plasma interaction system. He developed a laser plasma system based
Mathematical Models for Engineering Science
ISBN: 978-960-474-252-3 146
on a gas supersonic jet of Xenon as target. He utilizes these devices allow
relevant applications in microscopy analysis since they permit to obtain images of flash of life of the tested biological sample. A scientific
collaboration with the ENEA Frascati- Fusion Department is started. The aim
of this collaboration is studying the dust mobilization problem inside the nuclear fusion reactors. In this line he is studying the possibility to measure
the evolution of the dusts, in case of losses of void inside the reactors, through
the use of laser scattering radiation. On the same collaboration he is analyzing signal acquired from High Resolution Thomson Scattering system (HRTS) at
JET in Culham (UK).
From January 2007 Research at University of Rome Tor Vergata.
He is author of 93 papers, 51 articles published on International Journal and
Proceedings, one Italian Patent and 28 communications at International and National Congress.
He is a member of European Optical Society since 2004.
A.Malizia
PhD in Quantum Electronics and Plasma Physics. Research
field : Analysis of dust mobilization problems in case of Loss of Vacuum Accidents (LOVA) inside fusion nuclear reactors
(like ITER), experimental activity. Stager at JET (Joint
European Torus) : •Analysis of Joint European Torus (JET) diagnostics system
•Analysis of Joint European Torus (JET) techniques to
manage the components affected by a beryllium contamination
•Analysis of Joint European Torus (JET) procedures and instrumentations used to control loss of vacuum in the
plasma chamber.
Consultant in Chemical - Biological- Radiological - Nuclear Protection (CBRN Protection), Didactical Coordinator of Master of Science in "
Protection From CBRN events, Tutor in Optical Physics and General Physics.
I.Lupelli:
Ivan Lupelli hold a M.Phil. in Energy Engineer at University
of Rome ―Tor Vergata‖, he has worked during a grant in ―Business Lab‖ FILAS Project on development of models
for forecasting, monitoring and controlling energy
consumption in industrial sector. In his professional career he has worked for engineering company as consulting
engineer in mechanical plants, occupational and fire safety
(civil and commercials buildings, student residences, industrial buildings, television and radio broadcasting studio). He is Ph.D. candidate in Quantum
Electronics and Plasma Physics at University of Rome ―Tor Vergata‖.
Specific research topics include numerical simulations of LOVA event and multiphase phenomena in nuclear fusion reactors. Research interests include
nuclear fusion safety, energy system, performance-based approach to fire
safety design and occupational safety.
Mathematical Models for Engineering Science
ISBN: 978-960-474-252-3 147