experimental astrophysics with high power lasers and z pinches
TRANSCRIPT

UCRL-JRNL-209064
Experimental astrophysics withhigh power lasers and Z pinches
B. A. Remington, R. P. Drake, D. D. Ryutov
January 18, 2005
Reviews of Modern Physics

Disclaimer
This document was prepared as an account of work sponsored by an agency of the United States Government. Neither the United States Government nor the University of California nor any of their employees, makes any warranty, express or implied, or assumes any legal liability or responsibility for the accuracy, completeness, or usefulness of any information, apparatus, product, or process disclosed, or represents that its use would not infringe privately owned rights. Reference herein to any specific commercial product, process, or service by trade name, trademark, manufacturer, or otherwise, does not necessarily constitute or imply its endorsement, recommendation, or favoring by the United States Government or the University of California. The views and opinions of authors expressed herein do not necessarily state or reflect those of the United States Government or the University of California, and shall not be used for advertising or product endorsement purposes.

1
Experimental astrophysics with high power lasers and Z pinches
Bruce A. RemingtonLawrence Livermore National Laboratory
R. Paul DrakeUniversity of Michigan
Dmitri D. RyutovLawrence Livermore National Laboratory
For submission to Reviews of Modern PhysicsDecember 21, 2004
With the advent of high energy density (HED) experimental facilities, such as
high-energy lasers and fast Z-pinch, pulsed-power facilities, mm-scale quantities of
matter can be placed in extreme states of density, temperature, and/or velocity. This has
enabled the emergence of a new class of experimental science, HED laboratory
astrophysics, wherein the properties of matter and the processes that occur under extreme
astrophysical conditions can be examined in the laboratory. Areas particularly suitable to
this class of experimental astrophysics include the study of opacities relevant to stellar
interiors; equations of state relevant to planetary interiors; strong shock driven nonlinear
hydrodynamics and radiative dynamics, relevant to supernova explosions and subsequent
evolution; protostellar jets and high Mach –number flows; radiatively driven molecular
clouds and nonlinear photoevaporation front dynamics; and photoionized plasmas
relevant to accretion disks around compact objects, such as black holes and neutron stars.

2
Table of Contents:
I. Introduction 3
II. Facilities and capabilities 6
III. Opacities and Cepheid variables 13
IV. Hydrodynamics of core-collapse supernovae 19
V. Supernova remnants and radiative shocks 35
VI. Protostellar jets and high Mach-number flows 47
VII. Eagle Nebula and photoevaporation front dynamics 53
VIII. Planetary interiors and equations of state 63
IX. Compact object accretion disks and photoionized plasmas 68
X. Outlook for the future 72
References 76
Figure captions 106
Tables 118
Figures 120

3
I. INTRODUCTION
Over the past two decades, we have seen the emergence of a new experimental
capability in the form of high energy density (HED) facilities. These include high power
lasers and fast magnetic pinch machines (“z-pinch”), which were developed largely as a
result of the national inertial confinement fusion (ICF) program. [Lindl, 2004; Matzen,
2005]. Hand in hand with the emergence of these HED experimental faciltites came the
realization that a new class of laboratory astrophysics could be pursued. [Ripin, 1990;
Rose, 1991, Remington, 1999; Drake, 1999; Remington, 2000; Takabe, 2001] This new
class of experimental HED astrophysics is complementary to but distinct from traditional
laboratory astrophysics, such as measurements of low energy nuclear cross sections. The
new HED facilities allow matter to be placed, reproducibly, in extreme states of
temperature, density, and velocity. Measurements of these conditions and their evolution,
when properly diagnosed, allow theoretical models and computer simulation codes to be
tested under the extreme conditions relevant to HED regimes of astrophysics. Examples
include measurements of (1) opacities relevant to stellar interiors, [Rogers, 1994, 1998;
Arnett, 2001; Chenais-Popovics, 2002; Bailey, 2002; Wang, 2004] (2) the phase,
conductivity, and equations of state of matter under conditions relevant to planetary
interiors, [Saumon, 2004] (3) scaled, strong-shock-driven turbulent dynamics relevant to
supernova explosions, [Robey, 2003] and (4) ionization states of radiatively pumped
photoionized plasmas relevant to accretion disks surrounding black holes or neutron stars.
[Foord, 2004] Such measurements allow astrophysical models and large-scale simulation
techniques to be tested and verified under relevant conditions. In each of these four
areas, astrophysical models and simulations have been tested against HED laboratory

4
data under relevant conditions, leading to improvements in the models or modeling
techniques, or a realization of the limitations of the simulation methods.
To achieve the relevant high-temperature, high–pressure, or strong shock
conditions requires focusing macroscopic amounts of energy (E > ~1 kJ) into
microscopic spatial scales (L < ~1 mm) over very short time intervals (δt << 1 µs). This
allows the heating rates to greatly exceed the losses, resulting in high temperatures,
pressures, and densities. High energy, pulsed lasers achieve this by their ability to focus
their energy into microscopic volumes over nanosecond time scales. Magnetic pinch
facilities (z-pinches) achieve this by discharging large currents (> ~ 1 MA) through a
cylindrical can or wire array that then implodes due to the J x B forces. Upon stagnation
on the axis, the kinetic energy of the imploding wires is converted into an intense burst
of heat and radiation. Both approaches for achieving HED conditions in the laboratory
have been developed very successfully over the past two decades. Sophisticated time-,
spatially-, and spectrally-resolved diagnostics have also been developed. [Landen, 2001;
Koch, 1999; Budil, 1997; Heeter, 2001; Boehly, 1999] It was only after the deployment
of such diagnostics on these facilities that the field of HED laboratory astrophysics
emerged and has grown..
The connections to astrophysics achievable on these HED facilities have been
pursued vigorously over the past decade, and the rate of progress has been steadily
increasing. This is the topic of our review article, which is written with two separate
audiences in mind: plasma physicists (such as laser experimenters, for example) and
astrophysicists. We try to discuss each topic at a level that an interested researcher, not
necessarily expert in the specifics, can still follow the essence of the discussion. Ample

5
references are given, so that more in depth reading can easily be pursued. In Chap. II, a
discussion of HED facilities is given, along with descriptions of typical classes of
experiments. Chap. III is dedicated to a discussion of opacities, and their impact on
pulsating stars, such as the Cepheid variables. We discuss supernovae and supernova
remnants, along with relevant laboratory experiments, in Chaps. IV and V. Protostellar
jets, high Mach-number flows, and relevant experiments are discussed in Chap. VI. The
dynamics of photoevaproation fronts in radiatively driven molecular clouds, such as the
Eagle Nebula, are described in Chap. VII. Planetary interiors, and the properties of
matter under extreme states of pressure and density are the subject of Chap. VIII, and the
radiatively dominated conditions around an accreting compact object are discussed in
Chap. IX. We conclude with an outlook for the future in Chap. X.

6
II. FACILITIES AND CAPABILITIES
A. Introduction
The emerging field of high energy density laboratory astrophysics could not have
developed 20 years ago. The necessary energy sources and diagnostic technologies did
not exist. In the present chapter, we provide an overview of the remarkable facilities that
can concentrate energy to levels of MJ/cm3, and then diagnose the results as a function of
time, space, and spectral content.. We begin with a description of pulsed, high-energy
lasers and fast Z pinches and then discuss two examples of typical astrophysics-related
experiments.
B. High-Energy Lasers
A number of high-energy lasers have been constructed during the past 30 years,
motivated by the challenge of achieving “inertial confinement fusion”. The long-term
goal is to create miniature fusion explosions with an energy gain of about 100. Such a
laser system begins with a very high-quality laser beam, initially of low energy, which
propagates through and extracts energy from Nd-doped laser glass. The first challenge is
to prevent defects and diffraction from damaging the laser components as the energy per
unit area of the laser beam reaches high levels. The second is to extract a large fraction of
the stored energy. The first challenge was met in the 1970’s, leading to several high-
energy lasers capable of delivering > 1 kJ of laser energy to a target. The largest of these
lasers include the Omega laser, at the Laboratory for Laser Energetics of the University
of Rochester (Boehly et al., 1995), the Gekko XII laser, at Osaka University in Japan
(Miyanaga et al., 1997), and formerly the Nova laser at the Lawrence Livermore National
Laboratory (Campbell et al., 1986). A number of similar but smaller lasers have also

7
contributed to the results discussed below, such as LULI at Ecole Polytechnique in Paris,
France; Nike at Naval Research Laboratory; Vulcan at Rutherford-Appleton Laboratory
near Oxford, England; Trident at Los Alamos National Laborataory; Helen at Atomic
Weapons Establishment laboratory in Aldermaston, England; and Janus at Lawrence
Livermore National Laborataory.
Figure II.1a shows one example of such a laser system, the Omega facility, which
can deliver 30 kJ to a target. The laser occupies approximately the area of one
(American) football field. The initial laser beam, formed and amplified in the center of
the laser bay, is split, amplified further, and eventually feeds the 60 amplifier chains that
proceed down the sides of the laser bay toward the output end. Frequency conversion
crystals then triple the frequency of these laser beams, decreasing their wavelength from
1.05 µm to 0.35 µm, and mirrors direct the laser beams toward the center of the target
chamber. Typical laser pulse durations can range over 0.2 – 5 ns, and shapes can be flat-
topped, Gaussian, or custom-designed shapes. The beams can be individually pointed
and focused, and within limits, individually timed. Spot intensity spatial profiles can be
tailored with phase plates, with spot diameters in the range of 0.2 – 1 mm. Larger spots,
up to ~3 mm diameter, can be achieved by removing the phase plates, and defocusing the
beam.
The second challenge cited above, of using the stored energy more efficiently, is
being met by the National Ignition Facility (NIF), now under construction at Livermore
(Hogan et al., 2001; Miller, 2004; Moses, 2004), and by the Laser MegaJoule (LMJ)
under construction in France (Bettinger and Decroisette, 1999). For the laser beam to
extract more of the stored energy it must pass through the Nd-doped glass several times,
8
without destroying the quality or the focusability of the laser beam. The NIF and LMJ
laser systems, with 192 and 240 beams, respectively, are anticipated to deliver ~2 MJ of
laser energy to a target. This will enable the study of larger, hotter systems involving
stronger shock waves and higher energy density configurations. Important new regimes
will become accessible with these higher energy lasers; as discussed briefly in Chap. X.
C. Fast Z pinches and other pulsed-power facilities
Pulsed power devices are also proving to be very useful for experiments related to
astrophysics. A pulsed power machine delivers a large current (and voltage) to a load, in
a short, intense pulse (varying from a few ns to a few hundred ns). The most common
device driven by pulsed power is a Z pinch [Ryutov et al., 2000]. In a Z pinch, stored
electrical energy drives a large current through a cylindrical conductor, resulting in a
large magnetic pinch force. This force accelerates the conducting matter inward, causing
it to collide at the center of the pinch, converting kinetic energy to thermal energy, much
of which is radiated as x-rays.
The largest of the existing Z pinch facilities is the “Z” generator at Sandia, shown
in Fig. II.1b, which can generate a current of 20 MA; it is now being refurbished to
increase the current to ~30MA and provide a substantial degree of control over the pulse
shape (Matzen, 2005). There exist also two 5-10 MA facilities, the Saturn facility at
Sandia, and Angara-5 at Troitsk (Russia), as well as several 1 MA facilities, of which the
MAGPIE generator at the Imperial College (London) is used most actively for
experiments in laboratory astrophysics.
Z-pinch experiments permit several possible applications. First, by using an
array of hundreds of high-Z wires, one can obtain very efficient conversion of electrical
9
energy into thermal x-rays [Sanford et al., 1996]. The Z machine at Sandia National
Laboratories, as shown in Fig. II.1b, for example, can produce nearly 2 MJ of thermal x-
rays at a temperature above 1 million degrees. This x-ray energy can be used to launch a
shock wave, but with much more energy and over a much larger area than is possible in
laser experiments, which can be an advantage [Drake, 2002]. Second, by using many
wires of moderate-Z material, one can produce very large fluxes of Kα x-rays at energies
of a few keV. This is useful for radiation transport experiments. Third, by manipulating
the wires themselves, one can produce other effects of interest. For example, by using a
conical wire array one can produce a jet of material that radiatively collapses and is
relevant to astrophysical jets [Lebedev et al., 2002].
In addition to Z pinches, it has been demonstrated that pulsed power devices can
use J x B forces to accelerate flyer plates. Specifically, the Z machine has accelerated 9
mm square, 0.35 mm thick plates of Al to velocities above 20 km/s [Knudson et al.,
2001, 2003]. Used as flier plates, this permits equation of state experiments at pressures
above a Mbar (1012 dynes/cm2), which, together with work done on lasers, is directly
relevant to the interiors of gas giant planets.
D. Astrophysics Experiments
The experiments discussed in this article typically use one of two basic methods.
In “hohlraum” experiments, known in inertial fusion as “indirect drive”, a number of
laser beams are used to irradiate the inner surface of a cavity made of a high-Z material;
the beams penetrate the cavity through several (small) holes. This is a hohlraum.
Energies of tens of kJ heat few-mm-scale hohlraums to temperatures of kT = 100-200 eV.
The experimental package may be located inside the hohlraum, to locate a sample within

10
a uniform x-ray environment, outside the hohlraum, to control the orientation of the x-ray
flux to it, or on the side of the hohlraum, to produce planar acceleration of the package.
Many such experiments begin with the use of ablation by the soft x-rays the hohlraum
contains, in order to create a pressure that drives a shock wave into some material. Other
experiments are designed so that the x-rays in the hohlraum penetrate and heat the
material to be studied.
The hohlraum geometry can also be created in the z-pinch diode. In this case, the
fast pinch is formed on the axis of the hohlraum. The experimental package can be
situated either inside the hohlraum, or on its surface; secondary hohlraums can also be
used (See Sec. VIII.B in Ryutov, Derzon, Matzen, 2000). An experiment using a z-pinch
driven primary plus secondary hohlraum is shown in Fig. II.2a. This experiment, which
is discussed further in Chap. III, measured the opacity of iron under conditions relevant to
stellar envelopes, and was directly relevant to reducing the uncertainties in the models of
pulsating stars, the so-called Cepheid Variables. [Springer, 1997] The z pinch at the
Saturn pulsed power facility at SNLA drove concentric primary and secondary
cylindrical hohlraums. An iron sample placed in the secondary hohlraum was heated to
equilibrium temperatures of ~20 eV at a density of ~10-4 g/cm3. Using a high
transmission grating spectrometer, the transmission of broad band x rays, from the
Planckian hohlraum radiation field, through the sample was spectrally recorded, which
allowed the opacity of Fe to be determined with high spectral resolution, as shown in Fig.
II.2b. This data set was used to test models of the opacity of Fe under stellar envelope
conditions.

11
The other typical setting is a so-called “direct drive” setting, used on high
intensity lasers (not on z pinches), where the laser beams are focused directly on the
experimental target. Figure II.2c and II.2d illustrates such an experiment at the Omega
laser. The Omega system was built to study “direct drive” laser fusion, in which the laser
beams directly strike a capsule, causing it to implode and produce fusion. This explains
the large number of beams (60) and their even distribution (Fig. II.1). On Omega, a
planar shock can be launched using at most 12 (of the 60) beams, only 6 of which are
close enough to normally incident to be strongly effective. In this case the ablation by
the laser irradiation creates the pressure that launches the shock to initiate the experiment.
The experiment shown in Fig. II.2.c shows a ~120 µm diameter solid Cu sphere
embedded in a solid plastic cylindrical tube. [Robey, 2002; Klein, 2000, 2003] The laser
drive launches a strong shock down the tube of CH (ρ ~1 g/cm3), which has decayed to
Pshk ~12 Mbar by the time it reaches the location of the Cu sphere. Upon passage through
the Cu sphere, the shock compresses it, and induces vortical flow, morphologically
similar to a smoke ring. The evolution of this shock-sphere dynamics is captured in a
sequence of side-on x-ray shadowgraph images (radiographs), shown in Fig. II.2d. The
gold spatial resolution grid shown in the upper left-hand corner of the images has a grid
spacing of 63.5 µm., and is used to simultaneously measure magnification and spatial
resolution of the x-ray imaging camera used. This experiment is discussed in more detail
in Chap. V.
In many experiments, whether hohlraums or direct laser irradiation are used,
additional laser beams produce x-rays for diagnostic purposes. In fact, one often uses
more laser beams for this purpose than to drive the experiment. Some of the beams may

12
be used to irradiate a small spot on a material plate, situated behind the experimental
package and known as a backlighter. Under laser irradiation, this plate produces
energetic x-rays, typically in an emission line or band. The x-ray energy is chosen so that
components or structures in the target selectively absorb these x-rays. When they are
imaged onto a detector, the result is a radiograph of the target not unlike the chest x-ray a
doctor may request. In addition, these diagnostic x-rays can also be used for absorption
spectroscopy or for time-resolved measurements. We will describe below the results
from a wide variety of experiments utilizing similar techniques as those illustrated in Fig.
II.2. The specific configuration and diagnostic details of each individual experiment
presented will not be discussed in any depth, to allow a wider selection of results to be
shown. Details for each specific experiment can be found in the references.

13
III. OPACITIES AND CEPHEID VARIABLES
Understanding the evolution of stars from birth to death forms one of the
fundamental challenges facing astronomers and astrophysics. A star begins from an
initial “rapid” (several x 106 yrs) gravitational collapse of a dense clump in a molecular
cloud, in a region where the Jean’s (gravitational) instability dominates other dynamics
[eg., τJeans = (4πGρ)1/2 < other dynamic time scales in the cloud]. If the mass of the star
exceeds about 0.1MSun, the central temperature and density reach the point where
thermonuclear fusion of hydrogen into helium becomes the dominant energy source. At
this point, the star settles into its main sequence phase in the Hertzsprung-Russell (HR)
diagram (a plot of luminosity versus temperature or equivalently, magnitude versus
spectral type). [Hansen & Kawaler, 1995; Bohm-Vitense, 1989] When approximately
10% of a star’s original hydrogen is converted to helium, hydrogen depletion in the core
starts to become significant. At this point, the careful balance between core-generated
thermal pressure due to nuclear burning and the inwardly directed gravitational force is
perturbed, upsetting the condition of hydrostatic equilibrium, and the core starts to
contract. This contraction increases the temperature and density to the point where
helium burning begins, leading to a corresponding rise in the energy generation rate and
luminosity. The star enters its “blue-loop” phase.
If the star is sufficiently massive, M ≥ 5MSun, its blue loop excursion is
sufficiently large that its path on the HR diagram crosses, and more importantly, lingers
in the Cepheid instability strip, shown in Fig. III.1a. [Bohm-Vitense, 1989] In this phase,
an interesting global dynamics can occur, namely, stellar pulsation. All stars in this strip
are observed to pulsate, with luminosities varying by factors of up to 2 or 3 over periods

14
of days to weeks. The classical Cepheids refer to the δ Cephei supergiant stars, which
are the brightest in this class of variable stars. Several other classes of stars also fall into
the Cepheid instability strip and are variable, such as the RR Lyrae, δ Scuti, and W
Virginis variables. Understanding the mechanisms underlying such stellar pulsations has
been an ongoing challenge in astophysics.
A remarkable feature of Cepheid variable stars is that their pulsation periods, P,
are proportional to their average luminosities, as shown in Fig. III.1b. [Bohm-Vitense,
1989] Stellar pulsations result from a driven resonant standing compression wave of the
star. Bigger stars are more luminous, and by virtue of their larger size, will have longer
periods of pulsation. This relationship can be expressed as
PQ
sun
=( / ) /ρ ρ 1 2
where Q is a constant, ρ is the average density of the pulsating star, and ρsun is the
average density of the sun, ρsun g cm≈1 4 3. / . For a given mass, (spatially) larger stars are
more luminous, have lower average density, and longer period of oscillation, hence the
luminosity-period correlation.
The criteria to set up a global standing wave in a star is based on hitting a
resonance between a driving force and one or several normal modes of oscillation
(pulsation) in the star. Consider first a fictitious adiabatic star, [Bohm-Vitense, 1989] and
assume a small pulsation randomly began, say, near to the convection layer. At peak
compression, the temperature would be maximum, due to the P.dV work done on the star
by gravity. At peak expansion, the temperature would be minimum, due to the P.dV
work done by the star on itself by expanding. Radially outward velocity would be
maximum at the equilibrium radius as the star was expanding outwards. If the star were

15
truly adiabatic, this pulsation would continue forever, never growing (or decreasing) in
amplitude. This would definitely not lead to the large global pulsations of ~20% in
radius characteristic of Cepheid variable stars. To generate a global pulsation requires a
resonant driving force, a condition that can result from a nonadiabatic heat flow. Similar
to pushing a swing at its resonance frequency, as the star leaves peak compression and
moves into its expansion phase, e.g., near the point of peak outward velocity, there needs
to be a slightly increased outward push. This can be due, in this case, to a higher interior
temperature and hence, higher pressure. This added outward push in phase with the
oscillation causes the pulsation amplitude to increase, leading to a variable star. The
resulting phase relations are shown in Fig. III.1c for a δ Cephei star, showing periodic
oscillations of magnitude, temperature, spectral type, radial velocity, and radius. Notice
that radial velocity peaks in phase with temperature, which is proportional to pressure,
and which occurs just after the star leaves peak compression (∆R = 0), and starts to
expand.
Opacity plays a key role in causing this resonant temperature enhancement. For a
solar mixture of H, He, and “metals” (Z ≥ 3), the Rosseland mean opacity is shown as a
function of temperature, for a constant value of ρ/T3, in Fig. III.2a. [Rogers, 1994] There
are bumps or broad peaks in the average opacity as temperature is increased,
corresponding to thermal energies sufficient to excite or ionize H, He, and the higher-Z
metals through their various electron shells. On the rising side of one of these bumps
(sometimes called “κ mountains”), resonant conditions can occur in the heat flow that can
lead to stellar pulsations. As the star contracts, the temperature rises, increasing the
opacity, which allows less radiative heat from the core to leak out, raising the temperature

16
and pressure even further. This leads to a slightly enhanced outward push as the start
starts its outward movement, in resonance with the oscillatory motion of the star. Near
peak expansion, the temperature drops due to the work done by the star on itself. This
lowers the opacity, allowing more radiative heat to leak out, dropping the interior
pressure, allowing the star to contract more strongly. The result is that in this resonant
condition, the amplitude of global oscillation increases, leading to a pulsating star. These
pulsations do not increase in amplitude indefinitely, however. Once the pulsation
amplitudes become large enough that the heating during compression takes the opacity
over the top of the “κ mountain”, the opacity drops on compression, allowing radiation to
leak out, and serving as a damping mechanism.
There is an intimate connection between stellar pulsation period and opacity. The
global oscillations are standing sound (compression) waves in the star, so period must be
proportional to the ratio of star diameter to average sound speed. But sound speed varies
with temperature as T1/2. Since a higher stellar opacity holds in heat by inhibiting
radiative heat losses, temperature is a monotonically increasing function of opacity. The
result is that an increased stellar opacity leads to a shorter period of pulsation. This is
summarized by writing the following approximate relation for stellar oscillation period,
PD
c
D
T
Dstar
s
star starn
∝ ∝ ∝1 2 2/ /κ
where Dstar and cs correspond to the stellar diameter and average sound speed. For
simplicity, we have assumed, over a small enough interval of temperature on the rising
side of the bump, that κ ~ Tm, and n = 1/m. This period-opacity relation is portrayed
rather dramatically in a plot of the period of oscillation of the second harmonic (P1)
versus the period of the fundamental mode (P0) for beat Cepheids, shown in Fig. III.2b.

17
Using old opacities, which did not include all the relevant transitions for the metals, in
particular Fe, the calculated opacities were too low and the calculated pulsation periods
were too large. [Cox, 1976] When a more complete accounting of the Fe opacities was
taken in OPAL, [Iglesias, 1991; Rogers, 1992] the calculated periods for the beat
Cepheids were brought into much better agreement with observations, as shown in Fig.
III.2b.
Opacity calculations are enormously complex, especially for higher Z materials
(Z > several). The OPAL calculations have been improved by comparison with
experiments under a variety of conditions, as shown in Figs. III.2c and III.2d. In one of
the first Fe opacity measurements, done on the Nova laser, one laser beam with a
wavelength of 0.53 µm was used to heat a 250 nm thick Au foil by direct irradiation with
a square 1-ns pulse of 3.3 kJ. [Da Silva, 1992] The x-ray flux thus generated
volumetrically heated and expanded a 20 nm sample of Fe to a temperature of ~35 eV at
densities of ~10 mg/cm3. A second laser beam with a 2-ns square pulse of 0.53 µm light
irradiated a second Au foil, generating backlighter x-rays whose transmission through the
sample was measured with a time-resolved (“streaked”) XUV spectrometer. The
measured Fe transmission spectrum, shown in Fig. III.2c, showed a dominant absorption
feature centered at 70 eV, corresponding to an important ∆n = 0 (n = 3 to n = 3)
transition, overlooked in previous opacity calculations, such as that shown by the upper
curve corresponding to a DCA calculation. [Cox, 1976; Rogers, 1994] The newer
OPAL-DTA calculations, including term splitting, [Iglesias, 1991; Rogers, 1992]
reproduce this feature quite well. Transitions such as this, missing in previous opacity
calculations, leadsto the enhanced opacities in the models of beat Cepheid variables, that

18
allow the models to more closely reproduce the observed pulsation frequencies, as shown
in Fig. III.2b.
Opacity models differ more significantly at lower densities, ρ < 1 mg/cm3, where
density induced line broadening and smearing is lower. Under these conditions, “forests”
of fine-structure transitions can be resolved experimentally The time scales to achieve
steady-state, LTE conditions at lower densities, however, is longer. In this regime, large
Z-pinch facilities offer a more attractive setting for such opacity measurements. Their
characteristic time and spatial scales are longer. An example of a key opacity experiment
done on Fe on the Saturn z-pinch facility is shown in Fig. III.2d. [Springer, 1997] In this
experiment, the 9 MA Saturn z-pinch was used to drive a primary hohlraum to Tr = 70
eV. This, in turn, drove a much larger secondary hohlraum to 20 eV. The Fe samples
under investigation were located in the secondary hohlraum, and attained steady-state
ionization conditions at Te = 20 eV and ρ = 10-5 g/cm3, over a period of ~50 ns. A time-
gated transmission grating spectrometer measured the spectrum of black-body radiation
transmitted through the Fe sample. This was then compared with predictions of various
LTE opacity models, as shown in Fig. III.2d. The STA model, [Bar Shalom, 1989]
which averages over large groups of configurations, overpredicts the transmission data in
this regime, whereas the UTA model [Iglesias, 1994] underpredicts the data. The OPAL
calculation, [Iglesias, 1991; Rogers, 1992] which capture the complex arrays of fine-
structure absorption lines, falls in between in the figure, and is in much better agreement
with the data (shown in Fig. III.2b). Experimental measurements such as those shown in
Figs. III.2c and III.2d are indispensable in refining and “calibrating” sophisticated opacity
models such as OPAL.

19
IV. HYDRODYNAMICS OF CORE-COLLAPSE SUPERNOVAE
A. Introduction
Supernovae (SNe) involve a very broad range of physical processes. Their
description requires the use of very diverse areas of science such as particle physics,
general relativity, and hydrodynamic stability and turbulence. Furthermore, there are
several types of SNe, with different mechanisms of energy release.
The kinetic energy release in a typical SN event is ~1051 erg, of which only a few
percent is emitted as visible light. Still, supernovae can often be brighter than their entire
host galaxy. The light as detected by optical telescopes does not come from the core,
where the energy release has occurred, but rather from a photosphere, which is heated by
a complex combination of hydrodynamic flows and radiative transport. The connection
between the energy release in the SN core and the visible light curve requires an accurate
description of of material and radiation transport. Opacities in particular play a critical
role in modeling radiation transport. In this area, laboratory experiments are making
significant contributions by providing direct measurements under conditions relevant to
the actual astrophysical problem.
A nice description of the SN phenomenology, as well as existing theories of their
formation, can be found, e.g., in the book by Arnett (1996). Other papers of general
interest include Bethe (1990), Woosley (1990), and Woosley and Eastman (1997). Some
more recent surveys can be found in “Cosmic Explosions” (Proc. 10th Astrophysical
Conference, College Park, Maryland, 1999, AIP Conference Proceedings # 522).

20
Supernovae are believed to explode by two fundamental mechanisms: collapse of
the core (in large stars) and thermonuclear explosion (in small stars below 8 solar masses
at birth). The classification into types is based on spectra and is too involved to discuss
here. We will focus on only the predominant core-collapse SNe (Type II) and the
predominant thermonuclear SNe (Type Ia). Type II SNe are thought to occur as the result
of a gravitational collapse and neutronization of the iron core of the star; their formation
is accompanied by the generation of a short but very intense burst of neutrinos, which
carry away some 99% of the released energy. The energy deposited from the neutrinos
initiates a blast wave near the center of the progenitor star, which ultimately blows the
star apart, giving rise to a tremendous increase of luminosity. The collapsed core forms a
neutron star that might later be detected as a pulsar. The experiments discussed in
Sections C-E are relevant to Type II SNe.
Type Ia SNe are believed to be caused by a thermonuclear burn of carbon-oxygen
white dwarfs. One of the key problems in the physics of this system is a propagation of
“flame” from the ignition point, specifically, the stability of the flame and its transition
from a sub-sonic burn (deflagration) to a supersonic detonation. There is a significant
amount of information on these issues obtained in the experiments with propagation of
chemical flames, summarized in particular by Williams (1985), with more recent work
involving Khokhlov and others reviewed by Drake (1999). In the present experiments on
existing high-power lasers, it seems unlikely that conditions for the thermonuclear burn
of a DT mixture and propagation of ignition from a hot spot can be reached. Such
conditions perhaps will be reached with the NIF and the Laser Megajoule facilities that
are now under construction (see Sec. II). Type Ia SNe are used as “standardized candles”

21
to measure the distances to high-redshift galaxies, and provide the essential data
supporting the present conclusion that the expansion of the universe is accelerating
(Kirschner, 1999; Perlmutter et al, 1999).
Among the broad array of problems related to SN explosions, we shall
concentrate mainly on the laboratory simulation of hydrodynamic phenomena in Type II
SN explosions. We choose this subset because multi-dimensional hydrodynamic effects
are thought to be very important (see Sec. IV.B for more detail) and there already exist
successful experiments of this type, related to the shock breakout through the He-H
interface. In addition, the analysis of the scalability and other constraints can be nicely
illustrated; this example can serve as a template for similar analyses of the other
problems. At the conclusion of this section, we shall mention the role played by opacities
and radiation transport in the SN light curve.
B. Multidimensional Hydrodynamics in Core-Collapse Supernovae
It is believed that the progenitor star, just before the SN explosion, has a layered
(“onion-skin”) structure, with a dense core of higher Z elements (Z > 2) surrounded by
layers of helium and hydrogen (Fig. IV.1 from Shigeyama and Nomoto, 1990) The
observed light-curve for the most famous recent supernova in the Large Magellanic
Cloud, SN 1987A, is shown in Fig. IV.2.
Theoretical analyses have shown that it is impossible to explain the explosion of
Type II SNe without taking into account 2D and 3D hydrodynamic effects. The energy
deposition by neutrinos in the zone surrounding the collapsing core is insufficient, in a
spherically-symmetric case, to drive the explosion of the outer layers of the star.

22
Complex non-spherically-symmetric motions must be involved, and only their inclusion
(in a phenomenological manner) by Bethe and Wilson (1985) allowed a plausible model
for supernova explosions to be created.
Another problem where 3D motions are important is the post-collapse mix of the
inner parts of the star, mainly heavy elements into the outer parts, mainly hydrogen and
helium. The observed early appearance of heavy elements (like Ni56 and Co56) in the
photosphere of SN 1987A (see Sutherland, 1990, and references therein) is incompatible
with a spherically symmetric expansion; a lot of effort has been spent on developing a
mix theory based on the Rayleigh-Taylor (RT) instability. The results of a high resolution
2D core-collapse SN simulation, shown in Figure IV. 3, (Kifonides et al., 2000)
illustrates the spikes produced in the strongly nonlinear stage of the RT instability. A
principal motivation of the experiments discussed below is to test multidimensional
simulations of the RT instability in the deep nonlinear to turbulent regime, due to the
failure of such simulations to explain the SN observations. Two possibilities follow: the
simulations might be in error or other physics might be responsible for the observations.
Well-scaled experiments have shown that the simulations are probably correct with
regard to the large-scale RT behavior.
However, the experiments have also led to the realization that hydrodynamic
turbulence might affect the behavior of SNe in ways the simulations cannot reproduce.
This is one example of other physics with the potential to affect the observed quantities.
Experiments now underway are addressing this possibility. Another example of other
physics is provided by spectropolarimetric observations of SNe, which allow an
evaluation of the asphericity of the explosion. These studies have shown that between
23
two weeks and two months after the explosion, most SNe manifest gross deviations from
spherical symmetry (Jeffery 1991; Trammell et al., 1993; Tran et al., 1997; Leonard et
al., 2000). These observations lead to the realization that the collapse of a rotating,
magnetized stellar core might produce polar jets that would perforate the outer layers and
quickly reach the photosphere, thereby providing one more explanation to the early
arrival of heavy elements in the photosphere (Fryer, 1999). A strong enough magnetic
field can break the spherical symmetry and may generate MHD instabilities that are
typically 3-dimensional and might produce such jets (LeBlanc and Wilson 1970; Spruit
1999; Wheeler et al. 2000, Fryer and Heger 2000, Reinhardt et al. 2001). This motivated
recent hydrodynamic calculations of jet-driven SNe explosions by Khokhlov et al.
(1999); Fig. IV.4 shows one of their results. Well-scaled hydrodynamic experiments
relevant to this model are also now underway.
The importance of non-spherically-symmetric hydrodynamics is also shown by
the fact that neutron stars usually receive a strong “kick” during the explosion that creates
them (Cordes, Romani, Lundgren, 1993; Lyne and Lorimer, 1993). This seems to imply
that there are significant gross asymmetries at the early stage of the implosion, which are
enhanced in the course of the implosion (Burrows and Hayes, 1996; Fryer, Burrows, and
Benz, 1998). In addition, relatively little is known about the effects of rotation. The
angular velocity of a progenitor varies both in radius and in the polar angle. The velocity
shear will grow during the implosion, causing the development of shear-flow-induced
turbulence, whose effect on the mix during the implosion may be an important factor
(Heger, Langer, and Woosley, 2000).

24
In summary, there are several complex and still unresolved hydrodynamic
problems which have a fundamental impact on our understanding of supernovae, from
the actual explosion mechanism through the late-time observables. A concerted effort on
these problems, theoretically, computationally, and experimentally, is necessary to make
further progress on the “SN problem”.
C. A sample problem: shock wave breakout through the He-H interface
The problem of shock wave breakout through the He-H interface can serve as a
test-bed for designing scaled laboratory astrophysics experiments. It allows one to clearly
identify the most important steps leading to the formulation of a scaled laboratory
experiment. These steps, which will be described in more detail in the following
subsections, are: 1) making sure that a hydrodynamic description is adequate; 2)
evaluating the role of nonhydrodynamic transport processes (such as heat conduction); 3)
determine the equation of state; 4) characterizing the initial conditions; and 5)
considering whether some simplification in geometry is possible (e.g., can some time
interval of evolution of a planar system adequately describe the evolution of a spherically
divergent system).
As a representative set of plasma parameters in the He-H transition region in SN
1987A (Table IV.1), we have chosen a set of parameters similar to those described in
Müller, Fryxell, Arnett (1991). In Table IV.1, L is the density gradient scale-length, v is
the characteristic velocity, T is the plasma temperature (the electron and ion temperatures
are equal), and ρ is the plasma density. The blast wave that blows the star apart first
accelerates and then decelerates the transition region. During the deceleration the

25
pressure gradient is outward. Because this opposes the inward density gradient, the
transitional zone is RT unstable. The characteristic acceleration experienced by a given
fluid element after the transit of the blast wave can be estimated as v/τ, with τ ~L/v, to
be v2/L~2.5⋅105 cm/s2. The gravitational acceleration is orders of magnitude smaller, and
is also negligible in the laboratory experiment to be discussed. The representative
parameters of the first laboratory experiment simulating the He-H interface instability
(Remington, 1997) are those listed in the lowest row of TABLE IV.1.
We will now quickly go through the five questions formulated at the beginning of
this section. As was shown in Ryutov et al, 1999, the hydrodynamic description applies
to both systems, although in the case of a supernova the pressure is dominated by
radiation, whereas in the laboratory experiment it is dominated by the gaseous pressure.
The viscosity and thermal conductivity are small (i.e., the Reynolds and Peclet numbers
are large). Under such circumstances, both systems can be adequately described by the
Euler equations (e.g., Landau and Lifshitz, 1987).
The dominance of the radiation pressure in the case of the supernova means that
the equation of state is that for the ideal gas with the adiabatic index γ=4/3. It is desirable
that the materials used in the laboratory experiment have equations of state deviating not
too strongly from that for the polytropic gas with γ=4/3., Even if some deviations are
present, however, one should not expect the appearance of any dramatic differences,
because the Euler equations are structurally stable with respect to moderate variations of
γ.
Setting up appropriate initial conditions for simulating 2D and 3D dynamics is
usually based on the analysis of 1D simulations, which determine the background

26
conditions for 2D and 3D perturbation evolution. There exist numerous simulations
describing propagation of the shock through the He-H interface (e.g., Muller, Fryxell,
Arnett, 1991; Kane et al., 2000). In their 1D version, all are quite reliable and all present
a similar picture of the distribution of main hydrodynamic parameters that is needed as a
background for the studying 2D and 3D hydrodynamics. An example of density and
pressure versus position across the He-H interface after shock passage (t ~ 2000 s) from
such a 1D simulation is shown on Fig. IV.5a.
In the laboratory experiment, the experimental package is driven by the ablation
pressure produced by the absorption of the intense radiation on one of the sides of the
package. By changing the power and temporal shape of the laser pulse, the time
dependence of the ablation pressure can be varied, within limits. The temporal evolution
of the shock wave strength and the density and pressure distribution near the RT unstable
interface can therefore be tailored. One can also vary the materials constituting the
package and thickness of the layers. Figure IV.5b shows, at t = 20 ns, the profiles for
density and pressure versus position across the interface between copper and plastic
obtained in this way. Indeed, these distributions are quite similar to those expected in SN
(Fig. IV5.a). The temporal dependence of the parameters in the simulation experiment
can be adjusted to resemble that of a supernova to a high degree of accuracy. This is
illustrated on Fig. IV.5c (Kane, 1999).
In the experiment by Remington et al. (1997) which will be described in more
detail in Sec. IV.E, a planar geometry was used. This means that this particular
experiment can imitate the real system for a limited interval of time, within which the
radius of the He-H interface has not changed by more than 20% or so. This, in turn,

27
means that only relatively short-wavelength perturbations can be simulated. Fig. IV.5d
shows a radiograph from this experiment. Later on, experiments in divergent geometry
have also been demonstrated (see below).
D. Issues of the hydrodynamic similarity.
One attraction of using laboratory experiments to assess the difference between
2D and 3D SN hydrodynamics is the ability to control and vary the initial conditions,
repeating an experiment as many times as needed, and deploying as many time-resolved
diagnostics as required. An additional requirement is that hydrodynamic similarity be
maintained in the key parameters throughout the experiment, despite the 10-20 orders of
magnitude differences in spatial and temporal scales.
A detailed analysis of the hydrodynamic and magnetohydrodynamic similarity
constraints is available (Ryutov et al, 1999, 2000a, 2001, 2002). This analysis has shown
that the similarity constraints can be relatively easily satisfied within the framework of a
so called Euler similarity, which holds provided the Reynolds and Peclet numbers are
sufficiently large in both systems. The similarity holds for the spatial scales larger than
the dissipative scale ∆diss, which is typically small compared to the global scale L.
We now briefly discuss the possible role of small-scale vortices. In the Rayleigh-
Taylor (RT) instability driven by the onset of an accelerating motion, dissipation-scale
vortices do not appear instantaneously: it takes several eddy turn-over times at the global
scale (several L/v) for them to appear. In other words, the Euler similarity (with
dissipative terms neglected) will correctly describe the early stage of the instability
evolution, until small-scale vortices are formed. [We are referring to smooth transition

28
layers, with a density scale-length L. If one deals with a sharp (zero-scale) transition,
small-scale perturbations may appear early in the pulse]. During this early stage there is
no need to make any assumptions about the turbulent viscosity, or introduce Reynolds
stresses, and other approximate descriptions. The Euler equations correctly describe this
stage of evolution, including the formation of smaller-scale vortices. In a number of
cases, including the SN explosion and its laboratory simulation, this means that
essentially the whole physical process is correctly described by the Euler equations, with
viscosity neglected. Within this time interval, ~ several L/v, the system already reaches a
very different state of strong mixing.
It is interesting, however, to assess what would happen later in time. To what
extent will the behavior of the two systems be similar at the larger scales, if their
Reynolds numbers, albeit very large, are different in the two systems (meaning that
relative values of the dissipative scales are different). The differences on the global scale
will be not very large; they will probably appear in terms of order lnRe. this behavior
has been observed in a number of relevant problems exhaustively studied experimentally.
Examples include turbulent pipe flow (e.g., Landau, Lifshitz, 1987), and turbulent flow
past a localized object at high Reynolds number. (See Cantwell, 1981, Van Dyke, 1982,
and Gjevik, 1980 for excellent pictures of such flows over a broad range of Reynolds
numbers.) The issue of the development of dissipative scales in laboratory experiments
has been discussed recently by Dimotakis, 2000 and Robey, 2003a,b, 2004.
This problem warrants further study. Insights may be possible by carrying out a
set of experiments related to each other by a broader (than the Euler) similarity, a so-
called “perfect similarity,” (Ryutov, Remington, 2003a,b). where even the dissipation

29
scale would be perfectly mapped from one experiment to another. As this requires a large
change of the drive energy, the advent of the NIF lasere or the ZR magnetic pinch
facility may open up this possibility, although further progress in diagnostic
development may also allow one to obtain useful information on smaller-scale facilities.
E. Experiments on Supernovae Type II hydrodynamics.
For the past several years, a team of researchers has conducted a series of
experiments aimed at the problem of RT instabilities at the H-He interface. The point of
these experiments is to observe the dynamics of this process in a well-scaled
environment. In the context of the results, one can then ask whether the simulation codes
in fact calculate the deeply nonlinear behavior of the RT instability correctly, and
whether any other physics, not present in the simulations, appears in the experiments. All
these experiments begin by producing a shock wave, as discussed above, applying the
initial ablation pressure either through direct laser irradiation or through x-ray irradiation
(see Ch. II). The subsequent structure in the target then determines which aspects of RT
dynamics are being explored.
The first such experiments (Remington et al., 1997; Kane et al., 1997, 1998,
1999a, 2000) used the Nova laser to examine RT growth from a single-mode initial
perturbation at a planar interface. The target structure involved a 85-µm-thick Cu layer
followed by 500 µm of plastic (CH2 at ρ=0.95 g/cm3). The profiles of density and
pressure 20 ns after the laser pulse began are shown in Fig. IV.5b. The Cu-plastic
interface was rippled by a sinusoidal perturbation with a 200-µm wavelength and a 20-
µm amplitude. Figure IV.5d shows a radiograph of the resulting structure at 33 ns. The

30
distance from the valleys to the peaks in the observed modulations (known as the
“bubble-to-spike” distance) has become equal to the initial wavelength of 200 µm. This
is very nonlinear indeed. Simulations, using the astrophysical code PROMETHEUS
(Fryxell, Muller, and Arnett, 1991; Arnett, 1988) and the laboratory code CALE (Tipton,
1990), reproduced this result, but the details of the structures did not strongly resemble
what seems to be present in the rather poorly resolved data obtained in this first attempt.
Subsequent experiments (Robey et al., 2001) have both improved the quality of
the data and explored other aspects of RT dynamics, using the Omega laser. One aspect
explored has been RT grown in diverging systems, both cylindrical (Budil, 2000) and
spherical (Drake et al., 2002). In the spherically expanding case, a hemispherical plastic
capsule (of density 1.37 g/cm3, inside radius 220 µm, and thickness 110 µm) was
irradiated from the inside. It included a patch of Ge-doped plastic as a tracer for
radiography, and was in some cases modulated with an initial mode (70 µm wavelength,
10 µm peak-to-valley amplitude). The capsule was mated to a large volume of low-
density (50 –100 mg/cm3) foam. The unmodulated capsule retained its shape while
expanding nearly a factor of 3 in radius. The modulated capsules developed highly
nonlinear structures. This experiment was simulated using CALE and the front-tracking
hydrodynamic code FronTier (Glimm, Grove, and Zhang, 2001). Here again, and in the
presence of better data, the simulations reproduced the qualitative features but not the
exact quantitative details.
Another aspect of RT dynamics explored by experiments has been the coupling
between interfaces. In an exploding star, the initial modulations of any inner interface
introduce structure into the blast wave that can affect those interfaces outside it. The

31
experiment to examine this (Kane, et al., 2001) used the target structure shown in Fig.
IV.6a, with details described in the caption. This produced data shown in Fig. IV.6b.
One can see the Cu spikes, extending upward from below, and the modulations in the
second interface, made visible by the tracer strip in the plastic below the interface.
Detailed simulations of this experiment were carried out as part of a validation study
(Calder et al., 2002, 2004) for the next-generation astrophysical code FLASH, which
includes adaptive grids and other advanced features. Comparison of the simulation results
with the experimental images (Fig. IV.6b) supports the same conclusion as in the
previous cases. The qualitative features of the data are reproduced very well by the
simulations. Quantitatively, several details are not accurately reproduced, including the
exact spike length, the height of the structuring in the interface, and the behavior at the
edges of the system. In the specific case of the FLASH simulations, the length of the Cu
spikes was found to change with the number of levels of refinement in the simulation, but
did not appear to be converging toward the experimental value.
Experiments on the development of multi-mode perturbations and transition to a
turbulent mix at the interface have been carried out and analyzed in the context of their
correspondence to the code results, Robey et al., 2003; Miles et al. 2004a,b. In Robey et
al., 2003, the evolution of up to eight modes has been observed, and simulations in Miles,
2004a (Fig. IV.7) are in a reasonable agreement down to the scales determined by the
experimental resolution, which is ~ 10 microns (compared to the fundamental mode
wavelength of 50 microns). In Miles 2004b, the instability was driven by a strong blast
wave, giving rise to a Mach number for the growing perturbations as high as 0.1.

32
Surprisingly, in this case, the instability “remembers” small-scale details of the initial
conditions well into the nonlinear stage of the evolution.
The development of experimental capability has allowed experimentalists to
follow the evolution of the Rayleigh-Taylor instability into the turbulent regime. In the
papers by Robey et al. (2003) and Drake et al. (2004a) the experiment is described where
3D initial perturbations formed an “egg-crate” structure on the foam-plastic interface
whose stability was in question (the distance between the nodes was 71 µm). After the
passage of the shock, this interface experienced a long period of deceleration that led to
developing of a deeply nonlinear 3-dimensional Rayleigh-Taylor structure (Fig. IV.8, left
panel). According to Robey et al. (2003), the disappearance of the sharp transitions
between bubbles and spikes that is visible on the second and third panels may be
explained by the development of smaller-scale vortices, although, possibly, not yet
reaching the dissipation scale. Another interesting aspect reported in Drake et al. (2004)
is that the spikes can overtake the shock wave. This result was unanticipated by prior
simulations and models. Tentative explanations are related to the generation of additional
vorticity, triggered by some imperfections of the targets created during the machining
process, and to interactions between the spike tips.
It is reasonable to ask what the implications of the experiments to date are for the
questions asked above. It has been shown in several experiments that the simulations
correctly calculate the global features of deeply nonlinear RT dynamics. The details,
however, are not precisely reproduced and obtaining the level of agreement shown often
requires iteration of the simulation. Even so, from the point of view of such global

33
processes, it would appear unlikely that the simulations are sufficiently in error to explain
the observations from SN 1987A.
As to whether other physics appears that the codes do not address, the answer is
twofold. At the level of these simple yet deeply nonlinear systems, other physics does
not appear. The issue of the effect of the Reynolds number, which, although very large in
both laboratory and astrophysics, differs substantially between the two systems, is more
subtle. There is a chance that this question will also be solved in the near future.
F. Opacities and radiation transport relevant to supernovae
Exploding stars, ie, SNe, create a homologous expansion, where each radiating
region resides in a velocity gradient and sees plasma receding from it in all directions. In
other words, the absorbing regions are always red shifted relative to the emitting regions.
For photons emitted in one region to escape the star, they have to pass through
“windows” in opacity, where the absorption probability is low. To be able to construct a
synthetic light curve requires (1) access to high quality (“static”) opacity tables, and (2) a
radiation transport calculation including the effects of the Doppler shifts in the opacity
line and edge locations, due to the expansion. The opacity tables are produced by
calculations with sophisticated opacity codes such as OPAL (Rogers et al., 1996, Rogers
and Iglesias 1998).
Experiments have been conducted on various lasers to measure the LTE opacities
of a variety of materials, [Springer, 1997] and have already been discussed in Secs. II and
III (see Figs. II.2a,b and Figs. III.2c,d) in the context of Cepheid Variables. A different
class of experiment by Wark et al. (1994; 1995; 1997) and Patel et al., (2000) measured

34
radiation line transport in an expanding plasma (Fig. IV.9). The experiment studied the
structure of a doublet in the aluminum spectrum, at a wavelength near 7.18 Å. The
emission occurs from an optically thick plasma with a significant velocity gradient, so
that emission in one line of the doublet is often absorbed and re-emitted, at another
location in the plasma, by the other line. The resulting line structure is complex, but can
be reproduced by modeling only when this expansion effect on the radiation transport is
taken into account. Hence, experiments are under development to test opacity
calculations, both static and in expansion, relevant to SN light curves.
All in all, this work has shown that laser experiments can be carried out for
parameters that are scalable to those of actual SNe, and that several fundamental
questions regarding the dynamics, material transport, radiation transport, and simulations
can be answered. Relevant experiments on opacities and radiation flow are also very
suitable for the z-pinch facilities, such as Saturn and Z.

35
V. SUPERNOVA REMNANTS, BLAST WAVES, AND RADIATION
A. Introduction
The explosion of a star lasts only a few months. In contrast, the remnants from
these explosions, that is, supernova remnants (SNRs), can be observed for centuries if
not millennia. SNRs are the observable structures that form through the interaction of the
ejecta from a stellar explosion with the surrounding (circumstellar) environment. In
addition, SNRs are widely believed to produce most of the Cosmic Rays that irradiate the
Earth. Laboratory experiments can help improve our understanding of some of the
mechanisms present in SNRs, and can help test the computational models we build to
interpret their behavior. In section V.B, we will provide some background regarding
SNRs, whereas in the rest of this chapter we summarize the existing experiments.
B. General Features of Supernova Remnants
Supernova Remnants are created from the kinetic energy of the exploding star,
typically about 1051 ergs. The stellar ejecta from the explosion undergo a homologous
expansion, with velocity, v, radial distance, r, and time, t, related by v = r/t. Expansion
cooling reduces the temperature of this material to a low value early on, so that nearly all
the energy of the ejecta is in kinetic energy. The first phase of SNR evolution is the free
expansion (or “young remnant”) phase, during which the leading edge of the expanding
ejecta drives a “forward shock” into circumstellar matter at velocities of order 10,000
km/s. A “reverse shock” propagates from the contact discontinuity (ie, the “interface”
where the SN ejecta meets the ambient medium) back into the ejecta; in the laboratory
frame this reverse shock at this phase still moves in the outward direction (Chevalier,

36
1982a). Eventually, the mass of the accumulated circumstellar matter exceeds the mass of
the stellar ejecta. This is generally taken to mark the (gradual) transition to the “Sedov-
Taylor” phase. As this phase begins, the reverse shock runs in to the center of the SNR
and disappears, after which the SNR is believed to develop the characteristic structure of
a Sedov-Taylor blast wave [Whitham, 1974, p. 192]. During this phase, the SNR has a
single shock behind which the density and pressure decrease, and a radial size that
increases with time as R(t) ~ t0.4. Eventually the SNR becomes an old remnant,
corresponding to essentially a big bubble in the sky, with denser material around it.
Throughout the development of the SNR, the shocked matter radiates energy,
which escapes because the SNR is optically thin. The role of radiation varies depending
on the specific parameters of the particular event and on the phase that the remnant is in.
In paricular, conditions can be met (usually late in the explosion) where the radiation
causes a collapse of the shocked material into a thin shell (Blondin et al., 1998; Cioffi et
al., 1988), which can manifest a number of specific instabilities, e.g., Vishniac, 1983;
Ryu and Vishniac, 1987; Bertschinger, 1986; Innes et al., 1987 ). The Cygnus Loop, a
15,000 year old remnant that is close enough to be 6 times the size of the Moon on the
night sky, is in this phase. A small part of this remnant is shown in Figure V.1. is the
structures evident in the Cygnus Loop are not an exception: the remnants almost
universally reveal complex 3D structures. The origin of these structures can be related to
initial 3D non-uniformities of circumstellar medium, to instabilities at the contact
discontinuity or the blast wave, to 3D features “imprinted” on the ejecta during the SN
explosion itself, or to various combinations of these.

37
In particular, the massive stars that are thought to be the progenitors for core-
collapse supernovae are usually formed in the regions where dense molecular clouds are
present. Therefore, there is a significant chance that the ejecta from the star will interact
with other matter, such as a molecular cloud. Figure V.2 shows such an interaction.
An example that is thought to be related to the Rayleigh-Taylor instability at the
contact discontinuity (Dickel et al., 1989; Gull, 1973; Shirkey, 1978) (Chevalier et al.,
1992), is shown on Fig. V.3 which shows one of the Chandra images of SNR E0102.2-
7219 (Blair et al., 2000; Gaetz et al., 2000; Hughes, Rakowski and Decourchelle, 2000;
Rasmussen et al., 2001). One can see modulations, spectroscopically identified to be at
the contact surface, that seem likely to have been produced by Rayleigh Taylor
instabilities. It is notable that the mode number of these modulations appears larger than
the mode number typically seen in simulations.
A memory of the initially unstable and structured explosion of the core-collapse
supernova may be responsible for an amazing array of knots, filaments, and flocculi in
the relatively young (300 years old) Cassiopeia A remnant shown on Fig. V.4 (Anderson
and Rudnick, 1995; Keohane et al., 1996; Reed et al., 1995). Again, there are “bubbles”
and “spikes” at various places around the outer boundary that appear Rayleigh-Taylor
like.
Many of these aspects of SN explosions can be simulated in the laboratory
experiments with high-intensity lasers or Z pinches. In the rest of this chapter we discuss
experiments of various degrees of complexity related to (1) the overall 1D dynamics, (2)
the interaction between high-speed flows and density clumps, and (3) the studies of
various aspects of radiative shocks.

38
C. Simulating One-Dimensional Dynamics
In order to create an experimental setting that can be scaled to actual SNR
conditions, one must produce a system in which flowing, cool ejecta encounter a reverse
shock, with the shocked material driving a forward shock through low-density matter.
The first experiments to accomplish this were those of Drake and coworkers
(Drake, Carroll et al., 1998; Drake, Carroll_III et al., 2000; Drake, Glendinning et al.,
1998; Drake, Smith et al., 2000), using the Nova laser facility (Campbell et al., 1986).
These experiments were in a planar geometry, intended to simulate a small segment of
the overall SNR expansion. The experiment began when an intense x-ray flux, produced
by laser heating of a gold cavity, irradiated a 200-µm-thick layer of plastic. The x-rays
ablated the plastic, launching a strong shock wave through it, at a pressure of 5 x 10¹³
dynes/cm2 (50 Mbars). This was the analog of the initial blast wave produced by the SN
explosion. This shock wave compressed, accelerated, and heated the plastic. When the
shock broke out of the plastic, the ejecta from its rear expanded, accelerated, cooled, and
decompressed across a 150 µm wide gap. In an actual SNR, spherical expansion provides
the decompression (McKee, 1974). Here the gap served an analogous function. The
ejecta then launched a forward shock into the ambient matter, in this case a foam whose
density was less than 1% of the density of the compressed plastic layer. The ejecta
stagnated against the (moving) contact surface with the foam, which launched a reverse
shock into the ejecta, just as occurs in an SNR. In a young SNR and in this experiment,
respectively, Re = 6 x 10⁸ and 7 x 10⁶, Pe = 107 and 104. Radiative losses are unimportant
in both systems. Based on Euler scaling, the relation of the timescales is that 1 ns in the

39
experiment corresponds to 1 year in the SNR. This system can be used for basic setup
and benchmarking of hydrodynamic simulations.
D. Interaction of shocks and clumps
The local structures observed in SNRs may result from instabilities, but much of it
probably is due to clumpiness in the circumstellar matter or in the ejecta. The clumpiness
may in turn affect the development of instabilities, as has been explored in some
simulations. (Jun et al., 1996; Kane et al., 1999). Since clumps introduce substantial
vorticity into the fluids that interact with them, experiments with clumps test the accuracy
of simulations somewhat differently than shock waves and interface instabilities do. To
date, no experiment has addressed the impact of multiple clumps, like those explored by
Jun et al., 1996, on SNR evolution. However, two experimental studies have made
relevant measurements with a single clump.
The issue of the destruction of a cloud by a shock has been addressed in
experiments begun at the Nova laser (Klein et al., 2000) and continued at the Omega
laser (Robey et al., 2002). Both sets of experiments involve the generation of a nearly
planar blast wave, within a shock tube, its propagation over a significant distance, and its
subsequent interaction with a dense sphere of material. The geometry of the Omega
experiment has already been shown in Figure II.4a. In this experiment, by the time when
the shock arrives at the location of the solid Cu sphere, it (the shock) has long since been
overtaken by the rarefaction from the front surface of the irradiated material, giving it a
blast-wave structure not unlike that present in a Sedov-Taylor phase SNR.

40
When the shock wave traverses the sphere, the sphere compresses (gets
“crushed”). The interaction of the sphere with the post-shock flowing plasma produces
vortex rings, visible in the last panel of Figure II.4 b. The vortex rings are subject to
azimuthal bending instabilities (“Widnall instability”) that then produce three-
dimensional structure. These experiments should provide an excellent test of the ability
of astrophysical codes to simulate this type of shock-cloud interaction. Three
dimensional (3D) simulations are required to reproduce these observations.
The experiment of Kang et al. created the density structures present in a Young
SNR and observed their interaction with a (rather large) spherical obstacle (Kang,
Nishihara et al., 2001; Kang et al., 2000; Kang, Nishimura et al., 2001). The setting was
similar similar to that realized in Drake et al., described at the beginning of Sec. V.C, but
now the low-density foam contained a 150 µm diameter ZrO2 sphere, to observe the
interaction of the shock and the ejecta with this sphere. The authors have clarified some
details of this experiment for us that may prove useful in reading their papers. The
structure of the C10H14O4 foam consists of a thin fiber network, with µm-scale cell sizes.
The total laser intensity, and not the intensity of each beam, was 2 x 10¹⁴ W/cm2. The
simulations in the papers are all for an initial CH layer thickness of 50 µm. The
experiment produced images that show the forward shock, the layer of denser stagnated
ejecta, and some complex structures that developed through their interaction with the
sphere, attributed to vortex ring formation.
Beyond the global interaction of a shock wave with a molecular cloud, there are
also questions of the detailed interactions of the shock wave driven into the cloud with
the clumps that contain the vast majority of the cloud mass (Chevalier, 1999).
41
Experiments using the Z machine at the Sandia National Laboratories (Poludnenko et al.,
2004) have been designed to examine such interactions, but have not yet been
accomplished.
E. Radiative effects in shocks
Radiative shocks exhibit a range of behavior that depends on the optical depth of
the downstream and upstream regions relative to the shock (Drake, 2004b). Present-day
laboratory experiments provide the possibility to address issues of the radiative cooling of
shocked material and the formation of ionized precursors by the radiation of the shocked
material. As an example, we present Fig. V.5 based on experiments carried out by
Bouquet et al, 2004, at the LULI nanosecond laser facility. We first show the result of an
illustrative simulation with the ASTROLABE code (Fig. V.5a). We see the characteristic
structure of a strongly radiating shock, with the ion temperature initially very high ,
nearly ~ 1 keV (roughly corresponding to a standard Rankine-Hugoniot relation), then
decreasing because of the energy exchange with electrons. The electrons, in turn, are
cooled by atomic excitation and ionization processes, with a substantial part of this
energy radiated away from the shock region. Eventually, the temperature decreases to a
mere 20 eV, whereas the density reaches a value ~ 30 times higher than the initial
density.
In this experiment, the laser beams were focused onto a thin (2 µm) polyethylene
ablator which pushed a 25 µm layer of a polyethylene foam; the ablator and the foam
were separated by a 3 µm titanium x-ray shield to prevent x rays formed at the ablation
front from preheating the foam “piston”. On the other side of the foam, a Xe gas at a

42
density 1.3×10⁻³ g/cm3 was situated. The whole design was aimed at making the target
low density, so that, at a given laser intensity, the shock velocity would be high, and one
would reach temperatures sufficient to make radiative effects important. The foam/gas
interface acted as a piston that moved at a velocity of ~70 km/s, driving a strong shock
into the Xe gas.
A Mach-Zender interferometer was used to measure the electron density; an
interferogram is shown in Fig. V.5.b One sees the trajectory of the shock in Xe (dashed
curve), as well as the trajectory of the front end of the ionized precursor (solid curve)
produced by photoionization of the unshocked gas by the radiation from the shock region.
Shown in Fig. V.5c is a comparison of the experimental and calculated profiles of
electron density, 200 µm away from the foam surface (which serves as a pusher). The
position of the shock corresponds to the steep part of the curve; the left part of the curve
corresponds to an ionization precursor. The difference between measurements and
simulations is attributed to the 3D effects.
Experiments by Keiter et al, 2002, on the Omega laser also involve the initial
acceleration of a block of material to high velocity. Up to 10 laser beams struck the front
surface of this target, delivering several kJ of energy to an 800 µm diameter spot in a 1 ns
pulse. The laser irradiation shocked and accelerated a 60 µm thick plastic layer, which
crossed a 160 µm vacuum gap to impact a low-density foam, usually of density 0.01
g/cm3. This drove a shock wave through the foam at approximately 100 km/s.
The structure of the precursor was diagnosed using absorption spectroscopy.
Additional laser beams irradiated a thulium backlighter plate, permitting an imaging
crystal spectrometer to obtain absorption spectra. Absorption lines were detected from up

43
to 6 different ionization states. The lines from higher ionization states appear at higher
temperatures. This allows one, with the help of the OPAL atomic code (Iglesias and
Rogers, 1996; Rogers et al., 1996), to determine the temperature profile in the precursor.
Figure V.6 shows an example of the results, and of an initial comparison to results from a
very simple radiation hydrodynamic model. One can anticipate that such experiments
could provide quality benchmark data for astrophysical modeling.
The observation of a radiatively collapsed shocked layer has also been
demonstrated in the experiment by Reighard et al., 2004, who used a 3 mm long, 0.6 mm
ID shock tube filled with xenon gas at a density of 6×10⁻³ g/cm3. The pusher (“piston”)
was a 50 µm thick beryllium layer. Simulations with the 1D Lagrangian code HYADES
(Larsen and Lane, 1994) have shown the formation of a collapsed layer in the case when
radiation losses were taken into account Fig. V.7a. Note the logarithmic vertical scale: the
density in the radiatively-collapsed layer is twice as high as in the case with no radiation.
2D simulations allowed accounting for the effect of a finite radius of the shock tube
(Fig.V.7b). The 2D experimental radiographic image (Fig. V.7c) shows a remarkable
agreement with the simulations. Note that the velocity of the collapsed layer was quite
high, ~ 140 km/s.
Progress has also been made in the theory of radiative shocks, within the
approximation of high opacity and local thermodynamic equilibrium. In particular,
Michaut et al. (2003, 2004) have considered the role of radiation in the jump relations for
strong shocks in monotonic gases. These approximations, unfortunately, were never fully
satisfied in any of the aforementioned experiments. Still, some interesting qualitative
features are worth mentioning: It turns out that the density compression ratio is not a

44
monotonic function of the shock velocity. At a small velocity, when radiation, excitation,
and ionization are unimportant, the compresson ratio ρ2/ρ1 is 4 (for monatiomic gases).
At higher velocities, when the excitation and ionization “consume” a considerable
fraction of the energy of the shocked matter, but the radiation pressure is still small, the
compression ratio can be quite high, more than 10 (in other words, the equation of state
can be very “soft”). However, at yet higher velocity where the radiation pressure
becomes dominant in the shocked material, the compression ratio drops to 7
(corresponding to the adiabatic index of radiation γ=4/3). All this is illustrated for Xe in
Fig.V.8a . These effects play a role even in light gases, like hydrogen (Fig. V.8b, c).
F. Blast Waves
Experimentally, both cylindrical (Edwards et al., 2001; Ditmire et al., 2000;
Shigemori et al, 2000) and spherical (Grun et al., 1991, Edens et al., 2004, Hansen, 2004)
blast waves have been studied. Effects observed include the dependence of the expansion
trajectory on the equation of state and on the role of radiation, in the spirit of Cohen et al.,
1998, and the effects of the Vishniac instability of thin decelerating shells. We discuss
here in some detail two recent experiments of this type.
The first was performed by Edens et al. (2004) on the Janus laser facility at
Livermore (Glaze et al.) and at the Z-Beamlet facility at Sandia (Rambo et al., 2002). A 1
ns laser pulse with energy ranging from 10 J to 1 kJ was focused onto the tip of a metal or
nylon pin situated in a target chamber filled with Xe or N2 at a pressure of between 5 and
10 Torr. The fast energy release at the pin tip created a blast wave, visualized by dark
field imaging.

45
In the case of Xe, the blast wave trajectory initially followed the r~t0.25 law
corresponding to strong radiative losses from the material assembled by the blast wave
(Cohen et al., 1998). Later in the pulse, when the gas cooled down, a transition to the
Sedov-Taylor dependence, r~t0.4 occurred. In the case of nitrogen, the t0.4 dependence was
observed throughout the whole experiment (Fig. V.9 a,b).
Thin shell should manifest the overstability predicted by Vishniac. Indeed, in the
Xe plasma, small-scale structures were clearly visible, whereas in the case of nitrogen the
scale of the structures was larger (Fig. V.9c,d) – in agreement with the simple
observation that the Xe shell should be thinner because of stronger cooling.
An interesting effect was observed by Hansen et al. (2004). They used the
technique just mentioned to launch a shock wave into Xe gas and then followed the
evolution of the system over a long time scale, up to ~ 30 µs. At t=150 ns, both the shock
and the gas ahead of the shock are visible (Fig.V.10a). Later in time the initial shock
weakens and is no longer visible. However, at t=4 µs, a second shock appears, at a
position well ahead of the possible position of the first shock (Fig. V.10b). This suggests
that the second shock is driven by the energy deposited in the precursor region, a
conclusion supported by the numerical simulations shown in Fig. V.10c.
G. Summary
From their slow beginnings more than a decade ago, recent years have seen a
number of experiments aimed at physical issues that matter in SNRs. These provide
substantial groundwork for further research. However, in a very real sense they are all
preliminary steps, and further work is needed. It is also worthwhile to mention that, in

46
addition to hydrodynamic phenomena discussed in this chapter, there exists a broad range
of collisionless effects which, in particular, are thought to be responsible for the cosmic
rays generation in supernova remnants. In principle, HEDP facilities might contribute to
experiments on such phenomena (Drake, 2000), although experiment of this type remain
rare to date (Woolsey et al., 2001, Drake 2002, Courtois et al., 2004).

47
VI. PROTOSTELLAR JETS AND HIGH MACH-NUMBER FLOWS
Astrophysical jets present some of the most visually intriguing images
encountered in the galaxy and universe. [Reipurth, 2001; de Young, 1991] These jets
cover an enormous range of spatial scale, from 1017 cm for jets from young stellar objects
(YSO), as shown in Fig. VI.1, to 1024 cm for jets associated with quasars or active
galactic nuclei (AGN) harboring massive black holes (see Fig. IX.1a). The class of
stellar jets known as Herbig-Haro (HH) objects are thought to be collimated bipolar
outflows emerging from accretion disks during the star formation process. Examples of
Herbig-Haro jets, HH 47 [Heathcote, 1996] and HH 111, [Hartigan, 2001] are shown in
Fig. VI.1. [Reipurth, 2001] Typical velocities of the HH-jets are a few hundred km/s at
densities of njet = 10 – 100 cm-3. In terms of density contrast, this corresponds to η =
njet/nambient = 0.01 - 10, depending on the density of the ambient medium, where njet and
nambient are the jet and ambient number density, respectively. [Blondin, 1990] High Mach-
number, high density jets can be radiatively cooled, which greatly affects the dynamics
and morphology. [Blondin, 1990; Stone, 1994; Frank, 1998]
Models of jet formation generally fall into two broad categories. One category
assumes that jets are formed as a consequence of matter falling into a compact central
object from a magnetized rotating accretion disk. [Pudritz, 1986; Livio, 1999; Shu, 1995;
Lovelace, 1993] In the case of HH jets, the compact central object is the protostar or
young stellar object (YSO). A large toroidal magnetic field formed by a differential
rotation near the central object then causes the ejection of the matter along the axis,
forming a configuration not dissimilar from a Z pinch. The return current flows over the
surface of a large magnetic blob (see discussion later in this section).

48
A second class of models assumes that the accretion process onto a central object
results in a toroidal accretion disk, with density maximum along the equator and
minimum at the poles, which define the symmetry (and rotation) axis. Spherically
symmetric, outflowing winds from the central object then interact with this toroidal
density profile, which leads to a funneling of the wind into bipolar jets following the
rotation axis. [Icke, 1992] A variation on this is the formation of jets by convergence of
supersonic conical flows, in particular, in the presence of strong radiative cooling.
[Tenorio-Tagle, 1988] Observational data are insufficient at this time to conclusively
discriminate between these two classes of models, and indeed both may be operating
simultaneously.
Jets are often categorized according to their jet internal Mach number [jet velocity
/ sound speed inside the jet, ie, vj/cs(jet)]. One effect of high Mach-number on jet
dynamics is to reduce the level of tip broadening due to Kelvin-Helmholtz instabilities at
the working surface. An additional effect is to reduce the amount of mixing and material
entrainment along the sides of the jet. These effects are illustrated by the three
simulations show in Fig. VI.2a. [Norman, 1982] The effect of radiative cooling is even
more dramatic. [Blondin, 1990; Stone, 1994; Xu, 2000] Radiative cooling lowers the
pressure inside the jet, leading it to compress further, increasing the collimation, such as
shown by the simulations in Fig. VI.2b. [Blondin, 1990] As the radiative cooling
increases, as quantified by the cooling parameter, χ = Lcool/Rjet, the jet density and
collimation increases. Here, Lcool is the distance behind the working surface at which the
jet has radiatively cooled to some arbitrarily low value. The effect of radiative cooling on
jet morphology is still strong, even when magnetic field effects are included in the jet

49
evolution, as shown in Fig. VI.2c. [Frank, 1998] A fundamental question is how these
jets remain so well collimated over propagation distances exceeding ~10 jet diameters or
more.
An emerging new experimental capability may prove useful in testing aspects of
these models in addressing the collimation question. With the development of
sophisticated high power lasers and magnetic pinch facilities around the world, the ability
to conduct well controlled and well diagnosed laboratory experiments on high Mach
number hydrodynamic jets is now possible. [Stone, 2000] Laboratory experiments allow
the effects of high Mach number, radiative cooling, and possibly magnetic fields on the
jet dynamics to be probed individually or in combinations. The potential benefit of this
research to astrophysics is only starting to be recognized and pursued.
One example, done on the Omega laser at the University of Rochester, is a purely
hydrodynamic (non-radiative, non-magnetic), high Mach number jet, shown at two
different times in Fig. VI.3a. [Foster, 2002] In the experiment, a set of 12 laser beams at
a total energy of ~6 kJ enters a cylindrical gold cavity (hohlraum) on one end through the
laser entrance hole (LEH), and converts to x-rays at or near the inner gold wall surface,
generating a burst of radiation of temperature Tr ≈ 200 eV, which lasts of order ~1 ns. A
solid Al cylindrical plug of (200 µm diameter by 150 µm thick) is mounted on a hole on
the wall of the hohlraum opposite the LEH, with 100 µm of the Al protruding into the
hohlraum. This Al cylinder is butted up against a ~1 mm long tube filled with a solid-
density plastic (CH) reservoir. The radiation bath in the hohlraum ablatively launches
converging shocks into the Al cylindrical plug. The magnitudes of the observed early-
time jet and shock velocities suggest that an initial, very high pressure region in the

50
center of the Al cylinder, P > 100 Mbar (ie, 1014 dyne/cm2), is created. The Al-CH
interface at the entrance to the CH reservoir is at ambient pressure, hence, the high
internal pressure in the Al launches a high Mach number jet of Al moving axially down
the CH tube. This jet is imaged radiographically, by generating a timed burst of hard x-
rays (~5 keV) behind the target, and imaging the jet as a shadow (to the “backlighter” x-
rays). This external source of backlighter x-rays is generated by focussing several of the
Omega beams onto an auxillary planar disk of material such as Ti, generating a bright
source of He-α x-rays at 4.7 keV. The jet shown in Fig. VI.3a has moved about 3 jet
diameters, and a very prominent Kelvin-Helmholtz (KH) rollup is observed at the jet tip.
The bow shock in the plastic is also very evident in these images. Simulations of the
experiment are shown in the top of Fig. VI.3a, and the experimental data are at the
bottom of the figure. The internal Mach numbers in these jets are Mint = vjet/cs(jet) ≈ 3,
whereas the external Mach numbers are Mext = vjet/ cs(ambient CH) ≈ 5. The density ratio
at the time of the images is η = ρjet/ρambient~0.3, due to the decompression of the Al, and
the shock compression of the plastic. Once launched, these jets are purely hydrodynamic,
with effects due to radiation being insignificant other than generating the initial ablation
pressure source. For hydrodynamic jets such as these, a rigorous scale transformation
can relate the laboratory experiments to the astrophysical setting. [See the scaling
discussion in Chap. 4 on supernova hydrodynamics.]
A scaled up version of this experiment has now been done on the Z magnetic
pinch facility. The jet was generated by the ablation pressure created in a Z-pinch driven
hohlraum, similar to the technique used by Foster et al, 2002, although with a much
longer pulse length and observed considerably later in time at 150 ns, as shown in Fig.
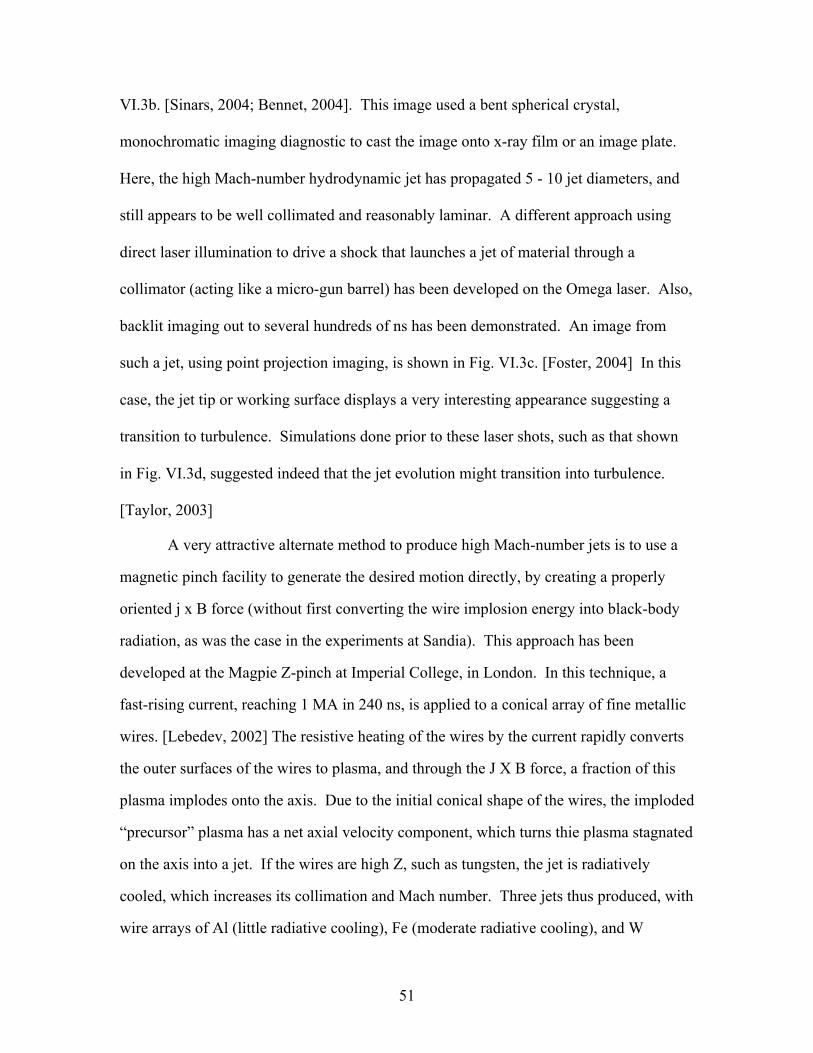
51
VI.3b. [Sinars, 2004; Bennet, 2004]. This image used a bent spherical crystal,
monochromatic imaging diagnostic to cast the image onto x-ray film or an image plate.
Here, the high Mach-number hydrodynamic jet has propagated 5 - 10 jet diameters, and
still appears to be well collimated and reasonably laminar. A different approach using
direct laser illumination to drive a shock that launches a jet of material through a
collimator (acting like a micro-gun barrel) has been developed on the Omega laser. Also,
backlit imaging out to several hundreds of ns has been demonstrated. An image from
such a jet, using point projection imaging, is shown in Fig. VI.3c. [Foster, 2004] In this
case, the jet tip or working surface displays a very interesting appearance suggesting a
transition to turbulence. Simulations done prior to these laser shots, such as that shown
in Fig. VI.3d, suggested indeed that the jet evolution might transition into turbulence.
[Taylor, 2003]
A very attractive alternate method to produce high Mach-number jets is to use a
magnetic pinch facility to generate the desired motion directly, by creating a properly
oriented j x B force (without first converting the wire implosion energy into black-body
radiation, as was the case in the experiments at Sandia). This approach has been
developed at the Magpie Z-pinch at Imperial College, in London. In this technique, a
fast-rising current, reaching 1 MA in 240 ns, is applied to a conical array of fine metallic
wires. [Lebedev, 2002] The resistive heating of the wires by the current rapidly converts
the outer surfaces of the wires to plasma, and through the J X B force, a fraction of this
plasma implodes onto the axis. Due to the initial conical shape of the wires, the imploded
“precursor” plasma has a net axial velocity component, which turns thie plasma stagnated
on the axis into a jet. If the wires are high Z, such as tungsten, the jet is radiatively
cooled, which increases its collimation and Mach number. Three jets thus produced, with
wire arrays of Al (little radiative cooling), Fe (moderate radiative cooling), and W

52
(strongly radiatively cooled) are shown in Fig. VI.4a. [Lebedev, 2002] As the W
precursor plasma stagnates on axis, the jet radiatively cools and remains well collimated
as it emerges from the pinch regions. This high Mach-number jet can then be directed to
impact an ambient medium, such as a CH plasma target. During this impact the jet tip
region (working surface) reheats, and starts to radiate in the soft x-ray again. An example
of such an impact from jet experiments done on the Magpie pinch facility is shown in the
left-hand image in Fig. VI.4b. [Lebedev, 2002] Also shown in this image on the right
hand side is the case where a radiatively cooled W jet is deflected sideways by a scaled
“stellar wind”, caused by ablating a suitably placed CH foil. [Lebedev, 2004a] Such jet
deflections have been observed in some HH jets.
An even newer development is the ability to create “magnetic tower” jets in the
laboratory, using a radial array of wires, instead of a cylindrical or conical array, as
shown in Fig. VI.4c. [Lebedev, 2004b] Such magnetized, high Mach number jets
resemble aspects of models of magnetically formed protostellar jets, and thus add one
more experimental capability to the techniques available to study jet dynamics in the
laboratory. Simulations show in detail the dynamics and conditions of these laboratory
high M-number magnetic tower jets, an example of which is shown in Fig. VI.4d.
[Ciardi, 2005] The radial flow of current converges to the center, then runs axially down
the stem or stalk. The net magnetic forces cause the radial wire “sheet” to buldge
upwards. Once the wires “break”, the magnetic bubble expands, launching a shock
upward into the ambient plasma. If the wires were high-Z, such as W, the on axis,
upward moving jet would be radiatively cooled, and therefore remain well collimated.

53
VII. HYDRODYNAMICS OF PHOTOEVAPORATED MOLECULAR CLOUDS
A. Introduction
Cold gaseous clouds illuminated by neighboring bright massive stars may
experience an intense ablation of material from their surfaces. The UV radiation from the
stars is absorbed by photoionization and photodissociation processes near the surface of
the cloud, causing a continuous ablation of the surface layers and generating a flow of
ionized gas directed away from the surface of the cloud. This process, first discussed by
Oort (1953), Spitzer (1954), and Oort and Spitzer (1955), is commonly called
“photoevaporation”. One of the best-known objects of this type is the Eagle Nebula.
Figure VII.1 shows the HST image of this object and Fig. VII.2 shows its orientation with
respect to the nearest young stars. Long pillars visible in the picture are sometimes called
“elephant trunks.” (Frieman, 1954) Other examples of photoevaporation flows can be
found, e.g., in Leung (1985). Detailed studies of the ionization front dynamics have been
carried out by Kahn (1954, 1958), who laid the groundwork for classifying various
possible regimes, as well as Dalgarno and McCray (1973) and Bertoldi (1989), who
produced a comprehensive analysis of the process with a detailed account of ionization
and recombination processes. Dense molecular clouds in the vicinity of bright young
stars are of broader interest because these clouds may serve as “cosmic nurseries,” where
star formation occurs (e.g., Shu et al, 1987; Elmegreen, 1998; Sugitani et al., 2002).
In recent years, much more detailed information about the physical conditions in
both the hot ionized flow and cold gaseous cloud has been obtained. The hot ionized part
was characterized by Hester et al. (1996) on the basis of Hubble Space Telescope
observations in Hα, [SII], and [OIII] lines. Imaging of the cold interior of the cloud at

54
millimeter-range wavelengths (emitted by the molecules of the cold gas) was carried out
by Pound (1998). Levenson et al. (2000) have characterized the photodissociation zone,
as well as parameters of the ionized matter. These data make possible a much more
detailed analysis of the physics processes responsible for the formation of the visible
structures. In particular, hydrodynamic velocities inside the cold gas have been found by
Pound.
Below, we discuss hydrodynamic phenomena occurring during photoevaporation
of the gas clouds, with the main emphasis made on possible instabilities of the cloud
surface. We argue that a significant part of the problem can be correctly described in the
framework of ideal hydrodynamics and modeled in scaled experiments.
B. Main physical processes
It has been realized many years ago (Spitzer, 1954) that complex hydrodynamic
motion and, eventually, the shape of the photoevaporated clouds is largely determined by
the ablation force arising from the intense photoevaporation. Molecular clouds are
typically quite cold: the balance of the heating of the cloud material by cosmic rays and
radiation cooling in the microwave range (Spitzer, 1978) establishes an initial (pre-shock)
temperature of only ~ 30 K. The ultraviolet radiation of the bright young stars is absorbed
in a very thin layer near the cloud surface by photoionization and photodissociation of the
hydrogen. The ionized gas thus formed begins to expand away from the cloud surface.
The pressure from the “rocket effect” then compresses the cloud . Typical ablation
pressures are orders of magnitude higher than the initial pressure of the cold cloud
interior. A strong shock is launched into the cloud, compressing and heating it. Once the

55
shock wave has traversed the cloud, a rarefaction wave from its far surface travels back to
the front surface, after which the whole slab is accelerated. For the Eagle Nebula, the
timescale for these developments is ~ 105 years and is comparable to the timescale
inferred by Pound (1998) to develop the structures.
The properties of the material in the Eagle Nebula have been determined by
Hester et al. (1996), Pound (1998), and Levenson et al. (2000). They are discussed by
Ryutov and Remington (2002) and are summarized in Table VII.1. In addition, Pound
determined that the velocity difference between the heads and the bases of the pillars is
∆v~106 cm/s, implying that the characteristic acceleration, g, of the cloud material is
g~(∆v)2/L~3⋅10-7 cm/s2.
One can readily show that the hydrodynamic description applies to these objects.
The mean free path λ of H2 molecules is determined by the molecular collisions with a
cross-section ~ 2⋅10-16 cm2. For the density as in Table VII.1, one has λ∼1011 cm, many
orders of magnitude less than any other characteristic dimension of the cloud. The
Reynolds number for the motions on the scale L is very large Re~107-108. The viscous
effects at the scales of interest are therefore unimportant. The particulate heat transport is
also negligible. We therefore conclude that the interior of the gas cloud can be adequately
described by the inviscid hydrodynamics.
In the ablative flow, which is almost totally ionized, the collisional mean free path
is determined by Coulomb collisions, which, at a temperature ~ 1 eV, have a cross-
section ~3⋅10-13 cm2. Therefore, despite a smaller density, the collisional mean-free path
λa in the ablation flow is very small: λa∼3⋅109 cm for density of na~103 cm-3. Therefore,

56
the particulate heat and momentum transport are both negligible here. One can check that
the radiation losses from the ionized low-density gas are also small.
Despite being quite cold, the molecular clouds are electrically conducting,
because of finite (albeit small) ionization. This ionization is non-thermal, it is produced
by cosmic rays for which the clouds are transparent. A substantial fraction of the
electrons are probably attached to dust grains (which are present in the cold clouds).
Estimates of the degree of ionization for the conditions typical for the Eagle Nebula yield
the value ~3⋅10-8 (Elmegreen, 1979). The magnetic Reynolds number turns out to be very
large (Ryutov, Remington, 2002).
Detailed estimates of the radiation losses from molecular clouds can be found in
Neufeld et al. 1995. Basically they show that the cooling time, defined as the ratio of the
thermal energy density to the power radiated from a unit volume, is very short, of order
of 100-1000 years. This means that the shocked material cools down very quickly, orders
of magnitude quicker than it takes for the shock to traverse the cloud (~ 105 years). This
brings up a paradox. Because of strong radiation cooling, the shocked material must
collapse to a high density to maintain pressure balance, nT=pabl , at a low temperature
(T~3⋅10-3 eV). This yields a density n~3⋅106cm-3, which directly contradicts the observed
values.
Several solutions to this paradox have been proposed: the effect of ram pressure
from a small-scale turbulence; the presence of a quasi-homogeneous magnetic field; the
presence of small-scale MHD turbulence; and the presence of force-free, random, static
magnetic field. The latest discussion of these models can be found in Ryutov et al., 2004,
2005, where references to earlier models can be found. The present authors assume that

57
one or a combination of these effects restores a hydrodynamic picture of the shock-
compressed gas, with some effective adiabatic index.
There are multiple time-scales involved in this problem. As pointed out by Pound
(1998), there is a characteristic time-scale for hydrodynamic motion, τdyn~(∆ ′v )-1, where
∆ ′v is the velocity shear inside the cloud. According to Pound, τdyn~3⋅1012s ~ 105years.
The significance of this is that it establishes the maximum time that has passed since this
shear motion began: at times much greater than τdyn, the cloud would have become much
larger than we actually see it. In this sense, the time τdyn sets the upper limit for the time
when the photoevaporation began (when the nearby O-type stars have ”turned on”). It
was noted by Pound that the time τdyn is much shorter than the evolutionary time of the
typical O-type star (~ 107 years). Therefore, we are witnessing a very early stage of the
photoevaporation process. This is a very important circumstance, because it points at a
possibility that the stars are still in a transient stage of their formation, and their
luminosity may have varied significantly during the past 105 years. Such variations,
including non-monotonic variations, with the luminosity passing through a maximum, are
a common phenomenon in the evolution of very young stars (e.g., Iben and Talbott, 1966;
Cohen and Kuhi, 1979).
The time-scale for photoevaporation to remove a considerable amount of the
initial molecular hydrogen is much longer: ~3⋅106years. In other words, the loss of cold
gas from the molecular cloud due to photoevaporation up to the present time is very
small.
C. Hydrodynamic models of the formation of the Elephant trunks.

58
There exist several models that attempt to explain the origin of the pillars in the
Eagle Nebula. The earliest one was suggested by Spitzer (1954) and is based on the
observation that, after the shock breaks out at the back side of the cloud and the resulting
rarefaction wave reaches the front side, the cloud as a unit begins to accelerate. This
drives the Rayleigh-Taylor instability at the ablation front (remember that nabl<<n). The
pillars are then identified with the familiar “spikes” of a heavy fluid penetrating through
the light fluid (Frieman, 1954).
We note that, if the intensity of the UV radiation grows with time, the interface
will be accelerated into the cloud even before the return of the rarefaction wave to the
front surface. This would allow the early onset of the RT instability. Generally, the
possible effects of the temporal dependence of the ionizing radiation have not been
studied in any detail.
Another popular model relates the formation of the pillars to the assumed
presence of the pre-existing dense “clumps”, whose density is substantially higher than
the density of the surrounding cloud. The ablation pressure is unable to move these heavy
clumps, which stay, roughly speaking, at their initial places, and shadow the cloud
material downstream. Then, whereas the rest of the cloud is moved over a significant
distance by the ablation pressure, the shadowed parts remain static, giving rise to the
pillar structure. This process has been studied numerically by Williams et al., 2001.
A third possible model is that the pillars are formed from the gas evaporated from
stand-alone dense clumps situated in front of the gaseous cloud. A part of the clump
material is pushed by the ablation pressure away from the radiation source, forming a
cometary-like structure [Bertoldi (1989); Bertoldi and McKee (1990), Lefloch and

59
Lazareff (1994)], whence a name: “cometary model”. The long tail eventually reaches the
cloud and mixes with it, making the whole structure very similar to the one observed.
D. Laboratory experiments
Provided that our conclusion regarding the applicability of ordinary compressible
hydrodynamics for the description of the cloud interior is correct, one can simulate, in a
scaled fashion, any of these models. The experiments using x-ray irradiation from
hohlraums seem to be more relevant than experiments based on a direct laser irradiation
of the target, since experiments of the first type involve the direct photoevaporation of the
material by the x-rays. It also matters that the density of the material in the ablation flow
is at least an order of magnitude less than the density of the underlying material.
Experiments of the second type (“direct drive” experiments, Ch. II) are less relevant to
astrophysical photoevaporation fronts, because they introduce complications not present
in the astrophysical systems. Specifically, the absorption zone for the laser radiation is
spatially decoupled from the ablation zone, with heat being transported between these
two regions by electron heat conduction. Also, additional complications involving the
laser-plasma interactions are also possible (Kruer, 2000).
Because of the importance of Rayleigh Taylor instabilities at ablating surfaces to
inertial confinement fusion, there have been many experiments related to this subject.
The first paper on this subject was that by Remington et al. (1993). Weber et al. (1994)
carried out an exhaustive study of radiation transport and ablation front structure for
conditions close to those of these experiments. The density of the ablated material was
indeed small compared to the density of the initial foil. Absorption in these experiments

60
occurs in a relatively narrow layer, as is the case in the Eagle Nebula. Ablative
stabilization (see below) plays a role only for short wavelengths, λ< 10 µm, whereas the
range of wavelengths studied was up to 150 µm. It is interesting to note that the structure
of well-developed RT perturbations observed in Remington et al., 1993 (Fig. VII.3) is
very similar to the “elephant trunks” observed in the Eagle Nebula. Although the
experiment was not optimized to have scaled parameters relevant to the Eagle Nebula, it
certainly has produced relevant results, somewhat by serendipity. The comparison of the
parameters of the Eagle Nebula with those of this laboratory experiment is presented in
Table VII.1.
Note that the so called “ablative stabilization” was insignificant in both the
laboratory experiment and its astrophysical counterpart. The underlying qualitative
explanation of this stabilization mechanism is that the Rayleigh-Taylor perturbation is
localized in a layer of thickness ~λ/2π near the surface, so that if the ablation front
“consumes” or burns off a layer of thickness ~λ/2π of the fluid within a time interval
shorter than the instability e-folding time, a considerable reduction in the growth rate,
compared to γRT = (2πg/λ)1/2, occurs. In other words, ablative stabilization becomes
significant when va>(ρa /ρ)(gλ/2π)1/2, where va is the velocity of the ablative flow and we
ignore a numerical factor of order unity; see surveys by Lindl, 1995 and Takabe, 1999,
for more detail and further references. Using the numbers of Table VII.1, one finds that,
indeed, the ablative stabilization is unimportant for the wavelengths of interest.
For completeness, we mention that ablation front RT instability has also been
studied in extensive detail in direct drive (Azechi et al., 1997; Knauer et al., 2000).
E. Issues for experiments and theory

61
There exist several additional effects that have to be properly factored into the
theory, numerical simulations, and the experiment, in order to produce a more complete
picture of the real photoevaporation front phenomenon.
The first effect is related to the absorption of the incident radiation in the ablation
flow. The absorption is caused from the small fraction of electrons and ions that
recombine, producing neutral hydrogen atoms which absorb the ionizing radiation.
Depending on the specifics of the geometry, this effect may be quite substantial. Kahn
(1958) argued qualitatively that absorption of the incoming radiation by hydrogen atoms
formed by recombination in the ablation outflow, can have a stabilizing effect, because of
the stronger absorption near the dimples of the surface relief compared to the bumps.
Axford (1964) presented a quantitative study that showed that this stabilization
mechanism is most effective for perturbations larger than the recombination length.
Sysoev (1997) provided more complete analysis. Williams (2002) confirmed it and
included the effects of radiation tilt. These papers dealt with the situation of a non-
accelerated ablation front. In a more recent study by Mizuta et al (2005), both effects of
acceleration and radiation absorption were included. It turned out that the linear RT
instability, for the characteristic parameters of the Eagle Nebula, is stabilized by the
absorption effect. On the other hand, nonlinear perturbations may continue to grow.
These results are illustrated by Fig.VII.4.
In the aforementioned experiment by Remington et al. (1993), the parameters of
the ablation flow were such that the absorption of the incident radiation was insignificant.
On the other hand, by a proper choice of dopants, it may be possible to reach conditions
where the absorption of radiation in the outflow would be similar to that in the Eagle

62
Nebula outflow. This would then open a possibility to experimentally assess the effect of
absorption on both the linear and the nonlinear stage.
The second additional effect is produced by noting that the incident ionizing
radiation may be tilted with respect to the surface of the ablation front. The perturbation
of the ablation pressure will then be different on the two slopes of a small-amplitude
sinusoidal surface wave, leading to the excitation of this wave as a traveling wave. This
effect was studied for non-accelerated clouds by Vandervoort (1962) and, more recently,
by Williams (2002). Ryutov et al. (2003) have included both the effect of acceleration
and the tilt, and predicted that, in the nonlinear regime, an effect similar to the breaking
of the waves on the ocean surface may occur. This phenomenon can be experimentally
studied in an asymmetrically-radiated hohlraum, where there will be an asymmetry in the
radiation flux (Ryutov, Remington, 2002).
The third effect is related to that situation where the radiation from a distant star
in the location of the cloud has a narrow angular distribution. J. Kane has found that this
may introduce new features to the development of small-scale perturbations of the
ionization front (Kane et al, 2005). This effect can also be studied with the use of a
hohlraum technique, by placing the target outside the hohlraum, far enough from the
hole in the hohlraum wall, so that the radiation would become strongly collimated.
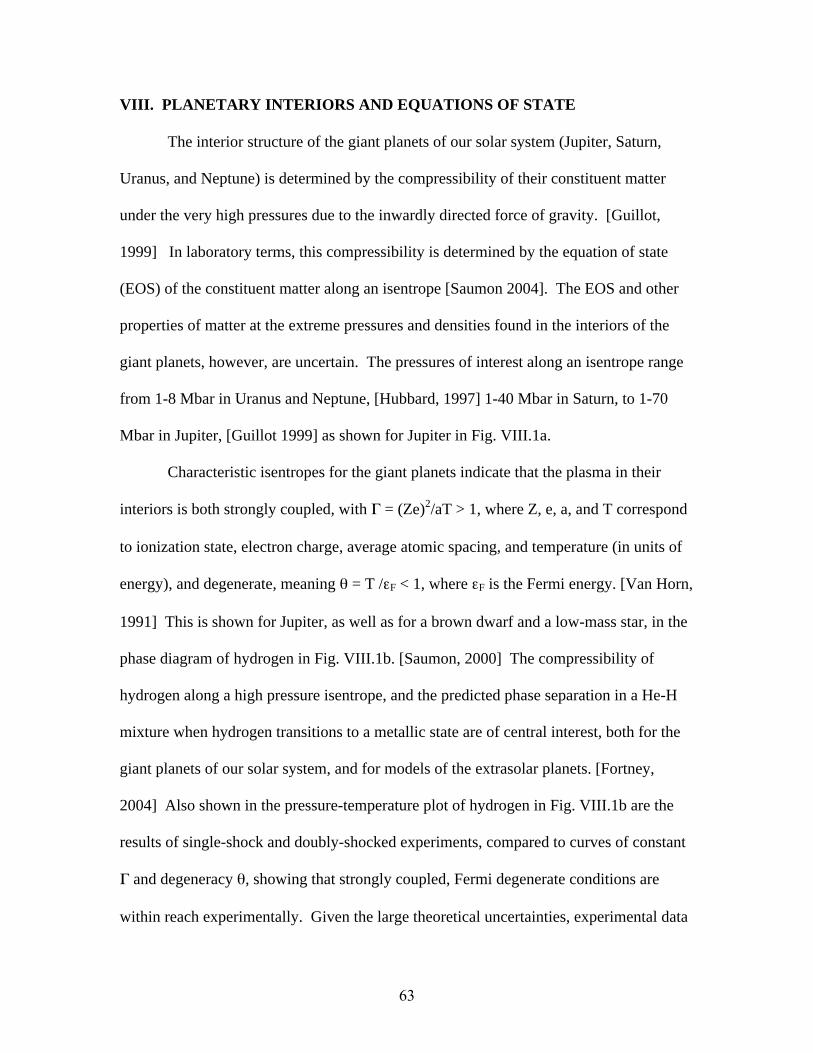
63
VIII. PLANETARY INTERIORS AND EQUATIONS OF STATE
The interior structure of the giant planets of our solar system (Jupiter, Saturn,
Uranus, and Neptune) is determined by the compressibility of their constituent matter
under the very high pressures due to the inwardly directed force of gravity. [Guillot,
1999] In laboratory terms, this compressibility is determined by the equation of state
(EOS) of the constituent matter along an isentrope [Saumon 2004]. The EOS and other
properties of matter at the extreme pressures and densities found in the interiors of the
giant planets, however, are uncertain. The pressures of interest along an isentrope range
from 1-8 Mbar in Uranus and Neptune, [Hubbard, 1997] 1-40 Mbar in Saturn, to 1-70
Mbar in Jupiter, [Guillot 1999] as shown for Jupiter in Fig. VIII.1a.
Characteristic isentropes for the giant planets indicate that the plasma in their
interiors is both strongly coupled, with Γ = (Ze)2/aT > 1, where Z, e, a, and T correspond
to ionization state, electron charge, average atomic spacing, and temperature (in units of
energy), and degenerate, meaning θ = T /εF < 1, where εF is the Fermi energy. [Van Horn,
1991] This is shown for Jupiter, as well as for a brown dwarf and a low-mass star, in the
phase diagram of hydrogen in Fig. VIII.1b. [Saumon, 2000] The compressibility of
hydrogen along a high pressure isentrope, and the predicted phase separation in a He-H
mixture when hydrogen transitions to a metallic state are of central interest, both for the
giant planets of our solar system, and for models of the extrasolar planets. [Fortney,
2004] Also shown in the pressure-temperature plot of hydrogen in Fig. VIII.1b are the
results of single-shock and doubly-shocked experiments, compared to curves of constant
Γ and degeneracy θ, showing that strongly coupled, Fermi degenerate conditions are
within reach experimentally. Given the large theoretical uncertainties, experimental data

64
on the high pressure EOS, phase, and conductivity of hydrogen is needed, to guide the
testing and refining of interior models of Jupiter and Saturn.
The giant ice planets Uranus and Neptune also have significant uncertainties in
our understanding of their interior structures. They are thought to exist of a gaseous
atmosphere, a rocky core, and a thick intermediate ocean of hot H2O, NH3, and CH4 in a
dense liquid phase customarily referred to as “ice”. [Hubbard, 1997; Cavazzoni, 1999]
Pressures and temperatures in the ice layer range from 20 – 600 GPa and 2000 – 7000 K,
resp., as shown in Fig. VIII.2a. Many of the observable quantities of the giant ice
planets, such as gravitational moments, atmospheric composition, and magnetic field, are
thought to be determined by the properties and conditions within the ice layer. There are
very large uncertainties in our understanding of how the magnetic fields of Neptune and
Uranus are formed. In particular, experimental data is needed on the conductivity of
water, methane, and ammonia at P > 100 GPa, before models of the origin of their
magnetic fields can be firmed up.
The phase diagram of high pressure water, shown in Fig. VIII.2b, has very large
uncertainties. Starting at low temperature, water will be in the solid ice state, and
depending on pressure, this can have several different phases. [Cavazzoni, 1999] At high
pressure, P > 100 GPa, as temperature is increased to T > ~2000 K, it is thought that a
transition occurs to a solid, superionic state, where the oxygen atoms maintain a
crystalline body-centered cubic (bcc) lattice structure, but the protons can readily diffuse.
This makes this solid-state material an ionic conductor but electronic insulator. As
temperature is further increased to T > ~3500 K, the oxygen sublattice also melts, and a
two-component ionic liquid (molten salt) is formed, which again is an ionic conductor but

65
electronic insulator. Finally, above 7000 – 7500 K, water is thought to become a metal,
that is, the electronic band gap closes, Egap/kT < 1. Experimental data on the high
pressure EOS, phase, and conductivity of water is needed, to allow theoretical progress to
be made on interior models of Neptune and Uranus. Fortunately, experimental progress
has been made on the high pressure properties of both hydrogen and water.
A summary of recent experimental measurements of the shock-driven EOS of D2
at ~1 Mbar pressures is given in Fig. VIII.3a. [Knudson, 2003] Achieving ~Mbar
pressures in these cryogenic hydrogen experiments is very difficult. The results from
four different techniques are shown in Fig. VIII.3a, corresponding to experiments done
on a gas gun [Holmes, 1995], the Sandia Z facility [Knudson, 2003], a spherically
convergent, HE-driven experiment [Be’lov, 2002; Boriskov, 2003], and the Nova laser
[Collins, 1998]. The gas gun, Z, and high explosive (HE) results all more or less agree
with each other. The gas gun and Z experiments both used the impedance matching
technique, that measures the EOS of D2 relative to an assumed known EOS of Al. The
Nova experiment was the only measurement in this set of four experiments that was
absolute, that is, the compressibility of D2 was measured directly, as opposed to being
inferred by comparison with the EOS of a reference material. This experiment showed
enhanced compressibility, not evident in the other experiments. The reason for the
difference between the Nova laser measurements, and all the rest of the measurements is
still under debate. A new set of relative measurements done on the Omega laser favors
an EOS of D2 that is less compressible than the Nova data, [Boehly, 2004] however, the
situation is still far from settled. [Nellis, 2002; Mostovych, 2001] To conclude this
ongoing debate, it seems likely that a new set of absolute measurements will be

66
necessary. There are a number of models of the EOS of high pressure hydrogen being
compared with these data, as shown in Fig. VIII.3a. The tabular SESAME EOS, and the
ab initio models generally are in agreement with the stiffer EOS data from Z. The linear
mixing models and the Saumon-Chabrier-Van Horn (SCVH) model generally favor a
softer EOS, that is, higher compressibility.
The impact on the predicted structure of the interior of Jupiter for the different
EOS models is shown in Fig. VIII.3b. [Saumon, 2004] This figure shows the mass of the
core of Jupiter versus the mass of high-Z elements mixed throughout the planet, predicted
using the five different models of high-pressure EOS of D2. Models that did not
reproduce the global gravitational moments of Jupiter, as determined by satellite fly-by
missions, were eliminated from these comparisons. The results in Fig. VIII.3b show that
the interior structure of Jupiter is surprisingly sensitive to the details of the high pressure
EOS of hydrogen. Hence, there is considerable impact and scientific interest in
concluding the experimental debate on the EOS of D2.
There are new experimental results, measuring the EOS and conductivity of high
pressure water, [Celliers, 2004; Koenig, 2004] relevant to the interior of Neptune. In
these measurements, the principle Hugoniot of water was measured, by the impedance
matching technique at an Al-H2O interface, as shown in Fig. VIII.4a. [Celliers, 2004]
Also, the reflectivity of high pressure water at the shock front was measured, as shown in
Fig. VIII.4b, from which the electronic conductivity, σe, was inferred, with the aid of a
Drude model. This model, thus calibrated, was used to estimate σe along the isentrope of
Neptune, as shown in Fig. VIII.4c. This, compared with measurements of the total DC
conductivity of water, σDC, done with singly shocked [Nellis, 1988] and reverberating
67
shocks on a gas gun, [Chau, 2001] suggest that the electronic conductivity contributes
roughly equally with ionic conductivity at 5000 K along the isentrope of Neptune, and
will begin to dominate at higher temperatures. This will have significant implications for
future models of the interior of Nepture, and in particular, on models of the formation of
its magnetic field.
Also, relevant to the interior of the earth, new dynamic measurements address the
EOS and high pressure melt transition in Fe, [Koenig, 2004; Koenig, 2000; Benuzzi-
Mounaix, 2002; Nguyen, 2004] relevant to the inner-core, outer-core boundary region of
the interior of earth. A key issue here is resolving the discrepancy between the high-
pressure melt temperature detected dynamically in shock experiments and static
measurements in a diamond anvil cell (DAC). Additional experiments and research will
likely be required to conclude this debade.

68
IX. COMPACT OBJECT ACCRETION DISKS AND PHOTOIONIZED
PLASMAS
One of the most intriguing objects in the universe is an accreting compact object,
such as a neutron star or black hole. At the extreme is an accretion disk around a massive
black hole (108-109 Msun) at the center of a galaxy such as the active galactic nucleus
(AGN) object NGC 4261, shown in Fig. IX.1a. [Ferrarese, 1996] The accreting, massive
black hole also generates bipolar intergalactic jets, which taken together form a quasar.
[Pinar, 2001]. Observational evidence from HST images suggests a massive black hole
in the active galaxy NGC 4261, a giant elliptical galaxy at a distance of 30 Mpc.
[Ferrarese, 1996] From an analysis of optical images obtained using HST/WFPC2,
similar to that shown in Fig. IX.1a, it is deduced that the ionized gas near the center is in
circular motion, consistent with a central mass of ~4.9 x 10⁸ M8 inside of a spatial extent
of 15 pc. The corresponding mass-to-light ratio is (M/L) ~ 2 x 10³ M8/L8, supporting the
interpretation of a central massive black hole. There appears to be an intimate connection
between the dust disk and the central engine, which drives the two bipolar radiojets of 105
light year extent that eminate normally from the disk. [Pinar, 2001] The inner dust disk is
thought to be supplying fuel to the central engine, and an outer dust disk is thought to be
feeding fuel to the inner accretion disk that surrounds the massive black hole.
Another much closer example of an accreting compact object is Cyg X-3, an
accreting x-ray binary system. An example spectrum from this accreting binary x-ray
source Cyg X-3 is shown in Fig. IX.1b. [Liedahl, 1996] These spectra result from the
final plunge of matter from the accretion disk into the compact object, and have been
shown to result from a photoionized plasma. Schematically this is illustrated in Fig.

69
IX.1c. In such a plasma, radiative excitation, absorption, and emission processes
dominate, and collisional processes are greatly reduced or negligible. The emission-line
spectrum of the X-ray binary Cygnus X-3 is consistent with recombination-dominated
line formation. From this it is inferred that the source of energy “pumping” the lines is
the hard X-ray continuum. The simplest interpretation of Cyg X-3 assumes that the x-ray
emission is from plasma in photoionization equilibrium.
To check or calibrate the models used to interpret these spectra, experimental data
of photoionzied plasmas in relevant regimes are required. It was recognized recently that
similar conditions of photoionized plasmas could be created in the laboratory using the
intense burst of x-rays coming from the z-pinch at the SNLA Z-facility. [Heeter, 2001]
An experiment was developed to measure the photoionized plasma x-ray spectra under
approximately scaled conditions. The figure of merit, the ionization parameter ξ = L/ner2,
where L, ne, and r are the ionizing (x-ray) luminosity, electron density, and distance from
the central source of ionizing radiation, resp., needs to be large, ξ ≥ 100, to be relevant to
astrophysical photoionized plasmas. This implies radiation dominance in the excitation
and de-excitation processes.
The experiments were performed at the Sandia National Laboratory Z facility.
The radiation from the pinch was generated by coupling a 20 MA, 100 ns rise time
current pulse into a 2 cm diameter, 1 cm length, cylindrical wire array, creating a 8 ns
FWHM, 120 TW, Tr = 165 eV near-blackbody radiation source. The sample charge state
distribution, the absolute radiative flux, and the sample densities were measured
independently. A typical spectrum from an Fe sample, located a distance of 1.5 - 1.6 cm
from the pinch, is shown in Fig. IX.2a. [Foord, 2004] In this experiment, ξ reaches a

70
value near 25 erg.cm/s at the peak of the radiation pulse, compared to the desired values
of 102-103 to resemble those of an accreting black hole.
A number of photoionized plasma models have now been compared with this
laboratory experiment, as shown in Figs. IX.2b and IX.2c. In Fig. IX.2b, the results from
the model Cloudy is shown as a function of temperature, from 30 – 210 eV. [Foord,
2004] In these model calculations of the laboratory plasma, it was assumed that Te = Ti.
The data are shown by the circular plotting symbols with error bars. There is significant
temperature dependence in the predicted <Z> from 30-70 eV, above which additional
increases in temperature have little effect. A simulation from the model FLYCHK is also
shown. Additional comparisons of the predicted versus experimentally observed
ionization distribution for an iron plasma are shown in Fig. IX.2c. [Rose, 2004] A
radiation temperature of Tr = 165 eV, electron temperature of Te = 150 eV and electron
number density of ne = 2 x 1019 cm-3 [Foord et al 2004] were assumed for the calculations
with the average-atom model NIMP. Calculations are shown without and with inclusion
of the radiation field. The observed ionization state would be underpredicted without the
inclusion of the radiation field, which is a central feature of astrophysical photoionized
plasmas. Also included in the comparison are predictions from the more detailed model
GALAXY presented for the same conditions.
These data are of sufficient quality to effectively test and calibrate these
photoionized plasma models under relevant conditions. Good agreement with
experiment is found only for the calculations that include the radiation field, but
collisional effects are not completely negligible. The average-atom model is observed to
be quite effective at calculating these photoionized plasma x-ray spectra, which is an

71
important conclusion, because of its wide use in modeling laboratory plasmas.

72
X. OUTLOOK FOR THE FUTURE
There are a multitude of new facilities on the horizon, that will enhance the ability
to pursue HED laboratory astrophysics. These include high energy, long pulse lasers and
magnetic pinch facilities; high energy, short pulse lasers; and ultrashort pulse lasers. In
the category of high energy HED facilities, the NIF (at LLNL) [Hogan, 2001; Miller,
2004; Moses, 2004] and LMJ (at CEA in Bordeaux, France) [Cavaillier, 2004; Andre,
1999] lasers will each deliver about ~2 MJ of laser energy, once they are complete. The
LIL laser in Bordeaux, France, will be an 8-beam demonstration facility for LMJ, and
should achieve at full performance over 60 kJ of 3ω light. [Di-Nicola, 2004] The ZR
magnetic pinch facility (at SNLA) will deliver a fast rise-time pulse of 30 MA current to
implode a cylindrical wire array, generating over ~2 MJ of x-rays. (Matzen, 2005) The
Omega-EP facility [McCrory, 2003] will include two 2.5 kJ PW lasers, which can be
focused into either a stand-alone chamber, or into the Omega 60-beam chamber,
synchronized with the 30 kJ, 60-beam Omega laser, enabling new regimes of high
intensity laser-matter interaction studies. [Sangster, 2004] The LULI laser facility is
being upgraded to have 4 beams: one 1 kJ, 1ω long pulse beam, one PW beam, and two
100 J probe beams. [Koenig, 2004] The Gekko-12 laser facility at Osaka Univ. will be
upgraded, so that the 12-beam, 10 kJ long pulse Gekko will be augmented by a high
energy (up to ~10 kJ) petawatt beam for fast ignition studies. [Miyanaga, 2004] The
Helen laser at AWE in the UK will be upgraded into Orion, which will be ten 1/2 kJ 2ω
beams, plus two 1/2 kJ petawatt lasers. And the Vulcan petawatt is just starting routine
operation at ~500 J in ~1/2 ps. [Danson, 2004] And there are a number of ultrashort
pulse (< ~1 ps), moderate-energy lasers operating or under development, such as the

73
Texas Petawatt at Univ. of Texas-Austin, [Ditmire, 2004] and the Leopard laser at the
Univ. of Nevada-Reno. The Zebra magnetic pinch machine, also at UNR, is being
developed, and will be combined with the Leopard laser, to form the Nevada Terawatt
Facility. [Erlandson, 2004] All of these facilities will eventually be equipped with an
array of time-resolved diagnostics, for carrying out unique HED experiments.
The greater number of HED experimental facilities will allow the new area of
HED laboratory astrophysics to be developed at a much faster pace. With the advent of
the next generation of very large facilities (NIF, LMJ, ZR), key new regimes will be
accessible, where current facilities have fallen short. Based on the discussions given in
this article, we suggest the following as potentialfruitful areas for next generation HED
laboratory astrophysics studies on the large facilities.
In the area of SN explosion hydrodynamics, a scaled, multilayer, spherically
divergent experiment could be carried out that should transition well into the turbulent
regime. Attempts at a scaled down version of such an experiment on the Omega laser
came up short in the amount of energy available to drive the package. The desired
hydrodynamic instabilities were initiated, but never entered the deep nonlinear regime.
[Drake, 2002; Robey, 2001] With the larger energies available on NIF and LMJ, this
multilayer, divergent geometry experiment could serve as a conclusive test whether the
“standard (spherical shock) model” of core collapse SNe is correct, at least from a
hydrodynamic perspective.
It should become possible to test high Mach-number jet propagation and
collimation over longer distances through an ambient medium, with and without the
effects of radiative cooling. Experiments such as this should help answer whether
74
astrophysical jets can remain collimated from a purely hydrodynamic or radiative-
hydrodynamic perspective, or whether additionally, magnetic fields are required.
With the more intense bursts of x-rays possible on the next generation larger
facilities (NIF, LMJ, ZR), it should be possible to conduct photoionized plasma
experiments in the correct regime of ionization parameter, ξ ~ L/ner2, allowing black hole
accretion disk models to be tested under properly scaled conditions.
In the area of opacities, the larger facilities open up the possibility for
measurements of opacity under conditions relevant to the core of solar-sized stars (~1
keV, 100 g/cm3). Also, measurements of expansion opacities, that is, opacities in a
homologously expanding ball of plasma, should be possible. These are relevant to SN
light curve calculations.
Another new regime will be the ability to study matter under planetary interior
conditions, with quasi-isentropic drives that reach 1-10 Mbar conditions, or higher, in a
well controlled, reproducible manner. This should allow EOS determinations, and
measurements of phase, conductivity, and maybe even solubility of mixtures of H, He,
and more complex “ices” under conditions relevant to planetary interiors. It should be
possible to experimentally show, unambiguously, whether or not the plasma phase
transition (“PPT”) in hydrogen exists. It may even be possible to study properties of
matter under even more extreme conditions relevant to the envelopes of white dwarf
stars. White dwarfs are interesting in their own right, but also serve as
“cosmochronometer”, [Fontaine, 2001] and when accreting from a binary partner, form
the initial conditions for a Type-I SN.
75
Extended duration radiation sources will be available, which will be ideal for
experimental studies of models and the dynamics of radiatively driven molecular clouds,
such as the Eagle Nebula. [Mizuta, 2005; Pound, 2005] Unique effects are predicted due
to the directionality of the radiation, due to stars acting effectively as “point sources”, and
due to the photoevaporated plasma not necessarily being optically thin. [Mizuta, 2005;
Kane, 2005]
Once ignition is achieved, the intense burst of D-T neutrons, generating a flux of
1032-1033 neutrons/(cm2.s), may allow excited state reactions to occur, which are relevant
to the nucleosynthesis of the heavy elements, ie, those nuclei more massive than Fe.
[Libby, 2003] It may also be possible to study thermonuclear reactions in highly
screened, dense plasmas, relevant to reactions in dwarf stars. Finally, if high gain (G >
100) implosions can be produced, [Suter, 2004] it may be possible to examine some of
the physics issues surrounding the proposed deflagration-to-detonation transition, and the
role of hydrodynamic mixing, relevant to Type-I supernovae.
Finally, with the ultrahigh intensity, short pulse lasers, it may be possible to study matter
under ultra-extreme conditions relevant to the vicinity and atmospheres of accreting
neutron stars. Extreme large magnetic fields are needed in a radiation-dominated
plasma. Aspects of these conditions may be within reach with the combination of
multiple petawatt lasers, plus the NIF, LMJ, or ZR driver.
This work was performed under the auspices of the U.S. Department of Energy by University
of California, Lawrence Livermore National Laboratory under Contract W-7405-Eng-48.

76
REFERENCES:
Anderson, M.C., and L. Rudnick, 1995, “The Deceleration Powering of Synchrotron
Emission from the Ejecta Contents in Supernova Remnant Cassiopeia A,” Astrophys.
J. 441, 307-333.
Andre, M.L., 1999, “The French Megajoule Laser Project (LMJ)”, Fusion Engineering
and Design 44: 43-49.
Arnett, W.D., 1988, “On the early behavior of supernova 1987A,” Astrophys. J. 331,
377-387.
Arnett, D. 1996, “Supernovae and Nucleosynthesis”, Princeton University Press,
Princeton,.
Arnett, D., B. Fryxell, and E. Muller, 1989, “Instabilities and nonradial motion in sn-
1987A,” Astrophys. J. 351, L63-L66.
Arnett D., 2001, “Consistency and prediction in stellar evolutionary theory,” Nuclear
Physics A 688, 177C-184C.
Axford, W.I., 1964. “The stability of ionization fronts.”ApJ 140 112.
Azechi H. Nakai M. Shigemori K. Miyanaga N. Shiraga H. Nishimura H. Honda M.
Ishizaki R. Wouchuk JG. Takabe H. Nishihara K. Mima K. Nishiguchi A. Endo T.
1997. Direct-drive hydrodynamic instability experiments on the GEKKO XII laser.
Phys Plasmas, 4, 4079.
Bailey, J. E., G. A. Chandler, D. Cohen, M. E. Cuneo, M. E. Foord, R. F. Heeter, D. Jobe,
P. W. Lake, J. J. MacFarlane, T. J. Nash, D. S. Nielson, R. Smelser, and J. Torres,
2002, “Radiation science using Z-pinch x rays,” Phys. Plasmas 9, 2186-2194.

77
Bar–Shalom, A., J. Oreg and W. H. Goldstein, D. Shvarts, A. Zigler, 1989, “Super-
transition-arrays: A model for the spectral analysis of hot, dense plasma,” Phys. Rev.
A 40, 3183-3193.
Belov, S.I. et al., 2002, Pis’ma Zh. Eksp. Teor. Fiz. 76, 508 (2002) [English version:
JETP Lett. 76, 433].
Bennet, G.R. D.B. Sinars, R.B. Cambpell, M.E. Cuneo, T.A. Mehlhorn, J.L. Porter, B.H.
Wilde, R.F. Coker, P.A. Rosen, J.M. Foster, T.S. Perry, and B.B. Afeyan, 2004, “Z-
pinch-driven-hohlraum high-Mach number jets on Z,” Bull. Am. Phys. Soc. (2004).
Benuzzi-Mounaix A, Koenig M, Huser G, Faral B, Batani D, Henry E, Tomasini M,
Marchet B, Hall TA, Boustie M, De Resseguier T, Hallouin M, Guyot F, Andrault D,
Charpin T., 2002, “Absolute equation of state measurements of iron using laser
driven shocks,” Phys. Plasmas 9, 2466-2469.
Bertoldi, F., 1989, “The photoevaporation of interstellar clouds.1.Radiation-driven
implosion,” Astrophys. J. 346, 735.
Bertoldi, F., C.F. McKee, 1990, “The photoevaporation of interstellar clouds .2.
Equilibrium cometary clouds,” Astrophys. J. 354, 529.
Bertschinger, E., 1986 “On the structure and stability of radiative shock waves,”
Astrophys. J. 304, 1 May, 154-177.
Bethe, H.A., 1990, “Supernova mechanisms,” Rev. Mod. Phys., 62, 801.
Bettinger A., Decroisette M., 1999, “Laser megajoule project and impact on the inertial
fusion program,” Fusion Engineering and Design 46, 457-460 NOV 1999
Blair, W.P., J.A. Morse, J.C. Raymond, R.P. Kirshner, J.P. Hughes, M.A. Dopita, R.S.
Sutherland, K.S. Long, and P.F. Winkler, 2000, "Hubble space telescope observations

78
of oxygen-rich supernova remnants in the magellanic clouds. Ii. Elemental
abundances in n132d and 1e 0102.2-7219," Astrophys. J. 537, 667-688.
Blondin, J.M., E.B. Wright, K.J. Borkowski, and S.P. Reynolds, 1998, Transition to the
radiative phase in supernova remnants, Astrophys. J. 500, 10 June, 342-354.
Blondin, John M., Bruce A. Fryxell, and Arieh Konigl, 1990, “The structure and
evolution of radiatively cooling jets,” Astrophys. J. 360, 370-386.
Boehly TR, McCrory RL, Verdon CP, Seka W, Loucks SJ, Babushkin A, Bahr RE, Boni
R, Bradley DK, Craxton RS, Delettrez JA, Donaldson WR, Epstein R, Harding D,
Jaanimagi PA, Jacobs SD, Kearney K, Keck RL, Kelly JH, Kessler TJ, Kremens RL,
Knauer JP, Lonobile DJ, Lund LD, Marshall FJ, McKenty PW, Meyerhofer DD,
Morse SFB, Okishev A, Papernov S, Pien G, Safford T, Schnittman JD, Short R,
Shoup MJ, Skeldon M, Skupsky S, Schmid AW, Smalyuk VA, Smith DJ, Soures JM,
Wittman M, Yaakobi B., 1999, “Inertial confinement fusion experiments with
OMEGA-A 30-kJ, 60-beam UV laser,” Fusion Engineering and Design 44, 35-42.
Boehly TR, Hicks DG, Celliers PM, Collins TJB, Earley R, Eggert JH, Jacobs-Perkins D,
Moon SJ, Vianello E, Meyerhofer DD, Collins GW, 2004, “Properties of fluid
deuterium under double-shock compression to several Mbar,” Phys. Plasmas 11, L49-
L52.
Bohm-Vitense, Erika, “Introduction to stellar astrophysics,” Vol. 1: Basic stellar
observations and data (Cambridge University Press, New York, 1989).
Bohm-Vitense, Erika, “Introduction to stellar astrophysics, Vol. 3: Stellar structure and
evolution,” (Cambridge University Press, New York, 1989).
Boriskov, G.V. et al., 2003, Dokl. Akad. Nauk 392, 755 (2003) [English version: Dokl.

79
Phys. 48, 553.
Bouquet, S., C. Stehle, M. Koenig, et al, 2004. “ Observation of Laser Driven
Supercritical Radiative Shock Precursors,” Phys. Rev. Lett., 92, 225001.
Budil, K. S., T. S. Perry, S. A. Alvarez, D. Hargrove, J. R. Mazuch, A. Nikitin, and P. M.
Bell, 1997, “Point projection radiography with the flexible x-ray imager,” Rev.Sci.
Instrum. 68, 796-798.
Budil KS. Gold DM. Estabrook KG. Remington BA. Kane J. Bell PM. Pennington, DM.
Brown C. Hatchett SP. Koch JA. Key MH. Perry M.D., 2000, “Development of a
radiative-hydrodynamics testbed using the Petawatt Laser facility,” Astrophysical Journal
Supplement Series. 127, :261-265.
Burrows, A., J. Hayes, 1996, “Pulsar recoil and gravitational radiation due to
asymmetrical stellar collapse and explosion,” Phys. Rev. Lett., 76, 352.
Calder, A., B. Fryxell, T. Plewa, R. Rosner, T. Dupont, H.F. Robey, J.O. Kane, B.A.
Remington, R.P. Drake, G. Dimonte, M. Zingale, L.J. Dursi, F.X. Timmes, K. Olson,
P. Ricker, P. MacNeice, and H.M. Tufo, 2002, “On validating an astrophysical
simulation code,” Astrophys. J. Suppl. 143, 201-229.
Calder A. Dursi J. Fryxell B. Plewa T. Weirs G. Dupont T. Robey H. Kane J. Remington
B. Timmes F. Dimonte G. Hayes J. Zingale M. Drake P. Ricker P. Stone J. Olson K.,
2004, “Validating astrophysical simulation codes,” Computing in Science &
Engineering. 6(5):10-20.
Campbell, E.M., J.T. Hunt, E.S. Bliss, D.R. Speck, and R.P. Drake, 1986, “Nova
Experimental Facility,” Rev. Sci. Instrum. 57, 2101.

80
Cantwell, B. J., 1981, “Organized motion in turbulent-flow,” Ann. Rev. Fluid Mech., 13,
pp. 457-515.
Cavailler, Claude, Noel Camarcat, Francis Kovacs, Michel Andre, 2004, “Status of the
LMJ program,” proceedings of IFSA-2003, Ed. B.A. Hammel, D.D. Meyerhofer, J.
Meyher-ter-Vehn, and H. Azechi, (American Nuclear Society, Inc, La Grange Park,
IL, 2004), 523-528.
Cavazzoni, C., G. L. Chiarotti, S. Scandolo, E. Tosatti, M. Bernasconi, M. Parrinello,
1999, “Superionic and metallic states of water and ammonia at giant planet
conditions,” Science 283, 44-46.
Celliers, P.M., G. W. Collins, D. G. Hicks, M. Koenig, E. Henry, A. Benuzzi-Mounaix,
D. Batani, D. K. Bradley, L. B. Da Silva, R. J. Wallace, S. J. Moon, J. H. Eggert, K.
K. M. Lee, L. R. Benedetti, R. Jeanloz, I. Masclet, N. Dague, B. Marchet, M. Rabec
Le Gloahec, Ch. Reverdin, J. Pasley, O. Willi, D. Neely, and C. Danson, 2004,
“Electronic conduction in shock-compressed water,” Phys. Plasmas 11, L41-L44.
Chau R, Mitchell AC, Minich RW, Nellis WJ., 2001, “Electrical conductivity of water
compressed dynamically to pressures of 70-180 GPa (0.7-1.8 Mbar),” J. Chemical
Physics 114, 1361-1365.
Chenais-Popovics C., 2002, “Astrophysics in laboratory: Opacity measurements,” Laser
and Particle Beams 20 (2): 291-298.
Chevalier, R.A., 1982a, “The radio and X-ray emission from Type II supernovae,”
Astrophys. J. 259, 1, 302-310.
Chevalier, R.A., 1999, “Supernova Remnants in Molecular Clouds,” Astrophys. J. 511,
798-811.

81
Ciardi, A., S.V. Lebedev, J.P. Chittendon, D.J. Ampleford, S.N. Gland, S.C. Bott, and J.
Rapley, 2005, “Modeling magnetic tower jets in the laboratory,” in press, Astrophys.
Space Sci. 298.
Collins, G. W., L. B. Da Silva, P. Celliers, D. M. Gold, M. E. Foord, R. J. Wallace, A.
Ng, S. V. Weber, K. S. Budil, R. Cauble, “Measurements of the Equation of State of
Deuterium at the Fluid Insulator–Metal Transition,” Science 281, 1178-1181.
Cioffi, D.F., C.F. McKee, and E. Bertschinger, 1988, “Dynamics of radiative supernova
remnants,” Astrophys. J. 334, Nov. 1998, 252-265.
Collins, G. W., L. B. Da Silva, P. Celliers, D. M. Gold, M. E. Foord, R. J. Wallace, A.
Ng, S. V. Weber, K. S. Budil, R. Cauble, “Measurements of the Equation of State of
Deuterium at the Fluid Insulator–Metal Transition,” Science 281, 1178-1181.
Cohen, Ehud, Tsvi Piran, and Re'em Sari, 1998, “Fluid dynamics of semiradiative blast
waves,” Astrophys. J. 509, 717-727.
Cohen, M., Kuhi, L.V. 1979. “Observational studies of star formation: conclusions”
Astrophys. J., 227, L105. Astrophys. J. Suppl., 41, 743
Cordes, J.M., R.W. Romani, S.C. Lundgren, 1993, “The Guitar Nebula - a bow shock
from a slow-spin, high-velocity neutron star,” Nature, 362, 133.
Courtois C., Grundy RAD., Ash AD., Chambers DM., Woolsey NC., Dendy RO.,
McClements KG., 2004, “Experiment on collisionless plasma interaction with
applications to supernova remnant physics.” Physics of Plasmas. 11, 3386-3393.
Cox, A.N. and J.E. Tabor, 1976, “Radiative opacity tables for 40 stellar mixtures,”
Astrophys. J. Suppl. Ser. 31, 271-312 (1976).

82
Da Silva, L.B., B.J. MacGowan, D.R. Kania, B.A. Hammel, C.A. Back, E. Hsich, R.
Doyas, C.A. Iglesias, F.J. Rogers, and R.W. Lee, 1992, “Absorption measurements
demonstrating the importance of ∆n = 0 transitions in the opacity of iron,” Phys. Rev.
Lett. 69, 438-441.
Dalgarno, A., R.A. McCray, 1972, “Heating and ionization of HI regions,” ARAA, 375.
Danson, C.N., P.A. Brummitt, J. Collier, R.J. Clark, M. Dominey, C.B. Edwards, R.
Edwards, A.J. Frackiewicz, J.A.C. Govans, S. Hancock, P.E. Hatton, S. Hawkes, C.R.
Heathcote, C. Hernandez-Gomez, P. Holligan, C. Hooker, M.H.R. Hutchinson, A.
Jackson, A. Kidd, W.J. Lester, J. Monk, D. Neely, D.R. Neville, P. Norreys, M.
Notley, D.A. Pepler, M.R. Pitts, C.J. Reason, D. Robinson, K.J. Rodgers, D. Rose,
I.N. Ross, A.J. Ryder, M.R. Selley, D. Shepherd, T. Strange, M. Tolley, R.
Wellstood, G.N. Wiggins, T.B. Winstone, P.N.M. Wright, R.W.W. Wyatt, B.E.
Wyborn and Ch. Ziener, 2004, “The Vulcan Petawatt Interaction Facility,”
proceedings of IFSA-2003, Ed. B.A. Hammel, D.D. Meyerhofer, J. Meyher-ter-Vehn,
and H. Azechi, (American Nuclear Society, Inc, La Grange Park, IL, 2004), 512-516.
De Young, David S., 1991, “Astrophysical jets,” Science 252, 389-395.
Di-Nicola, J.M., J.P. Leidinger, J.L. Bruneau, B. Le Garrec, X. Julien, E. Bordenave, R.
Maleck, F. Jequier, E. Journot, O. Lutz, G. Thiell, C. Feral, H. Graillot, and M.
Luttmann, “The LIL Facility start-up: first high power and high energy laser
experimental results at 1053 nm and 351 nm,” proceedings of IFSA-2003, Ed. B.A.
Hammel, D.D. Meyerhofer, J. Meyher-ter-Vehn, and H. Azechi, (American Nuclear
Society, Inc, La Grange Park, IL, 2004), pp. 558-562.

83
Dickel, J.R., J.A. Eilek, E.M. Jones, and S.P. Reynolds, 1989, Radio emission from
young supernova remnants: effects of an inhomogeneous circumstellar medium,
Astrophys. J. S., 70, July, 497-538.
Dimotakis, P.E., 2000, “The mixing transition in turbulent flows,” J. Fluid Mech. 409,
69-98.
Ditmire, T., K. Shigemori, B.A. Remington, K.G. Estabrook, and R.A. Smith, 2000, “The
Production of Strong Blast Waves Through Intense Laser Irradiation of Atomic
Clusters,” Astrophys. J. Suppl. 127, 299-304.
Drake, R.P., 1999, “Laboratory experiments to simulate the hydrodynamics of supernova
remnants and supernovae,” J. Geophys. Res., 104, A7, 14,505-14,515.
Drake, R.P., 2000, The design of laboratory experiments to produce collisionless shocks
of cosmic relevance, Phys. Plasmas, 7, 11, 4690-4698.
Drake, R.P., 2002, “Design of flyer-plate-driven compressible turbulent mix experiments
using Z”, Phys. Plasmas 9, 3545.
Drake, R.P., J.J. Carroll, K. Estabrook, S.G. Glendinning, B.A. Remington, and R.
McCray, 1998, "Development of a laboratory environment to test models of
supernova remnant formation," Astrophys. J. Lett. 500, L157-L161.
Drake, R.P., J.J.Carroll III, T.B. Smith, P. Keiter, S.G. Glendinning, O. Hurricane, K.
Estabrook, D.D. Ryutov, B.A. Remington, R.J.W., LLNL, E. Michael, and R.
McCray, 2000a, “Laboratory Experiments to Simulate Supernova Remnants,” Phys.
Plasmas 7, 2142.
Drake, R.P., S.G. Glendinning, K. Estabrook, B.A. Remington, R. McCray, R. Wallace,
L.J. Suter, T.B. Smith, R. London, and E. Liang, 1998b, Observation of forward

84
shocks and stagnated ejecta driven by high-energy-density plasma flow, Phys. Rev.
Lett., 81, 10, 2068-2071.
Drake, R.P., T. Smith, J.J.C. III, Y. Yan, S.G. Glendinning, K. Estabrook, D.D. Ryutov,
B.A. Remington, R.W., LLNL, and R. McCray, 2000b, “Progress Toward the
Laboratory Simulation of Young Supernova Remnants,” Astrophys. J. Suppl., 127,
305-310.
Drake, R.P., H.F. Robey, O.A. Hurricane, Y. Zhang, B.A. Remington, J. Knauer, J.
Glimm, D. Arnett, J. O. Kane, K.S. Budil, and J. Grove, 2002, “Experiments to
produce a hydrodynamically unstable, spherically diverging system of relevance to
instabilities in supernovae,” Astrophys. J., 564, 896-908
Drake RP. Leibrandt DR. Harding EC. Kuranz CC. Blackburn MA. Robey HF.
Remington BA. Edwards MJ. Miles AR. Perry TS. Wallace RJ. Louis H. Knauer JP.
Arnett D., 2004, “Nonlinear mixing behavior of the three-dimensional Rayleigh-
Taylor instability at a decelerating interface,” Physics of Plasmas. 11, 2829-2837..
Edens, A.D., T. Ditmire, J.F. Hansen, M.J. Edwards, R.G. Adams, P. Rambo, L. Ruggles,
I.C. Smith, J.L. Porter, 2004. “ Study of high Mach number laser driven blast waves.”
Phys. Plasmas, 11, 4968.
Edwards, M.J., A.J. MacKinnon, J. Zweiback, K. Shigemori, D.D. Ryutov, A.M.
Rubenchik, K.A. Keitlty, E. Liang, B.A. Remington, and T. Ditmire, 2001,
"Investigation of ultrafast laser-driven radiative blast waves," Phys. Rev. Lett. 87,
0850041-0850014.
Elmegreen, B.G., 1979,. “Magnetic diffusion and ionization fractions in dense molecular
clouds - The role of charged grains.” ApJ, 232, 729.

85
Elmegreen, B.G, 1998. “Observation and theory of Dynamical Triggers for Star
Formation,” Astronomical Society of the Pacific Conference Series, v. 148, p. 150.
Erlandson, A.C., Al Astanovitskiy, S. Batie, B. Bauer, A. Bayramian, J.A. Caird, C.
Ebbers, J. Fuchs, H. Faretto, J. glassman, V. Ivanov, B. LeGalloudec, N.
LeGalloudec, S. Letzring, S. Payne, B. Stuart, and T.E. Cowan, 2004, “Design of a 50
TW / 20 J chirped-pulse amplification laser for high-energy-density plasma physics
experiments at the Nevada Terawatt Facility of the University of Nevada,”
proceedings of IFSA-2003, Ed. B.A. Hammel, D.D. Meyerhofer, J. Meyher-ter-Vehn,
and H. Azechi, (American Nuclear Society, Inc, La Grange Park, IL, 2004), 626-629.
Ferrarese, Laura, Holland C. Ford and Walter Jaffe, 1996, “Evidence for a massive black
hole in the active galaxy NGC 4261 from Hubble Space Telescope images and
spectra,” Astrophys. J. 470, 444-459.
Fontaine, G., P. Brassard, and P. Bergeron, 2001, “The potential of white dwarf
cosmochronology,” Publications of the Astronomical Society of the Pacific, 113,
409–435.
Foord, M. E., R. F. Heeter, P. A. M. van Hoof, R. S. Thoe, J. E. Bailey, M. E. Cuneo, H.-
K. Chung, D. A. Liedahl, K. B. Fournier, G. A. Chandler, V. Jonauskas, R. Kisielius,
L. P. Mix, C. Ramsbottom, P.T. Springer, F. P. Keenan, S. J. Rose, and W. H.
Goldstein, 2004, “Charge-State Distribution and Doppler Effect in an Expanding
Photoionized Plasma,” Phys. Rev. Lett. 93, 055002.
Fortney, Jonathan J. and W. B. Hubbard, 2004, “Effects of helium phase separation on
the evolution of extrasolar giant planets,” Astrophys. J., 608,1039–1049.
Foster, J.M., B.H. Wilde, P.A. Rosen, T.S. Perry, M. Fell, M.J. Edwards, B.F. Lasinski,

86
R.E. Turner, and M.L. Gittings, 2002, “Supersonic jet and shock interactions,” Phys.
Plasmas 9, 2251.
Foster, J.M., B.H. Wilde, and P.A. Rosen, 2004, private communication.
Frank, A., D. Ryu, T.W. Jones, and A. Noriega-Crespo, 1998, “Effects of cooling on the
propagation of magnetized jets,” Astrophys. J. 494, L79-L83.
Frieman, E.A. 1954, “On ‘elephant-trunk’ structures in the region of O associations,”
Astrophys. J. 120, 18.
Fryer, C.L., 1999, “What Powers Core-Collapse Supernovae?,” in “Cosmic Explosions,”
Proc. 10th Astrophysical Conference, College Park, Maryland, 1999, AIP Conference
Proceedings # 522, p. 113.
Fryer, C.L., A. Burrows, W. Benz, 1998. Population syntheses for neutron star systems
with intrinsic kicks.” Astrophys. J. 496, 333.
Fryer, C.L. and A. Heger, 2000,.”Core-collapse simulations of rotating stars.” Astrophys.
J. 541, 1033.
Gaetz, T.J., Y.M. Butt, R.J. Edgar, K.A. Eriksen, P.P. Plucinsky, E.M. Schlegel, and R.K.
Smith, 2000, Chandra X-Ray Observatory arcsecond imaging of the young, oxygen-
rich supernova remnant 1E 0102.2-7219, Astrophys. J. Lett., 534, L47-50.
Gjevik, B. In “Orographic Effects in Planetary Flows,” Global Atmospheric Research
Programme (GARP) Publication #23, World Meteorological Organization -
International Council of Scientific Unions (WMO/ICSU), p. 304 (1980).
Glaze J.A., W.W. Simmons, W.F. Hagen, “Status of Large Neodimium Glass Lasers,”
(Society Photo-Optics Instrumentation Engineers, Palos Verdes Estates, CA), p. 7.

87
Glimm J., J.W. Grove, Yongmin Zhang, 2001, “Interface tracking for axisymmetric
flows,” SIAM Journal on Scientific Computing 24 208-236.
Grun, J., J. Stamper, C. Manka, J. Resnick, R. Burris, J. Crawford, and B.H. Ripin, 1991,
“Instability of Taylor-Sedov blast waves propagating through a uniform gas,” Phys.
Rev. Lett., 66, 21, 2738-2741.
Guillot, Tristan, 1999, “Interiors of giant planets inside and outside the solar system,”
Science 286, 72-77.
Gull, S.F., 1973, “A numerical model of the structure and evolution of young supernova
remnants,” MNRAS, 161, 1, 47-69.
Hansen, J.F., M.J. Edwards, D. Froula, G. Gregori, A. Edens, T. Ditmire, 2004,
“Laboratory observation of secondary shock formation ahead of a strongly radiative
blast wave,” submitted to Phys. Rev. Lett.
Hansen, C.J. and S.D. Kawaler, 1995, “Stellar Interiors: Physical Principles, Structure,
and Evolution,” (Springer-Verlag, New York, Inc.).
Hartigan, Patrick, Jon A. Morse, Bo Reipurth, Steve Heathcote, and John Bally, 2001,
“Proper motions of the HH 111 jet observed with the Hubble Space Telescope,”
Astrophys. J. 559, L157-161.
Heathcote, Steve, Jon A. Morse, Patrick Hartigan, Bo Reipurth, Richard D. Schwartz,
John Bally, and James M. Stone, 1996, “Hubble Space Telescope observations of the
HH 47 jet: narrowband images,” Astron. J. 112, 1141-1168.
Heeter, R. F., J. E. Bailey and M. E. Cuneo, J. Emig, M. E. Foord, P. T. Springer, and R.
S. Thoe, 2001, “Plasma diagnostics for x-ray driven foils at Z,” Rev. Sci. Instrum. 72,
1224-1227.
88
Heger, A., N. Langer, and S.E. Woosley, 2000, “Presupernova evolution of rotating
massive stars. I. Numerical method and evolution of the internal stellar structure.”
Astrophys. J., 528, 368.
Hester, J.J., P.A. Scowen, R. Sankrit, et al., 1996, “Hubble space telescope WFPC2
imaging of M16 - photoevaporation and emerging young stellar objects.,”AJ, 111,
2349.
Hogan, W., E. Moses, B. Warner, M. Sorem, J. Soures, “The National Ignition Facility,”
2001, Nuclear Fusion 41, 567.
Holmes, N.C., M. Ross, and W.J. Nellis, 1995, “Temperature measurements and
dissociation of shock-compressed liquid deuterium and hydrogen,” Phys. Rev. B 52,
15835-15845.
Hubbard, W.B. ,1997, “Neptune’s deep chemistry,” Science 275, 1279-1280.
Hughes, J.P., C.E. Rakowski, and A. Decourchelle, 2000b “Electron heating and cosmic
rays at a supernova shock from Chandra x-ray observations of E 0102.2 7219,”
Astrophys. J. Lett., 543, 1, L61-65.
Iben, I. Jr., and R.J. Talbot, 1966, “Stellar formation rates in young clusters,” Astrophys.
J. 144, 968.
Icke V, G. Mellema, B. Balick, F. Eulderink, and A. Frank, 1992, Nature 355, 524-526.
Iglesias, C.A.and B.G. Wilson, J. Quant. Spectrosc. Radiat. Transfer 52, 127 (1994).
Iglesias, C.A. and F.J. Rogers, 1991, “Opacity tables for Cepheid Variables,” Astrophys.
J. 371, L73-L75.
Iglesias, C.A., and F.J. Rogers, 1996, “Updated OPAL opacities,” Astrophys. J. 464, 2,
943-953.

89
Innes, D.E., J.R. Giddings, and S.A.E.G. Falle, 1987, “Dynamical models of radiative
shocks. II. Unsteady shocks,” MNRAS, 226, 1, 67-93.
Jeffery, D.J., 1991, “Analysis of SN 1987A Polarimetry,” Ap. J, 375, 264.
Jun, B.I., T.W. Jones, and M.L. Norman, 1996, Interaction of Rayleigh-Taylor fingers
and circumstellar cloudlets in young supernova remnants, Astrophys. J. 468,
September 1, L59-L63.
Kahn, F.D. 1954, “The acceleration of interstellar clouds.” Bull. Astr. Inst. Netherlands,
12, 187.
Kahn, F.D. 1958, “On the stability of ionization fronts,” Rev. Mod. Phys., 30, 1058.
Kane, J.O., D.D. Ryutov, A. Mizuta, B.A. Remington, M.W. Pound, 2005, “Molecular
clouds: observation to experiment,” Astrophysics and Space Science, in press.
Kane, J., D. Arnett, et al., 1997. Supernova experiments on the Nova laser. Second Oak
Ridge Symposium on Atomic and Nuclear Astrophysics, Oak Ridge, Tenessee.
Kane, J., D. Arnett, B.A. Remington, S.G. Glendinning, G. Bazan, R.P. Drake, B.A.
Fryxell, R. Teyssier, K. Moore, 1999a, “Scaling supernova hydrodynamics to the
laboratory,” Phys. Plasmas, 6, 2065.
Kane, J., R.P. Drake, and B.A. Remington, 1999b, An evaluation of the Richtmyer-
Meshkov instability in supernova remnant formation, Astrophys. J. 511, 1, 335-340.
Kane, J., D. Arnett, B.A. Remington, S.G. Glendinning, G. Bazan, E. Muller, B.A.
Fryxell, R. Teyssier, 2000. Two-dimensional versus three-dimensional supernova
hydrodynamic instability growth. Astrophys. J. 528, 989.

90
Kane, J.O., B.A. Remington, R.P.Drake, J. Knauer, D.D. Ryutov, H. Louis, R. Teyssier,
D. Arnett, R. Rosner, A. Calder, 2001, “Interface imprinting by a rippled shock using
an intense laser,” Phys. Rev. E, 63, 055401R
Kang, Y.G., H. Nishimura, H. Takabe, H. Azechi, T. Norimatsu, M. Nakai, H.
Nagatomo, J. Sunahara, K. Fujita, M. Nakatsuka, K. Mima, H.G. Kim, and H.J.
Kong, 2000, “Hydrodynamic model experiment of the collision of supernova 1987A
with its circumstellar ring using high power laser,” Proc. of the SPIE, 3886, 489-95.
Kang, Y.G., K. Nishihara, H. Nishimura, H. Takabe, A. Sunahara, T. Norimatsu, H. Kim,
M. Nakatsuka, H.J. Kong, and N.J. Zabusky, 2001, "Blast wave-sphere interaction
using a laser produced plasma: An experiment motivated by supernova 1987A," Phys.
Rev. E 64, 047402.
Kang, Y.G., H. Nishimura, H. Takabe, K. Nishihara, A. Sunahara, T. Norimatsu, H. Kim,
M. Nakatsuka, and H.J. Kong, 2001, "Laboratory simulation of the collision of
supernova 1987A with its circumstellar ring nebula," Plasma Phys. Rep. 27, 843-851.
Keohane, J.W., L. Rudnick, and M.C. Anderson, 1996, A Comparison of the X-Ray and
Radio Emission from the Supernova Remnant Cassiopeia A, Astrophys. J. 466, 309-
316.
Keiter, P.A., R.P. Drake, T.S. Perry, H.F. Robey, B.A. Remington, C.A. Iglesias, R.J.
Wallace, J. Knauer, 2002, “Observation of a hydrodynamically-driven, radiative-
precursor shock,” Phys. Rev. Lett. 89, 165003/1-4.
Kifonidis, K., T. Plewa, H.-Th. Janka, E. Muller, 2000, “Nucleosynthesis and clump
formation in a core-collapse supernova,” Astrophys. J. 531 L123-126.

91
Kirschner, R.P. et al., 1999, “Supernovae, an accelerating universe and the cosmological
constant” Proc. Nat. Acad. Sci. 96, 4224-4227.
Khokhlov, A.M., P.F. Hoflich, E.S. Oran, J.C. Wheeler, L. Wang, A.Y. Chtchelkanova,
1999, “Jet-induced explosions of core collapse supernovae,” Astrophys. J. 524, L107.
Klein, R.I., K.S. Budil, T.S. Perry, and D.R. Bach, 2000, “Interaction of supernova
remnants with interstellar clouds: from the Nova laser to the Galaxy,” Astrophys. J.
Suppl. Series, 127, 2, 379-383.
Klein RI. Budil KS. Perry TS. Bach DR. 2003, “The interaction of supernova remnants
with interstellar clouds: Experiments on the Nova laser,” Astrophysical Journal 583,
245-259.
Knauer JP. Betti R. Bradley DK. Boehly TR. Collins TJB. Goncharov VN. McKenty PW.
Meyerhofer DD. Smalyuk VA. Verdon CP. Glendinning SG. Kalantar DH. Watt RG,
2000, “Single-mode, Rayleigh-Taylor growth-rate measurements on the OMEGA
laser system.” Physics of Plasmas. 7,:338-345.
Knudson, M.D., Hanson DL. Bailey JE. Hall CA. Asay JR. Anderson WW., 2001,
“Equation of state measurements in liquid deuterium to 70 Gpa,” Physical Review
Letters. 87, 225501.
Knudson, M. D., D. L. Hanson, J. E. Bailey, C. A. Hall, and J. R. Asay, 2003, “Use of a
wave reverberation technique to infer the density compression of shocked liquid
deuterium to 75 GPa,” Phys. Rev. Lett. 90, 035505.
Koch, J.A., O.L. Landen, and B.A. Hammel, C. Brown and J. Seely, and Y. Aglitskiy,
1999, “Recent progress in high-energy, high-resolution x-ray imaging techniques for
application to the National Ignition Facility,” Rev. Sci. Instrum. 70, 525-529.

92
Koenig, M., 2004, private communication.
Kruer, W.L., 2000, “Interaction of plasmas with intense lasers,” Phys. Plasmas 7, 2270.
Landau, L.D., E.M.Lifshitz, “Fluid Mechanics,” NY, Pergamon Press, 1987.
Landen, O.L., D.R. Farley, S.G. Glendinning, L.M. Logory, P.M. Bell, J.A. Koch, F.D.
Lee, D.K. Bradley, D.H. Kalantar, C.A. Back, and R.E. Turner, 2001, “X-ray
backlighting for the National Ignition Facility,” Rev. Sci. Instrum. 72, 627-634.
Larsen J.T., S.M. Lane, 1994, “HYADES - a plasma hydrodynamics code for dense-
plasma studies,” Journal of Quantitative Spectroscopy & Radiative Transfer 51, 179-
186.
Lebedev, S.V., J.P. Chittenden, F.N. Beg, S.N. Bland, A. Ciardi,D. Ampleford, S.
Hughes, M.G. Haines, A. Fran k, E.G. Blackman, and T. Gardiner, 2002, “Laboratory
astrophysics and collimated stellar outflows: the production of radiatively cooled
hypersonic plasma jets,” Astrophys. J. 564, 113-119.
Lebedev, S.V., D. Ampleford, A. Ciardi, S.N. Bland, J.P. Chittendon, M.G. Haines, A.
Frank, E.G. Blackman, and A. Cunningham, 2004a, “Jet deflection via cross winds:
laboratory astrophysical studies,” Astrophys. J. 616, 2004.
Lebedev, S.V., 2004b, private communication.
LeBlanc, J.M., J.R. Wilson. Astrophys. J. 161, 541.
Lefloch, B., B. Lazareff, 1994, “Cometary globules. 1. Formation, Evolution and
morphology,” Astron. Astrophys., 289, 559.
Leonard, D.C., A.V. Filippenko, T. Matheson, 2000, “Probing the Geometry of
Supernovae with Spectropolarimetry,” In: Cosmic Explosions, Proc. 10th

93
Astrophysics Conference, College Park, Maryland, Oct . 1999; AIP Conference
Proceedings, v. 522, p. 165.
Leung, C.M. 1985, in Protostars and Planets II, ed. D. Black and M. Matthews, Tucson:
University of Arizona Press, p. 104.
Levenson, N., J. R. Graham, I.S. McLean, E.E. Becklin, D.F. Figer, A.M. Gilbert, J.E.
Larkin, H.I. Teplitz, M.K. Wilcox, 2000, “Hot stars and cool clouds: the
photodissociation region M16,” Astrophys. J. 533, L53-L56.
Libby, S.B., M. Tabak, R.D. Hoffman, M.A. Stoyer, S.W. Haan, S.P. Hatchett, D.P.
NcNabb, W.E. Ormand, J. Escher, P. Navratil, D. Gogny, M.S. Weiss, M. Mustafa, J.
Becker, W. Younes, E. Hartouni, and R.A. Ward, 2004, “Prospects for investigating
unusual nuclear reaction environments using the National Ignition Facility,”
proceedings of IFSA-2003, Ed. B.A. Hammel, D.D. Meyerhofer, J. Meyher-ter-Vehn,
and H. Azechi, (American Nuclear Society, Inc, La Grange Park, IL, 2004), 935-939.
Liedahl, Duane A. and Frits Paerels, 1996, “Photoionization-driven x-ray line emission in
Cygnus X-3,” Astrophys. J. 468, l33–l36.
Lindl, J., 1995,. “Development of the indirect-drive approach to inertial confinement
fusion and the target physics basis for ignition and gain,” Phys. Plasmas 2, 3933.
Lindl JD, Amendt P, Berger RL, Glendinning SG, Glenzer SH, Haan SW, Kauffman RL,
Landen OL, Suter LJ, 2004, “The physics basis for ignition using indirect-drive
targets on the National Ignition Facility,” Phys. Plasmas 11, 339-491.
Livio, Mario, 1999, “Astrophysical jets: a phenomenological examination of acceleration
and collimation,” Phys. Reports 311, 225-245.
94
Lovelace, R.V.E., M.M. Romanova, and J. Contopoulos, 1993, “Theory of jets from
young stars,” Astrophys. J. 403, 158-163.
Lyne, A.G., and D.R. Lorimer, 1994, “High birth velocities of radio pulsars,” Nature,
369, 127.
Matzen M.K. 2005. “Pulsed-power-driven high energy density physics and inertial
confinement fusion research” Phys. Plasmas, 12, in press.
Michaut C., C. Stehle, L. Boireau, S. Leygnac, 2003. “Microscopic aspects of radiative
shock structures.” In: Proc.of the 2003 Inernat. Conf. “Inertial Fusion Science and
Applications’ (Editors: B.A. Hammel, D.D. Meyerhofer, J. Meyer-terVehn, H.
Azechi, American Nuclear Society, 2004), p. 954.
Michaut C., C. Stehle, S. Leygnac, T. Lanz, L. Boireau, 2004. “Jump conditions in
hypersonic shocks.” Eur. Phys. J. D, 28, 381-392.
Miles AR. Braun DG. Edwards MJ. Robey HF. Drake RP. Leibrandt DR., 2004.
Numerical simulation of supernova-relevant laser-driven hydro experiments on
OMEGA. Physics of Plasmas. 11, 3631-3645.
Miles, A. R. , M. J. Edwards, B. Blue, J. F. Hansen, H. F. Robey, R. P. Drake, C. Kuranz,
and D. R. Leibrandt, 2004. “The effect of a short-wavelength mode on the evolution
of a long-wavelength perturbation driven by a strong blast wave.” Phys. Plasmas, 11,
pp. 5507-5519.
Miller, George H., 2004, “The National Ignition Facility,” proceedings of IFSA-2003,
Ed. B.A. Hammel, D.D. Meyerhofer, J. Meyher-ter-Vehn, and H. Azechi, (American
Nuclear Society, Inc, La Grange Park, IL, 2004), 529-534.

95
Miyanaga, N., H. Azechi, K.A. Tanaka, T. Kanabe, T. Jitsuno, Y. Fujimoto, R. Kodama,
H. Shiraga, K. Kondo, K. Tsubakimoto, Y. Kitagawa, H. Fujita, S. Sakabe, H.
Yoshida, K. Mima, T. Yamanaka, and Y. Izawa, 2004, “FIREX petawatt laser
development for fast ignition research at ILE, Osaka,” proceedings of IFSA-2003, Ed.
B.A. Hammel, D.D. Meyerhofer, J. Meyher-ter-Vehn, and H. Azechi, (American
Nuclear Society, Inc, La Grange Park, IL, 2004), 507-511.
Mizuta, Akira, Jave O. Kane, Marc W. Pound, Bruce A. Remington, Dmitri D. Ryutov,
and Hideaki Takabe, 2005, “Hydrodynamic instability of ionization fronts in HII
regions,” Astrophys. J., in press.
Moses, Edward I., 2004, “The National Inition Facility: transition to a target shooter,”
proceedings of IFSA-2003, Ed. B.A. Hammel, D.D. Meyerhofer, J. Meyher-ter-Vehn,
and H. Azechi, (American Nuclear Society, Inc, La Grange Park, IL, 2004), 535-540.
Mostovych, A. N., Y. Chan, T. Lehecha, L. Phillips, A. Schmitt, and J. D. Sethian, 2001,
“Reflected shock experiments on the equation-of-state properties of liquid deuterium
at 100–600 GPa (1–6 Mbar),” Phys. Plasmas 8, 2281-2286.
Müller, E., B. Fryxell, D. Arnett,1991, “Instability and clumping in SN-1987a,” Astron.
Astrophys. 251, 505-514.
Nellis W.J., D.C. Hamilton, N.C. Holmes, H.H. Radousky, F.H. Ree, A.C. Mitchell, M.
Nicol, 1988, “The nature of the interior of uranus based on studies of planetary ices at
high dynamic pressure,” Science 240, 779-781.
Nellis, W.J., 2002, “Shock compression of deuterium near 100 GPa pressures,” Phys.
Rev. Lett. 89, 165502.

96
Nguyen, J.H. and N.C. Holmes, 2004, “Melting of iron at the physical conditions of the
Earth's core,” Nature 427, 339-342.
Norman, M.L., L. Smarr, K.-H. A. Winkler, and M.D. Smith, 1982, “Structure and
dynamics of supersonic jets,” Astron. Astrophys. 113, 285-302.
Oort, J.H. 1953. Paper read at Cambridge Symposium on Gas Dynamics of Interstellar
Clouds.
Oort, J.H., Spitzer, L. 1955, “Acceleration of interstellar clouds by O-type stars.”
Astrophys. J. 121, 6.
Perlmutter, S. et al., 1999, “Measurements of Omega and Lambda from 42 high-redshift
supernovae.” Astrophys. J. 517, 565.
Piner, Glenn, Dayton Jones, and Ann E. Wehrle, 2001, “Orientation and speed of the
parsec-scale jet in NGC 4261 (3c 270),” Astron. J., 122, 2954-2960.
Pound, Marc W., Jave O. Kane , Bruce A. Remington and Dmitri D. Ryutov, Akira
Mizuta and Hideaki Takabe, “Eagle Nebula Pillars: From Models to Observations,”
in press, Astrophys. Space Science Vol. 298, No. 1-2.
Pound, Marc W., Jave O. Kane , Bruce A. Remington and Dmitri D. Ryutov, Akira
Mizuta and Hideaki Takabe, 2005, “Eagle Nebula Pillars: From Models to
Observations,” in press, Astrophys. Space Science Vol. 298, No. 1-2.
Poludnenko AY. Dannenberg KK. Drake RP. Frank A. Knauer J. Meyerhofer DD.
Furnish M. Asay JR. Mitran S., 2004. A laboratory investigation of supersonic
clumpy flows: Experimental design and theoretical analysis. Astrophysical Journal.
604, :213-221.

97
Pound, M.W., 1998, “Molecular gas in the Eagle Nebula,” Astrophys. J. 493, L113-
L116.
Pudritz, Ralph E. and Colin A. Norman, 1986, “Bipolar hydromagneticd winds from
disks around protostellar objects,” Astrophys. J. 301, 571-586.
Rambo P.K., J.L. Porter, G.R. Bennett, I.C. Smith, A.C. Erlandson, J.E. Murray, J. Caird,
2002. OSA Trends Opt. Photonics Ser. 73, 362.
Rasmussen, A.P., E. Behar, S.M. Kahn, J.W. den-Herder, and K. van-der-Heyden, 2001,
The X-ray spectrum of the supernova remnant 1E 0102.2-7219, Astron. &
Astrophys., 365, 1, L231-236.
Reed, J.I., J.J. Hester, A.C. Fabian, and P.F. Winkler, 1995, The Three Dimensional
Structure of the Cassiopeia A Supernova Remnant. I. The Spherical Shell, Astrophys.
J. 440, 706-721.
Reipurth, Bo, and John Bally, 2001, “Herbig-Haro flows: probes of early stellar
evolution,” Ann. Rev. Astron. Astrophys. 39, 403-455.
Remington, B.A., D. Arnett, R.P. Drake, and H. Takabe, 1999, “Modeling Astrophysical
Phenomena in the Laboratory with Intense Lasers,” Science 284, 1488-1493.
Remington, Bruce A., R. Paul Drake, Hideaki Takabe, and David Arnett, 2000, “A
review of astrophysics experiments on intense lasers,” Physics of Plasmas 7, 1641-
1652.
Remington, B.A., S.V. Weber, S.W. Haan, J.D. Kilkenny, S.G. Glendinning, R.J.
Wallace, W.H. Goldstein, B.G. Wilson, and J.K. Nash, 1993, “Laser Driven
Hydrodynamic Instability Experiments,” Phys. Fluids B 5, 2589-2595.
Remington, B.A., J. Kane, R.P. Drake, S.G. Glendinning, K. Estabrook, R. London, J.

98
Castor, R.J. Wallace, D. Arnett, E. Liang, R. McCray, A. Rubenchik, B. Fryxell,
1997. “Supernova hydrodynamics experiments on the Nova laser,” Phys. Plasmas, 4,
1994.
Ripin, B.H. et al., 1990 "Laboratory laser-produced astrophysical-like plasmas," Laser
and Part. Beams 8, 183.
Robey, H. F., J. O. Kane, B. A. Remington, R. P. Drake, O. A. Hurricane, H. Louis, R. J.
Wallace, J. Knauer, P. Keiter, D. Arnett, and D. D. Ryutov, 2001, “An experimental
testbed for the study of hydrodynamic issues in supernovae,” Phys. Plasmas 8, 2446-
2453.
Robey, H. F., Ye Zhou, and A. C. Buckingham, P. Keiter, B. A. Remington, R. P. Drake,
2003, “The time scale for the transition to turbulence in a high Reynolds number,
accelerated flow,” Phys. Plasmas 10, 614-622.
Robey, H.F., T.S. Perry, R.I. Klein, J.O. Kane, J.A. Greenough, and T.R. Boehly, 2002,
“Experimental investigation of the three-dimensional interaction of a strong shock
with a spherical density inhomogeneity,” Phys. Rev. Lett. 89, 085001-1-4.
Robey HF, AR Miles, JF Hansen, BE Blue, RP Drake, 2003b. “Laser-Driven
Hydrodynamic Experiments in the turbulent Plasma Regime: from Omega to NIF.”
In: Proc..of the 2003 Inernat. Conf. “Inertial Fusion Science and Applications’
(Editors: B.A. Hammel, D.D. Meyerhofer, J. Meyer-terVehn, H. Azechi, American
Nuclear Society, 2004) p.135
Robey H.F. , 2004. “Effects of viscosity and mass diffusion in hydrodynamically unstable
plasma flows.” Phys. Plasmas, 11, 4123.

99
Rogers, Forest J. and Carlos A. Iglesias, 1994, “Astrophysical opacity,” Science 263, 50-
55.
Rogers, F.J. and C.A. Iglesias, 1992, “Radiative atomic Rosseland mean opacity tables,”
Astrophys. J. Suppl. Ser. 79, 507.
Rogers, FJ; Iglesias, CA., 1998, “Opacity of stellar matter,” Space Science Reviews,
1998, V85, 61-70.
Rogers F.J., C.A. Iglesias, 1998, “Opacity of stellar matter,” Space Science Reviews 85
61-70.
Rose, S.J., 1991, " Laser-produced plasma and astrophysics," Laser and Part. Beams 9,
869.
Rose, S.J., P.A.M. van Hoof, V. Jonauskas, F.P. Keenan, R. Kisielius, C. Ramsbottom,
M.E. Foord, R.F. Heeter and P.T. Springer, 2004, “Calculation of photoionized
plasmas with an average-atom model,” J. Phys. B: At. Mol. Opt. Phys. 37,
L337–L342.
Ryu, D., and E.T. Vishniac, 1987, The growth of linear perturbations of adiabatic shock
waves, Ap. J, 313, 15 Feb., 820-41.
Ryutov, D.D. , R. P. Drake, J. Kane, E. Liang, B. A. Remington, and W.M. Wood-Vasey,
1999, Similarity criteria for the laboratory simulation of supernova hydrodynamics.
Astrophys. Journal, 518, 821.
Ryutov, D.D., M.S. Derzon, and M.K. Matzen, 2000, “The physics of fast Z pinches,”
Rev. Mod. Phys. 72, 167-223.

100
Ryutov, D.D., R.P. Drake and B.A. Remington, 2000a, Criteria for scaled laboratory
simulations of astrophysical MHD phenomena. Astrophysical Journal - Supplement,
127, 465.
Ryutov, D.D., B.A. Remington, H.F. Robey, R.P. Drake, 2001, “Magnetohydrodynamic
scaling: from astrophysics to the laboratory,” Phys. Plasmas 8, 1804.
Ryutov, D.D., B.A. Remington, 2002, “Scaling astrophysical phenomena to high-energy-
density laboratory experiments,” Plasma Phys. Controlled Fusion 44, B407-B423.
Ryutov, D.D., J.O. Kane, M.W. Pound, B.A. Remington, 2003, “Instability of an
ablatively-accelerated slab in the case of non-normal irradiation,” Plasma Physics and
Controlled Fusion 45, 769.
Ryutov D.D., B.A. Remington, 2003a. “A “perfect” hydrodynamic similarity and effect
of the Reynolds number on the global scale motion.” Physics of Plasmas, 10, 2629.
Ryutov D.D., B.A. Remington, 2003b. “ A perfect hydridynamic similarity and the effect
of small-scale vortices on the large-scale dynamics” In: Proc.of the 2003 Inernat.
Conf. “Inertial Fusion Science and Applications’ (Editors: B.A. Hammel, D.D.
Meyerhofer, J. Meyer-terVehn, H. Azechi, American Nuclear Society, 2004) p.945.
Ryutov D.D., J.O. Kane, A. Mizuta, M.W. Pound, and B.A. Remington, 2004. “Eagle
Nebula: the Problem of Missing Stiffness and the Hypothesis of Magnetostatic
Turbulence”, J.O. Kane, A. Mizuta, M.W. Pound, and B.A. Remington, 2004, in:
“Plasmas in the Laboratory and in the Universe”, AIP Conference Proceedings,
Volume 703, p. 415, Melville, NY, 2004.
Ryutov, D.D., J.O. Kane, A. Mizuta, M.W. Pound, B.A. Remington, 2005.

101
“Two models of magnetic support for photoevaporated molecular clouds,” in press,
Astrophysics and Space Science.
Sangster, C., 2004, private communication.
Saumon, D., and T. Guillot, 2004, “Shock compression of deuterium and the interiors of
Jupiter and Saturn,” Astrophys. J. 609,1170-1180.
Saumon, D, G. Chabrier, D.J. Wagner, and X. Xie, 2000, “Modeling pressure-ionization
of hydrogen in the context of astrophysics,” High Pressure Research 16, 331-343.
Shigemori, K., T. Ditmire, B.A. Remington, V. Yanovsky, D. Ryutov, K.G. Estabrook,
M.J. Edwards, A.J. MacKinnon, A.M. Rubenchik, K.A. Keilty, and E. Liang, , 2000,
“Developing a radiative shock experiment relevant to astrophysics,” Astrophys. J.
533, L159-L162.
Shigemori K, Kodama R, Farley DR, Koase T, Estabrook KG, Remington BA, Ryutov
DD, Ochi Y, Azechi H, Stone J, Turner N., 2000, “Experiments on radiative collapse
in laser-produced plasmas relevant to astrophysical jets,” Phys. Rev. E 62, 8838-
8841.
Shigeyama T., K. Nomoto, 1990, “Theoretical light curve of SN 1987A and mixing of
hydrogen and nickel in the ejecta,” Astrophys. J., 360, 242-256.
Shirkey, R.C., 1978, “The Radio Dynamical Evolution of Young Supernova Remnants,”
Astrophys. J. 224, 477-87.
Shu, F.H., F.C. Adams, S. Lizano, 1987, “Star formation in molecular clouds:
observation and theory,” Ann. Rev. Astron. Astrophys. 25, 23-81.

102
Shu, Frank H., Joan Najita, Eve C. Ostriker, and Hsien Shang, 1995,
“Magnetocentrifugally driven flows from young stars and disks. V. Asymptotic
collimation into jets.” Astrophys. J. 455, L155-L158.
Sinars, D.B., G.R. Bennett, D.F. Wenger, M.E. Cuneo, D.L. Hanson, J.L. Porter, R.G.
Adams, P.K. Rambo, D.C. Rovang, and I.C. Smith, 2004, “Monochromatic x-ray
imaging experiments on the Sandia National Laboratories Z facility,” Rev. Sci.
Instrum. 75, 3672.
Spitzer, L. 1954, “Behavior of matter in space,” Astrophys. J. 120, 1.
Spitzer, L. “Physical Processes in the Interstellar Medium,” John Wiley & Sons, New
York, 1978.
Springer P.T., D.J. Fields, B.G W ilson, J.K. Nash et al., 1992, “Spectroscopic absorption
measurements of an iron plasma,” Phys. Rev. Lett 69, 3735-3738.
Springer, P.T., K.L. Wong, C.A. Iglesias, J.H. Hammer, et al., 1997, “Laboratory
measurement of opacity for stellar envelopes,” J. Quant. Spectrosc. Radiat. Transfer,
58, 927-935.
Spruit, H., 1999, “Differential rotation and magnetic fields in stellar interiors,” Astron.
Astrophys., 349, 189.
Stone, James M. and Michael L. Norman, 1994, “Numerical simulations of protostellar
jets with nonequilibrium cooling. III. Three-dimensional results,” Astrophys. J. 420,
237-246.
Stone, James M., Neal Turner, Kent Estabrook Breuce Remington, David Farley, S.Gail
Glendinning, and Siegfried Glenzer, 2000, “Testing astrophysical radiation

103
hydrodynamics codes with hypervelocity jet experiments on the Nova laser,” Ap. J.
Suppl. 127, 497-502.
Sugitani, K, Tamura, M., Nakajima, Y., et al., 2002. “Near-infrared study of M-16: star
formation in the elephant trunks.” ApJ, 565, l25.
Suter, L.J., S. Glenzer, S. Haan, B. Hammel, K. manes, N. Meezan, J. Moody, M. Spaeth,
L. Divol, K. Oades, and M. Stevenson, 2004, “Prospects for high-gain, high yield NIF
targets driven by 2ω (green) light,” proceedings of IFSA-2003, Ed. B.A. Hammel,
D.D. Meyerhofer, J. Meyher-ter-Vehn, and H. Azechi, (American Nuclear Society,
Inc, La Grange Park, IL, 2004), 23-34.
Sutherland, P.G., 1990, “Gamma-Rays and X-Rays from Supernovae,” In: Supernovae,
A.G. Petschek, Ed., Springer Verlag, New York, Berlin, Heidelberg, 1990, p.111.
Sysoev, N.E., 1997. “Long-wave instability of an ionization front.” Astr. Lett. 23 409.
Takabe, H., H. Nagamoto, A. Sunahara, N. Ohnishi, A.I. Mahdy, Y. Yoda, S. Naruo, H.
Azechi, H. Nishimura, K. Mima, 1999, “Recent studies of laser produced plasmas,”
Plasma Phys. Contr. Fus., 41, A75.
Takabe, H. 2001, “Astrophysics with intense and ultra-intense lasers: ‘laser
astrophysics’,” Progress of Theoretical Physics Supplement 143, 202-265.
Taylor, Mark, John Foster, Paula Rosen, Robin Williams, BH. Wilde, T.S. Perry, P.
Keiter, R. Coker, R.P. Drake, and A.M. Khokhlov, 2004 “Transition to tujrbulence in
plasma jet experiments,” IFSA-2003 proceedings, p. 485-489.
Tenorio-Tagle, G., J. Canto, and M. Rozyczka, 1988, “The formation of interstellar jets,”
Astron. Astrophys. 202, 256-266.

104
Tipton, R.,1990, “Modeling flux compression generators with a 2D ALE code,” in
Megagauss Fields and Pulsed Power Systems, Nova Science Publishers, New York,
NY, USA., pp.217-31.
Trammell, S.R., D.C. Hines, J.C. Wheeler, 1993, “Spectropolarimetry of SN-1993j in
NGC-3031,” Astrophys. J. 414, 21.
Tran, H.D., A.V. Filippenko, G.D. Schmidt, K.S. Bjorkman, B.T. Jannuzi, P.S. Smith,
1997, “Probing the Geometry and Circumstellar Environment of SN 1993J in M81,”
PASP, 109, 489.
Van Dyke, M. 1982, “An album of fluid motion,” p.100, Parabolic Press, Stanford, CA.
Van Horn, H.M., 1991, “Dense astrophysical plasmas, Science 252, 384-389.
Vandervoort, P.O., 1962 “On the stability of ionization fronts.” ApJ 135 212.
Vishniac, E.T., 1983, The dynamic and gravitational instabilities of spherical shocks.,
Astrophys. J. 274, 1 Nov., 152-67.
Wang F.L., Zhao G., Yuan J.M., 2004, “Electronic structure and radiative opacity of the
metallic elements in hot and dense stellar material,” Astrophys. J. 600, 963-971.
Weber, S.V., B.A. Remington, S.W. Haan, B.G. Wilson, J.K. Nash. (1994). Phys.
Plasmas, 1, 3652.
"Modeling of Indirect-Drive Rayleigh-Taylor Experiments," S.V. Weber, B.A. Remington, S.W. Haan, B.
Wilson, and J. Nash, Phys. of Plasmas 1, 3652 (1994).
Wheeler, J.C., I. Yi, P. Hoflich, L. Wang, 2000, “Asymmetric supernovae, pulsars,
magnetars, and gamma-ray bursts.,”Astrophys. J. 537, 810.
Whitham, G.B., 1974, Linear and Nonlinear Waves, 636 pp., Wiley, New York.
Williams, F.A., 1985,. Combustion theory. Addison-Wesley.

105
Williams, R.J.R., D. Ward-Thompson, A.P. Whitworth, 2001. “Hydrodynamics of
photoionized columns in the eagle Mebula, M16.” MNRAS 327 788.
Williams, R.J.R., 2002. “On the stability of D-type ionization fronts” MNRAS, 331, 693.
Woolsey, N.C., Y.A. Ali, R.G. Evans, R.A.D. Grundy, S.J. Pestehe, P.G. Carolan, N.J.
Conway, R.O. Dendy, P. Helander, K.G. McClements, J.G. Kirk, P.A. Norreys, M.M.
Notley, and S.J. Rose, 2001, Collisionless shock and supernova remnant simulations
on VULCAN, Phys. Plasmas, 8, 5, 2439-2445.
Woosley, S., 1990, “Type I Supernovae: Carbon Deflagration and Detonation,” In:
Supernovae, A.G. Petschek, Ed., Springer Verlag, NY-Berlin-Heidelberg.
Woosley, S.E., R.G. Eastman, 1997, “Types 1B and 1C supernovae: models and spectra,”
In: Thermonuclear Supernovae, NATO Advanced Study Institute, B. Ruiz-Lapuente,
R. Canal, and J. Iser, Eds, Kluwer, Dordrecht.
Xu, Jianjun, Philip E. Hardee, and James M. Stone, 2000, “The stability of radiatively
cooled jets in three dimiensions,” Astrophys. J. 543, 161-177.

106
FIGURE CAPTIONS:
Figure II.1a. The Omega laser facility. Note a “switchyard” at front: it is used to
distribute 60 laser beams as evenly as possible around the vacuum chamber
where the target is situated. Such an arrangement is dictated by the principal
objective of the Omega facility, which is the studies of a “direct drive” fusion
(see the text).
Figure II.1b. Schematic of the Z facility at Sandia National Laboratories (Albuquerque).
The outermost part is formed by Marx generators. They are connected to 36
water-insulated transmission lines which, in turn, feed magnetically insulated
vacuum transmission lines converging at the diode. The diode is situated
inside the central tank. This facility is now being refurbished, to increase the
current from 20 to 30 MA (Matzen, 2005).
Figure II.2a. Experiment using a z-pinch driven hohlraum on the Saturn facility. The z-
pinch implodes on axis of a primary hohlraum which is used as a source of a
thermal x-ray radiation for probing an iron plasma and measuring its opacity
(Springer et al, 1997) under conditions interesting for the physics of
Cepheids.
Figure II.2c. Typical experiment using direct laser irradiation. In this case, the experiment
(H. Robey et al, 2002) is aimed at the study of interaction of a strong shock
with a density clump, a typical astrophysical problem (R.I. Klein, 2003).
Several of the Omega beams are used to generate a source of x-rays (a
backlighter, see the text) situated at the opposite side of the experimental

107
assembly. Using a gated x-ray pinhole camera (“x-ray framing camera”),
radiographic images are obtained as a function of time, as shown in (d).
Fig. III.1a: Hertzsprung-Russell diagram of magnitude versus spectral type for stars
along the main sequence, and variable stars, including those along the
Cepheid instability strip. Also shown along the horizontal axis are
temperatures (K) in parentheses, corresponding to the spectral type.
Reproduced from [Bohm-Vitense, 1989], Fig. 16.3.
Fig. III.1b: Plots of the stellar pulsation period – magnitude (or luminosity) linear
relation, showing that the longer the period of oscillation, the brighter the star
(lower magnitude). The three curves result from different analyses of this
correlation. These curves form the basis for the use of Cepheid variables as
galactic yardsticks, to infer distances. Reproduced from [Bohm-Vitense,
1989], Fig. 16.7.
Fig. III.1c: The phase relations for the variable star δ Cephei, showing the correlations
between periodic pulsations of visual magnitude (∆m), i.e., brightness,
effective temperature (T), spectral type (Sp), radial velocity (vel.), and radius
(R). Reproduced from [Bohm-Vitense, 1989], Fig. 16.4.
Fig. III.2a: Opacicty versus temperature for a 15-element mixture of solar composition,
along a path of constant ρ/T3. OPAL calculations are shown for a Z = 0 zero
metallicity star (no elements heavier than He), and for a Z = 0.02 solar
metallicity star (2% mass fraction in elements heavier than He). The results

108
from a previously used set of Los Alamos opaicities for Z = 0.02 are also
shown. Reproduced from [Rogers, 1994], Fig. 2.
Fig. III.2b: Diagram of the ratio of the periods of the first two harmonics of a beat
Cepheid variable star. The circles represent the observations. The upper
(dashed) curves correspond to the simulated result using older opacities,
which ignore the full fine structure of the metals. The lower (solid) cuves
correspond to simulations with OPAL-DTA, including the full fine structure,
in particular, for Fe. Reproduced from [Rogers, 1994], Fig. 4.
Fig. III.2c: Plot showing the measured versus calculated transmission through a thin Fe
sample heated to conditions of ~20 eV and ~10 mg/cm3. Two OPAL opacity
simulations are shown, one using DCA with hydrogenic oscillator strengths,
which ignores term splitting (top curve), and the other using full DTA with
intermediate coupling, which causes term splitting. The latter, more
complete opacity calculation more closely reproduces the experimental
results. The experiments were carried out on the Nova laser. Reproduced
from [Rogers, 1994], Fig. 3.
Fig. III.2d: Comparison of theoretical transmission spectra at the measured conditions of
20 eV, and 10-4 g/cm3. The calculations correspond to the STA opacity
model (upper curve), OPAL DTA model (intermediate curve, showing the
line fine structure), and OPAL UTA (lower curve). The intermediate curve
rather closely reproduces the experimental results (not shown). Including the
transition fine structure changes the predicted average opacities significantly.
Reproduced from [Springer, 1997], Fig. 9.

109
Figure IV.1 Variation of the density distribution after the explosion of SN 1987A (after
T. Shigeyama and T. Nomoto, 1990). Time t=0 corresponds to the instant just
before the explosion. Mr is a Lagrangian mass within a certain radius. Steep
density gradients in the progenitor star, situated at Mr/Msun≈2.5 and
Mr/Msun≈4 correspond to the Oxygen-Helium and Helium-Hydrogen
transition zones, respectively. After the transit of the shock wave through
these zones, the pressure gradient changes sign and the Rayleigh-taylor
instability develops, leading to a 3D mix process which is thought to be
important in the explanation of the light curve. The ertical line separates the
outer zone where conditions for the RT instability are not fulfilled.
Figure IV.2. Light curve for SN1987A (reproduced with permission from Arnett, 1996).
The ‘+’ symbols are the observed light curve, and the thin solid line is an
analytic model described in Arnett, 1996. The different dates indicated
show when x-rays were first detected on day 139 by the Ginga/Mir
experiment, when γ-rays from 56Co were detected by the Solar Maximum
Mission (SMM) at day 178, and when subsequent detections of γ -rays
occurred by several balloon experiments (CIT, LM, FG). The inset shows a
calculation of the evolution of temperature versus time as the shock breaks
out the surface of the star.
Figure IV.3 Density distribution (logρ [gcm-1]) 300 s after core bounce in the inner
~3×1011 cm of the star. The supernova shock (outermost discontinuity) is
located inside the hydrogen envelope at r=2.7×1011 cm. A dense shell
(visible as a ring) has formed behind the shock. Its outer boundary coincides

110
with the He/H interface, while the inner boundary is in the process of
steepening into a reverse shock (from Kifonides et al, 2000).
Figure IV.4 Jet-induced explosion (from Khokhlov et al., 1999). The frames show the
density in the x-z plane passing through the center of computational domain,
at 1.08 ns after the jet initiation. The jet axis (presumably the rotation axis)
is horizontal here. The size of the panel is 6⋅109 cm vertically and 9⋅109 cm
horizontally. Courtesy A. Khokhlov.
Figure IV.5 Hydrodynamic simulations for the supernova and the laboratory experiment:
spatial profiles of the pressure and the density for the SN at 2000 s (a) and
the laboratory experiment at 20 ns (b) (from Ryutov et al, 2000). (c) The
velocity of the He-H interface in supernova and in the laser experiment
(Kane et al, 1999); the curves are essentially identical, up to the scale
transformation. This is a pre-requisite for making a scaled laboratory
experiment on the evolution of 2D or 3D perturbations. Panel (d) shows a
radiograph obtained in the experiment by Remington et al (1997).
Figure IV.6. Code results vs experiment on coupled interface effects: (a) The laser beams
strike a 10-µm thick ablator layer on the front surface the Cu, which is of 85
µm average thickness. The Cu interface is modulated at a wavelength of
200 µm and an amplitude of 15 µm. The plastic layer, 150 µm-thick,
incorporates a 75-µm thick CH tracer with a 4.3 at. % doping of Br; both
have a density of 1.4 g/cm3. In the experiments, the resulting structures are
radiographed from behind by x-ray backlighting as discussed in Ch. II; (b)
the experimental radiograph and the results of FLASH simulations

111
Figure IV.7 Comparison of numerical simulations and experiment on a multi-mode RT
instability (Miles, 2004 a)
Figure IV. 8 Possible transition to the turbulence at the deeply non-linear stage of the RT
instability (see detailed explanations in the text).
Figure IV. 9 Experimental measurements of radiation line transport through an
expanding Al plasma with a large velocity gradient (reproduced from Wark et
al., 1997). The 1s 2S-2p 2P spectral line of hydrogenic Al is shown for
various observation angles with respect to the laser beam.
Figure V.1. Close-up view of shock waves in the Cygnus Loop. This image was taken
with the Wide Field and Planetary Camera 2 on the Hubble Space Telescope.
The image is a composite. Blue shows emission from doubly ionized oxygen
atoms produced by the heat behind the shock front. Red shows emission from
singly ionized sulfur atoms, which arises well behind the shock front, in gas
that has had a chance to cool since the passage of the shock. Green shows
light emitted by hydrogen atoms. Much of the hydrogen emission comes
from an extremely thin zone (only several times the distance between the Sun
and Earth) immediately behind the shock front itself. These thin regions
appear as sharp, green, filaments in the image. Credit: Jeff Hester (Arizona
State University) and the Space Telescope Science Institute, operated by the
Association of Universities for Research in Astronomy, Inc., from NASA
contract NAS5-26555. The image is reproduced with permission from
AURA/STScI.

112
Figure V.2. Interaction of a supernova remnant (the spherical object to the lower left) and
a molecular cloud (the elongated object above). The figure shows a grayscale
image of the x-ray emission, overlaid with a contour image of the radio
emission. Credit: D. Burrows of Penn State and T. Landecker of the
Dominion Radio Astronomy Observatory.
Figure V.3. An image of SNR E0102.2-7219 from Chandra. The colors encode the x-ray
photon energy (red is softer, blue is harder, white is the mean spectrum).
Credit: NASA/CXC/Rutgers/J.Hughes
Figure V.4. Cassiopea-A remnant (J.P. Hughes et al, 2000).
Figure V.5. Formation of the radiative precursor in a strong shock experiment (Bouquet
et al, 2004). See detailed explanations in the text.
Figure V.6. Data from the radiative precursor experiment (Keiter et al, 2002).
Temperature profile inferred from the absorption spectroscopy, along with
results of a simple radiation hydrodynamic model.
Figure V.7. Formation of a collapsed layer in dense Xe gas (Reighard et al, 2004). (a)
Density profiles calculated with the HYADES code for the case with
radiation (solid line) and no radiation (dashed line). (b) simulations of the 2D
geometry, with the finite radius of the shock tube taken into account; (c)
radiographic image showing a remarkable agreement with 2D simulations.
Figure V.8 Effects of the equation of state and radiation on the shock (Michaut et al,
2003, 2004). (a) Thermal wave precursor for the shock wave at Xe (initial
density 1.5×10⁻⁴ g/cm3, initial temperature 2 eV). (b,c) Jump conditions for

113
the hydrogen gas. Initial density 5×10⁻⁴ g/cm3, initial temperature 0.1 eV (b)
and 10 eV (c).
Figure V.9 Blast waves in nitrogen and xenon (Edens et al, 2004). Shock trajectories for
nitrogen (a) and Xenon (b). Structure of the blast wave for the 500 J energy
input for nitrogen (c) and xenon (d).
Figure V.10. The emergence of the second shock driven by the ionized precursor (a, b)
and the corresponding spherically-symmetrical modeling (c) – after Hansen
et al, 2004.
Figure VI.1. (a) Optical image of the protostellar jet, Herbig-Haro (HH) 47. The bipolar
HH 47 complex embedded in the dense Bok Globule: (Red) [SII] emission;
(green) Ha; (blue) [OIII]. Optical image of the jet, HH 111. Reproduced
from [Reipurth, 2001].
Figure VI.2 (a) Simulations of high Mach number jets relevant to HH jets, showing the
effect of Mach number in the jet morphology. Reproduced from [Norman,
1982] (b) Simulations of high Mach number jets relevant to HH jets, showing
the sensitivity to the amount of radiative cooling, reproduced from [Blondin,
1990]. (c) Simulations showing the effect of radiative cooling on a high
Mach number, magnetized jet. Reproduced from [Frank, 1998].
Figure VI.3. (a) Simulations, and experimental images of a high Mach number, purely
hydrodynamic (non-radiatively cooled) Al jet experiment done on the Omega
laser, located at the University of Rochester. Reproduced from [Foster,
2002]. (b) High Mach-number jet image taken on an experiment at the Z
magnetic pinch facility at SNLA. [Bennet, 2004] Reproduced from [Sinars,

114
2004]. (c) Image of a high Mach-number jet driven by direct laser
illumination of the target package, on the Omega laser, and backlight late in
time, at 200 ns. [Courtesy of J. Foster et al., private commun., 2004]. (d)
Simulation of the high Mach number turbulent jet, carried out prior to doing
the experiments, suggesting that the jet might indeed transition into turbulent
hydrodynamics. Reproduced from [Taylor, 2004].
Figure VI.4. (a) Images of jets of Al, Fe, and W plasma, created by conical arrays of
wires of the same material at the Imperial College Magpie magnetic pinch
facility. Reproduced from [Lebedev, 2002] (b) Experimental image of a high
Mach number, radiatively cooled W jet impacting a CH foil downstream,
causing the working surface to reheat, and emit shoft x-rays. Reproduced
from [Lebedev, 2002] Similar jet deflecting transversely, due to the lateral
flow of plasma (laboratory “stellar wind”) impacting the jet, creating a ram
pressure. Done on the Magpie z-pinch facility at Imperial College. [Lebedev,
2004]. (c) Images of a magnetic tower jet created by a radial wire array.
[Lebedev, 2004]. (d) Simulations of a magnetic tower jet created by a radial
wire array. [Ciardi, 2005].
Figure VII.1 The Hubble Space Telescope image of the Eagle Nebula. The radiation is
absorbed in a very thin layer near the surface of the cloud.
FigureVII.2. The projection of the Eagle Nebula and neighboring stars on the plane of the
sky (from Pound, 1998). The size of the symbols indicates the relative
strength of the Lyman continuum flux. Courtesy M. Pound.

115
Figure VII.3. Results of an experiment and simulation on the ablation front instability,
from Remington et al. (1993). Perturbations are viewed side-on at 4.4 ns.
The ablation front corresponds to the lower side of the material. The
experimental radiograph is on the left. The corresponding contour plot from
a 2D simulation is on the right. The initial wavelength was 100 µm and the
initial peak-to-valley variation was 4.6 µm.
Figure VII.4. Numerical simulations accounting for the absorption of the ionizing
radiation in the ablation outflow (Mizuta et al, 2005). (a) The left panel
shows the initial perturbation on the cloud surface. (b) The central panel
shows that, when the absorption is artificially turned off, the amplitude of
perturbations grows approximately according to the Rayleigh-Taylor model;
however, if the absorption is “turned on”, the exponential growth is replaced
by a some kind of oscillations. (c) The right panel shows that nonlinear
perturbations can grow even in the presence of absorption.
Fig. VIII.1. (a) Schematic of the interior of Jupiter, reproduced from [Guillot, 1999]. (b)
Phase diagram of high pressure hydrogen, reproduced from [Saumon, 2000].
Fig. VIII.2. (a) Schematic of the interior of Neptune, reproduced from [Hubbard, 1997].
(b) Phase diagram of high pressure water, reproduced from [Cavazzoni,
1999].
Fig. VIII.3. (a) Summary plot of recent high pressure shock Hugoniot measurements of
D2, reproduced from [Knudson, 2003]. (b) Plot showing the sensitivity of
calculations of the interior of Jupiter to the models of the high pressure EOS
of hydrogen, reproduced from [Saumon, 2004]. The different curves

116
correspond to the following models. LM-A: Modified Ross linear mixing
model. LM-H4: Linear mixing, with D4 chains, D2 molecules, and a D+ + e-
fluid metal. LM-SOCP: Ross linear mixing model, only with the One
Component Plasma (OCP) replaced with a screened OCP for the metallic
(atomic) fluid free energy. SCVH-1: the Saumon-Chabrier, Van Horn EOS.
SESAME-p: original SESAME, patched to better reproduce data in the
molecular regime for P < 0.2 Mbar.
Fig. VIII.4. (a) Plot of the measured EOS of water along the principle Hugoniot, at
pressures up to ~1000 GPa. (b) Measurements of the reflectivity of shocked
water, versus shock velocity and shock pressure. (c) Analysis of the
decomposition of DC conductivity of water at high pressure, along the
isentrope appropriate for the interior of Nepture. Reproduced from [Celliers,
2004].
Fig. IX.1. (a) Images of the intergalactic jet, and the accretion disk around the active
galactic nucleus, NGC 4261, reproduced from [Piner, 2001; Ferrarese, 1996].
(b) X-ray spectrum of the photoionized plasma in the immediate vicinity of
Cyg X-3 x-ray binary, reproduced from [Liedahl, 1996]. (c) Schematic
illustrating a generic accreting x-ray binary system, driving the emission of
photoionized plasma spectra.
Fig. IX.2 (a) X-ray spectrum in a scaled experiment done on the Z pinch facility at
SNLA, reproduced from [Foord, 2004]. The figure shows absorption
spectrum of L-shell iron and K-shell sodium and fluorine lines. (b)
Calculations of the ionization distribution from the photoionized plasma

117
models Cloudy and FLYCHK, compared with that observed in the Z
photoionized plasma experiment. Reproduced from [Foord, 2004]. (c)
Calculations of the ionization distribution from the photoionized plasma
models NIMP and GALAXY, compared with that observed in the Z
photoionized plasma experiment. Reproduced from [Rose, 2004].

118
TABLE IV.1 Comparing characteristic parameters of a SN 1987a plasma in the
He-H transition layer (t~2000 s) and of a laboratory experiment at t=20 ns since the
onset of the radiation drive .
Parameter SN 1987a Laboratory experiment
L, cm 9⋅1010 5.3⋅10-3
v, cm/s 2⋅107 1.3⋅105
ρ, g/cm3 7.5⋅10-3 4.2
p, dyn/cm2 3.5⋅1013 6⋅1011
Eu+ 0.29 0.34
Re 2.6⋅1010 1.9⋅106
Pe 2.6⋅105 1.8⋅103
+Eu is the Euler number, Eu=v(ρ/p)1/2.

119
TABLE VII.1. Parameters of the Eagle Nebula and possible simulation experiment
Parameter Notation Numerical value in
the Eagle Nebula
Numerical value in
the experiment
Characteristic length-scale L 3⋅1018 cm 6⋅10-3 cm
Average density of the cloud ρ 1.5⋅10-19 g/cm3 2 g/cm3
Ablation pressure pa 5⋅10-9 dyn/cm2 1013
Density of the ablation flow ρa 3⋅10-21 g/cm3 0.02 g/cm3
Temperature in the ablation flow Ta 1 eV 10 eV
Velocity of the ablation flow va 2⋅106 cm/s 5⋅106 cm/s

120
FIGURES II.1 – IX.2
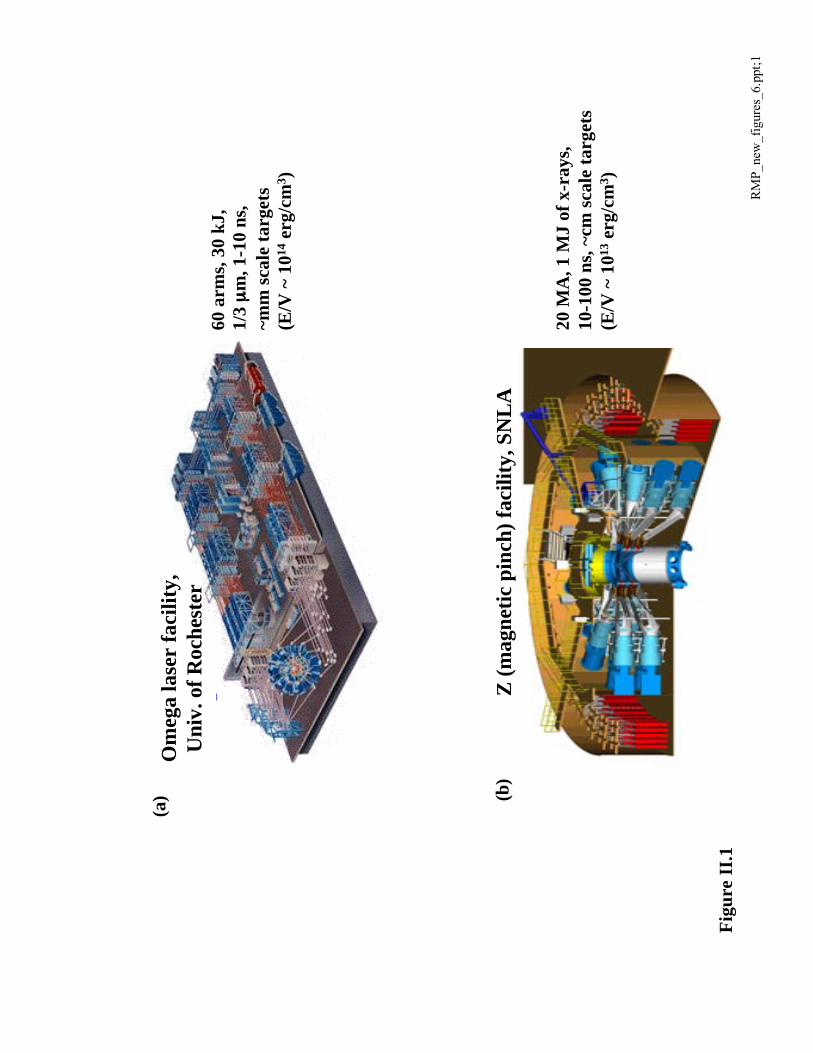
RM
P_ne
w_f
igur
es_6
.ppt
;1
Om
ega
lase
r
Om
ega
lase
r fa
cilit
y,U
niv.
of R
oche
ster
60 a
rms,
30
kJ,
1/3
µµµµm
, 1-1
0 ns
, ~m
m s
cale
tar
gets
(E/V
~ 1
014 e
rg/c
m3 )
Z (
mag
neti
c pi
nch)
fac
ility
, SN
LA
20 M
A, 1
MJ
of x
-ray
s,10
-100
ns,
~cm
sca
le t
arge
ts(E
/V ~
1013
erg
/cm
3 )
Fig
ure
II.1
(a) (b
)

RM
P_ne
w_f
igur
es_6
.ppt
;2
Ene
rgy
(eV
)
Transmission
Satu
rn e
xper
imen
tF
eρρρρ
= 1
0-4 g
/cm
3 ,T
e = 2
0 eV
δδδδ t =
10
ns
65
7
5
8
5
0.2
0.8
1.0
0.6
0.4 0
P.T.
Spr
inge
r et a
l.,
JQSR
T 58
, 927
-935
(199
7)
Las
er
Be
shie
ldB
e tu
be
Au
Gri
d Cu
sph
ere
CH
t =
39 n
st
= 13
ns
t =
26 n
s
H. R
obey
et a
l., P
hys.
Rev
. Let
t. 89
, 085
0051
(200
2);
R.I.
Kle
in e
t al.,
Ap.
J. 5
83, 2
45 (2
003)
.F
igur
e II
.2
(a)
(b)
(c)
(d)

RM
P_ne
w_f
igur
es_6
.ppt
;3
[Boh
m-V
itens
e, In
tro. t
o St
ella
r Ast
roph
ysic
s (19
89)]
Fig
ure
III.
1
(a)
∆∆∆∆R
Sp
v r
T∆∆∆∆m
Pha
se (
or a
5.4
-day
per
iod)
0
0.4
0
.8
1.2
0 0.4
0.8
K70
00
5000
03
(∆∆∆∆R x106) km
km/s
0+2
0
-20
∆∆∆∆m
(c)Magnitude, MV
Log
per
iod
(b)
0
0
.5
1
.0
1.
5
-5 -4 -3 -2 -1
[Fig
. 16.
7, V
ol. 1
, B
ohm
-Vite
nse,
Intro
. to
Stel
lar A
stro
phys
ics (
1989
)]

RM
P_ne
w_f
igur
es_6
.ppt
;4
Ene
rgy
(eV
)65
7
5
85
STA
OPAL UTA
Transmission0.8 0.4 0
OP
AL
DT
A
P.T.
Spr
inge
r et a
l.,
JQSR
T 58
, 927
-935
(199
7)
Log
T(K
)
Log κκκκR (cm2/g)
P0
(day
s)1
3
5
7
P1 / P0
0.74
0.70
0.72
OP
AL
opa
citi
es
Old
opa
citi
es
DC
A
OP
AL
Dat
a
Fig
ure
III.
2R
oger
s & Ig
lesi
as,
Sci
ence
263
, 50
(199
4)
(a)
(b)
(c) (d
)
Fe
M s
hell
Fe
L s
hell
and
C, O
, Ne
K s
hell
HH
e+
H,
He
Los
Ala
mos
, Z =
0.0
2O
PA
L, Z
= 0
.00
OP
AL
, Z =
0.0
2
Ar,
Fe
K s
hell
Te=
20eV
,ρρρρ
=5m
g/cm
3

RM
P_ne
w_f
igur
es_6
.ppt
;5
[Shi
geya
ma
& N
omot
o, A
p.J.
360,
242
(199
0)]
Mr/M
o
0
5
1
0
15
-4040
5
43
21
Tim
e (s
ec):
0:
0
1:
9
2:
167
3:
106
0 4
: 3
330
5:
746
0
Day
s si
nce
co
re c
olla
pse
0
200
40
0
6
00
800
42 3940410
8
0
1
60M
inu
tes
sin
ce c
olla
pse
6 4
Sh
ock
bre
ako
ut
calc
ula
tio
n5
[D. A
rnet
t,Sup
erno
vae
and
Nuc
leos
ynth
esis
(P
rince
ton
Uni
v. P
ress
, Prin
ceto
n, N
J, 19
96)]
Fig
ure
IV.1
(a)
(b) Fig
ure
IV.2

RM
P_ne
w_f
igur
es_6
.ppt
;6
t = 1
300
sec
1011
cm
Jet
mod
el
Kho
khlo
v et
al.,
Ap.
J. 5
24, L
107
(199
9)
6 x
109 c
m
9 x 109cm
Den
sity
Kifo
nidi
s et a
l., A
stro
n. A
stro
phys
. 408
, 621
(200
3).
(a)
(b)
Fig
ure
IV.3
Fig
ure
IV.4

RM
P_ne
w_f
igur
es_6
.ppt
;7
(a)
(b)
Fig
ure
IV.5
(d)
[Rem
ingt
on e
t al.,
Phy
s. Pl
asm
as 4
, 199
4-20
03 (1
997)
]
20 15 10 5 0
4030
2010
0
6000
5000
4000
3000
2000
1000 0
3000
2500
2000
1500
1000
500
0
Las
er e
xper
imen
t vel
ocity
Sup
erno
va v
eloc
ity
Las
er e
xper
imen
t ti
me
(nan
osec
onds
)
Supe
rnov
a ti
me
(sec
onds
)
Supernova velocity (km/s)
Laser exp. velocity (km/s)
[J. K
ane
et a
l., P
oP 6
, 206
5 (1
999)
]
Las
er e
xprm
nt in
terf
. vel
.Su
pern
ova
inte
rfac
e ve
l.
(c)
[Ryu
tov
et a
l., 1
999,
Ap.
J. 51
8, 8
21 (1
999)
]

RM
P_ne
w_f
igur
es_6
.ppt
;8
Kan
e et
al.,
Phy
s. R
ev. E
63,
055
401
(200
1)
A.C
. Cal
der e
t al.,
Ap.
J. Su
ppl.
143,
201
(200
2)
(a)
(b)
Fig
ure
IV.6

RM
P_ne
w_f
igur
es_6
.ppt
;9
[A. M
iles e
t al.,
PoP
11,
363
1 (2
004)
]
Num
eric
al r
adio
grap
hE
xper
imen
tal r
adio
grap
h
t = 1
3 ns
Sim
ulat
ed r
adio
grap
h
8-m
ode
t = 1
3 ns
t = 2
5 ns
t = 3
7 ns
shoc
kSh
ock-
tube
wal
l
100µ
m
[Rob
ey IF
SA-2
003
proc
eedi
ngs,
pp. 1
35-1
39 (2
004)
]F
igur
e IV
.8
Fig
ure
IV.7

RM
P_ne
w_f
igur
es_6
.ppt
;10
Fig
ure
IV.9
[War
k et
al.,
Phy
s. Pl
asm
as 4
, 200
(199
7)]

RM
P_ne
w_f
igur
es_6
.ppt
;11
[Lev
enso
n an
d G
raha
m, A
p. J.
559
, 948
(200
1);
Fes
en e
t al.,
AJ
104,
719
(199
2)]
J.P. H
ughe
s et a
l., A
p. J.
528
, L10
9 (2
000)
Cas
-A S
NR
fro
m c
ore-
colla
pse
SN16
80
Cyg
nus
Loo
p SN
R, d
= 0
.75
kpc,
tSN
~15
,000
yr
Bla
ir et
al.,
Ap.
J. 5
37, 6
67 (2
000)
Guo
& B
urro
ws,
Ap.
J.Let
t. 48
0, L
51 (1
997)
SNR
1E
010
2.2-
7219
in S
MC
d =
59 k
pcd
= 3.
4 kp
c
d =
1.7
kpc
ASC
A o
bser
vati
ons
of S
NR
VR
O 4
2.05
.01
Fig
. V.1
Fig
. V.2
Fig
. V.3
Fig
. V.4

RM
P_ne
w_f
igur
es_6
.ppt
;12
Tim
e (n
s)1
2
3
4
5
ne(cm-3)
1022
1020
1018
S. B
ouqu
et e
t al.,
PR
L 92
, 225
001
(200
4)
Sim
ulat
ion
Fig
. V.5
(a)
(b)
(c)
Shoc
k
Temperature (eV)
103
102
101
10-1
10-2
10-3
Density (g/cm3)
5
10
20
x - x
p(µµµµ
m)
Exp
erim
enta
lda
ta
Shoc
k
Ioni
zati
on
prec
urso
r
500
µµµµm
4 ns

RM
P_ne
w_f
igur
es_6
.ppt
;13
Om
ega
lase
r ex
peri
men
t
[Kei
ter e
t al.,
PR
L 89
,165
003
(200
2)]
Pos
itio
n (µµµµ
m)
Temperature (eV)
10 m
g/cc
Si
O2
foam
Fig
. V.6

RM
P_ne
w_f
igur
es_6
.ppt
;14
[Rei
ghar
d et
al.,
PR
L, s
ubni
tted
(200
4)]
(b) (c
)F
ig. V
.7
(a)
[Kei
ter e
t al.,
PR
L 89
,165
003
(200
2)]

RM
P_ne
w_f
igur
es_6
.ppt
;15
[C. M
icha
ut e
t al.,
IFSA
-200
3 pr
ocee
ding
s (20
04)]
[C. M
icha
ut e
t al.,
Eur
. Phy
s. J.
D 2
8, 3
81 (M
ar.,
2004
)]
ρρρρ2222////ρρρρ1111
Prad/Pth
ρρρρ2222////ρρρρ1111,,,, ΖΖΖΖ2222,,,, ΤΤΤΤ2222
u 1 (
km/s
)u 1
(km
/s)
Prad/Pth
Fig
. V.8
(a)
(b)
(c)
[C. M
icha
ut e
t al.,
IFSA
-20
03 p
roce
edin
gs (2
004)
]
0
1
00
20
0
ρρρρ2222////ρρρρ1111X
e pl
asm
a
z (c
m)
100
150
1000
v shk
Hyd
roge
n
Hyd
roge
n

RM
P_ne
w_f
igur
es_6
.ppt
;16
500
J, 600
ns
N2
blas
t w
ave
imag
e
Xe
blas
t w
ave
imag
eT
ime
(ns)
R(mm)
Tim
e (n
s)
R(mm)
R ~
t2/5
R ~
t1/4
R ~
t2/5
[A. E
dens
et a
l., in
pre
ss, P
oP 1
1 (N
ov. 2
004)
]
Xe
shoc
k tr
ajec
tory
Nit
roge
n sh
ock
traj
ecto
ry
0.5
cm
0.5
cm
(a)
(b)
(c)
(d)
Fig
. V.9
Las
er
Las
er

RM
P_ne
w_f
igur
es_6
.ppt
;17
[J.F
. Han
sen
et a
l., su
bmitt
ed, P
RL
(200
4)]
r(m
m)
Xe,
t =
150
ns
Shoc
k
Rad
iati
ve p
recu
rsor
Te(eV)
Shoc
k ve
l
0.1
1.0
5.0
1.0
4.0
Compression
0
10
20
Xe
shk:
vs(
init
ial)
~60
km
/s,
ρρρρ //// ρρρρ
0000(in
itia
l) >
20,
T
e ~ 5
eV
, ρρρρ 0
000(X
e) ~
10-5
g/c
m3 ,
Ela
ser =
10
J
Fig
. V.1
0
(a)
(b)
(c)

RM
P_ne
w_f
igur
es_6
.ppt
;18
HH
47
~1/2
lgt
yr
d HH
47 =
450
pc
[Rei
purth
and
Bal
ly,
AR
AA
. 39,
403
(200
1)]
Fig
ure
VI.
1(a)
(b)
HH
111
~0.1
lgt
yr

RM
P_ne
w_f
igur
es_6
.ppt
;19
[Mik
e N
orm
an, A
A11
3, 2
85 (1
982)
]
ρρρρ jet
/ρρρρam
bien
t = 0
.1
M =
6
M =
3
M =
1.5
M =
20,
ηηηη =
1 j
et s
imul
atio
ns
Adi
abat
ic (
pure
hyd
ro)
[Blo
ndin
et a
l., A
p. J.
360
, 370
(199
0)]
χχχχ =
0.2
MH
D
R axis (x 1.e17 cm)
Rad
iati
ve M
HD
Z a
xis
(x 1
.e17
cm
)[A
. Fra
nk e
t al.,
A
p. J.
494
, L79
(199
8)]
Fig
ure
VI.
2
(a)
(b)
(c)

RM
P_ne
w_f
igur
es_6
.ppt
;20
[J. F
oste
r et a
l., P
hys.
Plas
mas
9, 2
251
(200
2)]
Z (
µµµµm
)20
0
40
0
200
4
00
R (µµµµm) -2000
2000
200
8 ns
12 n
s
RA
GE
+ ho
hl.
Exp
erim
ent
[D.B
. Sin
ars
et a
l,. R
SI 7
5, 3
672
(200
4);
G.R
. Ben
net,
APS
-DPP
abs
tract
, EP1
.015
(Nov
. 200
4)]
Dis
tanc
e (m
m)
Distance (mm)
0
1
2
1.5 1
0.5 0
t = 1
50 n
s
t =
240
ns >
tcr
it?
1
2
3
4
Z (m
m)
R (mm) -0.5
-1.5
0.5
SHA
MR
OC
K A
MR
sim
ulat
ion[M
ark
Tayl
or e
t al.,
IFSA
-200
3, p
. 485
]
[Fos
ter,
Ros
en, W
ilde,
Fr
ank,
Blu
e et
al.
(200
4)]
200
ns
2000
µµµµm
Fig
ure
VI.
3
(a)
(b)
(c)
(d)

RM
P_ne
w_f
igur
es_6
.ppt
;21
[Leb
edev
et a
l., A
p.J.
564,
113
(200
2)]
Al (
hydr
o)
Fe
W (
radi
ativ
e)
1.5 cm
346
ns
326
ns
3
43 n
s
x-ra
y em
issi
on( ~
300e
V)
4 m
m
256
ns
10 m
m
[Leb
edev
, con
fere
nce
on "
Cor
es, D
iscs
, Jet
s and
O
utflo
ws,”
Ban
ff, A
lber
ta,C
anad
a (J
uly
12-1
6, 2
004)
;ht
tp://
ww
w.is
m.u
calg
ary.
ca/m
eetin
gs/b
anff
/inde
x.ht
ml]
[A. C
iard
i, S.
V. L
ebed
ev e
t al.,
HED
LA p
roce
edin
gs, i
n pr
ess,
Ast
roph
ys S
pace
Sci
. 298
:1-2
( Ju
ly, 2
005)
]
r-ax
is (
mm
)
z-axis (mm)
t =
206
ns
2-D
MH
D s
imul
atio
ns
1 cm
380
ns
t = 305 nsF
igur
e V
I.4
(a)
(b)
(c)
(d)

RM
P_ne
w_f
igur
es_6
.ppt
;22
1 pcE
agle
neb
ula,
d ~
2 k
pc
[J. H
este
r et a
l., A
J 111
, 234
9 (1
996)
][M
. Pou
nd, A
p.J.
493,
L11
3 (1
998)
]
[A. M
izut
a et
al.,
Ap.
J., i
n pr
ess (
2004
)]
460
ky
X
Y
Lin
ear
regi
me
RT
sta
biliz
edN
onlin
ear
RT
can
gro
w(a
)(b
)(c
)
Fig
ure
VII
.1F
igur
e V
II.2
Fig
ure
VII
.3
Fig
ure
VII
.4

RM
P_ne
w_f
igur
es_6
.ppt
;23
0.5-
5 M
bar
40 M
bar
Mol
ecul
ar H
2??
??? R
ock
- ic
e co
re?
PP
T?
70 M
bar
Met
allic
HIn
hom
ogen
eous
?
[Tris
tan
Gui
llot,
Scie
nce
286,
72
(199
9)]
Log
T (
K)
Log P (Mbar)
PP
T
2-sh
k
1-sh
k ex
p.
Jup
BrnDwf
0.1MSun
D. S
aum
on e
t al.,
Hig
h Pr
ess.
Res
earc
h 16
, 331
(200
0)
Fig
ure
VII
I.1
(a)
(b)

RM
P_ne
w_f
igur
es_6
.ppt
;24
70 K
0.1
MP
a
~200
0 K
~10
GP
a
~500
0 K
~300
GP
a
~80
00 K
~800
GP
a
[W.B
. Hub
bard
, Sci
ence
275
, 127
9 (1
997)
]
Mol
ecul
ar h
ydro
gen
“Ice
” (P
< 3
00 G
Pa)
“Ice
” (P
> 3
00 G
Pa)
Roc
ks
Nep
tune
[Cav
azzo
ni e
t al.,
Sci
ence
283
, 44
(199
9)]
Wat
er
P (G
Pa)
100
200
3
00
T (103 K)
1357
Fig
ure
VII
I.2
(a)
(b)

RM
P_ne
w_f
igur
es_6
.ppt
;25
Pressure (Mbar)
Com
pres
sion
(ρρρρ /ρρρρ 0
)
[Col
lins e
t al.,
Sci
ence
281
, 117
8 (1
998)
;H
olm
es e
t al.,
PRB
52,
158
35 (1
995)
;N
ellis
et a
l., S
cien
ce 2
69, 1
249
(199
5);
Mos
tovy
ch, e
t al.,
PR
L 85
, 381
0 (2
000)
.]
Z
Nov
aG
as
gun
HE
Sesa
me
Tig
ht b
indi
ng M
DP
ath-
inte
gral
MC
GG
A-M
DL
inea
r m
ixin
g
[Knu
dson
, PR
L 90
, 035
505
(200
3)]
0
0.5
1.0
1.5
2
4
6
[D. S
aum
on a
nd T
. Gui
llot,
Ap.
J. 60
9,11
70 (2
004)
]
MZ/M
Ear
th
MCore/MEarth
Jupi
ter
0
20
40
Fig
ure
VII
I.3
(a)
(b)

RM
P_ne
w_f
igur
es_6
.ppt
;26
Den
sity
(g/
cm3 )
Pressure (Mbar)
Reflectance
Shoc
k ve
loci
ty (
km/s
)
Pre
ssur
e (G
Pa)
Tem
pera
ture
(K
)
DC conductivity (ohm-cm)-1
σσσσD
C
σσσσe (th
is w
ork)
Infer
red σσσσ
e for N
eptune
along its ise
ntrope
[Cel
liers
et a
l., P
oP 1
1, L
41 (
2004
)]
110 0.1
[Koe
nig
et a
l., N
ucle
ar F
usio
n, in
pre
ss (2
004)
;V
.V. Y
akus
hev
et a
l., JE
TP 9
0, 6
17 (2
000)
;R
. Cha
u et
al.,
J. C
hem
. Phy
s. 11
4, 1
361
(200
1)]
Fig
ure
VII
I.4
(a)
(b)
(c)

RM
P_ne
w_f
igur
es_6
.ppt
;27
[Pin
er e
t al.,
A.J.
122
, 295
4 (2
001)
; F
erra
rese
et a
l., A
p. J.
470
, 444
(199
6)]
[D.A
. Lie
dahl
& F
. Pae
rels
, Ap.
J. 4
68, L
33 (1
996)
]
Pho
ton
ener
gy (
keV
)
Counts /(sec.keV)
1
2
3
5
7
10
102030 0
Mas
sfl
owm
−,
˙
[R. H
eete
r et a
l., R
SI 7
1,40
92 (2
000)
;M
.E. F
oord
et a
l., P
RL
93, 0
5500
2 (2
004)
]
Gra
vita
tion
al
wel
l V(r
)
Vis
cous
he
atin
g
Neu
tron
sta
ror
bla
ck h
ole
The
rmal
x-r
ay r
adia
tion
src
Pho
toio
nize
d
pla
sma
~103 km
Cyg
X-3
X-r
ay b
inar
y
Radio jets, vjet ~ c/2
d =
10 k
pcP
orb~
5 hr
ξξξξ ~
103
88,0
00 L
Y
Radio jets, vjet ~ c/2
Mbl
ack
hol
e ~ 4
.9 x
108 M
sun
d =
30 M
pc
400 LY
AG
N:
NG
C 4
261
Fig
ure
IX.1
(a)
(c)
(b)

RM
P_ne
w_f
igur
es_6
.ppt
;28
[S. R
ose
et a
l., J.
Phy
s. B
: A
t. M
ol. O
pt. P
hys.
37, L
337
(200
4)]
Iron
cha
rge
stat
e
Tr =
165
eV
Te =
150
eV
Ti =
150
eV
Charge state fractionN
IMP
, w
/o r
ad.
Exp
’l d
ata
NIM
P, w
/ rad
.G
AL
AX
Y, w
/ rad
.
Iron
cha
rge
stat
e
Charge state fraction
[M. F
oord
, PR
L 93
, 055
002
(200
4)]
Wav
elen
gth
(Ang
stro
ms)
Transmission
[M.E
. Foo
rd e
t al.,
Phy
s. R
ev. L
ett.
93,,
0550
02 (2
004)
]
Fig
ure
IX.2
(a)
(b)
(c)