experimental baseball physics
DESCRIPTION
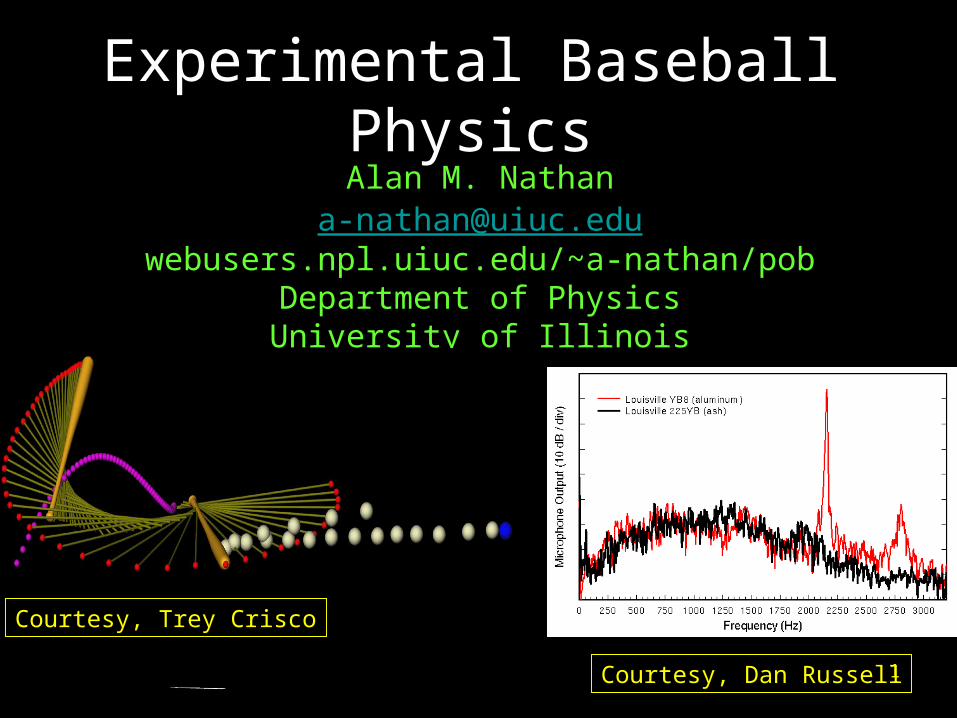
Experimental Baseball Physics. Alan M. Nathan [email protected] webusers.npl.uiuc.edu/~a-nathan/pob Department of Physics University of Illinois. Courtesy, Trey Crisco. Courtesy, Dan Russell. 1927 Yankees: Greatest baseball team ever assembled. 1927 Solvay Conference : - PowerPoint PPT PresentationTRANSCRIPT
1
Experimental Baseball PhysicsAlan M. Nathan
[email protected]/~a-nathan/pob
Department of PhysicsUniversity of Illinois
Courtesy, Trey Crisco
Courtesy, Dan Russell

2
1927
Solvay Conference:
Greatest physics team
ever assembled
The Baseball/Physics Connection
1927 Yankees:
Greatest baseball team
ever assembled
MVP’s

3
Some Topics I Will Cover
• The ball-bat collision
• The flight of the baseball
4
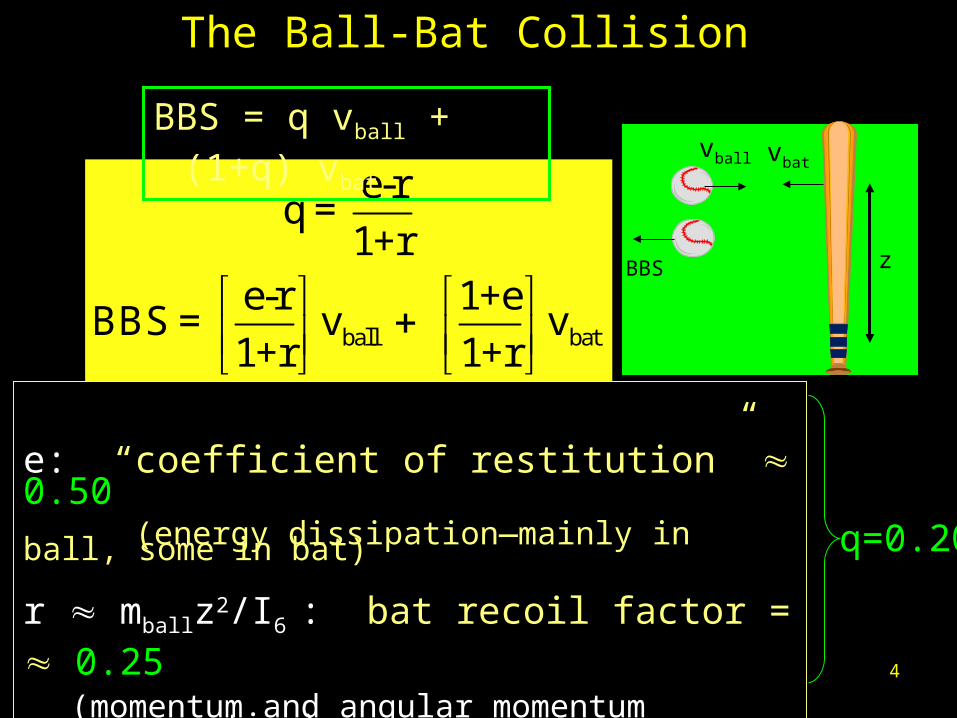
The Ball-Bat Collision
ball bat
e-rq =
1+re-r 1+e
BBS = v v1+r 1+r
e: “coefficient of restitution” 0.50 (energy dissipation—mainly in ball, some in bat)
r mballz2/I6 : bat recoil factor = 0.25(momentum and angular momentum conservation)
---heavier is better but…
q=0.20
BBS = q vball + (1+q) vbatvball vbat
BBS
z
5
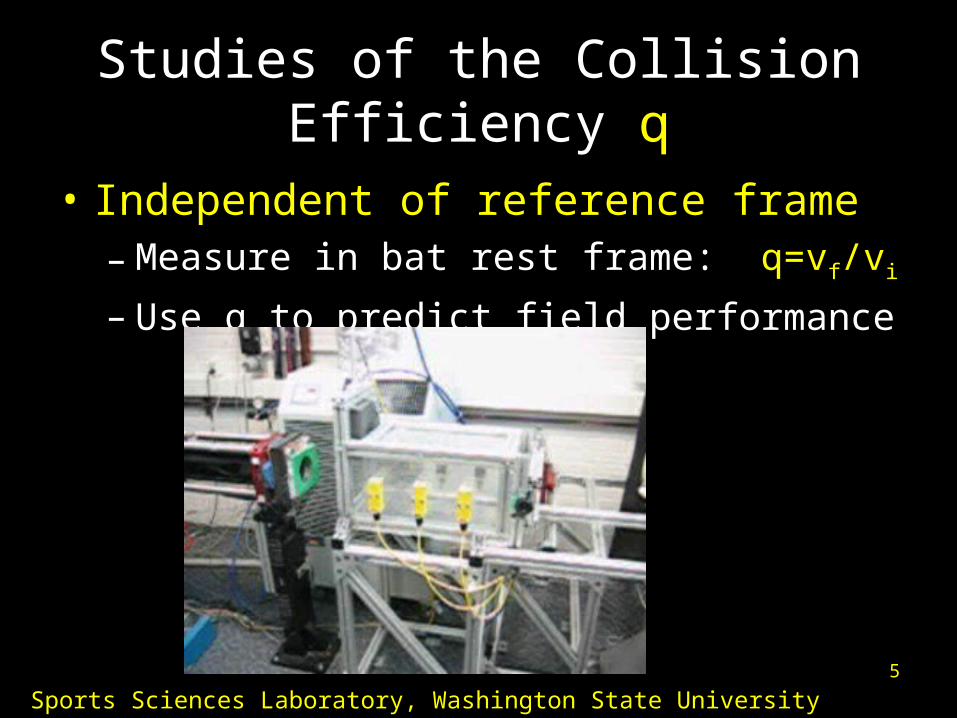
Studies of the Collision Efficiency q
• Independent of reference frame– Measure in bat rest frame: q=vf/vi
– Use q to predict field performance
Sports Sciences Laboratory, Washington State University
6
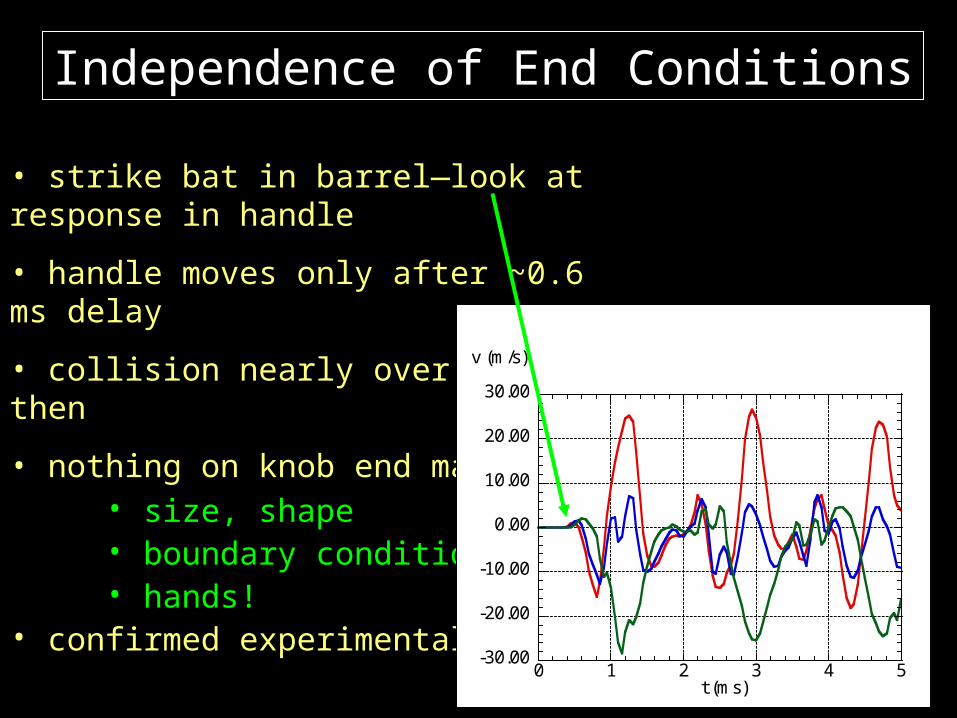
• strike bat in barrel—look at response in handle
• handle moves only after ~0.6 ms delay
• collision nearly over by then
• nothing on knob end matters• size, shape• boundary conditions• hands!
• confirmed experimentally
-30.00
-20.00
-10.00
0.00
10.00
20.00
30.00
0 1 2 3 4 5
v (m/s)
t (ms)
Independence of End Conditions
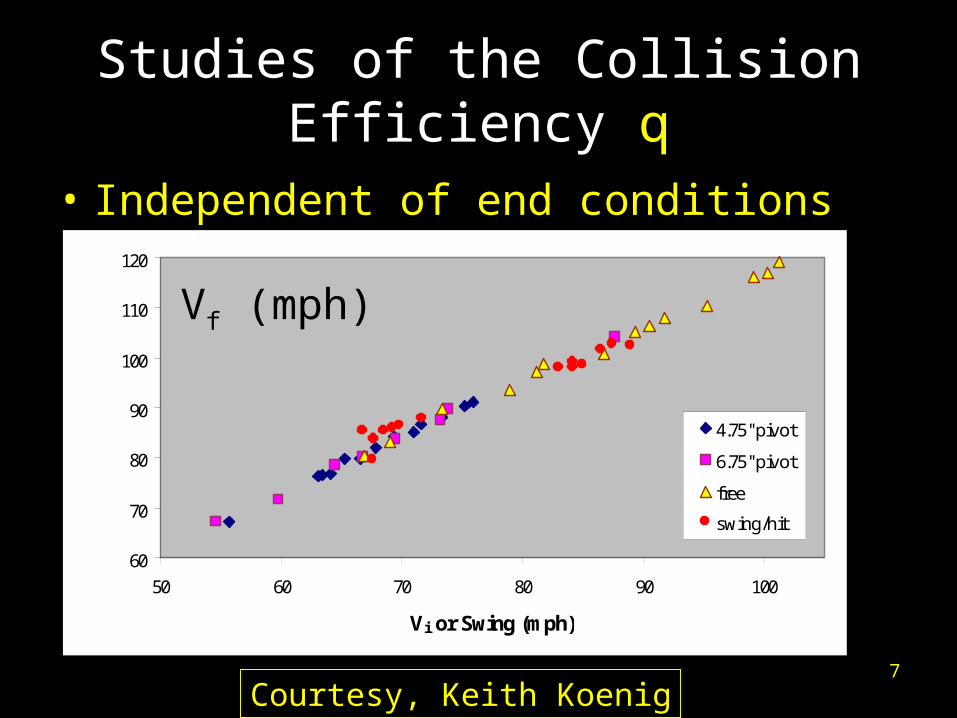
7
Studies of the Collision Efficiency q
• Independent of end conditions
60
70
80
90
100
110
120
50 60 70 80 90 100
Vi or Swing (mph)
4.75'' pivot
6.75'' pivot
free
swing/hit
Vf (mph)
Courtesy, Keith Koenig
8
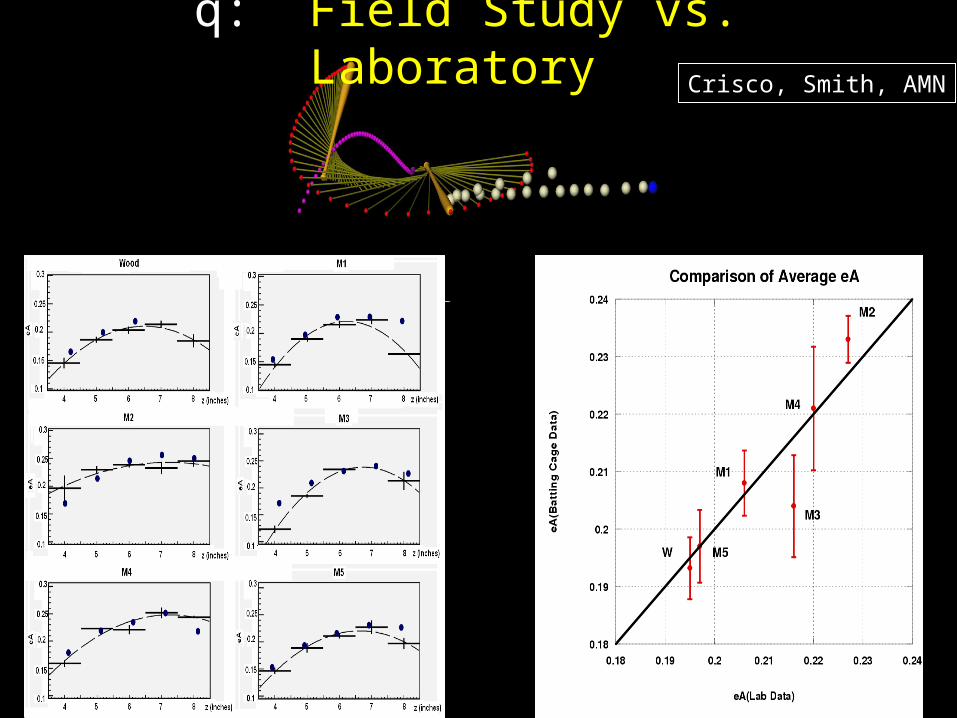
q: Field Study vs. Laboratory
Crisco, Smith, AMN

9
Modal Analysis of a Baseball Batwww.kettering.edu/~drussell/bats.html
0
0.05
0.1
0.15
0 500 1000 1500 2000 2500
FFT(R)
frequency (Hz)
179
582
1181
1830
2400
frequency
-1.5
-1
-0.5
0
0.5
1
0 5 10 15 20
R
t (ms)
time
0 5 10 15 20 25 30 35
f1 = 179 Hz
f2 = 582 Hz
f3 = 1181 Hz
f4 = 1830 Hz

10
Vibrations, COR, and the “Sweet Spot”
Evib
vf
e
+
0.1
0.2
0.2
0.3
0.3
0.4
0.4
0.5
0
20
40
60
80
100
120
0 5 10 15
e
vf (mph)
distance from tip (inches)
nodes4 3 2 1
Strike bat here
at ~ node 2
vibrations minimized
COR maximized
BBS maximized
best “feel”
Note: COP is irrelevant to feel and performance

11
•Two springs mutually compress each other KE PE KE
• PE shared between “ball spring” and “bat spring”
…sharing depends on “kball/kbat”
• PE in ball mostly dissipated (~80%!)
• PE in bat mostly restored
• Net effect: less overall energy dissipated...and therefore higher ball-bat COR
…more “bounce”—confirmed by experiment
…and higher BBS
• Also seen in golf, tennis, …
Aluminum Bats and the “Trampoline” Effect:A Simple Physical Picture
demo

12
0.40
0.45
0.50
0.55
0.60
0.65
0.70
500 1000 1500 2000
COR-modelCOR-expt
COR
fhoop
(Hz)
Softball Data and Model
Conclusions: • COR of Al bat can be significantly higher• essential physics is understood
Russell, Smith, AMN
change kballchange kbat
Wood
13
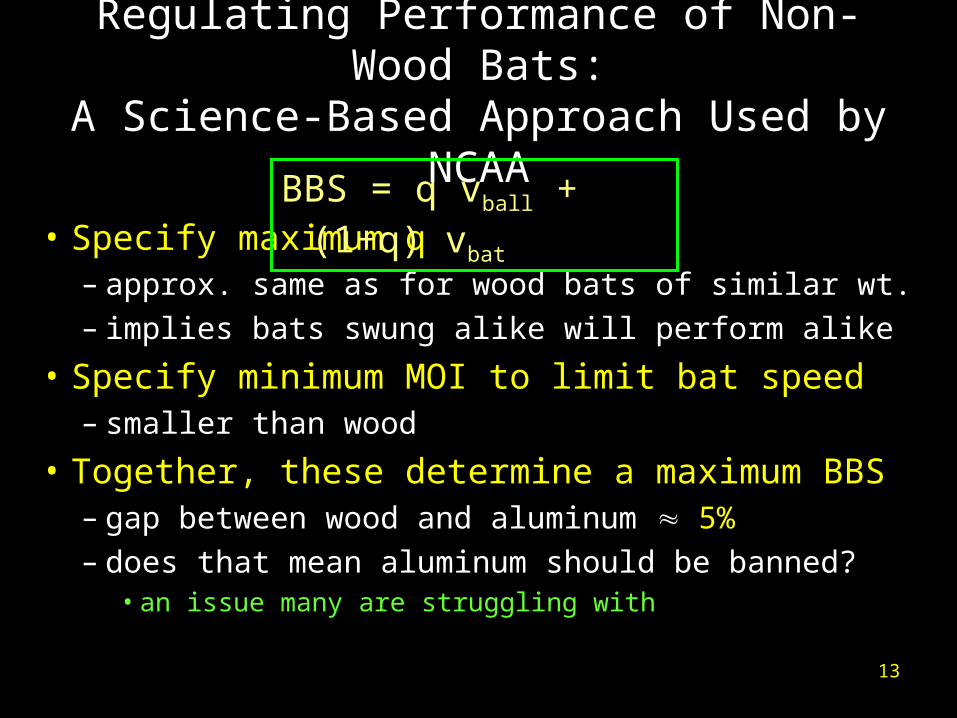
Regulating Performance of Non-Wood Bats:A Science-Based Approach Used by NCAA
• Specify maximum q – approx. same as for wood bats of similar wt.– implies bats swung alike will perform alike
• Specify minimum MOI to limit bat speed– smaller than wood
• Together, these determine a maximum BBS– gap between wood and aluminum 5%– does that mean aluminum should be banned?
• an issue many are struggling with
BBS = q vball + (1+q) vbat

14
40
42
44
46
48
50
8.5 9 9.5 10 10.5 11 11.5
I6"
(103 oz-in2)
knob
(rad/s)
y = m1*(9/m0)^m2
ErrorValue
0.392146.218m1
0.0574220.28747m2
NA3.8574Chisq
NA0.93138R
Crisco/Greenwald Batting Cage Study
woodaluminum
Batting cage study show how bat speed depends on I for college baseball players
~ [1/I6]n
0<n<0.5n 0.3
Other studies show bat speed independent of M for fixed I
Crisco, Greenwald, AMN

15
0.65
0.67
0.69
0.71
0.73
0.75
9000 9500 10000 10500 11000 11500 12000
BESR
MOI (oz-in2)
MOI limit
BESR limittypical wood
max vf
102 mph
97 mph
All bats below horizontal line and to right of vertical line are allowed
Example: 34” Bats=q+1/2
16
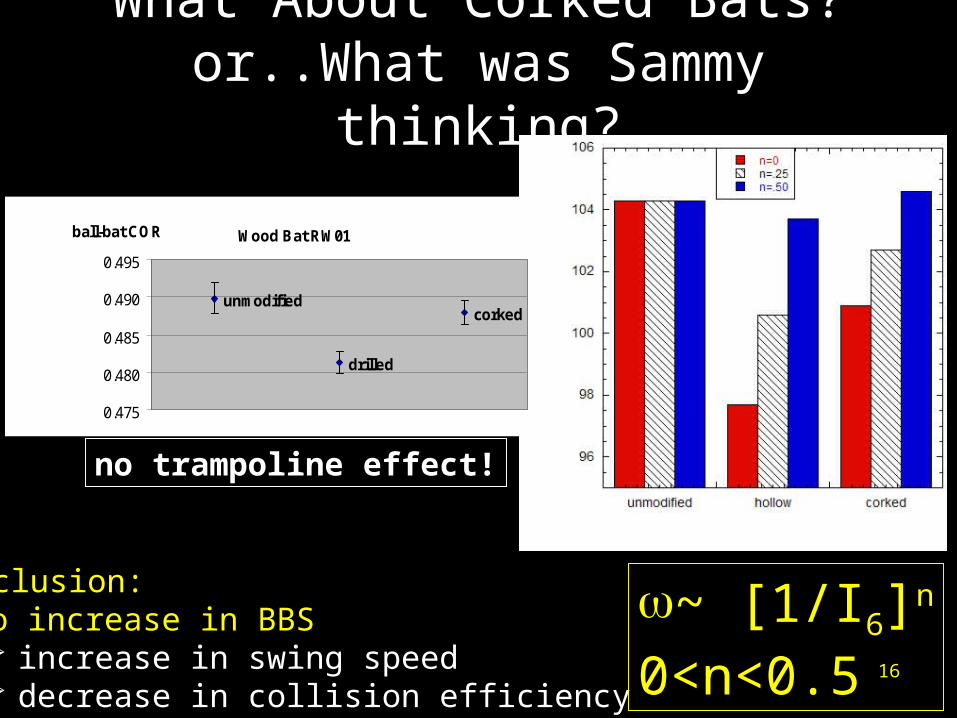
What About Corked Bats?or..What was Sammy thinking?
Conclusion:• No increase in BBS
increase in swing speed decrease in collision efficiency
~ [1/I6]n
0<n<0.5
no trampoline effect!
Wood Bat RW01
unmodified
drilled
corked
0.475
0.480
0.485
0.490
0.495
ball-bat COR

17
What About Juiced Baseballs?
Conclusion:No evidence for juiced ball

18
-80
-60
-40
-20
0
20
40
60
80
-2 -1 0 1 2
(inches)
1 = 79 rad/s
1 = 0 rad/s
1 = -72 rad/s
Etopspin
backspin
no spin
Putting spin on the ball: Low speeds
Conclusions: • slide-then-roll model approximately works• curveball is hit with more backspin than fastball
Cross & AMN

19
High-Speed Version:Work in Progress
20
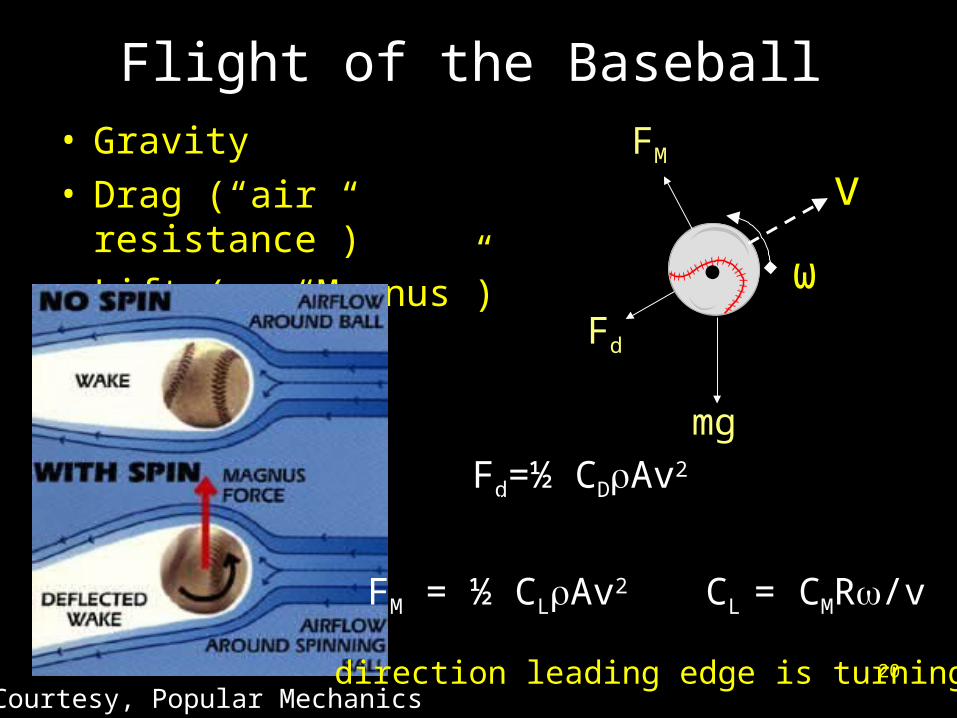
Flight of the Baseball• Gravity• Drag (“air resistance”)• Lift (or “Magnus”)
v
ω
mg
Fd
FM
Courtesy, Popular Mechanics
Fd=½ CDAv2
-v direction
FM = ½ CLAv2 CL = CMR/v
(ω v) direction direction leading edge is turning
21
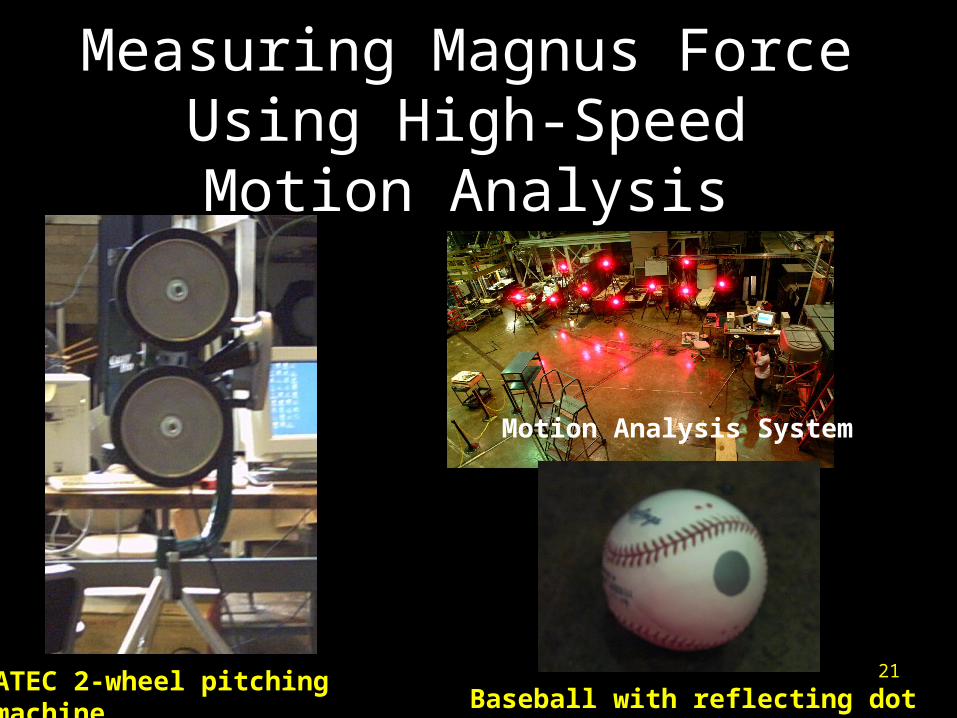
Measuring Magnus Force Using High-Speed Motion
Analysis
ATEC 2-wheel pitching machine
Motion Analysis System
Baseball with reflecting dot
22
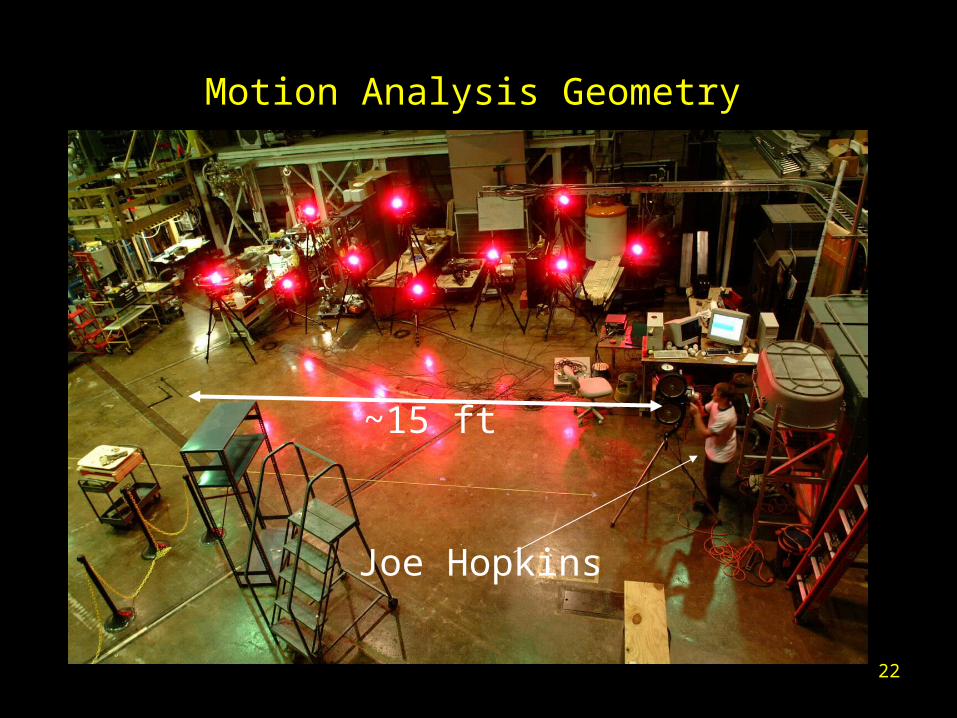
Joe Hopkins
~15 ft
Motion Analysis Geometry

23
Motion Capture System:
• 10 Eagle-4 cameras
• 700 frames/sec
• 1/2000 shutter
• EVaRT 4.0 software
www.motionanalysis.com
Pitching Machine:• project horizontally• 50-110 mph• 1500-4500 rpm

24
Typical Data and Fit
-3000
-2000
-1000
0
1000
2000
3000
1400
1420
1440
1460
1480
1500
1520
0.00 0.04 0.08 0.12 0.16t (s)
z
y
<v>=72 mph =4900 rpm
ay=1.58g
y
z
25
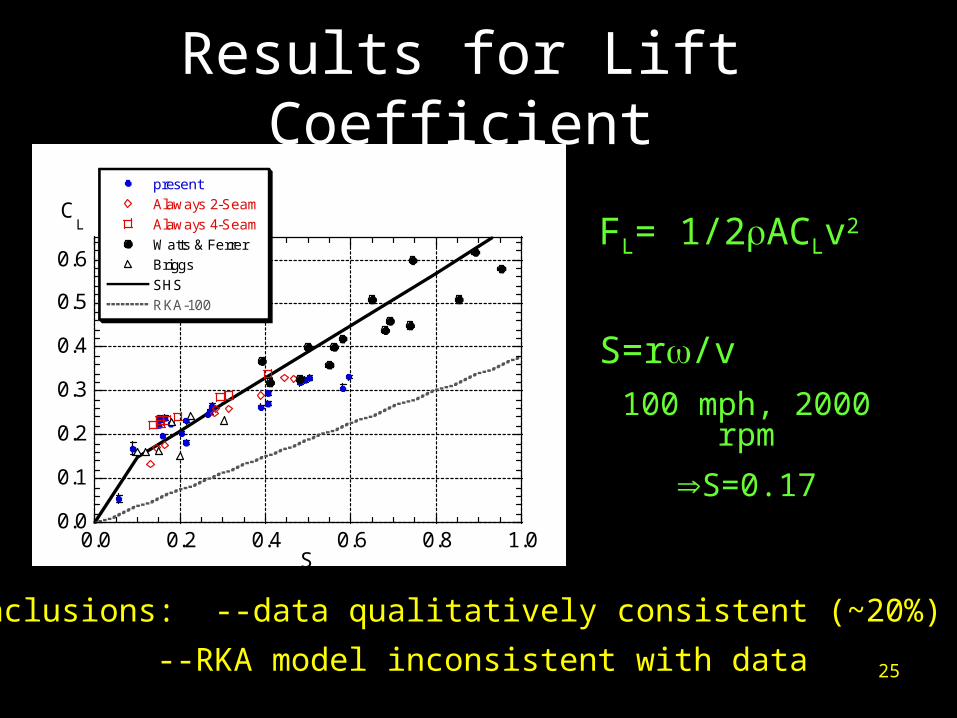
0.0
0.1
0.2
0.3
0.4
0.5
0.6
present
Alaways 2-Seam
Alaways 4-Seam
Watts & Ferrer
Briggs
SHS
RKA-100
0.0 0.2 0.4 0.6 0.8 1.0
CL
S
Results for Lift Coefficient
FL= 1/2ACLv2
S=r/v100 mph, 2000 rpm
S=0.17
Conclusions: --data qualitatively consistent (~20%)
--RKA model inconsistent with data

26
The PITCHf/x Tracking SystemA Quantitative Tool to Study Pitched Baseball Trajectories
27
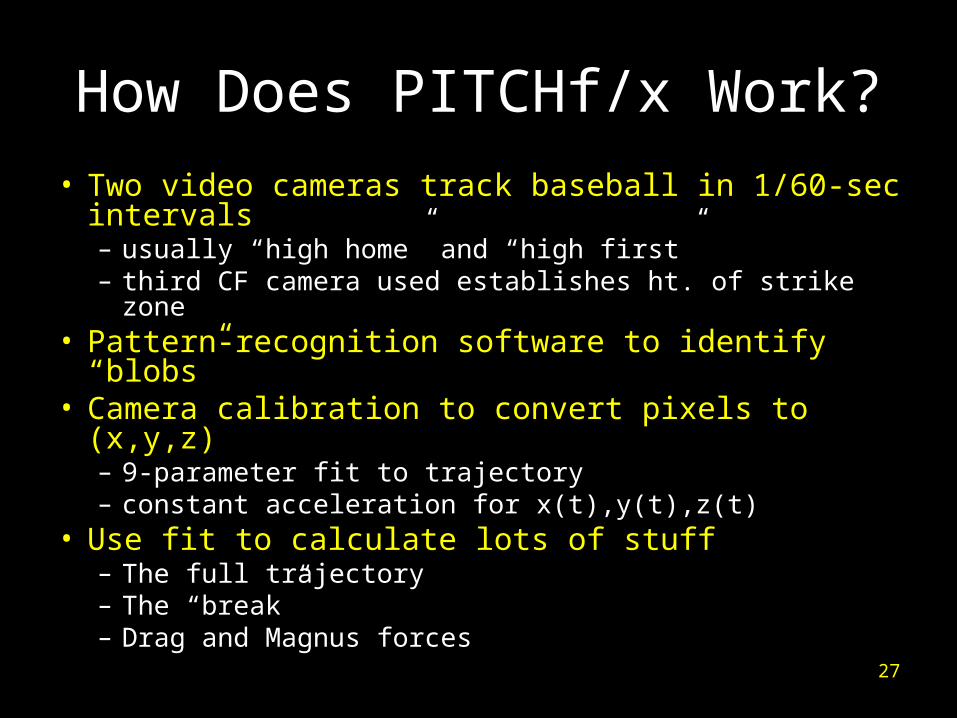
How Does PITCHf/x Work?
• Two video cameras track baseball in 1/60-sec intervals – usually “high home” and “high first”– third CF camera used establishes ht. of strike zone
• Pattern-recognition software to identify “blobs”• Camera calibration to convert pixels to (x,y,z)
– 9-parameter fit to trajectory– constant acceleration for x(t),y(t),z(t)
• Use fit to calculate lots of stuff– The full trajectory– The “break”– Drag and Magnus forces
28
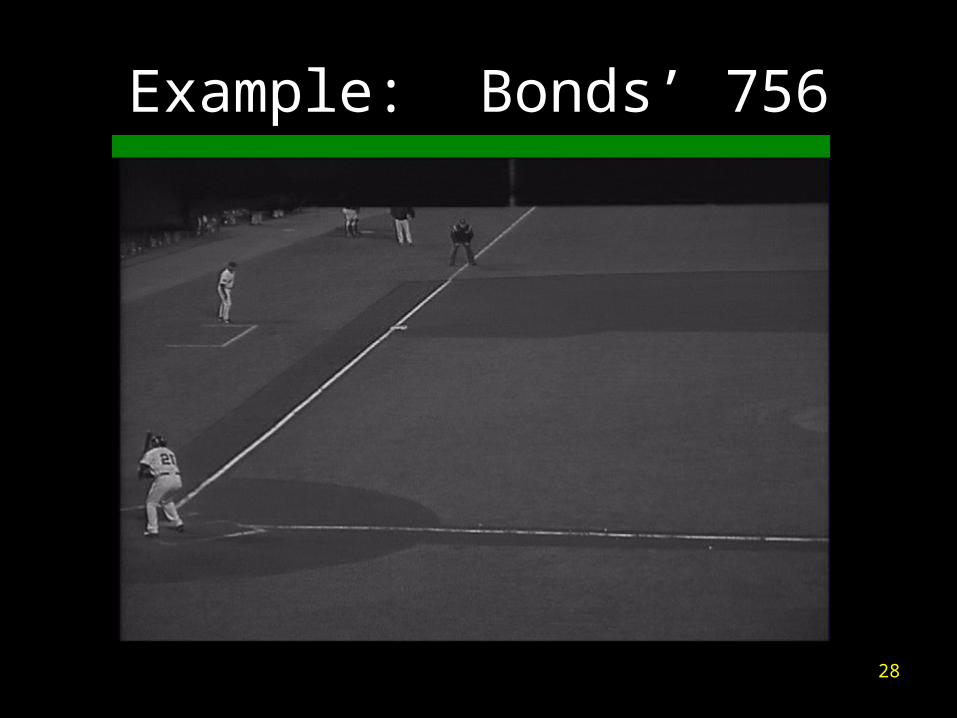
Example: Bonds’ 756
29
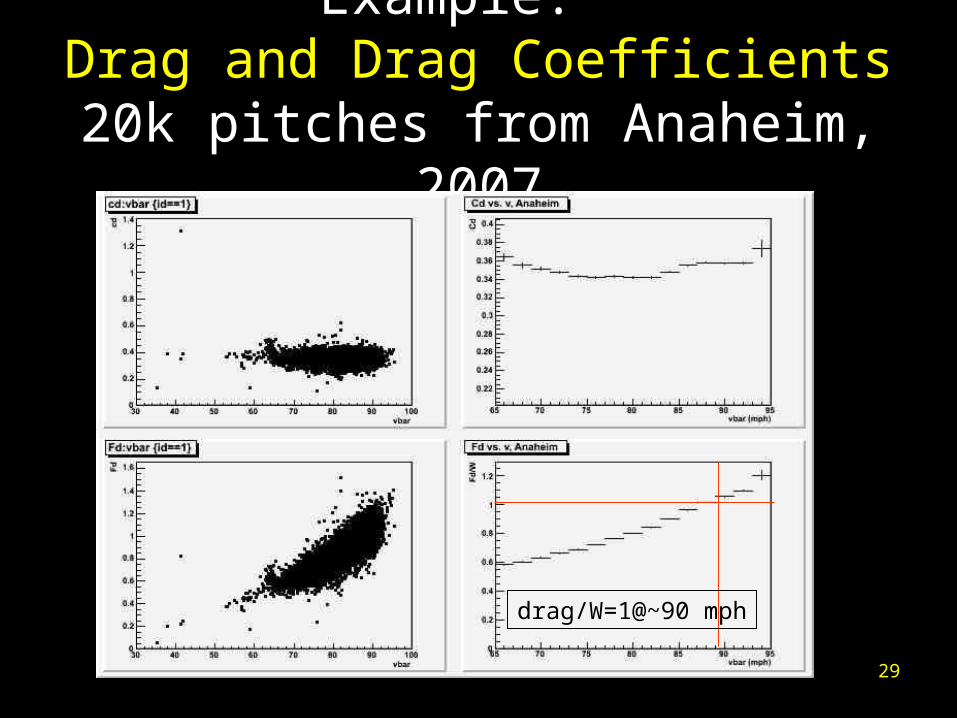
Example: Drag and Drag Coefficients
20k pitches from Anaheim, 2007
drag/W=1@~90 mph

30
Using PITCHf/x to Classify PitchesJon Lester, Aug 3, 2007 @ Seattle
I: 4-seam fastballII: Slider (?) III: 2-seam fastballIV: Curveball
LHPCatcher’s View
spin axis
break direction = -90o

31
How Far Did That Home Run Travel?
• Ball leaves bat• Hits stands D from home plate, H above
ground• How far would it have gone if no obstruction?

32
0
50
100
150
200
0 100 200 300 400 500horizontal distance (ft)
0
5
10
15
20
25
30
35
40
390 400 410 420 430 440 450 460horizontal distance (ft)
400 ft/30 ftRange=415-455Time can resolve
4 s
5 s7 s
See www.hittrackeronline.com
Calculations

33
From PITCHf/x to HITf/xBarry Bond’s 756th Home Run
• PITCHf/x data tracked hit ball over first 20 ft• Precision measurement of endpoint and time-of-flight
• Inferred: v0=112 mph; =270 up; =160 to right of dead center; =1186 rpm (backspin) and 189 rpm (sidespin, breaking to center)
34
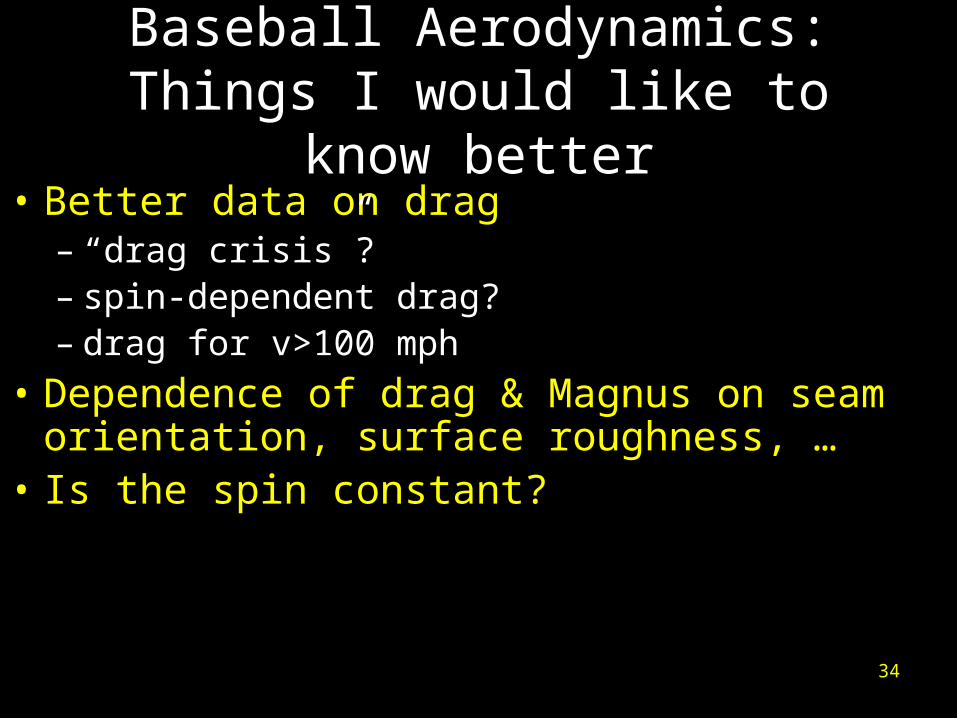
Baseball Aerodynamics:Things I would like to know better
• Better data on drag– “drag crisis”?– spin-dependent drag?– drag for v>100 mph
• Dependence of drag & Magnus on seam orientation, surface roughness, …
• Is the spin constant?

35
Trackman: The Wave of the Futuresee www.trackmangolf.com
• Doppler radar to measure radial velocity• 3-detector array to measure phase
– two angles
• Sidebands gives spin magnitude• Result:
– in principle, full trajectory can be reconstructed, including spin and spin axis
– already in use for golf, currently being adapted for baseball

36
Trackman Radar
Monopulse Principle (Phase)
TRANSMITTER
RECEIVER 1
FTX
FTX
FRX1fd1
(fd1 ) - (fd2) = 2**sin()*D*FTX/cRECEIVER 2FRX2
fd2
FTX
D

37thanks to Fredrik Tuxen, CTO of Trackman

38
• Steroids increases muscle mass
• Increased muscle mass increases swing speed
• Increased swing speed increase BBS
• Increased BBS means longer fly balls
• Longer fly balls means more home runs
Steroids and Home Run Productonsee Roger Tobin, AJP, Jan. 2008
39
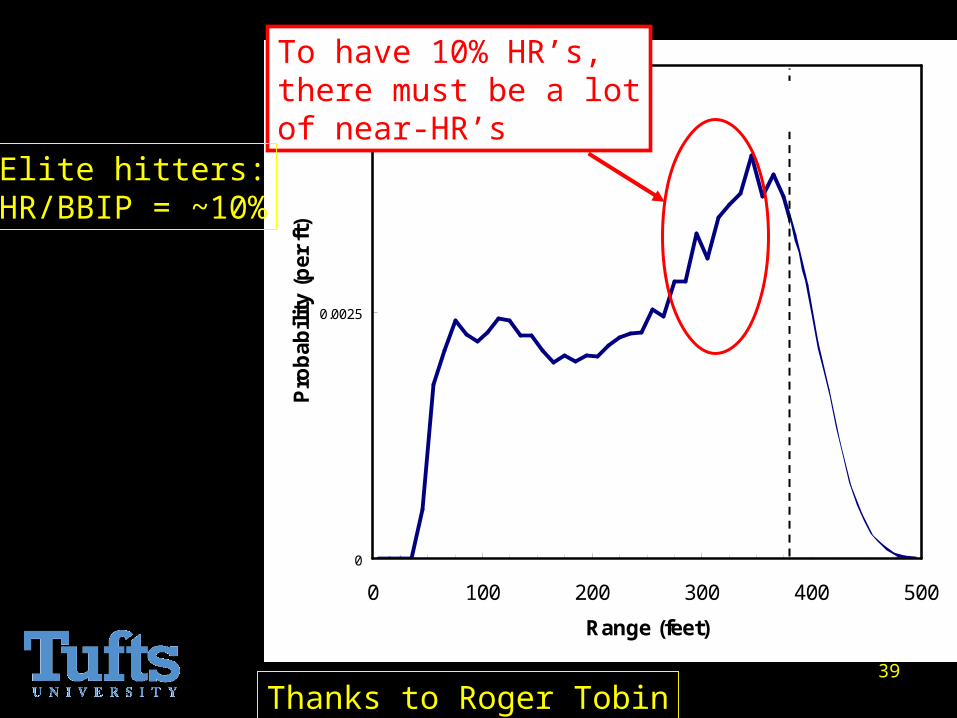
0
0.0025
0.005
0 100 200 300 400 500
Range (feet)
Pro
bab
ility
(p
er f
t)
Home Run Threshold
10%
To have 10% HR’s,there must be a lotof near-HR’s
Elite hitters:HR/BBIP = ~10%
Thanks to Roger Tobin

40
0
0.0025
0.005
0 100 200 300 400 500
Range (feet)
Pro
bab
ility
(p
er f
t)
Home Run Threshold
10%
14.9%
Change in range distribution when batted ball speed increased by 3%:3% change in BBS gives 50% increase in HR rate!
Baseline
3% speedincrease
Thanks to Roger Tobin

Home Run Distances, 2007www.hittrackeronline.com
Delta = distance beyond fence (ft)
~4% per foot
Tobin’s Conclusion: increase of BBS by few mph can increase HR rate by 30-50%!
42
Work in Progress
• Collision experiments & calculations to elucidate trampoline effect
• New studies of aerodynamics using Trackman and PITCHf/x
• Experiments on high-speed oblique collisions
• A book, with Aussi Rod Cross
Thanks for the invitation and your attention