experimental characterization and modeling of gf/pp
TRANSCRIPT

HAL Id: hal-01071017https://hal.archives-ouvertes.fr/hal-01071017
Submitted on 26 Mar 2015
HAL is a multi-disciplinary open accessarchive for the deposit and dissemination of sci-entific research documents, whether they are pub-lished or not. The documents may come fromteaching and research institutions in France orabroad, or from public or private research centers.
L’archive ouverte pluridisciplinaire HAL, estdestinée au dépôt et à la diffusion de documentsscientifiques de niveau recherche, publiés ou non,émanant des établissements d’enseignement et derecherche français ou étrangers, des laboratoirespublics ou privés.
Experimental characterization and modeling of GF/PPcommingled yarns tensile behavior
Jean-Emile Rocher, Samir Allaoui, Gilles Hivet, Jean Gilibert, Eric Blond
To cite this version:Jean-Emile Rocher, Samir Allaoui, Gilles Hivet, Jean Gilibert, Eric Blond. Experimental characteri-zation and modeling of GF/PP commingled yarns tensile behavior. Journal of Composite Materials,SAGE Publications, 2015, 49 (21), pp.2609-2624. �10.1177/0021998314551035�. �hal-01071017�

Experimental characterization and modeling of GFPP commingled yarns
tensile behavior
J-E Rocher, S. Allaoui, G.Hivet, J. Gillibert, E. Blond,
Journal of Composite material, 2014, DOI: 10.1177/0021998314551035.
Abstract
3D fabrics of commingled yarns offer the possibility of a low-cost and fast manufacturing of
complex shaped composite parts. Textile-reinforcement behavior during the forming
processes is very important since the appearance of defects (for example wrinkles, yarn
misalignment or breakage) can significantly affect the mechanical properties of the final part.
Experimental characterization of the mechanical behavior of textile-reinforcements is
expensive, time consuming and a large scattering of results is often observed. To overcome
this, meso-scale modeling is an interesting method to study and understand the textile
behavior at the unit cell level. To perform realistic simulations, an accurate modeling, and
therefore knowledge of the yarn mechanical behavior is needed. In this paper, a simple
protocol is proposed and validated in order to investigate the tensile behavior of commingled
polypropylene/glass yarns. Influence of specimen length and strain rate are highlighted. A
comparison of tensile behavior of yarns before and after weaving is carried out in order to
evaluate the weaving damage effect. Finally, a model describing the commingled yarn
behavior is proposed. The parameters of the model are defined. Their dependency to strain
rate, specimen length and weaving damage are highlighted.
Keywords
Commingled yarns, experimental protocol, tensile behavior, weaving damage, specimen
length, strain rate.

Introduction
There is a growing interest in automotive, aeronautic and leisure industries for the use of
textile reinforced thermoplastic composites as lightweight and high performance structural
components. Indeed, this kind of product offers interesting advantages compared to classical
thermoset composites, especially recycling and the possibility to reshape the part by re-
heating1-3
. Thermoplastic matrices also offer advantages in terms of mechanical behavior,
with better fracture toughness properties and easiest storage contrary to thermoset ones.
However, the high viscosity of thermoplastic matrices is among the main drawbacks because
it makes difficult the reinforcement impregnation. One solution can rely on the use of hybrid
yarns where the reinforcement and thermoplastic fibers are mixed together 4. Different
technologies have been developed to produce such yarns that can then be used to produce
highly drapeable fabrics2. The final composite part is obtained by a thermoforming process,
offering the possibility of low-cost and short time cycle manufacturing1-3
, which is an
important criterion when selecting a manufacturing process in the automotive industry for
example. For the production of thick parts, the use of 3D fabrics offers advantages like
reducing handling of layers and therefore manufacturing times. 3D textile composites also
offer mechanical advantages over classical 2D fabrics: they exhibit, thanks to the use of z-
binder better delamination properties, impact and fatigue resistance than conventional
composites5-7
. Within this study, which is part of the European project 3D light-Trans,
advantages of both technologies are combined in a 3D fabric of commingled yarns.
Manufacturing of the textile-reinforced composite parts requires the forming of the
reinforcements into the desired shape. The fabric behavior during this forming process is very
important since the appearance of defects (wrinkles, yarn misalignment) can affect the
mechanical properties and quality of the final part8-10
. Experimental studies have shown the
good drapeability of commingled yarn made fabrics2. But their potential is still poorly

understood and numerous choices of weaving architectures or yarns are possible, that is why
further investigation of their properties is needed.
Experimental characterization of mechanical behavior of textile materials is difficult, and a
large scattering of results is often observed11
. To avoid costly trial and error development,
numerical approaches can be used. Numerical approaches at the micro12
and meso13-16
scales
have been developed to investigate the mechanical behavior and formability of woven fabrics.
In meso-scale simulations, CAD models of the fabric unit cell where yarns are modeled as a
continuum are used. For roving fabrics, yarns are considered as transversely isotropic
material13,14,17
with null or roughly estimated lateral contraction during loading (zero
longitudinal Poisson’s ratio).
To perform realistic meso-scale simulations on fabrics made of commingled yarns, it is
important to investigate and model accurately the mechanical behavior, and in particular the
tensile behavior, of commingled yarns.
In this paper, a simple protocol to perform yarn tensile tests is proposed and validated. The
tensile behavior of commingled polypropylene/glass yarns is then investigated. Influence of
specimen length and strain rate are evaluated. Previous studies have shown the influence of
weaving damage on the yarn mechanical behavior18
. To consider the real mechanical behavior
of yarns inside the fabric, a comparison of yarn tensile behavior before and after weaving
(yarns extracted from the fabric) is carried out in order to analyze and quantify the effect of
weaving damage. Based on these experimental results, a model describing the specific
commingled yarns tensile behavior is proposed. Parameters of this model are identified,
paving the way to meso-scale simulations on commingled yarns made fabrics.

Materials and methods
Materials
Different technologies have been developed for the production of hybrid yarns. Thermoplastic
can be integrated in the yarn under different forms like powder, staple fibers or filaments. The
first main objective when producing hybrid yarns is to obtain a good mixture of components
that will lead to a good repartition of matrix and low porosity levels in the composite3. The
second important point is that hybrid yarns must be usable in weaving looms to produce
fabrics.
Commingling is one of the technologies used to produce hybrid yarns. It relies on the use of
air jet texturizing machines4. The commingled yarn is obtained using reinforcement and
matrix yarns as input. These yarns are opened and their filaments are mixed in the air nozzle.
The use of overdelivery (delivery speed of input yarns more important than the take out speed
of the commingled yarn) is necessary to perform the commingling. Still, the overdelivery
value must be as low as possible especially for reinforcement fibers to avoid significant loss
of orientation 4. This manufacturing process is cost effective and provides a good mixture of
matrix and reinforcement filaments in the yarn3. It enables producing yarns with different
reinforcement and matrix materials and different fiber volume fraction. The obtained
commingled yarns are flexible and can be woven, braided or knitted3,5,6
. However, the main
drawbacks are that the commingling process can damage fibers and that high counts yarns
cannot be produced effectively.
The commingled yarn structure is also highly influenced by the manufacturing process. The
use of pressured air leads to the appearance of opened areas and nips (compact areas) along
the yarn length (Figure 1). Different kinds of nip structures, corresponding to various
repartitions of the reinforcement and matrix filaments, can be observed19-21
. The types of nips,

their stability, the degree of interlacing (total length of nips divided by the yarn length), the
commingling damage and the filaments distribution in the yarn are highly influenced by the
chosen commingling parameters: speed, pressure, jet design and overdelivery values.
Consequently, the tensile behavior of commingled yarns depends on properties of the used
input yarns but also to a large extent on the yarn structure and therefore of the commingling
process19-21
. Investigation of commingled yarns tensile behavior is hence necessary since
models developed and used for other types of yarns are not relevant.
Yarns used in this study were manufactured using a 300 tex E-glass fiber yarn (referred to as
GF yarn in the following) and 3*32 tex polypropylene (PP) yarns. Overdelivery (OD) used
was of 2% for GF and 5% for PP. More details concerning the commingling process can be
found in the study of Fazeli et al.22
. Yarns are similar to the ones studied by Torun et al. 4 in
terms of input yarn count and GF overdelivery. Final yarn count is approximately 410 tex for
a glass fiber volume fraction��� � 52%.Commingled yarns will be referred to as GFPP
yarns in the following;
a b
Fig. 1. Commingled yarn: a. Global structure; b. Nip detail

Compared to rovings with roughly rectangular cross section at the end of the yarn production
process23
, the commingled yarn section is rather circular or elliptic19,24
. Yarn diameter can
vary from less than 1 mm in the nips to more than 3 mm in opened areas (see Figure 1(a)).
Using the input materials densities (2.54 for GF and 0.91 for PP) and the overdelivery value,
the average material section in the GFPP yarns can be estimated to 0.23mm². This value will
be used to calculate yarn’s stresses from measured forces in the following.
Within the study, yarns have been used to produce a 3D fabric. The weaving architecture of
the fabric is shown in Figure 2. It is composed of five layers of yarns in the weft direction and
four in the warp direction. Binding yarns are vertically oriented and interlock just 3 layers of
weft yarns. The weaving density of fabric is 240 yarns / 10 cm for weft yarns and 200 yarns /
10 cm for both warp yarns and binding yarns. All yarns used in the fabric are the previously
described GFPP yarns.
Fig. 2. Weaving architecture of the 3D fabric (grey: weft yarns, red: warp yarns, other colors:
binders)
Yarn tensile testing
The goal of this section is to propose and validate a simple protocol to perform reliable yarn
tensile tests in order to investigate the commingled yarn’s behavior. To the authors’
knowledge there are no specific standards for tensile testing of commingled yarns. However,
the standard ISO 334125
giving recommendations for the determination of the breaking force
and elongation of textile glass yarns can be used as a basis. This standard is applied for
rovings of less than 2000 tex. The use of 5mN/tex preload, 500 mm specimen length and 200
mm/min testing speed are recommended. During testing, samples must break at 10 mm away
from the grips. Reproducibility of results must be investigated by performing at least 10 tests.
In the literature, various specimen length and strain rates have been used. The results on
different types of yarns have shown that they both can have significant effect on the measured
modulus and breaking strength of yarns26-29
. The goal of these tests is to estimate what will be
the yarn behavior within the fabric. In this sense, it has been shown30
that determining yarn’s
strength at short specimen length is more appropriate. Moreover, during forming, yarns will
be subjected to various strain rate conditions. Experimental investigation of the influence of
strain rate and specimen length on the commingled yarns tensile behavior is therefore
required.
For this purpose, tests on commingled yarns were performed using a 500 mm specimen length
and three different crosshead speeds of 5 mm/min (strain rate �� � 1.67 × 10��s�� ), 50
mm/min (�� = 1.67 × 10��s��) and 500 mm/min (�� = 1.67 × 10��s��) to investigate the
strain rate effect. Tests were also performed with a 200 mm specimen length at same strain
rates (i.e with testing speeds of 2, 20 and 200 mm/min) to evaluate the influence of specimen
length on measured parameters. The 1.67 × 10��s�� strain rate was chosen to investigate the
quasi-static tensile behavior of yarns. The 1.67 × 10��s�� strain rate corresponds to what
could be observed in industrial conditions for composite parts manufacturing while the
1.67 × 10��s�� strain rate was chosen as an intermediary value.
For the sake of simplicity, tests were performed using a universal testing machine (INSTRON
4507) with conventional jaws. Samples were prepared by fixing yarns between thin aluminum
plates with glue. A uniform pressure was applied on the plates during at least 24 hours (time

of drying). Aluminum tabs were then directly fixed between the machine jaws for the testing.
At least 10 tests were performed in each testing configuration and more when a significant
scattering of tensile behavior between samples was highlighted. A 5mN/tex preload was used.
When performing tensile tests it is not always possible to rely on displacement data given by
the testing machine: when load is applied, machine components or other pieces like aluminum
tabs or glue used to fix the samples can deform. As a consequence, displacement given by the
machine is not the one to which the sample is subjected. This error can be significant if high
loads are reached or if the sample’s deformation is low. Another important issue is the
clamping: bad clamping conditions can lead to the premature breaking of the samples near the
clamping areas due to stress concentration phenomenon. To investigate these issues, optical
measurements with marker tracking method were used. Figure 3 shows black markers 50, 100
and 150 mm spaced that were placed on 200 mm long yarn samples. These tests were
performed on GF yarns (the 300 tex yarn used as an input for the manufacturing of
commingled yarns), since it is not possible to use the marker tracking method with
commingled yarns because of their particular structure described in the previous section.
Fig. 3. Schematic representation of a yarn tensile sample with markers for optical
acquisition
Positions of markers were registered during testing using a CCD camera (resolution 1280 ×
1024 pixels) and deformations were calculated by the Deftac software31
. In Figure 4 an
example of stress-strain curves of a sample reconstructed using machine displacement and

optical measurements (100 mm spaced markers) shows the very good agreement between the
two methods in the loading phase. Average Young’s modulus obtained on seven samples
using the machine displacement and the 3 couples of markers in this linear phase are shown in
Table 1.
Fig. 4. Tensile curves of a GF yarn obtained using machine and optical measurements
Table 1. GF yarns Young’s modulus calculated by the different methods
Modulus [GPa]
Optical 50 mm 73.8 ± 1.3
Optical 100 mm 73.5 ± 1.8
Optical 150 mm 73.3 ± 1.2
Machine 72.6 ± 0.6
Results of optical measurements show that the deformation is homogeneous along the yarn
length during the loading, and a very good agreement (difference of less than 2%) between
Young’s modulus calculated using the machine displacement and the marker tracking method
is highlighted. Moreover, the linear behavior in the loading phase and the measured modulus
of 73 GPa are in good agreement with the literature for E-glass rovings. These results show
that the machine compliance is negligible for GF yarns and therefore that machine
0
100
200
300
400
500
600
700
800
900
0 0.5 1 1.5 2 2.5
Str
ess
MP
a
Strain %
machine data
optical data

displacement can be used directly to calculate yarn strain. Since GFPP yarns have a lower
stiffness compared to GF yarns (as testing results will show in the next section), machine
compliance can also be neglected with 200 mm long GFPP yarns, and, as displacements will
increase with specimen length, machine displacement can also be used with the 500 mm long
samples.
When fibers begin to break inside the yarn, markers progressively disappear and it becomes
more difficult to obtain coherent optical measurements. This can be observed in Figure 4
when, after reaching the maximum load, optical and machine strain measurements start to
mismatch. Still, observations on samples tend to show that deformation remains homogeneous
along the yarn length during the breaking phase and that fiber breakages are not localized near
the clamps but homogeneously distributed along the GF yarn length. Due to the more brittle
breaking behavior of GFPP yarns, it is possible to observe directly where their breaking
occurred (see Figure 5). In most cases, breaking is not localized near clamps, tending to prove
that yarns don’t break prematurely due to stress concentration phenomenon.
Fig. 5. GFPP yarn after breaking
Results of tensile tests performed on ten GF yarn samples in the same testing configuration
(200 mm specimen length, 2 mm/min testing speed) are shown in Figure 6. A very good
reproducibility of results in the loading part is highlighted with coefficients of variation of
less than 3% for the measured moduli and breaking stress between the different samples.

These results show that the scattering that could be introduced by the testing protocol and
manufacturing process of samples is low.
Fig. 6. Repeatability of GF tensile test
As mentioned, longitudinal Poisson’s ratio considered in models describing roving tensile
behavior are often roughly estimated or supposed null. In our case, because of the particular
structure of commingled yarns it is interesting to see if modifications of the yarn structure
under tensile loading conditions can be observed. To do so, pictures were registered using a
camera (AVT manta, 2452*2048 pixels and 50 mm zoom lens) during tensile testing (see
Figure 7(a)). Obtained images were analyzed using a Matlab program to detect the yarn
contours (see Figure 7(b)) and highlight a possible yarn contraction in the transverse
direction. An example of result showing the evolution of yarn diameter with increasing tensile
load is shown in Figure 7(c).
The presented testing protocol gives, from the preparation of samples to the analysis of testing
results, a simple and reliable method to characterize the GFPP yarns tensile behavior. Use of
optical measurements and of a dedicated program for yarn contour detection also enables
analyzing changes of yarn section during testing.
0
100
200
300
400
500
600
700
800
900
0 0.5 1 1.5 2 2.5
Str
ess
MP
a
Strain %

a b
C
Fig. 7.a. Tensile testing of GFPP yarn with picture registration; b. Result of yarn contour
detection; c. Evolution of yarn diameter with applied tensile load.
Experimental results
In this section, experimental results of tests performed on commingled yarns are presented.
These results are discussed and interpreted in details in the section “modeling and
discussion”.
0
0.5
1
1.5
2
2.5
0 5 10 15 20
Yarn
dia
me
ter
mm
Position along yarn length mm
tensile load : 2N
tensile load : 10N
tensile load : 50N

Quasi-static tensile behavior of commingled yarns
Results presented are those obtained with the 200 mm specimen length and 2 mm/min testing
speed. Figure 8(a) shows the typical quasi-static tensile behavior of a GFPP yarn. At the
beginning of loading, a nonlinear behavior is observed. Yarn stiffness gradually increases and
the behavior progressively becomes linear, ��� value corresponds to the strain for which
behavior becomes linear. Little drops of force corresponding to the opening of unstable nips
can be observed (see in black ellipsis in Figure 8(a)). Nips opening might also explain the
yarn rotation that can be observed during testing. The behavior remains almost linear up to the
brutal break of glass fibers, then the load is taken up by the PP21
(see Figure 8(b)).
Fig. 8. GFPP tensile behavior: a. First part of tensile behavior and effect of the opening of an
unstable nip; b. Global tensile behavior.
There is a significant scatter of tensile properties of GFPP yarns in terms of modulus and
breaking strength (Figure 9(a)). The coefficient of variation is more than 10%. Average
breaking stress is of 340 MPa corresponding to a breaking load close to 80 N. From preload to
maximum strength value, the breaking strain is approximately 1.5%. Average Young’s
modulus (measured in the linear part of the stress-strain curves) is approximately 30 GPa. A

correlation appears to exist between the modulus of a particular yarn and its breaking strength
(see Figure 9(b)); yarns with a higher modulus tending to break at higher loads. It can also be
noticed that the ��� value seems to decrease with increasing modulus (see Figure 9(c)). The
calculated Spearman’s rho coefficients (assessing how well the relationship between two
variables can be described using a monotonic function) for both couples of variables are
respectively of 0.88 and -0.93. Linear regressions and coefficients of determination are also
reported in the two figures.
a b
c
Fig. 9. a. Scattering of GFPP yarns tensile behavior; b. Breaking stress-Young’s modulus
correlation; c. Size of nonlinear behavior (��� value) -Young’s modulus correlation
Pictures showing the evolution of yarn aspect with increasing applied tensile load are
displayed in Figure 10. A reduction of yarn diameter can be observed. The Evolution of
yarn’s diameter in the nips and opened areas highlighted in Figure 10 are plotted in Figure 11,
superposed with yarn tensile behavior. It can be observed that the yarn diameter tends to
0
50
100
150
200
250
300
350
400
450
500
0 0.5 1 1.5 2
Str
ess
MP
a
Strain %
y = 19.011x - 219.83
R² = 0.823
150
200
250
300
350
400
450
500
25 27 29 31 33 35
Bre
ak
ing
str
ess
MP
a
Young's modulus GPa

become homogenized when load increases. Decrease of yarn diameter is particularly
significant during the initial nonlinear behavior phase in the opened area. When behavior
becomes linear, the yarn diameter keeps decreasing but much more slowly.
2 load (9 MPa) 10 load (43 MPa)
20 load (87 MPa) 50 load (216 MPa)
Fig. 10. Evolution of yarn aspect with increasing load
Fig. 11. Decrease of yarn diameter in nips and opened areas superposed with yarn tensile
behavior
Effects of strain rate and specimen length
Average values and standard deviation of measured moduli, breaking strength and strain of
GFPP samples for the two specimen lengths and the three strain rates are shown in Table 2.
0
50
100
150
200
250
0.7
0.9
1.1
1.3
1.5
1.7
0 0.2 0.4 0.6 0.8 1
Str
ess
MP
a
ya
rn d
iam
ete
r m
m
Strain %
opened area
nip area
yarn tensile behavior
opened area nip

For comparison results obtained for GF yarns in the same testing configurations are also
reported. Average GFPP tensile curves for the 200 mm specimen length at the 3 strain rates
are shown in Figure 12. The first parts of the stress-strain curves are almost superposed. A
pronounced increase of breaking strength with strain rate is highlighted. For the two specimen
lengths, the average breaking strength at 1.67 × 10��s�� is more than 60% higher than the
one measured at1.67 × 10��s�� (Table 2). For GF yarns this increase is only of 20%. For
the 1.67 × 10��s�� strain rate, influence of specimen length on breaking strength appears to
be quite similar for GF and GFPP yarns, average breaking strength being approximately 6%
higher with the 200 mm specimen length compared to the 500 mm specimen length. This
difference remains the same for the three strain rates in the case of GF yarns but seems to
increase slightly with strain rate for GFPP (13% difference at 1.67 × 10��s�� strain rate).
Young’s modulus of GFPP yarns is close to 30 GPa. It increases slightly with strain rate and
decrease slightly with specimen length. For GF yarns it remains approximately the same in all
testing configurations. With high strain rates, a progressive decrease of stiffness of GFPP
yarns is observed before yarn break. In some cases, load is not taken up by PP fibers after the
breaking of glass fibers (total break of the yarns), this was mainly observed for the 500 mm
specimen length at high strain rates.
Fig. 12. Average stress-strain curves of GFPP yarns for the 3 strain rates (200 mm gauge
length)
0
100
200
300
400
500
600
0 0.5 1 1.5 2 2.5 3 3.5 4
Str
ess
MP
a
Strain %
1.67e-4 s-1
1.67e-3 s-1
1.67e-2 s-1

Table 2. Results in all testing configurations for GF and GFPP yarns.
Gauge length [mm] 200 500
Testing speed [mm/min] 2 20 200 5 50 500
Strain rate [%��] 1.67 × 10�� 1.67 × 10�� 1.67 × 10�� 1.67 × 10�� 1.67 × 10�� 1.67 × 10�� GF
Young’s modulus [GPa] 73.6±*.+ 73.1±�.* 73.9±�.� 73.9±�., 74.1±�.- 72.9±�.�
GFPP ./. 0±../ 01. 2±..3 01. 4±3./ .4. 5±3./ ./. 6±..1 01. 5±3.3
GF Breaking strain [%] (strain 0 at preload)
1.35±*.*, 1.54±*.*� 1.61±*.*- 1.24±*.*, 1.39±*.*� 1.51±*.*�
GFPP 3. 67±1.31 3. /.±1.34 .. 61±1.37 3. 6.±1.3. 3. 41±1.36 .. 67±1...
GF Breaking stress [MPa]
852±�� 948±�� 1024±�� 819±�+ 901±�* 968±�,
GFPP 061±51 622±23 24/±00 03/±64 614±23 236±60
GF Breaking load [N] 102.2±�., 113.8±�., 122.9±�.: 96.7±�.� 106.4±�.� 114.2±�.+
GFPP 74. 5±30.4 312. 1±33.7 305. 1±7.5 70. 7±33.. /5. 5±33.7 334. 7±/./
Torun4 performed tensile tests on quite similar yarns with a 500 mm specimen length and a 25
mm/min testing speed. Results show a modulus of less than 20 GPa and a breaking force of
approximately 45 N. These values are quite low compared with our results. Origin of these
differences could come from the different commingling process of yarns or from the different
tensile testing protocol.
Figure 13 presents the evolution of breaking strength for the two specimen lengths as a
function of the strain rate logarithm for GF and GFPP. Breaking load of GFPP yarns is of the
same order of magnitude as GF one. Still it can be observed that for quasi-static loading
conditions, GFPP yarn’s breaking load is lower than GF ones but becomes greater at high
strain rates.

Fig. 13. Influence of strain rate and gauge length on the breaking load of GF and GFPP yarns
Influence of weaving damage
Lee et al.18
have investigated the weaving damage effect on tensile behavior of glass yarns
during 3D fabrics weaving. Tensile tests performed on glass yarns after the different weaving
steps have shown that their stiffness remains almost unchanged while their tensile strength
can be decreased by up to 30% at the end of the process. This damaging can play a significant
role in the possible breaking of yarns during forming process. Damage is mainly attributed to
the abrasion between yarns and weaving machine components during the different weaving
steps. In our case, as mentioned above, the structure and tensile behavior of commingled
yarns are different when compared to rovings. It is therefore interesting to compare the
weaving damage effect on commingled yarns with the results of Lee et al. To do so, weft,
warp and binding yarns have been extracted from 3D fabric presented in Figure 2 and tested
(specimen length of 200 mm and testing speed of 2 mm/min). Table 3 gives the measured
moduli, breaking strengths and strains for the 3 groups of yarns and their variations compared
to values obtained for yarns before weaving. The average tensile curves of yarns are
compared in Figure 14.
70
80
90
100
110
120
130
140
-4 -3.8 -3.6 -3.4 -3.2 -3 -2.8 -2.6 -2.4 -2.2 -2 -1.8 -1.6
Bre
ak
ing
str
en
gth
N
log(strain rate)
GF 200 mm
GF 500 mm
GFPP 200 mm
GFPP 500 mm

[Insert Table 3]
Fig. 14. Average tensile behavior of damaged and undamaged GFPP yarns
Table 3. Mechanical parameters of damaged yarns and comparison with undamaged yarns
values in parenthesis
Breaking strain [%] Breaking strength [N] Breaking stress [MPa] Modulus [GPa]
Binding yarns 1.24±*.�-(-16 %) 66.9±:.;(-15 %) 290±�: (-15 %) 29.4±�.;(+ 1 %)
Warp yarns 1.21±*.��(-17 %) 61.4±:.�(-22 %) 266±�-(-22 %) 28.2±�.*(- 3 %)
Weft yarns 1.31±*.�-(-11 %) 56.3±�*.+(-28 %) 244±+* (-28 %) 24.2±:.�(- 17 %)
A decrease of breaking strength is observed for the three groups of yarns. Results show that
weft yarns are the most damaged, with a decrease of 28% of breaking strength and also a
decrease of 17% of modulus. A more significant scattering of weft yarn’s breaking strength
and modulus is also observed. Damage seems to vary significantly from one yarn to the other.
In this sense, observations on weft yarns show that on some samples a non-negligible number
of fibers are broken. It has been shown18
that fibers can be broken during the weft-insertion
0
50
100
150
200
250
300
350
0 0.5 1 1.5 2
Str
ess
MP
a
Strain %
undamaged yarns
binding yarns
warp yarns
weft yarns

stage when yarns pass through a guide. This damaging can explain the decreased breaking
strength and modulus observed on weft yarns.
The modulus of warp and binding yarns is not modified; they are similarly damaged by the
weaving process, with a decrease of breaking strength of respectively 15 and 22%. Their
average tensile behavior is very similar (Figure 14).
As apparent from Figure 14, the initial nonlinear behavior (��� value) is less pronounced for
warp and binding yarns as compared to undamaged yarns. During the weaving process, warp
and binding yarns pass through a tensioning device to provide adequate tension for the
shedding stage18
. They are therefore subjected to several tensioning cycles. To a lesser extent,
during the insertion stage, weft yarns can also be subjected to tension. It is in this sense
interesting to investigate the tensile behavior of GFPP yarns under cyclic loading. For this
purpose, cyclic loading tests have been performed on undamaged yarns (testing configuration
200 mm, 2 mm/min), and an example of result is shown in Figure 15.
Fig. 15. Cyclic testing of a GFPP yarn
0
20
40
60
80
100
120
140
0 0.2 0.4 0.6 0.8
Str
ess
MP
a
Strain %
first loading
unloading
second loading

After the first loading cycle, a permanent deformation is highlighted. The nonlinear phase of
the second loading is reduced compared to the one of the first loading and Young’s modulus
observed during the second loading also appears slightly more important. An increase of
Young’s modulus of up to 10% after few loading cycles is observed: on the testing result
example presented in Figure 16, the maximum modulus reached during the first loading is
26.7 GPa, it increases in the next two loadings to stabilize at a value of 29.3 GPa. This
phenomenon can be attributed to the progressive alignment of fibers along the loading
direction by the first loadings. If a high number of cycles are performed, it can lead to the
premature breaking of the yarn (see Figure 16). A possible explanation could be that damage
by inter-fiber friction occurs in the yarn because of the fiber interlacing and complex stress
repartition in the nip areas.
Fig. 16. Premature breaking after multiple cyclic loadings
0
50
100
150
200
0 0.5 1 1.5
Str
ess
MP
a
Strain %

During the weaving process, two effects have therefore to be considered. The first one is
abrasion between yarns and weaving machine components leading to fiber damage and fiber
breakage (observed for weft yarns) that can explain the decrease of yarn’s breaking strength
and stiffness. On the other hand, tensioning of yarns during the weaving process can lead to a
smaller initial nonlinear behavior, an increase of modulus and a decrease of breaking strength.
This mechanism can explain the smaller initial nonlinear behavior of warp and binding yarns.
Still, no increase of their Young’s modulus was observed (Table 3), maybe because loads
experienced by these yarns during the weaving process are less significant than those used for
cyclic testing. The possible increase of modulus can also have been compensated by fiber
breakage caused by abrasion with components like for weft yarns. Both fiber damage and
breakage due to abrasion with machine components and multiple tensioning of yarns during
weaving can explain the breaking strength decrease of warp and binding yarns.
Weaving induces a significant decrease of yarn’s breaking strength and also a stiffness
decrease for weft yarns. This can lead to yarn breakage during the forming process and
decreased mechanical properties of the final composite parts. An accurate knowledge of
tensile stresses to which yarns are subjected during weaving, and an investigation of their
tensile properties after each weaving step would help to better understand the effects of
weaving. One solution to avoid fiber damage could rely in the use of hybrid yarns where
matrix filaments are placed around the reinforcement fibers to protect them from abrasion. On
the other hand, due to the poor mixture of filaments in such yarns, the impregnation of
reinforcement fibers by matrix could be more difficult4.
The main consequences of these results is that, even if only just one type of yarn is used to
weave the fabric, due to the non-equivalent weaving damage effect on warp, binding and weft
yarns, their tensile behavior once inside the woven fabric will not be the same. It is therefore

important to perform tensile tests on yarns extracted from the fabrics to estimate the influence
of weaving in order to take into account this aspect in models describing the yarn tensile
behavior.
Modeling and discussion
The goal of this part is to propose a model to describe correctly the GFPP stress-strain tensile
behavior and to identify the influence of specimen length, strain rate and weaving damage on
parameters of this model. Few results can be found in the literature concerning this topic.
Torun4 has proposed a model to estimate Young’s modulus of commingled yarns, still there
are not known results to describe the whole stress-strain behavior.
First goal is to explain the initial nonlinear behavior of commingled yarns. Main contribution
to the yarn’s tensile behavior can be attributed to GF fibers; their modulus being much higher
than PP fibers modulus. As detailed in section 2.a, the commingled yarn structure is
composed of nips and opened areas. In opened areas, some fibers are initially almost straight,
while others are buckled. Different mechanisms can explain the initial nonlinear behavior.
Torun 4, made the assumption that all GF overdelivery is consumed in nips and therefore that
glass fibers are straight in opened areas, whereas PP overdelivery is consumed in both nips
and opened areas. It can be supposed that initially, it is not quite true and that glass fibers can
be slightly buckled in opened areas. Moreover, a fiber buckled in a particular opened area can
possibly be straight in another opened area, as schematized in Figure 17. If a fiber starts to
undergo significant tension in a particular portion of its length (where the fiber is straight) but
is not loaded in another one (where the fiber is buckled), it can be supposed that the fiber
could move relatively to the others to equilibrate the carried load on its whole length. Of
course this mechanism will be strongly linked to the intermingling of fibers in nips and to the

friction between fibers. Moreover, structure of the commingled yarn in nips is supposed
similar to the one observed in twisted yarns4. Results presented by Chudoba
27 tend to show
that once twisted, yarns have a more extended initial nonlinear behavior than untwisted. This
can be attributed to the reorganization of the twisted yarn structure when subjected to tensile
loading (decrease of yarn section and increase of yarn packing factor). Cyclic testing results
highlighting a permanent deformation after the first loading and a significant decrease of
nonlinear behavior in the next loadings tend to confirm these phenomena of reorganization of
the yarn structure.
Fig. 17. Simplified representation of the yarn structure
A model describing the influence of delayed activation of fibers in the case of rovings has
been proposed and validated by Chudoba32
. The slack of filament < being noted =>, when a
roving of length ? is subjected to a displacement @ the deformation of fiber < can be written32
:
�> � A�BC�DBC (1)
With E � F� the yarn deformation. Assuming a linear-elastic and brittle response of fibers of
modulus G and a large number of fibers in the roving, the stress-strain behavior can be
expressed by:
HBIEJ � G K A�B�DBB LMBI=J (2)
With MBI=J the cumulative density of delayed activation that can be extracted from
experimental results by constructing the normalized derivative of the stress-strain curve.
It is interesting to see if this model can also describe the tensile behavior of commingled yarns
since the different reorganization mechanisms of yarn structure presented above can be
supposed to act like as slack of fibers. To do so, it is necessary to evaluate the cumulative
density MBI=J in the case of commingled yarns. It is clear that predicting the shape of this
curve from direct analyze of the very disordered GFPP yarn structure is a very difficult issue.
For the sake of simplicity, a predefined shape of curve is proposed and fitted on the
experimental curve. Modulus of the commingled yarn is referred to as G��NN. Evaluation of
this parameter will be discussed in the next paragraph.
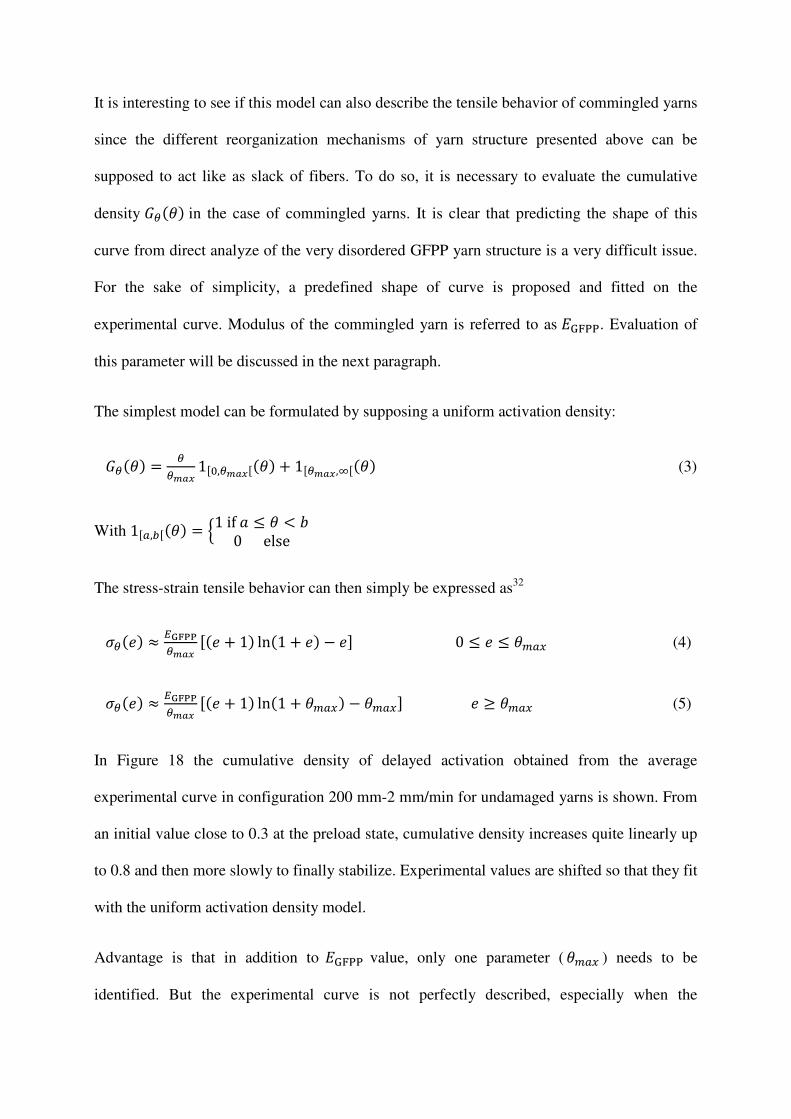
The simplest model can be formulated by supposing a uniform activation density:
MBI=J � BBOPQ 1[*,BOPQ[I=J + 1[BOPQ,T[I=J (3)
With 1[U,V[I=J � W1ifY ≤ = < \0else
The stress-strain tensile behavior can then simply be expressed as32
HBIEJ ≈ `abccBOPQ [IE + 1J lnI1 + EJ − E] 0 ≤ E ≤ =eUf (4)
HBIEJ ≈ `abccBOPQ [IE + 1J lnI1 + =eUfJ − =eUf] E ≥ =eUf (5)
In Figure 18 the cumulative density of delayed activation obtained from the average
experimental curve in configuration 200 mm-2 mm/min for undamaged yarns is shown. From
an initial value close to 0.3 at the preload state, cumulative density increases quite linearly up
to 0.8 and then more slowly to finally stabilize. Experimental values are shifted so that they fit
with the uniform activation density model.
Advantage is that in addition to G��NN value, only one parameter (=eUf ) needs to be
identified. But the experimental curve is not perfectly described, especially when the

cumulative density come close to 1 as seen in Figure 18. Still, the experimental and modeled
stress-strain curves (identified value =eUf � 0.008) are in quite good agreement (Figure 19).
Of course it is possible to better describe the cumulative density activation using for example
piecewise linear function32
.
Fig. 18. Cumulative density of delayed activation
Fig. 19. Model/experimental result comparison.
0
0.2
0.4
0.6
0.8
1
1.2
0 0.005 0.01 0.015
Cu
mu
lati
ve
de
nsi
ty o
f d
ela
ye
d
act
iva
tio
n
Strain
Uniform activation
density
Average GFPP tensile behavior
200mm-2mm/min
0
50
100
150
200
250
0 0.5 1
stre
ss M
Pa
strain %
experimental
model

As mentioned above, initial nonlinear behavior is only slightly influenced by both specimen
length and strain rate. Parameters identified on one testing configuration can be used on other
testing configuration just taking into account the slight variations of G��NN value with strain
rate and specimen length. Using Equation 3, initial value of the cumulative density of
activation is supposed null and therefore, the initial slope of the stress-strain curve is also null.
It seems appropriate to model results presented in section 3.b (tensile behavior of yarns
obtained after the commingling process) but a non-null initial modulus should be considered
for yarns that have been subjected to previous cyclic loadings and therefore possibly to yarns
after the weaving process.
A simple rule of mixture can give an estimation of the Young modulus G��NN of a GFPP yarn
in which all fibers would be parallel and perfectly aligned along the yarn direction. With a
modulus of 73 GPa for GF as identified with tensile tests and a modulus of 1.5 GPa for PP
(according to literature); given volume fraction values of GF and PP, the maximum modulus
GeUf ≈ 38GPa could be expected for such yarns. Actually, even if it can be supposed that
after the nonlinear behavior phase glass fibers are straight and aligned following the yarn
direction in opened areas, they remain intermingled in nips areas. G��NNis therefore less than
GeUf , as shown by experimental results highlighting an average modulus of 30 GPa (see
Table 2).
Torun4 has proposed a model to estimate Young modulus of commingled yarns. The
corresponding mechanical model is schematized in Figure 20.
Fig. 20. Mechanical model of GFPP yarn

In this model, assumption is made that glass fibers are straight in opened areas and structure
of the commingled yarn in nip areas is supposed similar to the one observed in twisted yarns.
Influence of PP on the behavior is neglected. The total length of the yarn is:
? � ?hijkjlmnjm + ?koi � I1 − pJ? + p? (6)
With p the degree of interlacing.
In nips, twisting of fibers is taken into account by introducing a function qIrJ (with r the
twist angle) which describes the loss of modulus due to twisting. stu is the glass fiber
material section in the yarn. Stiffness v of the commingled yarn is deduced using �w � �
wx + �wy
and its Young’s modulus is Gtuzz � w�{ with s the total material section in the yarn.
Therefore, the final expression of the Young modulus is:
G��NN ≈ `|}~�Df� x
�I�J��� (7)
r angle is obtained with4
r � ��%�� � ��D��abQ
� (8)
In the study of Torun4, assumption is made that all GF overdelivery has been consumed in
nips. But, as discussed earlier, part of the GF overdelivery can also be consumed in opened
area. Only the part consumed in nips, which will be noted ����koi should be taken into
account in Equation 8. Torun4 used qIrJ � ��%�IrJand obtained a value of G��NN only
slightly lower thanGeUf . The difference between experimental results and value obtained
using the model is explained by the influence of commingling damage. But, in our case,
observations on yarns after the commingling process (Figure 1(b)) have shown that only a

small number of fibers appeared to be broken. Moreover, small modifications of the model
could lead to a better approximation of the modulus:
-Especially for high twist angles, the ��%� model can underestimate significantly the
influence of twist33
.
-In twisted yarns, the twist angle = of a fiber depends on its radial
position33
:�Y�I=J � ���� , with � the radial position of the fiber in the yarn and ℎ the yarn
length for one turn. Models like the ��%� one are applied with angle � corresponding to the
twist angle of fibers at the most outer layer (surface twist angle) of the twisted yarns. This
angle is given by �Y�I�J � ���� , with R the yarn radius. The average fiber twist angle =eAU�
in the yarn is therefore less than� and is given by34
:
=eAU� � � + ��U�y� − �
�mk� (9)
Angle r calculated with Equation 8 corresponds in fact to the average twist angle of fibers
due to overdelivery i.e. to the =eAU� value. Angle used in Equation 7 shouldn’t therefore be r
but rather angle � calculated using Equation 9 with =eAU� � r.
Main difficulty comes from an accurate evaluation of parameters used in the model.
Calculation were made using p � 0.1 and ����koi � 1.5%. An average twist angle of30° is
obtained with Equation 8, corresponding to a surface twist angle� ≈ 42°. Few experimental
results investigating the decrease of modulus with such high angles are available, still
extrapolating average results presented by Rao33
, value qI�J ≈ 0.3 can be estimated. Using
Equation 7 a value of E��NN ≈ 31M�Y is obtained giving a good estimation of the
commingled yarns modulus.

From hypothesis of this model it can be supposed that scattering of GFPP yarn’s properties
shown in Figure 9(a) can be explained by the variability of yarn structure due to the
commingling process: the number, length and types of nips along the yarn length can vary
from one sample to the other leading to variations of p and ����koi values, and as a
consequence to a scattering of size of the initial nonlinear behavior and modulus.
The decrease of yarn section in opened areas during loading can be attributed to the alignment
of fibers along the yarn as they start to take load. In nips, twist of fibers will also leads to a
decrease of yarn section35
, which is experimentally confirmed in Figure 11. Results presented
in Figure 11 can be used to estimate the average decrease of yarn section but further work
would be necessary to investigate more precisely transverse behavior in nips and opened
areas. In meso-scale models, where yarns are modeled as a continuum, this transverse
behavior should be taken into account by considering a non-null longitudinal Poisson’s ratio.
No models that could allow estimating the commingled yarn’s breaking strength and failure
mechanisms have been found in the literature, but results and models are available for twisted
yarns33
and rovings36-38
. Results on twisted yarns show that, depending on the material, a low
yarn twist leads to an increase of breaking strength compared to an untwisted yarn, the
maximum strength being reached for angles close to 7°. This effect can be attributed to the
fragmentation process i.e. a fiber can break in the yarn but its fragments will continue to carry
load35
. When the angle is more important, typically more than 15°, yarn’s breaking strength
decreases compared to the one of untwisted yarns. Twist angle calculated in nip areas using
the model described above is greater than 15°. Therefore, neglecting the influence of PP, in
quasi-static loading conditions, GFPP yarns should break in the nip areas with a lower
breaking force than the GF roving one. In this sense, results presented in Figure 9(b) show

that yarns with an important modulus (so with a smaller number of nips or an average twist
angle in nips less than the average) are also those that have the highest breaking strength in
quasi-static loading conditions. Presence of nips results in the fact that deformation is not
homogeneous along the yarn length. Considering again the mechanical model described in
Figure 20, and using the same values of qI�J and p, if the commingled yarn is subjected to a
displacement speed @� , displacement speeds in the opened areas (subscript 1) and in nips
(subscript 2) are:
@�� � F� wywxDwy ≈ 0.73@� (10)
and
@�� � F� wxwxDwy ≈ 0.27@� (11)
Corresponding yarn’s strain rates in these zones are therefore:
E�� � F�x�x ≈ *.,;F�
*.+� ≈ 0.81E� (12)
and
E�� � F�y�y ≈ *.�;F�
*.�� ≈ 2.7E� (13)
In opened areas, as fibers are straight, fiber’s strain rate will be��� � E�� � 0.81E�. In nips,
strain rate for a fiber with twist angle = will be ���I=J � E����%�I=J33. Using the average twist
angle value of 30° calculated above, average fiber’s strain rate��� ≈ 2E� is obtained in nips.
Therefore, when E� is increased, breaking strength of GFPP increases more rapidly than the
one of GF, because, in nips areas where the GFPP yarn is the weakest, the local fiber’s strain
rate is more important than the global strain rate to which is subjected the yarn. When high
strain rates are reached, yarn could start to break preferentially in opened areas, where strain

rate is lower than in nips areas. As there is no twist in opened areas, fragmentation process
can possibly explain that the breaking force of GFPP becomes even greater than the one of
GF at high strain rates. The presence of PP could also play a role.
The model described above allows a good description of commingled yarn’s tensile behavior
up to linear-behavior part. In quasi-static loading conditions, it is possible in first
approximation to describe the full stress-strain curve of a particular GFPP yarn using the
previously proposed model and assuming a brittle failure of the yarn (see Figure 21(a)), load
being then taken up by PP. Still, the stress-strain curve peak is not well described and this
model is not adapted for high strain rates where a progressive loss of linearity can be observed
before yarn breaking.
It has been shown36-38
that roving’s tensile behavior can be described in first approximation
using Weibull model by:
HIEJ � GE × Ep���� ����O (14)
Where ? is the roving length, G is the fiber modulus and E* and � are respectively the scale
and shape parameters of the Weibull distribution. This expression is obtained under the
weakest link hypothesis based on the assumption that failure of fibers is due to the presence of
defects. With increasing fiber length?, the probability of presence of severe defects along the
fiber increases, leading to a decrease of its breaking stress.
It can be shown that, slightly modifying this model, it is possible to reproduce the average
GFPP yarn’s stress-strain tensile curve. The following expression is proposed:
HIEJ ≈ HBIEJEp���� ����O + Hzz �1 − Ep���� ����
O� (15)

Where HBIEJ is the previously identified model which describes stress-strain curve up to the
linear behavior. The second part of the equation describes the fact that load is taken up by PP
fibers when a GFPP yarn breaks. E* and � are linked to the breaking strain and to the
scattering of tensile properties of GFPP yarns. Parameters have been identified on results
obtained for undamaged yarns in testing configuration 200 mm - 2 mm/min Hzz �100MPa, E* � 0.0164 and � � 17) and allow a correct description of the full stress-strain
behavior as illustrated in Figure 21(b).
A B
Fig. 21. Model/experimental results comparison: a. Quasi-static behavior of a GFPP yarn; b.
Average tensile behavior, undamaged yarns 200 mm-2 mm/min
Assuming that E* and � do not depend on ?, the model explains the decrease of breaking
strength of approximately 7% between 200 mm and 500 mm specimen lengths, which is in
good agreement with experimental results obtained in quasi-static loading conditions. Of
course E* value will increase with strain rate and the values of E* and � will decrease for
yarns damaged by the weaving process since it leads to a decrease of tensile strength and a
0
50
100
150
200
250
300
350
400
450
0 0.5 1 1.5
stre
ss M
Pa
strain %
experimental
model
0
50
100
150
200
250
300
350
400
0 0.5 1 1.5 2 2.5
stre
ss M
Pa
strain %
experimental
model

more significant scattering of yarn’s tensile properties. Further work is necessary to identify
behavior of yarns once inside the fabric and particularly length ? that would have to be
considered in this case.
Conclusion
In this paper, a simple protocol to perform yarn tensile tests is proposed and validated. Results
obtained on commingled GFPP yarns highlight a nonlinear behavior. Influence of both
specimen length and strain rate on the yarn’s tensile behavior are investigated. A significant
increase of breaking strength with increasing strain rate is observed. Young modulus of GFPP
yarns is close to 30 GPa. It increases slightly with strain rate and decrease slightly with
specimen length. Tests performed on yarns extracted from a 3D fabric show the influence of
weaving on the stress-strain behavior of yarns: a significant decrease of breaking strength for
yarns in both weft and warp direction is highlighted. Weft yarns were found to be the most
damaged with also a decrease of Young modulus of 17%. The extent of nonlinear behavior is
slightly reduced on yarns extracted from the fabric compared to undamaged yarns. This can
be attributed to realignment of fibers within the yarns induced by cyclic tensile loadings
experienced by yarns during weaving. Using experimental results and taking into account the
particular structure of commingled yarns, a model is proposed to describe the GFPP yarn’s
tensile behavior. After identification of few parameters physically meaningful, the model
allows describing accurately the full stress-strain curve. Dependency of model parameters to
loading rate, specimen length and weaving damage is highlighted. Further work remains
necessary to identify the internal characteristic length relative to the behavior of yarns inside
the fabric and to investigate more precisely the transverse behavior of commingled yarns.
Acknowledgments

The research leading to these results has received funding from the European Union Seventh
Framework Programme (FP7/2007-2013) under grant agreement n° 263223.
References
1. Bernet N, Michaud V, Bourban PE, Manson JAE. Commingled yarn composites for the
rapid processing of complex shapes. Compos Part A 2001; 32: 1613-1626.
2. Hufenbach W, Böhm R, Thieme M, Winkler A, Mäder E, Rausch J, Schade M.
Polypropylene/glass fiber 3D-textile reinforced composites for automotive applications.
Mater Des 2011; 32: 1468-1476.
3. Svensson N, Shishoo R, Gilchrist M. Manufacturing of thermoplastic composites from
commingled yarns-A review. J Thermoplast Compos Mater 1998; 11: 22.
4. Torun AR. Advanced manufacturing technology for 3D profiles woven performs. PhD
Thesis. Techniche Universitat Dresden, Germany, 2011.
5. Guénon VA, Chou TW, Gillespie JW Jr. Toughness properties of a three-dimensional
carbon–epoxy composite. J Mater Sci 1989; 24: 4168–75.
6. Brandt J, Drechsler K, Arendts FJ. Mechanical performance of composites based on
various three-dimensional woven-fibre preforms. Compos Sci Technol 1996; 56: 381–6.
7. Thanomsilp C, Hogg PJ. Penetration impact resistance of hybrid composites based on
commingled yarns fabrics. Composi Sci Technol 2003; 63: 467-482.
8. Allaoui S, Hivet G, Soulat D, Wendling A, Ouagne P. Experimental preforming of highly
double curved shapes with a case corner using an interlock reinforcement. Int J Mater Form,
2014; 7(2):155-165.
9. Ten Thije RHW, Akkerman R. A multi-layer triangular membrane finite element for the
forming simulation of laminated composites. Compos Part A 2009; 40: 739–753.
10. Lightfoot JS, Wisnom MR, Potter K. Defects in woven preforms: Formation mechanisms
and the effects of laminate design and layup protocol. Compos Part A 2013 51: 99–107.
11. Cao J et al. Characterization of mechanical behavior of woven fabrics: Experimental
methods as benchmark results. Compos Part A 2008; 39: 1037-1053.
12. Durville D. Simulation of the mechanical behavior of woven fabrics at the scale of fibers,
Int J Mater Form 2010 vol. 3: 1241-1251.
13. Boisse P, Zouari B, Gasser A. A mesoscopic approach for the simulation of woven fibre
composite forming, Composi Sci Technol 2005; 65 (3-4): 429-436.

14. Badel P, Vidal-Sallé E, Maire E, Boisse P. Simulation and tomography analysis of textile
composite reinforcement deformation at the mesoscopic scale. Composi Sci Technol 2008; 68
(12): 2433-2440.
15. Badel P, Gauthier S, Vidal-Sallé E, Boisse P. Rate constitutive equations for
computational analyses of textile composite reinforcement mechanical behavior during
forming. Compos part A 2009; 40 (8): 997-1007.
16. Hivet G, Boisse P. Consistent 3D geometrical model of fabric elementary cell.
Application to a meshing preprocessor for 3D finite element analysis. Finite Elem Anal Des
2005; 4: 25-49.
17. Tavana R, Shaikhzadeh Najar S, Tahaye Abadi M, Sedighi M. Meso/macro-scale finite
element model for forming process of woven fabric reinforcements. J Compos Mater 2012;
47(17): 2075-2085.
18. Lee L, Rudov-Clark S, Mouritz AP, Bannister MK, Herszberg I. Effect of weaving
damage on the tensile properties of three-dimensional woven composites. Compos Struct
2002; 57: 405-413.
19. Kravaev P, Stolyarov O, Seide G, Gries T. Influence of process parameters on filament
distribution and blending quality in commingled yarns used for thermoplastic composites. J
Thermoplast Compos Mater 2012; 27: 350-363.
20. Alagirusamy R, Ogale V. Development and characterization of GF/PET, GF/Nylon, and
GF/PP commingled yarns for thermoplastic composites. J Thermoplast Compos Mater 2005;
18: 269-285.
21. Ogale V, Alagirusamy R. Tensile properties of GF-polyester, GF-nylon, and GF-
polypropylene commingled yarns. J Text Inst 2007; Vol. 98 No. 1: 37-45.
22. Fazeli M, Kleicke R, Cherif C, Van Paepegem W. High-performance lightweight
multifunctional composites based on 3D-shaped multilayered woven fabrics. Proceedings of
the 4th
world conference on 3D fabrics and their applications, RWTH Aachen, Germany, 10-
11 September 2012; pp. 1-12.
23. Saad N. Geometrical modelling and characterization of 3D warp interlock composites and
their on-line structural health monitoring using flexible textile sensors. PhD thesis. Université
des Sciences et Technologies, Lille 1, France, 2011.
24. Van West BP, Byron pipes R, Advani SG. The consolidation of commingled
thermoplastic fabrics. Polym Compos 1991; Vol. 12, No. 6.
25. ISO 3341. Textile glass--Yarns--Determination of breaking force and breaking elongation.
2002.
26. Wang Y, Xia Y. The effects of strain rate on the mechanical behavior of Kevlar fibre
bundles: an experimental and theoretical study. Compos Part A 1998; 29A: 1411-1415.

27. Chudoba R, Vorechovsky M, Eckers V, Gries T. Effect of twist, fineness, loading rate and
length on tensile behavior of multifilament yarns (A multivariate study). Text Res J 2007 Vol
77(11): 880-891.
28. Zhou Y, Wang Y, Xia Y, Jeelani S. Tensile behavior of carbon fiber bundles at different
strain rates. Mater Lett 2010; 64: 246-248.
29. Ghosh A, Ishtiaque SM, Rengasamy RS, Mal P, Patnaik A. Spun yarn strength as a
function of gauge length and extension rate: a critical review. Journal of textile and apparel,
technology and management 2004 Volume 4, Issue 2.
30. Realff ML, Seo M, Boyce MC, Schwartz P, Backer S. Mechanical properties of fabrics
woven from yarns produced by different spinning technologies: yarn failure as a function of
gauge length. Text Res J 1991; 61: 517-530.
31. Bretagne N, Valle V, Dupré JC. Development of the marks tracking technique for strain
field and volume variation measurements. NDT&E International 2005; 38 (4): 290-298.
32. Chudoba R, Vorechovsky M, Konrad M. I. Random properties within the cross-section
and size effect. Int J Solids Struct 2006; 43: 413-434.
33. Rao Y, Farris RJ. A modeling and experimental study of the influence of twist on the
mechanical properties of high-performance fiber yarns. J Appl Polym Sci 2000 Vol. 77: 1938-
1949.
34. Madsen B, Hoffmeyer P, Thomsen AB et al. Hemp yarn reinforced composites-I. Yarn
characteristics. Compos Part A 2007; 38: 2194-2203.
35. Pan N. Prediction of statistical strengths of twisted fibre structures. J Mater Sci 1993; 28:
6107-6114.
36. Weibull W. A statistical distribution of wide applicability. J Appl Mech-T ASME,
September 1951: 293-297.
37. Chi Z, Chou TW, Shen G. Determination of single fibre strength distribution from fibre
bundle testings. J Mater Sci 1984; 19: 3319-3324.
38. Van der Zwaag S. The concept of filament strength and the weibull modulus. J Test Eval
Sept. 1989; Vol.17, No. 5: 292-298.
