experimental evaluation of lubrication characteristics of ... ·...
TRANSCRIPT

applied sciences
Article
Experimental Evaluation of LubricationCharacteristics of a New Type Oil-Film Bearing OilUsing Multi-Sensor System
Jianmei Wang 1,*, Min Cai 1, Reza Malekian 2, Yanan Zhang 1 and Zhixiong Li 3,4,*1 School of Mechanical Engineering, Taiyuan University of Science and Technology, Taiyuan 030024, China;
[email protected] (M.C.); [email protected] (Y.Z.)2 Department of Electrical, Electronic & Computer Engineering, University of Pretoria, Pretoria 0002,
South Africa; [email protected] School of Mechatronic Engineering, China University of Mining Technology, Xuzhou 221116, China4 School of Manufacturing & Mechanical Engineering, University of New South Wales (UNSW),
Sydney 2200, Australia* Correspondence: [email protected] (J.W.); [email protected] (Z.L.);
Tel.: +86-351-6998313 (J.W.); +61-0451-069-970 (Z.L.)
Academic Editor: César M. A. VasquesReceived: 4 November 2016; Accepted: 13 December 2016; Published: 26 December 2016
Abstract: In order to evaluate the operating performance of a new type oil-film bearing oil S220,a new test bearing was designed based on oil-film bearing test rig. The operating temperature ofS220 was tested through the thermocouples installed on a test bearing; the operating oil-film pressurewas tested through pressure transducers; and the operating oil-film thickness was tested throughdisplacement transducers. Meanwhile, M220 was also tested as a comparison, and both oils arebased on mineral oil. The results showed that all property indexes of the test rig can meet thespecified requirements and can guarantee the performance test of oil-film bearing oil; the operatingtemperature of S220 is generally equal to that of M220, and both have the same operating stability.The temperature property conforms to Formula (1) and the operating temperature under differentload cases can be predicted. Although oil-film pressure of M220 is a little more stable, the oil-filmpressure of S220 is similar to that of M220. Moreover, both have the similar oil-film thickness, andthe oil-film thickness of S220 is slightly smaller than that of M220, especially at the beginning ofoperation. Ultimately, oil S220 is evaluated to be suitable for actual engineering application.
Keywords: oil-film bearing oil; oil-film bearing test rig; operating temperature; operating performances
1. Introduction
Oil-film bearing oil is mainly used for the lubrication of oil-film bearing in a strip and wire mill [1].The property of oil mainly depends on the quality of base oil and additives, as well as the optimizationof compound formula. If the oil is not qualified, it will not only affect the quality of steel plate andlead to economic loss, but might also result in a severe accident. Research shows that 75% accidents insteel mills result from the failure of lubricating oil [2]. Generally, there are four evaluation methods toevaluate the performances of oil-film bearing oil, which include physical and chemical monitoring,simulation test, bench test, and running test [3].
Physical and chemical monitoring is the most basic evaluation method to check whether thephysical and chemical indexes of oil-film bearing oil can meet the standard or not, the commonly usedanalytical methods are spectral analysis [4,5], differential scanning calorimetry [6], and the chemicalapproach [7]. However, these methods can hardly reflect the lubrication status of bearing friction pairs.Simulation test is used to simulate the working status and condition of devices in the laboratory. It can
Appl. Sci. 2017, 7, 28; doi:10.3390/app7010028 www.mdpi.com/journal/applsci

Appl. Sci. 2017, 7, 28 2 of 12
only be applied to some simple operation conditions, but it cannot reflect the effects of complicatedconditions on the operating performances of oil-film bearing. Test methods mainly include four-balltest [8,9] and FZG (Forschungsstelle fur Zahnrader und Getriebebau) gear test [10], etc. The benchtest is the most economical and effective. Under all comprehensive rigorous experimental conditions,bench testing can realize the operation under different conditions of devices and can intuitively reflectthe operating performances of oil. Testing oil-film bearing oil is mainly done on the oil-film bearing testrig [11–13]. The final procedure of oil development is the running test, and the test for oil-film bearingoil is required to be conducted on an on-site rolling mill [14,15], but too many influential factors needto be considered, and even the normal production of enterprise will be influenced or interrupted, so itis difficult to implement this method.
Bench testing is regarded as the most economical and ideal evaluation method. Some experts madecontributions to bench testing. Tadashi Katafuchi evaluated the low-viscosity base oil [3], F.P. Britostudied the effect of heavy loads on lubrication performance [16]. P.G. Morton studied the stability ofbearings [17]. J. Bouyer measured the start-up torque of bearings under different pressure [18].Sergei B. Glavatskih evaluated sensor performances under various operating conditions [19].Furthermore, Gregory F. Simmons and Sergei B. Glavatskih did some work on synthetic lubricants [20],but their test rig did not cover the medium and heavy load range. Although these contributionsreferred to bench testing of lubricating oil, they did not provide a method to evaluate oil-film bearingoil comprehensively. In this study, bench testing was done on a large-scale oil-film bearing test rig,and the test rig can simulate the actual rolling process covering a load range from light loads toheavy loads, i.e., the external hydraulic pressure is from 0 MPa to 25 MPa, and the maximum loadin this study is 12 MPa. Furthermore, the distribution of transducers in the test rig was based ontheoretical calculation results of oil-film pressure, oil-film thickness, and oil-film temperature, andthe positioning of transducers was determined to be in accordance with mesh subdivision of actualoil-film performances [2,21]. The test on oil-film bearing oil of different brands was compared, andthe oil-film temperature, oil-film pressure, and oil-film thickness were analyzed respectively. Finally,a comprehensive evaluation on operating performances of oil S220 was made after on-line testing forthree months.
2. Experimental Apparatus and Method
Bench test of oil-film bearing oil was conducted on large-scale mill oil-film bearing test rig.This test rig consists of a mechanical system, hydrodynamic lubrication system, hydrostatic lubricationsystem, thin-oil lubrication system used for the accelerator, hydraulic loading system, electrical controlsystem, pneumatic control system, and data acquisition system. Its mechanical system is composed ofa hydrostatic-dynamic oil-film bearing subsystem and experimental hydrodynamic oil-film bearingsubsystem. The operating performances of oil-film bearing oil can be monitored on-line. The schematicdiagram of oil-film bearing test rig is shown in Figure 1 [22].
Appl. Sci. 2016, 6, 445 2 of 12
laboratory. It can only be applied to some simple operation conditions, but it cannot reflect the
effects of complicated conditions on the operating performances of oil‐film bearing. Test methods
mainly include four‐ball test [8,9] and FZG (Forschungsstelle fur Zahnrader und Getriebebau) gear
test [10], etc. The bench test is the most economical and effective. Under all comprehensive rigorous
experimental conditions, bench testing can realize the operation under different conditions of
devices and can intuitively reflect the operating performances of oil. Testing oil‐film bearing oil is
mainly done on the oil‐film bearing test rig [11–13]. The final procedure of oil development is the
running test, and the test for oil‐film bearing oil is required to be conducted on an on‐site rolling mill
[14,15], but too many influential factors need to be considered, and even the normal production of
enterprise will be influenced or interrupted, so it is difficult to implement this method.
Bench testing is regarded as the most economical and ideal evaluation method. Some experts
made contributions to bench testing. Tadashi Katafuchi evaluated the low‐viscosity base oil [3], F.P.
Brito studied the effect of heavy loads on lubrication performance [16]. P.G. Morton studied the
stability of bearings [17]. J. Bouyer measured the start‐up torque of bearings under different
pressure [18]. Sergei B. Glavatskih evaluated sensor performances under various operating
conditions [19]. Furthermore, Gregory F. Simmons and Sergei B. Glavatskih did some work on
synthetic lubricants [20], but their test rig did not cover the medium and heavy load range.
Although these contributions referred to bench testing of lubricating oil, they did not provide a
method to evaluate oil‐film bearing oil comprehensively. In this study, bench testing was done on a
large‐scale oil‐film bearing test rig, and the test rig can simulate the actual rolling process covering a
load range from light loads to heavy loads, i.e., the external hydraulic pressure is from 0 MPa to 25
MPa, and the maximum load in this study is 12 MPa. Furthermore, the distribution of transducers in
the test rig was based on theoretical calculation results of oil‐film pressure, oil‐film thickness, and
oil‐film temperature, and the positioning of transducers was determined to be in accordance with
mesh subdivision of actual oil‐film performances [2,21]. The test on oil‐film bearing oil of different
brands was compared, and the oil‐film temperature, oil‐film pressure, and oil‐film thickness were
analyzed respectively. Finally, a comprehensive evaluation on operating performances of oil S220
was made after on‐line testing for three months.
2. Experimental Apparatus and Method
Bench test of oil‐film bearing oil was conducted on large‐scale mill oil‐film bearing test rig. This
test rig consists of a mechanical system, hydrodynamic lubrication system, hydrostatic lubrication
system, thin‐oil lubrication system used for the accelerator, hydraulic loading system, electrical
control system, pneumatic control system, and data acquisition system. Its mechanical system is
composed of a hydrostatic‐dynamic oil‐film bearing subsystem and experimental hydrodynamic
oil‐film bearing subsystem. The operating performances of oil‐film bearing oil can be monitored
on‐line. The schematic diagram of oil‐film bearing test rig is shown in Figure 1 [22].
Figure 1. Schematic diagram of oil‐film bearing test rig.
Several kinds of transducers have been installed in oil‐film bearing test rig. Figure 2 is the
distribution of different transducers on the test bearing. There are 3 pressure transducers
Figure 1. Schematic diagram of oil-film bearing test rig.

Appl. Sci. 2017, 7, 28 3 of 12
Several kinds of transducers have been installed in oil-film bearing test rig. Figure 2 isthe distribution of different transducers on the test bearing. There are 3 pressure transducers(HYDAC-ETS300, HYDAC, Bremen, Germany) used for measuring oil-film pressure, 6 displacementtransducers (BENTLY3300X, BENTLY, Exton, PA, USA) for oil-film thickness, 21 thermocouples(HYDAC-ETS300, HYDAC, Bremen, Germany) for oil-film temperature, and 1 torque transducer(ZRN503) (ZRN503, Beijing Ruineng Instrument Technology Co., Ltd., Beijing, China) for power ortorque measurement in Figure 1. The transducers are distributed based on theoretical calculationresults of oil-film pressure, oil-film thickness, and oil-film temperature, and the positions of transducersare determined in accordance with mesh subdivision of actual oil-film performance.
Appl. Sci. 2016, 6, 445 3 of 12
(HYDAC‐ETS300, HYDAC, Bremen, Germany) used for measuring oil‐film pressure, 6
displacement transducers (BENTLY3300X, BENTLY, Exton, PA, USA) for oil‐film thickness, 21
thermocouples (HYDAC‐ETS300, HYDAC, Bremen, Germany) for oil‐film temperature, and 1
torque transducer (ZRN503) (ZRN503, Beijing Ruineng Instrument Technology Co., Ltd., Beijing,
China) for power or torque measurement in Figure 1. The transducers are distributed based on
theoretical calculation results of oil‐film pressure, oil‐film thickness, and oil‐film temperature, and
the positions of transducers are determined in accordance with mesh subdivision of actual oil‐film
performance.
Figure 2. Distribution of different transducers on the test bearing.
Physical signals from these transducers will be translated into digital signal via PLC
(Programmable Logic Controller), and the digital signal will be displayed on IPC (Industrial
Personal Computer) (610L, Advantech Co., Ltd., Shanghai, China). So the operating performances
of oil‐film bearing (Taiyuan Heavy Industries Co., Ltd., Taiyuan, China) can be monitored on‐line.
The main structural parameters of test bearing are shown in Table 1. When the oil supply is
sufficient and the system is preheated, the instruction from upper computer will be transmitted to
PLC, thereafter, the DC (Direct Current) electromotor (24‐250‐42, Xiʹan Motor Co., Ltd., Xiʹan, China)
and hydraulic loading system will be started. When the test rig operates at the preset speed and load,
the transducers begin to collect data of the oil film. In order to analyze the operating performances of
oil‐film bearing oil, six typical load cases were set, as shown in Table 2.
Table 1. Main structure parameters of the test bearing.
Structure Parameters Value (mm)
Bearing diameter D 220
Bearing length L 178
Radial clearance c 0.10
Table 2. Six typical load case combinations for testing.
Load Case 1 2 3 4 5 6
Revolving speed (rpm) 100 150 150 200 300 300
Hydraulic load (MPa) 6.0 6.0 12.0 6.0 6.0 12.0
3. Results and Discussion
3.1. Systematic Performances
The monitoring system of the test rig can directly reflect the accuracy and reliability of oil [23].
Table 3 shows the fundamental parameters of both oils. Actual rotational speed of motor, outlet oil
pressure of lubrication station, oil temperature of lubrication station, and inlet oil pressure of
Figure 2. Distribution of different transducers on the test bearing.
Physical signals from these transducers will be translated into digital signal via PLC(Programmable Logic Controller), and the digital signal will be displayed on IPC (Industrial PersonalComputer) (610L, Advantech Co., Ltd., Shanghai, China). So the operating performances of oil-filmbearing (Taiyuan Heavy Industries Co., Ltd., Taiyuan, China) can be monitored on-line. The mainstructural parameters of test bearing are shown in Table 1. When the oil supply is sufficient and thesystem is preheated, the instruction from upper computer will be transmitted to PLC, thereafter, theDC (Direct Current) electromotor (24-250-42, Xi'an Motor Co., Ltd., Xi'an, China) and hydraulic loadingsystem will be started. When the test rig operates at the preset speed and load, the transducers beginto collect data of the oil film. In order to analyze the operating performances of oil-film bearing oil,six typical load cases were set, as shown in Table 2.
Table 1. Main structure parameters of the test bearing.
Structure Parameters Value (mm)
Bearing diameter D 220Bearing length L 178
Radial clearance c 0.10
Table 2. Six typical load case combinations for testing.
Load Case 1 2 3 4 5 6
Revolving speed (rpm) 100 150 150 200 300 300Hydraulic load (MPa) 6.0 6.0 12.0 6.0 6.0 12.0
3. Results and Discussion
3.1. Systematic Performances
The monitoring system of the test rig can directly reflect the accuracy and reliability of oil [23].Table 3 shows the fundamental parameters of both oils. Actual rotational speed of motor, outlet oil
Appl. Sci. 2017, 7, 28 4 of 12
pressure of lubrication station, oil temperature of lubrication station, and inlet oil pressure of bearingeffectively reflect the systematic properties of test rig. Table 4 gives the main parameters of systematicperformances. As shown in Table 4, the systematic performances of the test rig under the lubricationof S220 under different load cases are approximately equivalent to that under the lubrication of M220,and each index generally meets the requirement of systematic operation.
Table 3. Fundamental parameters of both oils.
Viscosity Grade 220
40 ◦C Viscosity (mm2/s) 219.3100 ◦C Viscosity (mm2/s) 25.38
Viscosity index 147Flash point (◦C) 248Pour point (◦C) −48
Table 4. Systematic performances under different load cases.
Oil Load Case(rpm-MPa)
ActualRotational
Speed of Motor(rpm)
Inlet OilPressure of
Bearing (MPa)
Outlet OilPressure ofLubrication
Station (MPa)
Outlet OilTemperature of
LubricationStation (◦C)
MaximumRise of Oil
Temperature(◦C)
HighestTemperature
in BearingBlock (◦C)
M220
100-6 98.63~100.95 0.10~0.12 0.376~0.406 34.64~47.60 18.91 43.80150-6 148.93~151.00 0.10~0.13 0.383~0.407 37.71~49.69 20.04 49.40150-12 148.62~151.18 0.10~0.12 0.373~0.405 38.80~47.55 14.69 48.70200-6 198.97~200.81 0.11~0.12 0.377~0.412 36.15~51.46 23.55 53.00300-6 299.26~300.66 0.10~0.13 0.384~0.401 40.43~42.76 16.69 49.00300-12 298.83~301.21 0.10~0.11 0.392~0.403 39.53~40.78 10.92 45.20
S220
100-6 98.75~101.14 0.10~0.13 0.394~0.398 37.14~45.52 16.85 44.60150-6 98.39~100.95 0.10~0.12 0.375~0.408 37.23~49.48 21.94 50.30150-12 148.86~151.18 0.10~0.13 0.380~0.408 40.31~46.61 19.87 50.30200-6 199.10~200.81 0.10~0.13 0.380~0.406 36.77~47.92 24.99 51.80300-6 299.07~300.60 0.10~0.12 0.375~0.412 36.67~40.57 22.35 48.50300-12 299.01~300.72 0.10~0.12 0.381~0.399 38.18~39.90 13.04 44.00
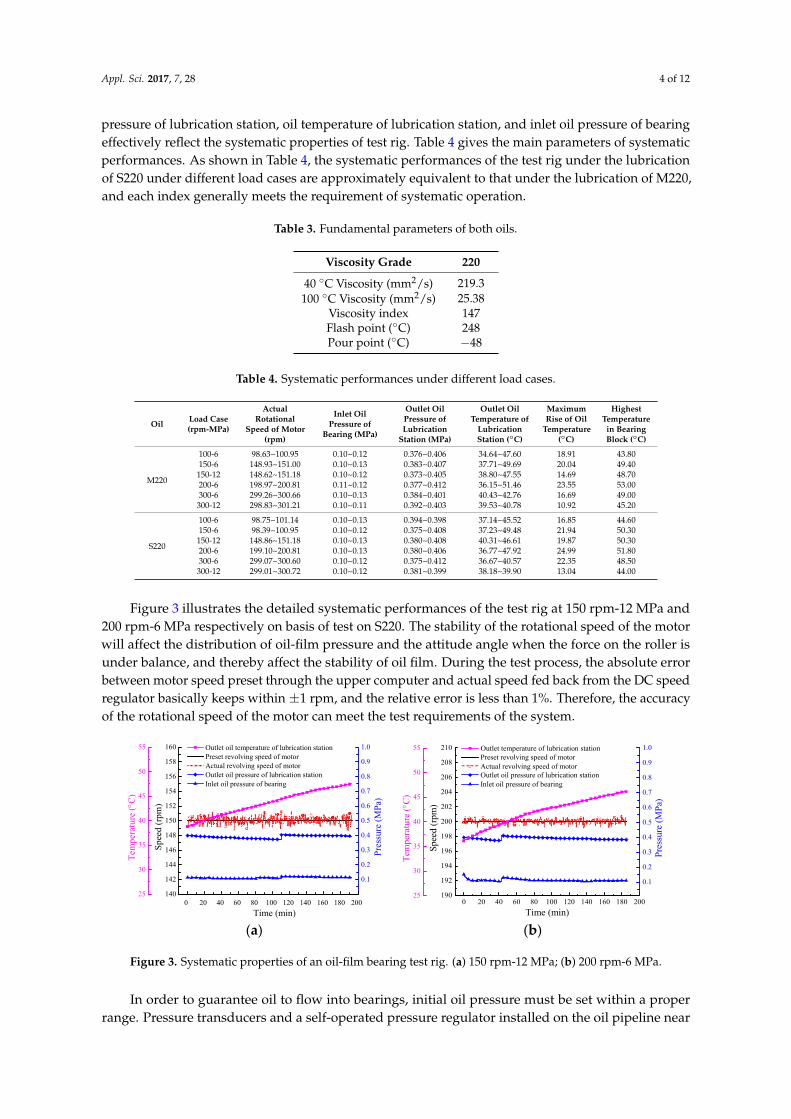
Figure 3 illustrates the detailed systematic performances of the test rig at 150 rpm-12 MPa and200 rpm-6 MPa respectively on basis of test on S220. The stability of the rotational speed of the motorwill affect the distribution of oil-film pressure and the attitude angle when the force on the roller isunder balance, and thereby affect the stability of oil film. During the test process, the absolute errorbetween motor speed preset through the upper computer and actual speed fed back from the DC speedregulator basically keeps within ±1 rpm, and the relative error is less than 1%. Therefore, the accuracyof the rotational speed of the motor can meet the test requirements of the system.
Appl. Sci. 2016, 6, 445 4 of 12
bearing effectively reflect the systematic properties of test rig. Table 4 gives the main parameters of
systematic performances. As shown in Table 4, the systematic performances of the test rig under the
lubrication of S220 under different load cases are approximately equivalent to that under the
lubrication of M220, and each index generally meets the requirement of systematic operation.
Table 3. Fundamental parameters of both oils.
Viscosity Grade 220
40 °C Viscosity (mm2/s) 219.3
100 °C Viscosity (mm2/s) 25.38
Viscosity index 147
Flash point (°C) 248
Pour point (°C) −48
Table 4. Systematic performances under different load cases.
Oil Load Case
(rpm‐MPa)
Actual Rotational
Speed of Motor
(rpm)
Inlet Oil
Pressure of
Bearing (MPa)
Outlet Oil
Pressure of
Lubrication
Station (MPa)
Outlet Oil
Temperature
of Lubrication
Station (°C)
Maximum
Rise of Oil
Temperature
(°C)
Highest
Temperature in
Bearing Block
(°C)
M220
100‐6 98.63~100.95 0.10~0.12 0.376~0.406 34.64~47.60 18.91 43.80
150‐6 148.93~151.00 0.10~0.13 0.383~0.407 37.71~49.69 20.04 49.40
150‐12 148.62~151.18 0.10~0.12 0.373~0.405 38.80~47.55 14.69 48.70
200‐6 198.97~200.81 0.11~0.12 0.377~0.412 36.15~51.46 23.55 53.00
300‐6 299.26~300.66 0.10~0.13 0.384~0.401 40.43~42.76 16.69 49.00
300‐12 298.83~301.21 0.10~0.11 0.392~0.403 39.53~40.78 10.92 45.20
S220
100‐6 98.75~101.14 0.10~0.13 0.394~0.398 37.14~45.52 16.85 44.60
150‐6 98.39~100.95 0.10~0.12 0.375~0.408 37.23~49.48 21.94 50.30
150‐12 148.86~151.18 0.10~0.13 0.380~0.408 40.31~46.61 19.87 50.30
200‐6 199.10~200.81 0.10~0.13 0.380~0.406 36.77~47.92 24.99 51.80
300‐6 299.07~300.60 0.10~0.12 0.375~0.412 36.67~40.57 22.35 48.50
300‐12 299.01~300.72 0.10~0.12 0.381~0.399 38.18~39.90 13.04 44.00
Figure 3 illustrates the detailed systematic performances of the test rig at 150 rpm‐12 MPa and
200 rpm‐6 MPa respectively on basis of test on S220. The stability of the rotational speed of the
motor will affect the distribution of oil‐film pressure and the attitude angle when the force on the
roller is under balance, and thereby affect the stability of oil film. During the test process, the
absolute error between motor speed preset through the upper computer and actual speed fed back
from the DC speed regulator basically keeps within ±1 rpm, and the relative error is less than 1%.
Therefore, the accuracy of the rotational speed of the motor can meet the test requirements of the
system.
140
142
144
146
148
150
152
154
156
158
160
Spe
ed (
rpm
)
0.1
0.2
0.3
0.4
0.5
0.6
0.7
0.8
0.9
1.0
Pre
ssur
e (M
Pa)
0 20 40 60 80 100 120 140 160 180 20025
30
35
40
45
50
55
Outlet oil temperature of lubrication station Preset revolving speed of motor Actual revolving speed of motor Outlet oil pressure of lubrication station Inlet oil pressure of bearing
Tem
pera
ture
(C
)
Time (min)0 20 40 60 80 100 120 140 160 180 200
190
192
194
196
198
200
202
204
206
208
210 Preset revolving speed of motor Actual revolving speed of motor
Spe
ed (
rpm
)
Time (min)
0.1
0.2
0.3
0.4
0.5
0.6
0.7
0.8
0.9
1.0
Outlet oil pressure of lubrication station Inlet oil pressure of bearing
Pres
sure
(M
Pa)
25
30
35
40
45
50
55 Outlet temperature of lubrication station
Tem
pera
ture
(C
)
(a) (b)
Figure 3. Systematic properties of an oil‐film bearing test rig. (a) 150 rpm‐12 MPa; (b) 200 rpm‐6 MPa.
In order to guarantee oil to flow into bearings, initial oil pressure must be set within a proper
range. Pressure transducers and a self‐operated pressure regulator installed on the oil pipeline near
the entrance to bearings are used to monitor and regulate inlet oil pressure of bearings. As shown in
Figure 3. Systematic properties of an oil-film bearing test rig. (a) 150 rpm-12 MPa; (b) 200 rpm-6 MPa.
In order to guarantee oil to flow into bearings, initial oil pressure must be set within a properrange. Pressure transducers and a self-operated pressure regulator installed on the oil pipeline near
Appl. Sci. 2017, 7, 28 5 of 12
the entrance to bearings are used to monitor and regulate inlet oil pressure of bearings. As shown inFigure 3, the pressure of lubrication station is kept within 0.38~0.40 MPa. Actual inlet oil pressure ofbearings is kept within 0.1~0.12 MPa, which is within the required range of the preset pressure.
High temperature will lead to low viscosity and decrease load-carrying capacity of bearings.In order to guarantee the operation safety of bearings, the limit on the outlet oil temperature of lubricationstation must be set. Figure 3 shows that outlet oil temperature of the lubrication station during the testprocess is kept within 39~50 ◦C, which conforms to the requirement of the preset temperature.
As known from the above analysis, various systematic performances of the oil-film bearing testrig meet the test requirements: the relative error of motor speed is less than 1%, the rolling force keepsconstant, and the temperature of the lubrication station and inlet oil temperature of bearing are withinthe specified range. The systematic properties of the oil-film bearing test rig are relatively stable, andthe test rig can guarantee the normal test for oil-film bearing oil.
3.2. Oil-Film Temperature
3.2.1. Oil-Film Temperature of S220 and M220
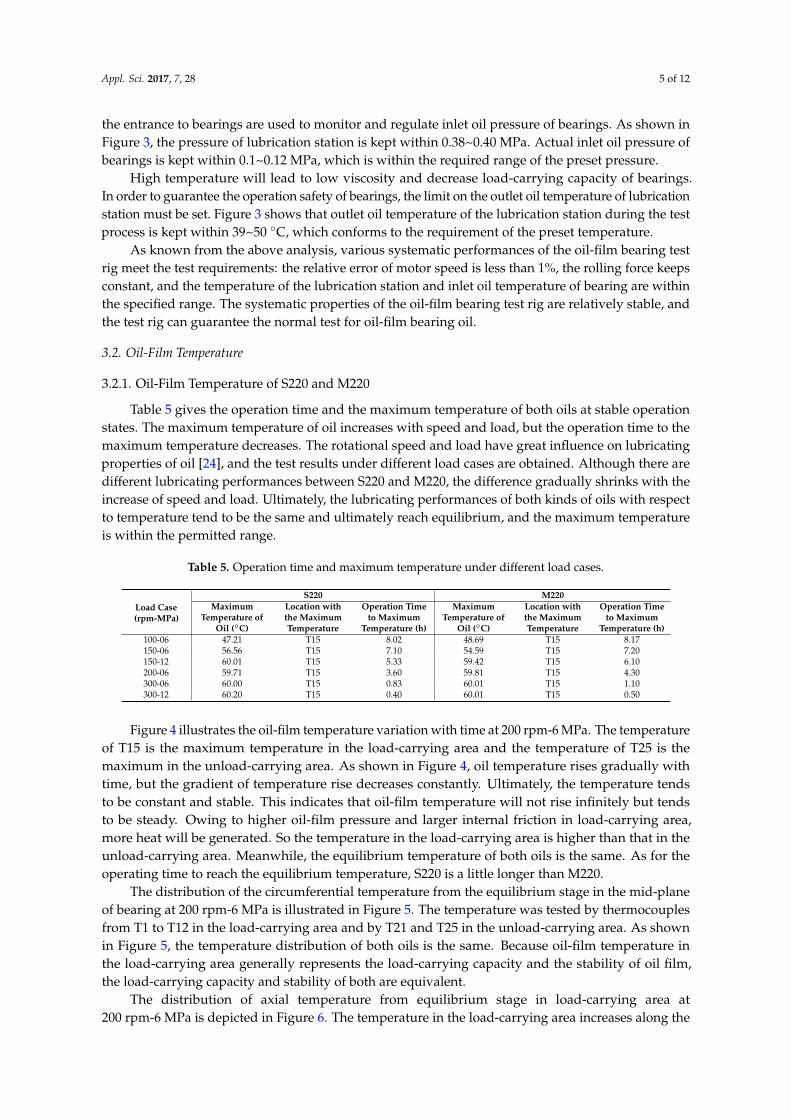
Table 5 gives the operation time and the maximum temperature of both oils at stable operationstates. The maximum temperature of oil increases with speed and load, but the operation time to themaximum temperature decreases. The rotational speed and load have great influence on lubricatingproperties of oil [24], and the test results under different load cases are obtained. Although there aredifferent lubricating performances between S220 and M220, the difference gradually shrinks with theincrease of speed and load. Ultimately, the lubricating performances of both kinds of oils with respectto temperature tend to be the same and ultimately reach equilibrium, and the maximum temperatureis within the permitted range.
Table 5. Operation time and maximum temperature under different load cases.
Load Case(rpm-MPa)
S220 M220Maximum
Temperature ofOil (◦C)
Location withthe MaximumTemperature
Operation Timeto Maximum
Temperature (h)
MaximumTemperature of
Oil (◦C)
Location withthe MaximumTemperature
Operation Timeto Maximum
Temperature (h)100-06 47.21 T15 8.02 48.69 T15 8.17150-06 56.56 T15 7.10 54.59 T15 7.20150-12 60.01 T15 5.33 59.42 T15 6.10200-06 59.71 T15 3.60 59.81 T15 4.30300-06 60.00 T15 0.83 60.01 T15 1.10300-12 60.20 T15 0.40 60.01 T15 0.50
Figure 4 illustrates the oil-film temperature variation with time at 200 rpm-6 MPa. The temperatureof T15 is the maximum temperature in the load-carrying area and the temperature of T25 is themaximum in the unload-carrying area. As shown in Figure 4, oil temperature rises gradually withtime, but the gradient of temperature rise decreases constantly. Ultimately, the temperature tendsto be constant and stable. This indicates that oil-film temperature will not rise infinitely but tendsto be steady. Owing to higher oil-film pressure and larger internal friction in load-carrying area,more heat will be generated. So the temperature in the load-carrying area is higher than that in theunload-carrying area. Meanwhile, the equilibrium temperature of both oils is the same. As for theoperating time to reach the equilibrium temperature, S220 is a little longer than M220.
The distribution of the circumferential temperature from the equilibrium stage in the mid-planeof bearing at 200 rpm-6 MPa is illustrated in Figure 5. The temperature was tested by thermocouplesfrom T1 to T12 in the load-carrying area and by T21 and T25 in the unload-carrying area. As shownin Figure 5, the temperature distribution of both oils is the same. Because oil-film temperature inthe load-carrying area generally represents the load-carrying capacity and the stability of oil film,the load-carrying capacity and stability of both are equivalent.
The distribution of axial temperature from equilibrium stage in load-carrying area at200 rpm-6 MPa is depicted in Figure 6. The temperature in the load-carrying area increases along the

Appl. Sci. 2017, 7, 28 6 of 12
axial direction, but temperature difference exists in both oils. The difference is somewhat larger onboth ends of the bearing and smaller in the middle region. The difference is within 1 ◦C. Therefore, thetemperature distribution of both oils is similar along the axial direction.
As known from above, both oils are extremely similiar in the operating temperature and thetemperature distribution. Oil-film temperature reflects load-carrying performance and service life ofoil-film bearing oil, so the load-carrying capacity of S220 is equivalent to that of M220.
Appl. Sci. 2016, 6, 445 6 of 12
axial direction, but temperature difference exists in both oils. The difference is somewhat larger on
both ends of the bearing and smaller in the middle region. The difference is within 1 °C. Therefore,
the temperature distribution of both oils is similar along the axial direction.
As known from above, both oils are extremely similiar in the operating temperature and the
temperature distribution. Oil‐film temperature reflects load‐carrying performance and service life of
oil‐film bearing oil, so the load‐carrying capacity of S220 is equivalent to that of M220.
0 50 100 150 20030
35
40
45
50
55
60
T15 under S220 in load-carrying area T25 under S220 in unload-carrying area T15 under M220 in load-carrying area T25 under M220 in unload-carrying area
Tem
pera
ture
(C
)
Time (min)
Figure 4. The oil‐film temperature variation with time at 200 rpm‐6 MPa.
20
30
40
50
60
0
30
60
90
120
150
180
210
240270
300
330
20
30
40
50
60
unload-carrying area25
21
12
1110 9 8 7 6 5
2
43
Tem
pera
ture
(C
)
S220 M220
1load-carrying area
Figure 5. Circumferential temperature distribution in the mid‐plane of bearing at 200 rpm‐6 MPa.
T13 T6 T14 T15
56
57
58
59
60
Tem
pera
ture
(C
)
Thermocouple
S220 M220
Figure 6. The axial temperature distribution in the load‐carrying area at 200 rpm‐6 MPa.
Figure 4. The oil-film temperature variation with time at 200 rpm-6 MPa.
Appl. Sci. 2016, 6, 445 6 of 12
axial direction, but temperature difference exists in both oils. The difference is somewhat larger on
both ends of the bearing and smaller in the middle region. The difference is within 1 °C. Therefore,
the temperature distribution of both oils is similar along the axial direction.
As known from above, both oils are extremely similiar in the operating temperature and the
temperature distribution. Oil‐film temperature reflects load‐carrying performance and service life of
oil‐film bearing oil, so the load‐carrying capacity of S220 is equivalent to that of M220.
0 50 100 150 20030
35
40
45
50
55
60
T15 under S220 in load-carrying area T25 under S220 in unload-carrying area T15 under M220 in load-carrying area T25 under M220 in unload-carrying area
Tem
pera
ture
(C
)
Time (min)
Figure 4. The oil‐film temperature variation with time at 200 rpm‐6 MPa.
20
30
40
50
60
0
30
60
90
120
150
180
210
240270
300
330
20
30
40
50
60
unload-carrying area25
21
12
1110 9 8 7 6 5
2
43
Tem
pera
ture
(C
)
S220 M220
1load-carrying area
Figure 5. Circumferential temperature distribution in the mid‐plane of bearing at 200 rpm‐6 MPa.
T13 T6 T14 T15
56
57
58
59
60
Tem
pera
ture
(C
)
Thermocouple
S220 M220
Figure 6. The axial temperature distribution in the load‐carrying area at 200 rpm‐6 MPa.
Figure 5. Circumferential temperature distribution in the mid-plane of bearing at 200 rpm-6 MPa.
Appl. Sci. 2016, 6, 445 6 of 12
axial direction, but temperature difference exists in both oils. The difference is somewhat larger on
both ends of the bearing and smaller in the middle region. The difference is within 1 °C. Therefore,
the temperature distribution of both oils is similar along the axial direction.
As known from above, both oils are extremely similiar in the operating temperature and the
temperature distribution. Oil‐film temperature reflects load‐carrying performance and service life of
oil‐film bearing oil, so the load‐carrying capacity of S220 is equivalent to that of M220.
0 50 100 150 20030
35
40
45
50
55
60
T15 under S220 in load-carrying area T25 under S220 in unload-carrying area T15 under M220 in load-carrying area T25 under M220 in unload-carrying area
Tem
pera
ture
(C
)
Time (min)
Figure 4. The oil‐film temperature variation with time at 200 rpm‐6 MPa.
20
30
40
50
60
0
30
60
90
120
150
180
210
240270
300
330
20
30
40
50
60
unload-carrying area25
21
12
1110 9 8 7 6 5
2
43
Tem
pera
ture
(C
)
S220 M220
1load-carrying area
Figure 5. Circumferential temperature distribution in the mid‐plane of bearing at 200 rpm‐6 MPa.
T13 T6 T14 T15
56
57
58
59
60
Tem
pera
ture
(C
)
Thermocouple
S220 M220
Figure 6. The axial temperature distribution in the load‐carrying area at 200 rpm‐6 MPa. Figure 6. The axial temperature distribution in the load-carrying area at 200 rpm-6 MPa.

Appl. Sci. 2017, 7, 28 7 of 12
3.2.2. Prediction of Operating Temperature
In order to study the influence of load cases on oil-film temperature and further analyze theoperating performances of both oils with the same viscosity, the temperatures of S220 and M220 arecompared under the same load and at different speeds, as shown in Figure 7, and the temperatures ofS220 and M220 at the same speed and under different loads are shown in Figure 8.
Figure 7 shows the comparison of temperature under the same load and at different speeds.The operating temperature increases with time, but the gradients of temperature rise at 200 rpm-6 MPais larger than that at 100 rpm-6 MPa. The equilibrium temperature of both oils at 100 rpm-6 MPa andat 200 rpm-6 MPa are respectively about 50 ◦C and 60 ◦C which indicates that the increase of rotationalspeed leads to the increase of the gradient of temperature rise. This is because the increase of rotationalspeed results in the generation of more friction heat.
Appl. Sci. 2016, 6, 445 7 of 12
3.2.2. Prediction of Operating Temperature
In order to study the influence of load cases on oil‐film temperature and further analyze the
operating performances of both oils with the same viscosity, the temperatures of S220 and M220 are
compared under the same load and at different speeds, as shown in Figure 7, and the temperatures
of S220 and M220 at the same speed and under different loads are shown in Figure 8.
Figure 7 shows the comparison of temperature under the same load and at different speeds. The
operating temperature increases with time, but the gradients of temperature rise at 200 rpm‐6 MPa is
larger than that at 100 rpm‐6 MPa. The equilibrium temperature of both oils at 100 rpm‐6 MPa and at
200 rpm‐6 MPa are respectively about 50 °C and 60 °C which indicates that the increase of rotational
speed leads to the increase of the gradient of temperature rise. This is because the increase of
rotational speed results in the generation of more friction heat.
0 50 100 150 200 250 30030
35
40
45
50
55
60
Tem
pera
ture
(C
)
Time (min)
T15 at 100 rpm-6 MPa T15 at 200 rpm-6 MPa
0 100 200 300
30
35
40
45
50
55
60
Tem
pera
ture
(C
)
Time (min)
T15 at 100 rpm-6 MPa T15 at 200 rpm-6 MPa
(a) (b)
Figure 7. Comparison of temperature under the same load and at different speeds. (a) S220; (b)
M220.
Figure 8 shows the comparison of temperature at the same speed and under different loads. The
operating temperature increases with time, but the gradients of temperature rise at 150 rpm‐12 MPa
is larger than that at 150 rpm‐6 MPa. The ultimate temperature of both oils at 150 rpm‐6 MPa and
150 rpm‐12 MPa is respectively about 55 °C and 60 °C, which indicates that the increase of load leads
to the increase of the gradient of temperature increase. This is because the increase of load also
results in the generation of more friction heat.
0 100 200 300 400
35
40
45
50
55
60
Tem
pera
ture
(C
)
Time (min)
T15 at 150 rpm-6 MPa T15 at 150 rpm-12 MPa
0 100 200 300 400
35
40
45
50
55
60
Tem
pera
ture
(C
)
Time (min)
T15 at 150 rpm-6 MPa T15 at 150 rpm-12 MPa
(a) (b)
Figure 8. Comparison of temperature at the same rotational speed and different loads. (a) S220; (b)
M220.
In order to predict oil‐film temperature at a given time, the temperature of both oils was
compared and analyzed. A large amount of test data indicates that the relationship between
temperature and time conforms to Formula (1) as below through the data fitting method [25,26].
Figure 7. Comparison of temperature under the same load and at different speeds. (a) S220; (b) M220.
Figure 8 shows the comparison of temperature at the same speed and under differentloads. The operating temperature increases with time, but the gradients of temperature rise at150 rpm-12 MPa is larger than that at 150 rpm-6 MPa. The ultimate temperature of both oils at150 rpm-6 MPa and 150 rpm-12 MPa is respectively about 55 ◦C and 60 ◦C, which indicates that theincrease of load leads to the increase of the gradient of temperature increase. This is because theincrease of load also results in the generation of more friction heat.
Appl. Sci. 2016, 6, 445 7 of 12
3.2.2. Prediction of Operating Temperature
In order to study the influence of load cases on oil‐film temperature and further analyze the
operating performances of both oils with the same viscosity, the temperatures of S220 and M220 are
compared under the same load and at different speeds, as shown in Figure 7, and the temperatures
of S220 and M220 at the same speed and under different loads are shown in Figure 8.
Figure 7 shows the comparison of temperature under the same load and at different speeds. The
operating temperature increases with time, but the gradients of temperature rise at 200 rpm‐6 MPa is
larger than that at 100 rpm‐6 MPa. The equilibrium temperature of both oils at 100 rpm‐6 MPa and at
200 rpm‐6 MPa are respectively about 50 °C and 60 °C which indicates that the increase of rotational
speed leads to the increase of the gradient of temperature rise. This is because the increase of
rotational speed results in the generation of more friction heat.
0 50 100 150 200 250 30030
35
40
45
50
55
60
Tem
pera
ture
(C
)
Time (min)
T15 at 100 rpm-6 MPa T15 at 200 rpm-6 MPa
0 100 200 300
30
35
40
45
50
55
60
Tem
pera
ture
(C
)
Time (min)
T15 at 100 rpm-6 MPa T15 at 200 rpm-6 MPa
(a) (b)
Figure 7. Comparison of temperature under the same load and at different speeds. (a) S220; (b)
M220.
Figure 8 shows the comparison of temperature at the same speed and under different loads. The
operating temperature increases with time, but the gradients of temperature rise at 150 rpm‐12 MPa
is larger than that at 150 rpm‐6 MPa. The ultimate temperature of both oils at 150 rpm‐6 MPa and
150 rpm‐12 MPa is respectively about 55 °C and 60 °C, which indicates that the increase of load leads
to the increase of the gradient of temperature increase. This is because the increase of load also
results in the generation of more friction heat.
0 100 200 300 400
35
40
45
50
55
60
Tem
pera
ture
(C
)
Time (min)
T15 at 150 rpm-6 MPa T15 at 150 rpm-12 MPa
0 100 200 300 400
35
40
45
50
55
60
Tem
pera
ture
(C
)
Time (min)
T15 at 150 rpm-6 MPa T15 at 150 rpm-12 MPa
(a) (b)
Figure 8. Comparison of temperature at the same rotational speed and different loads. (a) S220; (b)
M220.
In order to predict oil‐film temperature at a given time, the temperature of both oils was
compared and analyzed. A large amount of test data indicates that the relationship between
temperature and time conforms to Formula (1) as below through the data fitting method [25,26].
Figure 8. Comparison of temperature at the same rotational speed and different loads. (a) S220;(b) M220.

Appl. Sci. 2017, 7, 28 8 of 12
In order to predict oil-film temperature at a given time, the temperature of both oils was comparedand analyzed. A large amount of test data indicates that the relationship between temperature andtime conforms to Formula (1) as below through the data fitting method [25,26].
T = A2 +(A1 − A2)
1 + ( tta)
p (1)
where T is Oil-film temperature, ◦C; t is operating time, min; A1, A2, ta, and p are constants of whichthe value can be fitted based on the test data, ◦C, ◦C, min, 1.
Oil-film temperature under some load cases and at given times can be predicted throughFormula (1). Similarly, if the permitted temperature is given, the operation time of the system can bepredicted. For instance, the temperature of S220 and M220 at 100 rpm-6 MPa is fitted respectively asshown in Formulas (2) and (3), in which each related parameter is shown in Table 6. If the operationtime t tends to be infinite, the extreme temperature T of oil-film will be A2. The extreme temperature ofS220 and M220 is 52.64 ◦C and 51.29 ◦C respectively through Formulas (2) and (3). From the calculatedresults, it can be concluded that there exists a difference in operating temperature of both oils, but thedifference is not very large.
For S220:TS220 = 52.64− 20.8
1 + ( t78.46 )
1.08 (2)
For M220:TM220 = 51.29− 21.47
1 + ( t91.93 )
1.12 (3)
Figure 9 shows the relative error [27] of temperature of both oils between test data and fitted data,and the calculation equation is as Formula (4). As shown in Figure 9, the relative error is less than0.5% at almost all times except at a few moments such as at the beginning of operation. Therefore, it isrelatively accurate to describe the operating performance of oil with Formula (1).
δ =|Ttest − Tfitted|
Ttest× 100% (4)
Table 6. Fitted values of related parameters of different kinds of oil.
Oil Type A1 (◦C) A2 (◦C) t0 (min) p
S220 31.84 52.64 78.46 1.08M220 29.82 51.29 91.93 1.12
Appl. Sci. 2016, 6, 445 8 of 12
1 22
( )
1 ( ) p
a
A AT A
tt
(1)
where T is Oil‐film temperature, °C; t is operating time, min; A1, A2, ta, and p are constants of which
the value can be fitted based on the test data, °C, °C, min, 1.
Oil‐film temperature under some load cases and at given times can be predicted through
Formula (1). Similarly, if the permitted temperature is given, the operation time of the system can be
predicted. For instance, the temperature of S220 and M220 at 100 rpm‐6 MPa is fitted respectively as
shown in Formulas (2) and (3), in which each related parameter is shown in Table 6. If the operation
time t tends to be infinite, the extreme temperature T of oil‐film will be A2. The extreme temperature
of S220 and M220 is 52.64 °C and 51.29 °C respectively through Formulas (2) and (3). From the
calculated results, it can be concluded that there exists a difference in operating temperature of both
oils, but the difference is not very large.
For S220:
S2201.08
20.852.64
1 ( )78.46
Tt
(2)
For M220:
M2201.12
21.4751.29
1 ( )91.93
Tt
(3)
Figure 9 shows the relative error [27] of temperature of both oils between test data and fitted
data, and the calculation equation is as Formula (4). As shown in Figure 9, the relative error is less
than 0.5% at almost all times except at a few moments such as at the beginning of operation.
Therefore, it is relatively accurate to describe the operating performance of oil with Formula (1).
test fitted
test
| |δ 100%
T T
T
(4)
Table 6. Fitted values of related parameters of different kinds of oil.
Oil Type A1 (°C) A2 (°C) t0 (min) p
S220 31.84 52.64 78.46 1.08
M220 29.82 51.29 91.93 1.12
0 50 100 150 200 250 300
0.00
0.25
0.50
0.75
1.00
1.25
Rel
ativ
e er
ror
(%)
Time (min)0 50 100 150 200 250 300
0.00
0.25
0.50
0.75
1.00
1.25
Rel
ativ
e er
ror
(%)
Time (min) (a) (b)
Figure 9. The relative error in temperature between test value and fitted value. (a) S220; (b) M220. Figure 9. The relative error in temperature between test value and fitted value. (a) S220; (b) M220.

Appl. Sci. 2017, 7, 28 9 of 12
3.3. Oil-Film Pressure
In Section 3.2, oil-film temperature under different load cases has been analyzed and oil-filmtemperature determines the safety of operation [28,29]. In order to avoid repeatedly analyzing theinfluence of load cases on the operating performance of oil-film bearing oil, the emphasis in Sections 3.3and 3.4 will be on the comparison between two kinds of oil-film bearing oil, and 150 rpm-6 MPa isselected as the analyzing load case [30,31].
Figure 10 is the comparison of oil-film pressure between S220 and M220 at 150 rpm-6 MPa. P1 andP2 (P means pressure transducer) are in the same circumferential direction, and P1 and P3 are in the sameaxial direction, e.g., the theoretical oil-film pressures at 150 rpm-6 MPa were P1 = 1.528069, P2 = 0.475358,and P3 = 0.701255 by numerical calculation, which is obvious that P1 > P3 > P2. As shown in Figure 10,the experimental results of oil-film pressure of both oils conform to the theoretical distribution. P1 isthe nearest to the loading point, so it is the maximum. P3 is near to the axial end of oil-film bearing,so it is smaller. P2 locates in the unload-carrying area, so it is the smallest. During the whole operationstage, the oil-film pressure always keeps constant, and both oils have the equal oil-film pressure at thecorresponding points. Therefore, both oils have the approximate same oil-film pressure.
Appl. Sci. 2016, 6, 445 9 of 12
3.3. Oil‐Film Pressure
In Section 3.2, oil‐film temperature under different load cases has been analyzed and oil‐film
temperature determines the safety of operation [28,29]. In order to avoid repeatedly analyzing the
influence of load cases on the operating performance of oil‐film bearing oil, the emphasis in Sections
3.3 and 3.4 will be on the comparison between two kinds of oil‐film bearing oil, and 150 rpm‐6 MPa
is selected as the analyzing load case [30,31].
Figure 10 is the comparison of oil‐film pressure between S220 and M220 at 150 rpm‐6 MPa. P1
and P2 (P means pressure transducer) are in the same circumferential direction, and P1 and P3 are in
the same axial direction, e.g., the theoretical oil‐film pressures at 150 rpm‐6 MPa were P1 = 1.528069,
P2 = 0.475358, and P3 = 0.701255 by numerical calculation, which is obvious that P1 > P3 > P2. As
shown in Figure 10, the experimental results of oil‐film pressure of both oils conform to the
theoretical distribution. P1 is the nearest to the loading point, so it is the maximum. P3 is near to the
axial end of oil‐film bearing, so it is smaller. P2 locates in the unload‐carrying area, so it is the
smallest. During the whole operation stage, the oil‐film pressure always keeps constant, and both
oils have the equal oil‐film pressure at the corresponding points. Therefore, both oils have the
approximate same oil‐film pressure.
0 100 200 300 4000.0
0.5
1.0
1.5
2.0
2.5
3.0
Oil
-fil
m p
ress
ure
/MP
a
Operating time /min
Pressure transducer P1 Pressure transducer P2 Pressure transducer P3
0 100 200 300 4000.0
0.5
1.0
1.5
2.0
2.5
3.0O
il-f
ilm
pre
ssur
e /M
Pa
Operating time /min
Pressure transducer P1 Pressure transducer P2 Pressure transducer P3
(a) (b)
Figure 10. Comparison of oil‐film pressure between S220 and M220 at 150 rpm‐6 MPa. (a) S220; (b)
M220.
3.4. Oil‐Film Thickness
The variations of oil‐film thickness with time at 150 rpm‐6 MPa are shown from Figures 11–13.
Figure 14 is the comparison of minimum oil‐film thickness between S220 and M220 at 150 rpm‐6
MPa. Oil‐film thickness is obtained from displacement transducers H1, H2, and H3, and their
positions are shown in Figure 2. As is known from these figures, the oil‐film thickness is large at the
initial phase and then tends to decrease, and the minimum oil‐film thickness of both oils is almost
the same. Therefore, the oil‐film thickness of S220 and M220 has the same variation laws.
0 100 200 300 4000.44
0.45
0.46
0.47
0.48
0.49
0.50
Rad
ial d
ista
nce
/mm
Operating time /min
0 100 200 300 4000.44
0.45
0.46
0.47
0.48
0.49
0.50
Rad
ial d
ista
nce
/mm
Operating time /min (a) (b)
Figure 11. The variation of oil‐film thickness from displacement transducer H1 with time at 150
rpm‐6 MPa. (a) S220; (b) M220.
Figure 10. Comparison of oil-film pressure between S220 and M220 at 150 rpm-6 MPa. (a) S220; (b) M220.
3.4. Oil-Film Thickness
The variations of oil-film thickness with time at 150 rpm-6 MPa are shown from Figures 11–13.Figure 14 is the comparison of minimum oil-film thickness between S220 and M220 at 150 rpm-6 MPa.Oil-film thickness is obtained from displacement transducers H1, H2, and H3, and their positionsare shown in Figure 2. As is known from these figures, the oil-film thickness is large at the initialphase and then tends to decrease, and the minimum oil-film thickness of both oils is almost the same.Therefore, the oil-film thickness of S220 and M220 has the same variation laws.
Appl. Sci. 2016, 6, 445 9 of 12
3.3. Oil‐Film Pressure
In Section 3.2, oil‐film temperature under different load cases has been analyzed and oil‐film
temperature determines the safety of operation [28,29]. In order to avoid repeatedly analyzing the
influence of load cases on the operating performance of oil‐film bearing oil, the emphasis in Sections
3.3 and 3.4 will be on the comparison between two kinds of oil‐film bearing oil, and 150 rpm‐6 MPa
is selected as the analyzing load case [30,31].
Figure 10 is the comparison of oil‐film pressure between S220 and M220 at 150 rpm‐6 MPa. P1
and P2 (P means pressure transducer) are in the same circumferential direction, and P1 and P3 are in
the same axial direction, e.g., the theoretical oil‐film pressures at 150 rpm‐6 MPa were P1 = 1.528069,
P2 = 0.475358, and P3 = 0.701255 by numerical calculation, which is obvious that P1 > P3 > P2. As
shown in Figure 10, the experimental results of oil‐film pressure of both oils conform to the
theoretical distribution. P1 is the nearest to the loading point, so it is the maximum. P3 is near to the
axial end of oil‐film bearing, so it is smaller. P2 locates in the unload‐carrying area, so it is the
smallest. During the whole operation stage, the oil‐film pressure always keeps constant, and both
oils have the equal oil‐film pressure at the corresponding points. Therefore, both oils have the
approximate same oil‐film pressure.
0 100 200 300 4000.0
0.5
1.0
1.5
2.0
2.5
3.0
Oil
-fil
m p
ress
ure
/MP
a
Operating time /min
Pressure transducer P1 Pressure transducer P2 Pressure transducer P3
0 100 200 300 4000.0
0.5
1.0
1.5
2.0
2.5
3.0
Oil
-fil
m p
ress
ure
/MP
a
Operating time /min
Pressure transducer P1 Pressure transducer P2 Pressure transducer P3
(a) (b)
Figure 10. Comparison of oil‐film pressure between S220 and M220 at 150 rpm‐6 MPa. (a) S220; (b)
M220.
3.4. Oil‐Film Thickness
The variations of oil‐film thickness with time at 150 rpm‐6 MPa are shown from Figures 11–13.
Figure 14 is the comparison of minimum oil‐film thickness between S220 and M220 at 150 rpm‐6
MPa. Oil‐film thickness is obtained from displacement transducers H1, H2, and H3, and their
positions are shown in Figure 2. As is known from these figures, the oil‐film thickness is large at the
initial phase and then tends to decrease, and the minimum oil‐film thickness of both oils is almost
the same. Therefore, the oil‐film thickness of S220 and M220 has the same variation laws.
0 100 200 300 4000.44
0.45
0.46
0.47
0.48
0.49
0.50
Rad
ial d
ista
nce
/mm
Operating time /min
0 100 200 300 4000.44
0.45
0.46
0.47
0.48
0.49
0.50
Rad
ial d
ista
nce
/mm
Operating time /min (a) (b)
Figure 11. The variation of oil‐film thickness from displacement transducer H1 with time at 150
rpm‐6 MPa. (a) S220; (b) M220. Figure 11. The variation of oil-film thickness from displacement transducer H1 with time at150 rpm-6 MPa. (a) S220; (b) M220.

Appl. Sci. 2017, 7, 28 10 of 12
Appl. Sci. 2016, 6, 445 10 of 12
0 100 200 300 4000.44
0.45
0.46
0.47
0.48
0.49
0.50
Rad
ial d
ista
nce
/mm
Operating time /min
0 100 200 300 4000.44
0.45
0.46
0.47
0.48
0.49
0.50
Rad
ial d
ista
nce
/mm
Operating time /min (a) (b)
Figure 12. The variation of oil‐film thickness from displacement transducer H2 with time at
150 rpm‐6 MPa. (a) S220; (b) M220.
0 100 200 300 4000.44
0.45
0.46
0.47
0.48
0.49
0.50
Rad
ial d
ista
nce
/mm
Operating time /min
0 100 200 300 4000.44
0.45
0.46
0.47
0.48
0.49
0.50
Rad
ial d
ista
nce
/mm
Operating time /min (a) (b)
Figure 13. The variation of oil‐film thickness from displacement transducer H3 with time at 150
rpm‐6 MPa. (a) S220; (b) M220.
0 100 200 300 4000.02
0.04
0.06
0.08
0.10
0.12
0.14
0.16
Min
imum
oil
-fil
m th
ickn
ess
/mm
Operating time /min
0 100 200 300 4000.02
0.04
0.06
0.08
0.10
0.12
0.14
0.16
Min
imum
oil
-fil
m th
ickn
ess
/mm
Operating time /min (a) (b)
Figure 14. The comparison of minimum oil‐film thickness between S220 and M220 at 150 rpm‐6
MPa. (a) S220; (b) M220.
4. Conclusions
The oil‐film bearing test rig can realize the monitoring of operating performances of oil‐film
bearings with thermocouples, pressure transducers, and displacement transducers installed on the
test bearings. From the above analysis, several conclusions can be obtained as follows:
(1) All property indexes of an oil‐film bearing test rig can meet the specified requirements, and the
test rig can guarantee the performance test of oil‐film bearing oil.
Figure 12. The variation of oil-film thickness from displacement transducer H2 with time at150 rpm-6 MPa. (a) S220; (b) M220.
Appl. Sci. 2016, 6, 445 10 of 12
0 100 200 300 4000.44
0.45
0.46
0.47
0.48
0.49
0.50
Rad
ial d
ista
nce
/mm
Operating time /min
0 100 200 300 4000.44
0.45
0.46
0.47
0.48
0.49
0.50
Rad
ial d
ista
nce
/mm
Operating time /min (a) (b)
Figure 12. The variation of oil‐film thickness from displacement transducer H2 with time at
150 rpm‐6 MPa. (a) S220; (b) M220.
0 100 200 300 4000.44
0.45
0.46
0.47
0.48
0.49
0.50
Rad
ial d
ista
nce
/mm
Operating time /min
0 100 200 300 4000.44
0.45
0.46
0.47
0.48
0.49
0.50R
adia
l dis
tanc
e /m
m
Operating time /min (a) (b)
Figure 13. The variation of oil‐film thickness from displacement transducer H3 with time at 150
rpm‐6 MPa. (a) S220; (b) M220.
0 100 200 300 4000.02
0.04
0.06
0.08
0.10
0.12
0.14
0.16
Min
imum
oil
-fil
m th
ickn
ess
/mm
Operating time /min
0 100 200 300 4000.02
0.04
0.06
0.08
0.10
0.12
0.14
0.16
Min
imum
oil
-fil
m th
ickn
ess
/mm
Operating time /min (a) (b)
Figure 14. The comparison of minimum oil‐film thickness between S220 and M220 at 150 rpm‐6
MPa. (a) S220; (b) M220.
4. Conclusions
The oil‐film bearing test rig can realize the monitoring of operating performances of oil‐film
bearings with thermocouples, pressure transducers, and displacement transducers installed on the
test bearings. From the above analysis, several conclusions can be obtained as follows:
(1) All property indexes of an oil‐film bearing test rig can meet the specified requirements, and the
test rig can guarantee the performance test of oil‐film bearing oil.
Figure 13. The variation of oil-film thickness from displacement transducer H3 with time at150 rpm-6 MPa. (a) S220; (b) M220.
Appl. Sci. 2016, 6, 445 10 of 12
0 100 200 300 4000.44
0.45
0.46
0.47
0.48
0.49
0.50
Rad
ial d
ista
nce
/mm
Operating time /min
0 100 200 300 4000.44
0.45
0.46
0.47
0.48
0.49
0.50
Rad
ial d
ista
nce
/mm
Operating time /min (a) (b)
Figure 12. The variation of oil‐film thickness from displacement transducer H2 with time at
150 rpm‐6 MPa. (a) S220; (b) M220.
0 100 200 300 4000.44
0.45
0.46
0.47
0.48
0.49
0.50
Rad
ial d
ista
nce
/mm
Operating time /min
0 100 200 300 4000.44
0.45
0.46
0.47
0.48
0.49
0.50R
adia
l dis
tanc
e /m
m
Operating time /min (a) (b)
Figure 13. The variation of oil‐film thickness from displacement transducer H3 with time at 150
rpm‐6 MPa. (a) S220; (b) M220.
0 100 200 300 4000.02
0.04
0.06
0.08
0.10
0.12
0.14
0.16
Min
imum
oil
-fil
m th
ickn
ess
/mm
Operating time /min
0 100 200 300 4000.02
0.04
0.06
0.08
0.10
0.12
0.14
0.16
Min
imum
oil
-fil
m th
ickn
ess
/mm
Operating time /min (a) (b)
Figure 14. The comparison of minimum oil‐film thickness between S220 and M220 at 150 rpm‐6
MPa. (a) S220; (b) M220.
4. Conclusions
The oil‐film bearing test rig can realize the monitoring of operating performances of oil‐film
bearings with thermocouples, pressure transducers, and displacement transducers installed on the
test bearings. From the above analysis, several conclusions can be obtained as follows:
(1) All property indexes of an oil‐film bearing test rig can meet the specified requirements, and the
test rig can guarantee the performance test of oil‐film bearing oil.
Figure 14. The comparison of minimum oil-film thickness between S220 and M220 at 150 rpm-6 MPa.(a) S220; (b) M220.
4. Conclusions
The oil-film bearing test rig can realize the monitoring of operating performances of oil-filmbearings with thermocouples, pressure transducers, and displacement transducers installed on the testbearings. From the above analysis, several conclusions can be obtained as follows:

Appl. Sci. 2017, 7, 28 11 of 12
(1) All property indexes of an oil-film bearing test rig can meet the specified requirements, and thetest rig can guarantee the performance test of oil-film bearing oil.
(2) The temperature performance of S220 is generally equal to that of M220 and both have theequivalent operation stability. The oil-film temperature performance conforms to Formula (1),and can be predicted at given load case through Formula (1).
(3) Although the oil-film pressure of M220 is a little more stable, the oil-film pressure performance ofS220 is similar to that of M220.
(4) S220 and M220 have the same performance of oil-film thickness, and the oil-film thickness ofS220 is slightly smaller than that of M220, especially at the beginning of operation.
(5) From the comprehensive three months of comprehensive testing, S220 is evaluated to be suitablefor further engineering application.
Acknowledgments: This work is supported by the Natural Science Foundation of Shanxi Province(No. 201601D011049), Shanxi Patent Generalization and Implementation of Special Funding (No. 2016005),and Shanxi Provincial Key Research and Development Project (201603D111017).
Author Contributions: Jianmei Wang and Reza Malekian conceived and designed the experiments; Min Caiperformed the experiments; Yanan Zhang and Zhixiong Li analyzed the data; Min Cai contributedreagents/materials/analysis tools; Jianmei Wang wrote the paper.
Conflicts of Interest: The authors declare no conflict of interest.
Nomenclature
The following symbols are used in this manuscript:
T Oil-film temperature, ◦CA1, A2, ta, p constants of which the value can be fitted based on the test data, ◦C, ◦C, min, 1t operating time, minTS220 temperature of oil S220, ◦CTM220 temperature of oil M220, ◦CTtest test temperature, ◦CTfitted fitted temperature, ◦Cδ relative error, 100%S220 New type oil-film bearing oil of brand type S with viscosity 220
M220 existent oil-film bearing oil of brand type M with the same viscosity, which hasbeen widely applied in engineering
References
1. Tang, C. The developing of high speed wire and rod mill oil. Drive Syst. Tech. 2006, 20, 44–48.2. Huang, G.X.; Wang, J.M.; Jing, D.H. Pressure distribution and damages of oil-film bearing sleeve during the
process of interference fit. Chin. J. Mech. Eng. 2006, 42, 102–108. [CrossRef]3. Moritsugu, K.; Fillon, M.; Bouyer, J.; Jarny, S. Influence of lubricants on plain bearing performance: Evaluation
of bearing performance with polymer-containing oils. Tribol. Int. 2012, 46, 190–199.4. Santos, J.C.O.; Lima, L.N.; Santos Iêda, M.G.; Souza, A.G. Thermal, spectroscopic and rheological study of
mineral base lubricating oils. J. Ther. Anal. Calorim. 2007, 87, 639–643. [CrossRef]5. Li, X.W.; Su, J. The automobile engine lubricating oil monitor engineering research based on the near-infrared
light method. In Proceedings of the International Conference on Consumer Electronics, Communicationsand Networks (CECNet 2011), Xianning, China, 16–18 April 2011; pp. 3678–3681.
6. Drabik, J.; Trzos, M. Modelling relation between oxidation resistance and tribological properties of non-toxiclubricants with the use of artificial neural networks. J. Ther. Anal. Calorim. 2012, 109, 521–527. [CrossRef]
7. Sasaki, A. Contaminants in used Oils and their problems. Proc. Inst. Mech. Eng. Part J J. Eng. Tribol. 2006,220, 471–478. [CrossRef]
8. Liu, G.; Li, X.; Lu, N.; Fan, R.H. Enhancing AW/EP property of lubricant oil by adding nano Al/Sn particles.Tribol. Lett. 2005, 18, 85–90. [CrossRef]
9. Perez, J.M.; Weller, J.; David, E.; Duda, J.L. Sequential four-ball study of some lubricating oils. Lubr. Eng.1999, 55, 28–32.

Appl. Sci. 2017, 7, 28 12 of 12
10. Martins, R.; Cardoso, N.; Seabra, J. Gear power loss performance of biodegradable low-toxicity ester-basedoils. Proc. Inst. Mech. Eng. Part J J. Eng. Tribol. 2008, 222, 431–440. [CrossRef]
11. Wang, J.M.; Huang, Q.X.; Sun, J.Z.; Xue, T. Design and development of hydrodynamic lubricating system oflarge-scale mill oil-film bearing test rig. Adv. Mater. Res. 2011, 145, 274–277. [CrossRef]
12. Masuda, T.; Ushijima, K.; Hamai, K. Measurement of oil film pressure distribution in connecting rod bearingwith test rig. Tribol. Trans. 1992, 35, 71–76. [CrossRef]
13. Dimond, T.; Rockwell, R.D.; Sheth, P.N.; Allaire, P.E. A new fluid film bearing test rig for oil and waterbearings. Proc. ASME Turbo Expo Part B Power Land Sea Air 2008, 5, 1101–1110.
14. Grigor’eva, N.I.; Tarabaev, G.I.; Kudryavtsev, S.N.; Gavrilova, I.A. Russian Lubricating Oils for Rolling Millswith Fluid-Friction Bearings. Metallurg 2005, 49, 64. [CrossRef]
15. Mao, D.H.; Wang, W.J.; Cheng, J.; Tan, J.P. Performance of lubricating oil film in aluminium foil rolling.Trans. Nonferr. Met. Soc. China 1999, 9, 30–35.
16. Brito, F.P.; Miranda, A.S.; Claro, J.C.P.; Fillon, M. Experimental comparison of the performance of a journalbearing with a single and a twin axial groove configuration. Tribol. Int. 2012, 54, 1–8. [CrossRef]
17. Morton, P.G.; Johnson, J.H.; Walton, M.H. Paper XI(ii) The influence of grooves in bearings on the stabilityand response of rotating systems. Tribol. Ser. 1987, 11, 347–354.
18. Bouyer, J.; Fillon, M. Experimental measurement of the friction torque on hydrodynamic plain journalbearings during start-up. Tribol. Int. 2011, 44, 772–781. [CrossRef]
19. Glavatskih, S.B.; Uusitalo, Ö.; Spohn, D.J. Simultaneous monitoring of oil film thickness and temperature influid film bearings. Tribol. Int. 2001, 34, 853–857. [CrossRef]
20. Simmons, G.F.; Glavatskih, S.B. Synthetic Lubricants in Hydrodynamic Journal Bearings: ExperimentalResults. Tribol. Lett. 2011, 42, 109–115. [CrossRef]
21. Ma, L. Optimization of the System Performance of Oil Film Bearing Test Bed. Master’s Thesis, TaiyuanUniversity Science Technology, Taiyuan, China, Apirl 2014.
22. Wang, J.M.; Kang, J.F.; Zhang, Y.J.; Huang, X.J. Viscosity monitoring and control on oil-film bearing lubricationwith ferrofluids. Tribol. Int. 2014, 75, 61–68.
23. Yan, K.; Wang, N.; Zhai, Q.; Zhu, Y.S.; Zhang, J.H.; Niu, Q.B. Theoretical and experimental investigationon the thermal characteristics of double-row tapered roller bearings of high speed locomotive. Int. J. HeatMass Transf. 2015, 84, 1119–1130. [CrossRef]
24. Takabi, J.; Khonsari, M.M. Experimental testing and thermal analysis of ball bearings. Tribol. Int. 2013, 60,93–103. [CrossRef]
25. Yang, G.W.; Xu, J. A new fitting scattered data method based on the criterion of geometric distance.AASRI Procedia 2014, 6, 41–48. [CrossRef]
26. Sari, M. An improved method of fitting experimental data to the Hoek–Brown failure criterion. Eng. Geol.2012, 127, 27–35. [CrossRef]
27. Jones, M.C.; Park, H.S.; Shin, K.-I.; Vines, S.K.; Jeong, S.O. Relative error prediction via kernel regressionsmoothers. J. Stat. Plan. Inference 2008, 138, 2887–2898. [CrossRef]
28. Zhang, X.; Shao, J.; An, W.; Yang, T.; Reza, M. An Improved Time-Frequency Representation based onNonlinear Mode Decomposition and Adaptive Optimal Kernel. Elektron. Elektrotech. 2016, 22, 52–57.
29. Jin, X.; Shao, J.; Zhang, X.; An, W.; Malekian, R. Modeling of nonlinear system based on deep learningframework. Nonlinear Dyn. 2016, 84, 1327–1340. [CrossRef]
30. Su, B.; Malekian, R.; Yu, J.; Feng, X.; Liu, Z. Electrical Anisotropic Response of Water Conducted FracturedZone in the Mining Goaf. IEEE Access 2016, 4, 6216–6224. [CrossRef]
31. Gong, T.; Huang, H.; Chen, P.; Malekian, R.; Chen, T. Secure Two-party Distance Computation ProtocolBased on Privacy Homomorphism and Scalar Product in Wireless Sensor Networks. Tsinghua Sci. Technol.2016, 21, 385–396.
© 2016 by the authors; licensee MDPI, Basel, Switzerland. This article is an open accessarticle distributed under the terms and conditions of the Creative Commons Attribution(CC-BY) license (http://creativecommons.org/licenses/by/4.0/).