experimental evidence from the project on incentives in ... · final report: experimental evidence...
TRANSCRIPT

P R O J E C T O N I N C E N T I V E S I N T E A C H I N G
Final Report: Experimental Evidence
from the Project on Incentives in Teaching
(POINT)
Matthew G. Springer Dale Ballou
Laura Hamilton Vi-Nhuan Le
J.R. Lockwood
Daniel F. McCaffrey Matthew Pepper Brian M. Stecher
LED BY IN COOPERATION WITH

national centeR on peRFoRmance incentives
Final Report: Experimental Evidence from theProject on Incentives in Teaching (POINT)
September 30, 2012
While permission to reprint is not necessary, the recommended citation is: Springer, M.G., Ballou, D., Hamilton, L., Le, V., Lockwood, J.R., McCaffrey, D., Pepper, M., and Stecher, B. (2012). Final Report: Experimental Evidence from the Project on
Incentives in Teaching. Nashville, TN: National Center on Performance Incentives at Vanderbilt University.
This report is also available on the NCPI website at www.performanceincentives.org
FINal REPORT: ExPERImENTal EvIdENcE FROm ThE PROjEcT ON INcENTIvES IN TEachINg (POINT)
matthew g. Springerdale Balloulaura hamiltonvi-Nhuan le
j.R. lockwooddaniel F. mccaffreymatthew PepperBrian m. Stecher

national centeR on peRFoRmance incentives
this page intentionally left blank.
Final RepoRt: expeRimental evidence FRom the pRoject on incentives in teaching (point) / 5
acKnoWledgementsThis report was made possible by the efforts of many individuals and organizations over a five- year period. We greatly appreciate the willingness of the Metropolitan Nashville School Board, the Metropolitan Nashville Public Schools, the Mayor’s Office, the Metropolitan Nashville Education Association, the Nashville Alliance for Public Education, the Tennessee Education Association, and the Tennessee Department of Education. Many individuals also contributed in meaningful ways to make this project a success, including Leonard Bradley, Tim Caboni, Paul Changas, Mar-garet Dolan, David Fox, Pedro Garcia, Pamela Garrett, Graham Greeson, James Guthrie, Janet Hansen, Chris Henson, Marc Hill, Keel Hunt, Erick Huth, June Keel, Julie Koppich, Meredith Libbey, Dan Long, Al Mance, Jayme Merritt, Melanie Moran, Bill Purcell, Jesse Register, Kay Sim-mons, and Gloria Towner. Without their involvement, this study would not have been feasible. We wish we could name the many other dedicated educators who cooperated with the study in many ways. These people were extraordinarily generous with their time and expertise.
We would also like to acknowledge the contributions from many other individuals at the National Center on Performance Incentives, RAND, and Vanderbilt University’s Peabody College. We would like to acknowledge the input from Susan Burns, Christine DeMartini, Mark Ehlert, Cate Gardner, Bing Han, Robert Hickam, Rebekah Hutton, Kelly Fork, Jessica Lewis, Warren Langevin, Brian McInnis, Lawrence Painter, Art Peng, Michael Podgursky, John Smith, and Elias Walsh. Countless other colleagues at Vanderbilt University and RAND provided helpful comments and suggestions. The authors wish to thank Richard Colvin, Steve Glazerman, Carolyn Heinrich, Brian Jacob, Derek Neal, and Jeffrey Smith for their thoughtful review of the study.
This report was supported by the National Center on Performance Incentives (NCPI), which is funded by the United States Department of Education’s Institute of Education Sciences (R305A06034). The project would not have been possible without the generous support of an anonymous foundation that funded teacher bonuses.
The views expressed in this report do not necessarily reflect those of sponsoring agencies or indi-viduals acknowledged. Any errors remain the sole responsibility of the authors.
disclosURe oF potential conFlicts oF inteRestThe research team for this evaluation consists of a prime grantee, Vanderbilt University’s Peabody college; its subcontractors, RAND Corporation, University of Missouri – Columbia, and Univer-sity of Michigan. None of these organizations or their key staff members has financial interests that could be affected by findings from the study. No one involved in the content of this report has financial interests that could be affected by findings from the study.

6 / national centeR on peRFoRmance incentives
this page intentionally left blank.

Final RepoRt: expeRimental evidence FRom the pRoject on incentives in teaching (point) / 7
FoReWoRdThe Project on Incentives in Teaching (POINT) was a three-year study conducted by the National Center on Incentives in Teaching in the Metropolitan Nashville School System from 2006-07 through 2008-09. Middle school mathematics teachers voluntarily participated in a controlled experiment to assess the effect of offering financial rewards to teachers whose students showed unusual gains on standardized tests. In the fall of 2010 NCPI released an abbreviated report with the key findings from the project. At that time we indicated a longer report was in preparation that would contain additional information about the project and analyses of the results.
This document is that longer report. Among the additional features are the following: • More detail on the design of the intervention. • An extensive description of data-collecting activities and documentation of data sources.• More detailed descriptions of the model and the estimation procedures, including the use of
randomization analyses to inform the specification of the model’s stochastic structure.• Detailed information on sensitivity tests alluded to in the September 2010 report, including
numerous additional tables of results.• Results of additional sensitivity tests conducted after September 2010.• Descriptions of alternative estimation procedures intended to be robust to the problems posed
by purposive assignment and teacher attrition, with tabulated results.• A follow-up analysis of the persistence of treatment effects using 2010 outcomes for the 2009
cohort of fifth graders—an analysis that could not be undertaken at the time the September 2010 report was prepared because 2010 test results were not yet available.
• A full chapter devoted to an analysis of the impact of the intervention on teachers’ attitudes, perceptions, and beliefs, using survey responses.

8 / national centeR on peRFoRmance incentives
this page intentionally left blank.
Final RepoRt: expeRimental evidence FRom the pRoject on incentives in teaching (point) / 9
taBle oF contents
Executive Summary 18
Chapter 1: Introduction and Overview 22 1.1 Introduction 22 1.2 Experimental Evaluation of Performance Incentives in Public Education 23 1.3 Organization and Content of This Report 25
Chapter 2: The Project on Incentives in Teaching (POINT) Experiment 26 2.1: Design of POINT 26 2.2: Implementation of POINT 33 2.3 Number of Participants and Number and Amount of Bonuses by Year 38
Chapter 3: Data and Data Collection Activities 41 3.1: Summary of Data Collection Activities 41 3.2: District and State Administrative Files 43 3.3: Teacher and Administrative Data 51 3.4: Interviews with Teachers and Stakeholders 55
Chapter 4: Threats to Validity 57 4.1: Potential Sources of Treatment/Control Group Imbalance 57 4.2: Evidence of Imbalance 61 4.3: Additional Analyses of Purposive Assignment and Attrition 65 4.4: Threats to Validity: Responses 69 4.5: Illusory Test Score Gains: Did Treatment Teachers Manipulate Scores? 71 4.6: Threats to Validity: Final Reflections 74
Chapter 5: The Impact of Incentive Pay on Student Achievement 76 5.1: Model Specification 76 5.2: Results 83 5.3: How Teachers Responded to POINT 98 5.4: Why Was Fifth Grade Different? 103 5.5: Summary 111
Chapter 6: Teachers’ Attitudes, Perceptions and Behaviors 113 6.1: Methodology 113 6.2: Comparisons of Treatment and Control Teachers 117 6.3: Comparisons of Treatment Teachers Who Earned a Bonus to Those Who Did Not Earn a Bonus 126 6.4: Discussion 137
Chapter 7: Conclusions and Direction of Future Research 140
10 / national centeR on peRFoRmance incentives
References 146
Appendix A: Were POINT Performance Targets Unrealistic for Most Teachers? 149
Appendix B: Grade-Level Comparisons of Treatment and Control Groups 154
Appendix C1: Information Provided to Teachers 161
Appendix C2: A Guide to Calculating Monetary Bonuses for Teachers 178
Appendix D: Analysis of Test Score Manipulation 194
Appendix E: Complete Regression Results for Complete Case Analyses 211
Appendix F: Estimates of Treatment Effects on Student Achievement in Reading, Science, and Social Studies 214
Appendix G: Results of Sensitivity Tests 217
Appendix H: Comparing Instructional Practices and Professional Development of Fifth Grade Teachers to Teachers in Other Grades 220
Appendix I: Creating Survey Constructs from Original Survey Items 224

Final RepoRt: expeRimental evidence FRom the pRoject on incentives in teaching (point) / 11
this page intentionally left blank.

12 / national centeR on peRFoRmance incentives
list oF taBles
Chapter 2: The Project on Incentives in Teaching (POINT) Experiment Table 2.1: Design Components of the POINT Intervention 32 Table 2.2: Sample Bonus Summary Report 37 Table 2.3: NCPI Payment to Teachers 37 Table 2.4: Bonus Awards by Year 38
Chapter 3: Data and Data Collection Activities Table 3.1: Summary of Data Collection Activities 41 Table 3.2: Percent of Students with Missing Values by Teacher’s Experimental Status 47 Table 3.3: Percent of Teachers with Missing Values for Background Variables by Experimental Group 49 Table 3.4: Spring 2007, Spring 2008, Spring 2009 MNPS Teacher Survey Administration 52 Table 3.5: POINT Rosters and Appeals 54
Chapter 4: Threats to Validity Table 4.1: Number of Teachers Who Dropped Out of the POINT Experiment by Treatment Status and School Year 60 Table 4.2: Reasons for Attrition by Treatment Status 60 Table 4.3: Standardized Adjusted Treatment vs. Control Group Mean Differences Weighted by Number of Students Taught 62 Table 4.4: Treatment vs. Control Group Differences in Pre-POINT Math Achievement 64 Table 4.5: Estimates of the Treatment Effect on the SUSPECT Indicator 75
Chapter 5: The Impact of Incentive Pay on Student Achievement Table 5.1: Number of Sample Observations by Missingness Pattern 80 Table 5.2: Estimated Treatment Effects 87 Table 5.3: Persistence of Grade 5 Treatment Effects One Year Later 92 Table 5.4: Estimated Intervention Effects Using Course-Cluster Assignments 94 Table 5.5: Estimated Treatment Effects Adjusting for Teacher Variables Related to Attrition 95 Table 5.6: Estimated Treatment Effects from Sample Restricted to Teachers Who Remained in the Study for Three Years 96 Table 5.7: Estimated Treatment Effects, Models with Teacher Fixed Effects 97 Table 5.8: Measures of Teacher Effort, Professional Development, and Instructional Practice, Interacted with Teacher Treatment Status 101 Table 5.9: Estimated Intervention Effects from Models Including Prior Year Mathematics Scores as a Covariate 104 Table 5.10: Proportion of Students Taught 1, 2, 3 or 4 Core Courses by Their Mathematics Teacher by Grade 105

Final RepoRt: expeRimental evidence FRom the pRoject on incentives in teaching (point) / 13
Table 5.11: Estimated Treatment Effects, Controlling for Whether Math Teacher Has Student for at Least Two Other Core Subjects 106 Table 5.12: Estimated Treatment Effects, Teachers Who Remained to End of Study with Stable Proportion of Grade 5 Students 108 Table 5.13: Control Group Grade-Level Main Effects 109
Chapter 6: Teachers’ Attitudes, Perceptions and Behaviors Table 6.1: Teacher Enrollment, Survey Responses and Bonuses by Year 114 Table 6.2: POINT Survey Scale Descriptions 115 Table 6.3: Scales Ranges, Means Values, and Standardized Differences between Treatment and Control Teachers by Year 118 Table 6.4: Teachers’ Attitudes, Practices, Professional Development, and School Environment by Experience Category and Treatment Category in Year 1 121 Table 6.5: Teachers’ Attitudes, Practices, Professional Development, and School Environment by Experience Category and Treatment Category in Year 2 123 Table 6.6: Changes from Year 1 in Teachers’ Attitudes, Perceptions and Behaviors, and Differences in Change by Treatment Condition 125 Table 6.7: Treatment Teachers’ Attitudes, Practices, Professional Development, and School Environment by Year 129 Table 6.8: Changes in Attitudes, Practices, Professional Development, and School Environment between Years 1 and 2 by Bonus Status in Year 1 132 Table 6.9: Changes in Attitudes, Practices, Professional Development, and School Environment between Years 2 and 3 by Bonus Status in Year 2 134 Table 6.10: Standardized Regression Coefficients of Beliefs, Practices, Professional Development, and School Environment Variables that Predict Bonus Status 136
Appendix B: Grade-level Comparisons of Treatment and Control Groups Table B-1: Standardized Adjusted Treatment vs. Control Group Mean Differences Weighted by Number of Grade 5 Students Taught 155 Table B-2: Standardized Adjusted Treatment vs. Control Group Mean Differences Weighted by Number of Grade 6 Students Taught 156 Table B-3: Standardized Adjusted Treatment vs. Control Group Mean Differences Weighted by Number of Grade 7 Students Taught 157 Table B-4: Standardized Adjusted Treatment vs. Control Group Mean Differences Weighted by Number of Grade 8 Students Taught 159
Appendix D: Analysis of Test Score Manipulation Table D-1: Summary Stats 206 Table D-2: Correlation Matrix of Cheating Indicators 207 Table D-3: Estimates of the Treatment Effect on Cheating 208 Table D-4: Estimates of the Treatment Effect on Cheating by Grade and Year 209 Table D-5: Robustness of Estimates of the Treatment Effect on Cheating by Grade and Year to Alternative Cheating Measures 210

14 / national centeR on peRFoRmance incentives
Appendix E: Complete Regression Results for Complete Case Analyses Table E-1: Complete Regression Results, Complete Case Analyses 212
Appendix F: Estimates of Treatment Effects on Student Achievement in Reading, Science, and Social Studies Table F-1: Estimated Treatment Effects on Reading/ELA Achievement 215 Table F-2: Estimated Treatment Effects on Science Achievement 215 Table F-3: Estimated Treatment Effects on Social Studies Achievement 215 Table F-4: Treatment Effects in Reading, Sample Restricted to Students of Participating Teachers, Complete Cases 216 Table F-5: Treatment Effects in Science, Sample Restricted to Students of Participating Teachers, Complete Cases 216 Table F-6: Treatment Effects in Social Studies, Sample Restricted to Students of Participating Teachers, Complete Cases 216
Appendix G: Results of Sensitivity Tests Table G-1: Estimated Treatment Effects Using All Rather Than Stable Students 218 Table G-2: Estimated Treatment Effects, Models Including Squares and Cross- Products of Covariates 218 Table G-3: Estimated Treatment Effects, Sample Restricted to Students Who Count Toward a Teacher’s Bonus 219 Table G-4: Estimated Treatment Effects, Random Effect Specified at the Level of Student Course-Clusters 219
Appendix H: Comparing Instructional Practices and Professional Development of Fifth Grade Teachers to Teachers in Other Grades Table H-1: Differential Behavior of Grade 5 Treatment Group Teachers 222

Final RepoRt: expeRimental evidence FRom the pRoject on incentives in teaching (point) / 15
this page intentionally left blank.

16 / national centeR on peRFoRmance incentives
list oF FigUResChapter 2: The Project on Incentives in Teaching (POINT) Experiment Figure 2.1: Performance Standards and Amount of Bonus Awards in POINT Intervention 31 Figure 2.2 Consort Diagram for Teachers in POINT 40
Chapter 4: Threats to Validity Figure 4.1: Control/Treatment Survivor Rates 59
Chapter 5: The Impact of Incentive Pay on Student Achievement Figure 5.1: Grade and Year of Covariate Measurements by Grade and Year of Study Participation and Outcome Measurements 79 Figure 5.2: Math Achievement Trends Overall 84 Figure 5.3: Math Achievement Trends in Grade 5 85 Figure 5.4: Math Achievement Trends in Grade 6 85 Figure 5.5: Math Achievement Trends in Grade 7 86 Figure 5.6: Math Achievement Trends in Grade 8 86
Appendix A: Were POINT Performance Targets Unrealistic for Most Teachers? Figure A-1: Probability of Winning a Bonus 151 Figure A-2: Required Improvement to Earn a Bonus 152 Figure A-3: Subjective Probabilities of Winning a Bonus 153

Final RepoRt: expeRimental evidence FRom the pRoject on incentives in teaching (point) / 17
this page intentionally left blank.

18 / national centeR on peRFoRmance incentives
execUtive sUmmaRY The Project on Incentives in Teaching (POINT) was a three-year study conducted in the Metro-politan Nashville School System from 2006-07 through 2008-09, in which middle school math-ematics teachers voluntarily participated in a controlled experiment to assess the effect of finan-cial rewards for teachers whose students showed unusually large gains on standardized tests. The experiment was intended to test the notion that rewarding teachers for improved scores would cause scores to rise. It was up to participating teachers to decide what, if anything, they needed to do to raise student performance: participate in more professional development, seek coaching, collaborate with other teachers, or simply reflect on their practices. Thus, POINT was focused on the notion that a significant problem in American education is the absence of appropriate incen-tives, and that correcting the incentive structure would, in and of itself, constitute an effective intervention that improved student outcomes.
By and large, results did not confirm this hypothesis. While the general trend in middle school mathematics performance was upward over the period of the project, students of teachers ran-domly assigned to the treatment group (eligible for bonuses) did not outperform students whose teachers were assigned to the control group (not eligible for bonuses). The brightest spot was a positive effect of incentives detected in fifth grade during the second and third years of the experi-ment. This finding, which is robust to a variety of alternative estimation methods, is nonetheless of limited policy significance, for this effect does not appear to persist after students leave fifth grade. Students whose fifth grade teacher was in the treatment group performed no better by the end of sixth grade than did sixth graders whose teacher the year before was in the control group.
The report is divided into six chapters. Chapter One consists of an introduction to the policy background. Chapter Two describes the design and implementation of the intervention. In POINT the maximum bonus an eligible teacher might earn was $15,000—a considerable increase over base pay in this system. To receive this bonus, a teacher’s students had to perform at a level that historically had been reached by only the top five percent of middle school math teachers in a given year. Lesser amounts of $5,000 and $10,000 were awarded for performance at lower thresh-olds, corresponding to the 80th and 90th percentiles of the same historical distribution. Teach-ers were therefore striving to reach a fixed target rather than competing against one another—in principle, all participating teachers could have attained these thresholds.
It is unlikely that the bonus amounts were too small to motivate teachers assigned to the treat-ment group. Indeed, a guiding consideration in the design of POINT was our desire to avoid offering incentives so modest that at most a modest response would result. Instead, we sought to learn what would happen if incentives facing teachers were significantly altered. What if the bar was set too high and teachers were discouraged by the perception that the targets were out of reach? We devote considerable attention to this question in Section II, examining performance among teachers who were not eligible for bonuses (POINT participants prior to the implemen-tation of the project, and control teachers during the project). We find that about half of these teachers could reach the lowest of the bonus thresholds if their students answered 2 to 3 more questions correctly on an exam of some 55 items. We conclude that the bonus thresholds should
Final RepoRt: expeRimental evidence FRom the pRoject on incentives in teaching (point) / 19
have appeared within reach of most teachers, and that an attempt to raise performance at the margin ought not to have been seen as wasted effort by all but a few teachers “on the bubble.”
Chapter Three contains a detailed description of the data available to NCPI for this study. Sources are documented. Procedures NCPI undertook to verify the accuracy of the data are described.
Chapter Four takes up various threats to the validity of our findings. We investigate whether ran-domization achieved balance between treatment and control groups with respect to factors affect-ing achievement other than the incentives that POINT introduced. While balance was achieved overall, it was not within all subsamples of interest (for example, among teachers within a single grade). Statistical adjustments through multiple regression analysis are required to estimate the effect of incentives in such subsamples. As always, this raises the possibility that different models will yield different findings. As a result, we place greatest confidence in estimates based on the overall sample, in which data are pooled across years and grades.
POINT randomized participating teachers into treatment and control groups. It did not random-ize students. Because the assignment of students to teachers was controlled by the district, it is possible that principals and teachers manipulated the assignment process in order to produce classes for treatment teachers who enhanced their prospect of earning a bonus. In addition, attri-tion of teachers from POINT was high. By the end of the project, half of the initial participants had left the experiment. Such high rates of attrition raise the possibility that our findings could reflect differential selection (if, for example, more effective teachers remained in the treatment group than in the control group).
We conducted a variety of analyses to ascertain whether differential attrition or the manipulation of student assignments biased our results. We conclude that neither produced significant differ-ences between treatment and control groups and that experimental estimates of the incentive effect are free of substantial bias. In addition, to remove the impact of differences between the teachers and students assigned to treatment and control that arose by chance, we estimate treat-ment effects using models in which we control for student and teacher characteristics. Our con-clusions about the overall effect of incentives are robust to the omission of such controls: a simple comparison of mean outcomes in the treatment and control groups and estimates from the more complicated model both show no overall treatment effect. This is not true of estimates based on subsets of the full sample—for example, outcomes by grade level. At the grade level there were substantial imbalances between treatment and control groups whose influence on achievement had to be controlled for.
It is also possible that test score gains were illusory rather than indicators of genuine improve-ments in student achievement. This would obviously be the case if treatment teachers engaged in flagrant forms of cheating to promote their chances of earning a bonus. But it might also result from the adoption of instructional strategies intended to produce short-term gains on specific test instruments. Our investigation (including a statistical analysis of item-level responses) does not reveal this to have been a problem, though we acknowledge that we have not had access to test forms in order to look for suspicious patterns of erasures.

20 / national centeR on peRFoRmance incentives
In Chapter Five we present our findings. As already noted, we find no effect of incentives on test scores overall (pooling across all years and grades). We do find a positiv, though short-lived, effect among fifth graders. We have explored a variety of hypotheses that might account for a posi-tive effect in fifth grade but not the other grades. Only one seems to have played a major role: fifth grade teachers are more likely to instruct the same set of students in multiple subjects. This appears to confer an advantage, though it is unclear precisely what the advantage comprises—whether it is the opportunity to increase time on mathematics at the expense of other subjects, or the fact that these teachers know their students better, or something else. And even this is at best a partial explanation of the fifth grade response.
An investigation of instructional practices and participation in professional development showed that treatment teachers differed little from control teachers. Where there were differences, they were not associated with higher achievement. By and large, POINT appears to have had little ef-fect on what these teachers did in the classroom. Most teachers claimed they were already teach-ing as effectively as they could and would therefore make no changes in response to the bonuses. In addition, most did not appear to endorse the criteria used by POINT to determine who was teaching effectively. Participants did not agree with the notion that bonus recipients in POINT were better teachers, or that failing to earn a bonus meant that a teacher needed to improve. Their rejection of the criteria used by NCPI to award bonuses together with their belief that they were already doing the best they could (by their own criteria) may explain why bonuses failed to lift student achievement.
In Chapter Six we provide further detail on teachers’ responses to surveys. Treatment and control group teachers reported very few differences in terms of attitudes, practices, professional develop-ment, and school environment. The most noteworthy finding is that treatment teachers’ views of their school environments were at least as positive, and in some cases more so, than control group teachers, although views of POINT became somewhat more negative.
There were differences between treatment teachers who earned a bonus and those who did not, although some of these differences should be interpreted cautiously because the numerous sta-tistical tests conducted may have led us to observe significant differences by chance alone. While both groups generally supported performance-based compensation plans and the POINT experi-ment, not surprisingly, teachers who earned a bonus reported an increase in positive perceptions of the POINT program while teachers who did not earn a bonus showed the opposite pattern. Teachers who did not win bonuses were more likely than bonus winners to believe the POINT program increased teacher resentment and stress, and decreased teacher collaboration. However, this difference was present prior to the awarding of any bonuses; it does not appear to be a result of the bonuses, though it might be predictive of them. For the most part, however, few POINT participants believed the experiment had negative consequences for teachers.
A potential concern for performance-based compensation programs is the effect they may have on the morale and motivation of teachers who do not earn bonuses. Survey responses suggest that the failure to earn a bonus was not detrimental to motivation. Asked how much extra effort they were making to earn a bonus, teachers who had not earned bonuses in the previous year reported levels as great or greater than those reported by bonus winners. Furthermore, the POINT experi-

Final RepoRt: expeRimental evidence FRom the pRoject on incentives in teaching (point) / 21
ment may have had the effect of spurring teachers who did not win a bonus to work harder. For example, from Year 1 to Year 2, there was an increase in the amount of time that teachers who did not earn a bonus indicated they spent on school-related work outside of formal school hours, with a moderate portion of this time devoted to curricular planning and evaluating student work.
In Chapter Seven, we summarize our main findings and explore their implications for education policy. The introduction of performance incentives in MNPS middle schools did not set off sig-nificant negative reactions of the kind that have attended the introduction of merit pay elsewhere. But neither did it yield consistent and lasting gains in test scores. It simply did not do much of anything. While it might be tempting to conclude that the middle school math teachers in MNPS lacked the capacity to raise test scores, this is belied by the upward trend in scores over the period of the project, a trend that is probably due to some combination of increasing familiarity with a criterion-referenced test introduced in 2004 and to an intense, high-profile effort to improve test scores to avoid NCLB sanctions.
It should be kept in mind that POINT tested a particular model of incentive pay. Our negative findings do not mean that another approach would not be successful. It might be more productive to reward teachers in teams, or to combine incentives with coaching or professional development. Having incentives in place longer than three years might also have improved outcomes. However, our experience with POINT underscores the importance of putting such alternatives to the test.

22 / national centeR on peRFoRmance incentives
chapteR 1: intRodUction and oveRvieW
1.1 intRodUction Compensation of most professional workers in the United States is flexible, market-driven, and performance-based (Hein, 1996). Many professionals, including physicians, attorneys, dentists, nurses, college professors, and journalists, both in the public and private sectors, operate in envi-ronments where performance or effort plays some role in determining remuneration. The higher one progresses in an organization, the more likely at least part of one’s salary will be linked to performance.
Public school teachers are exceptions to this pattern. Salary schedules that determine teacher compensation on the basis of education and experience are a nearly universal feature of K–12 public school districts in the United States. A frequently cited statistic from national survey data on district compensation practices shows that close to 100 percent of traditional public school teachers are employed in school districts that make use of the single salary schedule (Podgursky, 2009). Thus, roughly 3.1 million public school teachers from kindergarten through secondary lev-el are paid largely on the basis of years of experience and their most advanced degree. Yet research has generally no evidence that holding an advanced degree raises teacher effectiveness, while even the impact of experience is mainly limited to the first few years of a teaching career, after which additional experience makes little, if any, difference to teacher effectiveness (Hanushek, 2003).
On the other hand, traditional merit pay, by which supervisors distribute bonuses based on their subjective assessment of teaching performance, has not fared well in public school systems. Teachers are often unclear why they have been denied bonuses, and those evaluating them have often been unable to provide cogent explanations (Murnane and Cohen, 1986). These plans have been resisted by teacher unions opposed to an augmentation of managerial authority that could be used to play favorites and set workers against one another. Most plans have been short-lived, and those that have survived have often linked bonuses to additional duties, so that the plans cease to be rewards for teaching excellence, particularly if there is no requirement that teachers taking on the extra work have first demonstrated superior performance.
Nonetheless, interest in tying teacher compensation to performance has revived, with the federal government now taking a leading role in promoting compensation reform as a way to improve public schools. In our view, three circumstances have contributed to this renewed interest in performance incentives. First is the frustration with the slow pace of progress. It is now nearly 30 years since the Reagan administration issued A Nation at Risk, yet improvement in public schools has been very slow, particularly at the secondary level. The United States continues to fare poorly in international comparisons; the achievement gap between the affluent and the disadvantaged remains wide.
Second, state and district accountability systems, most adopted in response to federal legislation, have focused public attention on educational outcomes and in particular on the use of standard-ized testing to evaluate school and teacher performance. Although there remains controversy

Final RepoRt: expeRimental evidence FRom the pRoject on incentives in teaching (point) / 23
about the validity of value-added measures of performance, it has been shown that it is feasible to evaluate teachers this way and that these measures correlate with other indicators of student learning and teacher effectiveness (Hill, Kapitula, and Umland, 2011; Bill and Melinda Gates Foundation, 2011).
Third, researchers estimating teacher value added have found that instructional quality is highly variable. Teachers appear to be the single most important schooling input, with educational out-comes depending more on teachers than any other factor outside the home.
Taken together, these factors have renewed interest in the use of performance incentives in public education. The idea is promoted by political leaders at the federal, state, and district level.1 It has been a prominent component of the reform strategies of both the Bush and Obama administra-tions. Yet significant questions remain about the wisdom of this policy. Two rationales for perfor-mance-based pay have been advanced. First, that the existing workforce will improve in response to incentives as teachers find ways to increase student learning that they do not now employ, and that test scores will rise as a result. Second is that the use of performance incentives will lead over time to an improvement in the quality of the workforce as more capable individuals are attracted to careers in teaching. Both of these claims have been challenged. Remarkably, there is little solid evidence on either.2 Yet reforms proceed apace, with the federal government rewarding states for innovations tying teacher compensation to measures of value added based on standardized achievement tests.
1.2 an expeRimental evalUation oF peRFoRmance incentives in pUBlic edUcation
In an effort to assess the impact of performance incentives in education, the National Center on Performance Incentives (NCPI) partnered with the Metropolitan Nashville Public Schools
1 Florida, Minnesota, and Texas allocate more than $550 million to incentive pay programs that reward teacher performance. Funding for the federally sponsored Teacher Incentive Fund (TIF) quadrupled in 2010, and the Obama administration’s 2011 budget request designated an additional $950 million for a new Teacher and Leader Innova-tion Fund that would support the development and implementation of performance-oriented compensation as a viable tool for motivating teachers to higher performance levels and for aligning teacher behaviors and interests with institutional goals.2 Muralidharan and Sundararaman (2008) and Lavy (2002, 2007) found that teacher incentive programs in India and Israel, respectively, improved student outcomes and promoted positive changes in teacher behavior and/or classroom pedagogy. Glewwe, Ilias, and Kremer (2008) similarly reported that students instructed by teachers eligible to receive a bonus award in Kenya demonstrated better scores on high-stakes tests; however, no discernible impact was found on low-stakes tests taken by treatment group students or on the same students when they took high-stakes tests during the post-intervention school year. Looking for studies that used a conventional treatment and control evaluation design, with pretreatment data on student performance for both groups, Podgursky and Springer (2007, 2011) found only four that dealt with incentives programs in the United States. None was a randomized, controlled trial. Three (Clotfelter and Ladd, 1996; Ladd, 1999; Figlio and Kenny, 2007) relied on cross-sectional comparisons of schools using incentives with other schools that did not. One (Winters et al., 2006) used a stronger difference-in-differences design, but the study was limited to two schools in which the intervention was tried and contained no information about why those schools had been selected. Not surprisingly, the authors of this review article concluded that more research was needed.

24 / national centeR on peRFoRmance incentives
(MNPS) to conduct the Project on Incentives in Teaching, or POINT. POINT is designed as a controlled experiment. Approximately half the teachers volunteering to participate were random-ly assigned to a treatment group, in which they were eligible for bonuses of up to $15,000 per year on the basis of student test-score gains on the Tennessee Comprehensive Assessment Program (TCAP). The other half were assigned to a control group that was not eligible for these bonuses. Because assignment to these conditions was random, there should be no systematic differences in the ability of the teachers in the two groups. A difference in student outcomes in favor of the treatment group would therefore be evidence that teacher incentives raise student learning.
POINT involved no other incentives or systems of support for teachers in the treatment condi-tion. There was no requirement that teachers participate in professional development or that they alter their instructional practices in a particular way. What teachers did in response to these financial incentives was entirely up to them.3 We designed POINT in this manner not because we believed that an incentive system of this type is the most effective way to improve teaching perfor-mance, but because the idea of rewarding teachers on the basis of student test scores has gained such currency. We sought a clean test of the proposition: If teachers are rewarded for an increase in student test scores, will test scores go up? This key feature of POINT needs to be kept in mind when interpreting our findings. We are not testing whether performance incentives in any form will raise student achievement, but whether incentives in this form work.4 In short, is it sufficient simply to put the money out there and leave it up to individual teachers to find ways to improve their performance, if they are so inclined? If the answer is negative, that by no means implies that some other incentive plan would not be successful.5
The theory of action that underlies this experiment is complicated. Incentives will alter student learning, if at all, through intermediate effects on teachers’ perceptions, attitudes, and behaviors. Because we did not specify what teachers should do to raise student achievement, it was impor-tant that we monitor a wide variety of possible responses in order to learn how teachers viewed the experiment and what they actually did when they were eligible for bonuses.
3 Although we did not stipulate any particular set of activities bonus-eligible teachers should follow, it is worth noting that the district provides opportunities for professional development that teachers can pursue on a voluntary basis. During POINT years, the district also offered peer coaching in mathematics to teachers who wished to take advantage of it. If test scores do not rise, it should not be thought that this was because teachers had no opportunity to improve.4 It may be objected that we have investigated a straw man, that no one really believes that an incentive plan should reward teachers for higher test scores and nothing else. Such critics may point to the fact that performance pay plans that have been adopted always include other components: perhaps multiple measures of performance, perhaps some form of coaching and support to help teachers earn bonuses. We would argue that existing plans are political com-promises between advocates and opponents of incentive pay, and that the presence of these components by no means indicates that there are no important constituents for the approach to teaching compensation that we are testing in POINT. On the contrary, advocates of tying teacher compensation to student performance, as measured by standard-ized tests, view this component as the heart of compensation reform. They are very much motivated by the three fac-tors we identified above. It now appears to be feasible to evaluate teachers based on student test scores; such methods appear to be scientific and objective; we use test scores in a host of other contexts to assess the performance of our educational system—so why not start paying teachers on the basis of value added, as measured by test scores? It is that proposition that POINT was designed to test.5 Many alternatives have been proposed. They include plans that combine incentives with professional develop-ment. It is also possible to reward teams of teachers to take advantage of peer monitoring and coaching.

Final RepoRt: expeRimental evidence FRom the pRoject on incentives in teaching (point) / 25
As part of POINT we have gathered extensive data on these variables. (See the discussion in Chapter Six.)
We are also aware that test scores might rise for reasons unrelated to an improvement in instruc-tional quality. Teachers eligible for bonuses might seek more favorable classroom assignments or take actions to remove struggling or disruptive students from their classes. (POINT randomized teachers to the treatment and control groups, but student assignments remained in the hands of the district.) In order to improve their chances of earning a bonus, teachers might have taught narrowly to the test, producing higher scores that do not hold up when students are given dif-ferent tests in the same subject or that prove short-lived. In extreme cases, teachers may coach students during the administration of tests or alter student answers. We took a variety of steps to discourage such steps. We also designed POINT in such a way that valid conclusions about the ef-fect of incentives could still be drawn even if the assignment of students to teacher were manipu-lated to promote eligible teachers’ chances of earning a bonus.6
In experiments involving human subjects, efforts to create balanced treatment and control groups through randomization can be undone by the subjects themselves. This was true of POINT as well. Turnover is high in urban school systems, and many teachers left POINT before the conclu-sion of the three-year experiment. Teachers who were eligible for bonuses were somewhat less likely to leave than teachers in the control group. If better teachers were more likely to remain when eligible for bonuses, but not when assigned to the control group, selective attrition could have undone the equivalence of treatment and control groups.
We have conducted a comprehensive analysis of the various threats to validity of POINT, examin-ing patterns of attrition and comparing the classes of treatment teachers with control teachers to determine whether attrition or the other threats described above have compromised our ability to draw conclusions about the impact of incentives. Although it is impossible to be sure that there are no contaminating influences, we remain broadly confident that our experimental design holds up—the comparison of outcomes in treatment and control groups does contain valuable informa-tion about teachers’ responses to incentives of the kind implemented in this project.
1.3 oRganiZation and content oF this RepoRt
The subsequent sections of this report are broken into six chapters. Chapter 2 describes the design of the POINT intervention and key implementation activities. Chapter 3 presents information about data and data collection activities. Chapter 4 considers the various threats to validity de-scribed above. Chapter 5 focuses on student achievement. Chapter 6 examines teacher attitudes and behaviors. Chapter 7 summarizes our conclusions and indicates the direction of future analy-ses.
6 See the description of randomization based on course-clusters in Chapter Two below. Unfortunately, cluster-based analyses were compromised by high rates of attrition from the experiment, as explained in Chapter Four.

26 / national centeR on peRFoRmance incentives
chapteR 2: the pRoject on incentives in teaching (point) expeRiment In this chapter, we describe the design and implementation of the POINT experiment. While decisions were informed by the theoretical and empirical literature on performance-pay programs both within and outside the education sector, this literature left unanswered many questions about the relative advantages and limitations of different options for measuring and rewarding teachers.
After providing a thorough summary of the POINT intervention and relevant information that informed design decisions, we summarize major research and development activities from sum-mer 2007 through fall 2009.
2.1 design oF point
The components of the POINT intervention were informed by the empirical and theoretical literature on performance-pay programs from both within and outside the education sector. The relative advantages and disadvantages of various design components were considered in the context of their likely impact on student outcomes, teacher attitudes and behavior, and institu-tional dynamics. We emphasize, however, that the incentives used in POINT do not represent those that NCPI researchers viewed as optimal or most likely to improve student achievement. Rather, POINT was designed to test the hypothesis that altering the incentives faced by individual teachers will, in and of itself, produce gains in achievement. Several important considerations in determining the design included:
• A fixed performance contract incentive structure would be adopted so that teachers were not competing against one another for a fixed number of bonus awards.
• Awards would be made to individual teachers based on the performance of their students, not to teams of teachers or entire schools.
• Bonus criteria would be based on a measure of teacher value added, so that teachers were as-sessed on the basis of students’ progress in the course of a year and not their incoming level of achievement. This leveling of the playing field was deemed essential to obtain teacher buy-in.
• The performance threshold for a teacher to earn a bonus award should not be so high that the goal appeared unattainable, or so low that total bonuses paid out would exceed NCPI resourc-es.
• The bonus a teacher could earn should be large enough to provide strong motivation to im-prove performance.
• The intervention must contain monitoring mechanisms and safeguards to minimize opportu-nistic behavior (system gaming) that could threaten the validity of the experiment.

Final RepoRt: expeRimental evidence FRom the pRoject on incentives in teaching (point) / 27
2.1.1 teacher eligibility
The POINT experiment was open to middle school (grades 5, 6, 7, and 8) mathematics teach-ers working in the MNPS district during the fall of the 2006-07 school year. Teachers were not required to teach math full time. Rather, teachers could also teach students from other subjects, such as English language arts, reading, science, and social studies, as long they instructed at least 10 students in mathematics who were expected to take the math TCAP at the end of the school year. With fewer than 10 students, chance factors can play too great a role in determining whether a teacher receives a bonus.
Statistical reliability was not the only reason we required participating teachers to have at least 10 math students. We also worried that some teachers might object to the notion that an instructor with exceedingly few math students could win a bonus as an effective math teacher. Given that we needed teacher buy-in for the project to go forward, teachers’ perceptions were an important consideration. While these considerations argued for setting some floor for eligibility, the choice of 10 was arbitrary.
The 10-student threshold made many, though not all, special education teachers ineligible. While we gave some consideration to the idea of excluding all special education teachers, the fact that their classes differed from those of regular teachers did not appear to us a compelling reason, given the considerable heterogeneity across “regular” classes. Political considerations also played a role, in that we needed the support of the Tennessee Education Association (TEA) leadership and ultimately its members in order to conduct POINT. Excluding teachers from participating did not seem wise from the standpoint of building support.
All teacher volunteers had to sign up in the first year of the experiment. Late enrollments were not permitted. Teachers were assigned to a treatment group (eligible for bonuses) or a control group (not eligible). These assignments were permanent for the duration of the project. Partici-pating teachers remained eligible to participate even if they transferred schools, as long as their new school was within the MNPS district and the teacher still taught mathematics in at least one middle school grade. As a rule, teachers who were dropped from the experiment were not allowed to re-enroll even if they returned to their original teaching assignment. There were a few excep-tions. For example, a teacher on maternity/paternity leave remained eligible in the experiment as long as their leave was in accordance with district and/or state policy.
The POINT experiment focused on middle school mathematics for several reasons. First, there were not sufficient funds to set up an experiment that would cover teachers of all subjects at all grade levels. Second, previous research with achievement test data has shown that the effects of mathematics teachers can be identified more readily than the effects of teachers in other subjects. Third, unlike mathematics teachers in elementary schools, middle school mathematics teachers, on average, work with a larger number of students. Having a larger number of students improves the precision of the performance measure and provides a larger sample of students for the study for a given number of participating teachers. Finally, the TCAP is administered to all middle school grades, allowing us to calculate the same performance measures for all middle school

28 / national centeR on peRFoRmance incentives
teachers of mathematics. This would not have been the case in elementary or high schools, where not all grades and subjects are tested on a consistent basis in every year.
2.1.2 Fixed vs. Relative performance targets
Our first priority was designing a bonus system in which teachers would not compete against one another for bonuses. Instead, they would earn a bonus by meeting a fixed, predetermined stan-dard. This criterion was central to our design for several reasons. First, much of the literature on teacher merit pay attributes failure of these plans in large part to competition for awards, threat-ening teacher collegiality and cooperation (e.g., Murnane and Cohen, 1986; Milgrom and Rob-erts, 1990). Promotion of competition among teachers can lead to a breakdown in the collegiate ethos of schooling (Adnett, 2003).
Second, early conversations with the Metropolitan Nashville Education Association and the Ten-nessee Education Association made it clear that a rank-ordered (tournament) incentive scheme was objectionable, particularly if individual teachers were to be ranked and rewarded.
In addition, a fixed standard for earning a bonus would give teachers a clear target for improving individual performance over time. Under a relative standard, teachers would not know the level of performance required to earn a bonus.
2.1.3 Unit of accountability
Debate over the merits of individual as opposed to group incentives has so far failed to yield a firm conclusion. Rewards for individual performance avoid free-riding, but they also sacrifice the alleged benefits of peer monitoring. Team bonuses are also thought to be more acceptable to teachers, who tend to view themselves as collectively responsible for student learning and regard team bonuses as more fair.
An ideal experiment would test these claims by assigning some teachers to a treatment condi-tion in which they were eligible for individual bonuses and others to a condition in which bo-nuses were based on group performance. POINT was not large enough to implement this type of design. We chose to base awards on a measure of individual teacher value-added for two reasons. First, we effectively had no choice, given the insistence of key stakeholders that participation in the experiment be voluntary. The second reason was laid out in the introductory chapter. The expanding use of student test scores to measure the performance of individual teachers, together with the evidence of wide variation in teacher effectiveness, has stimulated widespread interest in incentive schemes that reward individuals rather than teams or schools. POINT is an attempt to learn what happens when such a scheme is implemented.
2.1.4 performance measures
To determine whether a teacher qualified for an award we used a relatively simple measure of teacher value-added. While more complicated and sophisticated measures could have been cho-

Final RepoRt: expeRimental evidence FRom the pRoject on incentives in teaching (point) / 29
sen, simplicity and transparency seemed desirable. First, we needed to attract a sufficient number of volunteers to the program. Awarding bonuses on the basis of measures no one could under-stand struck us as unhelpful. Second, we felt a transparent measure of performance would give teachers the best opportunity to see why they had or had not received a bonus, and if they had not, by how much they fell short. This might in turn provide stronger motivation to improve than if we were to use a less transparent measure.
In this respect, as in others, we designed POINT to give individual incentives the best chance (in our view) of affecting teacher performance and student learning. We particularly sought to avoid the criticism, if incentives were found not to have an effect on student outcomes, that we had de-signed the system in a such a way as virtually to ensure failure: “teachers rejected it as unfair,” “it was too complicated,” “the bonuses were too small,” “the targets were unattainable,” etc.
Our value-added measure was based on students’ year-to-year growth on the state achievement test, TCAP (literally, the current year test score less the prior year score). To control for the pos-sibility that students at different points in the distribution of scores are likely to make different gains (for example, students who start the year with lower scores may typically gain the most), we benchmarked each student’s gain against the average gain, statewide, of all students in the same grade and subject who also started the year with the same prior score.7 Benchmarking was simple: we subtracted the statewide average gain from a student’s own gain to find out by how much his growth had exceeded the state average. Thus, the progress of a student with a prior year score of 400 was measured against the progress of all students in Tennessee with a prior score of 400. This resulted in a set of benchmarked scores for each student in a teacher’s class: +4, -8, + 14, etc., rep-resenting the amount by which the student’s gain surpassed or fell short of the mean gain of the student’s counterparts statewide. Finally, we averaged these benchmarked scores over a teacher’s class—more precisely, over students continuously enrolled in the teacher’s class from the 20th day of the school year to the spring TCAP administration, and for whom we had the prior year scores needed for benchmarking.8 This average was the value-added score used to determine whether the teacher qualified for a bonus.
2.1.5 Bonus thresholds
To determine the thresholds at which teachers would qualify for bonuses, we calculated these performance measures for district teachers of middle school mathematics in the two years imme-
7 Some smoothing of the state mean gains was done to compensate for erratic patterns at the extremes of the distri-bution, where the number of scores can be quite small, even for the entire state.8 The continuous enrollment criterion is the same as the one used to determine whether students count for pur-poses of determining a school’s Adequate Yearly Progress (AYP) under No Child Left Behind (NCLB). Thus, two categories of students did not matter when determining whether a teacher had earned a bonus: students who did not count for the determination of AYP under NCLB, and students who lacked test scores in the prior year and who therefore could not be compared with state benchmarks. We are aware that the exclusion of some students could give teachers an incentive to neglect them and to concentrate their efforts on students whose performance would affect the bonus. However, in focus group meetings that we conducted at the time POINT was designed, teachers expressed strong opposition to being held accountable for students not in their classrooms the entire year (or very nearly the entire year). Alternative schemes, such as weighting a student’s score by the proportion of the year the student spent with the teacher, were not regarded as favorably or deemed as fair as the rule we adopted.
30 / national centeR on peRFoRmance incentives
diately prior to POINT, 2004-05 and 2005-06. We then set three thresholds based on the distri-bution of these measures: one at the 80th percentile, a second at the 85th percentile, and a third at the 95th percentile. Bonus-eligible teachers whose performance during POINT reached the lowest of these thresholds would receive a $5,000 bonus. Those reaching the middle threshold would receive $10,000, and those reaching the highest threshold would receive $15,000. These targets represented a compromise between two considerations. We wanted the thresholds to be high but not out of reach. Thus, it was important to establish that they were within the range of what the district’s math teachers had achieved in the recent past. At the same time, because our financial exposure was open-ended (in principle, all participating POINT teachers might have reached these thresholds), we did not want to set them so low that we were obliged to pay bonuses that exceeded the funds available.
It may be wondered whether we set the bar too high—that most teachers would regard even the lowest performance target as unattainable no matter what they did. At the same time, those with strong past performance might feel they did not need to make any changes in order to obtain bonuses. We have conducted an extensive analysis of this issue. In fact, neither statement appears to have been true of most teachers, to judge from performance in the pre-POINT years. Teachers’ subjective probabilities point to the same conclusion. Few thought they had little or no chance of winning a bonus; few also believed that it was a sure thing. We consider this issue at length in Appendix A.
We also wanted the maximum bonus to be large, on the assumption that modest awards would produce at best modest responses. It was our goal to learn what would happen if teacher compen-sation were restructured to include a substantial component tied to performance: would we see a substantial improvement in student learning in response? Although the maximum bonus was attainable only if teachers reached a threshold that was quite high by historical standards, we be-lieved the top figure would possess a salience that would motivate teachers, even if the probability of earning the top amount remained small. Anecdotal evidence suggests that it was, indeed, the top bonus on which teachers focused when discussing the magnitude of the awards.
The thresholds and the associated bonuses are depicted in Figure 2.1.
2.1.6 adjustments for other subjects
Many middle school teachers teach subjects other than mathematics. Tying bonuses solely to mathematics test scores might encourage them to neglect other subjects. To safeguard against this, we calculated an analogous benchmarked performance measure for each teacher in all four tested subjects, including reading/English language arts, science, and social studies. To receive the full bonus for which a teacher qualified on the basis of the mathematics performance measure, it was necessary to achieve the district’s median score on the other measures in all the subjects for which the teacher provided instruction. Falling short of that goal cost the teacher a portion of the mathematics bonus.
The precise formula incorporating these adjustments follows. Let T equal the bonus for which a teacher qualified, based on the performance of her students in mathematics (either $5,000,

Final RepoRt: expeRimental evidence FRom the pRoject on incentives in teaching (point) / 31
$10,000 or $15,000). Let Dk equal one if the teacher fails to achieve the district’s median score (in the historical distribution) in subject k, where k= math (M), English (E), science (S), and social studies (SS); otherwise Dk is zero. Finally, let Pk be the weight assigned to subject k, as determined by the number of students the teacher instructs in subject k relative to other subjects. Specifically, let Nk be the number of students the teacher has in subject k (where, as noted above, students are counted only if they are continuously enrolled in the teacher’s class from the 20th day of the school year). Then Pk = Nk/Σ j Nj, j = M, E, S, and SS. The teacher’s bonus is then given by Bonus= T × [1-PEDE-PSDS-PSSDSS]
FigURe 2.1performance standards and amount of Bonus awards in point intervention
Performance Measure
$15,000
(Level III)
$10,000 (Level II)
$5,000
(Level I)
3.6
(80th percentile)
5.9
(85th percentile)
12.5
(95th percentile)
$0

32 / national centeR on peRFoRmance incentives
2.1.7 summary
To summarize, Table 2.1 displays the design components, design elements, and a general defini-tion for these aspects of the POINT intervention.
taBle 2.1design components of the point intervention Design Component POINT Design Definition
incentive structureFixed performance contract
the scheme or mechanism that guides the allocation of awards in a pay-for-performance system. in some cases only a limited number of employees can earn an award, while in others any employee who meets a predetermined performance standard will receive an award.
Unit of accountability individual teachers
the entity responsible for a measurable product or service whose performance on that measurable dimension determines bonus eligibility. The unit of accountability can be defined in various ways, including the individual teacher, a grade-level or departmental team of teachers, all employees within a school, or some combination thereof.
performance measures outputs
the evaluation criteria for gauging employee performance, i.e., what should be evaluated, how appraisal criteria should be linked to rewards, and the measures and instruments that will assess performance.
standards and thresholds
threshold levels (i.e., step function)
determines the required level of performance for a school, team of teachers, or individual teacher to secure a reward. dictates the number of units that can earn a bonus as well as what scale or minimum standards these units must meet.
size of Bonus award
$5,000, $10,000, or $15,000 award amountsBonuses can be reduced based on performance of non-mathe-matics students
the size of bonus, or payout level, refers to the amount of the total bonus award a school, team of teachers, or individual can earn.
Bonus award distribution
hierarchicalindividualist
Bonus award distribution refers to the guidelines that deter-mine the share of teachers who receive a bonus award and how bonuses vary among employees.
payout Frequency one time per yearthe rate of award distribution as well as the time interval be-tween assessment of the incentivized activity and distribution of the performance award.
Adapted from M.G. Springer and R. Balch (2009). Design Components of Incentive Pay Programs in the Education Sec-tor. Paris, France: Organisation for Economic Co-Operation and Development.

Final RepoRt: expeRimental evidence FRom the pRoject on incentives in teaching (point) / 33
2.2 implementation oF point
2.2.1 teacher Recruitment
Teacher recruitment began in August 2006, when letters were mailed to all MNPS middle school mathematics teachers, offering a brief overview of the project and general information on the project. A similar summary was distributed via email by the Director of Schools to all eligible teachers. The initial communications also included a card that teachers could mail back express-ing their interest. In total, 154 teachers responded indicating interest in learning more about the POINT experiment, representing 36.4 percent of all eligible teachers.
Following the initial mailing, principals at each MNPS middle school were contacted by tele-phone and email to schedule site visits in which an NCPI staff member visited a school and an-swered questions concerning the project. These visits took place during a two-week period (Sept. 25, 2006 to Oct. 6, 2006), with trained staff members typically spending the entire school day on-site to answer potential participants’ questions. While representatives were available to an-swer teacher questions, they did not intentionally seek out teachers, not even those who returned response cards indicating interest in the experiment.
During the on-site visits, a set of Frequently Asked Questions (FAQs) was distributed to all inter-ested teachers, summarizing various aspects of the POINT research design, including stipends for participating in data collection, bonus award amounts for qualifying treatment teachers, eligibility requirements for participation, and bonus calculations procedures. (A copy of these FAQs appears in Appendix C.) If an NCPI staff member did not know an answer to teacher and/or principal questions about POINT, or the question was particularly sensitive from a design and implementa-tion standpoint, the question was reported to the center director and project coordinator on the same day the visit took place. The project coordinator drafted a response, which was then re-viewed by the center director and other key personnel, and the response to the question was sent within 24 hours after the close of school on the day of the site visit.
At the close of the teacher recruitment period, 296 teachers had volunteered to participate in the study, nearly one and a half times the targeted number.9 Teacher volunteers were then randomly assigned to either the treatment or control conditions, as described below. Teachers were notified of their group assignment in a letter dated Oct. 24, 2006. Follow-up email communications were sent to confirm receipt of assignment. All participants confirmed receipt of their assignment prior to Nov. 1, 2006.
Given that the school year begins in mid-August and the state conducts testing in April, these delays meant that approximately 3/8 of the potential instructional time had passed before teachers knew whether they were eligible for bonuses. In fact, the situation was worse than that, for final
9 To obtain a sufficient sample to detect an effect of .12 to .17 standard deviations in student test scores with power of .8, we calculated that approximately 200 teachers would be needed, 100 treatment and 100 control. We sought more than this, anticipating that attrition would reduce the number considerably by the end of the experiment. This proved to be so.

34 / national centeR on peRFoRmance incentives
approval of the project was not obtained until mid-January in a vote of teacher union members, three months before testing.10 Although approval was widely anticipated, participating teachers may have postponed any effort to improve their instructional practices until they were certain that POINT was going forward.11
2.2.2. teacher Randomization
Two features of the study design had implications for randomization:
• Teachers would remain in the same experimental condition (treatment or control) for all three years of the study; and
• The district would retain control of student assignments to classes and teachers. Thus, while POINT could randomly assign teachers to treatment and control groups, we could not ran-domly assign students.
The first of these features meant teachers would know whether they were in the treatment group and eligible for bonuses prior to receiving teaching assignments in the second and third years of the experiment. If treatment teachers took advantage of that knowledge to influence the make-up of their classes, systematic differences could be introduced between treatment and control groups that might be confounded with the effect of bonus eligibility on teaching performance. We will refer to this as the problem of purposive assignment.
Given the potential for purposive assignment to bias estimated treatment effects,12 we developed a two-stage randomization scheme that would be robust to such threats.13 If all teachers of a partic-ular course in a particular school (for example, seventh-grade regular mathematics) were assigned to the same experimental status (treatment or control), movement of students between sections of that course would leave the balance of treatment and control groups unchanged. Of course, some transfers could occur outside this group. Students might move from a more advanced to an easier course, or vice versa, if their original placement was deemed a mistake. However, reassign-
10 The January vote arose through circumstances best described as a fluke. In the same year that POINT was launched, a competing pay-for-performance plan sponsored by another Nashville group was proposed for a small number of schools, contingent on a vote of teachers in the affected schools. They voted it down. This led other members of the union to ask why our proposal was not also required to clear the same hurdle. Although the union leadership had already approved POINT, they felt that the procedures applied to one proposal had to be applied to the other, and at a late date (fall) it was decided that the district’s participation in POINT had to be put to a vote of the members. With the endorsement of the union leadership, the proposal passed. 11 These problems could have been avoided had NCPI been allowed a longer lead-in period to launch POINT. However, NCPI was required by the Institute for Education Sciences to launch POINT in the 2006-07 school year, only a few months after the award of the center. This haste is doubly regrettable in that the first year of the experi-ment, before significant levels of attrition took place, offered the cleanest test with the greatest statistical power of the effects of incentives. 12 Manipulation of student assignments is much less of a concern in the first year of the study, since students were assigned to classes before teachers were randomized into treatment and control groups. However, even in the first year teachers might attempt to influence the make-up of their classes by recommending certain students for transfers, objecting to the arrival of new students at mid-year, etc.13 While post hoc statistical adjustments could be used to account for the nonrandom assignment, we did not want to lose the advantages of random assignment.
Final RepoRt: expeRimental evidence FRom the pRoject on incentives in teaching (point) / 35
ment of students outside a course would be much less likely than reassignment within a course, and less apt to be made to accommodate a particular teacher’s wish than for educationally sound reasons.14 Thus we created four course-clusters within each school (grade 5 and 6 mathematics classes, grade 7 and 8 mathematics classes, special education mathematics classes, and algebra or more advanced mathematics classes). Each teacher was associated with one of these groups based on the courses taken by a plurality of the teacher’s students in the fall of 2006. (For example, an algebra teacher with one section of regular seventh-grade mathematics would be in the advanced math group.) Each course-cluster within a school (and the set of teachers associated with it) was then randomly assigned to treatment or control status.15
This basic scheme was modified in two respects. First, prior to assigning course-clusters, schools were stratified into 10 groups based on student TCAP scores in prior years. Randomization of course-clusters was then done within strata for better balance between treatment and control groups. In addition, some teachers were given an assignment that differed from the rest of the instructors in their course-cluster in order to ensure that all schools have at least one treatment teacher (to forestall a negative reaction on the part of teachers, should it become known that none of the participants in a school was eligible for bonuses).
Randomization by course-cluster gives us a way to estimate the response to treatment that is ro-bust to purposive assignment within the cluster. If all teachers offering instruction within a given cluster had the same experimental status (treatment or control), then to the extent that purpo-sive assignment affected only the assignment of students to teachers within the cluster, estimated treatment effects would be free of any bias. In fact, not all students taking a given course had teachers with the same experimental status. Some instructors were non-participants, and some (for reasons just noted) were assigned to a different status than the majority of the teachers of that course. The situation is analogous to the familiar problem of non-compliance of experimental subjects with their assignment to treatment or control status: because the assignment is random even if compliance is not, an intent-to-treat estimate can be obtained representing the average effect of the cluster’s status on students, whatever the particular status of the teacher they had. Alternatively, course-group status can be used as an instrument to estimate the effect of treatment on the treated.
14 Students could transfer across schools, of course, but with rare exceptions these decisions would be made by parents and would not constitute the purposive assignment of students to improve some teachers’ chances of earning bonuses.15 We could have achieved the same goal by randomizing entire schools, rather than course-clusters, to treatment or control status, a design that would arguably have yielded even greater protection against purposive reassignment of students between treatment and control classrooms. However, randomizing aggregate units such as course-clusters with schools or whole schools reduces the efficiency of estimated effects and the power to test for treatment effects. The higher the level of aggregation at which randomization occurs, the greater the loss in efficiency, as a rule—hence our preference for randomizing at the course-cluster within school level. In addition, we did not want to create schools in which none of the POINT participants had been assigned to treatment, as this might have been perceived to violate our promise that all teachers would have an equal chance to be assigned to the treatment group. (Although we could have randomized by school without violating that assumption, teachers unfamiliar with the mechanics of assignment by cluster within strata might not have appreciated that fact.)

36 / national centeR on peRFoRmance incentives
2.2.3 Roster audits
Calculating accurate performance measures required that student scores be correctly matched with the teacher or teachers who provided instruction. Several recent studies have identified significant errors in student-teacher links in both state- and district-level data systems, including inaccurate course codes, errors in identifying the teacher or record, and inaccurate class rosters (Battelle for Kids, 2009; Data Quality Campaign, 2009). Such errors could have significant conse-quences for the accuracy of the performance measure and the credibility of the measure among teachers. As such, NCPI undertook extensive audits to ensure students and treatment group teachers were accurately linked. (For additional details, see Section 3.3.3)
2.2.4 Bonus calculations, Bonus Reports, and stipend distribution
In late summer of 2007, 2008, and 2009, NCPI calculated the performance measures and bonuses awards for treatment group teachers. In August of each year, test score data for middle school students were received from MNPS. Scores for the current and prior school year were merged onto the adjudicated student roster for each teacher, along with state TCAP benchmarks provided by the state Department of Education. We then calculated a benchmarked score for every student with a prior year test score and computed teachers’ performance measures for mathematics and other subjects. Following the formula in Equation 2.1, we calculated the bonus award for each teacher in the treatment group. These procedures were replicated by two to three senior research-ers independently. This process was followed in each year to ensure the accuracy of the bonus calculations.
Once bonus calculations were complete, confidential bonus reports were prepared for each treat-ment group teacher. Each report showed how the teacher’s performance measure was calculated and whether that measure exceeded any of the thresholds entitling the teacher to a bonus (see Table 2.2). A roster of student scores used to calculate the teacher’s performance measure was also provided. In the event a teacher was responsible for instruction in the other TCAP subject areas (reading/language arts, science, and social studies), summaries of the performance of students in each of those courses were also included. Appendix C includes sample bonus reports, includ-ing examples of those for multiple subjects. To protect student privacy, student names were never included in the bonus reports; letters were always used to represent individual students.16
Bonus reports were mailed to treatment group teachers in September 2007, 2008, and 2009. Bo-nus awards were distributed to qualifying teachers in November paychecks.
16 To the extent that this reduced the transparency of the bonus reports and made it more difficult for teachers to see where and by how much they had fallen short of a bonus, the value of the information provided teachers was diminished. However, our agreement with the district stipulated that NCPI would not reveal scores of individual students.

Final RepoRt: expeRimental evidence FRom the pRoject on incentives in teaching (point) / 37
taBle 2.2sample Bonus summary ReportTotal Number of Students with Usable Test Results on Your Final Roster
number of students percent of total students
mathematics 10 100.0%
Reading/ language arts 0 0.0%
science 0 0.0%social studies 0 0.0%total 10 100%
Bonus Eligibilityaverage Benchmark difference for Your mathematics students 14.3
minimum difference to Qualify level one Bonus +3.6
level two Bonus +5.9level three Bonus +12.5
You are eligible to receive a level three Bonus for this school year.
district and school records indicate you were not responsible for the instruction of additional students in qualifying subjects other than mathematics.
Each POINT teacher received a stipend of up to $750 in each year of their participation in the experiment. (See Table 2.3) In return, teachers were required to participate in various kinds of data-collection activities. The stipend amount was reduced if teachers did not complete all of these activities. Teachers were notified of their stipend awards in letters sent out in the summer, with stipends paid in the late summer.
taBle 2.3ncpi payments to teachers
Stipend Awards Distributed
Bonus Reports Distributed
Bonuses Paid in Paychecks
Year 1-2007 september 5, 2007 september 30, 2007 november 16, 2007Year 2-2008 august 22, 2008 september 29, 2008 november 14, 2008Year 3-2009 september 12, 2009 september 30, 2009 november 13, 2009
38 / national centeR on peRFoRmance incentives
2.3 nUmBeR oF paRticipants and nUmBeR and amoUnt oF BonUses BY YeaR
Of the 296 teachers who initially volunteered to participate in POINT, only 148 remained through the end of the third year. This was consistent with historical rates of turnover among middle school mathematics teachers in MNPS, which have been high. Not all teachers who dropped out of the experiment took jobs outside the district. Some moved to elementary or high schools. Oth-ers stopped teaching mathematics or ceased to meet the requirement that they have at least 10 mathematics students. Only one teacher who continued to meet POINT’s eligibility requirements asked to be removed from the experiment. A full breakdown of attrition by year and destination is shown for treatment and control groups in Figure 2.2. A comprehensive analysis of attrition and its implications follows in Chapter Four.
Over the three years the experiment ran, POINT paid out more than $1.27 million in bonuses. A breakdown by year and bonus level appears in Table 2.4. Note that the number of bonus recipients held steady at around 40 in all three years, even though the number of participating treatment teachers declined. Sixteen teachers were one-time bonus winners, 17 repeated once, and 18 won bonuses in all three years. In all, 51—or 33.6 percent—of the initial treatment group of 152 teach-ers received a bonus over the course of the experiment.
taBle 2.4Bonus awards by Year
Year 1-2007 Year 2-2008 Year 3-2009# of treatment teachers 143 105 84# of bonus recipients 41 40 44# at $5,000 10 4 8# at $10,000 17 15 23# at $15,000 14 21 13average bonus award $9,639 $11,370 $9,623Total amount awarded $395,179 $454,655 $423,412
In the second and third years, bonus winners made up 38 percent and 53 percent of the treatment group still participating. This may be construed as an indication that financial incentives elicited a positive response from treatment teachers, as these figures far exceed the 20 percent that would have been expected to earn bonuses had performance continued at the historical level. This con-clusion is unwarranted, for three reasons. First, POINT participants were self-selected. High per-centages of winners could reflect positive selection into the experiment. Second, selective attrition may have disproportionately kept many above average teachers in the experiment. Finally, strong performance by treatment teachers could be part of an upward trend that raised scores across the board, among students of treatment teachers, control teachers, and non-participating teachers alike. Such an upturn in average performance in fact occurred in the second and third years of the experiment.

Final RepoRt: expeRimental evidence FRom the pRoject on incentives in teaching (point) / 39
Valid conclusions about the effect of incentives cannot be drawn from the number of bonus win-ners, but must be based on a comparison of outcomes in the treatment and control groups.
That said, it should be noted that from an implementation standpoint, POINT was a success. This is not a trivial result, given the widespread perception that teachers are adamantly opposed to merit pay and will resist its implementation in any form. This was not the case in POINT with 66.5 percent of eligible teachers volunteering to participate. As we will see in Chapter Six, par-ticipants expressed moderately favorable views toward performance pay. Although they became somewhat less positive over the course of the experiment, it was by no means the case that once they became familiar with the operation of the program, they turned against it en masse. The program ran smoothly. There were no complaints from teachers that they had not been paid their bonus, and few questions about why they were not entitled to a bonus. Teachers did not question the fairness of the randomization process or the criteria used to determine bonus winners. There were no efforts to sabotage POINT that came to our attention. Names of bonus winners were not leaked to the media. Performance measures were not made public (a fear expressed by some teachers in the pre-implementation focus groups).
No doubt some of the ease with which POINT ran was due to the understanding that this was an experiment intended to provide evidence on whether such performance incentives will raise achievement. Even teachers skeptical of the merits of the policy saw the value in conducting the experiment. We believe there is an important lesson here: teachers are more likely to cooperate with a performance pay plan if its purpose is to determine whether the policy is a sound idea than they are with plans being forced on them in the absence of such evidence and in the face of their skepticism and misgivings.

40 / national centeR on peRFoRmance incentives
FigURe 2.2consort diagram for teachers in point
teachers signing up but failing to engage (n=2)
eligible teachers not opting into the study (n=125)
all teachers who instruct at least one mathematics class in grades 5, 6, 7, or 8 and are responsible for 10 or more students expected to take the mathematics tcap test at the end of the school year (n=421)
allocated to treatment (n=152)
• eligible for bonus (n=143)• ineligible for bonus, less than 10 stu-
dents in math, still in study (n=6)• ineligible, no longer in mnps (n=3)
Beginning of Year 2, control (n=140)
• Remained in experiment (n=82)• dropped from study, less than 10 stu-
dents in math (n=9)• stayed within mnps middle school, no
longer teaching math (n=17)• stayed within mnps, no longer in middle
school (n=12)• ineligible, no longer in mnps (n=20)
Beginning of Year 2, treatment (n=149)
• eligible for bonus (n=107)• dropped from study, less than 10
students in math (n=5)• stayed within mnps middle school,
no longer teaching math (n=14)• stayed within mnps, no longer in
middle school (n=13)• ineligible, no longer in mnps
(n=10)
Beginning of Year 3, treatment (n=107)
• eligible for bonus (n=84)• dropped from study, less than 10
students in math (n=2)• stayed within mnps middle
school, no longer teaching math (n=5)
• stayed within mnps, no longer in middle school (n=11)
• ineligible, no longer in mnps (n=5)
Beginning of Year 3, control (n=82)
• ended 08-09 in experiment (n=64)• dropped from study, less than 10 stu-
dents in math (n=1)• stayed within mnps middle school, no
longer teaching math (n=5)• stayed within mnps, no longer in middle
school (n=6)• ineligible, no longer in mnps (n=6)
teachers enrolled in study (n=294)Randomized into treatment & control
allocated to control (n=142)
• Remained in experiment (n=140)• ineligible, no longer in mnps (n=2)
Year
3-2
009
Year
2-2
008
Year
1-2
007

Final RepoRt: expeRimental evidence FRom the pRoject on incentives in teaching (point) / 41
chapteR 3: data and data collection activities A large number of data elements were collected from multiple sources, including information from district and state information management systems, teacher and administrator surveys, hu-man resource paper records, and teacher and key stakeholder interviews. In addition to obtaining detailed demographic and background information on students, teachers, administrators, and schools, we collected data related to the outcomes and contextual factors that may have influ-enced the intervention outcomes as identified earlier in the conceptual framework.
3.1 sUmmaRY oF data collection activities
A schedule for all data collection activities is presented in Figure 3.1.
taBle 3.1 summary of data collection activitiesMonth, Year Data Collection Activityjuly 2006 teacher focus groups conductedaugust 2006september 2006october 2006november 2006december 2006january 2007February 2007march 2007 Teachers notified of forthcoming survey and interviewsapril 2007 survey administered to all point participants
Interviews conducted with stratified random sample of 146 teachersmay 2007 audit of teacher rosters conductedjune 2007 06-07 enrollment and course files cleaned and added to paneljuly 2007august 2007 06-07 TCAP file cleaned and added to panel
06-07 tcap statewide norms provided by the tennessee dept of education05-06 tcap data for students with test histories outside of mnps, within tennessee hand-collected, added to panel
september 2007october 2007 teachers assessed on knowledge for teaching patterns, functions, and algebra
(through november 16th)november 2007december 2007 teacher survey administered (through january 12)january 2008

42 / national centeR on peRFoRmance incentives
February 2008 march 2008april 2008 teacher survey administeredmay 2008 audit of teacher rosters conducted
math mentor/mentee interaction data collectedjune 2008 07-08 enrollment and course files cleaned and added to paneljuly 2008august 2008 07-08 TCAP file cleaned and added to panel
collection of data from teacher human resource paper records completed (began in august 2007)07-08 tcap statewide norms provided by the tennessee dept of education06-07 tcap data for students with test histories outside of mnps, within tennessee hand-collected, added to panel
september 2008october 2008november 2008december 2008 02-03 to 08-09 principal movement data collectedjanuary 2009 02-03 to 05-06 enrollment and course files cleaned and added to panel
teacher commuting data created and added to panelFebruary 2009march 2009april 2009 survey administered to participantsmay 2009 audit of class rosters conductedjune 2009 08-09 enrollment and course files cleaned and added to paneljuly 2009august 2009 08-09 TCAP file cleaned and added to panel
02-03 to 06-07 teacher absence data cleaned and added to panel 05-06 to 08-09 teacher professional development data cleaned and added to panel08-09 tcap statewide norms provided by the tennessee dept of education07-08 tcap data for students with test histories outside of mnps, within tennessee hand-collected, added to panel
september 2009october 2009 2007 and 2009 teacher license and endorsement snapshots cleaned and added to
panelnovember 2009 2008 and 2009 teacher login behavior into assessment management system (col-
lected bi-monthly since august 2007) collated and added to panel06-07 to 08-09 thinklink assessment data cleaned and added to panel
december 2009 07-08 and 08-09 teacher absence data cleaned and added to panel02-09 teacher covariate file cleaned and added to panel02-09 student covariate file cleaned and added to panel02-03 to 08-09 student annual census tract data cleaned and added to panel

Final RepoRt: expeRimental evidence FRom the pRoject on incentives in teaching (point) / 43
3.2 distRict and state administRative Files
3.2.1 enrollment Files
Student enrollment histories were collected from archived district student management system (SMS) snapshots that track daily enrollment transactions for every student within the district. As MNPS uses these records multiple times throughout the year for federal and state reporting, the extraction and utilization of these records follows well-developed processes validated by the district. Additionally, monthly error reports highlighting inconsistencies are shared with district data quality staff at both the central office and school level, ensuring the standardization of data reporting procedures by all personnel.
The enrollment records track all enrollment and withdrawal transactions during each school day. New enrollments to the school are tracked by the source of the student; specifically, from some-where within MNPS, from a non-MNPS Tennessee public school system, from a public school system outside of Tennessee, or from a private or home school setting. Withdrawal codes simi-larly track students’ destinations with further delineation into social categories such as juvenile detention, deceased, or a doctor-ordered withdrawal.
Also included in the enrollment file is the free/reduced lunch status of students. Students are cat-egorized as free, reduced or neither, and the status is windowed by dates to determine when each FRL status expired. These data were collected as potential student covariates in the estimation of treatment effects.
3.2.2 course Files
MNPS course files were extracted from the same student management system as MNPS enroll-ment files. They provided student-course-teacher linkages for students in grades 5-8. Whereas the enrollment files are truly transactional (every enrollment action was captured), student course records are retroactively constructed as a sequence of four to six data snapshots in the course of a school year, recording student course enrollments on a given day.17 Course schedules for students who enrolled for short time periods between snapshots are excluded through this process; an investigation using transactional course files, where available, found that this was a negligible por-tion of the student population.
Course files include students’ current class schedules with course codes and titles, schools, and teachers of record. NCPI further categorized every course as a core subject or a non-core subject, with the core courses further divided into Math, Reading, Language Arts, Science, Social Studies, and Reading/Language Arts (a combination of the two). Class period information was inconsis-tently tracked across school years and therefore was not included in our data set. This prevents us from evaluating peer or classroom-level effects, given that we are unable to distinguish students
17 The structure and completeness of archived transactional course files varied significantly between years and schools, necessitating reliance on these snapshots.

44 / national centeR on peRFoRmance incentives
taking the same course from the same teacher by period of the day. This limitation, however, does not threaten the student-teacher link.
The four to six snapshots available for each year were used to identify student inter- and intra-school course changes throughout the panel. Course records were checked against enrollment records to ensure consistency in the student-school match for all time periods. Further cleaning steps were completed to verify that students were enrolled in the appropriate number of classes in each snapshot without duplication. A spike in duplication errors (students with two full sets of courses) at a level of 2 percent to 3 percent was found in the 2004-05 school year when the district transitioned to a new student management system. Other years had error rates from duplicated records below .5 percent. Further investigation into teacher patterns revealed course loads and teaching patterns consistent with middle school norms.
3.2.3 additional student covariates
Additional information on student characteristics was obtained from a series of archived English language learner (ELL), special education, course grades, attendance, and discipline snapshots. ELL data were the most error-prone, as the data were collected in a stand-alone Access Data-base until the 05-06 school year. In subsequent years the data benefited from routine consistency checks. Two ELL variables were available —one indicating a student’s eligibility for ELL services, and the other indicating actual services received. As parents have the option to refuse or opt-out from ELL services, not all eligible students receive them. Students receiving services are a subset of students eligible for services. The two groups accounted for 8 percent and 10 percent of district enrollment, respectively.
Special education files exhibited fewer inconsistencies. Special education students were classified into three categories: zero to four hours of services per week; four to 22 hours of service per week; and over 22 hours of service per week. This generally corresponds to students receiving minor language and behavioral therapy (3 percent), more intense behavioral therapy (5 percent), and full-time services (3 percent), respectively.
Course grades were also incorporated into the panel. NCPI averaged end-of-year course grades (100-point scale) across all courses. Finally, a file from the information management system that tracks daily attendance status—including days suspended—was used to calculate average annual attendance and tardy rates, and the number of days each student was suspended during the year.
3.2.4 assessment Files
Student achievement was measured using results of the Tennessee Comprehensive Assessment Program (TCAP). To promote accurate results the district “pre-slugs” over 26,000 grade 4-8 answer sheets with student identification and demographic data. This process makes unnecessary large-scale hand-entering of student IDs.
All assessment results were cross-checked against MNPS’ student management system to vali-
Final RepoRt: expeRimental evidence FRom the pRoject on incentives in teaching (point) / 45
date IDs. The match rate was over 99 percent. An attempt to match electronically the remaining 1 percent of students was made on school, first name, last name, and birthday variables, with hand-matching completed on students remaining after the electronic match. In the 2007-08 school year, only three out of 32,426 TCAP cases were unmatched. No students were unmatched in the 2008-09 school year.
The TCAP tests are criterion referenced tests given in grades 3-8 to 98 percent of students en-rolled at testing time, with the remainder taking a special education Portfolio exam or absent for the entire length of testing. Math, Reading/Language Arts, Science, and Social Studies were assessed from 03-04 through 08-09. Mathematics and English/Language Arts are vertically scaled across grades, with scores ranging from 310 to 750; Science and Social Studies scores are scaled separately for each grade and year, with scores on a given test ranging from 120 to 280.
For each cohort of students who passed through MNPS middle schools during POINT, the Ten-nessee Department of Education provided NCPI with tables of average TCAP scores statewide for the same cohort, displayed by the value of prior year scores. These averages were used as bench-marks when calculating teachers’ performance measures, as described in Chapter Two.
While the Tennessee Department of Education provides MNPS with current-year TCAP results, MNPS’s Department of Assessment and Evaluation also obtains previous-year scores for students who were in their first year at the district but had been previously enrolled in another Tennessee school district. Prior year test scores are required to calculate growth for the performance mea-sures and to serve a covariates in our estimation of intervention effects.
To obtain prior year scores for students who were new to MNPS, MNPS staff searched each in-dividual student’s cumulative enrollment folder using a secure online information system main-tained by the Tennessee Department of Education. While extremely time consuming, this process enabled us to include information on as many students as possible when determining teacher bonuses and evaluating the effect of the incentives.
Student scores were also available from ThinkLink, a formative assessment program administered three times per year in mathematics and English/ language arts to MNPS students in grades 3-8. According to Discovery Education, which owns ThinkLink, the 40-question, multiple-choice assessments are predictive of performance on the statewide summative, TCAP assessment. 2008-09, the third year of the POINT experiment, was the first year that ThinkLink was administered district-wide in grades 3-8. While these data were not used to measure outcomes in the experi-ment, they were used to investigate whether treatment group teachers attempted to manipulate class rosters to improve their chances of earning a bonus.
3.2.5 teacher Files
Teacher demographic variables used in this study were obtained from human resources records. They include:
• Teacher Gender (indicator for female)

46 / national centeR on peRFoRmance incentives
• Race/Ethnicity (indicators for white and black)• Year of birth
Data on teacher preparation and licensure history include:
• Undergraduate degree major (indicator for mathematics major)• Undergraduate degree minor (indicator for mathematics major or minor)• Number of undergraduate mathematics credits earned• Highest degree attained (indicator for Bachelor’s only, Master’s only, or Master’s plus 30 cred-
its or an advanced degree)• Evidence of a previous or current alternative certification• Professional licensure (indicator for having a current professional license)
Data on teacher undergraduate experiences were collected from human resource paper records by district personnel. The paper records included teachers’ undergraduate and graduate transcripts, which served as the source for the number of mathematics credits earned throughout the teach-er’s post-secondary career. The transcripts also determined the teacher’s educational attainment: Bachelor’s only, Master’s only, or Master’s plus 30 credits or an advanced degree.
MNPS records the licensure of its teachers each year but does not maintain a historic record of licensure. The Tennessee Department of Education, which licenses teachers in the state, however, does maintain historic records on teachers’ licensure and provided this data for MNPS teachers to the study. We reviewed these historical licensure records beginning in the 1960s to determine if the teacher was ever classified as having alternative certification source. We also reviewed these data to determine the professional licensure status of teacher and created an indicator of whether or not each teacher was teaching under a professional license at the start of the 2006-07 school year.
Data on number of years of experience and tenure status were included in the following form:
• Year hired with MNPS• Total years teaching experience• Indicator for new teachers• Tenure status (binary indicator for tenured)
Year hired and teacher tenure status are variables collected from district electronic human re-source records. Teacher experience levels were gathered from both district and state records to capture teaching experience outside of MNPS. As MNPS has traditionally allowed incoming teachers to transfer no more than 10 years of external teaching experience into MNPS, collection of Tennessee experience helps to avert potential bias. Experience, tenure, years hired, and age were used to flag teachers who were new to teaching (teaching less than three years).
The following professional development and teacher absenteeism records were collected from district databases on a yearly basis (2005-06 through 2008-09):
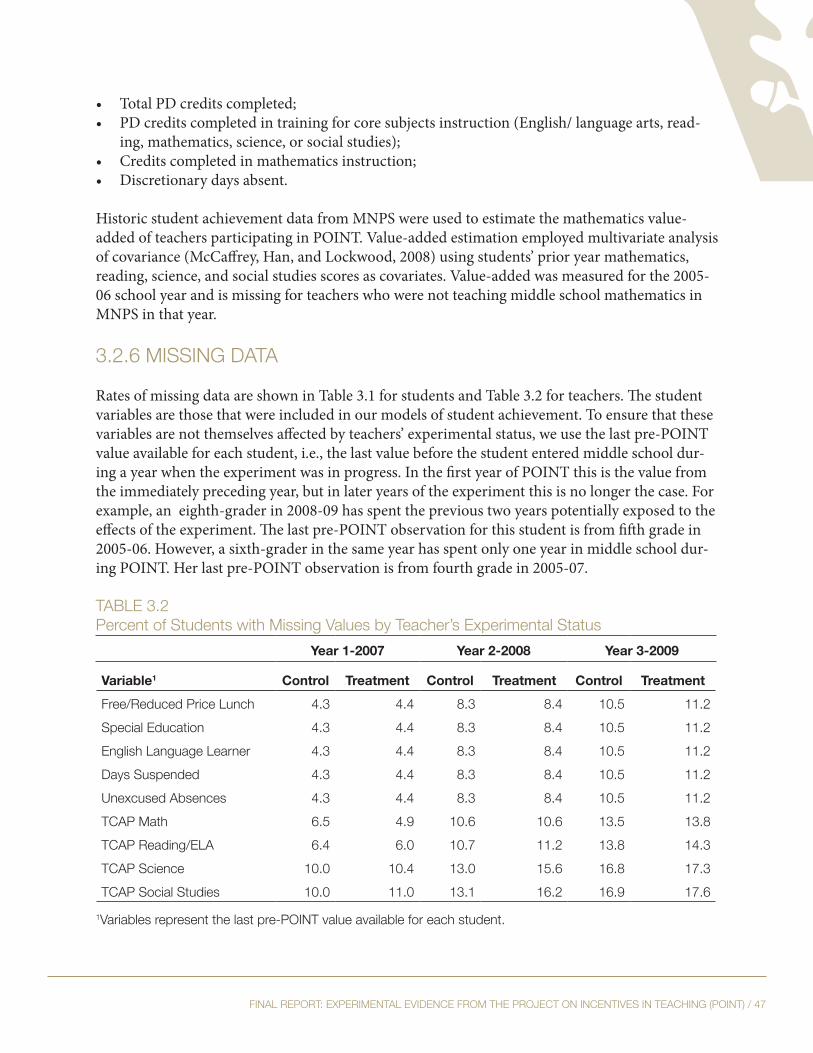
Final RepoRt: expeRimental evidence FRom the pRoject on incentives in teaching (point) / 47
• Total PD credits completed;• PD credits completed in training for core subjects instruction (English/ language arts, read-
ing, mathematics, science, or social studies);• Credits completed in mathematics instruction;• Discretionary days absent.
Historic student achievement data from MNPS were used to estimate the mathematics value-added of teachers participating in POINT. Value-added estimation employed multivariate analysis of covariance (McCaffrey, Han, and Lockwood, 2008) using students’ prior year mathematics, reading, science, and social studies scores as covariates. Value-added was measured for the 2005-06 school year and is missing for teachers who were not teaching middle school mathematics in MNPS in that year.
3.2.6 missing data
Rates of missing data are shown in Table 3.1 for students and Table 3.2 for teachers. The student variables are those that were included in our models of student achievement. To ensure that these variables are not themselves affected by teachers’ experimental status, we use the last pre-POINT value available for each student, i.e., the last value before the student entered middle school dur-ing a year when the experiment was in progress. In the first year of POINT this is the value from the immediately preceding year, but in later years of the experiment this is no longer the case. For example, an eighth-grader in 2008-09 has spent the previous two years potentially exposed to the effects of the experiment. The last pre-POINT observation for this student is from fifth grade in 2005-06. However, a sixth-grader in the same year has spent only one year in middle school dur-ing POINT. Her last pre-POINT observation is from fourth grade in 2005-07.
taBle 3.2percent of students with missing values by teacher’s experimental status
Year 1-2007 Year 2-2008 Year 3-2009
Variable1 Control Treatment Control Treatment Control TreatmentFree/Reduced price lunch 4.3 4.4 8.3 8.4 10.5 11.2special education 4.3 4.4 8.3 8.4 10.5 11.2english language learner 4.3 4.4 8.3 8.4 10.5 11.2days suspended 4.3 4.4 8.3 8.4 10.5 11.2Unexcused absences 4.3 4.4 8.3 8.4 10.5 11.2tcap math 6.5 4.9 10.6 10.6 13.5 13.8tcap Reading/ela 6.4 6.0 10.7 11.2 13.8 14.3tcap science 10.0 10.4 13.0 15.6 16.8 17.3tcap social studies 10.0 11.0 13.1 16.2 16.9 17.6
1variables represent the last pre-point value available for each student.

48 / national centeR on peRFoRmance incentives
Most missing values arise when students transfer into the district as middle-schoolers. As a re-sult, the incidence of missing values rises over the course of the experiment. (In the first year of POINT, missing values are largely limited to students transferring into the district in 2006-07. By the final year, students who have transferred into MNPS middle schools during any of the POINT years pose a problem.) If records are obtained from the school last attended, FRL eligibility, ELL status, special education, suspensions and absences are all known; if not, none of them is. Test scores are more likely to be missing (students coming from outside the state will not have taken TCAP; other students were absent during testing). Scores are more likely to be available for the more crucial tests in math and reading/ELA (required under NCLB) than for science and social studies. Despite these problems, the incidence of missing values never rises above 18 percent. There are no pronounced differences between treatment and control groups.
Table 3.2 presents missing data rates for teachers’ background variables. Most of these variables do not appear in our models of student achievement (recall that teachers were randomized into treatment and control groups, while students were not). However, we examine these background variables in assessing whether randomization successfully balanced treatment and control groups, in exploring the potential for bias resulting from teacher attrition, and when investigating teach-ers’ attitudes and behavioral responses to incentives. Rates of missing data are quite low for the demographic data, for course descriptions and for student characteristics.18 They range from about 5 percent to 16 percent for training and experience variables. Rates of missing data are higher for professional development, absenteeism, and an indicator for teaching mathematics the previous prior year, as these variables (all pertaining to the 2005-06 school year) are not available for teachers who were new to the district in 2006-07.19 The incidence of missing data is highest for teacher value-added (missing for anyone not teaching middle school mathematics in 2005-06). Rates of missing data are similar across the two experimental conditions for most variables. However, approximately one-third of treatment teachers are missing value-added, compared with one-quarter of control teachers.
18 Variables such as percentage ELL students need to be interpreted cautiously. A missing rate of 0 means that we were able to calculate a percentage for all teachers. It does not mean that the calculation was based on all students the instructor had in class (an impossibility, given the rate of missing data at the student level). 19 These variables are complete during the POINT years for teachers participating in the experiment.
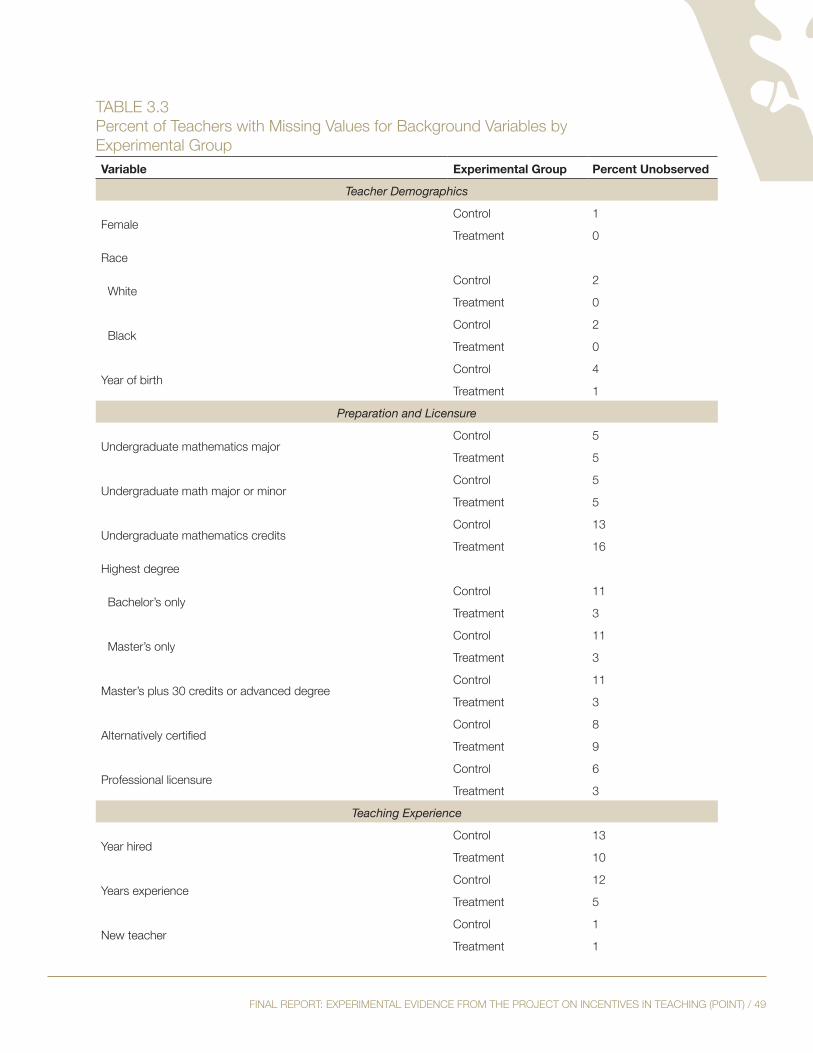
Final RepoRt: expeRimental evidence FRom the pRoject on incentives in teaching (point) / 49
taBle 3.3 percent of teachers with missing values for Background variables by experimental groupVariable Experimental Group Percent Unobserved
Teacher Demographics
Femalecontrol 1
treatment 0
Race
Whitecontrol 2
treatment 0
Blackcontrol 2
treatment 0
Year of birthcontrol 4
treatment 1
Preparation and Licensure
Undergraduate mathematics majorcontrol 5
treatment 5
Undergraduate math major or minorcontrol 5
treatment 5
Undergraduate mathematics creditscontrol 13
treatment 16
highest degree
Bachelor’s onlycontrol 11
treatment 3
master’s onlycontrol 11
treatment 3
master’s plus 30 credits or advanced degreecontrol 11
treatment 3
Alternatively certifiedcontrol 8
treatment 9
professional licensurecontrol 6
treatment 3
Teaching Experience
Year hiredcontrol 13
treatment 10
Years experiencecontrol 12
treatment 5
new teachercontrol 1
treatment 1

50 / national centeR on peRFoRmance incentives
tenuredcontrol 12
treatment 5
Professional Development
total credits, 2005-06control 13
treatment 10
core subject credits, 2005-06control 13
treatment 10
mathematics credits, 2005-06control 13
treatment 10
Teacher Performance
mathematics value-added, 2005-06 school yearcontrol 23
treatment 34
days absent, 2005-06 school yearcontrol 11
treatment 15
Teaching Assignment, Course Description
grade 5 or 6 mathematics teacher blockcontrol 0
treatment 0
grade 7 or 8 mathematics teacher blockcontrol 0
treatment 0
special education mathematics teacher blockcontrol 0
treatment 0
algebra or advance mathematics teacher blockcontrol 0
treatment 0
percentage of students in mathematics coursescontrol 0
treatment 0
Teaching Assignment, Student Characteristics
percentage white studentscontrol 0
treatment 0
percentage black studentscontrol 0
treatment 0
percentage special education studentscontrol 0
treatment 0
percentage english language learner studentscontrol 0
treatment 0
students’ average prior year tcap reading scoresccontrol 0
treatment 0
students’ average prior year tcap reading scoresccontrol 0
treatment 0

Final RepoRt: expeRimental evidence FRom the pRoject on incentives in teaching (point) / 51
3.3 teacheR and administRatoR sURveY data
Although improving student achievement is a central goal of pay-for-performance programs, there is a strong relationship between teacher attitudes and new policy interventions that may affect individual behavior and productivity in the school environment. Yet the specific contours of performance pay have not been extensively researched by social scientists. Public officials frequently lack any empirical base of knowledge about teacher perceptions of different types of performance pay schemes as well as the ways in which teachers may modify their workplace behavior in response to the implementation of a new policy intervention. Additionally, teacher attitudes may be shaped by school culture, specifically the quality of collegial relations and school leadership, which can have mediating effects on the impact of pay-for-performance programs. The complex sphere of teacher attitudes and experiences on pay-for-performance programs war-rants a systematic review of teacher behavior, interpersonal and organizational dynamics in order to understand these broader consequences of pay for performance in education.
3.3.1 teacher Behaviors and organizational dynamics (spring 2007, 2008, 2009)
NCPI administered surveys to all teachers participating in the POINT experiment in the spring 2007, spring 2008, and spring 2009 semesters. These data were used to examine differences and similarities between the control and treatment group, as well as any variability between teachers within the treatment group.
The surveys included items on teacher attitudes, behavior and instructional practice, and school culture. Surveys asked teachers about their opportunities for professional growth—whether they sought professional development/training beyond that which is required; the content, frequency, and format of training opportunities; and whether they participated in informal learning oppor-tunities at school (i.e., teacher networks, mentoring relationships).20
Surveys also asked teachers about their classroom practice —what resources did teachers use related to curriculum standards and assessments (i.e., curriculum guides, assessment training manuals); and did they use student achievement scores to tailor instruction for students’ indi-vidual needs.
Finally, surveys addressed contextual factors at school that may moderate the impact of pay-for-performance programs. We inquired about the quality of collegial relations and school leadership, as well as whether they work within a professional culture that values professional learning and growth.
Our survey data collection efforts were implemented using similar approaches to improve reli-ability of information (see Table 3.3). We also followed similar approaches in all survey years for: (1) pre-slugging surveys with de-identified tracking number; (2) compiling survey packages
20 All surveys administered as part of POINT can be found on the NCPI website at www.performanceincentives.org.
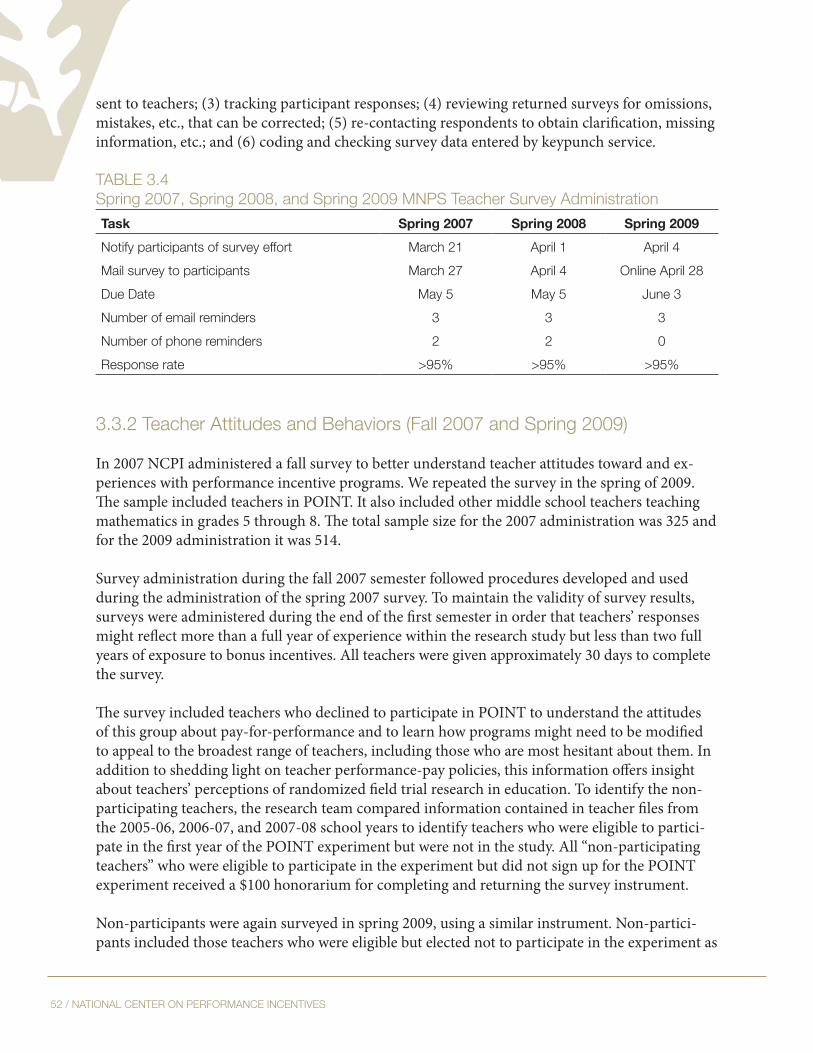
52 / national centeR on peRFoRmance incentives
sent to teachers; (3) tracking participant responses; (4) reviewing returned surveys for omissions, mistakes, etc., that can be corrected; (5) re-contacting respondents to obtain clarification, missing information, etc.; and (6) coding and checking survey data entered by keypunch service.
taBle 3.4spring 2007, spring 2008, and spring 2009 mnps teacher survey administrationTask Spring 2007 Spring 2008 Spring 2009notify participants of survey effort march 21 april 1 april 4mail survey to participants march 27 april 4 online april 28due date may 5 may 5 june 3number of email reminders 3 3 3number of phone reminders 2 2 0Response rate >95% >95% >95%
3.3.2 teacher attitudes and Behaviors (Fall 2007 and spring 2009) In 2007 NCPI administered a fall survey to better understand teacher attitudes toward and ex-periences with performance incentive programs. We repeated the survey in the spring of 2009. The sample included teachers in POINT. It also included other middle school teachers teaching mathematics in grades 5 through 8. The total sample size for the 2007 administration was 325 and for the 2009 administration it was 514.
Survey administration during the fall 2007 semester followed procedures developed and used during the administration of the spring 2007 survey. To maintain the validity of survey results, surveys were administered during the end of the first semester in order that teachers’ responses might reflect more than a full year of experience within the research study but less than two full years of exposure to bonus incentives. All teachers were given approximately 30 days to complete the survey.
The survey included teachers who declined to participate in POINT to understand the attitudes of this group about pay-for-performance and to learn how programs might need to be modified to appeal to the broadest range of teachers, including those who are most hesitant about them. In addition to shedding light on teacher performance-pay policies, this information offers insight about teachers’ perceptions of randomized field trial research in education. To identify the non-participating teachers, the research team compared information contained in teacher files from the 2005-06, 2006-07, and 2007-08 school years to identify teachers who were eligible to partici-pate in the first year of the POINT experiment but were not in the study. All “non-participating teachers” who were eligible to participate in the experiment but did not sign up for the POINT experiment received a $100 honorarium for completing and returning the survey instrument.
Non-participants were again surveyed in spring 2009, using a similar instrument. Non-partici-pants included those teachers who were eligible but elected not to participate in the experiment as

Final RepoRt: expeRimental evidence FRom the pRoject on incentives in teaching (point) / 53
well as those teachers who were ineligible to participate when implementation took place.
The survey instrument asked teachers about their perceptions of different types of pay-for-performance schemes (such as the importance of complementary and alternative methods for compensating teachers), as well as their specific experiences with the first two years of the POINT experiment. Teachers were asked about their sense of efficacy as professional educators and their general level of risk aversion and time preferences. NCPI also inquired about the quality of col-legial relations and school leadership, as well as whether teachers believed they worked within a professional culture that values professional learning and growth.
3.3.3 treatment teacher Roster audit survey (spring 2007, 2008, 2009)
To verify whether a particular student should be included in the class roster of students used to determine a treatment teacher’s bonus eligibility, NCPI obtained course enrollment files four times throughout the school year. NCPI analysts conducted extensive data cleaning and analysis to create rosters of students who counted for the determination of bonuses.21 A copy of this roster along with an introductory letter was mailed to each intervention group teachers. The teachers were required to verify the students listed on the roster were in fact the students in their class, and were informed that scores from these students would contribute to their performance measures. Teachers were asked to notify NCPI staff of any omissions or incorrect assignments on the rosters.
All teachers who requested changes received a formal follow-up from NCPI.22 NCPI analyzed several supplemental administrative data files when changes were suggested by teachers. In a few circumstances, personnel in the MNPS Department of Assessment and evaluation assisted in ef-forts to resolve roster discrepancies. Additional monthly course snapshots were accessed through an MNPS staff member to substantiate teacher roster claims.
Table 3.4 shows statistics on rosters created and appeals submitted for the three years of the POINT experiment.
21 Recall that we followed the NCLB rules: to count, students had to be continuously enrolled in a teacher’s class from the 20th day of the school year to the date on which TCAP was given in the spring.22 We did not undertake similar efforts to ensure accuracy of the rosters of teachers in the control group. This could have introduced subtle differences between treatment and control groups. To ensure that this did not con-taminate our estimates of the effects of treatment on student achievement, we used original, pre-cleaned rosters for that analysis—rosters, in other words, in which nothing was done for treatment teachers that was not also done for control teachers.

54 / national centeR on peRFoRmance incentives
taBle 3.5 point Rosters and appeals
YearRosters created
Total # of Appeals
# of Appeals Approved or
PartiallyApproved
Requested # of Student
Changes
# of Students Changed Plurality of Requests
Year 1-2007 143a 55 48 188 153intra-school transfers/spec ed pull-out
Year 2-2008 107 35 30 83 70 spec ed pull-outYear 3-2009 84 9 5 16 7 homebound studentsa six treatment teachers remained in the experiment but did not receive rosters because at the beginning of the year they had less than 10 students expected to take the tcap
Decreasing trends of appeals submitted reveal both an increased comfort level with the process by participants and the increasing quality of data and processing by the NCPI research team. The first two years of the experiment the district did not perfectly identify students who received special education pull-out services, and the first year of the experiment NCPI researchers did not attempt to identify intra-school transfers within the year. Both of these issues were solved by the third year, when very few appeals were submitted.
3.3.4 mathematics mentor activities survey (Fall 2007, spring 2008)
During 2007-08, eight mathematics mentors, all selected by the district, served as professional coaches and instructional assistants to aid math teachers in increasing their professional knowl-edge and improving teaching practice. Examples of possible topics included modeling lessons, team teaching, lesson planning, content and pedagogy development, classroom management, test preparation, alternative assessment strategies and PRAXIS review. Since each math mentor was assigned specific teachers with whom to work, the math mentors provide another way to monitor teacher responses to the performance-pay intervention. NCPI col-lected information from these mentors about the nature of their interactions with middle school math teachers. The mentors were involved in the development of the form that was used to collect data. Mentors responded to a maximum of five questions about their interactions with each teach-er served. If they had no interactions with a teacher, they responded to only two questions. If they had interactions with a teacher, they responded to three additional questions about the number and type of those interactions. The mentors were also asked to identify who initiated interactions with the teacher (the teacher, the principal, the mentor, etc.). NCPI research staff collected com-pleted booklets. The rosters were also collected and destroyed to preserve confidentiality.
The response rate was 100 percent for both administrations (fall and spring semesters) for the 2007-08 school year. However, NCPI discontinued this data collection effort in the 2008-09 school year when the district altered the role of math mentors so that mentors no longer inter-acted with teachers at the building level on a regular basis.

Final RepoRt: expeRimental evidence FRom the pRoject on incentives in teaching (point) / 55
3.3.5 principal surveys
In the summer of 2009, NCPI surveyed selected middle school principals in the Metropolitan Nashville Public Schools as to their perceptions of teacher behaviors and effectiveness for teach-ers who had some involvement in the POINT experiment. Using a one-page checklist, principals of middle schools where six or more teachers participated in at least one POINT data collection activity were asked to reflect upon various teacher characteristics including the teacher’s content knowledge and knowledge of pedagogy, the teacher’s interaction with various colleagues and stakeholders, and the teacher’s general effectiveness in the classroom. Principals were also asked for each teacher’s levels of education and years of experience.
Thirty-eight principals were asked to complete the survey. Nineteen completed checklists for 341 teachers. The information they provided was aggregated to examine possible variation in prin-cipal perceptions of POINT treatment group teachers, control group teachers, and non-partici-pants.
3.4 inteRvieWs With teacheRs and staKeholdeRs
3.4.1 teacher interviews (spring 2008, Winter 2010)
NCPI interviewed treatment and control group participants to gain further insight on teacher attitudes, behavior and instructional practice, and school culture. In the spring 2007 semester, we conducted interviews with a stratified random sample of half of all participant teachers, repre-senting both the treatment and control group.
Interviews supplemented the quantitative survey data with richer qualitative information. For example, while surveys asked about the type of professional development in which teachers par-ticipated, interviews were able to address why teachers sought such professional development and how well they believed the training met their needs. Interviews were also used to obtain more de-tailed information about teachers’ perceptions of the bonus program and how it impacted teacher practice, if at all.
NCPI analyzed responses from the spring 2007 interviews to determine whether any additional items and/or constructs should be included on the teacher survey instrument. It was determined the survey instrument did not require revision.
All interviews were one-on-one between a teacher and a research assistant with NCPI. Interviews were conducted at the school site and scheduled to accommodate interviewees’ schedule. All re-search assistants went through a one-day training seminar that provided a general overview of the POINT experiment, a review of the logic model for the POINT experiment, explanation of why questions were included on the interview protocol, guidance and professional tips on qualitative research, and time for conducting sample interviews and debriefing about those mock interviews. The project coordinator for the POINT experiment was responsible for scheduling all interviews, communicating with teachers, touching base with interviewers on a regular basis to discuss any

56 / national centeR on peRFoRmance incentives
issues, and hosting two debriefing session with all research assistants at the conclusion of the data collection period. All interviews were audio recorded and then sent to a professional transcrip-tions service. NCPI completed interviews with more than 95 percent of all randomly selected teachers participating in the POINT experiment.
3.4.2 Key stakeholder interviews (Fall 2006, 2009)
Telephone interviews with key stakeholders were conducted in September 2009. Conversations, each of which lasted approximately 45 minutes, were held with key Nashville education policy ac-tors, including the individual who served as superintendent of the Metropolitan Nashville Public Schools (MNPS) for most of the duration of POINT23, members of the MNPS school board, of-ficials of the Tennessee Education Association (TEA)24 and the Metropolitan Nashville Education Association (MNPS), representatives of the Alliance for Public Education,25 the former Nashville mayor, and NCPI researchers.
Individuals who were interviewed were questioned about the nature of their involvement in POINT (including their role in designing and implementing the experiment), their understand-ing of the objectives of POINT and views regarding the fidelity of program implementation, per-ceived challenges and successes of the experiment, preferences for POINT or some new teacher pay variant becoming a permanent part of MNPS policy, and lessons learned.
23 A different individual assumed the position prior to the conclusion of POINT.24 The TEA is the state union affiliate; the MNEA is the local affiliate. Both organizations are part of the National Education Association.25 The Alliance is a private organization dedicated to directing resources to Nashville public schools for projects related to improving student achievement.

Final RepoRt: expeRimental evidence FRom the pRoject on incentives in teaching (point) / 57
chapteR 4: thReats to validitY Although POINT was designed as a controlled experiment, for various reasons treatment and control groups may not have been equivalent on all relevant factors influencing student outcomes. We begin this chapter by reviewing three possible sources of treatment/control imbalance: un-lucky randomization, manipulation of student assignments to teachers, and teacher attrition. We review first various features of the experiment that give cause for concern. Second, we consider the evidence. How great are the differences between the students of treatment and control teach-ers? What are the characteristics of teachers who left the study, and how do they differ between treatment and control groups? Finally, where the preceding analysis has not dispelled concerns about validity, we describe various strategies to be undertaken in the empirical analysis, either to mitigate these threats or to test the sensitivity of our findings to assumptions about their magni-tude.
POINT rewarded teachers whose students had large gains on standardized tests. If test scores are found to have risen in the treatment group, it would appear that incentives have had the intended effect. However, in the broader sense, the conclusion that “incentives work” depends on the valid-ity of the tests themselves as measures of how much students have learned. Yet test results can be manipulated. An obvious instance arises when the performance measured by the test is not the student’s own—for example, when teachers alter answer sheets or coach students during an exam. But illusory gains can also be produced by less egregious behavior—such as narrowly teaching to the test, so that improvements do not generalize beyond a particular test instrument or fail to persist when the same students are re-tested the next year (Linn, 2000). We close this chapter by asking whether test results in treatment classrooms appear to have been manipulated to a greater degree than in control classrooms.
4.1 potential soURces oF tReatment/contRol gRoUpimBalance
Non-equivalent treatment and control groups might have arisen for the following reasons.
4.1.1 Unlucky Randomization
Though teachers were randomly assigned to treatment and control groups, imbalance can arise when the number of experimental subjects is small. The smaller the size of the groups, the greater the probability that the two groups differ by chance.
4.1.2 purposive assignment of students to teachers
POINT randomized participating teachers into treatment and control groups, but not their students. Because the assignment of students to teachers was controlled by the district, teachers may have attempted to manipulate the assignment process to enhance their prospect of earning a bonus. We will refer to this as purposive assignment of students. This could involve changing

58 / national centeR on peRFoRmance incentives
the courses a teacher is assigned, if it is thought to be easier to produce gains in some courses than others. Or it might involve nothing more than removing a disruptive student from a class or transferring students out of courses in which they are not doing well. If principals received more requests of this kind from treatment teachers, or if they accommodated a greater percentage of requests from this group, systematic differences might have been introduced between treatment and control classes that would bias estimates of the effect of incentives.
To protect against this possibility, NCPI took the following steps. (1) Principals were explicitly asked to run their schools during the POINT years just as they would have in the absence of an experiment. (2) Principals were not informed (by us) which of their faculty were participating in the experiment and whether they were treatment or control teachers. (3) Participating teachers were required to sign a declaration that they would not reveal to other employees of the school system whether they had been assigned to the treatment or the control group. We also pointed out that by keeping this information to themselves, they could avoid having to answer potentially awkward questions about whether they had earned a bonus.
We are unsure how effective these efforts were. On a survey administered to POINT teachers in the spring of the experiment’s third year, 72 percent of treatment teachers who were not them-selves bonus winners, along with 81 percent of control teachers, indicated that they did not know whether anyone in their school won a bonus based on results in the previous year. These figures may have been subject to an upward bias, given that teachers had pledged not to reveal this information to one another. Certainly, it would appear that NCPI was not completely successful in keeping the identities of treatment teachers secret. Moreover, even if principals did not know whether particular teachers were eligible for bonuses, they could have unwittingly abetted efforts to game the system by approving requests that treatment teachers were able to portray as educa-tionally sound—for example, assigning a teacher to a course in which the teacher deemed herself more effective, or moving a struggling or disruptive student out of a particular class.
4.1.3 teacher attrition
Differences in the rate at which teachers from treatment and control groups left the experiment can cause imbalances among the survivors (Figure 4.1). As shown in Table 4.1, participating teachers left POINT at a very high rate, with just more than half remaining through the third year. Most of this attrition was teacher initiated, although teachers with fewer than 10 math students were dropped from the experiment. Year-by-year attrition exhibits a spike in the second year of the experiment. Some (though certainly not all) of this spike is the result of granting teachers with fewer than 10 math students in 2006-07 a one-year reprieve, with the consequence that a disproportionate number of teachers who did not meet this requirement for a second year were dropped from the experiment at the beginning of 2007-08. Substantially more control than treat-ment teachers left in year 2, though that was reversed somewhat in the third year.26 The differ-ence between treatment and control groups in cumulative dropout rates at the end of year 2 was statistically significant in logistic regression models that controlled for randomization block and
26 The higher level of attrition among treatment teachers in year 3 is due to the fact that more treatment teachers remained in the study. As a proportion of survivors, the exit rate from the two groups was nearly the same.

Final RepoRt: expeRimental evidence FRom the pRoject on incentives in teaching (point) / 59
cluster (log odds ratio of dropout for treatment vs. control = -0.64, p = 0.02). The difference at the end of the study was not, though it came close (log odds ratio of dropout for treatment vs. control = -0.40, p = 0.12).
Teachers left the study for numerous reasons, among them changes in teaching assignment. Were treatment teachers more likely than control teachers to continue teaching middle school math-ematics, conditional on remaining in MNPS? The effect of treatment on assignment changes was marginally significant in year 2 and not significant in year 3.27 In year 2, the log odds ratio of changing an assignment for treatment vs. control was 0.47 (p=0.10) and in year 3 it was 0.28 (p=0.28). If the sample is restricted to teachers who taught at least 10 mathematics students, the log odds ratio of changing assignment for treatment vs. control was 0.54 (p=0.06). Because class size may be endogenous to treatment status (treatment teachers may make special efforts to ensure they continue to have 10 math students), in the remainder of this chapter we classify all dropouts together, whether teacher-initiated or the result of POINT administrators removing teachers with fewer than 10 students.
FigURe 4.1control / treatment survivor Rates
27 In this analysis, teachers who continued to teach mathematics but were dropped from POINT because the num-ber fell below 10 were classified as individuals who did not change their assignment.
!
0
10
20
30
40
50
60
70
80
90
100
12/9/2006 4/8/2007 8/6/2007 12/4/2007 4/2/2007 7/31/2008 11/28/2008 3/28/2009
Control
8/11/2006
Treatment
perc
ent o
f orig
inal
popu
latio
n st
ill in
stu
dy
date of attrition

60 / national centeR on peRFoRmance incentives
taBle 4.1number of teachers Who dropped out of the point experiment by treatment status and school YearExperimental Group 2006-07 2007-08 2008-09control 2 58 18treatment 3 42 23
Teachers dropped out of POINT for a variety of reasons (Table 4.2), most frequently because they left the district, stopped teaching middle school mathematics—although they remained teach-ing in the middle schools—or moved to elementary or high schools in the district. While there were some differences between the reasons given by treatment and control teachers, they were not statistically significant.
taBle 4.2Reasons for attrition by treatment status
Reason for AttritionChange in Assignment NCPI Initiated
In MNPS, not
teaching Retired
Moved to HS or ES
Left MNPS
Still teaching, not math
Dropped from experimenta
Less than 10 math students
control 8 0 14 27 18 1 10treatment 14 2 11 15 18 1 7
a one teacher declined to participate in the surveys and other aspects of the study and was dropped from the experiment; the other teacher was a long-term substitute who was not eligible and was dropped when status was revealed.
If dropouts were merely a random subset of all teachers, the fact that attrition was higher in the control group would not be a source of bias. However, the fact that attrition is systematically related to treatment status suggests it was not random; indeed, one would expect that treatment teachers who believed themselves to be of above average effectiveness with good chances of earn-ing a bonus would have been less likely to drop out than their counterparts in the control group. Moreover, on many observable dimensions, teachers who left the study differed from stayers. Teachers who dropped out by the end of the second year of the experiment were more likely to be black and less likely to be white. They tended to be somewhat younger than teachers who remained in the study all three years. These dropouts were also hired more recently, on average. They had less experience (including less prior experience outside the district), and more of them were new teachers without tenure compared with teachers who remained in the study at the end of the second year. Dropouts were more likely to have alternative certification and less likely to have professional licensure. Their pre-POINT teaching performance (as measured by an estimate of 2005-06 value added) was lower than that of retained teachers, and they had more days absent. Dropouts completed significantly more mathematics professional development credits than the teachers who stayed. Dropouts also tended to teach classes with relatively more black students
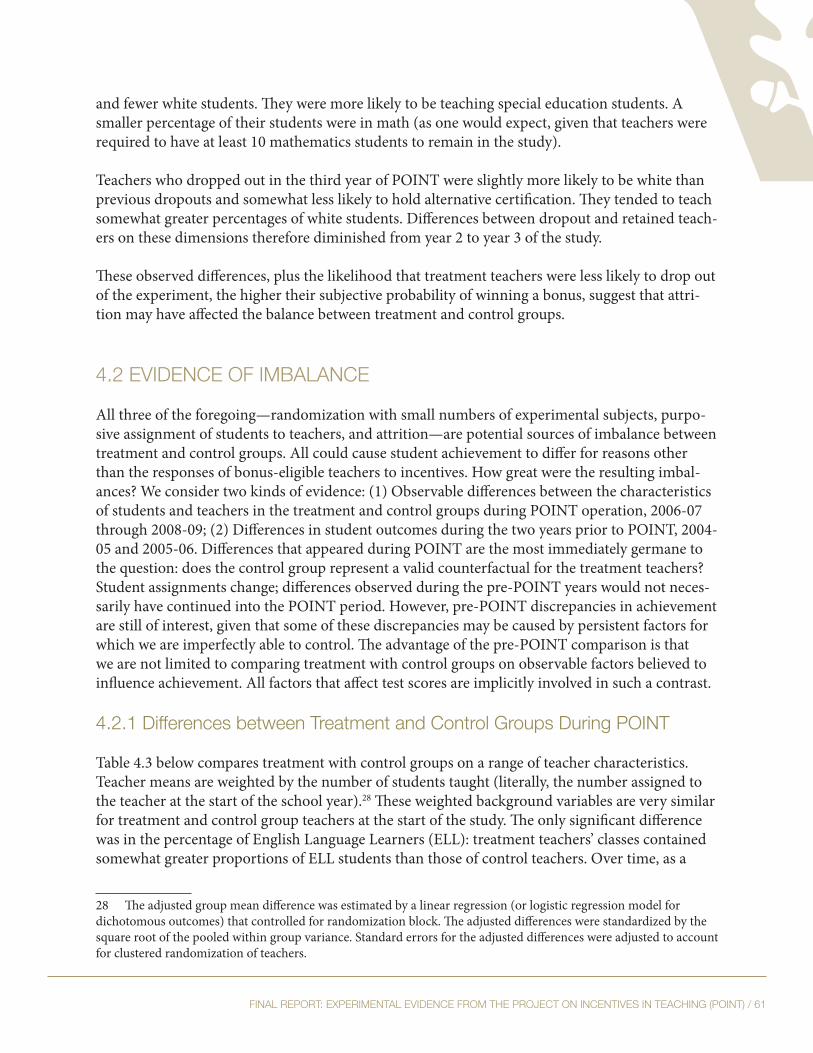
Final RepoRt: expeRimental evidence FRom the pRoject on incentives in teaching (point) / 61
and fewer white students. They were more likely to be teaching special education students. A smaller percentage of their students were in math (as one would expect, given that teachers were required to have at least 10 mathematics students to remain in the study).
Teachers who dropped out in the third year of POINT were slightly more likely to be white than previous dropouts and somewhat less likely to hold alternative certification. They tended to teach somewhat greater percentages of white students. Differences between dropout and retained teach-ers on these dimensions therefore diminished from year 2 to year 3 of the study.
These observed differences, plus the likelihood that treatment teachers were less likely to drop out of the experiment, the higher their subjective probability of winning a bonus, suggest that attri-tion may have affected the balance between treatment and control groups.
4.2 evidence oF imBalance
All three of the foregoing—randomization with small numbers of experimental subjects, purpo-sive assignment of students to teachers, and attrition—are potential sources of imbalance between treatment and control groups. All could cause student achievement to differ for reasons other than the responses of bonus-eligible teachers to incentives. How great were the resulting imbal-ances? We consider two kinds of evidence: (1) Observable differences between the characteristics of students and teachers in the treatment and control groups during POINT operation, 2006-07 through 2008-09; (2) Differences in student outcomes during the two years prior to POINT, 2004-05 and 2005-06. Differences that appeared during POINT are the most immediately germane to the question: does the control group represent a valid counterfactual for the treatment teachers? Student assignments change; differences observed during the pre-POINT years would not neces-sarily have continued into the POINT period. However, pre-POINT discrepancies in achievement are still of interest, given that some of these discrepancies may be caused by persistent factors for which we are imperfectly able to control. The advantage of the pre-POINT comparison is that we are not limited to comparing treatment with control groups on observable factors believed to influence achievement. All factors that affect test scores are implicitly involved in such a contrast.
4.2.1 differences between treatment and control groups during point
Table 4.3 below compares treatment with control groups on a range of teacher characteristics. Teacher means are weighted by the number of students taught (literally, the number assigned to the teacher at the start of the school year).28 These weighted background variables are very similar for treatment and control group teachers at the start of the study. The only significant difference was in the percentage of English Language Learners (ELL): treatment teachers’ classes contained somewhat greater proportions of ELL students than those of control teachers. Over time, as a
28 The adjusted group mean difference was estimated by a linear regression (or logistic regression model for dichotomous outcomes) that controlled for randomization block. The adjusted differences were standardized by the square root of the pooled within group variance. Standard errors for the adjusted differences were adjusted to account for clustered randomization of teachers.

62 / national centeR on peRFoRmance incentives
result of attrition, the treatment group came to have a higher proportion of students taught by female teachers and black teachers. Weighted means for the treatment group with respect to year hired, professional development credits, and days absent were significantly greater than the corre-sponding means for the control group in years 2 and 3. However, the differences are substantively small: half a day more of absences, one-third of a year in year hired. Importantly, no significant differences emerge in the variables that are arguably the most directly related to the experimental outcome: the estimate of teacher value-added from the 2005-06 school year, and mean prior-year student scores in math and reading.
taBle 4.3 standardized adjusted treatment vs. control group mean differences Weighted by number of students taught
Year 1-2007 Year 2-2008 Year 3-2009Teacher Demographics
Female 0.03 0.28† 0.35*Race White -0.03 -0.14 -0.11 Black 0.08 0.23† 0.21Year of Birth -0.18 -0.10 -0.12
Preparation and LicensureUndergraduate mathematics major 0.03 0.12 0.01Undergraduate math major or minor 0.15 0.25 0.22Undergraduate mathematics credits 0.10 0.10 0.08highest degree Bachelor’s only -0.03 -0.04 -0.17 master’s only 0.18 0.16 0.26master’s plus 30 credits or advanced degree -0.19 -0.16 -0.11Alternatively certified -0.18 -0.15 -0.11professional licensure -0.06 -0.04 0.03
Teaching ExperienceYear hired -0.15 -0.17 -0.34†
Years experience 0.10 0.07 0.07new teacher 0.09 0.14 0.10tenured -0.09 -0.08 -0.08
Professional Developmenttotal credits, 2005-06 -0.17 0.01 -0.07core subject credits, 2005-06 -0.08 0.02 0.02mathematics credits, 2005-06 -0.15 -0.02 0.08
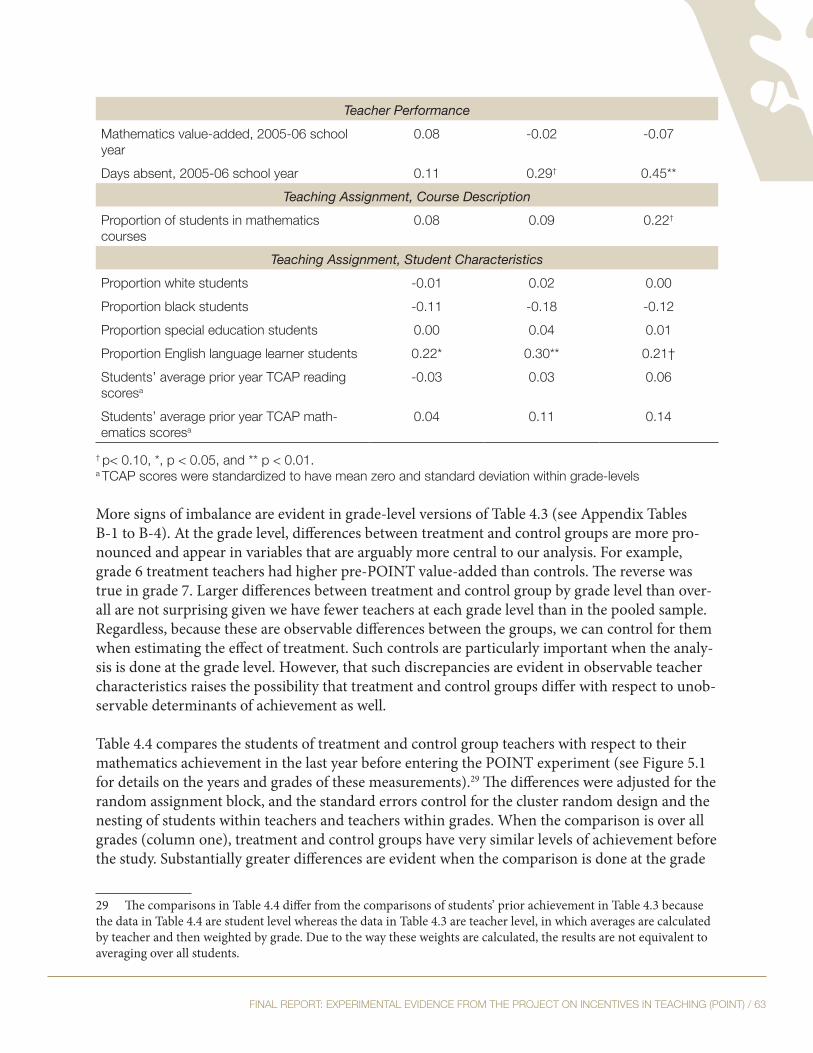
Final RepoRt: expeRimental evidence FRom the pRoject on incentives in teaching (point) / 63
Teacher Performancemathematics value-added, 2005-06 school year
0.08 -0.02 -0.07
days absent, 2005-06 school year 0.11 0.29† 0.45**Teaching Assignment, Course Description
proportion of students in mathematics courses
0.08 0.09 0.22†
Teaching Assignment, Student Characteristicsproportion white students -0.01 0.02 0.00proportion black students -0.11 -0.18 -0.12proportion special education students 0.00 0.04 0.01proportion english language learner students 0.22* 0.30** 0.21†students’ average prior year tcap reading scoresa
-0.03 0.03 0.06
students’ average prior year tcap math-ematics scoresa
0.04 0.11 0.14
† p< 0.10, *, p < 0.05, and ** p < 0.01.a tcap scores were standardized to have mean zero and standard deviation within grade-levels
More signs of imbalance are evident in grade-level versions of Table 4.3 (see Appendix Tables B-1 to B-4). At the grade level, differences between treatment and control groups are more pro-nounced and appear in variables that are arguably more central to our analysis. For example, grade 6 treatment teachers had higher pre-POINT value-added than controls. The reverse was true in grade 7. Larger differences between treatment and control group by grade level than over-all are not surprising given we have fewer teachers at each grade level than in the pooled sample. Regardless, because these are observable differences between the groups, we can control for them when estimating the effect of treatment. Such controls are particularly important when the analy-sis is done at the grade level. However, that such discrepancies are evident in observable teacher characteristics raises the possibility that treatment and control groups differ with respect to unob-servable determinants of achievement as well.
Table 4.4 compares the students of treatment and control group teachers with respect to their mathematics achievement in the last year before entering the POINT experiment (see Figure 5.1 for details on the years and grades of these measurements).29 The differences were adjusted for the random assignment block, and the standard errors control for the cluster random design and the nesting of students within teachers and teachers within grades. When the comparison is over all grades (column one), treatment and control groups have very similar levels of achievement before the study. Substantially greater differences are evident when the comparison is done at the grade
29 The comparisons in Table 4.4 differ from the comparisons of students’ prior achievement in Table 4.3 because the data in Table 4.4 are student level whereas the data in Table 4.3 are teacher level, in which averages are calculated by teacher and then weighted by grade. Due to the way these weights are calculated, the results are not equivalent to averaging over all students.

64 / national centeR on peRFoRmance incentives
level, with a difference of more than a quarter of a standard deviation in favor of the treatment group in grade 5 in 2007 and an equally large difference in favor of the control group in grade 7 in 2008. These differences underscore the importance of controlling for student characteristics such as prior achievement when estimating treatment effects at the grade level.
taBle 4.4treatment vs. control group differences in pre-point math achievement
Grade LevelYear All 5 6 7 8Year 1-2007 0.052 0.274* -0.029 -0.066 -0.086
(0.062) (0.104) (0.11) (0.126) (0.127)
Year 2-2008 -0.105 -0.009 -0.108 -0.265† -0.078(0.073) (0.13) (0.13) (0.148) (0.145)
Year 3-2009 -0.026 -0.015 0.002 -0.083 -0.03(0.070) (0.13) (0.115) (0.157) (0.133)
† p< 0.10, *, p < 0.05, and ** p < 0.01.
4.2.2. differences in achievement of students assigned to treatment and control teachers prior to point
Table 4.4 compares the pre-POINT achievement of students assigned to the classes of participat-ing POINT teachers during the experiment. However, it is also of interest to compare the achieve-ment of the students assigned to treatment and control teachers in the years before the experi-ment, given that such discrepancies may be caused by factors persisting into the POINT years. For this comparison we include only those students who were in a teacher’s classroom from at least the 20th day of the school year to the testing date. As we will be limiting our sample to this group when we analyze outcomes under POINT, it is reasonable to employ the same restriction when asking whether outcomes differed between treatment and control groups prior to the ex-periment. The use of the labels treatment and control during these years reflects the status teach-ers will have when the experiment starts. Thus, they are literally “future treatment” and “future control” teachers. Not all POINT participants taught middle school mathematics during these years; however, there is no reason to expect any systematic differences between the subset of treat-ment teachers for whom we have data in those years and their counterparts among the control group. The comparison of pre-experimental outcomes is reassuring. The differences are small and statistically insignificant in both years (-.03 in 2005 and .06 in 2006).30 Contrasts by grade level are
30 TCAP scale scores have been transformed to z-scores based on student’s rank-order. To remove any influence POINT may have had on the distribution of scores, the distribution of scores in the penultimate pre-POINT year, 2005-06, was used for this conversion. These z-scores have substantially smaller tails than the distribution of scale scores, conforming better to the assumption of normality used both in estimation and hypothesis testing. For details on this transformation, see Section 5.1.3.

Final RepoRt: expeRimental evidence FRom the pRoject on incentives in teaching (point) / 65
likewise statistically insignificant.31
4.3. additional analYses oF pURposive assignment and attRition Comparisons of the samples of treatment and control teachers are not the only evidence we have on the extent to which attrition or purposive assignment poses threats to the validity of conclu-sions from POINT. We now summarize some of this additional evidence.
4.3.1 intra-Year movement of students
If treatment teachers shed more of their low performers throughout the year, the resulting differ-ences in performance between treatment and control groups could be mistaken for differences in instructional quality.
We have estimated equations that predict the proportion of students who “switch out” of a teacher’s class during the course of a year. A student switches out if his last day in a teacher’s class occurs before TCAP administration in the spring. Such a student will not count for purposes of determining a teacher’s bonus. We find no evidence that treatment teachers behave more strategi-cally than control teachers in this respect—the difference in switching out rates between the two groups is less than one percentage point and is far from statistically significant (p=.37).32, 33
Treatment teachers might also behave strategically by resisting the placement of new students in their classes during the school year. Even though these students will not count against a teacher for purposes of determining bonuses, they might be viewed as diluting a teacher’s effort. To in-vestigate this behavior, we estimate a model predicting the proportion of a teacher’s math students who entered the class after the 20th day of the academic year (and whose performance therefore does not count toward the bonus). The difference between treatment and control teachers was again less than one percentage point and statistically insignificant (p=.74 for math, .68 for non-math students).
There remains the possibility that teachers behave strategically by requesting that struggling stu-dents be taken out of their classes. Note in this regard that a struggling student is not necessarily a student with low prior year scores. Treatment teachers might have preferred to instruct such stu-dents, expecting students with low prior scores to register the greatest gains. Moreover, when we estimate the effect of incentives, we can control for students’ prior scores, so that even if teachers do attempt to screen students with a particular prior history from their classes, we can control for
31 These comparisons controlled for randomization block and for students’ grade level. Random effects were as-sumed at the teacher course-cluster level, the teacher level, and the teacher by grade level, with uncorrelated student-level residuals. 32 All of the regressions described in this section included block effects to control for the fact that we randomized teachers to treatment and control status within blocks. They also included year and grade effects. Standard errors were corrected for clustering within course-clusters.33 An analogous test for non-mathematics students had a p-value of .69.

66 / national centeR on peRFoRmance incentives
that student characteristic when comparing treatment to control group outcomes. More troubling would be evidence that treatment teachers attempt to shed students who are doing worse in the current year than one would expect on the basis of prior history.
Fortunately we are able to test this hypothesis using data from formative assessments in math-ematics (the ThinkLink assessments described in Section 3.2.4). These assessments, introduced on a limited basis in 2007-08, were given to nearly all students the following year, the third year of the experiment. Three assessments were administered, one in early fall, one in late fall, and one in the spring semester. Performance on these assessments gives us an opportunity to observe what the classroom instructor could see—a student whose mathematics performance was substantially below what would have been expected on the basis of prior TCAP scores. Using data from 2008-09, we have estimated a model in which performance on the first assessment is the dependent variable. Regressors include an indicator for students who switch out. This indicator is interacted with treatment status to see if those students leaving the classes of treatment teachers have lower scores on the first assessment than do those who leave the classes of control teachers. No signifi-cant difference was found (p=.49). Nor was there a significant difference when we added a control for the prior year TCAP mathematics score (p =.27). We then repeated this analysis, using the score on the second formative assessment as the dependent variable and including the score on the first assessment as a regressor, thereby testing whether students who appear to be on a down-ward trend are more likely to leave treatment classrooms than control classrooms. Once again we found no difference (p=.68 without controls for the prior TCAP score, p=.92 with them).
4.3.2 changes in teacher Workload
Finally, we examined several workload indicators to determine whether there were significant dif-ferences in the jobs that treatment and control teachers were doing. First, we investigated whether either group taught a greater variety of subjects, involving more preparations. We constructed a Herfindahl index of subject concentration for each teacher. For this purpose we used four broad subject indicators interacted with the four grade levels to define subjects. Thus, fifth-grade science was a “subject,” as was seventh-grade mathematics, etc.34 We also considered whether treatment (or control) teachers simply had more students throughout the course of the year. We measured this in two ways: as a raw count of all students who showed up in their classes, and as a weighted count, where the weight represented the portion of the school year the student spent with that teacher. We looked for differences in the proportion of students in each of the four main subject areas, and in the proportion of students at each grade level. Finally, we calculated the proportion of the school year that a teacher’s students spent, on average, in that teacher’s classroom. Lower values mean more movement in and out, presumably making it more difficult for the teacher to do his job. With respect to none of these variables did we find significant differences at the 5 percent level between treatment and control teachers. Depending on the measure we use, treat-ment teachers have between two to four fewer students than do control teachers (p = .14). Differ-
34 In principle it should be possible to construct a finer measure of concentration using course codes: thus, seventh-grade algebra would not be treated as the same subject as seventh-grade basic mathematics. However, discrepancies and anomalies in the coding of courses made this infeasible, with some teachers apparently assigned implausibly many subjects.
Final RepoRt: expeRimental evidence FRom the pRoject on incentives in teaching (point) / 67
ences are small even when marginally significant. For example, treatment teachers have about two percentage points fewer social studies students (p = .08).
We did, however, find that treatment teachers were less likely to switch from the school they had been teaching in at the start of the POINT experiment to another middle school. The difference in mobility rates is six percentage points (p = .01). To the extent that it helps teachers to remain in a familiar setting, we would expect this to enhance the performance of treatment teachers’ vis-à-vis controls. Because this difference appears to have been induced by assignment to the treatment group, any resulting difference in outcomes could be viewed as part of the treatment effect. That is the viewpoint we adopt here, though we recognize that this does not represent “improved perfor-mance” in the sense that most advocates of pay for performance in education have in mind.
4.3.3. Which Kinds of teachers left the study?
We have conducted an extensive variable selection analysis to identify the teacher characteristics that predicted attrition from the study, testing for interaction between these variables and treat-ment status.35 There is little evidence that dropping out was a function of experimental treatment status. Of more than 20 variables examined —including teacher gender, teacher race, educational attainment, year hired, experience, tenure status, marital status, total and mathematics profession-al development credits (2005-06 school year), mathematics value-added (2005-06 school year), absences (2005-06 school year), proportion white students, proportion black students, propor-tion special education students, proportion English Language Learners, total number of students assigned to the teacher, number of mathematics students assigned to the teachers, and students’ last pre-POINT mathematics and reading scores – only gender had a significant interaction with treatment. Treatment effects were much smaller (nearly null) for male teachers than for female teachers. In short, by none of these measures is there any indication that the higher retention rate among treatment teachers was a function of teacher characteristics related to the probability of winning a bonus (experience, pre-POINT value-added) or to features of a teacher’s job that might have made it easier to earn a bonus (student characteristics, workload).
This may appear surprising. We earlier remarked that treatment teachers who believed themselves to have a high probability of winning a bonus ought to be more likely to remain in the experi-ment, other things being equal, than their counterparts in the control group. This would suggest that teacher characteristics related to the probability of earning a bonus ought to be associated with attrition rates. That they are not may be due to the fact that teachers do not appear to be very good at predicting their true probability of qualifying for a bonus. As we show in Appendix A, teachers’ subjective probabilities of qualifying for a bonus bear almost no relationship to whether teachers actually qualified. (See Figure A.3.)
Teachers’ attitudes about performance-based compensation and the POINT experiment could influence how they respond to the intervention. Using data from surveys administered to partici-
35 We also tested for interaction with teachers’ gender, as exploratory analyses suggested there was a strong inter-action between treatment and gender even though gender was not a significant predictor of attrition. Exploratory analyses did not suggest any other omitted interactions.

68 / national centeR on peRFoRmance incentives
pants each spring, we tested whether the effect of treatment on the likelihood of attrition varied with the following survey constructs:36
• Negative effects of POINT• Positive perceptions of POINT• Support for performance pay• Extra effort for bonus• Hours worked outside of the school day• Teacher’s estimate of his or her likelihood of earning a bonus.
Again we found no evidence that attrition among treatment teachers, compared with control teachers, was sensitive to any of these teacher measures.
Although we found no differences between treatment and control teachers who drop out (except for gender), it is possible that winning a bonus in the first or second year of POINT encour-aged teachers to stay, an effect that is obviously only possible for teachers in the treatment group. Likewise, receiving a low rating on the performance measure used by POINT to determine bonus winners might encourage a teacher to consider an alternative assignment. We tested this conjec-ture using data from the treatment group teachers who were notified in September of the second year of the experiment whether they had won a bonus in year one. While this was too late to affect their decision to continue teaching in 2007-08, this information along with their POINT performance measure could have influenced their decision about year 3 of the study. For the sample of treatment group teachers who remained in the study through year 2, we fit a series of logistic regression models to test for a relationship between their POINT performance measure (or whether they won a bonus) and the probability that they remained in the study through year 3. The first models include only the performance measure (or an indicator for winning a bonus), the next models include the performance measure (or winner indicator) plus baseline teacher background variables, and the final set of models include the performance measure (or winner in-dicator) interacted with the following variables: gender, our survey based measures of the negative effects of POINT, positive perceptions of POINT, support for performance pay, extra effort for bonus, hours worked outside of the school day, and each teacher’s estimate of his or her likelihood of earning a bonus.
Neither the performance measure nor the bonus status was significantly associated with the prob-ability of attrition between the end of year 2 and the end of year 3 in any of the models. However, our sample for these analyses is small, as it is restricted to the 107 treatment group teachers who remained in the study through the second school year. Of these only 23 (21 percent) dropped out the next year.
To conclude, treatment and control teachers were similar on a large number of background variables. Where they differed, the differences were evident at baseline and were not substantially altered by the fact that more control teachers left the study than treatment teachers. Even this was
36 SAS code used to create these survey constructs from the original survey items appears in Appendix I. A link to the POINT surveys can be found at https://my.vanderbilt.edu/performanceincentives/research/point-experiment/final-report-of-findings-from-point-experiment-2012/.

Final RepoRt: expeRimental evidence FRom the pRoject on incentives in teaching (point) / 69
largely a year 2 phenomenon, as the dropout rate among treatment teachers substantially caught up in the third year, so that differences in cumulative attrition rates were only marginally signifi-cant at the end of the experiment (p = .12).
Nonetheless, the fact that POINT retained a larger proportion of treatment teachers suggests that differential rates of attrition could be a source of bias. It is reassuring, therefore, that our best predictor of a teacher’s effectiveness, pre-POINT value-added, was distributed similarly in the two groups in all years of the study. The only exception arose in seventh grade, where statistically significant differences in favor of the control group emerged in the second and third years of the experiment. (A difference in the same direction also existed at baseline, but was not statistically significant in that year.) Moreover, teachers appear to be quite poor at predicting the probability they will earn a bonus, suggesting that self-selection of POINT dropouts may not be as great a cause for concern as first supposed.
Differential rates of attrition were observed between the first and second years of the experiment. This was before teachers were told whether they had won a bonus. Between years 2 and 3, attri-tion rates were the same among treatment and control teachers. Moreover, the increased attrition in the treatment group was not concentrated among the bonus losers: whether a teacher had re-ceived a bonus in year 1 did not affect the probability of dropping out of the experiment between years 2 and 3. Nor was the higher rate of attrition among treatment teachers associated with at-titudes toward performance-based pay.
4.4 thReats to validitY: Responses
POINT treatment and control groups were not perfectly equivalent. There were minor differences with respect to teacher characteristics. There were larger differences in student characteristics, notably race and prior-year achievement, that could be confounded with effects of incentives. In addition, differences between treatment and control groups with respect to teacher and student characteristics were considerably greater at the grade level, where sample sizes were smaller. Ac-cordingly, we control for student and teacher characteristics when estimating the impact of bonus eligibility on student achievement. (Estimates obtained without such controls are sometimes reported, though with caveats.)
This solution does not control for unobserved differences between treatment and control groups. Where such differences result from purposive student assignments to help treatment teachers win bonuses, we can avoid biased estimates of treatment effects by conducting our analysis at the level of course-clusters. This is analogous to an intent to treat analysis, in which the status of the cluster (treat-ment or control) replaces the status of an individual teacher as the explanatory variable of interest.While we include results of a cluster-level analysis in the next chapter, it should be recognized that high rates of attrition from the experiment pose a special problem for such analyses, given that more control teachers than treatment teachers dropped out. Even if the effectiveness of teachers leaving the experiment were known to be unrelated to treatment status, the fact that more of them left the control group than the treatment group has implications for average teacher quality at the cluster level: clusters in the control group will have more teachers new to middle school math (and perhaps new to teaching altogether), which is likely to have a negative impact on cluster

70 / national centeR on peRFoRmance incentives
performance. The possibility that differential rates of attrition were related to teacher effectiveness makes this problem still worse. Thus, while analysis at the cluster level substantially eliminates any bias resulting from purposive assignment, we suspect that it exacerbates bias from differential rates of attrition.
With respect to attrition itself, it might be thought that the problem could be made to disappear by defining the effect of treatment more broadly to include the impact of incentives on teacher turnover. Thus, treatment would affect student outcomes through two channels: an “effort” effect (teachers work harder to earn bonuses) and a “selection” effect (the best of the treatment teach-ers are more likely to continue teaching middle school mathematics). The selection effect would become one of the ways incentives alter outcomes rather than a source of bias.
The problem with this approach is not that this redefinition of the treatment effect is unreason-able, but that it does not solve the problem. The mean difference between outcomes in the treat-ment and control groups will not be an unbiased estimate of the treatment effect on student achievement, even under this broader definition, if the self-selection of treatment teachers in or out of POINT is a function of unobserved teacher and student characteristics. For example, suppose that in the absence of incentive pay, the probability that a teacher stops teaching middle school mathematics is a function of her ability plus the (unmeasured) engagement of her stu-dents, and that teachers with less engaged students are more likely to leave, ceteris paribus. Now suppose that incentive pay partially offsets this among teachers in the treatment group, depend-ing on how effective the teacher is. Then more effective treatment teachers who continue teach-ing middle school math will tend to have less engaged students than the average control teacher making the same decision, and unobserved student characteristics become confounded with the effects of treatment.
To mitigate any bias resulting from differential attrition, we have estimated student achievement models that include a variety of teacher-level covariates not in the baseline model. (See Chapter Five.) We have also estimated these models restricting the sample to the subset of teachers who remained in the experiment all three years. If there is a significant bias resulting from the self- selection of dropouts, we would expect to see that year 1 results using this sample differ signifi-cantly from year 1 results using the full sample (as yet unaffected by attrition). While this proce-dure does not correct for attrition-related bias, it does provide valuable evidence about its likely magnitude.
Another option for dealing with attrition is to condition on teacher quality by including teacher fixed effects in the model. However, there are some significant drawbacks to this approach. To estimate the effect of being eligible for bonuses, some teachers must switch status, from being ineligible to being eligible. Since treatment status was fixed during POINT, data from pre-POINT years must be used. However, as we will see in Chapter Five, pre-POINT achievement data can be quite unstable, with dramatic changes from year to year in the performance of students whose teachers will be assigned to the treatment group, compared with those whose teachers will be assigned to the control group. It is far from clear that pre-POINT performance represents an ap-propriate benchmark for the differences that would exist between these groups in the absence of the experimental intervention. Yet that is the assumption underlying the fixed effects analysis. In

Final RepoRt: expeRimental evidence FRom the pRoject on incentives in teaching (point) / 71
addition, there is a significant loss of data: one-third of POINT treatment teachers did not teach middle school mathematics prior to the experiment and will therefore contribute nothing to the estimated treatment effect. Finally, the fixed effects estimator becomes difficult to interpret when the response to treatment is heterogeneous. By 2009, nearly half the original POINT participants had left the experiment. Treatment teachers who remained may have been a select subset of the original treatment group—perhaps those most responsive to the incentive. If so, the fixed effects estimator does not furnish an unbiased estimate of the average treatment effect. It is, at best, an unbiased estimator of the effect of treatment on a subset of the treated. Though we present the results from models with teacher fixed effects in Chapter Five, along with other sensitivity tests, we note here that this is an imperfect device for dealing with teacher attrition. 4.5 illUsoRY test scoRe gains: did tReatment teacheRs manipUlate scoRes?37
In this section we ask whether teachers in the treatment group took steps to raise test scores other than by increasing student learning. The evidence we consider is necessarily indirect. The indica-tors are probabilistic in the sense that they indicate outcomes that are quite unusual but that could have occurred by chance in the absence of test manipulation. However, prior research suggests that these indicators do identify instances in which teachers have manipulated test results.38
Our first indicator is a classroom in which scores are high relative to how those same students tested in the previous year and relative to how they test the year following (Jacob and Levitt, 2003).39 In contrast, if large test score gains are due to a talented teacher, the student gains are likely to have a greater permanent component, even if some regression to the mean occurs. Hence, the first indicator of illusory gains is the extent to which a classroom’s mean performance in year t is unexpectedly large and the same students’ mean performance in year t+1 is unexpect-edly small.40
To create an indicator of whether a classroom’s test performance in year t is unexpectedly good (or poor), we regress the mathematics score of student i in year t in classroom c in school s on
37 This section contains a summary of analysis done for NCPI by Brian Jacob and Elias Walsh. The full text of their report appears as Appendix D below. 38 See Jacob and Levitt (2003) for more detail. In particular, an audit study in which a random selection ofclassrooms suspected of cheating (based on the measures described in this memo) were re-tested under controlled conditions several weeks after the official testing. A random sample of other classrooms (not suspected of cheating) was also re-tested. Classrooms suspected of cheating scored substantially lower on the re-test than they had on the official exam only several weeks earlier while the other classrooms scored roughly the same on the re-test and official exam.39 The term “classroom” is used to refer to all students taking a particular course from a particular teacher, what-ever the period of the school day. 40 Note that this indicator could also signal other behaviors that produce gains that are not sustained. Teaching narrowly to the test is one. Poaching on next year’s curriculum in the hope that students will be able to answer a few that would normally be too difficult (“low hanging fruit”) is another.

72 / national centeR on peRFoRmance incentives
measures of prior year achievement and a set of student and teacher-level covariates.41 Separate regressions were run for each grade/year in the analysis for a total of six: grades 5, 6, and 7 in
years 2007 and 2008. Classroom mean residuals are multiplied by Ntcs as an approximate cor-rection for sampling variability. Note that it is expected that large gains in one year will be fol-lowed by smaller gains the next (regression to the mean). We are looking for outliers with respect to this phenomenon: exceptional swings from one year to the next for the same group of stu-dents.42
The second indication of illusory gains is based on the pattern of student item responses, on the assumption that teachers who intentionally manipulate test results will generate unusual patterns in item responses. Consider, for example, a teacher who erases and fills in correct responses for the final five questions for the first half of the students in her class. In this case, there will be an unexpectedly high correlation between the student responses on these questions. We combine four different indicators of suspicious answer strings. The first is the probability, under the hy-pothesis that student answers within the same classroom are uncorrelated, of the most unlikely block of identical answers given by students in the same classroom on consecutive questions. The second and third measures capture the extent to which within-classroom deviations from the most likely answer to a given item (based on responses over the entire sample) are correlated. The first of these averages such correlations over items, reflecting the overall degree of correlation on the test. The second is a measure of the variability of such correlations across items. If a teacher changes answers for multiple students on some subset of questions, the within-classroom cor-relation on those particular items will be extremely high while the degree of within-classroom correlation on other questions will likely be typical. This will cause the cross-question variance in correlations to be unusually large.
The fourth indicator compares the answers that students in one classroom give with other stu-dents in the system who take the identical test and get the exact same score. Questions vary significantly in difficulty. The typical student will answer most of the easy questions correctly and
41 Student prior achievement measures include a quadratic in prior scores for all four core subjects (a total of eight variables), a quadratic in two years prior scores in all subjects (a total of eight variables), and missing value indicators for each of the eight test scores included in the regression (a total of eight variables). Prior test scores that are missing are set to zero so that these observations are not dropped from the regression. The student demographics, X, include dummies for male, black, Hispanic, and other race, a cubic in age, a quadratic in days suspended, a quadratic in un-excused absences, a quadratic in excused absences, binary indicators for ELL eligible, free and reduced lunch, special education status, and having multiple addresses during the current school year. The “classroom” demographics, C, include fraction male, black, Hispanic, other race, free or reduced lunch, and special education in the class, and a quadratic in class size. These are defined at the year-school-grade-teacher-course level, as close to a true classroom as the data allow us to get. 42 The statistic we employ is constructed by ranking each classroom’s average test score gains relative to all other classrooms in that same subject, grade, and year, and then transforming these ranks as follows:(3) SCOREcst = (rank_basecst)
2 + (1-rank_postcst)2
where rank_basecst is the percentile rank for class c in school s in year t and rank_postcst is the percentile rank for the same group of students in year t+1. Classes with relatively big gains on this year’s test and relatively small gains on next year’s test will have high values of SCORE. Squaring the individual terms gives more relatively more weight to big test score gains this year and big test score declines the following year.

Final RepoRt: expeRimental evidence FRom the pRoject on incentives in teaching (point) / 73
get most of the hard questions wrong (where “easy” and “hard” are based on how well students of similar ability do on the question). If students in a class systematically miss the easy questions while correctly answering the hard questions, this may be an indication that answers have been altered. Our overall measure of suspicious answer strings is constructed in a manner parallel to our measure of unusual test score fluctuations. Within a given grade and year, we rank classrooms on each of these four indicators, and then take the sum of squared ranks across the four mea-sures.43
We combine the two aggregate indicators —SCORE and STRING—to create a single indicator for each class-by-year combination. Classes with “high” values on both indicators are regarded as cas-es in which gains may be illusory (SUSPECTcst = 1). Of course, the definition of “high” is arbitrary. In this analysis, we consider classrooms that score above the 90th percentile on both SCORE and STRING.44 In order to determine whether these suspect cases were more prevalent among treat-ment classes, we regress this binary indicator on teacher treatment status and several covariates: a measure of the teacher’s value-added in the year prior to the experiment, the average incoming math score of students in the classroom, and fixed effects for the blocks within which random assigned occurred.45 The sample was restricted to teachers who participated in the experiment and students in grades 5, 6, and 7 in years 2007 and 2008 (so that all students remaining in MNPS would have the post-test observation needed to construct the SCORE variable).
Results are displayed in Table 4.5 below. Treatment classrooms were no more likely than control classrooms to be identified as suspect. Coefficients on the treatment indicator are both substan-tively and statistically insignificant. We do find that pre-POINT teacher value-added has a strong positive relationship to the dependent variable, but this is expected. Value added is a measure of teacher quality, and classrooms of effective teachers should look different by both measures: strong gains during the students’ year with that teacher followed by smaller gains the next year, and a greater likelihood that students in these classrooms will answer more questions the same way (correctly). Separate regressions run for each grade also fail to detect any relationship be-tween treatment status and the suspect indicator.
4.6 thReats to validitY: Final ReFlections
In this chapter we have examined several potential threats to the validity of conclusions about the effects of incentive pay that might be drawn from POINT. They included the possibility that randomization failed to produce balanced treatment and control groups; that treatment teach-ers gamed the system by manipulating course assignments and the make-up of their classes to
43 Specifically, the statistic is constructed as
STRINGcst = (rank_m1cst)2 + (rank_m2cst)
2 + (rank_m3cst)2 + (rank_m4cst)
2
44 Results were unchanged using alternative cutoffs corresponding to the 80th and 95th percentiles. See Appendix D.45 The value-added variable is set to zero if the teacher did not have a value-added score (for example, because the teacher was newly hired or newly assigned to teach math in 2006-07). Such cases were also distinguished by a binary indicator for missing value-added scores.

74 / national centeR on peRFoRmance incentives
enhance their chances of earning a bonus; and that higher rates of attrition among control teach-ers relative to treatment teachers meant the two groups were no longer equivalent in the second and third years of the experiment. We have also considered the possibility that teachers in the treatment group manipulated test scores, producing short-lived, illusory gains unconnected with students’ mastery of the subject being tested.
With respect to all of these concerns, the evidence is reassuring. Although treatment and control classrooms differed with respect to some characteristics, they were broadly similar. (There were more differences in subsamples defined by grade level.) There is no evidence that treatment teach-ers shed students who seemed likely to impair their prospects for earning bonuses. Attrition was related to treatment status (more control teachers left), but it did not produce treatment classes likely to have higher performance, at least by measurable characteristics of teachers and students. Suspicious patterns of test score gains, suggestive of the manipulation of scores, occurred no more frequently among treatment than among control classrooms.
We close this chapter with an additional observation pointing to the same conclusion. Most of the threats we have considered are one-directional: their impact on measured outcomes, if any, would have been to increase performance in the classes of treatment teachers relative to control teachers. Attempts by treatment teachers to manipulate the make-up of their classes would clearly work in this direction, as would other kinds of system-gaming, such as coaching students during exams, altering answer sheets, teaching narrowly to the test, etc. Likewise, if lower attrition from the treatment group meant more effective treatment teachers stayed in the experiment in order to qualify for bonuses, scores should have risen vis-à-vis the control group.
In fact, no such effect was seen. As noted in the executive summary (and explained at length in the next chapter) overall there was no significant difference between student outcomes in treat-ment and control classes. Given that we have failed to detect a positive incentive effect, it is dif-ficult to see how there could have been much of a positive bias.46
46 Of course, it is conceivable that the effect of incentives was actually negative and was masked by various positive biases. This seems far-fetched, both on theoretical grounds and given the evidence in favor of more plausible alterna-tives: that serious threats to validity failed to materialize, and that teachers did not alter their behavior very much in response to incentives.
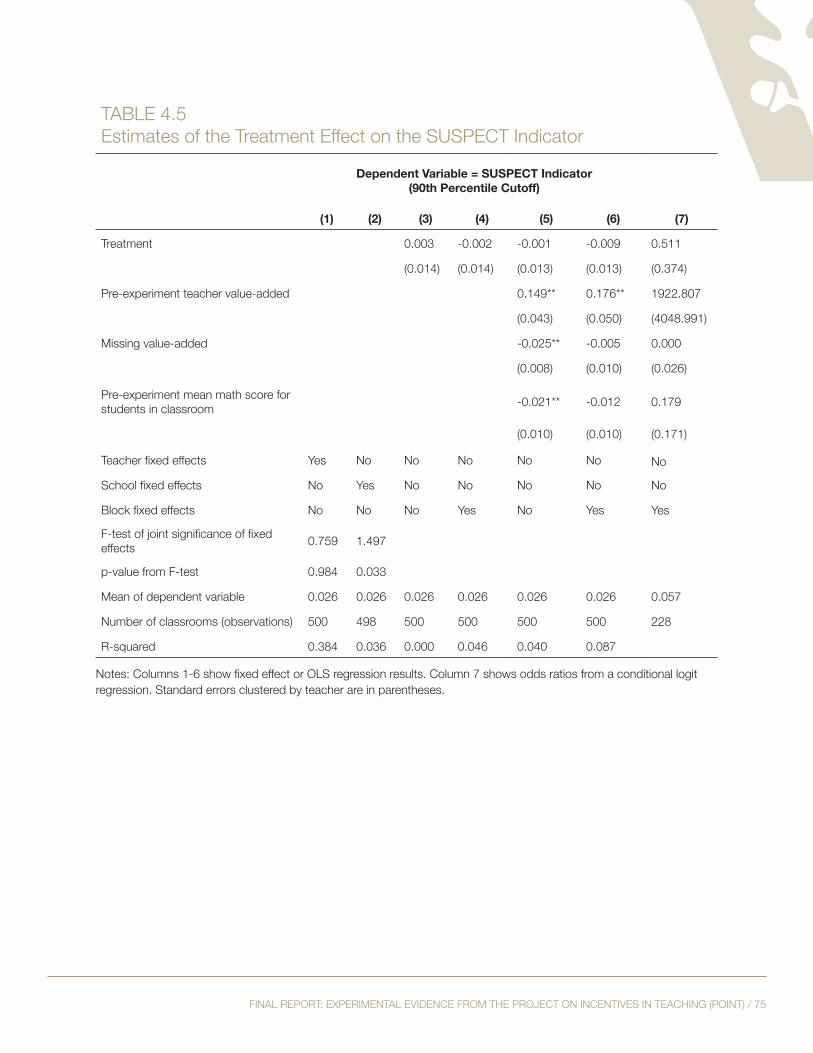
Final RepoRt: expeRimental evidence FRom the pRoject on incentives in teaching (point) / 75
taBle 4.5estimates of the treatment effect on the sUspect indicator
Dependent Variable = SUSPECT Indicator (90th Percentile Cutoff)
(1) (2) (3) (4) (5) (6) (7)
treatment 0.003 -0.002 -0.001 -0.009 0.511
(0.014) (0.014) (0.013) (0.013) (0.374)
pre-experiment teacher value-added 0.149** 0.176** 1922.807
(0.043) (0.050) (4048.991)
missing value-added -0.025** -0.005 0.000
(0.008) (0.010) (0.026)
pre-experiment mean math score for students in classroom -0.021** -0.012 0.179
(0.010) (0.010) (0.171)
Teacher fixed effects Yes no no no no no no
School fixed effects no Yes no no no no no
Block fixed effects no no no Yes no Yes Yes
F-test of joint significance of fixed effects 0.759 1.497
p-value from F-test 0.984 0.033
mean of dependent variable 0.026 0.026 0.026 0.026 0.026 0.026 0.057
number of classrooms (observations) 500 498 500 500 500 500 228
R-squared 0.384 0.036 0.000 0.046 0.040 0.087
Notes: Columns 1-6 show fixed effect or OLS regression results. Column 7 shows odds ratios from a conditional logit regression. standard errors clustered by teacher are in parentheses.
76 / national centeR on peRFoRmance incentives
chapteR 5: the impact oF incentive paY onstUdent achievement
The ultimate purpose of changing teacher compensation is to improve outcomes for students in our nation’s schools. As discussed in Chapter 2, the evidence on how well performance-based pay serves this goal is limited and mixed. This chapter adds to this evidence base by analyzing the effects of the POINT intervention on student achievement, as measured on TCAP. Of course, standardized test scores are only one measure of learning. Others, such as attainment or lifelong productivity, may be of greater interest. However, student achievement on state tests is the curren-cy of school evaluation and of great interest to policy makers and educators. Because achievement gains on state tests were the basis for the bonus awards, teachers had a direct reason to improve students’ scores: if POINT incentives had an effect, presumably it would be most evident here.The chapter first describes the methodology and the data used to estimate the effect of bonus-eligibility on student achievement. It then presents results, followed by sensitivity analyses testing the model’s assumptions and exploring possible explanations for our findings.
5.1 model speciFication
POINT ran for three years. Each additional year provided teachers additional time to make adjustments to their teaching to improve their chances of earning a bonus. With each additional year, treatment teachers also received more information about their performance as measured by the award metric. Hence, there is potential for the effects of the intervention to vary across years. Effects may also differ by grade level. Students in different grades took different tests and had varying amounts of exposure to teachers in the intervention. The majority of fifth and sixth grade students were in self-contained classrooms in which teachers provided instruction in multiple subjects. This was typically not the case in grades 7 and 8, when mathematics instruction was generally provided by teachers specializing in math. Also, due to the way teachers were assigned to treatment and control groups (by course-cluster), sixth and eighth grade students in treatment (control) classes in years 2 and 3 of the experiment were likely to have had a treatment (control) teacher in the preceding year. As a result, there is variation in total years of exposure to the inter-vention: sixth and eighth grade students were apt to have had multiple years of exposure if they had any; students in grade 5 always had at most one year of exposure; and about half of the treat-ment students in grade 7 had multiple years of exposure and half only a single year. Consequently, results at different grades might be measuring different degrees of exposure to teachers eligible for bonuses.
Given that the strength of these factors is unknown, we employed several models to look for the impact of incentive pay: one specifying a single overall effect, pooling data across grades and years; and others that examine separate effects by year, by grade, and by grade and year. Our linear mixed models account for the way teachers were randomized into treatment and control groups (Raudenbush and Bryk, 2002). In addition, over the three years of the experiment we ob-tained repeated measures on both students and teachers. These units were not nested, for students
Final RepoRt: expeRimental evidence FRom the pRoject on incentives in teaching (point) / 77
moved across teachers in a variety of cross-classified patterns as they progressed through grades. Finally, data were not available for all students and teachers on the full set of covariates for which we wished to control. Dealing with missing data added further complexity to models that were already quite complicated. For computational tractability, it was necessary to restrict some mod-els, as noted below.
5.1.1 Unobserved differences in Blocks, clusters, teachers, grades, and Years
As described in Chapter Two, NCPI divided district middle schools into 10 strata. Strata were fur-ther subdivided into four course-clusters: fifth and sixth grade mathematics classes, seventh and eighth grade mathematics classes, special education mathematics classes, and algebra or more ad-vanced mathematics classes. Each teacher was associated with one cluster based on the course(s) taken by a plurality of the teacher’s students. With four clusters per school and 10 strata, there were potentially 40 blocks within which randomization was conducted. Empty cells reduced the actual number to 37. Each cluster-within-stratum unit was assigned to treatment or control status, with individual teachers acquiring the status of the cluster with which they were associated. (This status applied to all their courses, even those falling outside the cluster.) Because randomization occurred within blocks, all of our models included block fixed effects: thus inferences about the effect of incentives are based on within-block variation in outcomes and not on variation across blocks. The models also included grade-by-year fixed effects to account for unobservable factors causing system-wide volatility in scores (such as changes in the difficulty of a test).
We assume that the unobserved influences on student achievement operate at a variety of levels. One is the course-cluster to which teachers were assigned when initially randomized into treat-ment and control groups. (For example, teachers in the same cluster might share lesson plans.) At a lower level of aggregation, we assume a random teacher effect and a random teacher-by-grade effect (allowing for the possibility that a teacher is not equally effective at all grade levels). All of these effects were permitted to vary across years: thus, they are actually course-cluster-by-year effects, etc. This is implicit when separate models are estimated for each year, explicit when data are pooled across years.47 Individual students are observed more than once when data are pooled across years. In this case, within-student covariances over time are unrestricted. Residual errors of different students are assumed to be independent.
Obviously other specifications were possible. We might have specified a school effect operating above the level of the cluster. Below the teacher-by-grade level, we might have specified a teacher-by-course effect. Our choices were shaped by our judgment of which factors were most important, bearing in mind the need for computational tractability. We also conducted extensive testing of these specifications using randomization analyses (Efron and Tibshirani, 1993). In these analyses we artificially generated several hundred samples of spurious “treatment” and “control” groups, using the same randomization procedures that were actually followed but varying the coin-toss (literally, the draw from a random number generator) that determined whether a teacher would be in the treatment or the control group. We then calculated student achievement contrasts
47 The same holds of the block fixed effects, which are literally block-by-year effects.

78 / national centeR on peRFoRmance incentives
between the “treatment” and “control” groups so generated. For some tests we used pre-POINT values, for others test scores from POINT. Either way, such contrasts in the re-randomized data have an expected value of zero. In the latter case, their empirical distribution mimics the distribu-tion of the test score difference under the null hypothesis that treatment had no effect. In the for-mer case, it mimics the distribution of the pre-experiment treatment/control difference under the hypothesis that assignments were truly random. When model specifications failed to capture all the relevant sources of variation in the data, reported p-values were too low when compared with the tail probabilities of the same contrasts in the empirically generated distribution: the contrasts appeared statistically significant using model-based standard errors, whereas the randomization analysis showed that contrasts of that magnitude had a high probability of arising by chance. As we introduced more richly specified models, allowing for additional random effects, reported standard errors corresponded more closely to those obtained from the randomization analysis and the p-values from the model converged to those from the randomization inference.
5.1.2 observed student and teacher covariates
To improve precision and to control for differences between treatment and control groups that might have arisen for reasons other than chance (e.g., attrition), we adjust for a variety of pre-POINT student characteristics including achievement in each of the four TCAP subjects, race/ethnicity, gender, English Language Learner (ELL) classification, special education participation, free and reduced price lunch participation, and the numbers of days of suspension and unexcused absences. Covariates were measured by taking the value from the most recent year outside of the experimental frame (grades 5-8 from 2006-07 to 2008-09). For time-invariant characteristics such as race and gender, this made no difference; for others, using the most recent pre-POINT value avoided including potentially endogenous covariates in the model. The point in a student’s academic career at which these variables were measured consequently varied by grade level and cohort. For instance, the student-level covariates for an eighth grade student in year 1 (the 2006-07 school year) were measured when the student was in seventh grade in the 2005-06 school year. The same covariates for eighth graders in year 2 (the 2007-08 school year) and year 3 (2008-09) were the values from grade 6 in the 2005-06 school year and grade 5 in the 2005-06 school year, respectively. See Figure 5.1 for details.

Final RepoRt: expeRimental evidence FRom the pRoject on incentives in teaching (point) / 79
FigURe 5.1grade and Year of covariate measurements by grade and Year of study participation and outcome measurementsGrade and Year of Covariate Measurement
Year and Grade of Outcome Measurement
Year 1-2007 Year 2-2008 Year 3-2009Year grade 5 6 7 8 5 6 7 8 5 6 7 8
2006
4 x x x5 x x x6 x x7 x
2007 4 x x2008 4 x
To avoid dropping observations with missing values, we employed a pattern mixture model. Students were assigned to one of four common missingness patterns: no missing covariates, miss-ing science and social studies test scores, missing scores in all four tested subjects, missing FRL eligibility, ELL status, special education, suspensions and absences as well as test scores (See Table 3.1). Missing values were set to zero and separate coefficients were estimated for the covariates within each pattern.48 All of these terms were interacted with both grade and year to account for potentially different associations between the covariates and the test score outcomes from differ-ent grades or years. Thus, for a single student-level covariate 48 coefficients were estimated (four grades times four missingness patterns times three years). Variances of the residual (student-level) errors were permitted to differ across missingness patterns. This is important: residual errors of students without pre-experiment test scores are substantially more variable than those of students with such scores. Other error variances were assumed constant across missingness patterns and grades (though not years). Table 5.1 reports the number of observations by missingness pattern in each of the three POINT years. Column percentages are given as well as a raw count. As expected
48 This is a generalization of a commonly used method of dealing with missing data, in which the missing covari-ate is set to an arbitrary value (say, zero or the sample mean) and a dummy variable for observations with missing values is added to the model. Here a dummy variable is defined for each pattern of missing values and interacted with the covariates that determined these patterns. Observations that did not fit one of the four most common patterns of missing data were made to fit by setting some covariates to missing. A small amount of data was lost in this way at a considerable gain in computational tractability. The pattern mixture approach does not in general yield unbiased estimates of a model’s parameters, even when data are missing at random. If it is necessary to control for X in order to obtain an unbiased estimate of the coefficient on W, a pattern mixture model fails because the dummy variable that is a proxy for a missing X is not the value that is needed. However, when W is assigned at random, so that the role of covariates is to improve precision, not to protect against bias, the foregoing objection does not apply. This is not quite the case here: we include covariates both to improve precision and to guard against bias arising from attrition and purposive assignment. Given that the evidence of bias from these sources is not particularly strong, we deemed a pattern mixture model the best available option for dealing with the problem of missing data. For comparison, our sensitivity analyses include results from a complete case analysis in which we have discarded records with incomplete student-level data. These results appear in Appendix E.

80 / national centeR on peRFoRmance incentives
from the discussion in Chapter Four, the incidence of missing data increases in the later years of the experiment and in the upper grades. However, the percentage of complete cases (pattern 1) never drops below 74 percent in any grade or year.
taBle 5.1 number of sample observations by missingness patternYear Pattern Grade
5 6 7 8 All Grades
Year 1- 2007
1 2,792 3,240 3,060 3,446 12,53885.62 86.1 84.72 85.23 85.41
2 245 279 275 296 1,0957.51 7.41 7.61 7.32 7.46
3 70 101 114 126 4112.15 2.68 3.16 3.12 2.8
4 154 143 163 175 6354.72 3.8 4.51 4.33 4.33
total 3,261 3,763 3,612 4,043 14,679
Year 2- 2008
1 1,848 2,315 2,085 2,263 8,51184.19 82.3 80.47 78.91 81.31
2 169 317 304 385 1,1757.7 11.27 11.73 13.42 11.23
3 62 93 105 94 3542.82 3.31 4.05 3.28 3.38
4 116 88 97 126 4275.28 3.13 3.74 4.39 4.08
total 2,195 2,813 2,591 2,868 10,467
Year 3- 2009
1 1,376 2,107 1,450 2,075 7,00891.37 81.86 74.28 74.72 79.56
2 89 285 343 452 1,1695.91 11.07 17.57 16.28 13.27
3 32 85 89 123 3292.12 3.3 4.56 4.43 3.73
4 9 97 70 127 3030.6 3.77 3.59 4.57 3.44
Total 1,506 2,574 1,952 2,777 8,809Definition of missingness patterns: “1”—No missing variables. “2”—All student-level covariates missing. “3”—Only prior test scores missing (all four subjects). “4”—Only science and social studies test scores missing.

Final RepoRt: expeRimental evidence FRom the pRoject on incentives in teaching (point) / 81
The models also included three teacher-level covariates: an estimate of a teacher’s value-added in mathematics from the year prior to POINT (set to zero when missing), a binary indicator that this variable was unobserved (POINT participants who did not teach middle school mathematics in 2005-06), and the average pre-POINT mathematics score of a teacher’s students. The first two of these variables were constant through the three years of the experiment, the third varied with the make-up of a teacher’s classes.
Finally, the models included teacher treatment status in one of three ways: 1) a single treatment indicator representing an overall intervention effect; 2) treatment effects by year; and 3) treatment effects for each of the 12 grade-by-year cells. Separate models were fit for each of these three cases using REML estimation with the lme routine available in the R environment. Except for the first, they were also independently estimated using the xtmixed command in STATA. The two sets of estimates agreed to several decimal places.49
5.1.3 outcome variables
Outcomes are students’ TCAP criterion referenced test scores during the experiment time period. Scale scores provided by the test maker have heavy tails that may invalidate assumptions of nor-mality used to interpret results. We therefore transformed the scores using rank-based z-scores to improve the plausibility of the assumption that residual disturbances are distributed normally. To avoid distorting the relative performance of treatment and control groups, we standardized the scores by grade and subject relative to the distribution of the entire district in spring 2006, the last pre-POINT testing period. Specifically, we used the district-wide TCAP data from 2005-06 to create a mapping between TCAP scale scores and percentiles in the district, with separate map-pings by grade and subject. For all other years, we assigned to every scale score the corresponding percentile of the 2006 grade/subject distribution, using linear interpolation to estimate percentiles for scale scores that were not observed in 2006.50 The percentiles were then transformed by the standard normal inverse cumulative distribution function. We report results on this standardized scale. We also created an alternative standardization of rank-based z-scores computed by grade and year within the district, without anchoring to the 2006 base year. Results based on the alter-native scaling were substantively identical to the results reported below.
Because POINT awarded bonuses primarily on the basis of students’ gains in mathematics, our main interest is in mathematics outcomes. Middle school students were also tested in reading, sci-ence and social studies. As described in Chapter Two, these scores were also factored into bonus calculations when a mathematics teacher also taught one or more of these other subjects. We thus analyzed achievement in these other subjects to study possible positive or negative spillover effects from the primary intervention. We used rank-based z-scores for all tests, regardless of subject.
49 Models of the second and third type were estimated separately by year, avoiding the computational problems caused by non-nesting of students within teachers. To estimate the first model, it was necessary to simplify the sto-chastic structure by dropping teacher-by-grade random effects.50 The very small number of scores outside the observed 2006 range were assigned the percentile of the highest or lowest 2006 score.

82 / national centeR on peRFoRmance incentives
5.1.4 analysis sample
Using data from the MNPS student information system (see Chapter Three) we identified all students enrolled in grades 5-8 in the district during the years of the experiment. Restricted to students who took mathematics from a teacher participating in the study, this database contained 38,577 records for 37,130 unique student-year combinations from 25,656 unique students across the four grades and three years of the study, and contained data from 289 unique teachers.51
Some student-years occurred multiple times in this dataset because the student switched schools or switched mathematics teachers within schools during the year. We restricted the data to the first record for each student in each year reflecting either their beginning-of-year assigned math-ematics teacher, or their first mathematics teacher upon entering the district mid-year. This restriction left 35,625 records from 35,625 unique student-year combinations from 25,001 unique students.
Only students who completed the TCAP mathematics test can be included in the estimation of the intervention effects on mathematics. More than 95 percent of student-years enrolled in partic-ipating teachers’ classes had observed mathematics scores. The percentages by teacher treatment status were 95.5 percent for control teachers and 95.2 percent for treatment teachers. In seven of our student-year observations, the students were tested outside of their current grade level. These cases were excluded. After restricting the sample to records with current-year, on-grade mathe-matics test scores, our analysis dataset comprised 33,955 records from 33,955 unique student-year combinations from 23,784 unique students and 288 unique teachers.52
For our baseline estimates, we further restricted the sample to student-years where students were taught by a single mathematics teacher for 90 percent or more of the school year (“stable” enroll-ments). Attribution of achievement outcomes to responsible instructors is clearly easier in the stable cases, compared with situations in which a student had multiple teachers over the course of the year. Of all student-years linked to treatment teachers, 80.9 percent had stable enrollments, compared with 82.5 percent for control teachers. This difference was not statistically significant.53
After dropping students who lacked stable enrollments, our analysis data set comprised 29,001 unique student-year records from 20,731 unique students.
51 Only 289 teachers are part of the outcomes analysis file because five teachers dropped out of the study during year 1 before student outcomes were measured. See Chapter Four for details.52 As discussed in Chapter Three, some teachers with very few math students enrolled in the study. These teachers were permitted to remain in the study through year 1 (and thus to earn bonuses, if they otherwise qualified). They were removed from the study for years 2 and 3.53 We fit a Generalized Linear Mixed Model (Raudenbush and Bryk, 2002) to test for differences between the treatment and control groups on the proportion of “stable” students. The model predicted the probability of a student being classified as stable as a function of treatment assignment and other terms to control for features of the design and clustering, including random effects for teacher and teacher course-cluster.
Final RepoRt: expeRimental evidence FRom the pRoject on incentives in teaching (point) / 83
5.2 ResUlts
Before we present estimates from the models described above, we display graphically middle school achievement trends in the district. The graphs are both easy to understand and illuminat-ing. In several respects, they prefigure our more sophisticated analyses.
5.2.1 achievement trends in treatment and control groups: graphical display
Figure 5.2 presents mean achievement from spring 2005 through spring 2009. The achievement measure is a student’s score on the math TCAP minus the state mean score for students with the same previous year score, a rough way of seeing whether students performed better or worse than “expected.” In the pre-POINT years, “treatment” and “control” refer to teachers’ future status once the experiment has started.54 Achievement is higher in the control group in 2005, but the gap is almost completely gone in 2006. The difference in 2007, the first year of POINT, is neither large nor statistically significant. Thereafter both groups trend upward. This may be a function of growing familiarity with a new set of tests introduced in 2004, or a response to pressures the district faced under No Child Left Behind. (A similar upward trend, not displayed in this figure, is evident among students of teachers who did not participate in POINT.) This trend also illustrates why we cannot take the large number of bonus winners in POINT as evidence that incentives worked. There were more bonus winners than expected on the basis of the district’s historical per-formance, but this was because performance overall was rising, not because the treatment group outperformed the control group.
54 The mix of teachers changes over these years, but very similar patterns are obtained when the sample is restrict-ed to teachers who teach middle school math in all five years.

84 / national centeR on peRFoRmance incentives
FigURe 5.2math achievement trends overall
Figures 5.3-5.6 show trends by grade level. The general upward trend after 2007 is also evident at each of these grade levels. The pre-POINT differences between treatment and control groups are greater, particularly in 2005, than they were in Figure 5.2, where a positive difference in grade 6 partly offset negative differences in the other grades. We also note that the gaps between treat-ment and control groups can be quite unstable. They vary considerably even within the pre-POINT period, suggesting that we should be wary of taking the pre-POINT gap as an indication of what would have occurred in the absence of incentives. Consistent evidence of a treatment effect is evident only in grade 5: a small gap in favor of the treatment group in the first year of the experiment, widening considerably in the second year.
-2
-1
0
1
2
3
4
TreatmentControl
20092008200720062005
Testing Year
Mea
n B
ench
mar
ked
Gai
n
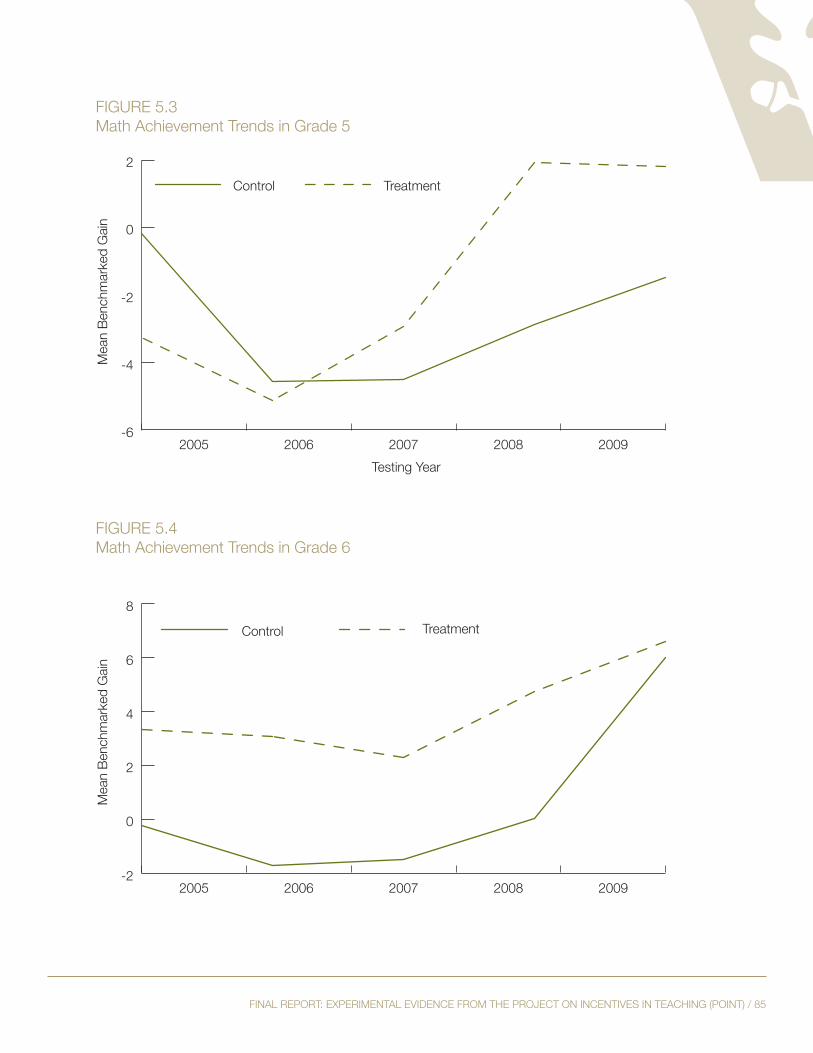
Final RepoRt: expeRimental evidence FRom the pRoject on incentives in teaching (point) / 85
FigURe 5.3math achievement trends in grade 5
FigURe 5.4math achievement trends in grade 6
-6
-4
-2
0
2
TreatmentControl
20092008200720062005
Testing Year
Mea
n B
ench
mar
ked
Gai
n
-2
0
2
4
6
8
TreatmentControl
20092008200720062005Testing Year
Mea
n B
ench
mar
ked
Gai
n
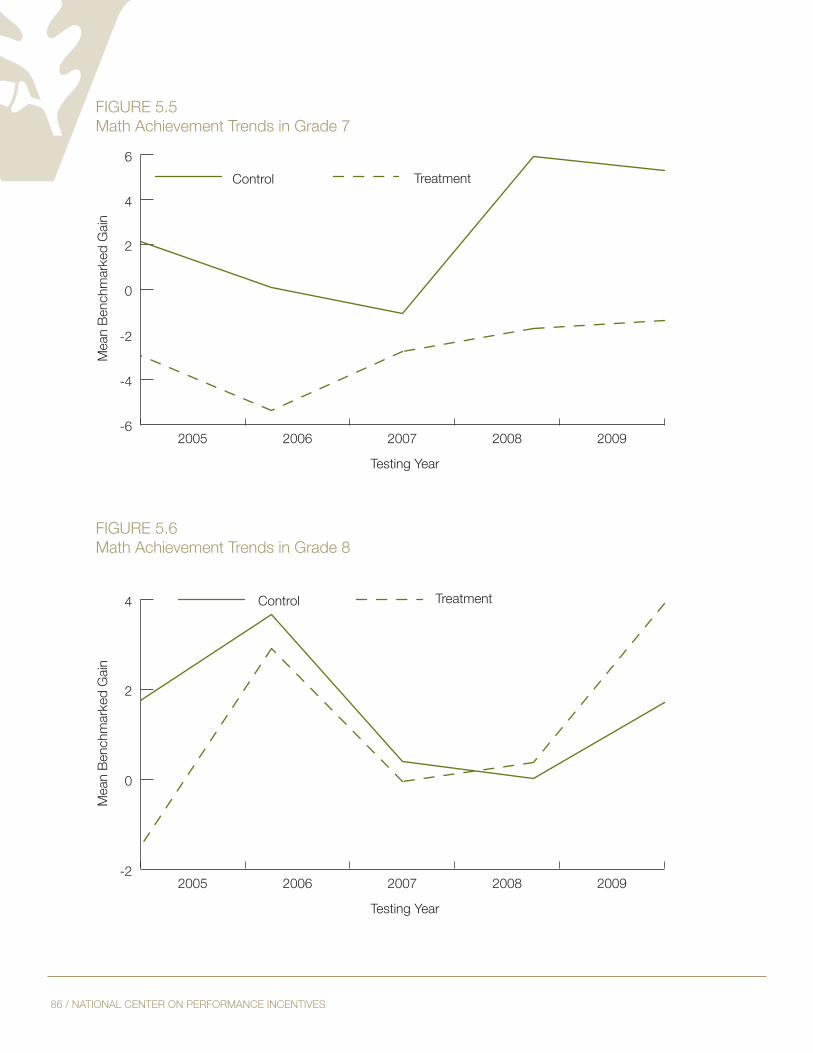
86 / national centeR on peRFoRmance incentives
FigURe 5.5math achievement trends in grade 7
FigURe 5.6math achievement trends in grade 8
-6
-4
-2
0
2
4
6
TreatmentControl
20092008200720062005
Testing Year
Mea
n B
ench
mar
ked
Gai
n
-2
0
2
4 TreatmentControl
20092008200720062005
Testing Year
Mea
n B
ench
mar
ked
Gai
n

Final RepoRt: expeRimental evidence FRom the pRoject on incentives in teaching (point) / 87
Could spillover from the treatment group be responsible for improved performance in the con-trol group? We find little support in the data for this hypothesis. First, it is implausible that such spillover would increase achievement as much in the control group as among teachers who were eligible for bonuses. A finer look at the evidence also argues against such a conclusion. There was variation from school to school and from grade to grade in the same school in the number of teachers in the treatment group. However, gains were no greater for control teachers who were exposed to a higher proportion of treatment teachers as colleagues. In addition, the same upward trend in mathematics scores shown in Figure 5.2 occurred in elementary schools, where the great majority of teachers had no day-to-day contact with teachers in the experiment.
5.2.2. estimated treatment effects: Baseline Results
Turning to our statistical analysis, we estimate an overall treatment effect across all years and grades of 0.04 with a standard error of 0.02—a small and statistically insignificant result. While this estimate is derived from the model described above, it is replicated in model-free com-parisons of treatment and control group outcomes that control only for student grade level and randomization block, with random effects for course-clusters and teachers to ensure the accuracy of the standard errors. The difference between treatment and control groups remains small and statistically insignificant. The fact that we obtain the same results with or without the extensive set of controls for student and teacher characteristics suggests that neither attrition nor attempts to game the system disturbed the balance between treatment and control groups on the observed variables enough to impart a substantial upward bias to estimated treatment effects.
However, there are differences by grade level, as shown in Table 5.2. Results for grade 6, 7, and 8 students are not significant, but those for grade 5 are, with positive effects in the second two years of the experiment amounting to 0.18 and 0.20 units on the transformed CRCT scale. Since the variance of the transformed scores is roughly one, these values are similar to effect sizes. These grade 5 treatment effects are equivalent to between one-half and two-thirds of a typical year’s growth in scores on this exam. These differences are significant even if we use a Bonferroni adjustment to control for testing of multiple hypotheses on math outcomes (Steel, Torrie, and Dickey, 1997).
taBle 5.2 estimated treatment effects
Grade LevelYear All 5 6 7 8
Year 1-20070.032 0.063 0.011 -0.021 0.025(0.024) (0.041) (0.042) (0.047) (0.046)
Year 2-20080.043 0.184** 0.045 -0.009 -0.096(0.041) (0.063) (0.062) (0.068) (0.065)
Year 3-20090.045 0.201** 0.029 -0.045 -0.012(0.043) (0.077) (0.068) (0.091) (0.078)
† p< 0.10, *, p < 0.05, and ** p < 0.01.

88 / national centeR on peRFoRmance incentives
Table 5.2 contains only the coefficients on the treatment indicators. We do not present the full set of regression results. As noted above, the models are extremely complicated, with 48 coefficients estimated for each covariate (allowing for differences by grade, year, and missingness pattern). It is difficult to interpret any single coefficient. Nor is it particularly illuminating to view all of them together, given the complex relations among them. We do, however, present full results for a simplified variant of the model: a complete case analysis, in which we have dropped from the estimation sample records that are missing any of the student-level covariates. The full set of estimated coefficients appears in Appendix E. We allow coefficients to vary by year and grade, but by discarding incomplete records we avoid the additional complexity of the pattern mixture model. Estimated treatment effects are very similar to those in Table 5.2. Effects of covariates are largely in line with what one would expect. Students’ pre-POINT scores are very strong predictors of current year performance, as are the teachers’ 2005-06 mathematics value-added. However, the average pre-POINT math score for a teacher’s students as a group is not particularly informative. Black, low-income, and special education students do not score as well in general, though there is variation by grade level.
5.2.3 contemporaneous effects on Reading, science, and social studies achievement
Appendix Tables F.1 to F.3 present estimates of the effect of math teachers’ treatment status on achievement in reading, science and social studies. The samples comprise all students whose math teacher participated in POINT, whether that teacher was responsible for instruction in these other subjects or not. (This occurs frequently in grade 5, particularly in science; less often in grade 6; and very rarely in grades 7 and 8.) Thus, these estimates capture both the direct effect of having a reading, science, or social studies teacher eligible for bonuses as well as spillover effects from the experiment to teachers of other core subjects. There are no significant effects for reading. How-ever, there are significant differences between treatment and control group students in grade 5 for both science and social studies. For both subjects, students whose math teacher was in the treat-ment group scored significantly higher in year 3, with effects of 0.147 (p=0.03) and 0.145 (p=0.03) for science and social studies, respectively. There was also a significant difference of .111 in social studies in year 2 (p=0.04).
In Tables F.4 to F.6 we restrict the sample to students of POINT participants, investigating the narrower question: what was the direct impact of incentives on student achievement in subjects other than math. (Recall that while bonuses were principally a function of math gains, if students did not perform at the level of the district average in other tested subjects, the amount of any bonus awarded would be reduced on a prorated basis.) Estimates are presented only for grades 5 and 6, as there are too few observations in the higher grades. In addition, attempts to estimate the pattern mixture model were unsuccessful, presumably due to the smaller number of students per teacher. As a result, we present results of a complete case analysis, where no convergence problems were encountered. Results are qualitatively quite similar. Grade 5 students of treatment teachers did better in science in 2009, and in social studies in both 2008 and 2009. The positive results in Tables F.2 and F.3 would therefore appear to be caused by the effect of incentives on the behavior of treatment group teachers responsible for offering instruction in other subjects
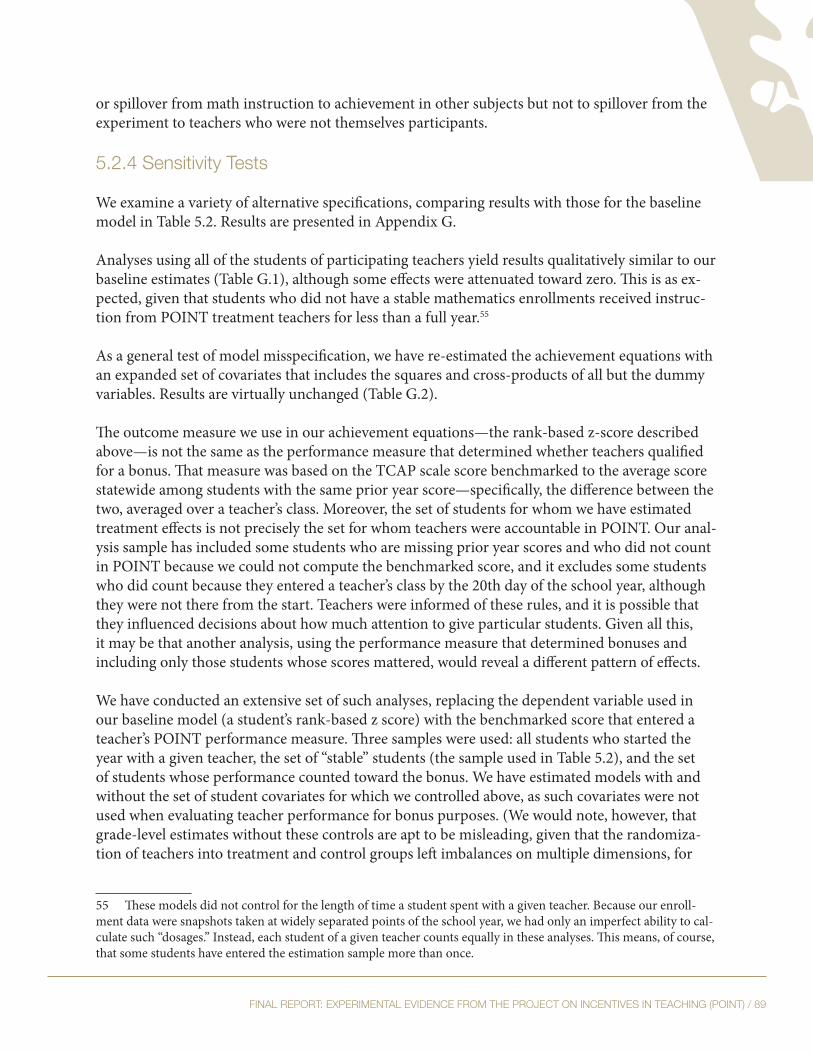
Final RepoRt: expeRimental evidence FRom the pRoject on incentives in teaching (point) / 89
or spillover from math instruction to achievement in other subjects but not to spillover from the experiment to teachers who were not themselves participants.
5.2.4 sensitivity tests
We examine a variety of alternative specifications, comparing results with those for the baseline model in Table 5.2. Results are presented in Appendix G.
Analyses using all of the students of participating teachers yield results qualitatively similar to our baseline estimates (Table G.1), although some effects were attenuated toward zero. This is as ex-pected, given that students who did not have a stable mathematics enrollments received instruc-tion from POINT treatment teachers for less than a full year.55
As a general test of model misspecification, we have re-estimated the achievement equations with an expanded set of covariates that includes the squares and cross-products of all but the dummy variables. Results are virtually unchanged (Table G.2).
The outcome measure we use in our achievement equations—the rank-based z-score described above—is not the same as the performance measure that determined whether teachers qualified for a bonus. That measure was based on the TCAP scale score benchmarked to the average score statewide among students with the same prior year score—specifically, the difference between the two, averaged over a teacher’s class. Moreover, the set of students for whom we have estimated treatment effects is not precisely the set for whom teachers were accountable in POINT. Our anal-ysis sample has included some students who are missing prior year scores and who did not count in POINT because we could not compute the benchmarked score, and it excludes some students who did count because they entered a teacher’s class by the 20th day of the school year, although they were not there from the start. Teachers were informed of these rules, and it is possible that they influenced decisions about how much attention to give particular students. Given all this, it may be that another analysis, using the performance measure that determined bonuses and including only those students whose scores mattered, would reveal a different pattern of effects.
We have conducted an extensive set of such analyses, replacing the dependent variable used in our baseline model (a student’s rank-based z score) with the benchmarked score that entered a teacher’s POINT performance measure. Three samples were used: all students who started the year with a given teacher, the set of “stable” students (the sample used in Table 5.2), and the set of students whose performance counted toward the bonus. We have estimated models with and without the set of student covariates for which we controlled above, as such covariates were not used when evaluating teacher performance for bonus purposes. (We would note, however, that grade-level estimates without these controls are apt to be misleading, given that the randomiza-tion of teachers into treatment and control groups left imbalances on multiple dimensions, for
55 These models did not control for the length of time a student spent with a given teacher. Because our enroll-ment data were snapshots taken at widely separated points of the school year, we had only an imperfect ability to cal-culate such “dosages.” Instead, each student of a given teacher counts equally in these analyses. This means, of course, that some students have entered the estimation sample more than once.
90 / national centeR on peRFoRmance incentives
which benchmarking to a single prior score is not a sufficient remedy.)
Broadly speaking, results are consistent with those in Table 5.2. Results for the sample of students who counted toward a teacher’s bonus are shown in Table G-3. Results for the other samples are qualitatively similar. There are no significant treatment effects overall (pooling across grades). Sta-tistically significant treatment effects are found only in the second and third years of the experi-ment in grade 5.56
As noted above, our baseline model contained random effects at the level of a teacher’s course-cluster, the teacher, and the teacher-by-grade combination. One may wonder whether the course-cluster associated with the teacher is the appropriate choice, given that a teacher was assigned to a cluster based on the course(s) taken by a plurality of her students (with some students therefore “out of cluster” by this measure). In addition, the teacher course-cluster was fixed at the time of randomization and did not change afterward even if the teacher was assigned to quite different courses, changed grades, or switched schools. It might be suspected that the more relevant in-formation would instead be contained in the student’s course-cluster, which changed from year to year and simply indicated at any point in time whether the student was taking remedial math (including special education), regular fifth or sixth grade mathematics, regular seventh or eighth grade math, or more advanced courses (mainly algebra). We have therefore re-estimated the base-line models using the student course-cluster in place of the teacher course-cluster. Results (Table G.4) are very similar to Table 5.2. Coefficients are within one or two hundredths of our baseline estimates. As before, the only significant treatment effects arise in fifth grade in years 2 and 3 of the experiment.
5.2.5 sustained effects
A response on the part of teachers to financial incentives is of little long-term value if their stu-dents’ gains are not sustained into the future. A failure to sustain these gains may also indicate that teachers achieved these results by teaching narrowly to the test, so that the gains evaporated when students were re-tested using a different instrument. Because our only positive findings concern fifth grade teachers in years 2 and 3 of the experiment, we examined longer-term effects for two cohorts: those students who were in fifth grade during the second year of the study, and those who were in fifth grade in the final year of the study. For evidence of sustained effects, we examined their performance as sixth graders the following year. The sample was therefore re-stricted to sixth graders students whose data were used in estimating the fifth-grade achievement model in the previous year. We fit a model analogous to our main achievement model, with grade
56 When the sample includes all students, including those who left in mid-year, we find a significant positive treat-ment effect in grade 5 in the first year of the experiment (p = .09) and a negative point estimate in grade 7 in the third year (p = .09), though these appear only when background controls (student and teacher covariates) are omitted.

Final RepoRt: expeRimental evidence FRom the pRoject on incentives in teaching (point) / 91
6 scores specified as a function of the treatment status of the grade 5 teacher.57
We estimated models with and without controls for the experimental status of the grade 6 teacher (treatment, control, and study non-participant).58 Two different samples were employed: an un-restricted sample, with students linked to the sixth grade teacher to whom they were assigned at the beginning of the year; and a sample restricted to students who remained with the same sixth grade teacher from the 20th day of the school year onward—i.e., students with “stable” sixth grade mathematics enrollments.
Across all of these configurations and across all four subjects, there were no statistically signifi-cant (α=.05) effects of grade 5 teacher treatment status on grade 6 outcomes in the 2008 cohort (Table 5.3). None of the point estimates exceeded .055. For the 2009 cohort, point estimates were somewhat larger (up to .091), but so were the standard errors. Once again, none of the estimates approaches statistical significance at conventional levels.
To summarize, we find no overall effect, pooling across years and grades, of teacher incentive pay on mathematics achievement. Likewise, we find no overall effect by year, pooling across grades. However, we do obtain positive findings in grade 5 in the second and third years of the experi-ment. These grade 5 results are also found in science and social studies in at least some years. These results are robust to a variety of alternative specifications of the model, including replacing our outcomes measure with the performance measure used during the experiment to determine whether a teacher would receive a bonus. However, an investigation of the persistence of these grade 5 gains fails to find a statistically significant impact of the fifth grade teacher’s treatment status on grade 6 scores in any subject, although point estimates were positive.
57 Because we followed these students regardless of whether their grade 6 teachers participated in POINT, we were unable to specify a random effect at the level of the teacher course-cluster: non-POINT participants were never assigned to a course-cluster. While it would have been possible to retroactively make such an assignment for teachers who had been teaching middle school in fall 2006, when the initial randomization was conducted, this was not pos-sible for teachers who began teaching in the district’s middle schools after that year. No such assignment would have been equivalent to the teacher course-clusters assigned to POINT participants. Thus, for purposes of these analyses, we specified a random effect at the level of student course-clusters. As shown in Table G.4, substituting student for teacher course-clusters makes very little difference to the baseline estimates. 58 For the first of these two cohorts, students who were fifth-graders in 2008, their sixth-grade teacher’s experi-mental status was the current value as of 2009, the third year of POINT. For the second cohort, fifth-graders in 2009, the experiment was over by the time they reached sixth grade. The “experimental status” of their sixth grade teacher was a retrospective variable—the status the teacher had enjoyed during the experiment. Teachers new to the district were classified as non-participants.

92 / national centeR on peRFoRmance incentives
taBle 5.3persistence of grade 5 treatment effects one Year later
SubjectMath Reading/ELA Science Social Studies
2008 cohort:model/sample1 0.044 0.012 -0.011 0.020
(0.045) (0.043) (0.048) (0.044)2 0.055 0.001 -0.034 0.016
(0.049) (0.045) (0.052) (0.047)3 0.045 0.017 -0.008 0.023
(0.045) (0.043) (0.049) (0.044)4 0.053 0.005 -0.031 0.019
(0.049) (0.046) (0.053) (0.047)2009 cohort:model/sample1 0.091 0.018 0.010 0.096
(0.076) (0.059) (0.078) (0.081)2 0.078 -0.009 -0.032 0.051
(0.083) (0.064) (0.082) (0.082)3 0.088 0.018 0.007 1
(0.076) (0.057) (0.076)4 0.075 -0.010 -0.039 1
(0.083) (0.063) (0.081)model/sample 1: all students at Beginning of Year, no controls for grade 6 treatment statusmodel/sample 2: stable students, no controls for grade 6 treatment statusmodel/sample 3: all students at Beginning of Year, controls for grade 6 treatment statusmodel/sample 4: stable students, controls for grade 6 treatment status1 these estimates failed to converge.

Final RepoRt: expeRimental evidence FRom the pRoject on incentives in teaching (point) / 93
5.2.6 estimates Robust to purposive assignment: cluster-level analyses
As discussed in Chapter 2, the POINT experimental design randomized course-clusters rather than individual teachers within schools to treatment and control status. Within a course-cluster, opportunities to manipulate student assignments based on a teacher’s treatment status should be quite limited. For instance, student assignments to special education classes or to regular courses (two different clusters) are not controlled by an individual teacher but rather are regulated by school and district-wide policies. Hence, differences between the outcomes of students in treat-ment course-clusters compared to students in control course-clusters are unlikely to be the result of purposive assignment. As a result, an analysis of treatment effects at the cluster-level will be largely if not entirely free of bias due to the attempt of treatment teachers to game the system in this manner.
In a cluster-level analysis, the treatment effect is the effect of being assigned to a treatment cluster rather than a control cluster.59 Because not all students in a treatment (control) cluster had treat-ment (control) teachers, the resulting estimates are akin to intent-to-treat estimates in which some students assigned to treatment “fail to comply.” As estimates of the effect of having a treat-ment teacher, the results are biased toward zero (the effect is diluted by non-compliance). None-theless, if incentive pay improves student outcomes, there should be evidence to that effect at the cluster-level as well, and tests of the statistical significance of the coefficients on indicators of treatment clusters will constitute a valid test of the efficacy of the intervention, provided there are no other systematic differences between treatment and control clusters.60
We identified students with “stable” enrollments in their mathematics courses, noted whether the cluster to which that course belonged was assigned a treatment or a control status in the student’s school, and fit a three-level model to estimate and test the intervention effects. The models in-cluded fixed effects for blocks and random effects for student course-clusters and teachers within clusters. We again fit annual models rather than one overall model to reduce computational time required to complete the sensitivity checks.
59 For this analysis we use the student-level course-cluster described in Section 5.3.5, as in Table G-4. 60 This, of course, is precisely the problem, as teacher attrition was higher from control clusters. Implications for a cluster-level analysis were noted in Section 4.3 above; we return to them below.
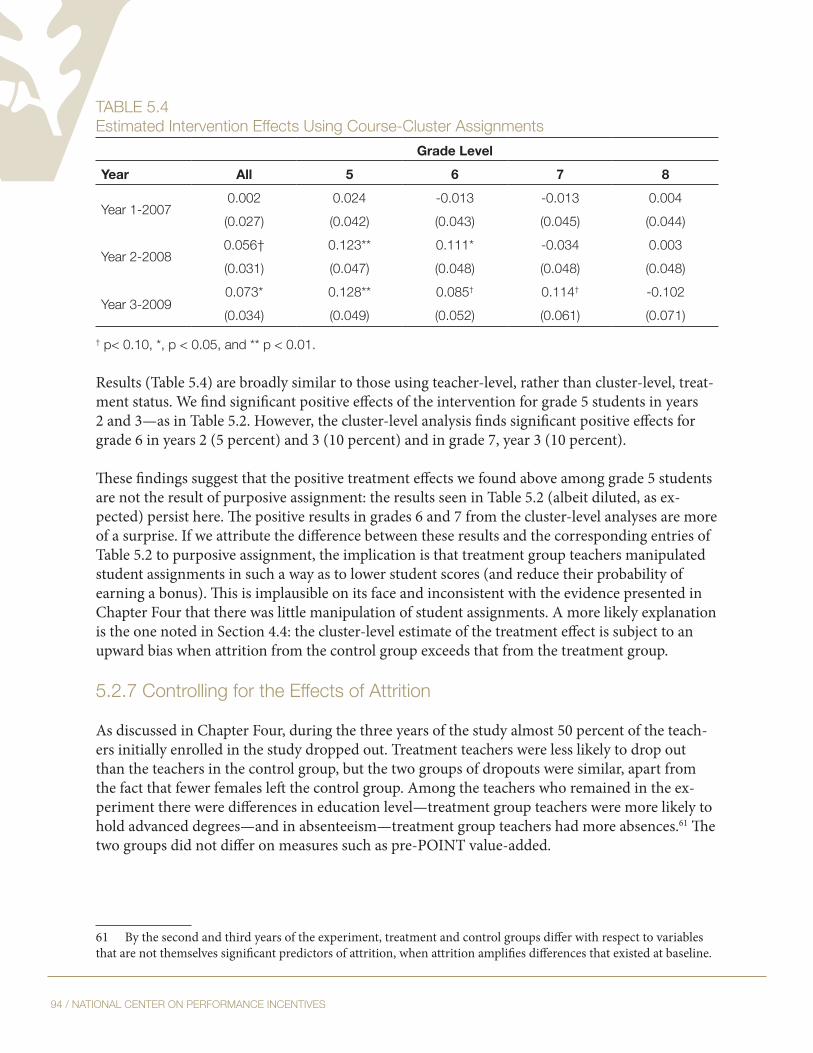
94 / national centeR on peRFoRmance incentives
taBle 5.4 estimated intervention effects Using course-cluster assignments
Grade LevelYear All 5 6 7 8
Year 1-20070.002 0.024 -0.013 -0.013 0.004(0.027) (0.042) (0.043) (0.045) (0.044)
Year 2-20080.056† 0.123** 0.111* -0.034 0.003(0.031) (0.047) (0.048) (0.048) (0.048)
Year 3-20090.073* 0.128** 0.085† 0.114† -0.102(0.034) (0.049) (0.052) (0.061) (0.071)
† p< 0.10, *, p < 0.05, and ** p < 0.01.
Results (Table 5.4) are broadly similar to those using teacher-level, rather than cluster-level, treat-ment status. We find significant positive effects of the intervention for grade 5 students in years 2 and 3—as in Table 5.2. However, the cluster-level analysis finds significant positive effects for grade 6 in years 2 (5 percent) and 3 (10 percent) and in grade 7, year 3 (10 percent).
These findings suggest that the positive treatment effects we found above among grade 5 students are not the result of purposive assignment: the results seen in Table 5.2 (albeit diluted, as ex-pected) persist here. The positive results in grades 6 and 7 from the cluster-level analyses are more of a surprise. If we attribute the difference between these results and the corresponding entries of Table 5.2 to purposive assignment, the implication is that treatment group teachers manipulated student assignments in such a way as to lower student scores (and reduce their probability of earning a bonus). This is implausible on its face and inconsistent with the evidence presented in Chapter Four that there was little manipulation of student assignments. A more likely explanation is the one noted in Section 4.4: the cluster-level estimate of the treatment effect is subject to an upward bias when attrition from the control group exceeds that from the treatment group.
5.2.7 controlling for the effects of attrition
As discussed in Chapter Four, during the three years of the study almost 50 percent of the teach-ers initially enrolled in the study dropped out. Treatment teachers were less likely to drop out than the teachers in the control group, but the two groups of dropouts were similar, apart from the fact that fewer females left the control group. Among the teachers who remained in the ex-periment there were differences in education level—treatment group teachers were more likely to hold advanced degrees—and in absenteeism—treatment group teachers had more absences.61 The two groups did not differ on measures such as pre-POINT value-added.
61 By the second and third years of the experiment, treatment and control groups differ with respect to variables that are not themselves significant predictors of attrition, when attrition amplifies differences that existed at baseline.

Final RepoRt: expeRimental evidence FRom the pRoject on incentives in teaching (point) / 95
Among teachers who taught grade 5, there were more differences.62 In years 2 and 3 the treatment group tended to have a greater proportion white teachers and a smaller share of black teachers. Treatment group teachers were also more likely to have progressed beyond a master’s degree. More of them entered teaching with alternative certification. They had more years of experience on average than their control group counterparts.
In an attempt to account for the differences in the groups that resulted from attrition, we fit ex-panded models that included the aforementioned teacher-level variables that differed between the groups. These models yield nearly the same estimates as the models without the additional covari-ates, suggesting that differences on observed variables that arose as a result of attrition did not influence our baseline estimates of treatment effects (Table 5.5).
taBle 5.5 estimated treatment effects adjusting for teacher variables Related to attrition
Grade LevelYear All 5 6 7 8
Year 1-20070.041 0.077* -0.003 0.044 0.048(0.023) (0.039) (0.041) (0.047) (0.046)
Year 2-20080.042 0.162* 0.036 0.015 -0.081(0.043) (0.068) (0.065) (0.072) (0.070)
Year 3-20090.054 0.202* 0.036 -0.016 -0.014(0.047) (0.081) (0.073) (0.100) (0.082)
† p< 0.10, *, p < 0.05, and ** p < 0.01. the additional covariates were indicators for teacher race, advanced degrees, alternate certification, experience as of 2006-07, and absences in 2005-06. Missing values were set to zero and indicators included denoting such cases.
We have also run analyses restricting the sample to the 148 teachers who remained in the study for all three years, again using separate models by year. These are presented in Table 5.6. Restrict-ing the sample to teachers who remained in the study does not change the pattern of results across time and leads to minimal changes overall. This analysis does not guarantee that attrition bias is not present in our estimates. If non-attriting treatment teachers systematically differ from non-attriting control teachers, the resulting selection bias will certainly affect the estimates in Table 5.6. However, in this case we would expect to see evidence of a systematic difference in teacher quality in every year, as there is no change over time in the sample of teachers. This is not the case. In fact, this sample restriction has almost no effect on the year 1 grade 5 treatment effect, which continues to be small and statistically insignificant.
62 Because some teachers taught at multiple grade levels, we measured this as the proportion of a teacher’s students who were in fifth grade.

96 / national centeR on peRFoRmance incentives
taBle 5.6 estimated treatment effects from sample Restricted to teachers Who Remained in the study for three Years
Grade LevelYear All 5 6 7 8
Year 1-20070.036 0.072 0.031 0.029 0.004(0.029) (0.052) (0.050) (0.057) (0.054)
Year 2-20080.048 0.222** 0.037 0.003 -0.088(0.045) (0.074) (0.068) (0.073) (0.071)
Year 3-20090.045 0.201** 0.029 -0.045 -0.012(0.044) (0.077) (0.068) (0.091) (0.078)
† p< 0.10, *, p < 0.05, and ** p < 0.01.
As a final control for the effects of attrition, we estimate achievement models that include teacher fixed effects. For this purpose it is necessary to include two pre-POINT years in addition to the three POINT years in the sample.63 The identification of treatment effects is based on pre-POINT to POINT differences in the achievement of students receiving mathematics instruction from teachers who are, or will be, in the POINT treatment group, compared with the same within-teacher difference among controls. Time invariant differences between teachers will not affect estimated treatment effects: thus, if the best treatment teachers were more likely to remain in POINT than their counterparts in the control group (where “best” means teachers whose students have better than expected scores on average, year in and year out), conditioning on teacher fixed effects will prevent that from biasing our estimates of the effect of bonus eligibility on student achievement.
These models were estimated by grade level, using data from 2005 through 2009. Thus, the pan-els consisted of successive cohorts of students at a given grade level. The treatment indicator was interacted with year, providing separate estimates of the effect of being eligible for bonuses for each year, by grade level. (The model includes main year effects as well.) Teacher fixed effects subsumed the block effects, teacher effects, and (given the way these models were estimated), teacher-by-grade effects in our baseline model, as well as the teacher value-added measure. Student-level covariates were kept in these models, though in a slightly altered form. In our baseline model, time-varying student covariates were measured using the most recent value for each student that fell outside the frame of the experiment (middle school from 2007 to 2009). For many students this was the value from 2006. However, 2006 values now lie within the sample period for the teacher fixed effects models; indeed, with respect to the 2005 data, a value from 2006 comes after the observation. We therefore substitute one-year lagged values to control for prior test scores, for past rates of student absenteeism and disciplinary incidents (number of days suspended). Thus, the equation for grade 7 students in 2005 will control for prior test scores in
63 Data were furnished to NCPI for 2004 through 2010. However, data from 2004 were used to construct lagged values of achievement for students tested in 2005. Thus, the two pre-POINT years used to estimate the teacher fixed effects models were 2005 and 2006.

Final RepoRt: expeRimental evidence FRom the pRoject on incentives in teaching (point) / 97
2004 (when the student was in grade 6), etc. Testing rates in science and social studies were below the rates in mathematics and reading in the early years of this period. Because we do not employ the pattern mixture model for this analysis, our controls include prior scores in reading and math but not science and social studies to reduce the number of observations lost due to missing data. Our controls for student free and reduced-price lunch eligibility, and special education and Eng-lish language learner status use current-year values.64 Except for a small number of students who repeated a grade (less than one percent), each student appeared only once in each of the estima-tion samples, obviating concerns about within-student covariances. A robust covariance estimator was employed, with errors clustered at the level of the teacher course-cluster.
Because we estimate separate models for each grade level, there may be a concern that sample sizes per teacher become quite small (if, say, the workloads of many teachers are spread over mul-tiple grade levels). This does not appear to be a problem. Among students whose teachers partici-pated in POINT, in 2007 the average grade-5 student had a teacher with 36 students at that grade level. Only 5 percent of grade 5 students had teachers who taught fewer than 15 students at that grade level. The corresponding numbers of grade 6 were 45 and 13; for grade 7, 80 and 12; and for grade 8, 80 and 21. Other years are very similar.
taBle 5.7estimated treatment effects, models with teacher Fixed effects
GradeYear 5 6 7 8Year 1-2007 0.091* -0.061 -0.007 0.017
(0.046) (0.044) (0.051) (0.041)Year 2-2008 0.160* -0.015 -0.079 0.055
(0.070) (0.054) (0.060) (0.041)Year 3-2009 0.174* -0.114 -0.043 0.063
(0.073) (0.077) (0.086) (0.062)† p< 0.10, *, p < 0.05, and ** p < 0.01.
Results are presented in Table 5.7.65 Results are qualitatively similar to our baseline estimates. Though point estimates in grades 6, 7, and 8 are generally larger than before, none exceeds con-ventional thresholds of statistical significance. Grade 5 results are now significantly positive in all three years. Two of three years are significantly negative in grade 6 and one of three in grade 7. The biggest surprise is probably the emergence of positive (though insignificant) point estimates in the second and third years of the experiment in grade 8.
We doubt that the discrepancies between these point estimates and those reported in Table 5.2
64 Although these are current-year values, they are predetermined with respect to our outcome variables (end-of-year test scores). 65 These models estimated separate effects by student’s grade level and controlled for the student-level covariates in the baseline model. The time-invariant teacher characteristics in that model are implicitly subsumed in the teacher fixed effects.

98 / national centeR on peRFoRmance incentives
mean that our baseline results are affected by attrition bias. Instead, we remind readers of the caveats expressed in Section 4.4 about the fixed effects estimates. In particular, we note that the sample of teachers who contribute to the fixed effects estimates can differ considerably from the set for whom treatment effects were estimated in Table 5.2. For example, there were 17 treatment group teachers at the grade 7 level in 2009 (down from 37 at the beginning of the experiment). Of those 17, only nine had grade 7 data from either of the two pre-POINT years, 2005 and 2006. Thus, the number of seventh grade teachers directly contributing to the 2009 fixed effects estimate of the treatment effect was only about half the number teaching at that grade level in that year.
5.3 hoW teacheRs Responded to point
Overall we have found no effect of teacher incentives on student achievement. Grade-level analy-ses show positive effects in the second and third years of the experiment, but only in grade 5. This effect is not sustained through the following year: by the end of sixth grade, it does not matter whether a student had a treatment teacher or a control teacher the year before. In this section, we ask why incentives failed to raise student test scores overall and in three of four grades. In the next, we ask why grade 5 was different.
Broadly speaking, there are two possible reasons for the failure of incentive pay to raise student achievement: (1) Teachers tried hard to earn bonuses, but the changes they made were not effec-tive; (2) Teachers went about business as usual, despite the incentives. The data NCPI collected on teacher behavior strongly points in the direction of the second of these explanations.66
NCPI administered surveys to all teachers participating in the POINT experiment in the spring 2007, spring 2008, and spring 2009 semesters.67 While the surveys included items on teacher attitudes, behavior and instructional practice, and school culture, two questions asked teachers to characterize broadly their response to POINT. If we accept at face value teachers’ responses, it should not be a surprise that mathematics achievement did not increase among students of teachers eligible for bonuses. Most teachers claim to have made few if any changes in response to POINT. In each year, more than 80 percent of treatment group teachers agreed with the state-ment: “I was already working as effectively as I could before the implementation of POINT, so the experiment will not affect my work.” Most disagreed with the statement: “I have altered my instructional practices as a result of the POINT experiment,” though there was some change over time, with the percentage in disagreement falling from 87 percent in 2007 to 76 percent in 2009.
Some caution is required in interpreting these responses. Teachers may have been reluctant to agree with the first of these statements, as it carries the implication that they were not working as effectively as they could before the experiment. Some teachers who said POINT had no effect on
66 In Chapter Six we explore some explanations for why teachers went about business as usual, despite the bo-nuses. 67 Survey response rates were extremely high, ranging from 96 to 98 percent for control teachers and from 93 per-cent to 100 percent for treatment teachers. For the most part, teachers responded to all applicable survey items.

Final RepoRt: expeRimental evidence FRom the pRoject on incentives in teaching (point) / 99
their work nevertheless made changes to their classroom practices over the course of the project, though they may have meant that these changes would have occurred anyway. The surveys asked POINT participants about a wide range of teacher behavior and instructional practices. An analy-sis of these questions may reveal detail missed by the broad characterizations.
In Chapter Six we present results of a comprehensive analysis of survey data collected by POINT. Here we focus on a subset of items that seem most relevant to understanding what treatment teachers did, if anything, to earn a bonus. They fall into the following categories: (1) Alignment of instruction with district standards; (2) Use of instructional time; (3) Development of test-taking skills; (4) Use of particular teaching methods; (5) Use of test scores to inform and shape instruc-tion; (6) Collaboration with other math teachers.
We have augmented these survey responses with two other sources of data. From administrative records, we obtained the number of credit hours teachers earned in professional development activities: (1) Total professional development credit hours earned during the year; (2) Profes-sional development credits in core academic subjects; (3) Math professional development credits; (4) How frequently a teacher was a ‘no-show’ in a professional development workshop for which she had registered; (5) How frequently a teacher was a late drop from a professional development workshop; (6) The number of times a teacher logged into Edusoft, the platform through which the district administered formative assessments (making the number of logins an indicator of the frequency with which an instructor used the assessment tools and reports available on the Edu-soft website).68 Finally, using surveys of the district’s math mentors, we constructed an index of the frequency and duration of teachers’ contacts with mentors.69
We regressed each of these variables on the proportion of a teacher’s students at each grade level and on treatment status. We used OLS when the dependent variable was continuous, probit when it was binary, and ordered probit in the remaining cases. All models included randomization block indicators and allowed for random effects at the level of the teacher course-cluster.
As shown in Table 5.8, there are few survey items on which we find a significant difference be-tween the responses of treatment teachers and control teachers. (We display all contrasts with p values less than .15 in italics. Treatment teachers were more likely to respond that they aligned their mathematics instruction with MNPS standards (p = .11). They spent less time re-teaching topics or skills based on students’ performance on classroom tests (p = .04). They spent more time
68 Edusoft login activity was measured four times per year throughout 2007-08 and 2008-09: eight snapshots in all. A teacher’s count was divided by the number of snapshots taken while she was employed by the district, so that it represents an average, not a total, measure of activity.69 Mentors were asked how frequently they had worked with a teacher in each of six skill areas. Responses were never, once or twice a semester, once or twice a month (plus indicators of more frequent contact that were never or almost never selected). They were also asked the average duration of sessions: < 15 minutes, 15 minutes, 30 minutes, 45 minutes, 1 hour, more than 1 hour. To construct the index we treated once or twice a semester as a baseline (=1). Relative to this, a response of once or twice a month (or still more often) was assigned a value of 3. “Never” was 0, of course. We then treated <15 minutes as equal to 15 minutes and >1 hour as equal to 1 hour, and multiplied the revised duration values by the three frequency values (0, 1, or 3). We then summed this over the 6 skill areas and across all mentors who worked with a given teacher to obtain a crude index of how much contact a teacher had with the math mentors.

100 / national centeR on peRFoRmance incentives
having students answer items similar to those on the TCAP (p = .09) and using other TCAP-spe-cific preparation materials (p = .02). The only other significant differences were in collaborative activities, with treatment teachers replying that they collaborated more on virtually every mea-sured dimension. Data from administrative records and from surveys administered to the dis-trict’s math mentors also show few differences between treatment and control groups. Although treatment teachers completed more hours of professional development in core academic subjects, the difference was small (.14 credit hours when the sample mean was 28) and only marginally significant (p = .12). Moreover, there was no discernible difference in professional development completed in mathematics. Likewise, treatment teachers had no more overall contact with the dis-trict’s math mentors than teachers in the control group.

Final RepoRt: expeRimental evidence FRom the pRoject on incentives in teaching (point) / 101
taBle 5.8 measures of teacher effort, professional development, and instructional practice,interacted with teacher treatment status Dependent Variables Coeff. S.E.
subject assessment of effort/time on math
extra effort teacher has put in to earn a bonus1 -0.078 (0.119)
subjective probability of earning a bonus (%) -0.665 (0.113)
instructional time on math increased for all students (1=yes; 0=no) 0.020 (0.116)
instructional time on math increased for low-achieving students (1=yes; 0=no) 0.077 (0.122)
professional development activities
number of times teachers logged into edusoft 0.039 (0.167)
teacher was no show for professional development workshop 0.024 (0.115)
teacher was a late drop for professional development workshop -0.017 (0.110)
total professional development credits earned this year 0.054 (0.100)
total pd credits earned in core subjects 0.142 (0.091)
total pd credits earned in math 0.040 (0.090)
teachers use of district math mentor 0.141 (0.195)
survey items
mnps standards2
I analyze students’ work to identify the MNPS mathematics standards students have or have not yet mastered 0.001 (0.121)
I design my mathematics lessons to be aligned with specific MNPS academic standards 0.196 (0.121)
Use of instructional time3
Aligning my mathematics instruction with the MNPS standards 0.123 (0.104)
Focusing on the mathematics content covered by tcap 0.051 (0.099)
administering mathematics tests or quizzes 0.036 (0.094)
Re-teaching topics or skills based on students’ performance on classroom tests -0.194 (0.096)
Reviewing test results with students -0.042 (0.102)
Reviewing student test results with other teachers 0.097 (0.104)
practicing test-taking skills4
increasing instruction targeted to state or district standards that are known to be as-sessed by the tcap 0.126 (0.136)
Having students answer items similar to those on the TCAP (e.g., released items from prior TCAP administrations). 0.208 (0.123)
Using other TCAP-specific preparation materials. 0.272 (0.117)
engaging in hands-on learning activities (e.g., working with manipulative aids). 0.003 (0.091)
Working in groups. 0.107 (0.091)
time devoted to particular teaching methods in mathematics5

102 / national centeR on peRFoRmance incentives
during a typical week, approximately how many hours do you devote to school work outside of formal school hours (e.g., in the evenings, before the school day, and on weekends)? -0.019 (0.128)
level of instructional Focus6
I focus more effort on students who are not quite proficient in mathematics, but close. -0.101 (0.104)
I focus more effort on students who are far below proficient in mathematics. 0.062 (0.104)
Use of test scores7
Identify individual students who need remedial assistance. 0.023 (0.101)
Set learning goals for individual students. -0.001 (0.123)
tailor instruction to individual students’ needs. -0.174 (0.121)
develop recommendations for tutoring or other educational service for students. 0.113 (0.105)
assign or reassign students to groups. 0.011 (0.104)
identify and correct gaps in the curriculum for all students. 0.036 (0.104)
collaborative activities with other mathematics teachers8
Analyzed student work with other teachers at my school. 0.245 (0.098)
Met with other teachers at my school to discuss instructional planning. 0.449 (0.115)
observed lesson taught by another teacher at my school. 0.029 (0.121)
had my lessons observed by another teacher at my school. 0.192 (0.113)
acted as a coach or mentor to other teaches or staff in my school. 0.363 (0.100)
Received coaching or mentoring from another teacher as my school or from a district math specialist. 0.360 (0.094)
1 0% = same effort as if there were no bonus; 100% = twice the usual effort. For control group teachers, this was a hypothetical question: the extra effort they would have made, had they been eligible for a bonus.2 all items answered: never (1), once or twice a year (2), once or twice a semester (3), once or twice a month (4), once or twice a week (5), or almost daily (6)3 all items answered: much less than last year (1), a little less than last year (2), the same as last year (3), a little more than last year (4), or much more than last year (5)4 all items answered: no importance (1), low importance (2), moderate importance (3), or high importance (4)5 all items answered: much less than last year (1), a little less than last year (2), the same as last year (3), a little more than last year (4), or much more than last year (5)6 all items answered: never or almost never (1), occasionally (2), frequently (3), or always or almost always (4)7 all items answered: not used in this way (1), used minimally (2), used moderately (3), or used extensively (4)8 all items answered: never (1), once or twice a year (2), once or twice a semester (3), once or twice a month (4), once or twice a week (5), or almost daily (6)dependent variables found to have a strong relationship to mathematics achievement (p values of .10 or smaller) are highlighted in boldface.

Final RepoRt: expeRimental evidence FRom the pRoject on incentives in teaching (point) / 103
Finally, where treatment teachers did differ from controls, we do not find the differences for the most part associated with higher levels of student achievement. We have introduced each of the preceding dependent variables into our baseline student achievement equations as an additional explanatory variable. To improve statistical power, we estimated these equations using the en-tire sample for all three years of the experiment.70 Few had a strong relationship to mathematics achievement. The exceptions (p values of .10 or smaller) have been highlighted in boldface in Table 5.8.71 Given the large number of equations estimated, there is a strong probability that sev-eral of these “significant” coefficients represent Type I errors. Of the eight instructional practices associated with higher student achievement in these data, treatment teachers were more likely than control teachers to use three: collaborating with other teachers at their school in analyzing student work and instructional planning, and having students practice questions similar to those on the state’s standardized mathematics test.
In summary, treatment teachers differed little from control teachers on a wide range of measures of effort and instructional practices. Where there were differences, they were not in general as-sociated with higher achievement.
5.4 WhY Was FiFth gRade diFFeRent?
In our baseline models as well as our sensitivity tests, we have consistently found significant ef-fects for grade 5 students in years 2 and 3. This is true of no other grade or year. In this section we ask why incentives appeared to work in that grade but none of the others.
5.4.1 Model Misspecification
In our main analyses we have controlled for students’ prior achievement, using their last pre-POINT score before they entered the experimental frame (middle school from 2007 to 2009). For fifth-graders, these scores are always from the prior year, when they were fourth-graders. How-ever, as shown in Figure 5.1, for students in grades 6 to 8 in years 2 and 3 of the experiment, these scores are from two or three years earlier, raising the possibility that the information they contain is dated. Conceivably, the use of more recent controls for prior achievement would change the results we obtain for those grades and years.
70 We ignored within-student covariances when calculating standard errors. The resulting understatement of stan-dard errors implies that, if anything, we have overstated the number of variables in Table 5.8 that have a significant association with achievement. 71 In addition to the eight variables in boldface, the first and second items in the list—the extra effort a teacher made (or would have made, if eligible) to earn a bonus, and a teacher’s subjective probability of qualifying for a bonus—were significant predictors of student achievement. Because the first was a hypothetical question when put to control group teachers, the treatment-control contrast is of no value in ascertaining what control teachers actually did that differed from teachers in the treatment group. The second question may contain information about the effort teachers were making to earn a bonus, but it may also simply reflect teachers’ self-assessment of their ability or the ability of their students (if they thought being assigned higher achieving students would help them to earn a bonus). As a result, we do not include either of these variables in our list of instructional practices associated with higher stu-dent achievement. When the sample is restricted to treatment teachers, the extra effort variable has a small positive coefficient (p = .13). The implied effect size from a self-reported doubling of a teacher’s effort is only 7 percent—an indication that there may not be a great deal of information in this variable.

104 / national centeR on peRFoRmance incentives
Accordingly, we have re-estimated our achievement models including the immediate prior year math score as a covariate.72 The results (Table 5.9) are qualitatively similar to those of Table 5.2. There are large effects for grade 5 in years 2 and 3 but not for other grades and years. While these estimates are difficult to interpret (the prior year score is a post-treatment outcome for some students and therefore endogenous), it is clear that controlling for scores in the year immediately preceding does not change our finding that positive treatment effects were limited to grade 5 in the second and third years of the experiment.
taBle 5.9 estimated intervention effects from models including prior Year mathematics scores as a covariate
Grade LevelYear All 5 6 7 8
Year 1-20070.032 0.063 0.0131 0.021 0.024(0.024) (0.041) (0.042) (0.047) (0.046)
Year 2-20080.051 0.173** 0.062 -0.015 -0.067(0.041) (0.062) (0.061) (0.065) (0.063)
Year 3-20090.036 0.175** -0.021 -0.031 0.032(0.041) (0.071) (0.062) (0.083) (0.071)
† p< 0.10, *, p < 0.05, and ** p < 0.01.
5.4.2 advantages of teaching multiple subjects in a self-contained classroom
Although housed in the middle schools, many fifth-graders are assigned to self-contained class-rooms, with a single teacher providing instruction in all core subjects and spending most of the day with these students. In some instances, the teacher will provide core instruction in two or three of the core subject areas, while students rotate to other teachers for the others. As shown in Table 5.10, only 10 percent of grade 5 students received only their mathematics instruction from the teacher who taught them mathematics; 28 percent received all of their core instruction from their mathematics teacher and an additional 30 percent received instruction in all but one core subject. The core subject most likely not to be taught by students’ mathematics teachers was read-ing/English language arts.
The assignment of students to teachers for core instruction is very different in grades 7 and 8. By grades 7 and 8, instruction is nearly fully departmentalized with over 90 percent of students receiving no core instruction other than mathematics from their mathematics teacher. Special education students account for a sizeable fraction of the students receiving instruction in other core subjects from their mathematics teacher. Grade 6 occupies an intermediate position: nearly a
72 As with other covariates we include indicators for whether a prior test score was missing. Indicators of missing-ness patterns were adjusted accordingly.
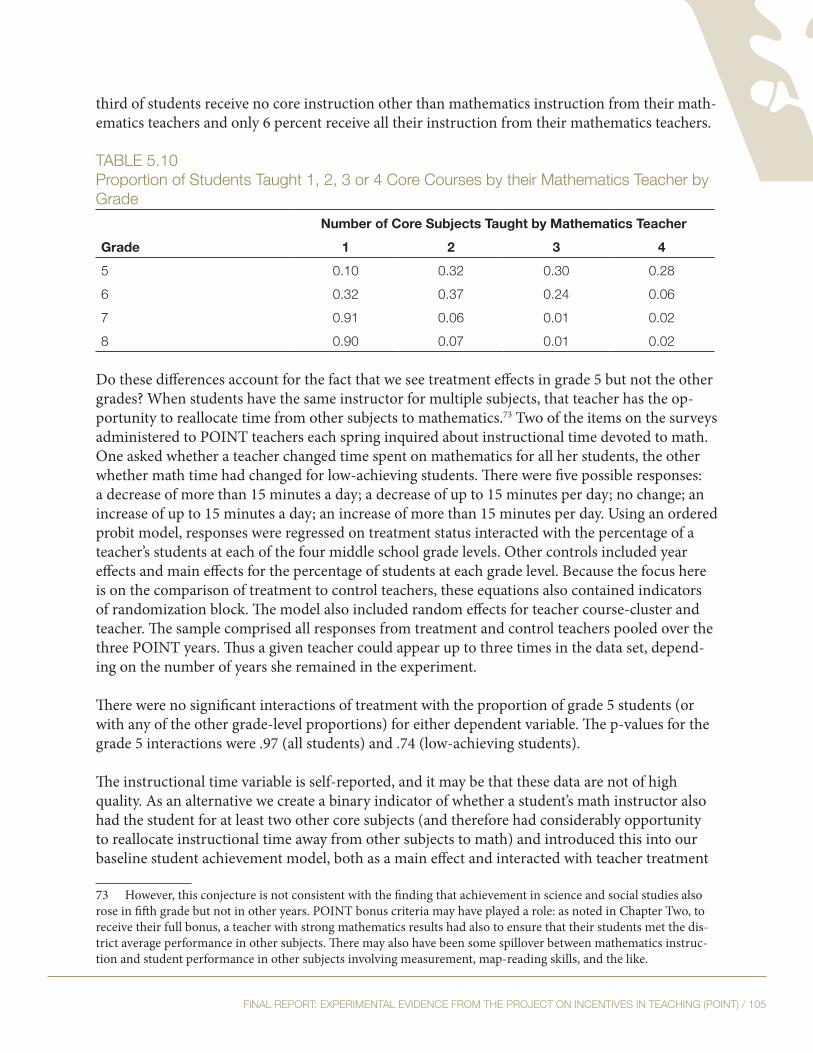
Final RepoRt: expeRimental evidence FRom the pRoject on incentives in teaching (point) / 105
third of students receive no core instruction other than mathematics instruction from their math-ematics teachers and only 6 percent receive all their instruction from their mathematics teachers.
taBle 5.10 proportion of students taught 1, 2, 3 or 4 core courses by their mathematics teacher by grade
Number of Core Subjects Taught by Mathematics TeacherGrade 1 2 3 45 0.10 0.32 0.30 0.286 0.32 0.37 0.24 0.067 0.91 0.06 0.01 0.028 0.90 0.07 0.01 0.02
Do these differences account for the fact that we see treatment effects in grade 5 but not the other grades? When students have the same instructor for multiple subjects, that teacher has the op-portunity to reallocate time from other subjects to mathematics.73 Two of the items on the surveys administered to POINT teachers each spring inquired about instructional time devoted to math. One asked whether a teacher changed time spent on mathematics for all her students, the other whether math time had changed for low-achieving students. There were five possible responses: a decrease of more than 15 minutes a day; a decrease of up to 15 minutes per day; no change; an increase of up to 15 minutes a day; an increase of more than 15 minutes per day. Using an ordered probit model, responses were regressed on treatment status interacted with the percentage of a teacher’s students at each of the four middle school grade levels. Other controls included year effects and main effects for the percentage of students at each grade level. Because the focus here is on the comparison of treatment to control teachers, these equations also contained indicators of randomization block. The model also included random effects for teacher course-cluster and teacher. The sample comprised all responses from treatment and control teachers pooled over the three POINT years. Thus a given teacher could appear up to three times in the data set, depend-ing on the number of years she remained in the experiment.
There were no significant interactions of treatment with the proportion of grade 5 students (or with any of the other grade-level proportions) for either dependent variable. The p-values for the grade 5 interactions were .97 (all students) and .74 (low-achieving students).
The instructional time variable is self-reported, and it may be that these data are not of high quality. As an alternative we create a binary indicator of whether a student’s math instructor also had the student for at least two other core subjects (and therefore had considerably opportunity to reallocate instructional time away from other subjects to math) and introduced this into our baseline student achievement model, both as a main effect and interacted with teacher treatment
73 However, this conjecture is not consistent with the finding that achievement in science and social studies also rose in fifth grade but not in other years. POINT bonus criteria may have played a role: as noted in Chapter Two, to receive their full bonus, a teacher with strong mathematics results had also to ensure that their students met the dis-trict average performance in other subjects. There may also have been some spillover between mathematics instruc-tion and student performance in other subjects involving measurement, map-reading skills, and the like.
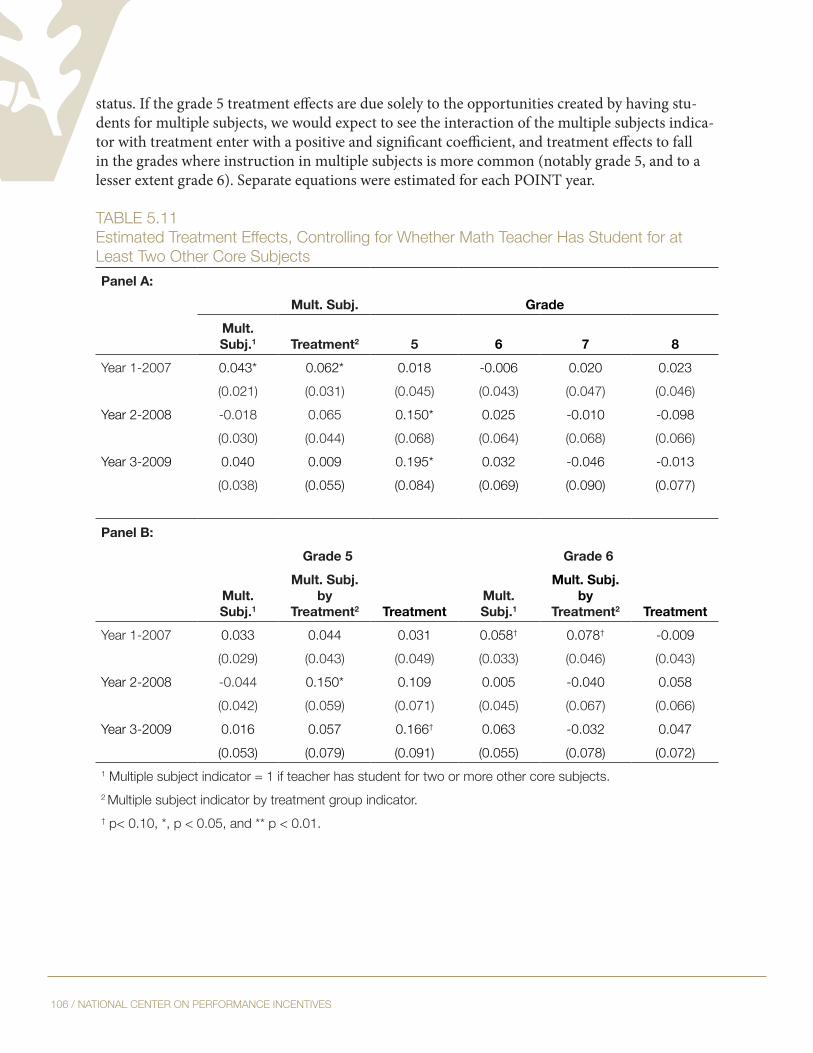
106 / national centeR on peRFoRmance incentives
status. If the grade 5 treatment effects are due solely to the opportunities created by having stu-dents for multiple subjects, we would expect to see the interaction of the multiple subjects indica-tor with treatment enter with a positive and significant coefficient, and treatment effects to fall in the grades where instruction in multiple subjects is more common (notably grade 5, and to a lesser extent grade 6). Separate equations were estimated for each POINT year.
taBle 5.11 estimated treatment effects, controlling for Whether math teacher has student for at least two other core subjectsPanel A:
Mult. Subj. GradeMult. Subj.1 Treatment2 5 6 7 8
Year 1-2007 0.043* 0.062* 0.018 -0.006 0.020 0.023(0.021) (0.031) (0.045) (0.043) (0.047) (0.046)
Year 2-2008 -0.018 0.065 0.150* 0.025 -0.010 -0.098(0.030) (0.044) (0.068) (0.064) (0.068) (0.066)
Year 3-2009 0.040 0.009 0.195* 0.032 -0.046 -0.013(0.038) (0.055) (0.084) (0.069) (0.090) (0.077)
Panel B:Grade 5 Grade 6
Mult. Subj.1
Mult. Subj. by
Treatment2 TreatmentMult. Subj.1
Mult. Subj. by
Treatment2 TreatmentYear 1-2007 0.033 0.044 0.031 0.058† 0.078† -0.009
(0.029) (0.043) (0.049) (0.033) (0.046) (0.043)Year 2-2008 -0.044 0.150* 0.109 0.005 -0.040 0.058
(0.042) (0.059) (0.071) (0.045) (0.067) (0.066)Year 3-2009 0.016 0.057 0.166† 0.063 -0.032 0.047
(0.053) (0.079) (0.091) (0.055) (0.078) (0.072)1 multiple subject indicator = 1 if teacher has student for two or more other core subjects.2 multiple subject indicator by treatment group indicator.† p< 0.10, *, p < 0.05, and ** p < 0.01.
Final RepoRt: expeRimental evidence FRom the pRoject on incentives in teaching (point) / 107
Results are presented in Table 5.11, Panel A. A significant main effect and interaction with treat-ment were found only in 2007. The point estimate of the grade 5 treatment effect falls by about the amount of the coefficient on the interaction. However, in 2008 and 2009, the multiple subjects indicator is insignificant both as a main effect and interacted with treatment, and the estimated grade 5 treatment effects are only slightly lower than the baseline results.
We estimate as well a second variant of the model, in which the multiple subjects indicator is interacted with treatment status by grade. Only the interactions in grade 5 and 6 are of interest, as very few grade 7 and 8 mathematics teachers taught multiple subjects. We find a significant posi-tive coefficient on the interaction for grade 5 treatment teachers in 2008. In that year, fifth-graders whose math teacher also provided instruction in at least two other core subjects had higher math scores. The approximate effect size is .15 (p = .01). If we take this estimate at face value, it ac-counts for about half the positive grade 5 treatment effect. The grade 5 treatment effect for stu-dents whose math teacher does not provide instruction in at least two other core subjects falls to .11 and is not significant (p = .13). Qualitatively similar, though weaker, effects are seen in 2009. The interaction of the multiple subjects indicator with grade 5 treatment teachers is insignificant in 2009, but the grade 5 treatment effect for students whose math teachers do not provide instruc-tion in multiple subjects drops to .17 and loses some significance (p = .07). In addition, we find weak evidence that having the same math teacher in multiple subjects raises grade 6 achievement in treatment classes compared with control classes in 2007 (p = .09).
In summary, the evidence on time reallocation is mixed. According to teachers’ own reports, real-location of time to mathematics from other subjects is not the reason we have found a treatment effect in grade 5 but not in other grades.74 However, it appears that having the same student for at least three core subjects helps treatment teachers boost mathematics achievement, though the evi-dence is spotty. Why this is so is less clear. It may be that treatment group teachers are reallocating time from other subjects to mathematics. However, it is difficult in this case to explain why there was also positive treatment effect on achievement in science and social studies in fifth grade but not in other grades. It may be that a self-contained class in which the same instructor is respon-sible for multiple subjects is advantageous in other ways. The teacher may also know his or her students better and be better able to adapt instruction to meet the students’ learning styles and needs. However, most sixth-grade mathematics teachers also teach at least one other subject to their math students, affording them some of the same opportunities to get to know their students better and to reallocate time from other subjects to mathematics that fifth grade teachers enjoy. Yet estimated treatment effects in grade 6 are quite small and far from statistically significant. We conclude that while teaching largely self-contained classes may be a contributing factor to the positive response to treatment found in grade 5, it does not appear to be the entire explanation.
74 We have re-estimated the time allocation equations using the percentage of students a teacher instructs in one, two, and three additional core subjects (besides math) in place of the percentage of students at each grade level. Although the main effects were positive and significant for the two and three additional subject main effects, their interactions with the teacher’s treatment status were strongly negative and significant, offsetting the main effects. This was true whether the dependent variable was time for all students or two for low achievers. Taken at face value, these results imply that control group teachers were more likely to increase time on math instruction when they had students for multiple subjects, but treatment group teachers were not.

108 / national centeR on peRFoRmance incentives
5.4.3 changes in teacher assignments
We also investigated whether changes in teacher assignments during the study could explain the grade 5 effects. The mix of grade levels taught by individual teachers changes over time. If treat-ment teachers believed that teaching grade 5 students would increase their chances of earning a bonus, they may have attempted to change their teaching assignments to grade 5 in years 2 and 3 of the study, which could result in differences between the treatment and control groups. Overall, 64 of the 148 teachers who remained through all three years of the experiment taught at least one grade 5 student. Evidence of a systematic shift of treatment teachers to grade 5 during the study was not strong. The percentages of control teachers who taught any grade 5 students were 34 percent, 36 percent and 31 percent for years 1-3 respectively. The corresponding percentages for treatment teachers were 39 percent, 33 percent and 39 percent.
We also conducted a sensitivity analysis in which we removed from the sample teachers who moved in or out of fifth grade during the experiment. (Non-movers were defined as teachers whose percentage of grade 5 students never fell below 80 percent or, alternatively, never rose above 20 percent. Others were classified as movers.) Using the restricted sample of 127 non-movers (the 148 teachers who remained to the end of the study, less the 21 who moved in or out of grade 5), we re-estimated our baseline model. If our grade 5 treatment effects have been caused by above average treatment teachers moving into grade 5, those effects should not appear in this sample.
The estimated grade 5 effects are smaller, but they do not vanish (Table 5.12). By year they were 0.115 (p = 0.06), 0.171 (p = 0.06) and 0.121 (p=0.18). The point estimate for 2009 has fallen by about one-third from its baseline value, while that for 2007 has increased. Although the results do not attain the same level of statistical significance as before, this is not surprising given that the analysis removed about one-third of all the teachers contributing to the grade 5 effects among stable study teachers. That the grade 5 treatment effect is higher in 2007 and lower in 2009 sug-gests that over the course of the experiment somewhat less effective teachers exited from fifth grade treatment classrooms while stronger teachers entered. However, these changes are impre-cisely estimated. The other grade-level treatment effects remain insignificant.
taBle 5.12 estimated treatment effects, teachers Who Remained to end of study with stable proportion of grade 5 students
All 5 6 7 8Year 1-2007 0.031 0.115† 0.008 0.023 -0.002
(0.032) (0.061) (0.053) (0.057) (0.054)Year 2-2008 0.033 0.171† 0.024 0.022 -0.069
(0.049) (0.091) (0.078) (0.078) (0.077)Year 3-2009 0.024 0.122 0.033 -0.068 0.009
(0.047) (0.090) (0.073) (0.095) (0.080)† p< 0.10, *, p < 0.05, and ** p < 0.01.

Final RepoRt: expeRimental evidence FRom the pRoject on incentives in teaching (point) / 109
5.4.4 other hypotheses
Attrition. In Section 5.3 we examined the impact of attrition on estimated treatment effects. None of those analyses suggested that differential attrition accounted for the positive and strongly significant grade 5 treatment effects found in years 2 and 3. However, there are indications in the data of a deterioration over time in the performance of the grade 5 control group teachers vis-a-vis the other grades. Evidence is found in the grade-level main effects in the student achievement equations, as shown in Table 5.13. These represent average achievement in these grades relative to grade 5, the omitted category, after controlling for the other variables in the model. These other variables include treatment interacted with grade level, so the coefficients reported below are the within-grade intercepts for control teachers. Relative to the other grades, performance deterio-rates in the grade 5 control group in years 2 and 3. The point estimates increase, though they are often not individually statistically significant. By 2009 achievement appears to be much higher for control teachers in grades 6-8 than in grade 5. Although there is no obvious interpretation of these findings (while the cause may be attrition, it could be something else), they suggest that the anomalous grade 5 treatment effect may have less to do with between-grade differences in the treatment group than with the same differences in the control group.
taBle 5.13 control group grade-level main effects
Grade6 7 8
Year 1-2007 0.434† 0.129 -0.138(0.257) (0.242) (0.203)
Year 2-2008 0.627 0.327 -0.031(0.425) (0.398) (0.265)
Year 3-2009 0.509 0.996† 0.509†
(0.530) (0.535) (0.291)† p< 0.10, *, p < 0.05, and ** p < 0.01.
Difficulty of earning a bonus. If, for whatever reason, grade 5 teachers started out closer to the bonus thresholds, they may have been particularly encouraged to put forth extra effort compared with teachers who felt these targets were out of reach. To test this hypothesis, we constructed a variable measuring how much teachers would have needed to improve to reach the lowest bonus threshold, assuming that a teacher continued to perform at the same level as in the prior year. We regressed this variable on the percentage of a teacher’s students at each grade level, using two samples: (a) all POINT teachers in 2007, the first year of the experiment; and (b) only treatment teachers in 2007. We limit the analysis to the first year of the experiment, as prior performance is endogenous to the treatment in subsequent years. In both samples, grade 5 teachers were actually farther from the bonus thresholds than teachers in grades 7 and 8. (Grade 6 teachers were clos-est).
110 / national centeR on peRFoRmance incentives
Variability in the POINT performance measures. If grade 5 teacher performance is more variable than teacher performance in other grades, this could encourage greater effort.75 More teachers might have felt they were “on the bubble” where a marginal improvement could determine wheth-er they qualified for a bonus. To test this, we constructed a variable representing the absolute difference between the current year’s performance measure and the previous year’s performance measure. We regressed this on the percentage of students taught at each grade level. To avoid endogeneity, we used two samples from which teachers eligible for bonuses were excluded: (a) all POINT teachers during the two years prior to the experiment; (b) sample (a) plus all POINT control teachers during the experiment. None of the coefficients was statistically significant. Point estimates of the coefficient on the percentage of grade 5 students were actually negative. We repeated this analyses for a third sample (c), removing from sample (a) teachers who were sub-sequently assigned to the experimental control group. The point estimate for the percentage of grade 5 students was positive but small and far from significant (p = .9).
Teacher effort. POINT participants were asked on surveys what they had done to earn a bonus. We examined three broad indicators of how much effort treatment teachers made, based on the following three questions: (1) Did they agree with the statement, “[POINT] would not affect my work, because I was already working as effectively as I could before the implementation of POINT;” (2) Did they agree with the statement, “I have altered my instructional practices as a result of the POINT experiment;” and (3) “How much extra effort have you put in to earn the bo-nus?” These three dependent variables were regressed on the percentage of students at each grade level. (For the first two we use logit models after recoding responses to binary variables.) Regres-sions were run on two samples (each limited to treatment teachers): (a) all POINT years; (b) 2008 and 2009, when positive treatment effects appeared in grade 5. There were no significant coef-ficients in any of the equations. The equation that came nearest to showing significant differences was the “extra effort” equation, where the coefficient on the percentage of grade 5 students was lower (signifying less effort) than on grade 6 or 7. When the sample was restricted to 2008 and 2009, the same pattern was obtained, though the coefficient on the percentage of grade 7 students increased (p = .09). The point estimate on grade 5 fell in the restricted sample.
Professional development and instructional practices. As noted in Section 5.3, surveys administered to POINT participants asked about a wide range of teacher activities in the areas of professional development and instructional practices. We examined responses to see whether grade 5 treat-ment group teachers were doing something that their peers in other grades were not. (See Ap-pendix H for details.) Broadly speaking, grade 5 treatment teachers engaged in less professional development and had less contact with math mentors relative to control teachers than did treat-ment teachers in other grades. They made more classroom use of tests (giving tests, reviewing tests), but were less likely to engage in narrow teaching to the TCAP or to use test scores to guide instructional decisions. There were mixed results as well on collaborative activities. Grade 5 treat-ment teachers had fewer meetings with other teachers to analyze student work or plan instruc-
75 The notion that greater variability may encourage effort may seem counter-intuitive. However, in a system that rewards teachers if they can reach a standard set at the performance level of what has historically been the 85th percentile of the teacher distribution, if the performance of individual teachers does not vary from year to year, many teachers are likely to conclude that they have no chance of reaching that threshold unless their teaching improves radically. Variability means more modest improvements could have a payoff.

Final RepoRt: expeRimental evidence FRom the pRoject on incentives in teaching (point) / 111
tion, but they participated more in observations and coaching (both doing and receiving).
Clearly, grade 5 treatment teachers did more of some things, less of others, than their counter-parts in other grades. Did they happen to pick a more effective set? As noted in Section 5.3, only eight of these measures of professional development and instructional practice were found to be positively related to student achievement. Most of them were less characteristic of grade 5 treat-ment teachers. The difference between grade 5 and other grades does not appear to be explained by the choice of particularly effective instructional practices.
To conclude, most of the explanations we have considered for why effects would be limited to grade 5 have been rejected. One, the advantage of teaching multiple subjects in a self-contained class, appears to be a factor, but accounts for only part of the grade 5 difference. Changes to teacher assignments may also have played a minor role. There is evidence of a deterioration in the performance of the grade 5 control group relative to other grades, but the reason is not obvious.
5.5 sUmmaRY
To summarize, POINT found few effects of performance incentives on student achievement in middle school mathematics. Outside of fifth grade, there were no positive, statistically significant differences between outcomes in the treatment and control groups in any year of the experiment. Positive effects were found in the second and third years in grade five. However, these effects did not persist into the next year. By the end of sixth grade, whether a student had had a treatment or a control group teacher the year before no longer made a statistically significant difference to mathematics achievement. While no one explanation appears to account for the anomalous fifth grade results, there is some indication that fifth grade treatment teachers benefitted from having their students in multiple subjects, though the evidence does not support the hypothesis that the benefit took the form of diverting time from other subjects to mathematics.
These findings were robust to a wide variety of alternative specifications of the model and mea-sures of teacher performance. Although rates of attrition from POINT were high, attrition did not introduce large differences between treatment and control groups. Sensitivity tests (including the estimation of models with teacher fixed effects) did not support the hypothesis that attrition was responsible for our findings. Nor, to repeat the conclusion reached at the end of Chapter Four, is it plausible that attrition bias would cause performance incentives to appear ineffective when their influence was actually positive.
Using administrative data on teacher professional development and teachers’ responses to POINT surveys, we have attempted to ascertain why POINT’s performance incentives failed to make a greater difference to student achievement. We return to this question in Chapter Seven. First, however, we report in the next chapter the results of a more comprehensive examination of teacher attitudes, perceptions, and behavior, as reflected in POINT surveys.

112 / national centeR on peRFoRmance incentives
this page intentionally left blank.

Final RepoRt: expeRimental evidence FRom the pRoject on incentives in teaching (point) / 113
chapteR 6: teacheRs’ attitUdes, peRceptions and BehavioRs It is frequently alleged that teacher buy-in is essential to the success of performance-based pay. However, teachers are skeptical that such systems can be administered fairly and that the effects on students will be positive (Goldhaber, 2009). However, teacher attitudes are not immutable. They may change for better or worse in response to teachers’ experiences with performance in-centive plans. This chapter examines teachers’ self-reported attitudes, perceptions and behaviors, as measured by surveys given annually during the spring (prior to receiving information on their students’ test performance or their bonus status). We ask whether these attitudes, perceptions, and behaviors changed in response to teachers’ experiences in POINT, particularly to teachers’ assignment to treatment and control groups. We also investigate whether these variables played a role in teachers’ success earning bonuses.
We begin by listing the research questions that motivated the analysis:
1. What is the effect of being eligible for a performance-based bonus on teachers’ attitudes, in-structional practices, professional development, and perceptions of their school environment?
2. Do the effects of bonus eligibility on teachers’ attitudes, instructional practices, professional development, and perceptions of their school environment differ with level of teaching expe-rience?
3. Does bonus eligibility affect the evolution of teachers’ attitudes, instructional practices, profes-sional development, and perceptions of their school environment over time?
4. Are there differences in a given year between treatment teachers who win a bonus (based on student performance at the end of that year) and treatment teachers who do not win a bonus in terms of their attitudes, instructional practices, professional development, and perceptions of their school environment?
5. Is winning a bonus in a given year associated with changes in treatment teachers’ attitudes, instructional practices, professional development, or perceptions of their school environment in subsequent years?
6. Are teachers’ attitudes, instructional practices, professional development and perceptions of their school environment predictive of whether they will earn a bonus?
6.1 methodologY
Details regarding survey administration are provided in Chapter Three. In this section we de-scribe the sample of respondents and the composite measures developed from the survey items.
6.1.1 sample of participating teachers
Table 6.1 displays the number of teachers who participated in the experiment and the number who completed a survey each year by treatment status, as well as the number of treatment group teachers who earned a bonus. Survey response rates were extremely high, ranging from 96 per-

114 / national centeR on peRFoRmance incentives
cent to 98 percent for control teachers, and from 93 percent to 100 percent for treatment teachers.
For the most part, teachers responded to all applicable survey items. However, there were some notable exceptions in years 1 and 3. In year 1, approximately 21 percent of treatment teachers and 15 percent of control teachers skipped items relating to changes in the amount of time they spent using reform-oriented practices (such as hands-on learning and group work) and changes in their emphasis on standards and tests (such as MNPS standards, TCAP content, math tests and quizzes, and re-teaching or reviewing test results). Further inspection showed that these items appeared on the same page as an item containing a visually prominent grid, so teachers may not have seen the other two items. In year 3, nearly 33 percent of treatment teachers and 28 percent of control teachers skipped an item asking about the amount of extra time they devoted to school work outside of formal school hours.
taBle 6.1 teacher enrollment, survey Responses and Bonuses by Year
Control Teachers Treatment TeachersYear Responding/
EnrolledResponse
RateResponding/
EnrolledResponse
RateNumber
That Earned Bonus
Percent That Earned Bonus
2007 136/142 96% 141/152 93% 41 27%2008 80/82 98% 107/107 100% 40 37%2009 63/64 98% 82/84 98% 44 52%
6.1.2 description of survey measures
We created scales from the survey responses corresponding to selected attitudes, instructional practices, professional development and school environment factors. In some cases, we relied on individual items, whereas other scales were created by combining responses across multiple items. To create these composite measures, we reviewed each of the survey questions, computed descrip-tive statistics for all responses, compared patterns of results across years, and conducted explor-atory factor analyses where appropriate. A few of the attitude items on the control teacher survey were framed as hypothetical situations (“imagine you were in the POINT treatment group…”). In these cases, scale creation decisions were based initially on analyses of responses from treat-ment group teachers but were corroborated through separate analyses of the control group teach-ers. It should be noted that in the case of these hypothetical items, the corresponding treatment and control group items should not be treated as equivalent. Nonetheless, there is some value in comparing the reactions of these two groups, so that we include them in some of the comparisons discussed below.
After examining descriptive statistics on the scales by year and by treatment group and reviewing the literature summarized in Chapter One of this report, we selected a subset of the scales listed in Table 6.2 to include in further analyses. The complete list of items constituting each scale, along with the range of values and the reliability of each scale, is presented in Appendix I.

Final RepoRt: expeRimental evidence FRom the pRoject on incentives in teaching (point) / 115
table 6.2point survey scale descriptionsScale Number
of ItemsDescription
Teacher Attitudes
negative effects of point 3 extent to which teachers think the point experiment discouraged staff from working together, increased resentment among teachers or increased stress.
positive perceptions of point
6 extent to which teachers think point can distinguish between ef-fective and ineffective teachers, is fair to all teachers, is consistent with the principal’s approach for evaluating teachers, has bonuses large enough to motivate effort, instills a desire to earn a bonus, and includes all important aspects of performance.
support for performance pay
4 teachers’ opinions about receiving additional compensation for outstanding teaching skills and student achievement gains.
Bonus depends on students*
3 extent to which teachers think they have less of a chance of earn-ing a point bonus because their students are not easy to teach, they have a number of students with ieps, or they have a number of students who are not proficient in English.
Understanding of point 4 teachers’ reports of whether they have a clear understanding of the point index, can explain the index at least conceptually, understand the point bonus target, and understand the difference between the point index and the tennessee value-added assess-ment system (tvaas) score (Year 1 only).
Instructional Practicesextra effort for bonus* 1 extent of extra effort teachers make compared with the effort they
would make without the bonus option (from 0 to 100 percent more effort).
standards-based math 2 extent to which teachers incorporate mnps standards into their instructional planning.
change in emphasis: standards and tests
6 extent to which teachers devote more or less time than last year to mnps standards, tcap content, math tests and quizzes, and re-teaching or reviewing test results.
test preparation 4 importance teachers give to practicing test-taking skills, focus-ing on standards and items in tcap, and using tcap preparation materials.
instructional use of test scores
6 teachers’ use of test scores to identify students who need reme-dial assistance, set learning goals, individualist instruction, recom-mend tutoring, assign students to groups or focus curriculum for all students.
Focus on below-proficient students
1 extent to which teachers focus their effort on students far below proficient or not quite proficient at least “frequently.”
increase in reform instruction
2 extent to which teachers have students devote more or less time than last year to hands-on learning and group work.

116 / national centeR on peRFoRmance incentives
extra work hours ** 1 number of hours per week teachers devote to schoolwork outside of formal school hours.
change in instruction 2 extent to which teachers alter instruction as a result of the point experiment.Professional Development
math pd hours 1 hours of professional development received during the current school year and previous summer that focused on mathematics or mathematics instruction.
math pd focus 2 extent to which professional development received during the current school year and previous summer focused on topics in mathematics and strategies for teaching mathematics.
test use pd focus 2 extent to which professional development received during the current school year and previous summer focused on preparing student for testing and interpreting achievement results.
math pd collaboration 6 Frequency with which teachers engaged in professional develop-ment that emphasized the collaborative aspects of mathematics instruction, including analyze student work, discuss instructional planning, observe lessons, are observed, act as coach or mentor, or receive coaching or mentoring.
math mentors 1 number of hours of assistance received from the district’s math mentors.
School Environmentteacher collegiality 2 extent to which teachers think teachers in their school are more
cooperative than competitive and trust each other.principal leadership 4 teacher’s opinions about whether their principals create a sense
of community, set high standards for teaching, ensure sufficient time for professional development and support the improvement of math teaching.
* indicates items that were presented to control group teachers as hypothetical questions preceded by an instruction asking them to “imagine they were eligible to receive a bonus” and then respond. ** outlying responses (i.e., those beyond 50 hours per week) were set to missing.

Final RepoRt: expeRimental evidence FRom the pRoject on incentives in teaching (point) / 117
6.2 compaRisons oF tReatment and contRol teacheRs
6.2.1 comparing treatment and control teachers’ Responses by Year
To answer the first research question, we compared the responses of treatment and control teach-ers on each of the survey scales in each year of the study. Table 2 presents the range of possible responses on each scale, the means for the treatment and control teachers by year, and an estimate of the difference between treatment and control groups.76
Overall, statistically significant group differences were observed for only a small number of survey measures in any year of the study, indicating that the assignment to the POINT treatment or control group was not associated with many differences in attitudes, perceptions or behaviors. There were some exceptions. In all three waves, treatment group teachers reported higher levels of collegiality among teachers in their schools than did control group teachers. They also reported higher levels of collaborative professional development focused on mathematics (e.g., working with other teachers to discuss instructional planning or analyze student work) in years 1 and 3, and higher-quality principal leadership in year 1. Thus, despite frequently expressed concerns among educators and policymakers that teacher incentives could damage the collegial environ-ment in schools, the bonus-eligible teachers in this study tended to report more favorable condi-tions than their control-group colleagues. The only other statistically significant difference was observed for test preparation in year 3, with treatment teachers reporting more frequent use of test-preparation activities. This finding is consistent with the hypothesis that test-score-based in-centives might increase teachers’ emphasis on preparing students to do well on standardized tests, but it is not clear why a significant difference was observed only in the final year of the study.
Because control teachers dropped out of the study at a higher rate than treatment teachers, we conducted bounding analyses to examine whether the significant differences between the treat-ment and control groups in Years 2 and 3 may be due to different characteristics of the teachers who persisted in the study in each group. In general the bounds are so wide that we cannot rule out the possibility that attrition is responsible for differences between treatment and control groups in years 2 and 3. However, in three cases the bounds are narrow enough to rule this out. These are the effects of treatment on teachers’ responses with respect to collaborative professional development (year 3), levels of teacher collegiality (years 2 and 3), and use of test-preparation activities (year 3). Thus, the estimated treatment effects for these variables were not an artifact of the sample of teachers who continued in the experiment.
76 These estimates were obtained from linear regression analyses using scaled survey responses as the dependent variables. In addition to group assignment (treatment versus control), regressors included a fixed effect for random-ization block and years of teaching experience as a covariate. We also standardized the survey-based measures. As a result, the reported coefficient on group membership corresponds to the expected difference between the groups on the constructs measured on the survey in standard deviation units. We conducted separate analyses of group differ-ences during each of the three years. To account for the randomization of teachers in course-clusters, we adjusted the standard errors via the Huber-White method (Huber, 1967; White, 1980). The same adjustment was made for all results reported in this chapter.

118 / national centeR on peRFoRmance incentives
taBle 6.3scales Ranges, means values, and standardized differences between treatment andcontrol teachers by Year Variable Name
Range of score values
Year 1 Stan-dardized
Differ-ence (T-C)
Year 2 Stan-dardized
Differ-ence (T-C)
Year 3 Stan-dardized
Differ-ence (T-C)
Treat-ment Mean
(N=141)
Control Mean(N=13)
Treat-ment Mean
(N=107)
Control Mean(N=80)
Treat-ment Mean(N=82)
Control Mean(N=63)
negative ef-fects of point
1-4 1.55 1.64 -0.18 1.66 1.88 1.75 -0.03
positive perceptions of point
1-4 2.35 2.33 -0.00 2.33 2.31 0.14 2.34 2.32 0.22
support for performance pay
1-4 2.51 2.60 -0.19 2.56 2.57 0.13
Bonus depends on students
1-4 2.22
1.94 2.22 2.12
Understand- ing of point
1-4 2.22
extra effort for bonus
0-100 23.69 27.56 26.91 26.29 28.88 21.98
standards-based math
1-6 5.08 4.99 0.04 5.03 4.93 -0.00 5.10 5.02 0.09
change in emphasis: standards and tests
1-5 3.55 3.54 -0.05 3.54 3.42 0.09 3.66 3.59 0.14
test preparation
1-4 3.46 3.39 0.12 3.40 3.28 0.10 3.55 3.28 0.55**
instructional use of test scores
1-4 2.91 2.89 0.04 2.95 2.95 -0.17 3.11 3.01 0.09
Focus on be-low-proficient students (%)
0-100 58.16 50.38 0.08 49.52 55.00 -0.12 58.54 58.06 -0.06
increase in reform instruc-tion
1-5 3.52 3.42 0.13 3.47 3.43 -0.11 3.48 3.34 0.17
extra work hours
0-50 13.01 14.48 0.11 12.34 12.48 0.10 14.26 12.83 0.06
change in instruction a
1-4 1.77 1.95 1.90 1.95 1.91 1.77
math pd hours 0-150 19.84 18.06 0.08 31.58 34.17 -0.07 28.01 27.52 -0.07
math pd focus 1-5 2.54 2.49 -0.01 2.91 2.98 -0.08 2.78 2.80 -0.06
test use pd focus
1-5 1.90 1.76 0.15 1.93 1.78 0.12 2.13 2.17 -0.04
math pd col-laboration
1-6 2.87 2.46 0.45** 2.73 2.42 0.22 2.98 2.62 0.34*
math mentors
0-50 4.70 4.38 0.01 6.99 4.95 0.26

Final RepoRt: expeRimental evidence FRom the pRoject on incentives in teaching (point) / 119
teacher collegiality
1-4 3.10 2.89 0.41** 3.11 2.97 0.35* 3.11 2.93 0.49*
principal lead-ership
1-4 3.13 2.84 0.34* 3.14 3.10 0.16
values for n in column headings indicate total numbers of survey respondents. sample sizes for some items are slightly smaller due to skipped responses at the item level.Blank cells indicate the question was not asked in that year. * p<0.05; ** p<0.01positive values indicate higher scores for treatment group teachers, after controlling for teaching experience.a this scale was hypothetically worded for the control teachers, so the responses are not directly comparable between the treatment and control teachers.
6.2.3 comparing Responses among novice, mid-level, and veteran teachers
In this section, we ask whether experience influenced teachers’ attitudes, instructional practices, professional development and perceptions of the school environment. Of particular interest is the possibility that the difference between treatment and control groups varied with level of experi-ence, given results in the literature that indicate a greater openness on the part of new teachers to innovations in teacher compensation (Goldhaber, 2009). We divided teachers into one of three groups: (a) novice teachers, defined as teachers who had five or fewer years of teaching experi-ence; (b) mid-level teachers, defined as teachers who had between six and 15 years of teaching experience, and (c) veteran teachers, defined as teachers who had more than 15 years of teaching experience. We then conducted analyses in which block, treatment group membership, teacher experience group membership, and the interactions between the treatment membership and teacher experience group membership served as the independent variables. Novice teachers served as the reference group. We conducted this analysis for years 1 and 2, but not for year 3 be-cause of small sample sizes. Tables 6.4 and 6.5 provide the mean scores for each of level of teacher experience by treatment condition, and the corresponding estimates of the standardized differ-ence and interaction effects.
Overall, there were few differences in responses related to levels of teacher experience. In year 1, novice teachers were significantly more likely than veteran teachers to support performance-based compensation plans and in both years 1 and 2, they were more likely to hold positive perceptions of POINT. These findings are consistent with previous research that found that less experienced teachers were more open to performance-based pay (Goldhaber, DeArmond, & De-Burgomaster, 2007; Jacob & Springer, 2008). On the other hand, in year 1, veteran teachers were more likely than novice teachers to report higher levels of teacher collegiality.
On three variables—professional development, principal leadership and work outside of school hours—the effect of treatment varied with experience. In year 1, novice teachers in the treatment group were significantly more likely than novice teachers in the control group to report engaging in professional development that emphasized collaboration with other mathematics teachers. In contrast, mid-level and veteran treatment teachers were comparable to their control counterparts with respect to engagement in collaborative professional development. On perceptions of princi-pal leadership, veteran teachers in the treatment and control group were similar in year 1, whereas
120 / national centeR on peRFoRmance incentives
novice teachers in the treatment group were significantly more positive about their principals than novice teachers in the control group. Finally, novice teachers in the treatment group report-ed devoting a greater number of hours to schoolwork outside of formal work hours than novice teachers in the control group. The pattern was reversed among veteran teachers, where control teachers reported more hours outside of school hours than treatment teachers.
In summary, experience tended to be unrelated to treatment effects on teachers’ attitudes, in-structional practices, professional development and school environment. In the three exceptional cases, treatment effects for novices were positive while they were not significant or negative for veteran teachers.

Final RepoRt: expeRimental evidence FRom the pRoject on incentives in teaching (point) / 121
taBle 6.4teachers’ attitudes, practices, professional development, and school environment by experience category and treatment category in Year 1Variable Name
Range of
score values
Novice Mid-Level Veteran
Treat-ment (N = 42)
Control (N = 39)
Treat-ment(N = 58)
Con-trol(N = 47)
Stand. Diff. bet.
Mid-Level and
Novice Teach-
ers
Interac-tion bet.
Mid-Level
Teacher and
Treat-ment
Treat-ment (N = 35)
Control (N = 33)
Stand.Diff. bet. Vet. and
Novice Teach-
ers
Inter-action
bet. Vet.
Teach-er and Treat-ment
negative effects of point
1-4 1.56 1.64 1.54 1.52 -0.25 0.28 1.54 1.73 0.25 -0.34
positive per-ceptions of point
1-4 2.34 2.41 2.36 2.38 -0.05 -0.04 2.32 2.15 -0.53 * 0.44
support for performance pay
1-4 2.50 2.69 2.55 2.65 0.02 -0.12 2.43 2.36 -0.54 * 0.31
Understand-ing of pointb 1-4 2.21 2.20 2.19
extra effort for bonus 0-100 22.63 32.31 21.69 28.22 22.86 21.52
standards-based math 1-6 5.11 4.96 5.13 4.83 -0.12 0.13 4.97 5.23 0.47 -0.58
change in emphasis: standards and tests
1-5 3.64 3.67 3.53 3.47 -0.31 0.13 3.50 3.44 -0.42 0.26
test prepara-tion 1-4 3.46 3.38 3.47 3.36 0.23 -0.30 3.46 3.35 0.14 -0.13
instructional use of test scores
1-4 2.91 2.90 2.97 2.87 -0.02 0.05 2.81 2.78 -0.12 -0.03
Focus on below- proficient students (%)
0-100 45.24 48.72 65.52 48.94 0.03 0.44 60.00 53.33 0.15 0.17
increase in reform instruction
1-5 3.79 3.56 3.57 3.50 -0.03 -0.26 3.27 3.11 -0.43 -0.02
extra work hours 0-50 14.15 12.69 12.26 15.20 0.03 -0.25 12.34 15.30 0.31 -0.57
change in instructiona 1-4 1.80 2.10 1.67 1.99 1.86 1.71

122 / national centeR on peRFoRmance incentives
math pd hours 0-150 21.64 16.24 21.03 20.70 -0.03 -0.18 17.46 17.03 -0.01 -0.40
math pd focus 1-5 2.63 2.51 2.55 2.47 -0.19 0.02 2.43 2.59 0.11 -0.41
test use pd focus 1-5 1.95 1.75 1.75 1.65 0.15 -0.37 1.99 1.83 0.35 -0.17
math pd collaboration 1-6 3.20 2.43 2.76 2.38 0.05 -0.60 * 2.59 2.53 0.22 -0.92
**
teacher collegiality 1-4 3.03 2.81 3.11 2.91 0.25 0.00 3.13 3.01 0.51 * -0.19
principal leadership 1-4 3.25 2.77 3.14 2.90 0.03 -0.32 3.01 2.94 0.24 -0.70 *
values for n in column headings indicate total numbers of survey respondents. sample sizes for some items are slightly smaller due to skipped responses.in Year 1, there was no information on services received from the district’s math mentors.Blank cells indicate that the question was not asked in that year.a this scale was hypothetically worded for the control teachers, so the responses are not directly comparable between the treatment and control teachers.b this scale was administered only to treatment teachers in Year 1.* p<0.05; ** p<0.01

Final RepoRt: expeRimental evidence FRom the pRoject on incentives in teaching (point) / 123
taBle 6.5 teachers’ attitudes, practices, professional development, and school environment by experience category and treatment category in Year 2Variable Name Range
of score values
Novice Mid-Level Veteran
Treat-ment
(N =25)
Con-trol
(N =17)
Treat-ment
(N =46)
Con-trol
(N =35)
Stand. Diff. bet. Mid-Level and
Novice Teacher
Interac-tion bet.
Mid-Level
Teacher and
Treat-ment
Treat-ment
(N =35)
Con-trol(N = 24)
Stand. Diff. bet. Vet. and
Novice Teacher
Inter-action
bet. Vet.
Teacher and
Treat-ment
positive percep-tions of point
1-4 2.41 2.48 2.31 2.29 -0.35 -0.08 2.32 2.20 -0.70 * 0.23
Bonus depends on studentsa
1-4 2.11 1.94 2.18 1.90 2.40 1.99
extra effort for bonus
0-100 24.58 41.94 28.41 25.71 25.53 17.50
standards-based math
1-6 4.96 4.74 5.14 4.94 0.30 -0.23 4.90 5.17 0.61 -0.75
change in em-phasis: standards and tests
1-5 3.63 3.49 3.61 3.46 0.08 0.08 3.42 3.31 -0.18 0.19
testpreparation
1-4 3.49 3.34 3.42 3.35 0.20 -0.37 3.32 3.16 0.01 -0.38
instructional use of test scores
1-4 3.05 3.02 3.01 3.04 0.11 -0.17 2.83 2.85 0.02 -0.20
Focus on below-proficient students (%)
0-100 68.00 0.47 45.45 0.63 0.38 -0.85 40.00 50.00 0.08 -0.39
increase in reforminstruction
1-5 3.54 3.26 3.55 3.54 0.22 -0.28 3.29 3.40 0.16 -0.46
extra work hours 0-50 14.60 10.59 11.65 10.65 -0.23 -0.21 12.00 15.77 0.49 -1.16 **
change in instructiona
1-4 1.96 2.31 1.92 1.91 1.84 1.72
math pd hours 0-150 32.38 34.29 34.09 34.55 -0.39 0.56 28.54 30.61 -0.35 0.04
math pd focus 1-5 2.94 3.15 2.92 3.09 -0.33 0.30 2.90 2.63 -0.63 0.35
test use pd focus
1-5 2.00 1.94 1.91 1.80 0.12 -0.23 1.87 1.63 0.00 -0.09
math pdcollaboration
1-6 2.94 2.67 2.76 2.43 -0.44 0.37 2.50 2.38 -0.26 -0.12
math mentors 0-50 4.75 4.94 4.80 4.97 0.00 -0.15 4.57 3.08 -0.27 0.00
teachercollegiality
1-4 3.11 2.82 3.11 2.96 0.07 -0.19 3.12 3.03 0.14 -0.38
values for n in column headings indicate total numbers of survey respondents.sample sizes for some items are slightly smaller due to skipped responses. Blank cells indicate that the question was not asked in that year.a these scales were hypothetically worded for the control teachers, so the responses are not directly compa-rable between the treatment and control teachers.* p<0.05; ** p<0.01

124 / national centeR on peRFoRmance incentives
6.2.3 changes over time in teachers’ Responses
Table 6.6 presents the results of the longitudinal analyses that examine changes in teachers’ responses across the three years. The first column displays the mean difference in standardized scores between responses in year 1 and year 2 for all teachers, and the second column presents estimates of the change in the treatment effect across years of the study. That is, the first column indicates whether there was an overall change (positive values mean that survey responses were higher in year 2, after controlling for teachers’ experience), and the second column indicates whether the change was different for treatment and control teachers (a positive effect means treat-ment teachers gains were relatively larger than control teachers’ gains, after controlling for teach-ers’ experience). The sample was restricted to treatment and control teachers who responded to the survey in all three years.77
For the most part, we observe few differences in the mean scores from year 1 to year 2, indicat-ing that teachers’ attitudes, perceptions, and behavior were relatively stable and that participating in the study had little effect on either group. There was one exception to this pattern. From year 1 to year 2, both groups of teachers significantly increased the amount of time they engaged in math professional development, with treatment teachers reporting an average increase of nearly 12 hours and control teachers reporting an average increase of approximately 16 hours (see Table 6.3). The difference between the two groups was not significant (see Column 2 in Table 6.6). There were no other significant changes in any of the scales from year 1 to year 2. Given the large num-ber of outcomes tested it is likely that we might observe a small number of significant effects just by chance between the groups.
The information in Column 3 of Table 6.6 shows that between year 1 and year 3, there were sig-nificant increases overall in a number of scales. These scales included teachers’ perceptions of the negative consequences of POINT, the attention teachers paid to test scores, the amount of profes-sional development focused on test preparation and interpretation of test scores, and the use of test score data to improve instruction. We are unable to attribute these changes to participation in the POINT study, as there were almost no differences between treatment and control groups with respect to year 1 to year 3 changes. It may be that the changes we observe reflect an increased emphasis on test scores throughout MNPS in response to No Child Left Behind or other factors.
There was one scale on which changes between years 1 and 3 were related to treatment status: principal leadership. In year 1, treatment teachers were significantly more positive than control teachers about their principal’s leadership. In year 3, treatment teachers remained positive about their principal’s leadership (scores were about the same as year 1), while control teachers showed a significant increase in scores, effacing the difference that existed in year 1.
77 We used a multiple regression analysis with standardized survey responses as the dependent variable and treat-ment group, study year, and the interaction of intervention group and year of study as independent variables. We also included teachers as fixed effects in the model. The interaction terms allow us to estimate annual intervention effects and test if these differed across years.

Final RepoRt: expeRimental evidence FRom the pRoject on incentives in teaching (point) / 125
taBle 6.6changes from Year 1 in teachers’ attitudes, perceptions and Behaviors, and differences in change by treatment condition Variable Name (1)
Year 2 - Year 1
Standardized Difference
(2)Interaction
Between Year 2 - Year 1 Difference
and Treatment Status
(3)Year 3 - Year 1
Standardized Difference
(4)Interaction Between
Year 3 - Year 1Difference
and Treatment Status
negative effects of point 0.38* 0.19positive perceptions of point -0.05 0.03 -0.06 0.02support for performance pay na na 0.06 0.13standards-based math -0.08 -0.17 -0.03 -0.20change in emphasis: standards and tests
0.05 0.26 0.25 0.14
test preparation -0.07 -0.04 0.11 0.18instructional use of test scores 0.16 -0.09 0.48* 0.14Focus on below-proficient students
-0.15 -0.30 -0.02 -0.24
increase in reform instruction -0.02 -0.07 -0.02 0.09extra work hours -0.05 0.15 0.22 0.30math pd hours 0.35* -0.19 0.16 -0.08math pd focus 0.33 -0.00 0.08 -0.09test use pd focus 0.09 -0.03 0.28* -0.23math pd collaboration -0.13 -0.11 0.13 -0.07teacher collegiality 0.01 -0.03 -0.16 -0.16principal leadership -0.13 -0.42*
* p<0.05Blank cells indicate that the question was not asked in that year.positive values indicate higher gains for treatment group teachers, after controlling for teaching experience.

126 / national centeR on peRFoRmance incentives
6.3 compaRisons oF tReatment teacheRs Who eaRned a BonUs to those Who did not eaRn a BonUs
6.3.1 comparing the Responses of treatment teachers Who earned a Bonus and treatment teachers Who did not, by Year
Table 6.7 provides the mean scores on the scales relating to attitudes, practices, professional de-velopment, and school environment variables for the bonus winners and other treatment group teachers by year. In each year, the survey responses were collected before bonus awards were announced. Thus, differences between bonus winners and other teachers are not responses to winning a bonus for the year in question. On the contrary, these differences might have played a role in determining which teachers won bonuses (e.g., teachers with more positive attitudes might have been more effective). We discuss each set of responses in turn.78
Attitudes. Overall, in year 1 both groups of treatment teachers were moderately supportive of performance-based pay plans and the POINT experiment, but treatment teachers who earned a bonus were generally more supportive of such programs than treatment teachers who did not earn a bonus. Bonus winners and other teachers were comparable with respect to their support for performance pay plans, their understanding of how POINT worked, and their perceptions of the positive aspects of POINT in year 1. However, there were differences with respect to whether they believed the POINT experiment had negative consequences. In year 1, teachers who did not earn a bonus were more likely than bonus winners to believe the POINT experiment decreased peer collaboration and increased teacher resentment and stress, although most teachers in both group tended to report few negative effects (see Table 6.7).
Differences in attitudes towards performance-based systems were also observed in years 2 and 3. In both years, bonus winners in each year were more likely to hold more positive perceptions of POINT than other teachers, and in year 3, bonus winners were more likely to support perfor-mance pay plans than teachers who did not earn a bonus that year. However, unlike the finding in year 1, there were no differences between the two groups with respect to their perceptions about the negative consequences of POINT in either year 2 or year 3.
Teachers who did not win a bonus were also more likely than bonus winners to endorse state-ments suggesting that their chances of winning a bonus depended upon the types of students they taught. Teachers who did not win a bonus were more likely to believe the probability of winning a bonus was reduced because they had many students with IEPs, many students who were not proficient in English, or many students who were not easy to teach. It is important to remember that POINT bonuses were awarded on the basis of gains in student scores compared with students with the same score in the prior year, so this opinion may reflect a misunderstanding about how the bonuses were awarded. Alternatively, teachers’ sense that their students presented greater
78 Separate linear regression equations were estimated for each year using standardized survey responses. In each of the models, we controlled for years of teaching experience and teachers’ bonus status (defined as whether the teacher won a bonus for that year).
Final RepoRt: expeRimental evidence FRom the pRoject on incentives in teaching (point) / 127
challenges might have negatively influenced their efforts to improve student performance.
Somewhat unexpectedly, in year 1 teachers who did not win a bonus reported putting forth a greater amount of extra effort to win a bonus than bonus winners. It is possible this finding arises because the two groups of teachers had been working at different levels of effectiveness. Further analysis supported this hypothesis, as 95 percent of bonus winners compared with 84 percent of other treatment teachers endorsed a survey item indicating that they were working as effectively as possible even prior to the implementation of POINT and that the experiment would not affect their work.
In general, it appears that teachers who earned bonuses tended to be more favorably inclined toward POINT and toward the idea of performance pay more generally, and less likely to believe that their chances of earning a bonus were hindered by the characteristics of the students they taught. The differences between bonus winners and other teachers were most pronounced in the first year of the study before any bonuses had actually been awarded. These findings suggest that teachers with more positive attitudes were more likely to win bonuses, but we do not know whether positive attitudes increase the probability a teacher will perform well or whether teachers who are better performers also tend to have more positive attitudes.
Instructional Practices. There was some evidence that the instructional practices of bonus win-ners differed from those of other treatment teachers in all three years of the study. For example, teachers who did not earn a bonus at the end of year 1 were more likely than teachers who did earn a bonus to report having changed their instruction that year (see Table 6.7). Relative to the bonus winners, teachers who did not win a bonus reported spending more time during year 1 on reform-oriented math practices than in the year, before POINT was implemented. In addition, teachers who did not win a bonus were more likely to report increasing emphasis on standards and tests relative to the previous year’s instruction, with greater time spent on practices such as reviewing test results or focusing on TCAP content. Bonus winners, however, were more likely than other teachers to incorporate MNPS standards into their instructional planning in year 1. Both groups gave similar responses in year 1 concerning other types of classroom practices, including their emphasis on test preparation, their use of test scores for instructional purposes, their time spent on schoolwork outside of formal school hours, and the amount of time they fo-cused on below-proficient students.
While there were fewer differences in classroom practices in years 2 and 3, some persisted. As in year 1, teachers who earned a bonus in year 2 incorporated MNPS standards more frequently into their mathematics instruction than teachers who did not earn a bonus. (This difference did not persist into year 3.) In both years 2 and 3, bonus winners reported greater emphasis on test prepa-ration activities, such as using TCAP preparation materials, having students practice test-taking skills, and aligning instruction to the TCAP. However, there were no other differences between the two groups for other types of classroom practices for either year 2 or year 3.
Overall, bonus winners and other teachers did not differ much in their instructional practices, with differences that were statistically significant in one year ceasing to be so in another year. However, there were two notable exceptions where differences in instruction persisted across

128 / national centeR on peRFoRmance incentives
years. Bonus winners were significantly more likely than other teachers to engage in standards-based mathematics instruction and to emphasize test preparation, a finding anticipated by studies that have shown that the use of standards-aligned curriculum and test-preparation activities is associated with higher student test scores (Porter & Smithson, 2001; Smith & Fey, 2000).
Professional Development. For the most part, bonus winners were no more likely than other treat-ment teachers to engage in professional development. Differences were limited to the first year. In year 1, although both groups were similar with respect to the number of math professional development hours taken, there were differences in the content, with bonus winners more likely to engage in professional development that focused on in-depth study of math topics or teach-ing strategies within math (see Table 6.7). Bonus winners also reported engaging in more job-embedded professional development that emphasized peer collaboration on various aspects of math instruction, including observing each others’ lessons, acting as a coach or mentor, receiving mentoring, and analyzing students’ work. The two groups were comparable on other aspects of professional development, such as that related to the interpretation and use of test scores.
There were no differences between the bonus winners and other teachers in professional devel-opment activities in year 2, and virtually no differences in year 3. The one exception in year 3 pertained to the content of the professional development taken, where bonus winners were more likely than other teachers to receive professional development that was focused on the teaching and study of math (see Table 6.7).
Taken together, bonus winners differed little from other teachers with respect to professional de-velopment. Most of the differences in professional development activities were observed in year 1, prior to the awarding of any bonuses, but these differences tended not to persist in years 2 and 3.
School Environment. Both bonus winners and other teachers were fairly positive about the level of teacher collegiality in their schools, and no differences were observed between the two groups with respect to teacher collegiality in any of the years (see Table 6.5). Both groups were also posi-tive about their principal’s leadership, although bonus winners were significantly more positive than other teachers in year 1. However, there were no differences in their perceptions of their principal’s leadership in year 3 (the question was not asked in year 2).
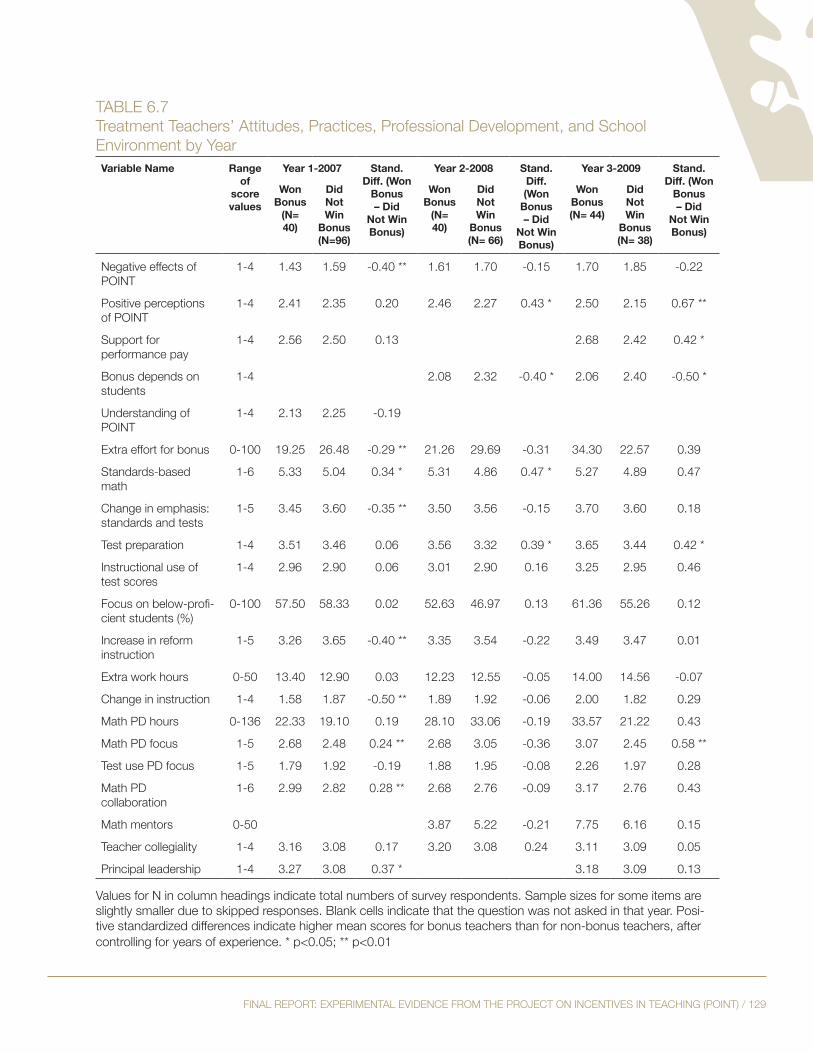
Final RepoRt: expeRimental evidence FRom the pRoject on incentives in teaching (point) / 129
taBle 6.7treatment teachers’ attitudes, practices, professional development, and school environment by YearVariable Name Range
of score values
Year 1-2007 Stand. Diff. (Won
Bonus – Did
Not Win Bonus)
Year 2-2008 Stand. Diff. (Won
Bonus – Did
Not Win Bonus)
Year 3-2009 Stand. Diff. (Won
Bonus – Did
Not Win Bonus)
Won Bonus
(N= 40)
Did Not Win
Bonus(N=96)
Won Bonus
(N= 40)
Did Not Win
Bonus(N= 66)
Won Bonus(N= 44)
Did Not Win
Bonus(N= 38)
negative effects of point
1-4 1.43 1.59 -0.40 ** 1.61 1.70 -0.15 1.70 1.85 -0.22
positive perceptions of point
1-4 2.41 2.35 0.20 2.46 2.27 0.43 * 2.50 2.15 0.67 **
support for performance pay
1-4 2.56 2.50 0.13 2.68 2.42 0.42 *
Bonus depends on students
1-4 2.08 2.32 -0.40 * 2.06 2.40 -0.50 *
Understanding of point
1-4 2.13 2.25 -0.19
extra effort for bonus 0-100 19.25 26.48 -0.29 ** 21.26 29.69 -0.31 34.30 22.57 0.39
standards-based math
1-6 5.33 5.04 0.34 * 5.31 4.86 0.47 * 5.27 4.89 0.47
change in emphasis: standards and tests
1-5 3.45 3.60 -0.35 ** 3.50 3.56 -0.15 3.70 3.60 0.18
test preparation 1-4 3.51 3.46 0.06 3.56 3.32 0.39 * 3.65 3.44 0.42 *
instructional use of test scores
1-4 2.96 2.90 0.06 3.01 2.90 0.16 3.25 2.95 0.46
Focus on below-profi-cient students (%)
0-100 57.50 58.33 0.02 52.63 46.97 0.13 61.36 55.26 0.12
increase in reform instruction
1-5 3.26 3.65 -0.40 ** 3.35 3.54 -0.22 3.49 3.47 0.01
extra work hours 0-50 13.40 12.90 0.03 12.23 12.55 -0.05 14.00 14.56 -0.07
change in instruction 1-4 1.58 1.87 -0.50 ** 1.89 1.92 -0.06 2.00 1.82 0.29
math pd hours 0-136 22.33 19.10 0.19 28.10 33.06 -0.19 33.57 21.22 0.43
math pd focus 1-5 2.68 2.48 0.24 ** 2.68 3.05 -0.36 3.07 2.45 0.58 **
test use pd focus 1-5 1.79 1.92 -0.19 1.88 1.95 -0.08 2.26 1.97 0.28
math pd collaboration
1-6 2.99 2.82 0.28 ** 2.68 2.76 -0.09 3.17 2.76 0.43
math mentors 0-50 3.87 5.22 -0.21 7.75 6.16 0.15
teacher collegiality 1-4 3.16 3.08 0.17 3.20 3.08 0.24 3.11 3.09 0.05
principal leadership 1-4 3.27 3.08 0.37 * 3.18 3.09 0.13
values for n in column headings indicate total numbers of survey respondents. sample sizes for some items are slightly smaller due to skipped responses. Blank cells indicate that the question was not asked in that year. posi-tive standardized differences indicate higher mean scores for bonus teachers than for non-bonus teachers, after controlling for years of experience. * p<0.05; ** p<0.01

130 / national centeR on peRFoRmance incentives
6.3.2 changes over time in treatment teachers’ Responses and differences in changes Between treatment teachers Who earned a Bonus and treatment teachers Who did not
In our next analysis, we examined whether earning a bonus is related to subsequent changes in teachers’ attitudes, perceptions and behaviors over time. We computed changes in responses from year 1 to year 2 for all treatment group teachers and then compared the means of these changes for treatment teachers who earned a bonus and those who did not in year 1. We then repeated this for years 2 and 3.79
Table 6.6 displays the change in scores for each teacher scale from year 1 to year 2, delineated by year 1 bonus status. From year 1 to year 2, bonus winners and other teachers were fairly similar with respect to changes in their attitudes, including their perceptions of the negative effects of POINT and in the amount of extra effort they would put in to win the bonus. There were, howev-er, differences in their views of the positive aspects of POINT. Whereas teachers who won a bonus in year 1 reported an increase in their support for the POINT experiment from year 1 to year 2, teachers who did not win a bonus in year 1 reported a decrease in their support for the program (see Table 6.8). Given that both groups showed similar levels of support in year 1, this finding is consistent with their attitudes being influenced by winning or not winning a bonus.
Earning a bonus at the end of year 1 was also related to changes in teachers’ instruction from year 1 to year 2. The extent to which teachers reported altering their instruction due to POINT in-creased more for bonus winners than other teachers (see Table 6.8). While there were increases in the average scores for both groups, the increase was larger among the bonus winners than among other teachers. On the other hand, teachers who did not win a bonus reported greater change in the amount of time spent on standards and tests from year 1 to year 2 than bonus winners. Teach-ers who did not win a bonus also reported greater change in the amount of extra work hours. Whereas the bonus winners reported they decreased their outside-of-school work by almost an hour from year 1 to year 2, other teachers reported increasing their outside-of-school work by nearly half an hour. Further analysis showed that the most frequent outside-of-school work activi-ties for teachers who did not win a bonus consisted of preparing lesson plans, evaluating student work, and completing administrative responsibilities.
There were few changes in the amount of professional development or in perceptions of school climate between year 1 and year 2 that were related to bonus status at the end of year 1. The one exception involved professional development that focused on the TCAP and interpretation of stu-dent achievement results. Bonus winners increased their training in this area from year 1 to year 2
79 To examine the relationship between winning a bonus and change in responses from year 1 to year 2, and from year 2 to year 3, we restricted the sample to treatment teachers who responded to the surveys for the relevant two years. We then created difference scores for each scale by subtracting the previous year from the current year; as a result, positive scores indicated that the current year had higher values. We then standardized the difference scores, and modeled the standardized difference scores as a function whether or not the teacher won a bonus the previous year. Teaching experience was included as a covariate.

Final RepoRt: expeRimental evidence FRom the pRoject on incentives in teaching (point) / 131
while other teachers showed the opposite pattern.
Taken together, the results suggested bonus winners became more positive about POINT, and further increased their focus on professional development that emphasized use of test scores. Despite not winning a bonus, other teachers continued to be motivated, reporting an increase in the amount of outside-of-school time on schoolwork. They also increased their emphasis on standards and tests, which is consistent with the idea that test-based incentives may lead teachers to place greater focus on MNPS standards and TCAP content in an effort to win a bonus.

132 / national centeR on peRFoRmance incentives
taBle 6.8change in attitudes, practices, professional development, and school environment between Years 1 and 2 by Bonus status in Year 1Variable Name Range
of Score Values
Earned a Bonus in Year 1(N = 32)
Did Not Earn a Bonus in Year 1
(N = 67)
Difference in Standardized Gains (Earned
Bonus – Did Not Earn Bonus )Year 1-
2007 Mean
Year 2-2008 Mean
Year 1-2007 Mean
Year 2-2008 Mean
negative effects of point 1-4 1.39 1.54 1.61 1.72 0.01positive perceptions of point 1-4 2.42 2.56 2.38 2.26 0.59 **extra effort for bonus 0-100 15.63 19.16 27.88 29.92 0.01standards-based math 1-6 5.27 5.28 5.00 4.94 0.07change in emphasis: standards and tests a
1-5 3.45 3.31 3.57 3.67-0.66 **
test preparation 1-4 3.49 3.45 3.44 3.40 0.04instructional use of test scores 1-4 2.89 2.91 2.82 2.97 -0.17Focus on below-proficient students (%)
0-100 59.38 58.06 56.72 45.45 0.16
increase in reform instruction a 1-5 3.31 3.27 3.57 3.55 -0.36extra work hours 0-50 12.81 12.00 12.87 13.21 0.08 *change in instruction 1-4 1.59 1.77 1.92 1.98 0.24 *math pd hours 0-136 22.78 33.84 21.67 30.70 0.04math pd focus 1-5 2.69 3.02 2.67 2.89 0.03test use pd focus 1-5 1.80 2.05 1.94 1.87 0.34 *math pd collaboration 1-6 3.00 2.91 2.80 2.60 0.07teacher collegiality 1-4 3.28 3.30 3.10 3.07 0.16
the sample is limited to teachers who responded to the surveys in both years.values for n in column headings indicate total numbers of survey respondents. sample sizes for some items are slightly smaller due to skipped item-level responses.a difference scores were not calculated for these scales because the items asked about changes in practice from the previous year (i.e., “How much change has there been … this year compared to last year?”). Thus, these scales already represent a change score.positive standardized differences indicate the bonus group showed larger increases or smaller decreases in change scores than the non-bonus group, after controlling for years of experience.* p<0.05; ** p<0.01

Final RepoRt: expeRimental evidence FRom the pRoject on incentives in teaching (point) / 133
Table 6.9 provides the change in scores for each scale from year 2 to year 3, delineated by year 2 bonus status. As we have seen for years 1 and 2, teachers who won a bonus in year 2 reported an increase in their positive perceptions of POINT from year 2 to year 3, whereas teachers who did not win a bonus in year 2 reported a decrease (see Table 6.9). In a similar vein, year 2 bonus win-ners reported increasing their effort to win a bonus from year 2 to year 3, whereas teachers who did not win a bonus in year 2 reported decreasing their effort to do so in year 3. Despite the larger increase in the reported effort put forth by the bonus winners, both the bonus winners and other teachers reported comparable amounts of effort to win a bonus in year 3.
Bonus winners also reported an increased change in their instructional practices from year 2 to year 3, whereas other teachers reported a decrease. However, changes in other measures of prac-tice were similar across the two groups.
Bonus status was also related to changes in mathematics-related professional development. Teach-ers who won a bonus in year 2 reported increasing the amount of professional development hours in math the next year. In addition, they reported that more of their professional development activities were focused on the teaching and study of math. In contrast, teachers who did not win a bonus in year 2 reported decreases in both the amount of math-related professional development hours and the amount of professional development activities that were focused on math teaching strategies and topics. Instead, teachers who did not win a bonus focused their attention on receiv-ing assistance from the district’s math mentors, and reported an average increase of more than 3 hours from year 2 to year 3. Bonus winners also reported more contact with the district math mentors from year 2 to year 3, but the average increase was more modest, at 1.5 hours.
Overall, from year 2 to year 3, treatment teachers who earned bonuses developed more positive attitudes thereafter and seemed to redouble their efforts, while teachers who did not earn a bonus had less positive attitudes toward POINT in subsequent years and seemed to make fewer changes.
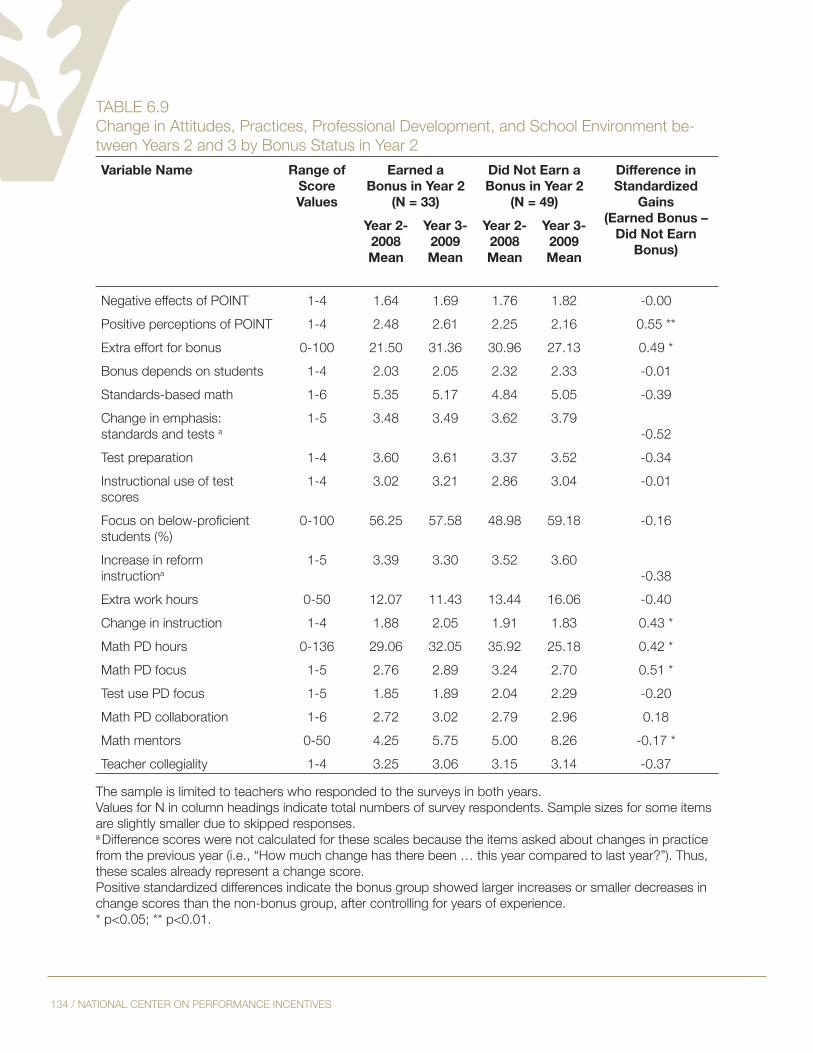
134 / national centeR on peRFoRmance incentives
taBle 6.9change in attitudes, practices, professional development, and school environment be-tween Years 2 and 3 by Bonus status in Year 2Variable Name Range of
Score Values
Earned a Bonus in Year 2
(N = 33)
Did Not Earn a Bonus in Year 2
(N = 49)
Difference in Standardized
Gains(Earned Bonus –
Did Not EarnBonus)
Year 2- 2008Mean
Year 3- 2009Mean
Year 2- 2008Mean
Year 3-2009Mean
negative effects of point 1-4 1.64 1.69 1.76 1.82 -0.00positive perceptions of point 1-4 2.48 2.61 2.25 2.16 0.55 **extra effort for bonus 0-100 21.50 31.36 30.96 27.13 0.49 *Bonus depends on students 1-4 2.03 2.05 2.32 2.33 -0.01standards-based math 1-6 5.35 5.17 4.84 5.05 -0.39change in emphasis: standards and tests a
1-5 3.48 3.49 3.62 3.79-0.52
test preparation 1-4 3.60 3.61 3.37 3.52 -0.34instructional use of test scores
1-4 3.02 3.21 2.86 3.04 -0.01
Focus on below-proficient students (%)
0-100 56.25 57.58 48.98 59.18 -0.16
increase in reform instructiona
1-5 3.39 3.30 3.52 3.60-0.38
extra work hours 0-50 12.07 11.43 13.44 16.06 -0.40change in instruction 1-4 1.88 2.05 1.91 1.83 0.43 *math pd hours 0-136 29.06 32.05 35.92 25.18 0.42 *math pd focus 1-5 2.76 2.89 3.24 2.70 0.51 *test use pd focus 1-5 1.85 1.89 2.04 2.29 -0.20math pd collaboration 1-6 2.72 3.02 2.79 2.96 0.18math mentors 0-50 4.25 5.75 5.00 8.26 -0.17 *teacher collegiality 1-4 3.25 3.06 3.15 3.14 -0.37
the sample is limited to teachers who responded to the surveys in both years.values for n in column headings indicate total numbers of survey respondents. sample sizes for some items are slightly smaller due to skipped responses.a difference scores were not calculated for these scales because the items asked about changes in practice from the previous year (i.e., “How much change has there been … this year compared to last year?”). Thus, these scales already represent a change score.positive standardized differences indicate the bonus group showed larger increases or smaller decreases in change scores than the non-bonus group, after controlling for years of experience.* p<0.05; ** p<0.01.

Final RepoRt: expeRimental evidence FRom the pRoject on incentives in teaching (point) / 135
6.3.3 teachers’ Responses predicting Bonus status
Previously we examined whether earning a bonus was related to subsequent practice; here we ex-plore whether particular practices are associated with subsequent bonuses.80 Table 6.10 provides the regression coefficients relating attitudes, instructional practices, professional development, and school environment variables measured in the spring of each year to bonus status earned at the end of the school year. In year 1, none of the measures were significant predictors of whether or not teachers would go on to win a bonus based on that year’s student test results. In year 2, teachers who reported putting in more effort in the past year to win a bonus were significantly less likely to win a bonus, as were teachers who reported focusing on below-proficient students.
As reported earlier, if a greater proportion of bonus winners than other teachers were already working at maximum effectiveness, we may expect them to score lower than non-bonus teacher on a survey item that asks about extra effort. However, unlike in year 1, we did not find bonus winners and other teachers to be working at different levels of capacity in year 2. Namely, teachers in both groups endorsed the statement “I was already working as effectively as I could before the implementation of POINT, so the experiment will not affect my work” at similar rates (75 per-cent). Thus, it was not the case that relative to teachers who did not win the bonus, bonus winners had no “extra” effort to put forth.
In year 2, teachers who reported focusing on students who were below proficient had a greater probability of winning a bonus. It is possible that extra effort devoted to below-proficient students paid off in larger gains for these students relative to more proficient students.
80 To investigate how responses on the survey in the spring of year 1 were related to earning a bonus for year 1, we used a linear regression model that included years of teaching experience and teachers’ value-added estimate of effectiveness from the previous year (prior to the experiment) as covariates. To explore how survey responses in year 2 were related to earning a bonus for year 2, we controlled for teaching experience and whether or not teachers received a bonus in year 1. We do not report analogous analysis for the third year due to small sample sizes.

136 / national centeR on peRFoRmance incentives
taBle 6.10 Standardized Regression Coefficients of Beliefs, Practices, Professional Development, and school environment variables that predict Bonus statusVariable Name Year 1-2007
(N = 141)Year 2-2008
(N = 107)experience 0.69 0.05negative effects of point -0.39 0.05positive perceptions of point 0.01 0.63support for performance pay 0.04extra effort for bonus -0.37 -0.84 **Bonus depends on students 0.12Understanding of point -0.23standards-based math 0.09 0.54change in emphasis: standards and tests -0.19 -0.25test preparation -0.33 0.56instructional use of test scores -0.10 0.34Focus on below-proficient students 0.36 0.67 *increase in reform instruction -0.12 0.26extra work hours 0.44 0.19change in instruction -0.15 -0.19math pd hours 0.03 0.22math pd focus 0.30 -0.88test use pd focus 0.53 -0.39math pd collaboration 0.17 0.30math mentors -0.49teacher collegiality 0.80 -0.01principal leadership -0.58
* p<0.05; ** p<0.01Blank cells indicate that the question was not asked in that year.

Final RepoRt: expeRimental evidence FRom the pRoject on incentives in teaching (point) / 137
6.4 discUssion
Treatment and control group teachers reported very few differences in terms of attitudes, prac-tices, professional development, and school environment. The most noteworthy finding is that treatment teachers’ views of their school environments were at least as positive, and in some cases more so, than control group teachers. The opinions of both treatment and control teachers under-went some changes over the course of the experiment. Views of POINT became more negative. Teachers focused more on test scores. For the most part there were no differences between treat-ment and control teachers in these longitudinal comparisons. The exception was in their view of principal leadership, where the treatment group was more positive in year 1, though no differ-ence remained in year 3. Overall this suggests that being assigned to the group that was eligible to earn bonuses did not have large mean effects on the attitudes, perceptions or behaviors that we measured. On average, treatment teachers did not exhibit more positive attitudes toward pay for performance, make major changes in instructional practices, participate in more professional development or develop more positive perceptions of their school environment compared with control teachers.
There were differences between treatment teachers who earned a bonus and those who did not, although some of these differences should be interpreted cautiously because the numerous sta-tistical tests conducted may have led us to observe significant differences by chance alone. While both groups generally supported performance-based compensation plans and the POINT experi-ment, teachers who earned a bonus reported an increase in positive perceptions of the POINT program while teachers who did not earn a bonus showed the opposite pattern. Moreover, teach-ers who did not win bonuses were more likely than bonus winners to believe the POINT program increased teacher resentment and stress and decreased teacher collaboration. Because this dif-ference was present prior to the awarding of any bonus payment; it does not appear to be a result of the bonuses, though it might be predictive of them. For the most part, however, few POINT participants believed the experiment had negative consequences for teachers.
A potential concern for performance-based compensation programs is the effect they may have on teachers who do not earn bonuses, particularly on their motivation to continue to put forth effort when they do not receive a bonus. The results of this study suggest that the failure to earn a bonus was not necessarily detrimental to non-bonus teachers’ motivation, as the reported levels of extra effort put forth to earn a bonus were comparable to or greater than those reported by bonus winners. Furthermore, the POINT experiment may have had the effect of spurring teachers who did not win a bonus to work harder. For example, from year 1 to year 2, there was an increase in the amount of time that teachers who did not earn a bonus indicated they spent on school-related work outside of formal school hours, with a moderate portion of this time devoted to curricular planning and evaluating student work.
Our analyses suggested that bonus winners and other teachers had different approaches to in-struction and professional development. Bonus winners were more likely than other teachers to engage in professional development that focused on math teaching strategies and math topics and to receive professional development related to mentoring, coaching, and peer collaboration. They

138 / national centeR on peRFoRmance incentives
also were more likely than other teachers to change their instruction in response to POINT, and engaged in standards-based mathematics instruction and test preparation activities more fre-quently than did teachers who did not earn a bonus. The literature has suggested that engaging in content-professional development can be effective ways to improve students’ test scores (Yoon et al., 2007; Desimone et al., 2002; Garet et al., 2001), as can aligning instruction to standards (Por-ter & Smithson, 2001) and incorporating test preparation into instruction (Smith & Fey, 2000).On the other hand, teachers who did not earn a bonus were more likely than bonus winners to report greater emphasis on reform-oriented instruction. While previous studies have found posi-tive correlations between these types of practices and student achievement (Le et al., 2009), it is possible that teachers who did not win a bonus may not have been effective at implementing these strategies. Studies have shown that it is particularly difficult to for teachers to engage in reform-oriented practices, and many teachers perceive themselves to be using reform-oriented practices, whereas observers judge them to be doing so in only superficial ways (Cohen, 1990; Ingle & Cory, 1999; Mayer, 1999). However, we are unable to evaluate the quality of teachers’ instruction through surveys.
Taken together, the results suggest that the implementation of a performance-based compensa-tion plan that provides incentives to individual teachers does not necessarily have negative effects on teachers’ attitudes or the school environment. Treatment and control group teachers, as well as bonus winners and other teachers, expressed support for the POINT experiment and gave high marks to the level of teacher collegiality and collaboration in their school. While this suggests that the POINT experiment was generally well-received by teachers, we cannot identify from our surveys which particular features of the program were endorsed by teachers and which particular features were in need of improvement. Future studies should examine teachers’ perceptions of various aspects relating to the POINT experiment, including the clarity of the feedback provided about their performance, the extent to which there are mechanisms in place to support improve-ments in teaching, and the degree of alignment among the POINT experiment, teacher profes-sional development, and other teacher evaluation systems.
The study also suggests that earning a bonus was not related to changes in treatment teachers’ attitudes and behaviors as much as it was the result of differences in attitudes and behaviors that existed before the program was implemented. Finally, the school environment, particularly teach-ers’ judgments about teacher collegiality and principal leadership, did not have a big effect on the impact of the experiment or on treatment teachers’ likelihood of earning a bonus.

Final RepoRt: expeRimental evidence FRom the pRoject on incentives in teaching (point) / 139
this page intentionally left blank.

140 / national centeR on peRFoRmance incentives
chapteR 7: conclUsions and diRection oF FUtURe ReseaRchWe begin this chapter by reviewing the lessons learned from POINT, both concerning the imple-mentation of incentive pay and its impact on student achievement. We close with some broader reflections on incentive design and on research into the role of incentives in education.
Implementation. In terms of implementation, POINT was a success. At the district’s request, par-ticipation was voluntary. Given the controversial history of performance incentives in education, we had some concern that an insufficient number of teachers would choose to participate. More than 70 percent of eligible teachers volunteered, exceeding our target. Only one teacher asked to be removed from the study. Responses to teacher surveys administered in the spring of each year ranged between 92 percent and 100 percent. Through the three years that the project ran, it enjoyed the support of the district, the teachers union, and community groups. Bonuses were paid as promised. Because focus groups conducted prior to the project indicated that teacher were concerned about adverse consequences if the list of bonus winners were publicized, we promised that to the extent possible we would maintain confidentiality about who participated and who earned bonuses. We were able to keep this promise, despite paying out nearly $1.3 million in bonuses. Nonetheless, POINT enjoyed a relatively low profile in the community. In contrast to the experience with performance pay elsewhere, no list of winners appeared in the local press, nor did irate teachers seek outlets in the media to express dissatisfaction with their treatment.
Probably the greatest problem from the standpoint of implementation was the high rate of at-trition from the project. POINT began with 296 participating teachers. By the end of the third year, only 148 remained. Attrition occurred for a variety of reasons: teachers left the district, they switched to administrative jobs, they took positions in elementary schools or high schools, they ceased teaching math, or the number of math students they had fell below the threshold of 10. Cumulative attrition by the end of the project was higher among control teachers than treatment teachers (55 percent versus 45 percent), though the difference was only marginally statistically significant (p = .12). The experiment therefore provides weak evidence that the opportunity to earn a bonus reduces teacher attrition, though the project was not designed to test that hypoth-esis. However, there is no evidence that being eligible for a bonus had a differential impact by teacher quality, as would be the case if being assigned to the treatment group made more effective teachers particularly likely to stay.
Outcomes. Of greatest interest is the impact of performance incentives on student achievement, the central question the study was designed to address. Our principal findings can be summarized as follows:
• With respect to test scores in mathematics, we find no significant difference overall between students whose teachers were assigned to the treatment group and those whose teachers were assigned to the control group.
• In addition, there were no significant differences in any single year, nor were there significant differences for students in grades 6-8 when separate effects were estimated for each grade level.

Final RepoRt: expeRimental evidence FRom the pRoject on incentives in teaching (point) / 141
• We do find significant positive effects of being eligible for bonuses in the second and third years of the project in grade 5. The difference amounts to between one-half and two-thirds of a year’s typical growth in mathematics.
• However, these effects are no longer evident the following year. That is, it makes no difference to grade 6 test scores whether a student’s fifth-grade teacher was in the treatment group or the control group.
• There was also a significant difference between students of treatment and control teachers in fifth-grade social studies (years 2 and 3 of the project) and fifth-grade science (year 3). No dif-ferences for these subjects were found in other grades.
• Given the limited scope of the effects and their apparent lack of persistence, we conclude that the POINT intervention did not lead overall to large, lasting changes in student achievement as measured by TCAP.
These findings raise further questions. Why did we find no effect on most students? Why was there an effect in grade 5?
We have considered three explanations for the absence of an effect. (1) The incentives were poorly designed. Bonuses were either too small or the prospect of obtaining a bonus was too remote for teachers to change their instructional practices. (2) Teachers made little or no attempt to improve, either because they believed they were already doing the best job of which they were capable, or because they did not know what else to try. (3) Teachers did attempt to improve their perfor-mance, but the measures they took were not effective.
The first explanation does not appear to be credible. Most treatment teachers were “within range” of a bonus, in the sense that they would have qualified for a bonus had their students answered correctly 2-3 more questions (on a mathematics test of approximately 55 items). A third of the teachers assigned to the treatment group actually did earn a bonus at some point during the project—despite the fact that 45 percent of treatment teachers limited their opportunity to do so by dropping out before the experiment ended. Responses to teacher surveys confirmed that the POINT bonuses got their attention. More than 70 percent of treatment teachers agreed that they had a strong desire to earn a bonus. The size of the bonuses—$5,000, $10,000 and $15,000—rela-tive to base salaries in the district makes it extremely unlikely that teachers viewed them as not worth the bother.
These surveys contain much stronger evidence in support of the second explanation. More than 80 percent of treatment teachers agreed that POINT “has not affected my work, because I was al-ready working as effectively as I could before the implementation of POINT.” Fewer than a quar-ter agreed that they had altered their instructional practices as a result of the POINT experiment. Teachers’ responses to such questions are not perfectly reliable indicators of their behavior: there may have been some reluctance to disagree with the first statement, for example, as disagreement implies that a teacher was not already working as effectively as she could. And indeed, responses to survey items dealing with specific instructional methods reveal that some teachers claiming to have done nothing different in response to POINT did change classroom practices over the course of the project, though they may have meant that these changes were not in response to bonuses, but would have occurred anyway. On a wide range of questions about teaching practices,

142 / national centeR on peRFoRmance incentives
there are few to which treatment and control teachers gave consistently different answers in all years of the project. Nor were there significant differences between the two groups in the number of teachers reporting that they increased time spent on mathematics, either for all students or for low achievers in particular.
The conclusion that eligibility for bonuses did not induce teachers to make substantial changes to their instructional practices or their effort is corroborated by data from administrative records and surveys administered to the district’s math mentors. Although treatment teachers completed more hours of professional development in core academic subjects, the difference was small (.14 credit hours when the sample mean was 28) and only marginally significant (p = .12). Moreover, there was no discernible difference in professional development completed in mathematics. Like-wise, treatment teachers had no more overall contact with the district’s math mentors than teach-ers in the control group.
However, the conclusion that incentives failed because participating teachers were unable or unwilling to improve performance must be accompanied by an important caveat. As shown at the beginning of Chapter Five, mathematics achievement rose throughout the district’s elementary and middle schools in the second and third years of POINT. The metric is student gain bench-marked against the gain statewide for students with the same prior year score, so that this upward trend cannot be explained by something affecting all Tennessee schools alike (such as easier math tests). Clearly, MNPS mathematics teachers were doing something different. Because the district was under heavy pressure from NCLB to raise test scores, it may be that accountability-based improvement “crowded out” incentive-based improvement. If there was only so much a teacher could do in a short period of time to improve performance, there may not have been much scope for incentives to affect behavior. But this explanation remains speculative.
We are not able to say as much about the third hypothesis. Analysis of survey data on instruction-al methods is problematic. First are the obvious limitations of self-reported data. Second, while information was sought on practices that have been deemed ways of improving instructional effectiveness (with varying degrees of evidence), choices of teaching method are affected by teach-ers’ perceptions of student needs and their own strengths and weaknesses. That a given teacher does or does not adopt a particular practice tells us little about whether that teacher is making the right instructional decisions for her circumstances. Finally, success in using any teaching method depends on implementation. We cannot tell from survey responses whether teachers using par-ticular methods did so in a way that would enhance their effectiveness.
With these caveats in mind, what can we say about the way treatment teachers responded? While treatment teachers differed from control in some respects, only eight of our measures of instruc-tional practices were associated with improved student achievement in our data. Of those eight, treatment teachers were more likely than control teachers to use three. This is not strong evidence that treatment teachers were behaving differently from control teachers in ways that matter.To conclude, there is little evidence that POINT incentives induced teachers to make substantial changes to their instructional practices or their level of effort, and equally little evidence that the changes they did make were particularly well-chosen to increase student achievement, though the latter inference must be carefully qualified for the reasons indicated above. This might not

Final RepoRt: expeRimental evidence FRom the pRoject on incentives in teaching (point) / 143
be disturbing if it were true, as 80 percent of project participants claimed, that they were already teaching as effectively as they could. However, that claim is called into question by the substantial improvement in mathematics achievement across all middle school classrooms over the dura-tion of the project, particularly in the final year when the district faced the threat of state takeover under NCLB. Under that threat, test scores improved. Yet they did not in response to monetary incentives.
The overall negative conclusion is tempered by the finding of a positive response in fifth grade during the second and third years of the experiment. What made fifth grade the exception? It might be explained by the fact that math teachers in fifth grade normally have the same set of students for multiple subjects, giving them the opportunity to increase time spent on math at the expense of other subjects in a way that is not possible in grades 7 and 8, where math teachers typically specialize. While we found limited support for this hypothesis, it did not appear to be a factor in all years. Nor did tests scores fall in other subjects; in fact, they rose in fifth grade science and social studies. Other possibilities remain conjectural. Because fifth grade teachers have fewer students for longer periods, it may be that they achieve better understanding of their students and enjoy greater rapport with them, both of which might contribute to higher achievement when the stakes are raised for teachers. Fifth graders are the youngest students in middle school. Not yet adolescents, they may have been more responsive to attempts by their teachers to inspire them to greater effort.
Finally, while the positive fifth grade effect might seem to be “good news,” the effect did not last. By the end of sixth grade it did not matter whether a student’s fifth grade math teacher had been in the treatment group or the control group. If not spurious, the fifth grade effect seems at best short-lived, possibly a sign that it was achieved by narrowly teaching to the test or test-prep ac-tivities that had no enduring impact on achievement.
Teacher surveys obtained information about teachers’ perceptions and attitudes as well as their instructional practices. Some of what we learned is encouraging (if one believes there is a role for performance incentives in education). Teachers on the whole had a moderately positive attitude toward POINT, though it declined slightly over time. Failing to win a bonus did not sour treat-ment teachers; if anything, they seemed to put forth somewhat greater effort the following year, as measured by the time they put in outside regular school hours. Perceptions of teacher collegiality were not adversely affected by the experiment. The generally positive view of POINT may be due to the fact that teachers were not competing with one another for bonuses. It may also reflect the fact that the project was clearly understood to be an experiment in which even teachers opposed to incentives of this kind could see value.
In sum, the introduction of performance incentives in MNPS middle schools did not set off sig-nificant negative reactions of the kind that have attended the introduction of merit pay elsewhere. But neither did it yield consistent and lasting gains in test scores. It simply did not do much of anything. Possibly certain features of the project which were adopted in response to teachers’ concerns ended up limiting its impact. The names of bonus winners were not publicized. Teach-ers were asked not to communicate to other district employees whether they received bonuses. A performance measure was used with which teachers were not familiar, and though it was easy
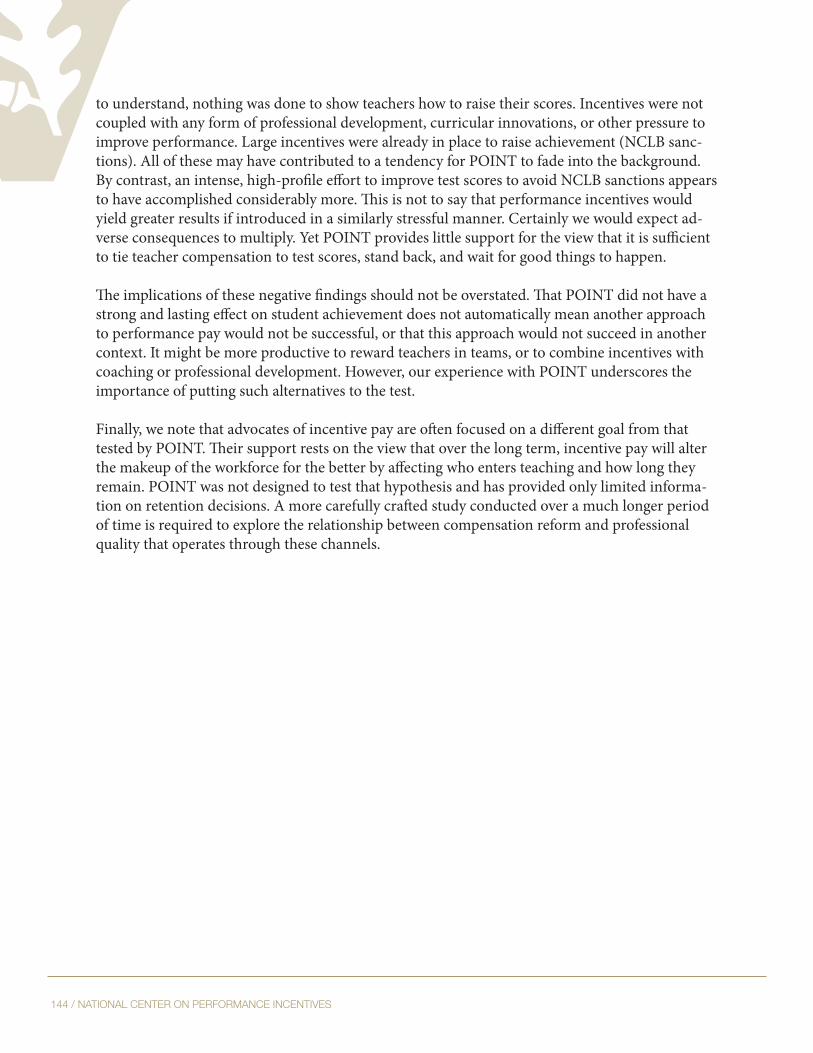
144 / national centeR on peRFoRmance incentives
to understand, nothing was done to show teachers how to raise their scores. Incentives were not coupled with any form of professional development, curricular innovations, or other pressure to improve performance. Large incentives were already in place to raise achievement (NCLB sanc-tions). All of these may have contributed to a tendency for POINT to fade into the background. By contrast, an intense, high-profile effort to improve test scores to avoid NCLB sanctions appears to have accomplished considerably more. This is not to say that performance incentives would yield greater results if introduced in a similarly stressful manner. Certainly we would expect ad-verse consequences to multiply. Yet POINT provides little support for the view that it is sufficient to tie teacher compensation to test scores, stand back, and wait for good things to happen.
The implications of these negative findings should not be overstated. That POINT did not have a strong and lasting effect on student achievement does not automatically mean another approach to performance pay would not be successful, or that this approach would not succeed in another context. It might be more productive to reward teachers in teams, or to combine incentives with coaching or professional development. However, our experience with POINT underscores the importance of putting such alternatives to the test.
Finally, we note that advocates of incentive pay are often focused on a different goal from that tested by POINT. Their support rests on the view that over the long term, incentive pay will alter the makeup of the workforce for the better by affecting who enters teaching and how long they remain. POINT was not designed to test that hypothesis and has provided only limited informa-tion on retention decisions. A more carefully crafted study conducted over a much longer period of time is required to explore the relationship between compensation reform and professional quality that operates through these channels.

Final RepoRt: expeRimental evidence FRom the pRoject on incentives in teaching (point) / 145
this page intentionally left blank.

146 / national centeR on peRFoRmance incentives
ReFeRences
Adnett, N. (2003). Reforming teachers’ pay: Incentive payments, collegiate ethos, and U.K. policy. Cambridge Journal of Economics, 27(1), 145-157.
Battelle for Kids. (2009). The importance of accurately linking instruction to students to determine teacher effectiveness. Retrieved from static.battelleforkids.org/images/BFK/Link_whitepagesApril-2010web.pdf
Bill and Melinda Gates Foundation. (2011). Learning about teaching: Initial findings from the mea-sures of effective teaching project. Retrieved from http://www.gatesfoundation.org/college-ready-education/Documents/preliminary-finding-policy-brief.pdf
Clotfelter, C. & Ladd, H. (1996). Recognizing and rewarding success in public schools. In H. Ladd (Ed.), Holding schools accountable: Performance-related reform in education. (pp. 23-64). Washing-ton, D.C.: The Brookings Institution.
Cohen, D. (1990). A revolution in one classroom: The case of Mrs. Oublier. Educational Evalua-tion and Policy Analysis, 12(3), 311-329.
Data Quality Campaign. (2009). The next step: Using longitudinal data systems to improve student success. Retrieved from http://www.dataqualitycampaign.org/files/NextStep.pdf
Desimone, L., Porter, A., Garet, M., Yoon, K., & Birman, B. (2002). Effects of professional devel-opment on teachers’ instruction: Results from a three-year longitudinal study. Educational Evalu-ation and Policy Analysis, 24(2), 81-112.
Efron, B. & Tibshirani, R. (1993). An introduction to the bootstrap. New York: Chapman & Hall/CRC.
Figlio, D. & Kenny, L. (2007). Individual teacher incentives and student performance. Journal of Public Economics, 91(5-6), 901-914.
Garet, M., Porter, A., Desimone, L., Birman, B., & Yoon, K. (2001). What makes professional development effective? Results from a national sample of teachers. American Educational Research Journal, 38(4), 915-945.
Glewwe, P., Ilias, N., & Kremer, M. (2008). Teacher incentives. Unpublished manuscript. Harvard University, Cambridge, MA.
Goldhaber, D. (2009). The politics of teacher pay reform. In M. Springer (Ed.), Performance incen-tives: Their growing impact on K-12 education. (pp. 25-42). Washington, D.C.: Brookings Institu-tion Press.
Final RepoRt: expeRimental evidence FRom the pRoject on incentives in teaching (point) / 147
Goldhaber, D., DeArmond, M., & DeBurgonmaster, S. (2007). Teacher attitudes about compensa-tion reform: Implications for reform implementation. Working Paper No. 20, School Finance Rede-sign Project, Center on Reinventing Public Education, Seattle, WA.
Hanushek, E. (2003). The failure of input-based school policies. The Economic Journal, 113(485), 64-F98.
Hein, K. (1996). Raises fail, but incentives save the day. Incentive, 170, 11.
Hill, H., Kapitula, L., Umland, K. (2011). A validity argument approach to evaluating teacher value-added scores. American Educational Research Journal, 48(3), 794-831.
Huber, G.(1967). The application of behavioral science theory to professional development. Acad-emy of Management Journal (Pre-1986), 10(000003), 275.
Ingle, M. & Cory, S. (1999). Classroom implementation of the national science education stan-dards: A snapshot instrument to provide feedback and reflection for teachers. Science Educator, 8, 49-54.
Jacob, B. & Levitt, S. (2003). Rotten apples: An investigation of the prevalence and predictors of teacher cheating. Quarterly Journal of Economics, 118(3), 843-877.
Jacob, B. & Springer, M. (2008). Teacher attitudes toward pay for performance: Evidence from Hill-sborough County, Florida. Paper presented at the National Conference on Performance Incentives: Their growing impact on American K-12 education, Nashville, TN, February.
Ladd, H. (1999). The Dallas school accountability and incentive program: An evaluation of its impacts on student outcomes. Economics of Education Review, 18, 1-16.
Lavy, V. (2002). Evaluating the effect of teachers’ group performance incentives on pupil achieve-ment. Journal of Political Economy, 110(6), 1286-1317.
Lavy, V. (2007). Using performance-based pay to improve the quality of teachers. The Future of Children, 17(1), 87-110.
Le, V., Lockwood, J., Stecher, B., Hamilton, L., & Martinez, J. (2009). A longitudinal investigation of the relationship between teachers’ self-reports of reform-oriented instruction and mathematics and science achievement. Educational Evaluation and Policy Analysis, 31(3), 200-220.
Linn, R. (2000). Assessments and accountability. Educational Researcher, 29(2), 4-16.
Mayer, D. (1999). Measuring instructional practice: Can policymakers trust survey data? Educa-tional Evaluation and Policy Analysis, 21(1), 29-45.
McCaffrey, D., Han, B., & Lockwood, J. (2008). From data to bonuses: A case study of the issues

148 / national centeR on peRFoRmance incentives
related to awarding teachers pay on the basis of their students’ progress. In National Center for Performance Incentives conference, Performance Incentives: Their growing impact on American K-12 education, Vanderbilt University, Nashville, TN.
Milgrom, P., & Roberts, J. (1990). Rationalizability, learning, and equilibrium in games with stra-tegic complementarities. Econometrica, 58(6), 1225-1277.
Muralidharan, K. & Sundararaman, V. (2008). Teacher incentives in developing countries: Experi-mental evidence from India. Research brief, National Center on Performance Incentives.
Murnane, R. & Cohen, D. (1986). Merit pay and the evaluation problem: Why most merit pay plans fail and a few survive. Harvard Educational Review, 56(1), 1-17.
Podgursky, M. (2009). Market based pay reforms for teachers. In M. Springer (Ed.), Performance incentives: Their growing impact on K-12 education. (pp. 67-86). Washington, D.C.: Brookings Institution Press.
Podgursky, M. & Springer, M. (2007). Teacher performance pay: A review. Journal of Policy Analy-sis and Management, 26, 909-950.
Porter, A. & Smithson, J. (2001). Defining, developing, and using curriculum indicators (CPRE Re-search Report Series RR-048). Philadelphia: Consortium for Policy Research in Education.
Raudenbush, S. & Bryk, A. (2002). Hierarchical linear models: applications and data analysis meth-ods. 2nd edition. Newbury Park, CA: Sage.
Smith, M. & Fey, P. (2000). Validity and accountability in high-stakes testing. Journal of Teacher Education, 51(5), 334-344.
Springer, M. & Balch, R. (2009). Design components of incentive pay programs in the education sec-tion. Paris, France: organization for Economic Co-operation and Development.
Steel, R., Torrie, J., & Dickey, D. (1997). Principles and procedures of statistics, 3rd edition. McGraw Hill.
White, H. (1980). A heteroskedasticity-consistent covariance matrix estimator and a direct test for heteroskedasticity. Econometrica (Pre-1986), 48(4), 817-838.
Winters, M., Ritter, G., Barnett, J., & Greene, J. (2006). An evaluation of teacher performance pay in Arkansas. University of Arkansas. Department of Education Reform.
Yoon, K., Garet, M., Birman, B., & Jacobson, R. (2007). Examining the effects of mathematics and science professional development on teachers’ instructional practice: Using professional development activity log. Washington, D.C.: Council of Chief State School Officers.

appendix / 149
appendix a:
WeRe point peRFoRmance taRgetsUnRealistic FoR most teacheRs?

150 / national centeR on peRFoRmance incentives
POINT tests whether large bonuses linked to student test scores motivate teachers in some un-specified set of ways to raise those scores. There are, of course, other ways to design incentives. Teachers might have been offered smaller amounts for incremental improvements over their own past results. In designing POINT as we did, we sought to test one model for radical reform of teacher compensation, in which high rewards are offered for excellent teaching, rather than a set of modest incentives that would yield, at best, modest results.
However, it may be wondered whether we set the bar at a height where few teachers would be motivated to change their instructional practices or raise their level of effort—that most teachers would regard the performance targets as unattainable no matter what they did, while a smaller number with strong past performance would also have little reason to make changes, but for the opposite reason: they could win a bonus without doing anything different. If the great major-ity of teachers fall into one of these two groups, only a few on the margin (or “the bubble”) have much incentive to do anything differently.
To address this concern, we examine achievement in the two years immediately before POINT, asking how many of the teachers who participated in POINT would have earned a bonus in one of those years had the same rules been in effect then. Focusing on the teachers for whom we have results in both years, we find 25 were “winners” in 2005 but not 2006, 18 were “winners” in 2006 but not 2005, and 23 would have won in both years, for a total of 66 who won in at least one year, compared to 94 that won in neither. Clearly it is not the case that only a small minority of teach-ers had a realistic chance of winning, as 41 percent of the teachers observed in both years actually did qualify at least once.
We conduct the same calculation for teachers in the control group during POINT. (Like teachers during the pre-POINT years, control teachers were not eligible for bonuses, so that this tabulation gives us the incidence of rewards assuming a “historical” level of effort.) 30 of the teachers ob-served in both years “won” at least once, compared to 59 that did not. Of those 59, an additional eight were “winners” in 2009. Thus, among control teachers who remained in POINT through the final year of the experiment, 38 met the bonus performance target at least once, versus 51 that did not, or 43 percent versus 57 percent.
These tabulations overlook those who failed to qualify but came close. For a more nuanced exam-ination of this question, we employ the mean benchmarked score, which, as described above, de-termined whether a teacher qualified for a bonus. Using a sample of all future participants in the pre-POINT years and the control teachers during the POINT years, we regress this performance measure on its lagged value, obtaining a predicted performance measure (EXPECTED PERFOR-MANCE)—what a teacher might reasonably have expected her students to do in the coming year, based on the year just completed. We then use this prediction as the independent variable in a logistic regression in which the dependent variable is a binary indicator for whether the teacher qualifies for a bonus in the coming year. Not surprisingly, EXPECTED PERFORMANCE is a strongly significant predictor of the probability of earning a bonus in the coming year, as teachers who have done well in the past tend to do well in the future. Figure A-1 contains histograms of the predicted probability of winning a bonus—the probabilities predicted from the logistic regres-sion. There are substantial differences between losers and winners in the predicted probability of
0
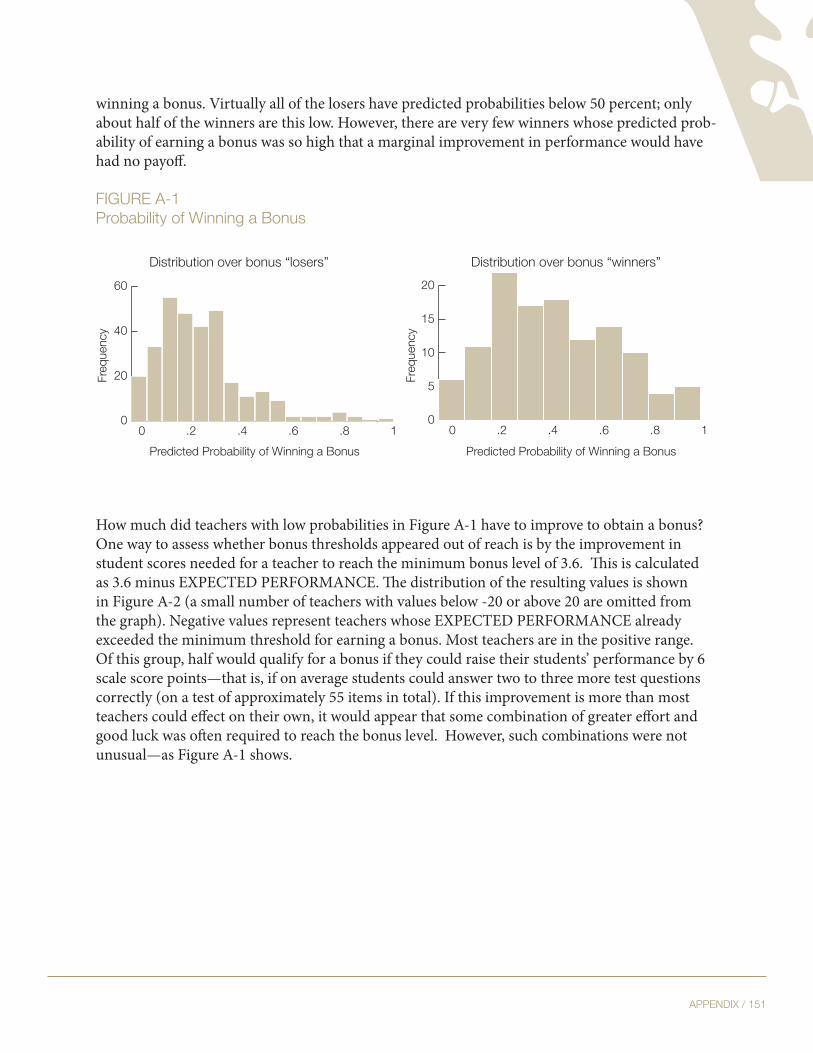
appendix / 151
winning a bonus. Virtually all of the losers have predicted probabilities below 50 percent; only about half of the winners are this low. However, there are very few winners whose predicted prob-ability of earning a bonus was so high that a marginal improvement in performance would have had no payoff.
FigURe a-1 probability of Winning a Bonus
How much did teachers with low probabilities in Figure A-1 have to improve to obtain a bonus? One way to assess whether bonus thresholds appeared out of reach is by the improvement in student scores needed for a teacher to reach the minimum bonus level of 3.6. This is calculated as 3.6 minus EXPECTED PERFORMANCE. The distribution of the resulting values is shown in Figure A-2 (a small number of teachers with values below -20 or above 20 are omitted from the graph). Negative values represent teachers whose EXPECTED PERFORMANCE already exceeded the minimum threshold for earning a bonus. Most teachers are in the positive range. Of this group, half would qualify for a bonus if they could raise their students’ performance by 6 scale score points—that is, if on average students could answer two to three more test questions correctly (on a test of approximately 55 items in total). If this improvement is more than most teachers could effect on their own, it would appear that some combination of greater effort and good luck was often required to reach the bonus level. However, such combinations were not unusual—as Figure A-1 shows.
0
5
10
15
20
Predicted Probability of Winning a Bonus
Freq
uenc
y0
20
40
60
Predicted Probability of Winning a Bonus
Freq
uenc
y
.20 .4 .6 .8 1.20 .4 .6 .8 1
Distribution over bonus “losers” Distribution over bonus “winners”

152 / national centeR on peRFoRmance incentives
FigURe a-2Required improvement to earn a Bonus
The preceding analysis has used data on teachers’ performance measures to calculate how likely teachers were to win bonuses as a function of EXPECTED PERFORMANCE. As an alternative, we can use teachers’ subjective probabilities of winning bonuses, as reported in surveys con-ducted each spring during POINT. Arguably, teachers’ beliefs are more important than a statisti-cal analysis of historical data in understanding whether the design of POINT provided them with sufficient incentive to modify their practices. Figure A-3 depicts the distribution of these subjec-tive probabilities over bonus losers and winners.
Compared to the previous graphs, losers and winners look remarkably similar. Subjective prob-abilities bear almost no relationship to whether teachers actually won or lost bonuses. Teachers who thought they had almost no chance of earning a bonus are represented about equally in both groups, as are teachers who believed they were a sure thing. In both, the modal value is 50 per-cent.
0
50
100
150
200
Bonus Threshold Less Expected Performance
Den
sity
0 10 20-10-20
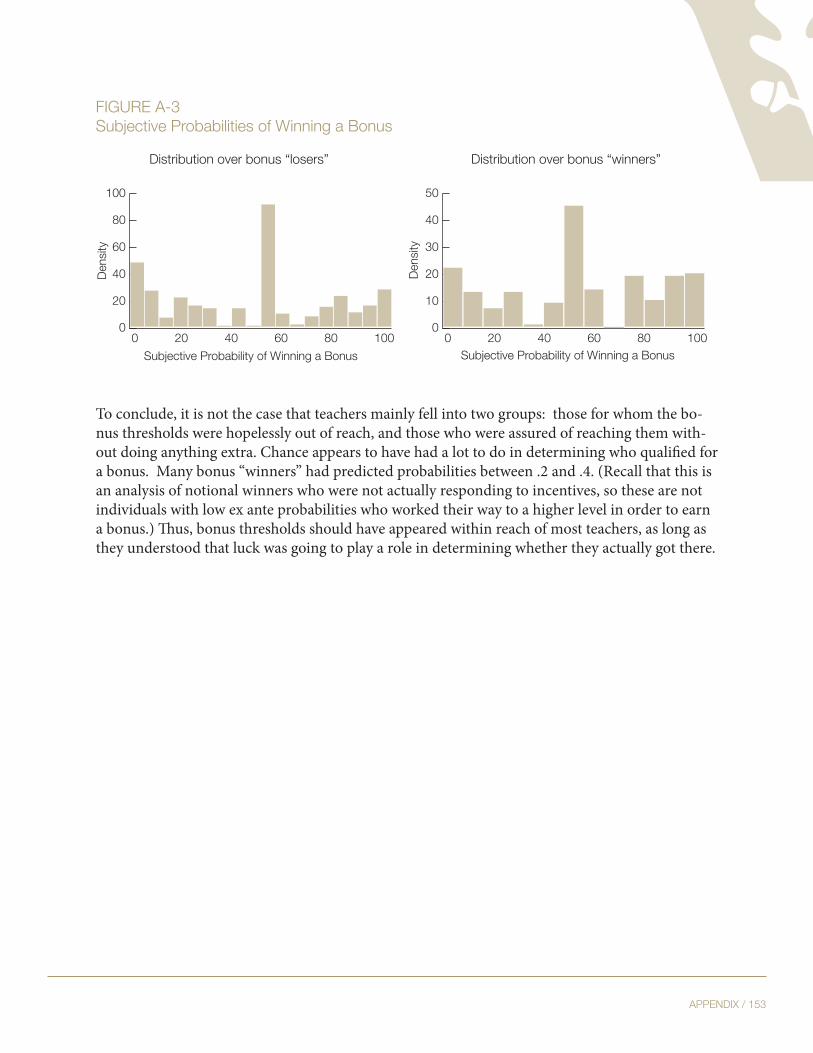
appendix / 153
FigURe a-3 subjective probabilities of Winning a Bonus
To conclude, it is not the case that teachers mainly fell into two groups: those for whom the bo-nus thresholds were hopelessly out of reach, and those who were assured of reaching them with-out doing anything extra. Chance appears to have had a lot to do in determining who qualified for a bonus. Many bonus “winners” had predicted probabilities between .2 and .4. (Recall that this is an analysis of notional winners who were not actually responding to incentives, so these are not individuals with low ex ante probabilities who worked their way to a higher level in order to earn a bonus.) Thus, bonus thresholds should have appeared within reach of most teachers, as long as they understood that luck was going to play a role in determining whether they actually got there.
0
.01
020406080100subjective probability of Winning a Bonus
0
20
40
60
80
100
Subjective Probability of Winning a Bonus
Den
sity
0
10
20
30
40
50
Subjective Probability of Winning a Bonus
Den
sity
0 20 40 60 80 100 0 20 40 60 80 100
Distribution over bonus “losers” Distribution over bonus “winners”
154 / national centeR on peRFoRmance incentives
appendix B:gRade-level compaRisons oF
tReatment and contRol gRoUps

appendix / 155
taBle B-1standardized adjusted treatment vs. control group mean differences Weighted by number of grade 5 students taught
Year 1-2007 Year 2-2008 Year 3-2009Teacher Demographics
Female -0.11 0.29 0.14Race White 0.12 0.57* 0.51 Black -0.04 -0.49† -0.42Year of birth 0.04 -0.11 0.03
Preparation and LicensureUndergraduate mathematics major -0.31† -0.41 -0.40Undergraduate math major or minor -0.17 -0.39 -0.35Undergraduate mathematics credits -0.05 -0.16 -0.14highest degree Bachelor’s only -0.11 -0.32 -0.39 master’s only -0.14 -0.23 -0.14master’s plus 30 credits or advanced degree
0.32† 0.65* 0.64
Alternatively certified 0.17 0.38† 0.10professional licensure -0.00 -0.01 0.22
Teaching ExperienceYear hired -0.05 -0.04 0.05Years experience 0.14 0.48† -0.01new teacher 0.11 -0.20 -0.29tenured 0.05 -0.03 0.15
Professional Developmenttotal credits, 2005-06 -0.03 -0.07 -0.21core subject credits, 2005-06 0.03 0.03 -0.08mathematics credits, 2005-06 0.13 0.10 0.12
Teacher Performancemathematics value-added, 2005-06 school year
-0.34 0.23 0.10
days absent, 2005-06 school year 0.00 0.33† 0.08Teaching Assignment, Course Description
percentage of students in mathematics courses
0.19 0.39† 0.64*
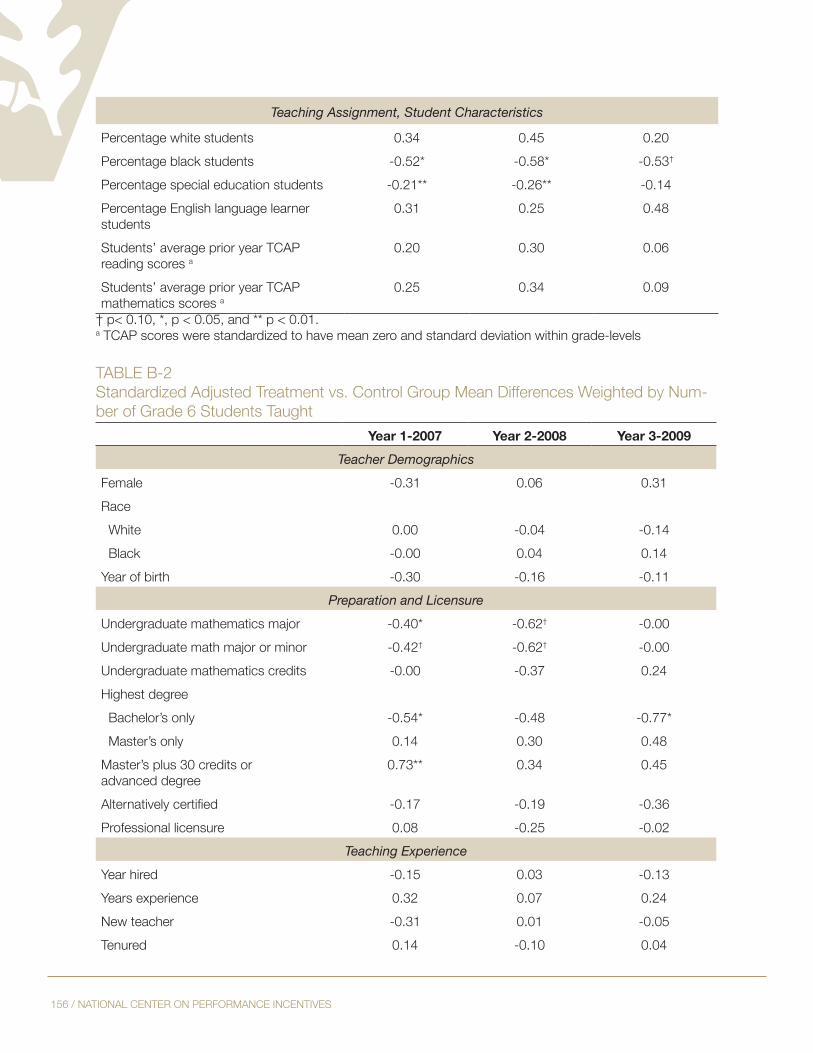
156 / national centeR on peRFoRmance incentives
Teaching Assignment, Student Characteristics
percentage white students 0.34 0.45 0.20percentage black students -0.52* -0.58* -0.53†
percentage special education students -0.21** -0.26** -0.14percentage english language learner students
0.31 0.25 0.48
students’ average prior year tcap reading scores a
0.20 0.30 0.06
students’ average prior year tcap mathematics scores a
0.25 0.34 0.09
† p< 0.10, *, p < 0.05, and ** p < 0.01.a tcap scores were standardized to have mean zero and standard deviation within grade-levels
taBle B-2standardized adjusted treatment vs. control group mean differences Weighted by num-ber of grade 6 students taught
Year 1-2007 Year 2-2008 Year 3-2009Teacher Demographics
Female -0.31 0.06 0.31Race White 0.00 -0.04 -0.14 Black -0.00 0.04 0.14Year of birth -0.30 -0.16 -0.11
Preparation and LicensureUndergraduate mathematics major -0.40* -0.62† -0.00Undergraduate math major or minor -0.42† -0.62† -0.00Undergraduate mathematics credits -0.00 -0.37 0.24highest degree Bachelor’s only -0.54* -0.48 -0.77* master’s only 0.14 0.30 0.48master’s plus 30 credits or advanced degree
0.73** 0.34 0.45
Alternatively certified -0.17 -0.19 -0.36professional licensure 0.08 -0.25 -0.02
Teaching ExperienceYear hired -0.15 0.03 -0.13Years experience 0.32 0.07 0.24new teacher -0.31 0.01 -0.05tenured 0.14 -0.10 0.04

appendix / 157
Professional Developmenttotal credits, 2005-06 -0.16 -0.09 -0.16core subject credits, 2005-06 0.01 0.03 -0.01mathematics credits, 2005-06 -0.15 0.17 0.02
Teacher Performancemathematics value-added, 2005-06 school year
0.60** 0.22 0.30
days absent, 2005-06 school year 0.05 0.38 0.66*Teaching Assignment, Course Description
percentage of students in mathematics courses
0.07 0.44* 0.57*
Teaching Assignment, Student Characteristicspercentage white students 0.19 0.33 0.27percentage black students -0.21 -0.48† -0.14percentage special education students 0.09 0.06 0.11percentage english language learner students
0.21 0.29† -0.23
students’ average prior year tcap reading scores a
-0.05 -0.03 0.07
students’ average prior year tcap mathematics scores a
0.00 0.12 0.16
† p< 0.10, *, p < 0.05, and ** p < 0.01.a tcap scores were standardized to have mean zero and standard deviation within grade-levels
taBle B-3standardized adjusted treatment vs. control group mean differences Weighted bynumber of grade 7 students taught
Year 1-2007 Year 2-2008 Year 3-2009Teacher Demographics
Female -0.28 -0.34 -0.35Race White -0.28 -1.00** -0.80 Black 0.40† 1.48** 1.44*Year of birth -0.28 0.11 -0.01
Preparation and LicensureUndergraduate mathematics major -0.13 -0.05 -0.27Undergraduate math major or minor -0.06 0.11 0.03Undergraduate mathematics credits -0.13 -0.19 -0.71†
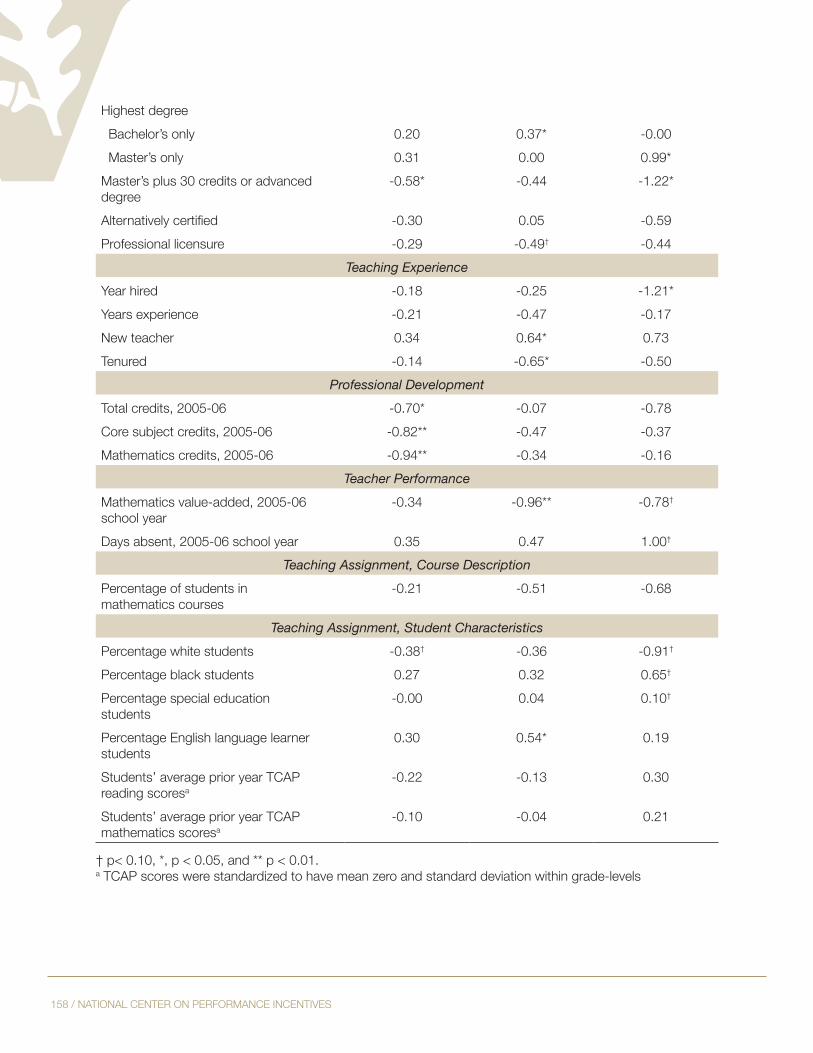
158 / national centeR on peRFoRmance incentives
highest degree Bachelor’s only 0.20 0.37* -0.00 master’s only 0.31 0.00 0.99*master’s plus 30 credits or advanced degree
-0.58* -0.44 -1.22*
Alternatively certified -0.30 0.05 -0.59professional licensure -0.29 -0.49† -0.44
Teaching ExperienceYear hired -0.18 -0.25 -1.21*Years experience -0.21 -0.47 -0.17new teacher 0.34 0.64* 0.73tenured -0.14 -0.65* -0.50
Professional Developmenttotal credits, 2005-06 -0.70* -0.07 -0.78core subject credits, 2005-06 -0.82** -0.47 -0.37mathematics credits, 2005-06 -0.94** -0.34 -0.16
Teacher Performancemathematics value-added, 2005-06 school year
-0.34 -0.96** -0.78†
days absent, 2005-06 school year 0.35 0.47 1.00†
Teaching Assignment, Course Descriptionpercentage of students in mathematics courses
-0.21 -0.51 -0.68
Teaching Assignment, Student Characteristicspercentage white students -0.38† -0.36 -0.91†
percentage black students 0.27 0.32 0.65†
percentage special education students
-0.00 0.04 0.10†
percentage english language learner students
0.30 0.54* 0.19
students’ average prior year tcap reading scoresa
-0.22 -0.13 0.30
students’ average prior year tcap mathematics scoresa
-0.10 -0.04 0.21
† p< 0.10, *, p < 0.05, and ** p < 0.01.a tcap scores were standardized to have mean zero and standard deviation within grade-levels
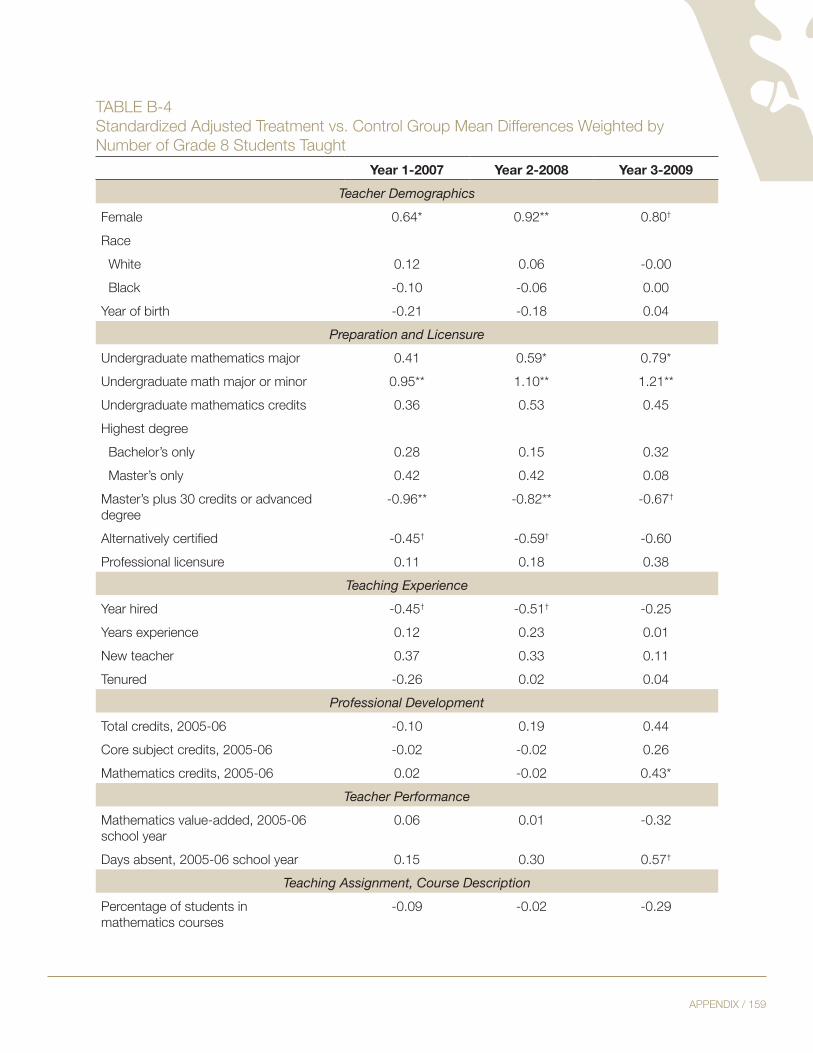
appendix / 159
taBle B-4standardized adjusted treatment vs. control group mean differences Weighted bynumber of grade 8 students taught
Year 1-2007 Year 2-2008 Year 3-2009Teacher Demographics
Female 0.64* 0.92** 0.80†
Race White 0.12 0.06 -0.00 Black -0.10 -0.06 0.00Year of birth -0.21 -0.18 0.04
Preparation and LicensureUndergraduate mathematics major 0.41 0.59* 0.79*Undergraduate math major or minor 0.95** 1.10** 1.21**Undergraduate mathematics credits 0.36 0.53 0.45highest degree Bachelor’s only 0.28 0.15 0.32 master’s only 0.42 0.42 0.08master’s plus 30 credits or advanced degree
-0.96** -0.82** -0.67†
Alternatively certified -0.45† -0.59† -0.60professional licensure 0.11 0.18 0.38
Teaching ExperienceYear hired -0.45† -0.51† -0.25Years experience 0.12 0.23 0.01new teacher 0.37 0.33 0.11tenured -0.26 0.02 0.04
Professional Developmenttotal credits, 2005-06 -0.10 0.19 0.44core subject credits, 2005-06 -0.02 -0.02 0.26mathematics credits, 2005-06 0.02 -0.02 0.43*
Teacher Performancemathematics value-added, 2005-06 school year
0.06 0.01 -0.32
days absent, 2005-06 school year 0.15 0.30 0.57†
Teaching Assignment, Course Descriptionpercentage of students in mathematics courses
-0.09 -0.02 -0.29
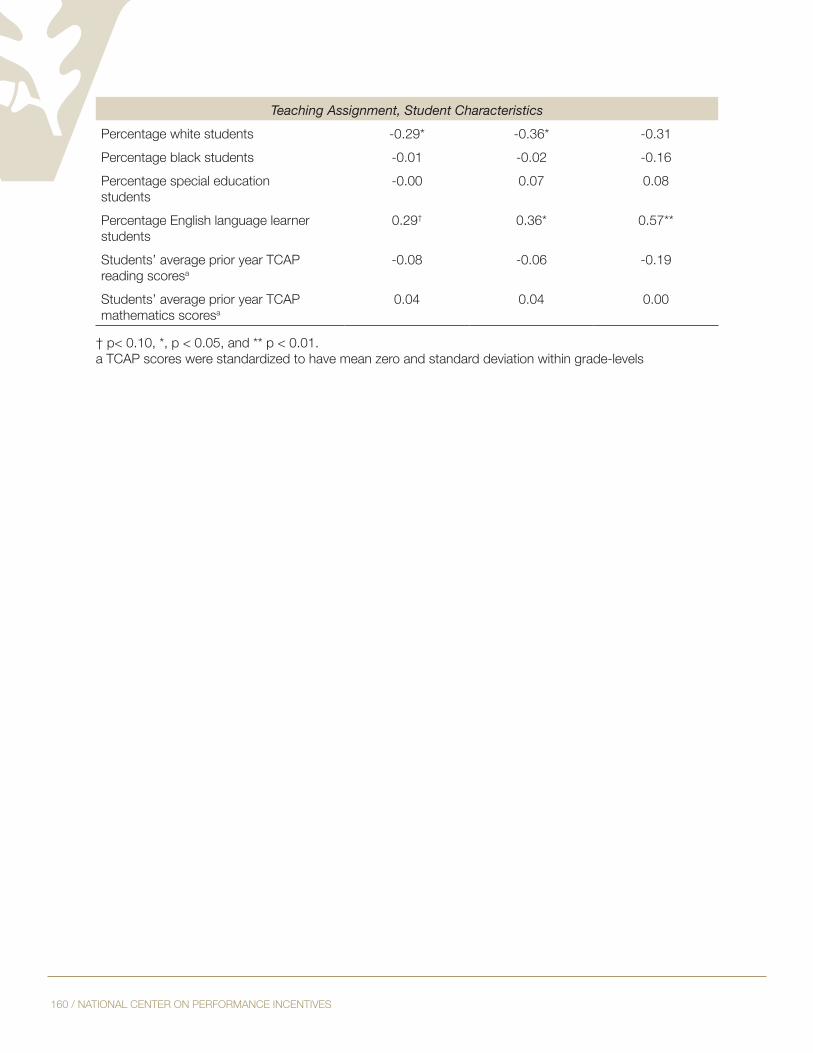
160 / national centeR on peRFoRmance incentives
Teaching Assignment, Student Characteristicspercentage white students -0.29* -0.36* -0.31percentage black students -0.01 -0.02 -0.16percentage special education students
-0.00 0.07 0.08
percentage english language learner students
0.29† 0.36* 0.57**
students’ average prior year tcap reading scoresa
-0.08 -0.06 -0.19
students’ average prior year tcap mathematics scoresa
0.04 0.04 0.00
† p< 0.10, *, p < 0.05, and ** p < 0.01.a tcap scores were standardized to have mean zero and standard deviation within grade-levels

appendix / 161
appendix c1:inFoRmation pRovided to teacheRs

PROJECT ON INCENTIVESIN TEACHING (POINT)
Frequently Asked Questions (FAQs)
Conducted by
National Center on Performance IncentivesPeabody College of Education and Human Development
Vanderbilt University
Funded by the United States Department of Education
Supported by
Peabody College of Vanderbilt UniversityLearning Sciences Institute at Vanderbilt University
University of Missouri at ColumbiaRAND Corporation
1

0
FREQUENTLY ASKED QUESTIONS (FAQs) These FAQs are organized into four categories.
I. Participation
Who is eligible to participate? How will the experiment work? How much extra work will I have to do? How long does the experiment last? Can I stop participating? Will I have another chance to sign up later? Can I switch from control group to treatment group? Will identities of participants/bonus winners be made public? Why should assignment to treatment and control groups be kept confidential? Will my performance in the experiment be used to evaluate me? Are special ed teachers eligible?
If I stop teaching math for one year, will I automatically rejoin the experiment when I return?
II. Bonuses
Are teachers competing against each other for bonuses? How are bonuses determined? How can you deter teachers who might cheat? When will teachers receive their bonuses? Will students who are not in my class all year count toward my bonus? Will students with missing test scores count toward my bonus?
III. Research
Why are you conducting this research? Why are only middle school math teachers eligible? What will researchers do with the results of the experiment?
IV. Miscellaneous
Very short answers to a variety of questions.

1
I. Participation Who is eligible? To participate in the experiment, you must be a teacher of mathematics in grades 5, 6, 7, or 8 with ten or more students in mathematics who are expected to take the TCAP at the end of the year.
You do not need to be a full-time math teacher—you may have students for other subjects, such as science or English. But you need at least ten students who are expected to take the TCAP math test. Your math students can be in a mix of different subjects and grades.
How will the experiment work? Participation is entirely voluntary. Approximately 200 volunteers are needed. If we have more volunteers than needed, some teachers will be selected (at random) for a waiting list. We will draw on these teachers in the future if we need to replace participants.
The teachers selected to participate will be randomly assigned to one of two groups: a treatment group and a control group. If you are put in the treatment group, you will be eligible to earn bonuses based on your students’ progress during the year, as measured by their gains on the TCAP (details below). If you are placed in the control group, you will not be eligible for bonuses. However, all participating teachers, in both treatment and control groups, will receive stipends of $750 each year for helping us in the experiment.
How much extra work will I have to do as a participant in the experiment? We will ask you to complete one or two surveys each year. (These surveys are not expected to take more than 30 minutes.) In addition we may seek to interview you in person. Responding to the surveys and interviews is all you have to do for us. Anything else (for example, taking steps to improve your teaching) is up to you. We are not asking that you adopt a particular teaching method or that you attend workshops or write reports.
How long does the experiment last? The experiment is planned to last three years. Teachers who are assigned to the treatment group will remain in that group for three years. Likewise, teachers assigned to the control group will remain in that group for three years.
If I do not want to continue in the experiment, may I stop? You may leave the experiment at any time by notifying us that you no longer wish to participate. However, if you leave before the end of the year, you will forfeit your annual stipend of $750.

2
If I do not participate in the first year, will I have a chance to change my mind later? We anticipate that some participating teachers will move out of the area or otherwise leave their jobs before the end of the experiment. When this happens, we will attempt to replace them. First priority will be given to teachers who volunteered in year one and who were placed on the waiting list. If we need additional replacements, we will call for new volunteers.
If I am assigned to the control group, will I have a chance to switch to the treatment group later? No, your assignment to the treatment or control group is permanent.
If I change schools, will I remain in the experiment? You will remain in the experiment as long as you continue to teach mathematics at the middle school level.
Will the identities of the participants be made public? Who will know if I earn a bonus? The National Center for Performance Incentives will not make public the names of participants. The district has also agreed to preserve confidentiality of the names of participants and the teachers who earn bonuses. Obviously someone in the district administration must have access to the names of the winners in order to send checks to the right individuals. However, this individual will not make this information public.
In addition, we are asking that all participating teachers sign a pledge of confidentiality not to reveal to other district employees whether they have been assigned to the treatment or the control group. In addition to protecting the integrity of the experiment, this provides you with an easy way to deflect prying questions. All you need say if asked whether you are eligible for a bonus (or if you have won one) is that you have signed a pledge of confidentiality.
Why is it important to the experiment to keep the assignments to treatment and control groups confidential? As in any experiment, treatment and control groups should be as much alike as possible, apart from the fact that one group receives the treatment and the other does not. Confidentiality helps to ensure that all teachers in the experiment will be treated normally by parents, by principals, and by colleagues, and keeps unwanted influences out of the experiment.
Will my teaching performance be compared to other participants? Will it be used to evaluate me or judge me in any way?
No.

3
Are special education teachers eligible to participate? Yes, provided they have at least ten math students who are expected to take the TCAP math test in the spring. Students taking an alternative assessment do not count toward the requirement of ten. What happens if I meet the minimum requirement (10 students) now, but over the course of the year some of my students leave the district or are transferred out of my class, so that I no longer have ten when the TCAP is administered? Will I be dropped from the experiment? You will not be dropped from the experiment, as long as the ten students you have in the fall are supposed to take the TCAP in the spring. If they leave your class for reasons beyond your control, you will be permitted to remain in the experiment. However, if your enrollment does not go back up above ten next fall, you will not be permitted to participate next year. Suppose I sign up to participate this year, but in 2007-08 I take a leave of absence for one year. Will I be permitted to rejoin the experiment when I come back from my leave? No. If you leave your teaching position, even for a leave of absence, we will need to replace you. It would not be fair to your replacement to bump him or her when you come back. If I stop teaching math for one year, will I automatically rejoin the experiment when I resume teaching math? No, when you stop teaching math, we will need to replace you. You will not automatically rejoin the experiment, even if you start to teach math again.

4
II. Bonuses Are teachers competing against one another for bonuses? No. Teachers will be judged against a standard based on past performance of Nashville teachers. This standard will be determined at the beginning of the experiment and will remain fixed. (For details, see the next question.) All teachers will have the opportunity to improve. In principle, all could end up exceeding this standard. Are you using the TVAAS to determine which teachers receive bonuses? We are not using TVAAS. Our procedure for determining which teachers will receive bonuses is described in the answer to the next question. How are bonuses determined? Bonuses are based on two factors: the progress of your math students over the year (as measured by their gains on TCAP), and the progress of your non-math students over the year (also measured by gains on TCAP).
It is easiest to explain using a hypothetical table. Suppose the table below represents a roster of math students for Mr. Brown. If you are assigned to the treatment group in the experiment, you will receive such a table with test results for each of your students once they are made available by the state and district. As you see, Mr. Brown’s roster includes each student’s TCAP score from spring of 2006 (column 2) and spring of 2007 (column 4). Between these two columns is another column containing benchmarks based on the 2007 scores of all students in Tennessee at this grade level.
For example, the first student on the roster is John Smith. John scored 250 on the TCAP in spring of 2006. The state benchmark score for John is 270. This represents the statewide average score in 2007 of students who, like John, had a score of 250 in 2006.1 In column 4 we see that John’s own 2007 score is 285. Thus, John gained 15 points more than the average student in Tennessee who started at the same level. We record this as +15 in column five.
We do likewise for the other students on the roster. Each student’s own gain is compared to the benchmark gain of similar students in the state, and the differences, plus or minus, are recorded in the final column.
At the bottom of column five, we have averaged the differences. As you see, Mr. Brown’s students gained 7 points more, on average, than similar students statewide. To find out whether Mr. Brown has earned a bonus, we compare his score of +7 to targets based on the performance of Nashville mathematics teachers in recent years. The lowest target is based on the top 20% of Nashville teachers from 2004 to 2006. If Mr. Brown’s +7 is equal to their performance, he will qualify for the lowest-level bonus, $5000. To earn a $10,000 bonus, Mr. Brown would need to exceed the performance of 85% of Nashville teachers from 2004 to 2006. And to qualify for a $15,000 bonus, he would need to exceed the performance of 95% of Nashville teachers over that period.
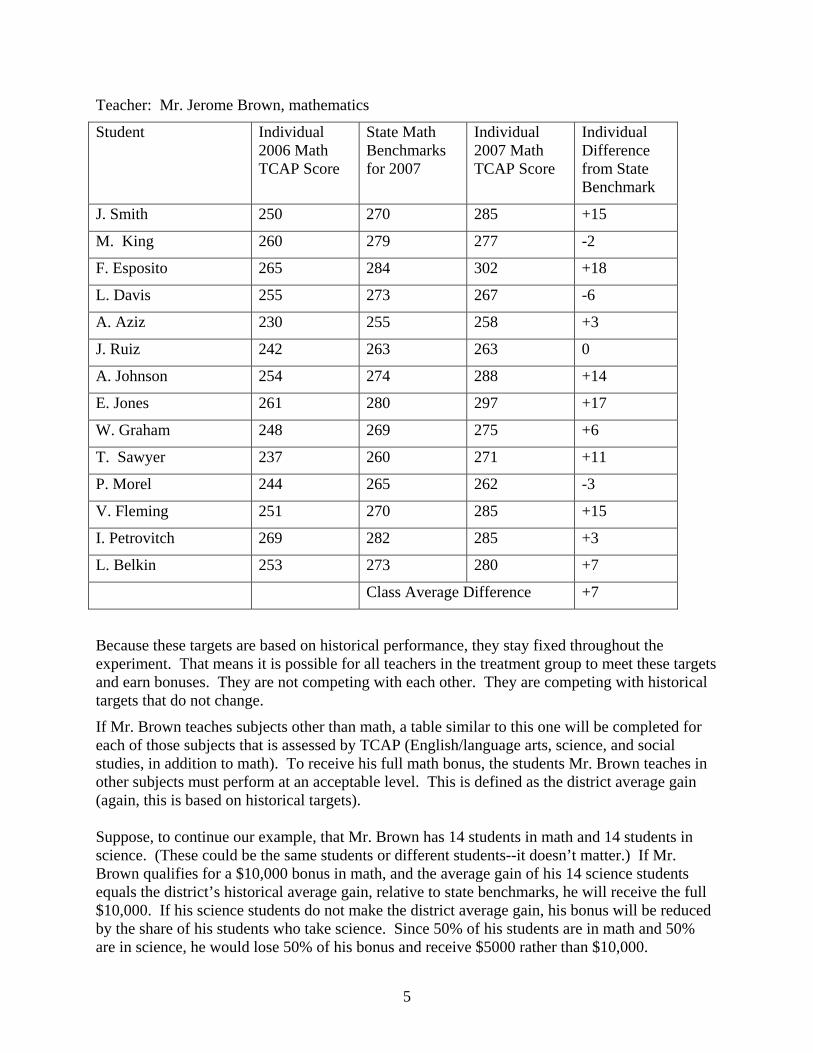
5
Teacher: Mr. Jerome Brown, mathematics
Student Individual 2006 Math TCAP Score
State Math Benchmarks for 2007
Individual 2007 Math TCAP Score
Individual Difference from State Benchmark
J. Smith 250 270 285 +15
M. King 260 279 277 -2
F. Esposito 265 284 302 +18
L. Davis 255 273 267 -6
A. Aziz 230 255 258 +3
J. Ruiz 242 263 263 0
A. Johnson 254 274 288 +14
E. Jones 261 280 297 +17
W. Graham 248 269 275 +6
T. Sawyer 237 260 271 +11
P. Morel 244 265 262 -3
V. Fleming 251 270 285 +15
I. Petrovitch 269 282 285 +3
L. Belkin 253 273 280 +7
Class Average Difference +7
Because these targets are based on historical performance, they stay fixed throughout the experiment. That means it is possible for all teachers in the treatment group to meet these targets and earn bonuses. They are not competing with each other. They are competing with historical targets that do not change.
If Mr. Brown teaches subjects other than math, a table similar to this one will be completed for each of those subjects that is assessed by TCAP (English/language arts, science, and social studies, in addition to math). To receive his full math bonus, the students Mr. Brown teaches in other subjects must perform at an acceptable level. This is defined as the district average gain (again, this is based on historical targets). Suppose, to continue our example, that Mr. Brown has 14 students in math and 14 students in science. (These could be the same students or different students--it doesn’t matter.) If Mr. Brown qualifies for a $10,000 bonus in math, and the average gain of his 14 science students equals the district’s historical average gain, relative to state benchmarks, he will receive the full $10,000. If his science students do not make the district average gain, his bonus will be reduced by the share of his students who take science. Since 50% of his students are in math and 50% are in science, he would lose 50% of his bonus and receive $5000 rather than $10,000.

6
Students in subjects that are not tested under TCAP (such as music, art, and foreign languages) do not affect your bonus.
Some teachers might try to improve their scores by encouraging certain students to stay home on test day or by coaching them during the exam. Do you have any way to deter this? News reports from other parts of the country indicate this can be a problem. As a result, we have developed the following procedures to safeguard the integrity of the experiment.
First, we will examine attendance during TCAP. If treatment and control groups in the same school have essentially the same absentee rate, we will conclude that no suspicious behavior occurred. Even if attendance in the treatment group is lower, it will be deemed acceptable for purposes of this experiment as long as it exceeds the requirements of No Child Left Behind. If neither of these conditions is satisfied, we will conduct further analysis. Treatment teachers with the worst attendance may be subject to one of these penalties: a reduction in their bonus (if they earn one), or being dropped from the experiment the following year. We emphasize that these penalties will be applied only in the worst cases. If you are a treatment teacher and your attendance during TCAP is not significantly worse than the rest of your school, you have nothing to fear.
According to MNPS policy, teachers are not to proctor their own students during TCAP. Student scores will be deemed valid in all schools that follow this policy. In schools that do not adhere to the policy, researchers for the Center will examine answer patterns for evidence of coaching. Teachers who are found to have coached their students during the exam will have their bonuses withheld and will be dropped from the experiment.
When will teachers receive their bonuses? The Center must wait until the district has received test results before it can calculate who has earned a bonus. We must also wait for the state to furnish us the data needed to compute state benchmarks. All of this should occur before the beginning of the next school year, but there could be delays. Once the Center has received the data it requires, it will inform the district which teachers have earned bonuses. If all goes well, you should be notified whether you have earned a bonus by the beginning of the next school year and receive the bonus shortly thereafter. If there are questions about the validity of your students’ scores, payment of bonuses may be delayed until we can investigate.
Do students who are not in my class for the full year count toward my bonus? We follow the rules established under No Child Left Behind. To count for purposes of this experiment, a student must be continuously enrolled in your class, starting no later than the 20th day of the school year, until the time of test administration.
Thus a student who leaves your class half-way through the year will not affect your bonus. However, this student will still count toward determining your eligibility, because eligibility is based on enrollment at the time participants are chosen (this fall).
7
Do students who have missing test scores count toward my bonus? Students who are missing test scores from the previous year do not count, because we cannot calculate their gains. However, we are working with MNPS administrators to obtain scores for as many students as possible, including students who were not enrolled in MNPS last year but who took TCAP elsewhere in the state.

8
III. Research Why are you conducting this experiment? Incentives for teachers are being widely discussed. They have been enacted by some state legislatures (for example, Texas and Florida) and are under consideration elsewhere. However, very little is known about the effectiveness of these incentives. We believe that more should be known about their consequences before legislatures and other public officials rush to put such policies in place. Why are only middle school math teachers eligible? First, there were not sufficient funds to set up an experiment that would cover teachers of all subjects at all grade levels. Second, previous research with achievement test data has shown that the effects of math teachers can be identified more readily than the effects of teachers in other subjects. We chose middle school rather than elementary school because middle school mathematics teachers, on average, work with a larger number of students than do elementary teachers of mathematics. Having a larger number of students improves the quality of the data obtained from the experiment. We chose middle school rather than high school because middle school students in Tennessee take the TCAP, a vertically-linked exam on which it is possible to measure gains from year to year. At higher grade levels, students take a variety of exams that lack this property. What will the researchers do with the results of this experiment? The researchers will write a report describing the effect that incentives had on mathematics achievement. Regardless of whether the effect was positive, negative, or zero, they will report the findings. The conclusion will be based on a comparison of treatment to control group teachers. Only group comparisons will be used, not comparisons of individuals. No information that could identify individuals will be reported by the researchers. The researchers will also write a report describing other effects of the incentive plan on schools and teachers, as revealed by the surveys that participants will fill out. These reports can be accessed through the Center’s website: www.performanceincentives.org.

9
IV. Miscellaneous (Quick Answers) More details on most of these matters can be found in the preceding sections.
1. How large are bonuses? Between $5,000 and $15,000, as long as your non-math students make acceptable progress. 2. What do I have to do to get a bonus? The gains of your math students, relative to a state benchmark, must exceed pre-specified targets. 3. What do I have to do to get a stipend? By participating in the experiment and completing surveys that will be sent to you once or twice a year, you will receive a stipend of $750. 4. When do I get the money? Stipends will be paid at the end of the academic year. If you earn a bonus, you will probably receive a check near the beginning of the next academic year. 5. Are all teachers eligible? No, only middle school math teachers who have at least ten students in math. 6. Why focus on math teachers? Funds are limited. Previous research has shown that it is easier to identify the effects of math teachers on standardized test scores than teacher effects in other subjects. 7. Do I have to teach only math? Can I have students in other subjects as well? You may have students in other subjects, as long as you have at least 10 math students. 8. Is the study confidential? We will not make public the names of any participating teachers or bonus winners. 9. Are all teachers eligible for bonuses? Only middle school math teachers can participate and earn bonuses, provided they are randomly assigned to treatment group and meet the targets. 10. Are we going to be competing against one another? No, you’ll be competing against a fixed standard, based on the district’s historical performance.
11. Who supports this research? Metropolitan Nashville Public Schools, MNPS Board of Education, Metropolitan Nashville Education Association, Tennessee Education Association, Nashville Mayor’s Office, and Nashville Alliance for Public Education.

10
12. Who is conducting this research? Peabody College of Vanderbilt University, in conjunction with the RAND Corporation and University of Missouri. 13. Who is raising money for the bonuses? The Nashville Alliance for Public Education. 14. How do you determine who wins bonuses? (There is no short answer to this question. Please turn to the section on bonuses, pp. 4-7.) 15. Will this experiment change our curriculum? No. 16. Can I still participate in professional development? Yes. 17. Can I still go to workshops? Yes. 18. How long will experiment last? 3 years. 19. What happens if I leave at end of year? Will you mail me my check? Unless you disappear without leaving a forwarding address, we will mail you your check. 20. Can I drop out of experiment after the first year? Yes. 21. Can I tell people I have a chance to win $15,000? You should not reveal this information directly or indirectly to other district employees. Teachers assigned to the treatment group will have a chance to earn a bonus, but teachers assigned to the control group will not. We are asking that you keep this information confidential. 22. Why are you doing this research? There is very little evidence about the effectiveness of performance incentives for teachers. We are trying to get some solid answers before policy-makers proceed in this area. 23. Is your procedure for deciding who earns a bonus fair to teachers? Student gains are measured against a state benchmark that takes into account each student’s score from last year. In this way, we have tried to ensure that a teacher is judged against a standard that is appropriate for the kinds of students that teacher has been assigned.

11
24. Is it easier for certain teachers to get a bonus? We have tried to level the playing field. However, some teachers may still feel that if they could have another teacher’s job, they would have an easier time earning a bonus. We have no way to evaluate the accuracy of such beliefs. 25. Are all TCAP tests vertically equated? Tests in mathematics and language arts are vertically equated. At this time, tests in science and social studies are not. 26. Must I have a minimum number of students before I can sign up? You must have ten math students who are expected to take the TCAP math test in order to participate. 27. Can a permanent substitute participate? Yes, if the permanent substitute will remain with the same students for the entire year. 28. If I teach math but have only a reading certification can I participate? Yes. 29. I’m moving next year. Can I still participate? Yes. 30. What do you think will be the outcome of this project? We don’t know whether the experiment will show that incentives are a good idea or a bad idea. We hope to get an answer one way or the other. 31. Are you studying only student achievement? No. We will ask teachers who are participating in the experiment to complete surveys describing how they have responded, if at all, to these incentives and how they believe the project has affected their schools. We will also conduct interviews with teachers and selected district personnel (for example, math coordinators). However, our analysis of the project’s effects on student outcomes will be based on test scores. 32. Are you conducting this research in other locations? The Center plans to conduct at least one additional experiment in another location, still to be determined. 33. How can I learn more about the Center? Go to our web site at www.performanceincentives.org. This site is still under development and may not be accessible until later in October. 34. Are you pro-incentives? The Center is not pro-incentive. It is also not anti-incentive. The Center has no official position on the wisdom of performance incentives. Our position is that incentives are being widely discussed and in some places enacted, and that more should be known about their effects before policies are put in place.

12
35. How do I sign up? Representatives of the Center will be visiting your school. You can also sign up by faxing the informed consent document to Mr. John Smith at (615) 322-6018 or e-mailing your signed consent form to [email protected]. If you do not receive e-mail confirmation within 24 hours of submitting your signed consent document please contact Mr. John Smith at (615) 322-7289. 36. Will we receive feedback on our instruction and performance? Teachers in the treatment group will receive a table like the one shown on p. 5, indicating how we determined whether you qualified for a bonus. Other than this, the Center will not provide feedback to teachers. 37. Will the principal know how well we did? No. 38. Does Dr. Garcia know who is in the experiment? No. 39. What information will researchers release to public? While the experiment is on-going, the Center will reveal how many teachers in the district are participating and how many teachers earned bonuses each year. We will not reveal any results of our analysis until the experiment is over. We will not reveal identities of participants or the schools in which they work at any time. 40. Will researchers observe my classroom teaching? No. 41. Are you using TVAAS to evaluate teachers? No. 42. Are you using a value-added measure of teacher effectiveness? Because our evaluation of teachers is based on student gains, it can be considered a value-added measure. However, it is not the same as the TVAAS estimate of teacher effectiveness. 43. How are you assigning teachers to treatment and control groups? Assignments are made randomly. Each teacher has an equal chance of being assigned to the treatment group and the control group. 44. Can I withdrawal from the experiment? Yes. 45. Can I give some of my money to the math coordinator? Your bonus will be paid to you. After that, you can do what you want with it.

13
46. Who funds the research? The United States Department of Education’s Institute of Education Sciences. 47. How long have you been working on this project? Planning has gone on for two years. 48. Who should I contact to learn more? Call the Center at (615) 322-5538 or e-mail the Center at [email protected] 49. What happens to the single salary schedule if this experiment shows positive effects from
performance incentives? The experiment is not about changing teachers’ base pay. It is about adding bonuses on top of base pay. We will point this out in our reports. 50. Is this research only conducted by Peabody College? The RAND Corporation is collaborating. 51. Who will know who is in experiment? A very small number of district employees need to know, in order to process the bonus payments. The Center will also have that information on file, because teachers are submitting consent forms. 52. What happens if I have questions throughout the project? Call the Center at (615) 322-5538. E-mail the Center at [email protected] 53. Will this take a lot of my time? The last research project I participated in took a lot of
time. One or two brief surveys will be sent to you during the year. You may also be contacted for a short interview. 54. Do I have to be in MNEA to participate? No. 55. What happens if a parent wants to know if I’m eligible for a bonus? Tell them that you have signed a pledge of confidentiality not to reveal this information. 56. What other states are experimenting with PFP? Texas and Florida, among others. 57. Does the Nashville School Board support this effort? Yes. 58. Do you monitor who takes the TCAP tests? We rely on the district to conduct the testing and provide us with results.

14
59. Am I responsible for all the kids in my classroom? Only students who have been in your class most of the year will count toward your bonus. 60. What happens if a student enters my class halfway through the year? That student will not affect your bonus. 61. How can I sign up? All teachers were sent an informed consent document. Teachers interested in participating need to fax the signed document to Mr. John Smith at (615) 322-6018 or e-mail the signed consent form to [email protected]. Teachers may also sign up when a Center representative visits your school. The Center must receive your signed consent form by 4:00 pm on Friday, September 29th. If you do not receive e-mail confirmation within 24 hours of submitting your signed consent document please contact Mr. John Smith at (615) 322-7289. 62. When will I find out if I’m a participant in the research project? All teachers that submitted an informed consent document will be notified in early October about their placement. Placements include control group, treatment group, or waitlist. 63. Will things change from one year to the next in the experimental design? We do not expect to make any changes. However, if it becomes apparent in the first year that the experiment is not working as intended, we will consider changes. 64. Is your research team made up of researchers or do teachers also participate? Researchers, some of whom have been K-12 teachers. 65. Is the reward system based on each student? No, an average of a teacher’s students. 66. Why mess with the current system? It is already fair and equitable. Performance incentives are receiving a lot of attention around the country. Very little is known about how they would affect schools. We’re trying to fill that gap.
1 If state data exhibit discontinuous patterns of gains, these will be smoothed averages rather than simple averages. If there are significant changes in test scales from one year to the next, it may also be necessary to rescale tests to ensure comparability over time.

178 / national centeR on peRFoRmance incentives
appendix c2:a gUide to calcUlating monetaRY
BonUses FoR teacheRs

PROJECT ON INCENTIVES IN TEACHING (POINT)
A Guide to Calculating Monetary Bonuses for Teachers
Conducted by
National Center on Performance Incentives Peabody College of Education and Human Development
Vanderbilt University
Funded by the United States Department of Education
Supported by
Peabody College of Vanderbilt University Learning Sciences Institute at Vanderbilt University
University of Missouri at Columbia RAND Corporation
PROJECT ON INCENTIVESIN TEACHING (POINT)
Sample Bonus Calculation Report
Conducted by
National Center on Performance IncentivesPeabody College of Education and Human Development
Vanderbilt University
Funded by the United States Department of Education
Supported by
Peabody College of Vanderbilt UniversityLearning Sciences Institute at Vanderbilt University
University of Missouri at ColumbiaRAND Corporation
1

2
Introduction
This guide provides information regarding monetary bonuses for teachers in the Project on Incentives in Teaching (POINT) experiment. The guide explains how the National Center on Performance Incentives counted the total number of students, determined whether a teacher was eligible for a bonus based on the performance of mathematics students, and calculated the total amount of the bonus in relation to the performance of non-mathematics students.
Counting the Total Number of Students A middle school teacher was considered for a monetary bonus on the basis of his or her total number of mathematics students. To participate in the first year of the experiment, a teacher must be responsible for the instruction of ten or more mathematics students who were expected to take the TCAP at the end of the year. The total number of mathematics students was determined by a careful review of district records and class rosters as of the twentieth day of school. Students who completed an alternative assessment were not counted toward the total number of students. To make sure our records were correct, the National Center on Performance Incentives sent a class roster to every participating teacher. Teachers were strongly encouraged to notify us of any possible errors or discrepancies between the class roster and their personal records. A senior member of our research staff consulted with district and school officials to review all teacher concerns and determine the final roster of students that would be counted toward your bonus eligibility. The National Center on Performance Incentives prioritized the confidentiality of teacher and student records when verifying the classroom rosters for all teachers.
Determining Bonus Eligibility To determine your bonus eligibility, the National Center on Performance Incentives measured the progress of your mathematics students over the previous academic year using test score gains on the Tennessee Comprehensive Assessment Program (TCAP) exams. Before providing a few hypothetical examples of how we calculated bonus eligibility, we believe it helpful to explain three of the basic concepts in the monetary award system:
• State benchmarks for student performance; • Teacher responsibility for all mathematics students; and
• Historical targets for teacher performance.

3
State Benchmarks for Student Performance Our first consideration is that the progress of an individual student is compared with the progress of a typical student with the same TCAP score in the previous year. To compare the progress of a particular student and those students who previously received the same test score in the current year, the National Center on Performance Incentives used a state benchmark score for all individual test scores at every grade level. The state benchmark score is the average test score in the current testing year for all Tennessee students in that grade and subject who demonstrated the same level of student achievement in the previous year. A teacher is considered for a bonus according to how well their student performs relative to the average Tennessee student who received the same test score in the previous year. Teacher Responsibility for all Mathematics Students The National Center on Performance Incentives will calculate bonus eligibility for an individual teacher based on his or her complete roster of mathematics students across different classes and grade levels. If a teacher is responsible for two or more mathematics classes at the same grade level, regardless of the course titles, the final roster of students used for determining bonus eligibility will contain all mathematics students in that grade. Teachers with multiple classes are considered for a monetary bonus using the same historical standard as a teacher with one mathematics class. The state benchmark score is the same for all students at the same grade level regardless of the course title or subject area. If a teacher is responsible for multiple classes at different grades, the state benchmark scores will be calculated separately for students in each grade. As a result, a student is compared only to the average Tennessee student at the same grade level.

4
Historical Targets for Teacher Performance A third consideration in the experiment is that teachers are not competing against one another for bonuses. Teachers are being compared with all mathematics teachers who served in Metropolitan Nashville Public Schools (MNPS) during the two years prior to the start of the experiment. Since teachers are competing against historical targets of past performance, it is possible for all teachers in the treatment group to receive bonuses this year and in the future. The total amount of the monetary bonus is based on the performance of your students relative to the past performance of students taught by MNPS teachers. The lowest target is based on the performance of students for the top 20% of MNPS teachers from 2004 to 2006. If a teacher’s students perform at or above that threshold, then the teacher will qualify for a bonus of $5000. To qualify for the next highest bonus of $10,000, the teacher’s students would need to perform at or above the top 15% of MNPS teachers. For a teacher to qualify for the highest bonus level of $15,000, the teacher’s students must perform at the level of the top 5% of MNPS teachers. Table 1 displays the monetary bonus levels and minimum thresholds for student performance. The minimum benchmark difference, which is fully explained in the next section (Page 6), indicates whether a teacher is eligible to receive a bonus and the base amount of the bonus level. While your bonus eligibility is determined by the progress of your mathematics students over the year, the total amount of the monetary bonus may be affected by the progress of your non-mathematics students over the year (Page 14).
Table 1. Historical Performance of MNPS Teachers and Bonus Levels
Level Percentile Rank in
Distribution of MNPS Teachers
Base Amount of Monetary Bonus
Minimum Benchmark Difference to Qualify
for Bonus
One 80 % $ 5,000 + _3.6
Two 85 % $ 10,000 + _5.9
Three 95 % $ 15,000 + 12.5

5
Hypothetical Cases Here are four hypothetical cases to help you understand how we calculated bonus eligibility. These examples show a classroom teacher in one of four different circumstances, in order:
• Mr. Bailey - A teacher with one class of mathematics students who receives a monetary bonus.
• Ms. Carter - A teacher with two classes of mathematics students at the same grade level
who receives a monetary bonus.
• Mrs. Lopez - A teacher with two classes of mathematics students at different grade levels who receives a monetary bonus.
• Mr. Stewart - A teacher with one class of mathematics students who does not receive a
monetary bonus. The narrative description for each teacher is presented with a class roster in the same format that you will receive in a confidential report. We discuss the first case in detail and focus on major differences in teacher circumstances for the three remaining cases.

6
Hypothetical Example - Mr. Bailey Mr. Bailey is a mathematics teacher for ten students in the sixth grade. Table 2 shows the complete roster for Mr. Bailey. The class roster has a separate row for each of his ten students with their grade levels (Column 2), TCAP scores in the previous year (Column 3), and TCAP scores in the most recent year (Column 4). Additionally, the table displays the state benchmark score for each particular test score at the same grade level (Column 5). The first pupil on the roster scored 392 on the TCAP in 2006. The state benchmark score for Student A is 437.6. This state benchmark represents the 2007 statewide average score obtained by students who, like Student A, had a score of 392 in 2006. The fourth column shows that Student A had a score of 440 in 2007. Thus, Student A gained 2.4 points more than the average Tennessee student who demonstrated the same level of student achievement in 2006. The table records the individual difference from state benchmark with the value of +2.4 for Student A (Column 6). We perform the same calculation for other students on the roster. The individual differences, plus or minus, are recorded in the final column. Teacher performance is measured by the average test score differences of all mathematics students. The final row at the bottom of the roster shows the average benchmark difference for all ten students. Table 2 indicates Mr. Bailey’s students gained 6.1 points more, on average, than comparable students statewide. To find out the bonus eligibility of Mr. Bailey, we compare his average benchmark difference of +6.1 to the historical performance of MNPS teachers in recent years. According to the historical targets listed in Table 1, Mr. Bailey will receive a monetary bonus.

7
Table 2. Mathematics Roster for Mr. Bailey, 2006-2007
Student Grade Individual
TCAP Score
2006
Individual TCAP Score
2007
State TCAP Benchmark
2007
Individual Difference from State Benchmark
A 6 392 440 437.6 _ _2.4
B 6 423 449 450.4 – _1.4
C 6 430 461 450.9 _ 10.1
D 6 451 478 471.9 _ _6.1
E 6 459 494 478.2 _ 15.8
F 6 485 495 499.6 – _4.6
G 6 515 545 530.8 _ 14.2
H 6 518 547 534.4 _ 12.6
I 6 554 579 571.2 _ _7.8
J 6 560 576 578.1 – _2.1
Average Benchmark Difference for Your Mathematics Students _ _6.1

8
Hypothetical Example - Mrs. Carter Mrs. Carter is a mathematics teacher for two different classes in the eighth grade. Her Algebra course had ten pupils and her Honors Algebra course had seven pupils at the start of the school year. While Mrs. Carter was responsible for seventeen pupils, there are a total of ten students on her final roster because three students took an alternative test and four students withdrew from the district prior to the spring exams. Table 3 shows the complete roster for Mrs. Carter. The class roster has a separate row for each student who took the spring exam, but it does not list the course title taught by Mrs. Carter. The state benchmark scores reflect the same value for comparable students in both courses because all ten students are tested at the same grade level. The second pupil on the roster scored 447 on the TCAP in 2006. The state benchmark score for Student B is 459.3. This state benchmark represents the 2007 statewide average score obtained by students who, like Student B, had a score of 447 in 2006. The fourth column shows that Student B had a score of 470 in 2007. Thus, Student B gained 10.7 points more than the average Tennessee student who demonstrated the same level of student achievement in 2006. The table records the individual difference from state benchmark with the value of +10.7 for Student B (Column 6). We perform the same calculation for other students regardless of their course title. Just like the case of Mr. Bailey, teacher performance for Mrs. Carter is measured by the average test score changes of all mathematics students. Table 3 indicates Mrs. Carter’s students gained 10.7 points more, on average, than comparable students statewide. To find out the bonus eligibility of Mrs. Carter, we compare her average benchmark difference of +10.7 to the historical performance of MNPS teachers. According to the historical targets listed in Table 1, Mrs. Carter will receive a monetary bonus.
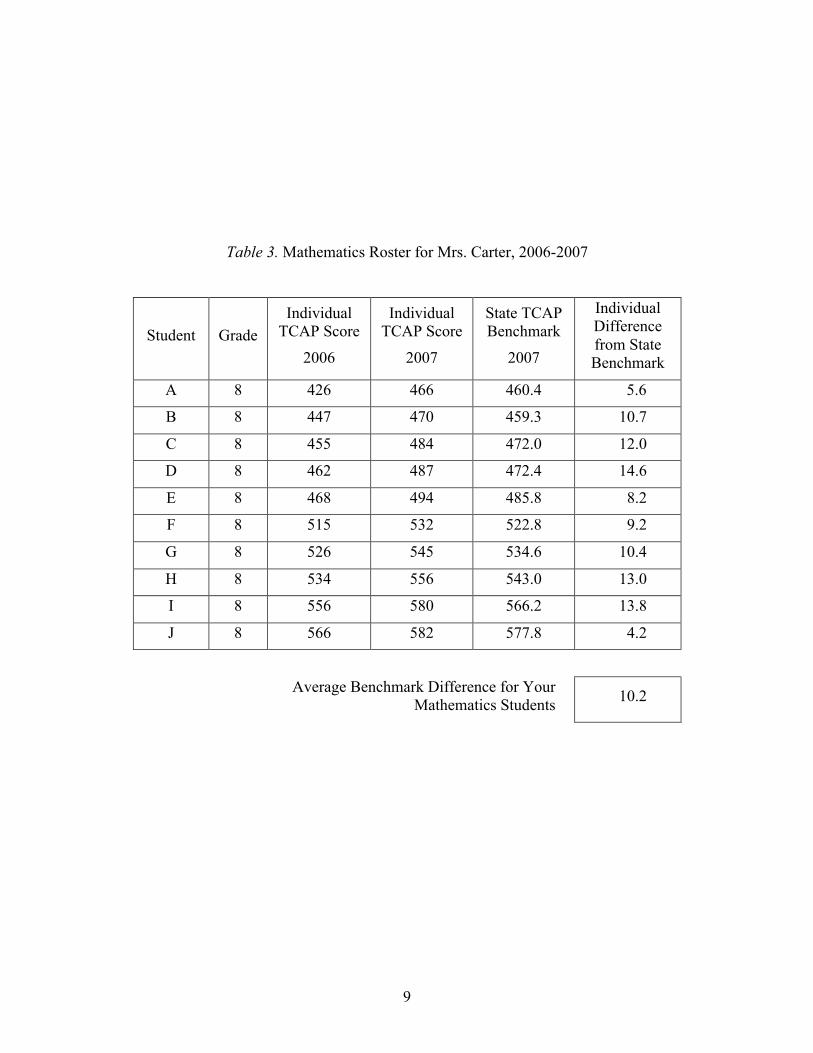
9
Table 3. Mathematics Roster for Mrs. Carter, 2006-2007
Student Grade Individual
TCAP Score
2006
Individual TCAP Score
2007
State TCAP Benchmark
2007
Individual Difference from State Benchmark
A 8 426 466 460.4 _ _5.6
B 8 447 470 459.3 _ _10.7
C 8 455 484 472.0 _ _12.0
D 8 462 487 472.4 _ _14.6
E 8 468 494 485.8 _ _8.2
F 8 515 532 522.8 _ _9.2
G 8 526 545 534.6 _ _10.4
H 8 534 556 543.0 _ _13.0
I 8 556 580 566.2 _ _13.8
J 8 566 582 577.8 _ _4.2
Average Benchmark Difference for Your Mathematics Students _ _10.2

10
Hypothetical Example - Mrs. Lopez Mrs. Lopez is a mathematics teacher with a seventh grade class and an eighth grade class. Her seventh grade class has five pupils and her eighth grade class has five pupils. All ten pupils took the spring exams. Table 4 shows the complete roster for Mrs. Lopez. The class roster has a separate row for each student and indicates the student’s grade level. All of the ten students are clustered with peer students in the same grade. Since the state benchmark scores are calculated using statewide averages for students in a specific grade, students in different grades who have the same 2006 score may have different benchmark scores. This is best explained with the comparison below. The fourth pupil on the roster scored 496 on the TCAP in 2006. The state benchmark score for Student D is 511.1. This state benchmark represents the 2007 statewide average score obtained by seventh grade students who, like Student D, had a score of 496 in 2006. The fourth column shows that Student D had a score of 513 in 2007. Thus, Student D gained 1.9 points more than the average Tennessee seventh grader who demonstrated the same level of student achievement in 2006. The table records the individual difference from state benchmark with the value of +1.9 for Student D. The seventh pupil on the roster scored 496 on the TCAP in 2006. The state benchmark score for Student G is 505.7. This state benchmark represents the 2007 statewide average score obtained by eighth grade students who, like Student G, had a score of 496 in 2006. The fourth column shows that Student G had a score of 513 in 2007. Thus, Student G gained 7.3 points more than the average Tennessee eighth grader who demonstrated the same level of student achievement in 2006. The table records the individual difference from state benchmark with the value of +7.3 for Student G. We perform the same calculation for other students using the state benchmark score for their grade level. Just like the case of Mr. Bailey, teacher performance for Mrs. Lopez is measured by the average test score changes of all mathematics students. Table 4 indicates Mrs. Lopez’s students gained 6.3 points more, on average, than comparable students statewide. To find out the bonus eligibility of Mrs. Lopez, we compare her average benchmark difference of +6.3 to the historical performance of MNPS teachers. According to the historical targets listed in Table 1, Mrs. Lopez will receive a monetary bonus.

11
Table 4. Mathematics Roster for Mrs. Lopez, 2006-2007
Student Grade Individual
TCAP Score 2006
Individual TCAP Score
2007
State TCAP Benchmark
2007
Individual Difference from State Benchmark
A 7 480 509 494.3 _ _14.7
B 7 483 505 496.4 _ _8.6
C 7 490 519 504.3 _ _14.7
D 7 496 513 511.1 _ _1.9
E 7 505 517 519.7 – _2.7
F 8 488 498 498.5 – _0.5
G 8 496 513 505.7 _ _7.3
H 8 506 526 514.4 _ _11.6
I 8 515 531 522.8 _ _8.2
J 8 529 536 537.1 – _1.1
Average Benchmark Difference for Your Mathematics Students _ _6.3

12
Hypothetical Example - Mr. Stewart Mr. Stewart is a mathematics teacher for one class of seventh grade students. His Algebra course had thirteen pupils at the start of the school year. There are a total of ten students on his final roster because two students transferred to a remedial course in October and district officials invalidated the test score of one student. The first pupil on the roster scored 496 on the TCAP in 2006. The state benchmark score for Student A is 511.1. This state benchmark represents the 2007 statewide average score obtained by students who, like Student A, had a score of 496 in 2006. The fourth column shows that Student A had a score of 523 in 2007. Thus, Student A gained 11.9 points more than the average Tennessee student who demonstrated the same level of student achievement in 2006. The table records the individual difference from state benchmark with the value of +11.9 for Student A. Teacher performance is measured by the average test score changes of all mathematics students. The final row at the bottom of the roster shows the average benchmark difference for all ten students. Table 5 indicates Mr. Stewart’s students gained 3 points more, on average, than comparable students statewide. To find out the bonus eligibility of Mr. Stewart, we compare his average benchmark difference of +3.0 to the historical performance of MNPS teachers in recent years. According to the historical targets listed in Table 1, Mr. Stewart will not receive a monetary bonus.

13
Table 5. Mathematics Roster for Mr. Stewart, 2006-2007
Student Grade Individual
TCAP Score 2006
Individual TCAP Score
2007
State TCAP Benchmark
2007
Individual Difference from State Benchmark
A 7 496 523 511.1 _ _11.9
B 7 505 529 519.7 _ _9.3
C 7 521 541 536.0 _ _5.0
D 7 521 544 536.0 _ _8.0
E 7 526 547 541.5 _ _5.5
F 7 534 548 550.4 – _2.4
G 7 546 567 563.5 _ _3.5
H 7 553 563 570.6 – _7.6
I 7 576 593 592.4 _ _0.6
J 7 583 594 597.4 – _3.4
Average Benchmark Difference for Your Mathematics Students _ _3.0

14
Calculating the Total Amount of the Monetary Bonus While your bonus eligibility is determined by the progress of your mathematics students over the year, the total amount of the monetary bonus may be affected by the progress of your non-mathematics students over the year. If a teacher is responsible for students in subjects other than mathematics, the teacher will receive a second set of tables. Just as the first set of tables listed mathematics students, the second set of tables will display the progress of your students in each of the subjects that is assessed by TCAP (English and Language Arts, Science, and Social Studies). To receive the base amount of the monetary bonus shown in Table 1, the average benchmark difference of students that a teacher instructs in other subjects must meet or exceed the district target. The district target is defined as the district’s average test score change in other subjects demonstrated by historical standards of student performance (2004 to 2006). A hypothetical example may offer a helpful way to explain the bonus calculation process. For the purposes of simplicity, we return to the case of Mr. Bailey, a sixth grade teacher of ten mathematics students eligible for a bonus of $10,000 (See Page 6). To determine the total amount of the monetary bonus, we calculate the number of students that Mr. Bailey instructs in subjects other than mathematics. District and school records indicate Mr. Bailey has 10 mathematics students as well as 10 pupils in science. Since Mr. Bailey qualifies for a $10,000 bonus in mathematics, he will receive the full amount of the monetary bonus if the average difference of his 10 science students meets or exceeds the district target. If his science students perform below the district target, the total amount of Mr. Bailey’s award will be reduced by the proportion of his pupils in science. Table 6 shows the complete roster of science students for Mr. Bailey. The class roster has a separate row with each science student. Teacher performance is measured by the average test score changes of all science students. The final row at the bottom of the roster shows the average difference for all ten students. Table 5 indicates Mr. Bailey’s students gained 2.4 points less, on average, than comparable students statewide. To find out the total amount of the bonus for Mr. Bailey, we compare his average benchmark difference of –2.4 to the district target. The average difference is less than the district target of –1.9, so the total amount of the bonus is reduced by the proportion of his pupils in a science course. Since Mr. Bailey has ten math students (50%) and ten science students (50%) for a total of twenty pupils, he loses 50% of his bonus and receives $5,000 rather than $10,000. Students in subjects that are not tested under TCAP, including Music, Art, and Foreign Languages, do not affect the total amount of your monetary bonus. Your total number of students, which is used to calculate the total amount of your monetary bonus, does not include any students in subjects that are not tested under TCAP as well as students without valid results.
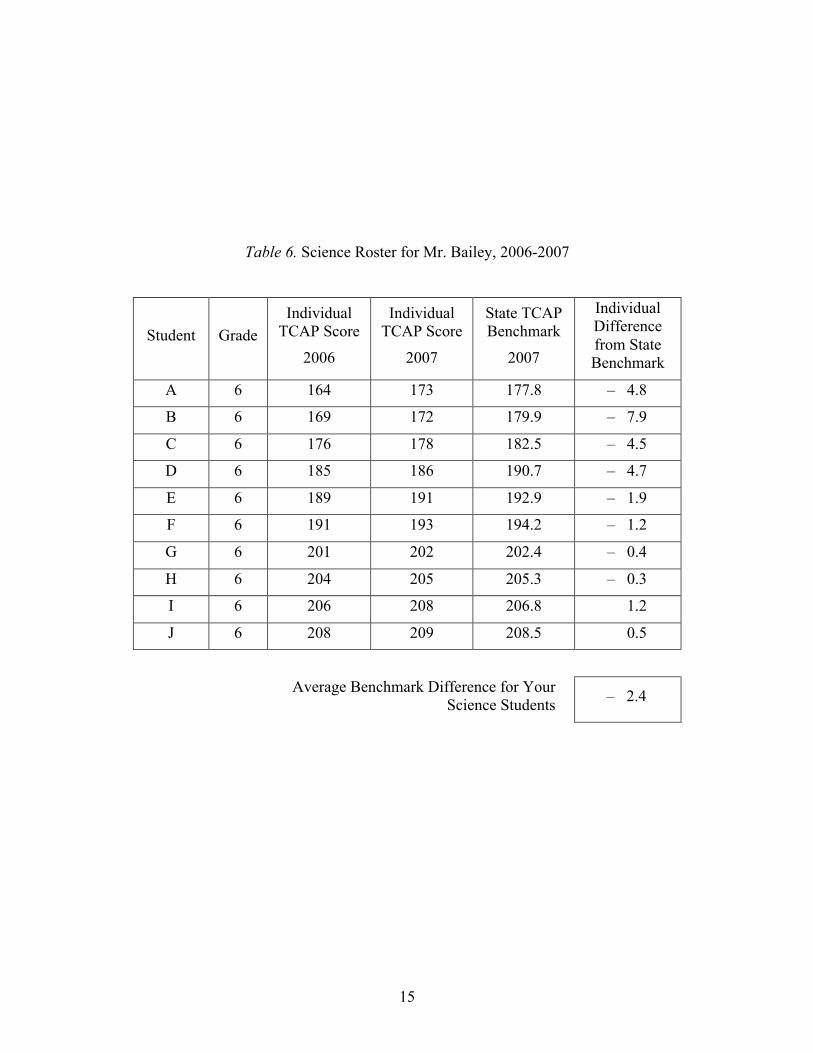
15
Table 6. Science Roster for Mr. Bailey, 2006-2007
Student Grade Individual
TCAP Score
2006
Individual TCAP Score
2007
State TCAP Benchmark
2007
Individual Difference from State Benchmark
A 6 164 173 177.8 – _4.8
B 6 169 172 179.9 – _7.9
C 6 176 178 182.5 – _4.5
D 6 185 186 190.7 – _4.7
E 6 189 191 192.9 – _1.9
F 6 191 193 194.2 – _1.2
G 6 201 202 202.4 – _0.4
H 6 204 205 205.3 – _0.3
I 6 206 208 206.8 _ _1.2
J 6 208 209 208.5 _ _0.5
Average Benchmark Difference for Your Science Students – _2.4
194 / national centeR on peRFoRmance incentives
appendix d:analYsis oF test scoRe manipUlation
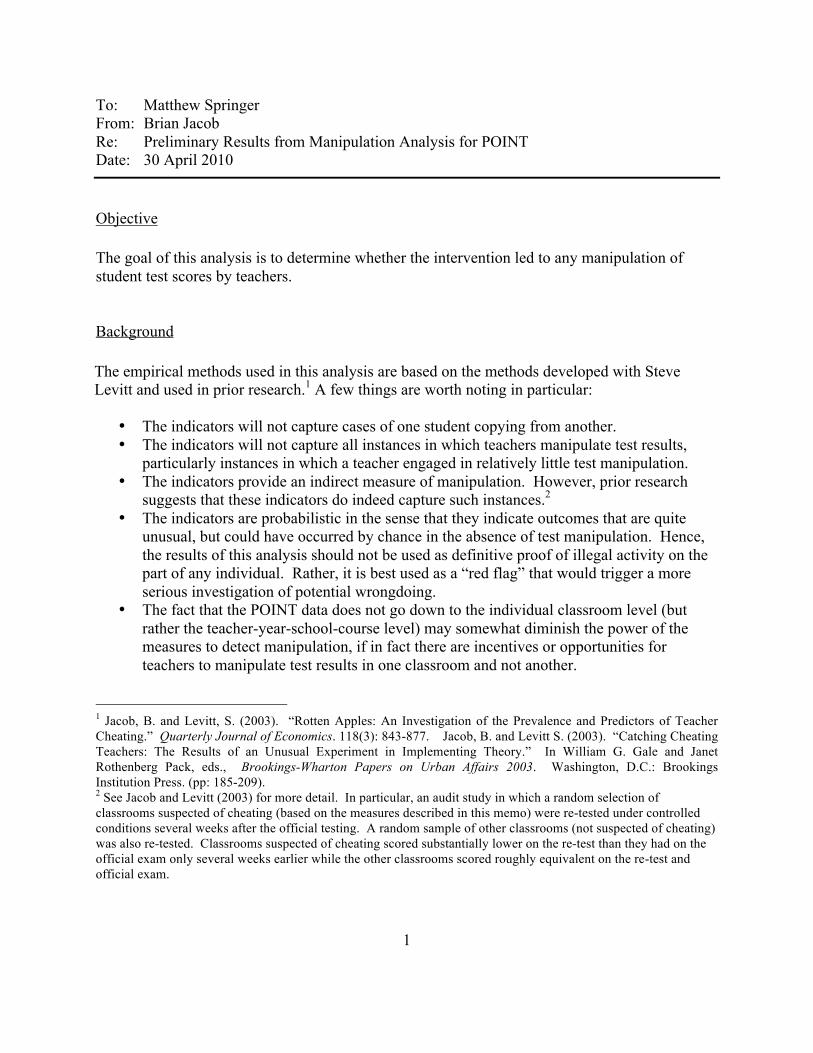
1
To: Matthew Springer From: Brian Jacob Re: Preliminary Results from Manipulation Analysis for POINT Date: 30 April 2010 Objective The goal of this analysis is to determine whether the intervention led to any manipulation of student test scores by teachers. Background The empirical methods used in this analysis are based on the methods developed with Steve Levitt and used in prior research.1 A few things are worth noting in particular:
• The indicators will not capture cases of one student copying from another. • The indicators will not capture all instances in which teachers manipulate test results,
particularly instances in which a teacher engaged in relatively little test manipulation. • The indicators provide an indirect measure of manipulation. However, prior research
suggests that these indicators do indeed capture such instances.2 • The indicators are probabilistic in the sense that they indicate outcomes that are quite
unusual, but could have occurred by chance in the absence of test manipulation. Hence, the results of this analysis should not be used as definitive proof of illegal activity on the part of any individual. Rather, it is best used as a “red flag” that would trigger a more serious investigation of potential wrongdoing.
• The fact that the POINT data does not go down to the individual classroom level (but rather the teacher-year-school-course level) may somewhat diminish the power of the measures to detect manipulation, if in fact there are incentives or opportunities for teachers to manipulate test results in one classroom and not another.
1 Jacob, B. and Levitt, S. (2003). “Rotten Apples: An Investigation of the Prevalence and Predictors of Teacher Cheating.” Quarterly Journal of Economics. 118(3): 843-877. Jacob, B. and Levitt S. (2003). “Catching Cheating Teachers: The Results of an Unusual Experiment in Implementing Theory.” In William G. Gale and Janet Rothenberg Pack, eds., Brookings-Wharton Papers on Urban Affairs 2003. Washington, D.C.: Brookings Institution Press. (pp: 185-209). 2 See Jacob and Levitt (2003) for more detail. In particular, an audit study in which a random selection of classrooms suspected of cheating (based on the measures described in this memo) were re-tested under controlled conditions several weeks after the official testing. A random sample of other classrooms (not suspected of cheating) was also re-tested. Classrooms suspected of cheating scored substantially lower on the re-test than they had on the official exam only several weeks earlier while the other classrooms scored roughly equivalent on the re-test and official exam.

2
• The analysis below is limited to teachers in grades 5-7 in years 2006-07 and 2007-08. We cannot examine teachers who exclusively teach 8th graders because our measures (described in more detail below) depend on subsequent year test scores. For this reason, we cannot yet examine teachers during the 2008-09 school year, although we will be able to examine teachers for grades 5-7 once the 2010 data is available.
Indicator #1: Unexpected Test Score Fluctuations Given that the aim of manipulation is to raise test scores, an obvious potential indicator is a classroom that experiences unexpectedly large gains in test scores relative to how thosesame students tested in the previous year.3 Since test score gains that result from manipulation do not represent real gains in knowledge, there is no reason to expect the gains to be sustained on future exams taken by these students (unless, of course, next year’s teachers also manipulate testresults). Thus, large gains due to manipulation should be followed by smaller than usual test score gains for these students in the following year. In contrast, if large test score gains are due to a talented teacher, the student gains are likely to have a greater permanent component, even if some regression to the mean occurs. Hence, the first indicator of manipulation is the extent to which a classroom’s mean performance in year t is unexpectedly large and the same classroom’s mean performance in year t+1 is unexpectedly small. To create an indicator of whether a classroom’s test performance in year t is unexpectedly good, I regress the standardized test score of student i in year t in classroom c in school s, yitcs, on a series of covariates. Note that for now the analysis is limited to math, and that I estimate a separate regression for each grade x year in the analysis - i.e., 6 total regressions: grades 5, 6 and 7 x years 2007 and 2008. (1) yitcs = Pitcsπ + Xitcsβ + Ctcsδ + εitcs Student prior achievement measures, P, include the following: a quadratic in prior scores in for all four core subjects (a total of 8 variables), a quadratic in two years prior scores in all subjects (a total of 8 variables), and missing value indicators for each of the 8 test scores included in the regression (a total of 8 variables). Prior test scores that are missing are set to zero so that these observations are not dropped from the regression. The student demographics, X, include the following: dummies for male, black, Hispanic, and other race, a cubic in age, a quadratic in days suspended, a quadratic in unexcused absences, a quadratic in excused absences, binary indicators for ELL eligible, free and reduced lunch, special
3 All of the models described below are based on regressions in which the dependent variable is a level test score and prior achievement scores are included as controls. I will use the term “gain” and “performance” interchangeably throughout this memo, although some might object to the reference to gains given that the outcome in these analyses are level scores.
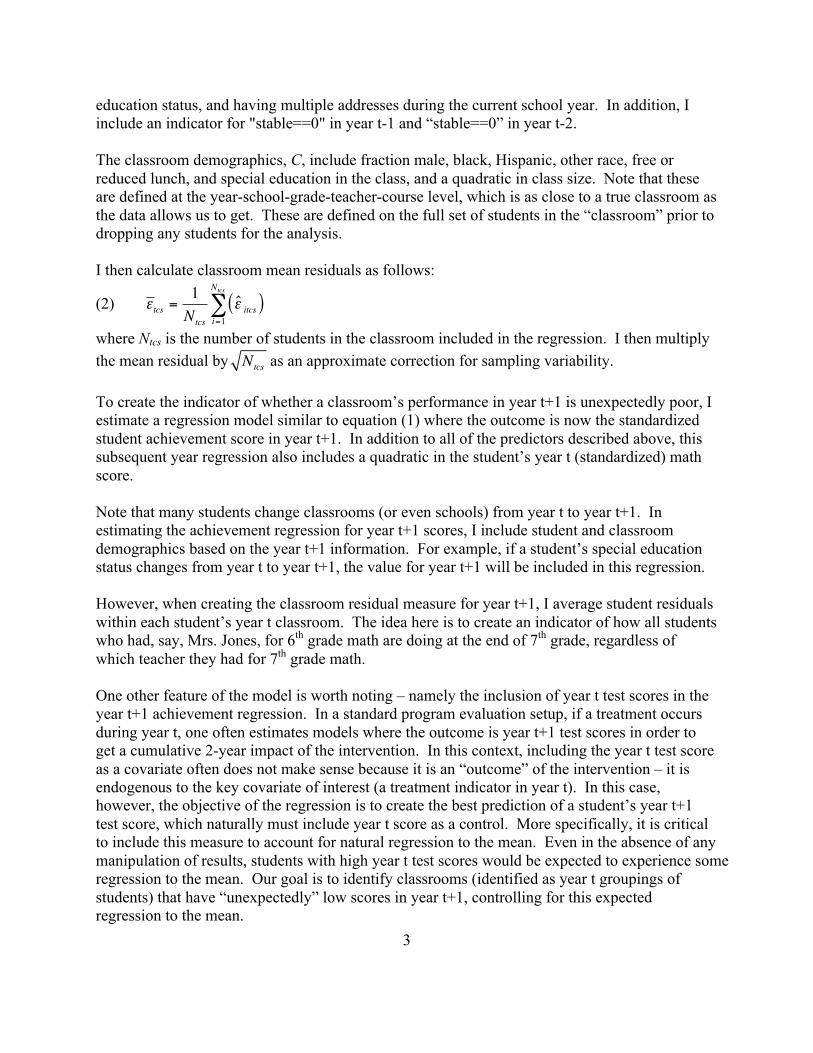
3
education status, and having multiple addresses during the current school year. In addition, I include an indicator for "stable==0" in year t-1 and “stable==0” in year t-2. The classroom demographics, C, include fraction male, black, Hispanic, other race, free or reduced lunch, and special education in the class, and a quadratic in class size. Note that these are defined at the year-school-grade-teacher-course level, which is as close to a true classroom as the data allows us to get. These are defined on the full set of students in the “classroom” prior to dropping any students for the analysis. I then calculate classroom mean residuals as follows:
(2) εtcs =1Ntcs
ε̂ itcs( )i=1
Ntcs
∑
where Ntcs is the number of students in the classroom included in the regression. I then multiply the mean residual by Ntcs as an approximate correction for sampling variability. To create the indicator of whether a classroom’s performance in year t+1 is unexpectedly poor, I estimate a regression model similar to equation (1) where the outcome is now the standardized student achievement score in year t+1. In addition to all of the predictors described above, this subsequent year regression also includes a quadratic in the student’s year t (standardized) math score. Note that many students change classrooms (or even schools) from year t to year t+1. In estimating the achievement regression for year t+1 scores, I include student and classroom demographics based on the year t+1 information. For example, if a student’s special education status changes from year t to year t+1, the value for year t+1 will be included in this regression. However, when creating the classroom residual measure for year t+1, I average student residuals within each student’s year t classroom. The idea here is to create an indicator of how all students who had, say, Mrs. Jones, for 6th grade math are doing at the end of 7th grade, regardless of which teacher they had for 7th grade math. One other feature of the model is worth noting – namely the inclusion of year t test scores in the year t+1 achievement regression. In a standard program evaluation setup, if a treatment occurs during year t, one often estimates models where the outcome is year t+1 test scores in order to get a cumulative 2-year impact of the intervention. In this context, including the year t test score as a covariate often does not make sense because it is an “outcome” of the intervention – it is endogenous to the key covariate of interest (a treatment indicator in year t). In this case, however, the objective of the regression is to create the best prediction of a student’s year t+1 test score, which naturally must include year t score as a control. More specifically, it is critical to include this measure to account for natural regression to the mean. Even in the absence of anymanipulation of results, students with high year t test scores would be expected to experience some regression to the mean. Our goal is to identify classrooms (identified as year t groupings of students) that have “unexpectedly” low scores in year t+1, controlling for this expected regression to the mean.

4
Having calculated classroom mean residuals for base and subsequent year achievement, the next step is to determine what constitutes an unusually large test score gain or loss. Obviously, the choice of such cutoffs is somewhat arbitrary. In prior work, Levitt and I simply ranked each classroom’s average test score gains relative to all other classrooms in that same subject, grade, and year, and construct the following statistic: (3)
€
SCOREcst = (rank _basecst )2 + (1− rank _ postcst )
2 where rank_basecst is the percentile rank for class c in school s in year t. Classes with relatively big gains on this year’s test and relatively small gains on next year’s test will have high values of SCORE. Squaring the individual terms gives more relatively more weight to big test score gains this year and big test score declines the following year. Indicator #2: Suspicious Answer Strings The second indicator involves the pattern of student item responses. The intuition of these measures is that teachers who intentionally manipulate student tests will generateunusual patterns in item responses. Suppose, for example, a teacher that erases and fills in correct responses for the final 5 questions for the first half of the students in her class. In this case, there will be an unexpectedly high correlation between the student responses on these questions
I combine four different measures of how suspicious a classroom’s answer strings are.
The first measure focuses on the most unlikely block of identical answers given by students on consecutive questions. This is meant to pick up teachers who change a series of questions for some number of students in their classroom. For example, a teacher may fill in the correct responses for the last six questions on the exam for ten low-achieving students in the class. We calculate the probability that this block of answers would have occurred if student responses within a classroom were uncorrelated. The more unlikely is the most unexpected block of test responses, the more likely it is that manipulation occurred.
Using a rich set of student and classroom achievement and demographic information, we predict the likelihood that each student will give each possible answer (A, B, C or D) on every question. Specifically, we estimate the following multinomial logit model (separately for each grade x year) for each test item:4
4 That is, if the 5th grade math exam in 2007 contained 50 items, we would estimate 50 separate multinomial logit models.
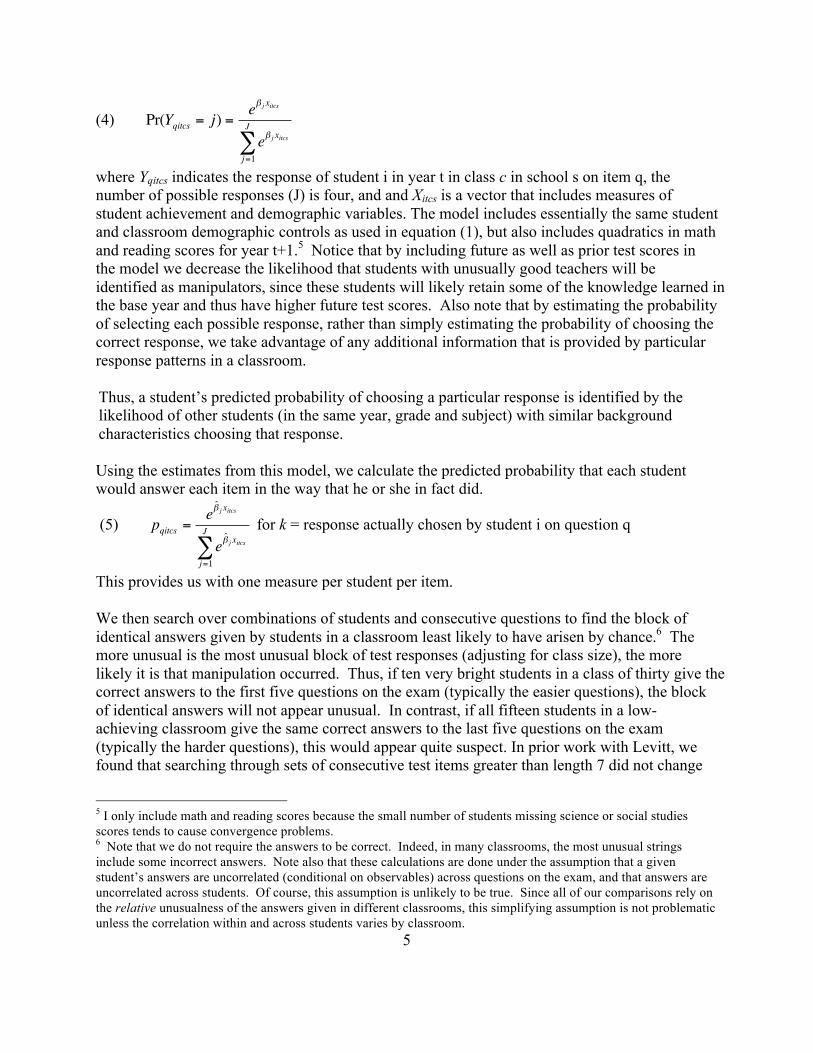
5
(4) Pr(Yqitcs = j) = eβ j xitcs
eβ j xitcsj=1
J
∑
where Yqitcs indicates the response of student i in year t in class c in school s on item q, the number of possible responses (J) is four, and and Xitcs is a vector that includes measures of student achievement and demographic variables. The model includes essentially the same student and classroom demographic controls as used in equation (1), but also includes quadratics in math and reading scores for year t+1.5 Notice that by including future as well as prior test scores in the model we decrease the likelihood that students with unusually good teachers will be identified as manipulators, since these students will likely retain some of the knowledge learned in the base year and thus have higher future test scores. Also note that by estimating the probability of selecting each possible response, rather than simply estimating the probability of choosing the correct response, we take advantage of any additional information that is provided by particular response patterns in a classroom. Thus, a student’s predicted probability of choosing a particular response is identified by the likelihood of other students (in the same year, grade and subject) with similar background characteristics choosing that response. Using the estimates from this model, we calculate the predicted probability that each student would answer each item in the way that he or she in fact did.
(5) pqitcs =eβ̂ j xitcs
eβ̂ j xitcsj=1
J
∑ for k = response actually chosen by student i on question q
This provides us with one measure per student per item. We then search over combinations of students and consecutive questions to find the block of identical answers given by students in a classroom least likely to have arisen by chance.6 The more unusual is the most unusual block of test responses (adjusting for class size), the more likely it is that manipulation occurred. Thus, if ten very bright students in a class of thirty give the correct answers to the first five questions on the exam (typically the easier questions), the block of identical answers will not appear unusual. In contrast, if all fifteen students in a low-achieving classroom give the same correct answers to the last five questions on the exam (typically the harder questions), this would appear quite suspect. In prior work with Levitt, we found that searching through sets of consecutive test items greater than length 7 did not change
5 I only include math and reading scores because the small number of students missing science or social studies scores tends to cause convergence problems. 6 Note that we do not require the answers to be correct. Indeed, in many classrooms, the most unusual strings include some incorrect answers. Note also that these calculations are done under the assumption that a given student’s answers are uncorrelated (conditional on observables) across questions on the exam, and that answers are uncorrelated across students. Of course, this assumption is unlikely to be true. Since all of our comparisons rely on the relative unusualness of the answers given in different classrooms, this simplifying assumption is not problematic unless the correlation within and across students varies by classroom.

6
the results of the analysis. Hence, in this case, we limit our search to all potential consecutive sets of items length 3-7. Taking the product over items within student, we calculate the probability that a student would have answered a string of consecutive questions (from item m to item n) as he or she did:
(6) pitscmn = pqitcs
q=m
n
∏
We then take the product across all students in the classroom who had identical responses in the string, and then divide by the class size. For each classroom x string, this gives the probability of observing a given student responding with the observed response under the assumption that those who did not give the response had a zero probability of answering that way. If we define Sitcs
mn as the string of responses for student i from item m to item n, and Sitcsmn as
the most common string of responses from item m to item n in class c, and I as a set of students, then we can express the product as:
(7)
ptscmn = pitsc
mn
i∈ I :Sitcsmn =Stcs
mn{ }∏
Note that if there are Ntcs students in class c, and each student has a unique set of responses to these particular items, then ptsc
mn collapses to ptscmn for each student and there will be Ntcs distinct
values within the class. On the other extreme, if all of the students in class c have identical responses, then there is only one distinct value of ptsc
mn . We repeat this calculation for all possible consecutive strings of length three to seven; that is, for all such that . Once all strings have been evaluated, we take the minimum of the predicted block probability in the classroom. This measure captures the least likely block of identical answers given on consecutive questions in the classroom. The smaller this value – i.e., the less likely the occurrence – the more suspicious the pattern can be considered. (8)
m1tcs = mintcs ptcs
mn( )
The second measure of suspicious answer strings is intended to capture more general patterns of similarity in student responses. When a teacher changes answers on student test forms, it presumably increases the uniformity of responses across students in the class. Thus, the overall degree of correlation in student answers across the test may be quite high, even if there is not one particularly unusual block of identical answers. To construct this measure, we first calculate the residuals for each of the possible choices a student could have made for each item.

7
(9)
ejqitcs = 0 − eβ̂ j xitcs
eβ̂ j xitcsj=1
J
∑ if j ≠ k
= 1− eβ̂ j xitcs
eβ̂ j xitcsj=1
J
∑ if j = k
where ejqtisc is the residual for response j on question q by student i in classroom c in school s in year t. We thus have four separate residuals per student per item. To create a classroom level measure of the response to item q, we need to combine the information for each student. First, we sum the residuals for each response across students within a classroom.
(10) sumrestcsqr = eitcs
qr
i=1
Ncts
∑
If there is no within class correlation in the way that students responded to a particular item, this term should be approximately zero. Second, we sum across the four possible responses for each item within classrooms. At the same time, we square each of the component residual measures to accentuate outliers and divide by number of students in the class to normalize by class size.
(11) sumrestcsq =
sumrestcsq1( )2 + sumrestcs
q2( )2 + sumrestcsq3( )2 + sumrestcs
q4( )2⎡⎣
⎤⎦
Ntcs
This statistic captures something like the variance of student responses on item q within classroom c. Notice that we choose to first sum across the residuals of each response across students and then sum the classroom level measures for each response, rather than summing across responses within student initially. We do this in order to emphasize the classroom level tendencies in response patterns. I then calculate the mean and standard deviation of the squared sums of residuals, sumrestcs
q , across questions to create two classroom level measures:
(12) m2 : sum _mntcs = sumrestcsq
q=1
Ntcsq
∑
(13) m3 : sum _ sdtcs =1Ntcs
q sumrestcsq − sum _mntcs( )
q=1
Ntcsq
∑
where Ntcsq is the number of questions on the math exam in the relevant grade and year.

8
The second measure, M2 in equation (7), is simply the classroom average (across items) of this variance term across all test items. Note that within-classroom correlation may arise for many reasons other than manipulation. For example, a teacher may emphasize a certain topic or set of skills during the school year. Hence, we do not intend for this measure alone to indicate teachermanipulation of test results. The third measure, M3 in equation (8), focuses on the variance (as opposed to the mean) in the degree of correlation across questions. If the teacher changes answers for multiple students on some set of questions, the within-classroom correlation on those particular items will be extremely high while the degree of within-classroom correlation on other questions will likely be typical. This will cause the cross-question variance in correlations to be larger thannormal.
The final indicator compares the answers that students in one classroom give compared to other studentsin the system who take the identical test and get the exact same score. Questions vary significantlyin difficulty. The typical student will answer most of the easy questions correctly and get most of the hard questions wrong (where “easy” and “hard” are based on how well students of similar abilitydo on the question). If students in a class systematically miss the easy questions while correctly answering the hard questions, this may be an indication that the teacher has manipulated results.
Let qqitsc equal one if student s in classroom c answered item q correctly, and zero otherwise. Let Aitcs equal the aggregate score of student i on the exam. We then determine what fraction of students at each aggregate score level answered each item correctly. If we let nsA equal then number of students with an aggregate score of A, then this fraction, , can be expressed as
(14) qqtA =
qqitsci∈ I :Ai =A{ }∑
nsA
We then calculate a measure of how much the response pattern of student s differed from the response pattern of other students with the same aggregate score. We do so by subtracting a student’s answer on item i from the mean response of all students with aggregate score A, squaring these deviations and then summing across all items on the exam.
(15) Zitcs = qqitcs − qqA( )
q=1
Nqt
∑
We then subtract out the mean deviation for all students with the same aggregate score, , and sum the students within each classroom to obtain our final indicator.
(16) m4 tcs = Zitsc − ZA( )
i=1
Ntcs
∑
Our overall measure of suspicious answer strings is constructed in a manner parallel to our measure of unusual test score fluctuations. Within a given grade and year, we rank classrooms

9
on each of these four indicators, and then take the sum of squared ranks across the four measures: (17) STRINGcst = rank _m1cst( )2 + rank _m2cst( )2 + rank _m3cst( )2 + rank _m4cst( )2 Creating a Single Manipulation Indicator We combine the two aggregate indicators – SCORE and STRING – to create a single manipulation indicator for each class x year. Classes with “high” values on both indicators are considered potential manipulators. Of course, the definition of “high” is larger arbitrary. In prior work, we experimented with three cutoffs, corresponding to the 80th, 90th, and 95th percentiles among all classrooms in the sample. In this prior work, the results seemed robust to choice of cutoff. In this analysis, we consider classrooms that score above the 90th percentile on both SCORE and STRING as suspicious. (18) CHEATcst = SCORE _P90cst = 1( )x STRING _P90cst = 1( ) Comparing Treatment and Control Classes In order to determine whether teacher manipulation was more prevalent among treatment classes, I regress the binary indicator of manipulation on the randomly assigned treatment indicator and several covariates: (19) CHEATcst = β0 + β1Treatmentcst + β2VA0506cst + β3MissVAcst + β4MeanScorecst + γ cst + εcst In the model above, VA0506 is a measure of the teacher’s value-added in the year prior to the experiment (which is set to zero if the teacher did not have a value-added), MissVA is a binary indicator for whether the teacher had a prior value-added score, MeanScore is the average incoming math score of students in the classroom, and γ are fixed effects for the blocks within which random assigned occurred. Note that the estimation sample only includes teachers that participated in the experiment (i.e., tx = 0,1) and only includes grades 5, 6 and 7 in years 2007 and 2008. In order to account for potential correlation across teachers over time and across teachers within the same randomization cluster, standard errors are cluster-corrected by teacher. We obtain identical results clustering by the cluster variable, or including random effects for teacher or cluster.

10
Appendix A: Data Preparation 1) I standardize the scaled test scores in enrctcap0309.csv at the student level within year-grade tested-subject. 2) I merge the student, teacher, test score, and answer string files onto the course file. I only merge on tests scores of students who are tested in the same grade as indicated in the course file (I ignore the student file grade, which J.R. says is inferior). 3) I construct classroom identifiers (which combine "classes" of students within teacher because we don't observe class periods or rooms) using year-meno-grdyr-ncpiid-cou combinations. In other words, I create an identifier for year-school-grade-teacher-course. 4) I construct indicators for reasons we will drop students from the analysis sample, but still want to include as prior or subsequent scores: A) not stable, an indicator that the student was not enrolled in one class all year, already exists; B) missing teacher id. 5) I merge on the subsequent and two prior year test scores (in all 4 subjects) for students *before* dropping any students from the raw file for any of the sample limitations imposed below, though scores are treated as missing if the student is tested off-grade. I also merge on lagged indicators for “not stable and “missing teacher id” and grade level. I use prior and subsequent grade level for construction of indicators for retained or promoted students. In practice there are so few students retained or over-promoted that these indicators are not used in the analysis. 6) I create a class size variable that includes all students in the class in the raw files *before* dropping any students for any reason. I save this panel of student-courses from 2005-2009 as panel05_09.dta. 7) I now keep only math classes in grades 5-8. I also drop students who do not have a valid contemporaneous math score, have a missing teacher id, or have stable==0. 8) Finally, I drop students in classes of fewer than 10 students (counting only students in this restricted analysis sample). This panel of students from 2005-2009 is saved as anal_panel05_09_math.dta. 9) I create tx_t1, the student's subsequent year math classroom treatment status. 10) Read in anal_panel05_08_math.dta and keep one grade-year at a time. 11) I drop a tiny number of students with ages outside of an 8-year window based on the grade level. For example, for 5th graders I drop students who are not between 7 and 14 years old.
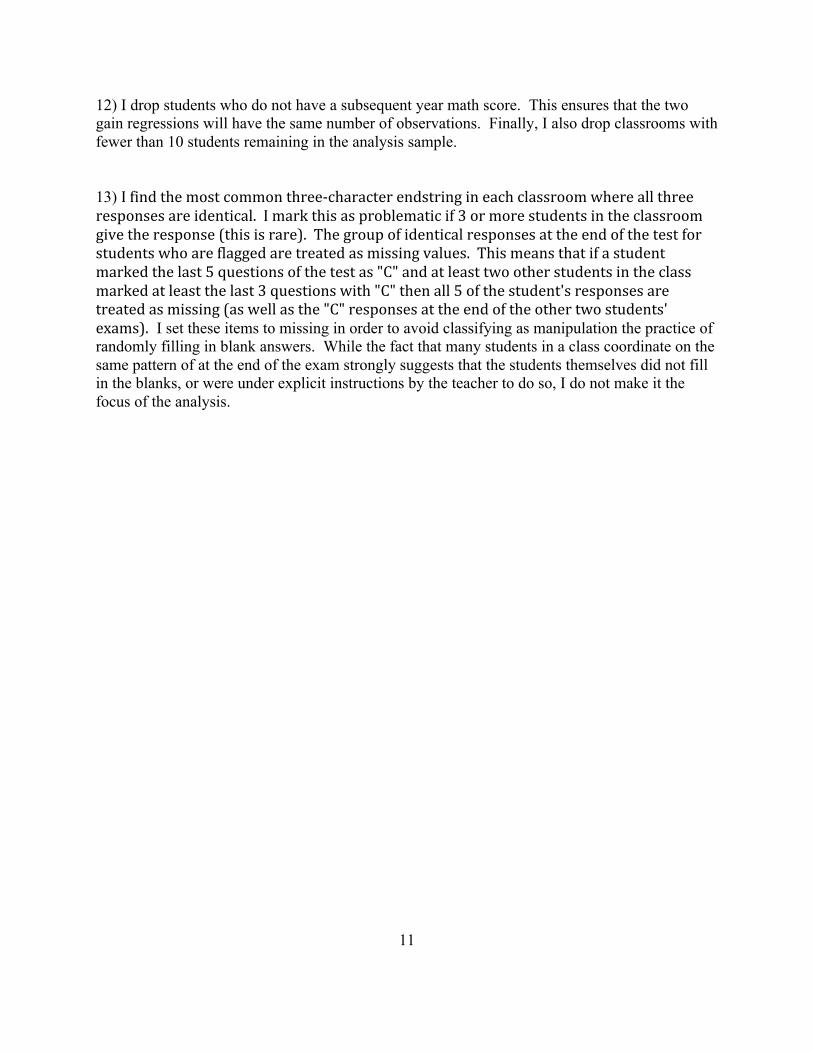
11
12) I drop students who do not have a subsequent year math score. This ensures that the two gain regressions will have the same number of observations. Finally, I also drop classrooms with fewer than 10 students remaining in the analysis sample. 13) I find the most common three-‐character endstring in each classroom where all three responses are identical. I mark this as problematic if 3 or more students in the classroom give the response (this is rare). The group of identical responses at the end of the test for students who are flagged are treated as missing values. This means that if a student marked the last 5 questions of the test as "C" and at least two other students in the class marked at least the last 3 questions with "C" then all 5 of the student's responses are treated as missing (as well as the "C" responses at the end of the other two students' exams). I set these items to missing in order to avoid classifying as manipulation the practice of randomly filling in blank answers. While the fact that many students in a class coordinate on the same pattern of at the end of the exam strongly suggests that the students themselves did not fill in the blanks, or were under explicit instructions by the teacher to do so, I do not make it the focus of the analysis.

206 / national centeR on peRFoRmance incentives
taBle d-1summary stats
All grade 5-7 math
classrooms 2006-2008
(1)
All experiment classrooms 2007-2008
(2)
Controlclassrooms 2007-2008
(3)
Treatment classrooms 2007-2008
(4)
class mean residual in year t+1 -0.002(0.751)
0.001(0.736)
0.008(0.706)
-0.007(0.764)
class mean residual in year t -0.002(0.902)
0.076(1.056)
-0.014(1.068)
0.162(1.039)
suspicious string measure m2 0.611(0.211)
0.618(0.238)
0.618(0.246)
0.619(0.231)
suspicious string measure m3 0.779(0.372)
0.803(0.415)
0.810(0.433)
0.797(0.398)
suspicious string measure m1 0.394(0.108)
0.401(0.109)
0.397(0.106)
0.405(0.112)
suspicious string measure m4 0.000(0.404)
0.006(0.386)
-0.001(0.372)
0.012(0.400)
score (see equation 3 in text) 0.673(0.423)
0.700(0.424)
0.667(0.406)
0.731(0.439)
string (see equation 17 in text) 1.345(0.782)
1.323(0.795)
1.367(0.816)
1.280(0.774)
cheating indicator(80th percentile cutoff)
0.060(0.237)
0.060(0.238)
0.061(0.240)
0.059(0.236)
cheating indicator(90th percentile cutoff)
0.025(0.155)
0.026(0.159)
0.024(0.155)
0.028(0.164)
cheating indicator(95th percentile cutoff)
0.009(0.093)
0.008(0.089)
0.008(0.090)
0.008(0.089)
pre-experiment teacher value added
0.037(0.200)
0.058(0.210)
0.047(0.205)
0.069(0.214)
missing value added 0.010(0.101)
0.010(0.100)
0.008(0.090)
0.012(0.108)
pre-experiment mean math score for students in classroom
0.102(0.652)
0.154(0.663)
0.192(0.666)
0.117(0.659)
number of classrooms(observations)
1258 500 246 254
number of teachers 519 226 111 115notes: standard deviations in parentheses. Full sample in column 1 includes grade 5-7 mathematics class-rooms in 2006-2008.

appendix / 207
Class mean
residual in year t+1
Class mean
residual in year t
Suspicious string
measure M2
Suspicious string
measure M3
Suspicious string
measureM1
Suspicious string
measure M4
Score String
class mean residual in year t+1
1.000
class mean residual in year t
0.036 1.000
suspicious string measure m2
0.075 -0.071 1.000
suspicious string measure m3
0.101 -0.078 0.826 1.000
suspicious string measure m1
-0.006 -0.075 -0.156 -0.159 1.000
suspicious string measure m4
-0.017 0.105 0.169 0.171 -0.177 1.000
score (see equation 3 in text)
-0.626 0.677 -0.061 -0.105 -0.027 0.103 1.000
string (see equation 17 in text)
0.048 0.060 0.721 0.700 -0.468 0.558 0.031 1.000
notes: correlations are estimates on the sample of 500 experiment classrooms in 2007 and 2008 (column 2 of table 1).
taBle d-2correlation matrix of cheating indicators
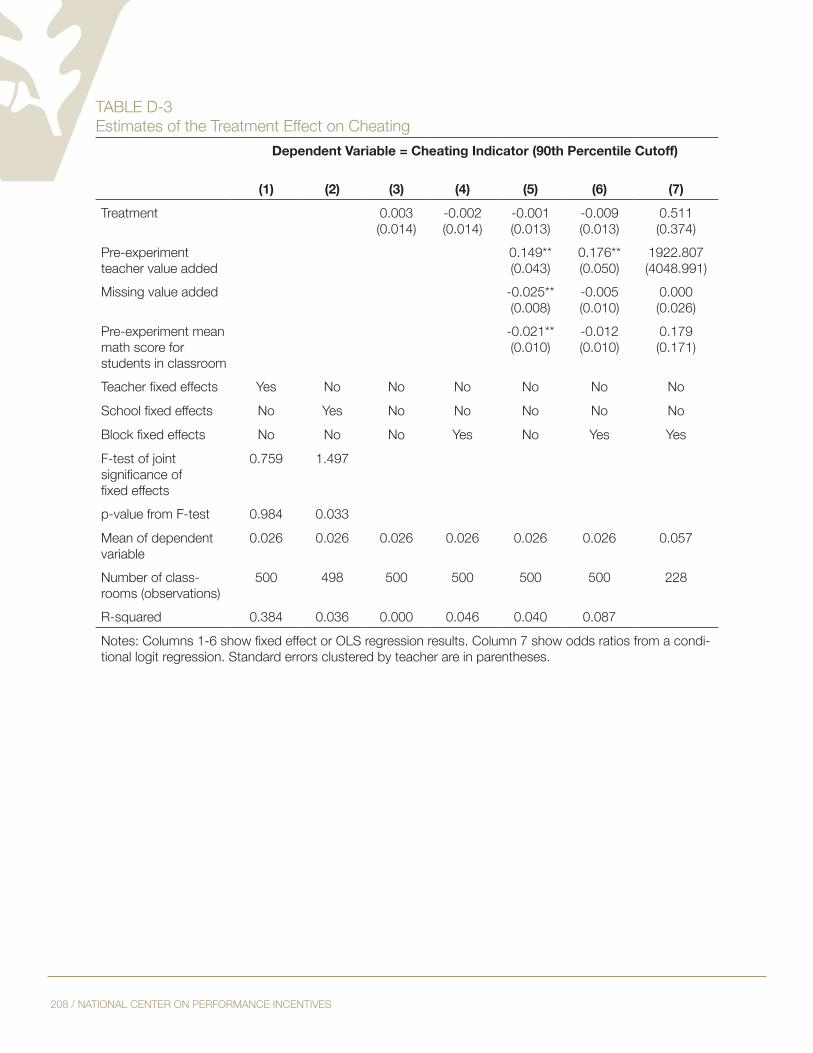
208 / national centeR on peRFoRmance incentives
taBle d-3 estimates of the treatment effect on cheating
Dependent Variable = Cheating Indicator (90th Percentile Cutoff)
(1) (2) (3) (4) (5) (6) (7)
treatment 0.003(0.014)
-0.002(0.014)
-0.001(0.013)
-0.009(0.013)
0.511(0.374)
pre-experiment teacher value added
0.149**(0.043)
0.176**(0.050)
1922.807(4048.991)
missing value added -0.025**(0.008)
-0.005(0.010)
0.000(0.026)
pre-experiment mean math score for students in classroom
-0.021**(0.010)
-0.012(0.010)
0.179(0.171)
Teacher fixed effects Yes no no no no no no
School fixed effects no Yes no no no no no
Block fixed effects no no no Yes no Yes Yes
F-test of joint significance of fixed effects
0.759 1.497
p-value from F-test 0.984 0.033
mean of dependent variable
0.026 0.026 0.026 0.026 0.026 0.026 0.057
number of class-rooms (observations)
500 498 500 500 500 500 228
R-squared 0.384 0.036 0.000 0.046 0.040 0.087
Notes: Columns 1-6 show fixed effect or OLS regression results. Column 7 show odds ratios from a condi-tional logit regression. standard errors clustered by teacher are in parentheses.

appendix / 209
taBle d-4estimates of the treatment effect on cheating by grade and Year
Dependent Variable = Cheating Indicator (90th Percentile Cutoff)Year 1- 2007 Year 2-2008
Grade 5 Grade 6 Grade 7 Grade 5 Grade 6 Grade 7 (1) (2) (3) (4) (5) (6)treatment -0.033
(0.039)0.017(0.017)
0.017(0.036)
-0.003(0.041)
-0.006(0.011)
pre-experiment teacher value added
0.408**(0.158)
0.119(0.107)
0.301**(0.147)
0.234(0.148)
0.164(0.136)
missing value added 0.037(0.031)
pre-experiment mean math score for students in class-room
0.001(0.041)
-0.010(0.015)
0.010(0.020)
-0.023(0.023)
0.004(0.007)
Block fixed effects Yes Yes Yes Yes Yes Yesmean of dependent variable
0.054 0.021 0.024 0.000 0.025 0.018
number of class-rooms (observations)
112 96 83 74 79 56
R-squared 0.248 0.555 0.179 0.140 0.257Notes: The table shows the results of the column 6 specification in Table 3 separately by grade-year. Grade 5 in 2008 (column 4) has no results because there are no positively identified cases of the dependent vari-able.
210 / national centeR on peRFoRmance incentives
taBle d-5 Robustness of estimates of the treatment effect on cheating by grade and Year toalternative cheating measures
Dependent Variable = Cheating Indicator (80th Percentile Cutoff)
Year 1-2007 Year 2-2008
All Grade 5 Grade 6 Grade 7 Grade 5 Grade 6 Grade 7
(1) (2) (3) (4) (5) (6) (7)
treatment -0.027(0.022)
-0.060(0.055)
0.025(0.046)
0.007(0.034)
0.040(0.031)
-0.061(0.067)
-0.121**(0.050)
pre-experiment teacher value added
0.415**(0.080)
0.532**(0.178)
0.509**(0.208)
0.551**(0.184)
0.043(0.039)
0.736**(0.202)
0.445**(0.159)
missing value added 0.295(0.265)
0.040(0.043)
0.968**(0.028)
pre-experiment mean math score for students in classroom
-0.048**(0.017)
-0.052(0.043)
-0.050(0.043)
-0.015(0.030)
-0.018(0.014)
-0.036(0.051)
-0.147(0.105)
Block fixed effects Yes Yes Yes Yes Yes Yes Yes
mean of dependent variable
0.060 0.080 0.062 0.036 0.027 0.076 0.071
number of classrooms (observations)
500 112 96 83 74 79 56
R-squared 0.177 0.265 0.423 0.232 0.682 0.291 0.367
Dependent Variable = Cheating Indicator (95th Percentile Cutoff)
Year 1-2007 Year 2-2008
All Grade 5 Grade 6 Grade 7 Grade 5 Grade 6 Grade 7
(1) (2) (3) (4) (5) (6) (7)
treatment -0.002(0.008)
0.017(0.036)
-0.003(0.041)
pre-experiment teacher value added
0.055**(0.027)
0.301**(0.147)
0.234(0.148)
missing value added -0.006(0.007)
0.037(0.031)
pre-experiment mean math score for students in classroom
-0.005(0.005)
0.010(0.020)
-0.023(0.023)
Block fixed effects Yes Yes Yes Yes Yes Yes Yes
mean of dependent variable
0.008 0.000 0.000 0.024 0.000 0.025 0.000
number of classrooms (observations)
500 112 96 83 74 79 56
R-squared 0.056 0.179 0.140
Notes: The table shows the results of the column 6 specification in Table 3 separately by grade-year. Grade 5 in 2008 (column 4) has no results because there are no positively identified cases of the dependent variable.
appendix / 211
appendix e:complete RegRession ResUlts FoR
complete case analYses

212 / national centeR on peRFoRmance incentives
Year 1-2007 Year 2-2008 Year 3-2009
Variable Coef. Std. Err. P>|z| Coef. Std. Err. P>|z| Coef. Std. Err. P>|z|
grade 6 -0.03 0.05 0.50 0.07 0.07 0.33 0.18 0.09 0.05
grade 7 -0.09 0.08 0.24 0.18 0.10 0.07 0.31 0.11 0.01
grade 8 -0.13 0.08 0.08 0.08 0.10 0.39 0.11 0.11 0.31
treatment group 0.06 0.04 0.15 0.18 0.07 0.01 0.20 0.08 0.01
treatment x grade 6 -0.04 0.06 0.44 -0.13 0.08 0.09 -0.18 0.09 0.06
treatment x grade 7 -0.03 0.06 0.58 -0.17 0.09 0.08 -0.23 0.12 0.06
treatment x grade 8 -0.03 0.06 0.58 -0.26 0.09 0.00 -0.20 0.11 0.07
male student 0.07 0.02 0.00 0.02 0.03 0.49 0.04 0.03 0.20
male x grade 6 -0.04 0.03 0.14 0.03 0.03 0.42 0.00 0.04 0.93
male x grade 7 -0.06 0.03 0.02 -0.01 0.03 0.77 -0.04 0.04 0.34
male x grade 8 -0.14 0.03 0.00 -0.03 0.03 0.44 -0.01 0.04 0.82
asian student 0.12 0.05 0.02 0.10 0.06 0.09 0.16 0.07 0.03
asian x grade 6 0.02 0.07 0.82 -0.02 0.08 0.77 0.08 0.09 0.38
asian x grade 7 -0.05 0.07 0.48 0.01 0.09 0.94 -0.11 0.11 0.34
asian x grade 8 -0.11 0.07 0.12 0.04 0.08 0.60 -0.01 0.09 0.94
Black student -0.10 0.02 0.00 -0.11 0.03 0.00 -0.08 0.04 0.03
Black x grade 6 0.07 0.03 0.02 0.01 0.04 0.74 0.01 0.05 0.91
Black x grade 7 0.06 0.03 0.06 0.09 0.04 0.03 -0.01 0.05 0.91
Black x grade 8 0.08 0.03 0.01 0.07 0.04 0.10 0.02 0.05 0.71
hispanic student -0.03 0.03 0.40 0.00 0.04 0.96 -0.04 0.05 0.38
hispanic x grade 6 0.01 0.05 0.88 0.02 0.06 0.77 0.05 0.06 0.45
hispanic x grade 7 0.09 0.05 0.06 0.06 0.06 0.32 0.09 0.07 0.18
hispanic x grade 8 0.09 0.05 0.07 0.05 0.06 0.42 -0.01 0.06 0.85
Free and reduced lunch eligible -0.02 0.02 0.44 -0.08 0.03 0.01 -0.05 0.04 0.14
FRl x grade 6 -0.01 0.03 0.83 0.00 0.04 0.95 0.06 0.05 0.19
FRl x grade 7 0.00 0.03 0.92 0.06 0.04 0.14 -0.06 0.05 0.19
FRl x grade 8 -0.01 0.03 0.72 0.08 0.04 0.05 0.04 0.04 0.38
special education -0.04 0.04 0.35 -0.19 0.05 0.00 -0.07 0.06 0.28
sped x grade 6 -0.09 0.05 0.09 0.00 0.07 1.00 -0.07 0.08 0.38
sped x grade 7 0.07 0.06 0.21 0.07 0.07 0.32 -0.01 0.08 0.89
sped x grade 8 0.01 0.05 0.82 0.13 0.07 0.06 0.00 0.08 1.00
english language learner 0.01 0.05 0.86 0.09 0.09 0.37 -0.06 0.06 0.35
ell x grade 6 0.06 0.07 0.42 -0.02 0.11 0.85 0.07 0.11 0.53
ell x grade 7 0.00 0.07 0.94 -0.07 0.12 0.56 0.30 0.10 0.00
ell x grade 8 0.05 0.07 0.49 0.04 0.11 0.70 0.18 0.09 0.05
days suspended 0.00 0.01 0.89 -0.01 0.01 0.51 0.00 0.02 0.82
taBle e-1 complete Regression Results, complete case analyses
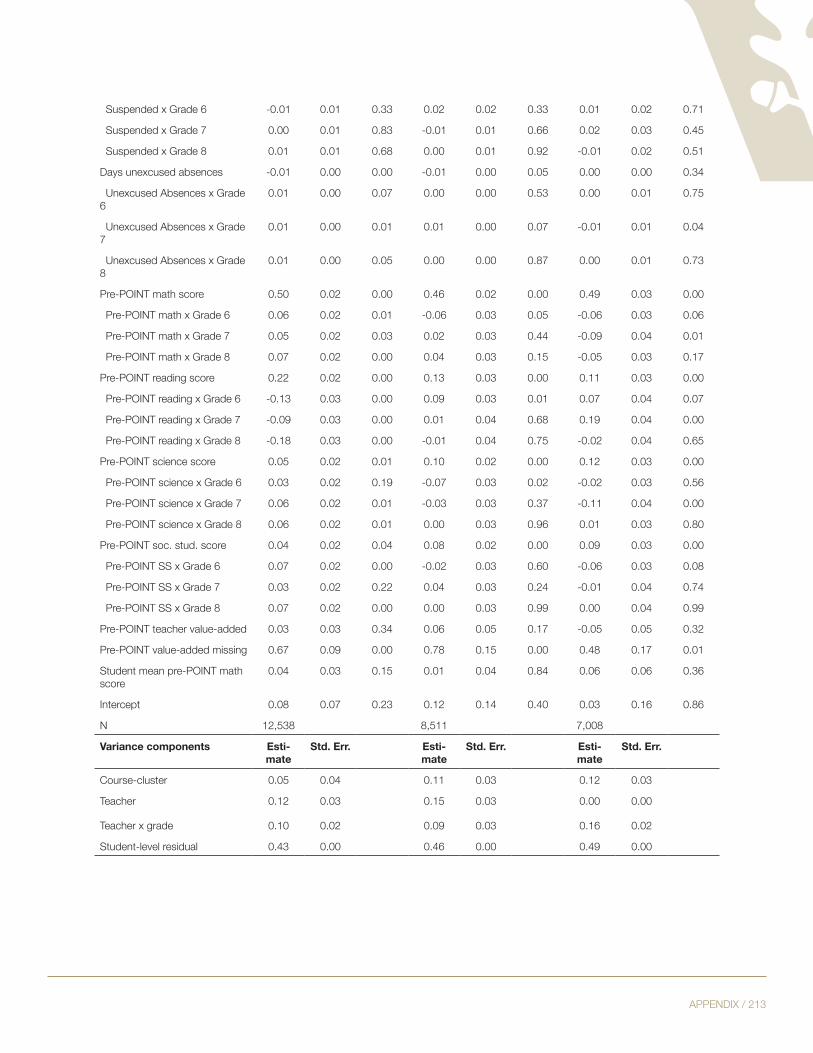
appendix / 213
suspended x grade 6 -0.01 0.01 0.33 0.02 0.02 0.33 0.01 0.02 0.71
suspended x grade 7 0.00 0.01 0.83 -0.01 0.01 0.66 0.02 0.03 0.45
suspended x grade 8 0.01 0.01 0.68 0.00 0.01 0.92 -0.01 0.02 0.51
days unexcused absences -0.01 0.00 0.00 -0.01 0.00 0.05 0.00 0.00 0.34
Unexcused absences x grade 6
0.01 0.00 0.07 0.00 0.00 0.53 0.00 0.01 0.75
Unexcused absences x grade 7
0.01 0.00 0.01 0.01 0.00 0.07 -0.01 0.01 0.04
Unexcused absences x grade 8
0.01 0.00 0.05 0.00 0.00 0.87 0.00 0.01 0.73
pre-point math score 0.50 0.02 0.00 0.46 0.02 0.00 0.49 0.03 0.00
pre-point math x grade 6 0.06 0.02 0.01 -0.06 0.03 0.05 -0.06 0.03 0.06
pre-point math x grade 7 0.05 0.02 0.03 0.02 0.03 0.44 -0.09 0.04 0.01
pre-point math x grade 8 0.07 0.02 0.00 0.04 0.03 0.15 -0.05 0.03 0.17
pre-point reading score 0.22 0.02 0.00 0.13 0.03 0.00 0.11 0.03 0.00
pre-point reading x grade 6 -0.13 0.03 0.00 0.09 0.03 0.01 0.07 0.04 0.07
pre-point reading x grade 7 -0.09 0.03 0.00 0.01 0.04 0.68 0.19 0.04 0.00
pre-point reading x grade 8 -0.18 0.03 0.00 -0.01 0.04 0.75 -0.02 0.04 0.65
pre-point science score 0.05 0.02 0.01 0.10 0.02 0.00 0.12 0.03 0.00
pre-point science x grade 6 0.03 0.02 0.19 -0.07 0.03 0.02 -0.02 0.03 0.56
pre-point science x grade 7 0.06 0.02 0.01 -0.03 0.03 0.37 -0.11 0.04 0.00
pre-point science x grade 8 0.06 0.02 0.01 0.00 0.03 0.96 0.01 0.03 0.80
pre-point soc. stud. score 0.04 0.02 0.04 0.08 0.02 0.00 0.09 0.03 0.00
pre-point ss x grade 6 0.07 0.02 0.00 -0.02 0.03 0.60 -0.06 0.03 0.08
pre-point ss x grade 7 0.03 0.02 0.22 0.04 0.03 0.24 -0.01 0.04 0.74
pre-point ss x grade 8 0.07 0.02 0.00 0.00 0.03 0.99 0.00 0.04 0.99
pre-point teacher value-added 0.03 0.03 0.34 0.06 0.05 0.17 -0.05 0.05 0.32
pre-point value-added missing 0.67 0.09 0.00 0.78 0.15 0.00 0.48 0.17 0.01
student mean pre-point math score
0.04 0.03 0.15 0.01 0.04 0.84 0.06 0.06 0.36
intercept 0.08 0.07 0.23 0.12 0.14 0.40 0.03 0.16 0.86
n 12,538 8,511 7,008
Variance components Esti-mate
Std. Err. Esti-mate
Std. Err. Esti-mate
Std. Err.
course-cluster 0.05 0.04 0.11 0.03 0.12 0.03
teacher 0.12 0.03 0.15 0.03 0.00 0.00
teacher x grade 0.10 0.02 0.09 0.03 0.16 0.02
student-level residual 0.43 0.00 0.46 0.00 0.49 0.00

214 / national centeR on peRFoRmance incentives
appendix F:estimates oF tReatment eFFects on
stUdent achievement in Reading, science,and social stUdies
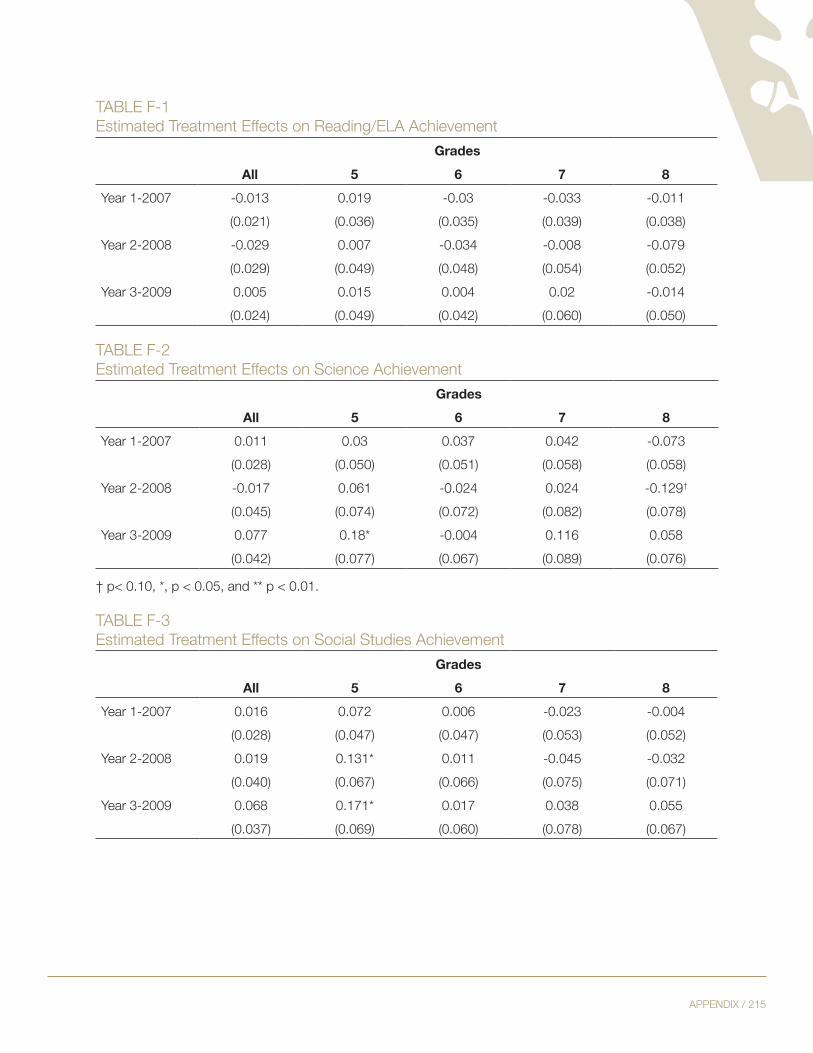
appendix / 215
taBle F-1estimated treatment effects on Reading/ela achievement
GradesAll 5 6 7 8
Year 1-2007 -0.013 0.019 -0.03 -0.033 -0.011(0.021) (0.036) (0.035) (0.039) (0.038)
Year 2-2008 -0.029 0.007 -0.034 -0.008 -0.079(0.029) (0.049) (0.048) (0.054) (0.052)
Year 3-2009 0.005 0.015 0.004 0.02 -0.014(0.024) (0.049) (0.042) (0.060) (0.050)
taBle F-2estimated treatment effects on science achievement
GradesAll 5 6 7 8
Year 1-2007 0.011 0.03 0.037 0.042 -0.073(0.028) (0.050) (0.051) (0.058) (0.058)
Year 2-2008 -0.017 0.061 -0.024 0.024 -0.129†
(0.045) (0.074) (0.072) (0.082) (0.078)Year 3-2009 0.077 0.18* -0.004 0.116 0.058
(0.042) (0.077) (0.067) (0.089) (0.076)
† p< 0.10, *, p < 0.05, and ** p < 0.01.
taBle F-3estimated treatment effects on social studies achievement
GradesAll 5 6 7 8
Year 1-2007 0.016 0.072 0.006 -0.023 -0.004(0.028) (0.047) (0.047) (0.053) (0.052)
Year 2-2008 0.019 0.131* 0.011 -0.045 -0.032(0.040) (0.067) (0.066) (0.075) (0.071)
Year 3-2009 0.068 0.171* 0.017 0.038 0.055(0.037) (0.069) (0.060) (0.078) (0.067)

216 / national centeR on peRFoRmance incentives
taBle F-4treatment effects in Reading, sample Restricted to students of participating teachers, complete cases
Grade5 6 N
Year 1-2007 -0.012 -0.072 1659(0.050) (0.059)
Year 2-2008 0.02 0.006 792(0.095) (0.123)
Year 3-2009 0.088 -0.211 683(0.101) (0.148)
† p< 0.10, *, p < 0.05, and ** p < 0.01.
taBle F-5treatment effects in science, sample Restricted to students of participating teachers, complete cases
Grade5 6 N
Year 1-2007 0.021 0.118 2844(0.059) (0.077)
Year 2-2008 0.122 0.127 21220.094 (0.104)
Year 3-2009 0.206† 0.032 1787(0.108) (0.119)
† p< 0.10, *, p < 0.05, and ** p < 0.01.
taBle F-6treatment effects in social studies, sample Restricted to students of participating teachers, complete cases
Grade5 6 N
Year 1-2007 0.063 0.066 2047(0.057) (0.065)
Year 2-2008 0.207* 0.147 1508(0.100) (0.103)
Year 3-2009 0.249* 0.044 1534(0.103) (0.098)
† p< 0.10, *, p < 0.05, and ** p < 0.01.

appendix / 217
appendix g:ResUlts oF sensitivitY tests

218 / national centeR on peRFoRmance incentives
taBle g-1estimated treatment effects Using all Rather than stable students
Grade LevelAll 5 6 7 8 N
Year 1-2007 0.023 0.044 0.024 -0.000 0.004 14679(0.025) (0.038) (0.038) (0.040) (0.040)
Year 2-2008 0.031 0.100* 0.059 0.003 -0.087† 10467(0.029) (0.045) (0.043) (0.046) (0.046)
Year 3-2009 0.044 0.166** 0.023 0.012 -0.020 8809(0.032) (0.056) (0.047) (0.059) (0.050)
n 6,962 9,150 8,155 9,6889,150 8,155 9,688
† p< 0.10, *, p < 0.05, and ** p < 0.01.
taBle g-2estimated treatment effects, models including squares and cross-products of covariates
Grade LevelAll 5 6 7 8
Year 1-2007 0.031 0.056 0.014 0.023 0.027Year 1-2007 (0.024) (0.041) (0.042) (0.047) (0.046)Year 2-2008 0.043 0.201** 0.033 -0.011 -0.1Year 2-2008 (0.041) (0.064) (0.062) (0.067) (0.065)Year 3-2009 0.046 0.205* 0.022 -0.042 -0.008Year 3-2009 (0.042) (0.075) (0.066) (0.090) (0.077)
† p< 0.10, *, p < 0.05, and ** p < 0.01.
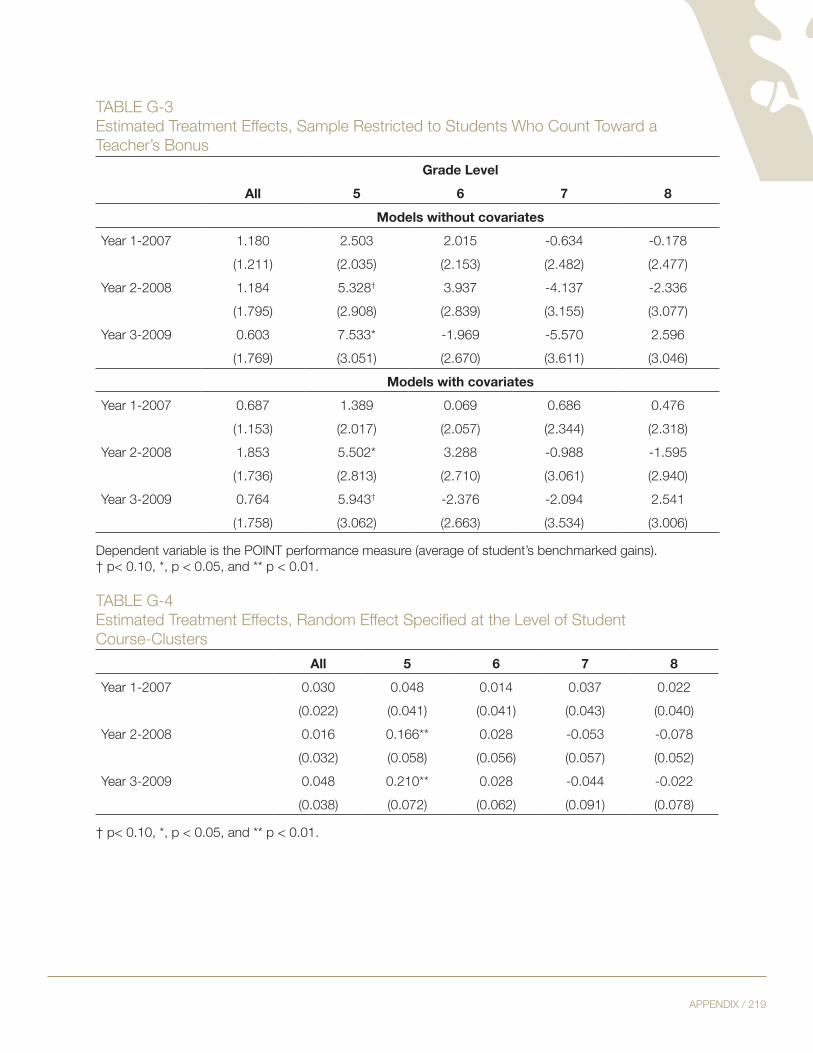
appendix / 219
taBle g-3estimated treatment effects, sample Restricted to students Who count toward ateacher’s Bonus
Grade LevelAll 5 6 7 8
Models without covariatesYear 1-2007 1.180 2.503 2.015 -0.634 -0.178
(1.211) (2.035) (2.153) (2.482) (2.477)Year 2-2008 1.184 5.328† 3.937 -4.137 -2.336
(1.795) (2.908) (2.839) (3.155) (3.077)Year 3-2009 0.603 7.533* -1.969 -5.570 2.596
(1.769) (3.051) (2.670) (3.611) (3.046)Models with covariates
Year 1-2007 0.687 1.389 0.069 0.686 0.476(1.153) (2.017) (2.057) (2.344) (2.318)
Year 2-2008 1.853 5.502* 3.288 -0.988 -1.595(1.736) (2.813) (2.710) (3.061) (2.940)
Year 3-2009 0.764 5.943† -2.376 -2.094 2.541(1.758) (3.062) (2.663) (3.534) (3.006)
dependent variable is the point performance measure (average of student’s benchmarked gains).† p< 0.10, *, p < 0.05, and ** p < 0.01.
taBle g-4Estimated Treatment Effects, Random Effect Specified at the Level of Studentcourse-clusters
All 5 6 7 8Year 1-2007 0.030 0.048 0.014 0.037 0.022
(0.022) (0.041) (0.041) (0.043) (0.040)Year 2-2008 0.016 0.166** 0.028 -0.053 -0.078
(0.032) (0.058) (0.056) (0.057) (0.052)Year 3-2009 0.048 0.210** 0.028 -0.044 -0.022
(0.038) (0.072) (0.062) (0.091) (0.078)
† p< 0.10, *, p < 0.05, and ** p < 0.01.

220 / national centeR on peRFoRmance incentives
appendix h:compaRing instRUctional pRactices and
pRoFessional development oF FiFth gRade teacheRs to teacheRs in otheR gRades

appendix / 221
To investigate whether grade 5 treatment group teachers responded to incentives in ways that their counterparts in other grades did not, we estimated modified versions of the models described in Section 5.3. The dependent variables listed in Table 5.8 were regressed on a teacher’s percentage of students at each grade level (grade 8 was the omitted category) and the interactions of these vari-ables with treatment status. Apart from replacing a treatment status main effect with these interac-tions, the models and methods of estimation were identical to those described in Section 5.3. All equations were estimated twice, once with a sample that pooled all POINT years, a second time using data from 2008 and 2009, the two years in which there was a significant grade 5 treatment effect. Using the regression results, we tested whether there was a significant interaction of the percentage of grade 5 students with treatment (Table H.1, column 1). We also tested whether this interaction differed from interactions for other grades (Table H.1, columns 2-4). Results are shown only for equations with at least one significant interaction or contrast. The table shows the sign of the estimated effect or contrast and the level of significance. The sample in which the results were obtained (all years, or just 2008 and 2009) is denoted by the letters A and B.
Results are mixed. Broadly speaking, grade 5 treatment teachers engaged in less professional de-velopment and had less contact with math mentors than treatment teachers in other grades. (All of these comparisons are relative to control teachers in the same grades.) They made more class-room use of tests (giving tests, reviewing tests), but were less likely to engage in narrow teaching to the TCAP or to use test scores to guide instructional decisions. There were mixed results as well on collaborative activities. Grade 5 treatment teachers had fewer meetings with other teach-ers to analyze student work or plan instruction, but they participated more in observations and coaching (both doing and receiving).
Clearly, grade 5 treatment teachers did more of some things, less of others, than their counter-parts in other grades. Did they happen to pick a more effective set? As noted in Section 5.3, only eight of the above instructional practice variables were found to have statistically significant as-sociations with student achievement in our data. In five of the eight cases, the results in Table H-1 show that the grade 5 interactions and contrasts go the wrong way: grade 5 treatment teachers were less likely than the counterparts to use these practices. Only one interaction goes in the right direction, and in two cases there was no significant grade 5 effect.

222 / national centeR on peRFoRmance incentives
Significant Treatment Effects (** = 5%, * = 10%, A = all years, B = 2008 & 2009)
Dependent Variable pct_5 pct_5 - pct_6 pct_5 - pct_7 pct_5 - pct_8
total professional development credit hours earned during the year
neg*a neg*a,B
core professional development credits neg**a,B neg**a,B neg**B
math professional development credits neg**a,B neg**a neg**a,B
how frequently a teacher was a ‘no-show’ in a professional development workshop
neg*a neg*a neg**a,B
how frequently a teacher was a late drop from a professional development workshop
pos* B
the number of times a teacher logged onto edu-soft, adjusted for the number of times checked
an index of the frequency and duration of teach-ers’ contacts with math mentors
neg**a,B neg**a,B
i analyze students’ work to identify the mnps mathematics standards students have or have not yet mastered
neg**B neg**B
i design my mathematics lessons to be aligned with specific MNPS academic standards
neg**a,*B neg**B neg*a,**B
Spending more or less time on:
aligning my mathematics instruction with the mnps standards
pos**a,*B
Focusing on the mathematics content covered by tcap
administering mathematics tests or quizzes pos*a,B neg*B pos*a
Re-teaching topics or skills based on students’ performance on classroom tests
pos*a
Reviewing test results with students
Reviewing student test results with other teachers neg**B
Practicing test-taking skills:
increasing instruction targeted to state or district standards that are known to be assessed by the tcap
neg**a,B
having students answer items similar to those on the tcap (e.g., released items from prior tcap administrations)
neg*B
Using other TCAP-specific preparation materials neg**B
Math students spending more time on:
engaging in hands-on learning activities (e.g., working with manipulative aids)
pos*a
Working in groups pos**a neg**B pos**a,B
taBle h-1differential Behavior of grade 5 treatment group teachers
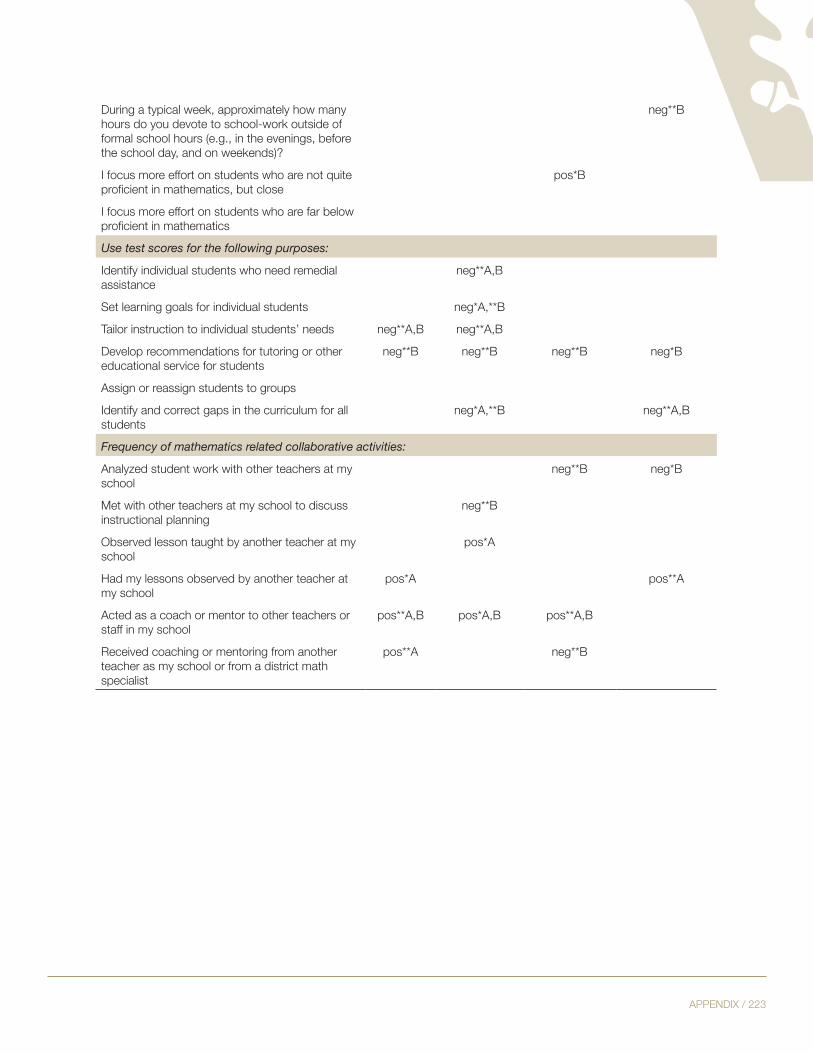
appendix / 223
during a typical week, approximately how many hours do you devote to school-work outside of formal school hours (e.g., in the evenings, before the school day, and on weekends)?
neg**B
i focus more effort on students who are not quite proficient in mathematics, but close
pos*B
i focus more effort on students who are far below proficient in mathematics
Use test scores for the following purposes:
identify individual students who need remedial assistance
neg**a,B
set learning goals for individual students neg*a,**B
tailor instruction to individual students’ needs neg**a,B neg**a,B
develop recommendations for tutoring or other educational service for students
neg**B neg**B neg**B neg*B
assign or reassign students to groups
identify and correct gaps in the curriculum for all students
neg*a,**B neg**a,B
Frequency of mathematics related collaborative activities:
analyzed student work with other teachers at my school
neg**B neg*B
met with other teachers at my school to discuss instructional planning
neg**B
observed lesson taught by another teacher at my school
pos*a
had my lessons observed by another teacher at my school
pos*a pos**a
acted as a coach or mentor to other teachers or staff in my school
pos**a,B pos*a,B pos**a,B
Received coaching or mentoring from another teacher as my school or from a district math specialist
pos**a neg**B

224 / national centeR on peRFoRmance incentives
appendix i: cReating sURveY constRUctsFRom oRiginal sURveY items

appendix / 225
taBle i-1 variables and scalesVariable or Scale Name
Items Alpha
Negative effects of POINT
the prospect that teachers in the point treatment group can earn a bonus discourages staff in the school from working together.
i have noticed increased resentment among teachers since the start of the point experiment.
i have experienced increased stress as a result of the point experiment.
[all items answered: strongly disagree (1), disagree (2), agree (3), or strongly agree (4)]
0.80
Support forperformance pay
teachers should receive additional compensation for demonstrating outstand-ing teachers skills.
teachers should receive additional compensation if their students show out-standing achievement gains.
Rewarding individual teachers based on test score gains is problematic be-cause it is hard to relate gains in student achievement to the work done by an individual teacher (reverse coded).
linking bonuses with student performance would give me an incentive to work beyond the requirements of my job.
[all items answered: strongly disagree (1), disagree (2), agree (3), or strongly agree (4)]
0.76
Positiveperceptions of POINT
the point experiment does a good job of distinguishing effective from ineffec-tive teachers in the treatment group.
the point method for awarding bonuses (based on growth in tcap scores) is fair to all teachers in the treatment group.
the point method for awarding bonuses to treatment group teachers is con-sistent with my principal’s approach for evaluating teachers.
the size of the top point award is large enough to motivate me to put in extra effort.
i have a strong desire to earn a point bonus.
the point experiment ignores important aspects of my performance that are not measured by test scores (reverse coded).
[all items answered: strongly disagree (1), disagree (2), agree (3), or strongly agree (4)]
0.69
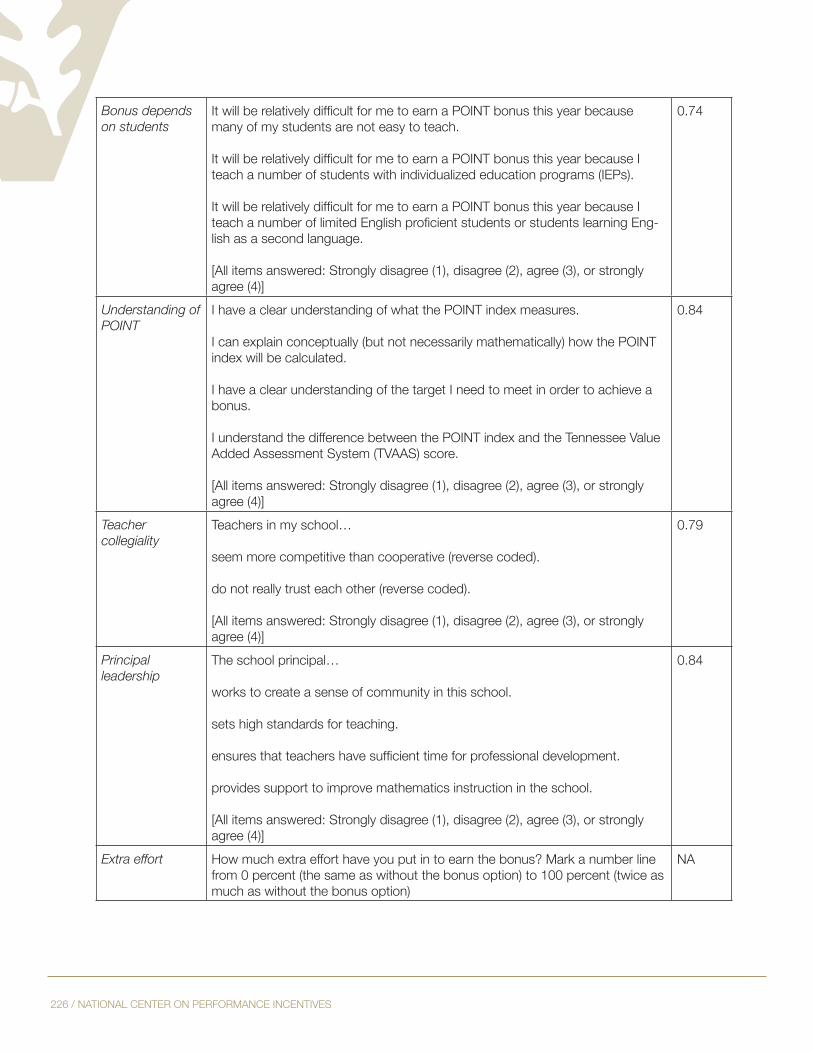
226 / national centeR on peRFoRmance incentives
Bonus depends on students
It will be relatively difficult for me to earn a POINT bonus this year because many of my students are not easy to teach.
It will be relatively difficult for me to earn a POINT bonus this year because I teach a number of students with individualized education programs (ieps).
It will be relatively difficult for me to earn a POINT bonus this year because I teach a number of limited English proficient students or students learning Eng-lish as a second language.
[all items answered: strongly disagree (1), disagree (2), agree (3), or strongly agree (4)]
0.74
Understanding of POINT
i have a clear understanding of what the point index measures.
i can explain conceptually (but not necessarily mathematically) how the point index will be calculated.
i have a clear understanding of the target i need to meet in order to achieve a bonus.
i understand the difference between the point index and the tennessee value added assessment system (tvaas) score.
[all items answered: strongly disagree (1), disagree (2), agree (3), or strongly agree (4)]
0.84
Teachercollegiality
Teachers in my school…
seem more competitive than cooperative (reverse coded).
do not really trust each other (reverse coded).
[all items answered: strongly disagree (1), disagree (2), agree (3), or strongly agree (4)]
0.79
Principalleadership
The school principal…
works to create a sense of community in this school.
sets high standards for teaching.
ensures that teachers have sufficient time for professional development.
provides support to improve mathematics instruction in the school.
[all items answered: strongly disagree (1), disagree (2), agree (3), or strongly agree (4)]
0.84
Extra effort how much extra effort have you put in to earn the bonus? mark a number line from 0 percent (the same as without the bonus option) to 100 percent (twice as much as without the bonus option)
na

appendix / 227
Standards-basedmathematics
i analyze students’ work to identify the mnps mathematics standards students have or have not yet mastered.
I design my mathematics lessons to be aligned with specific MNPS academic standards.
[all items answered: never (1), once or twice a year (2), once or twice a semes-ter (3), once or twice a month (4), once or twice a week (5), or almost daily (6)]
0.61
Change inemphasis:standards and tests
spending more or less time on:
aligning my mathematics instruction with the mnps standards.
Focusing on the mathematics content covered by tcap.
administering mathematics tests or quizzes.
Re-teaching topics or skills based on students’ performance on classroom tests.
Reviewing test results with students.
Reviewing student test results with other teachers.
[all items answered: much less than last year (1), a little less than last year (2), the same as last year (3), a little more than last year (4), or much more than last year (5)]
0.84
Test preparation practicing test-taking skills
increasing instruction targeted to state or district standards that are known to be assessed by the tcap
having students answer items similar to those on the tcap (e.g., released items from prior tcap administrations).
Using other TCAP-specific preparation materials.
[all items answered: no importance (1), low importance (2), moderate impor-tance (3), or high importance (4)]
0.84
Increase inreforminstruction
math students spending more time on:
engaging in hands-on learning activities (e.g., working with manipulative aids).
Working in groups.
[all items answered: much less than last year (1), a little less than last year (2), the same as last year (3), a little more than last year (4), or much more than last year (5)]
0.73

228 / national centeR on peRFoRmance incentives
Extra work hours during a typical week, approximately how many hours do you devote to school-work outside of formal school hours (e.g., in the evenings, before the school day, and on weekends)?
Note. Outlying responses, defined as responses greater than 50 hours, were rare. For the control group, 1.5, 2.5, and 0 percent of responses were outlying in years 1, 2, and 3 respectively. For the treatment group, 2.1, 4.7, and 1.2 percent of responses were outlying in years 1, 2, and 3, respectively.
na
Focus on below-proficient students
Percent of treatment or control teachers who report the following “frequently” or “always or almost always.”
I focus more effort on students who are not quite proficient in mathematics, but close.
I focus more effort on students who are far below proficient in mathematics.
[all items answered: never or almost never (1), occasionally (2), frequently (3), or always or almost always (4)]
0.43
Instructional use of test scores
Use test scores for the following purposes:
identify individual students who need remedial assistance.
set learning goals for individual students.
tailor instruction to individual students’ needs.
develop recommendations for tutoring or other educational service forstudents.
assign or reassign students to groups.
identify and correct gaps in the curriculum for all students.
[all items answered: not used in this way (1), used minimally (2), used moder-ately (3), or used extensively (4)]
0.88
Change ininstruction
I was already working as efficiently as I could before the implementation of point, so the experiment is not affecting my work (reverse coded).
i have altered my instructional practices as a result of the point experiment.
[all items answered: strongly disagree (1), disagree (2), agree (3) or strongly agree (4)]
0.67

appendix / 229
Math PDcollaboration
Frequency of mathematics-related collaborative activities:
analyzed student work with other teachers at my school.
met with other teachers at my school to discuss instructional planning.
observed lesson taught by another teacher at my school.
had my lessons observed by another teacher at my school.
acted as a coach or mentor to other teachers or staff in my school.
Received coaching or mentoring from another teacher at my school or from a district math specialist.
[all items answered: never (1), once or twice a year (2), once or twice a semes-ter (3), once or twice a month (4), once or twice a week (5), or almost daily (6)]
0.73
Math PD hours how many hours [of professional development during the current school year, including the (prior) summer] were focused on mathematics or mathematics instruction?
na
Test use PD focus
hours of professional development during the current school year, including the (prior) summer devoted to:
preparing students to take the tcap assessments.
analyzing and interpreting student achievement data.
[all items answered: none (1), 1-5 hours (2), 6-24 hours (3), 25-40 hours (4), more than 40 hours (5)]
0.84
Math PD focus hours of professional development during the current school year, including the (prior) summer devoted to:
strategies for teaching mathematics.
in-depth study of topics in mathematics.
[all items answered: none (1), 1-5 hours (2), 6-24 hours (3), 25-40 hours (4), more than 40 hours (5)]
0.82
Note: Reported Cronbach alpha reliabilities are based on treatment group responses in 2009.

230 / national centeR on peRFoRmance incentives
sas code creating scale constructs
Year 1:data three; set two; principal_leadership = mean (q9a, q9b, q9c, q9d); q10ar = 5 - q10a; q10br = 5 - q10b; tchr_collegiality = mean (q10ar, q10br, q10c, q10d, q10e, q10f, q10g); reform_instruction = mean (q14a, q14b); trad_instruction = mean (q14c, q14d); q15cr = 5 - q15c; tchr_efficacy = mean (q15a, q15b, q15cr); instructional_efficacy = mean (Q15a, q15b); parental_involvement = mean (q22a, q22b, q22c, q22d, q22e); if Q2g_control ne . then Q2g_control_agree = (Q2g_control > = 3); negative_effects_POINT = mean (Q2a, Q2c, Q2g); Q2fr =5 - Q2f; Q2mr = 5- Q2m; change_my_instruction = mean (Q2fr, Q2j); positive_perception_POINT = mean (q2k, q2l, q2e, q2b, q2d, q2mr); /* drop q2h because alpha better without it */ Q1cr = 5 - Q1c; support_additional_compensation = mean (Q1a, Q1b, Q1cr, Q1d); understanding_of_POINT = mean (Q4a, Q4b, Q4c, Q5a); PD_reading = mean (Q6a, Q6b); PD_math = mean (Q6c, Q6d); PD_test_use = mean (Q6h, Q6i); PD_collaboration_others = mean (Q8a, Q8b, Q8c, Q8d, Q8e, Q8f); standards_math_instruction = mean (Q11a, Q11c); data_driven_instruction = mean (Q13a, Q13c, Q13d, Q13e, Q13f, Q13g); if q16b ne . then q16b_advanced = (Q16b >=3); if q16c ne . then Q16c_proficient = (Q16c >= 3); if Q16d ne . then Q16d_close_proficient = (Q16d >= 3); if Q16e ne . then Q16e_below_proficient = (q16e >= 3); test_taking_emphasis = mean (Q17a, Q17b, Q17c, Q17d); formal_assessments = mean (Q18a, Q18b, Q18c, Q18d); classroom_assessments = mean (Q18e, Q18f); instructional_use = mean (Q19a, Q19b, Q19c, Q19d, Q19e, Q19f); self_development = mean (Q19h, Q19i);
if Q16b_advanced ne . or Q16c_proficient ne . then do; if Q16b_advanced = 1 or Q16c_proficient = 1 then focus_advanced_proficient = 1; else focus_advanced_proficient = 0; end;
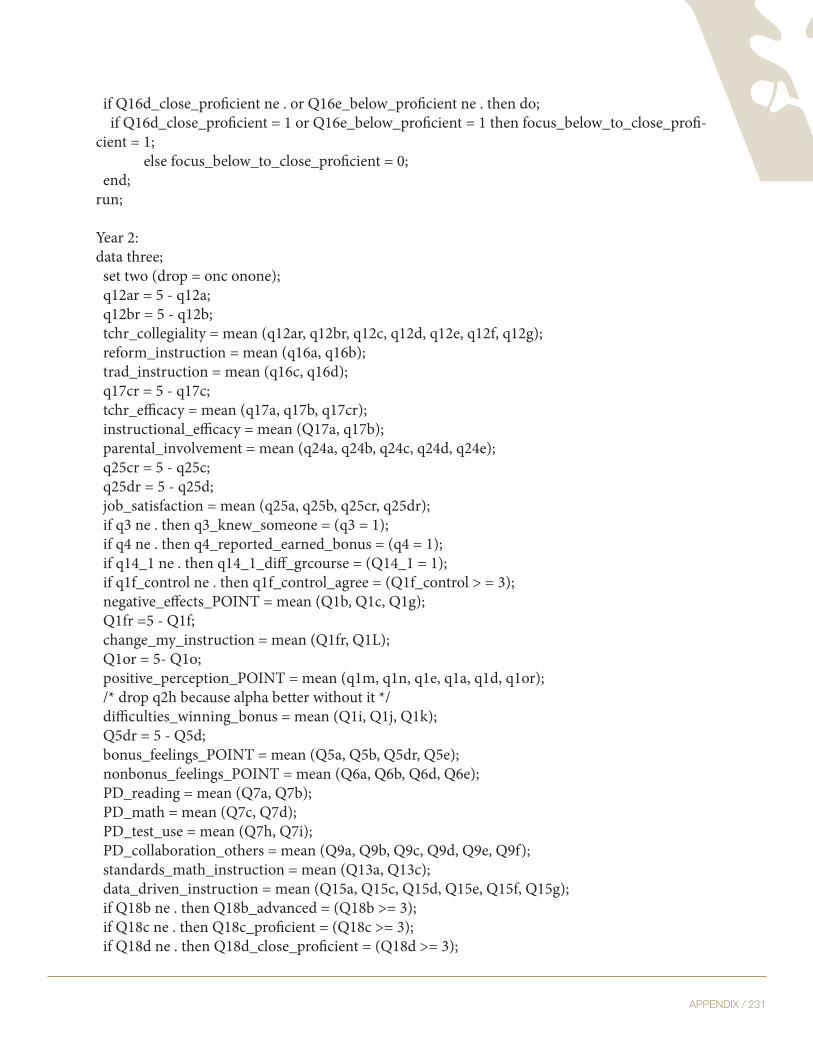
appendix / 231
if Q16d_close_proficient ne . or Q16e_below_proficient ne . then do; if Q16d_close_proficient = 1 or Q16e_below_proficient = 1 then focus_below_to_close_profi-cient = 1; else focus_below_to_close_proficient = 0; end;run; Year 2:data three; set two (drop = onc onone); q12ar = 5 - q12a; q12br = 5 - q12b; tchr_collegiality = mean (q12ar, q12br, q12c, q12d, q12e, q12f, q12g); reform_instruction = mean (q16a, q16b); trad_instruction = mean (q16c, q16d); q17cr = 5 - q17c; tchr_efficacy = mean (q17a, q17b, q17cr); instructional_efficacy = mean (Q17a, q17b); parental_involvement = mean (q24a, q24b, q24c, q24d, q24e); q25cr = 5 - q25c; q25dr = 5 - q25d; job_satisfaction = mean (q25a, q25b, q25cr, q25dr); if q3 ne . then q3_knew_someone = (q3 = 1); if q4 ne . then q4_reported_earned_bonus = (q4 = 1); if q14_1 ne . then q14_1_diff_grcourse = (Q14_1 = 1); if q1f_control ne . then q1f_control_agree = (Q1f_control > = 3); negative_effects_POINT = mean (Q1b, Q1c, Q1g); Q1fr =5 - Q1f; change_my_instruction = mean (Q1fr, Q1L); Q1or = 5- Q1o; positive_perception_POINT = mean (q1m, q1n, q1e, q1a, q1d, q1or); /* drop q2h because alpha better without it */ difficulties_winning_bonus = mean (Q1i, Q1j, Q1k); Q5dr = 5 - Q5d; bonus_feelings_POINT = mean (Q5a, Q5b, Q5dr, Q5e); nonbonus_feelings_POINT = mean (Q6a, Q6b, Q6d, Q6e); PD_reading = mean (Q7a, Q7b); PD_math = mean (Q7c, Q7d); PD_test_use = mean (Q7h, Q7i); PD_collaboration_others = mean (Q9a, Q9b, Q9c, Q9d, Q9e, Q9f); standards_math_instruction = mean (Q13a, Q13c); data_driven_instruction = mean (Q15a, Q15c, Q15d, Q15e, Q15f, Q15g); if Q18b ne . then Q18b_advanced = (Q18b >= 3); if Q18c ne . then Q18c_proficient = (Q18c >= 3); if Q18d ne . then Q18d_close_proficient = (Q18d >= 3);
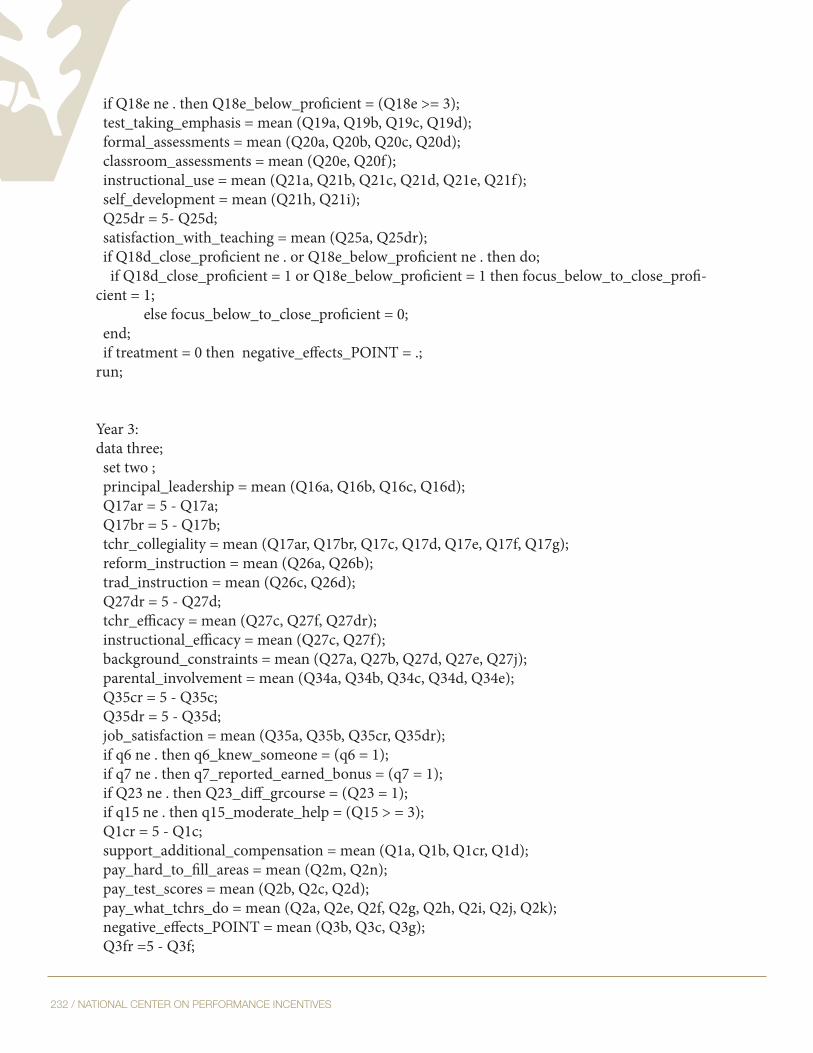
232 / national centeR on peRFoRmance incentives
if Q18e ne . then Q18e_below_proficient = (Q18e >= 3); test_taking_emphasis = mean (Q19a, Q19b, Q19c, Q19d); formal_assessments = mean (Q20a, Q20b, Q20c, Q20d); classroom_assessments = mean (Q20e, Q20f); instructional_use = mean (Q21a, Q21b, Q21c, Q21d, Q21e, Q21f); self_development = mean (Q21h, Q21i); Q25dr = 5- Q25d; satisfaction_with_teaching = mean (Q25a, Q25dr); if Q18d_close_proficient ne . or Q18e_below_proficient ne . then do; if Q18d_close_proficient = 1 or Q18e_below_proficient = 1 then focus_below_to_close_profi-cient = 1; else focus_below_to_close_proficient = 0; end; if treatment = 0 then negative_effects_POINT = .;run;
Year 3:data three; set two ; principal_leadership = mean (Q16a, Q16b, Q16c, Q16d); Q17ar = 5 - Q17a; Q17br = 5 - Q17b; tchr_collegiality = mean (Q17ar, Q17br, Q17c, Q17d, Q17e, Q17f, Q17g); reform_instruction = mean (Q26a, Q26b); trad_instruction = mean (Q26c, Q26d); Q27dr = 5 - Q27d; tchr_efficacy = mean (Q27c, Q27f, Q27dr); instructional_efficacy = mean (Q27c, Q27f); background_constraints = mean (Q27a, Q27b, Q27d, Q27e, Q27j); parental_involvement = mean (Q34a, Q34b, Q34c, Q34d, Q34e); Q35cr = 5 - Q35c; Q35dr = 5 - Q35d; job_satisfaction = mean (Q35a, Q35b, Q35cr, Q35dr); if q6 ne . then q6_knew_someone = (q6 = 1); if q7 ne . then q7_reported_earned_bonus = (q7 = 1); if Q23 ne . then Q23_diff_grcourse = (Q23 = 1); if q15 ne . then q15_moderate_help = (Q15 > = 3); Q1cr = 5 - Q1c; support_additional_compensation = mean (Q1a, Q1b, Q1cr, Q1d); pay_hard_to_fill_areas = mean (Q2m, Q2n); pay_test_scores = mean (Q2b, Q2c, Q2d); pay_what_tchrs_do = mean (Q2a, Q2e, Q2f, Q2g, Q2h, Q2i, Q2j, Q2k); negative_effects_POINT = mean (Q3b, Q3c, Q3g); Q3fr =5 - Q3f;

appendix / 233
change_my_instruction = mean (Q3fr, Q3L); Q3or = 5- Q3o; positive_perception_POINT = mean (Q3m, Q3n, Q3e, Q3a, Q3d, Q3or); /* drop q2h because alpha better without it */ difficulties_winning_bonus = mean (Q3i, Q3j, Q3k); Q8dr = 5 - Q8d; bonus_feelings_POINT = mean (Q8a, Q8b, Q8dr, Q8e); nonbonus_feelings_POINT = mean (Q9a, Q9b, Q9d, Q9e); POINT_index_positive = mean (Q10a, Q10c); PD_reading = mean (Q11a, Q11b); PD_math = mean (Q11c, Q11d); PD_test_use = mean (Q11h, Q11i); PD_collaboration_others = mean (Q13a, Q13b, Q13c, Q13d, Q13e, Q13f); standards_math_instruction = mean (Q22a, Q22c); data_driven_instruction = mean (Q25a, Q25c, Q25d, Q25e, Q25f, Q25g); if Q28b ne . then Q28b_advanced = (Q28b >= 3); if Q28c ne . then Q28c_proficient = (Q28c >= 3); if Q28d ne . then Q28d_close_proficient = (Q28d >= 3); if Q28e ne . then Q28e_below_proficient = (Q28e >= 3); test_taking_emphasis = mean (Q29a, Q29b, Q29c, Q29d); formal_assessments = mean (Q30a, Q30b, Q30c, Q30d); classroom_assessments = mean (Q30e, Q30f); instructional_use = mean (Q31a, Q31b, Q31c, Q31d, Q31e, Q31f); self_development = mean (Q31h, Q31i); Q35dr = 5- Q35d; satisfaction_with_teaching = mean (Q35a, Q35dr);
if Q28b_advanced ne . or Q28c_proficient ne . then do; if Q28b_advanced = 1 or Q28c_proficient = 1 then focus_advanced_proficient = 1; else focus_advanced_proficient = 0; end; if Q28d_close_proficient ne . or Q28e_below_proficient ne . then do; if Q28d_close_proficient = 1 or Q28e_below_proficient = 1 then focus_below_to_close_profi-cient = 1; else focus_below_to_close_proficient = 0; end;run;
i If state data exhibit discontinuous patterns of gains, these will be smoothed averages rather than simple averages. If there are significant changes in test scales from one year to the next, it may also be necessary to rescale tests to ensure comparability over time.

Matthew G. Springer Director National Center on Performance Incentives
Assistant Professor of Public Policy and Education Vanderbilt University’s Peabody College
Dale Ballou Associate Professor of Public Policy and Education Vanderbilt University’s Peabody College
Leonard Bradley Lecturer in Public Policy Vanderbilt University’s Peabody College
Timothy C. Caboni Associate Dean for External Relations; Lecturer in Public Policy and Higher Education Vanderbilt University’s Peabody College
Mark Ehlert Research Assistant Professor University of Missouri – Columbia
Bonnie Ghosh-Dastidar Statistician The RAND Corporation
Timothy J. Gronberg Professor of Economics Texas A&M University
James W. Guthrie Senior Fellow George W. Bush Institute
Professor Southern Methodist University
Laura Hamilton Senior Behavioral Scientist RAND Corporation
Janet S. Hansen Vice President and Director of Education Studies Committee for Economic Development
Chris Hulleman Assistant Professor James Madison University
Brian A. Jacob Walter H. Annenberg Professor of Education Policy Gerald R. Ford School of Public Policy University of Michigan
Dennis W. Jansen Professor of Economics Texas A&M University
Cory Koedel Assistant Professor of Economics University of Missouri-Columbia
Vi-Nhuan Le Behavioral Scientist RAND Corporation
Jessica L. Lewis Research Associate National Center on Performance Incentives
J.R. Lockwood Statistician RAND Corporation
Daniel F. McCaffrey Head of Statistics Senior Statistician RAND Corporation
Patrick J. McEwan Associate Professor of Economics Wellesley College
Shawn Ni Professor of Economics and Adjunct Professor of Statistics University of Missouri-Columbia
Michael J. Podgursky Professor of Economics University of Missouri-Columbia
Brian M. Stecher Senior Social Scientist RAND Corporation
Lori L. Taylor Associate Professor Texas A&M University
E X A M I N I N G P E R F O R M A N C E I N C E N T I V E S I N E D U C A T I O N
National Center on Performance Incentives Vanderbilt University Peabody College
Peabody #43 230 Appleton Place Nashville, TN 37203
(615) 322-5538 www.performanceincentives.org