experimental evidence of the compressibility of · pdf fileexperimental evidence of the...
TRANSCRIPT
Experimental evidence of the compressibility of arteries
Zohar Yosibash1a, Itay Manor1a, Ilan Gilada, Udi Willentzb
aDepartment of Mechanical Engineering, Ben-Gurion University of the Negev, Beer-Sheva,84105, Israel (Tel/Fax: +972-8-6477103/1, Email:[email protected])
bLahav CRO, Kibbutz Lahav 85335, Israel
Abstract
A definitive answer to the question whether artery walls are incompressible is to our
opinion not yet categorically provided. Experimental-based evidence on the level of com-
pressibility in artery walls is not easily achieved becauseof the difficulties associated with
measurement of very small differences in volumes under physiological pressure in these
biological tissues. Past experiments aimed at addressing the question considered different
species, different arteries, the experimental devices were not accurate enough and a sta-
tistical analysis of the results was missing.
A precise experimental device together with a thorough testing protocol, a careful se-
lection of arteries and a statistical analysis is presentedfor a definitive evaluation of the
artery wall compressibility. We provide experimental evidence that in saphenous and
femoral porcine arteries under physiological pressure range a relative compressibility of
2 - 6% is observed. The pre-assumption of incompressibilityin many phenomenological
constitutive models of artery walls should probably be re-evaluated.
Keywords: Artery, compressibility, experimental observations
1Equal contribution.
Preprint submitted to J. Mechanical Behavior of Biomedical Materials August 28, 2014
1. Introduction
The biomechanical response of the artery tissue is a topic ofmajor importance
and intensive research, and several phenomenological constitutive models have
been proposed for the prediction of their passive response.The common models
are hyperelastic(uniquely determined by a strain energy density function, SEDF,
Ψ) pre-assuming the incompressibility of the artery tissue under physiological
conditions, see e.g. the recent review [13]. This assumption is based on the argu-
mentation that the artery wall is comprised mostly of water,which is considered
incompressible.
In this case, the SEDF contains only an isochoric (volume preserving) part
associated with the elastic matrix, and a part associated with the two families of
the collagen fibers. For example in [12] the following decomposition of the SEDF
was suggested:
Ψ =µ2(ICIII −1/3
C −3)+Ψ f ibers, (1)
where IC and IIIC are the first and third invariants of the right Cauchy-Green tensor
C. The material parameterµ is associated with the shear modulus at infinitesimal
strains (or ground-state).
However, if in reality the artery is compressible or even slightly compressible,
the SEDF has to be enriched by another volumetric term that must account for it.
One such option is [20]:
Ψ =µ2(ICIII −1/3
C −3)+κ2(III 1/2
C −1)2+Ψ f ibers, (2)
with the material parameterκ being associated with the bulk modulus at infinites-
imal strains (or ground-state).
2

The stresses resulting from SEDFs under the assumption of incompressibility
are significantly different compared to those obtained under the slightly compress-
ible assumption (see e.g. [18]). As an example, slight compressibility (volume-
change of up to roughly 3%) resulted in circumferential stresses in the arterial
wall up to 100% higher compared to the incompressible case for the physiologi-
cal pressure of 100 mmHg as documented in [21, 8]. For almost-incompressible
materialsε = µ/κ is usually a small parameter, but not zero, and the interested
reader is referenced to a detailed analysis of such cases forε ≪ 1 in [14, 15].
A definitive experimental-based answer on the level of compressibility in artery
walls is therefore of biomechanical interest but not easilyanswered because of
difficulties to measure accurately very small differences in volume under physio-
logical pressure.
Numerous publications in the past three decades report on experiments aimed
at measuring the “incompressibility” in arterial walls. The reported results, how-
ever, differ significantly due to the variation in methods, number and quality of
examined arteries and lack of a systematic experimental protocol and statistical
evaluation of the experimental observation.
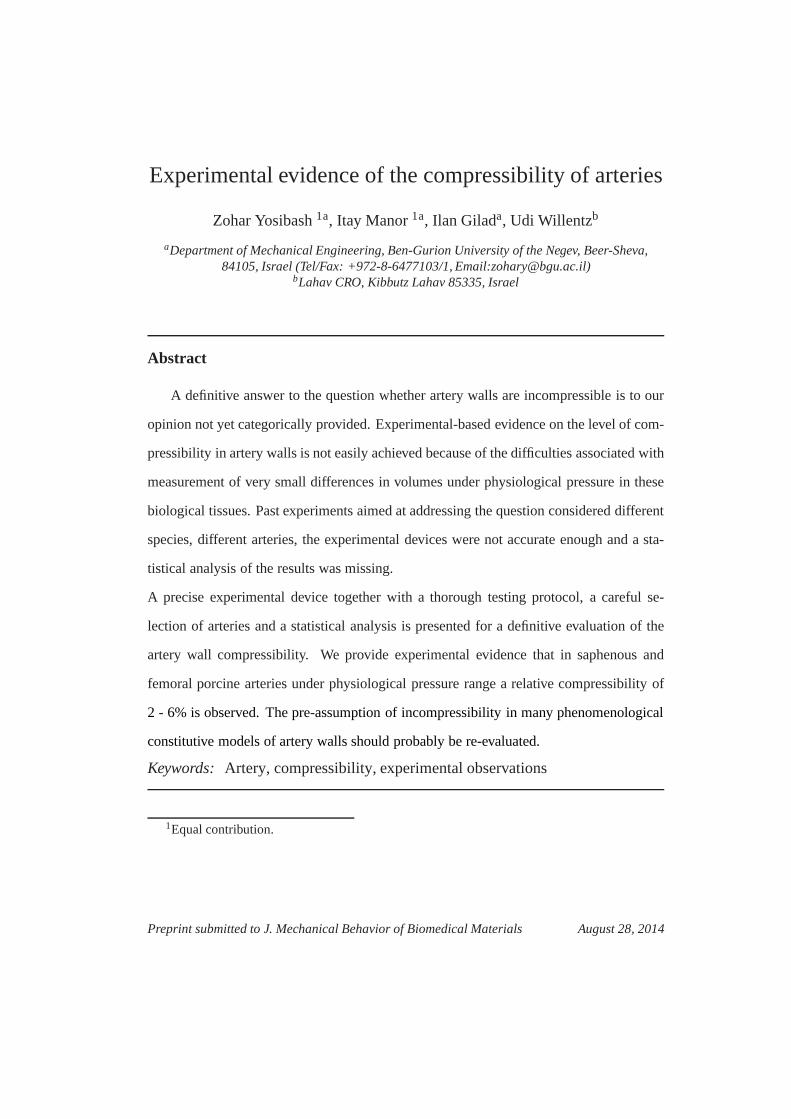
We first provide a critical review of these past experiments:Lawton [17] ex-
perimented on dog aorta, investigating the thermo-elasticbehaviour under uniaxial
loads. In part of his study he used a dilatometer to determinethe volume-change of
the aorta during uniaxial tension. The apparatus (shown in Fig. 1) included a brass
tube in which the specimen was submerged in saline solution while measuring the
change in liquid level during extension. Lawton implemented a thermodynamic
theory to calculate the tension force taking the change in volume into account.
A small change in volume (less than 1%) was reported being within the range
3
of experimental error, resulting in the conclusion that theartery wall is incom-
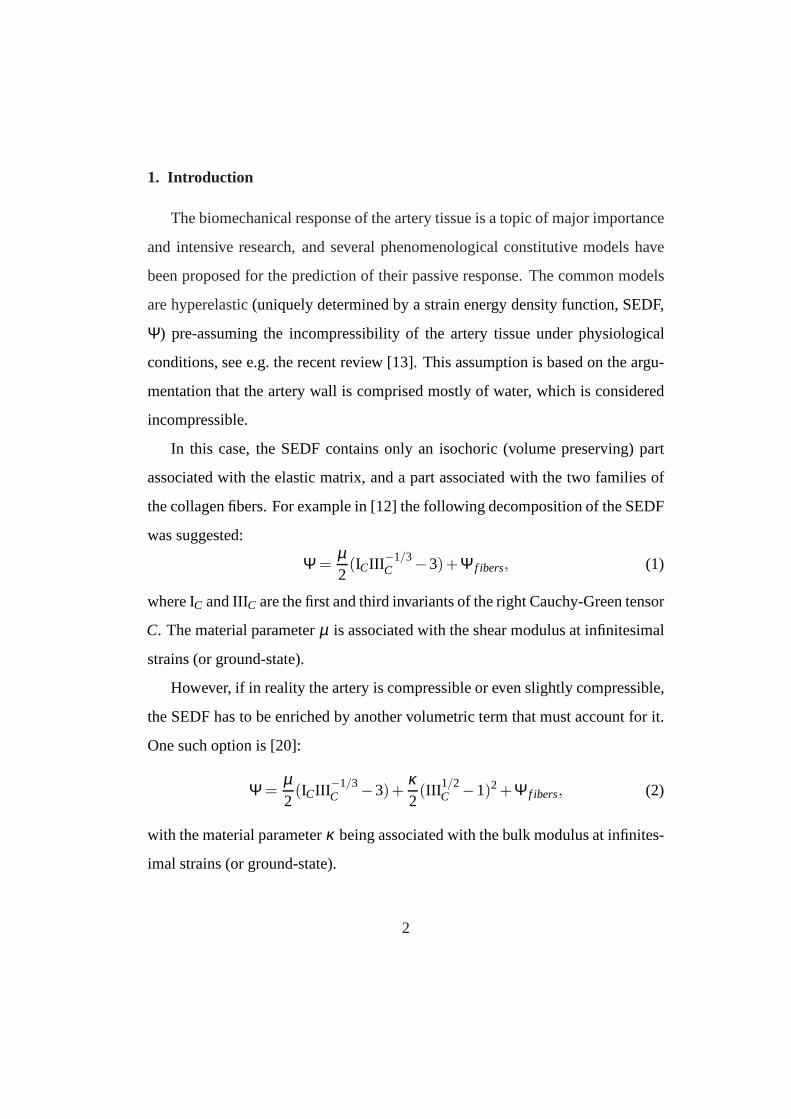
pressible. Carew et al. [3] combined analytical and experimental approaches to
Figure 1: Schematic drawing of the dilatometer [17]. The specimen was connected to the loops
(L) and the change in volume was measured by the liquid extruded into the pipet (P).
assess the compressibility of the artery in terms of the bulkmodulusκ . Cylin-
drical segments of various dog arteries submersed in a control volume filled with
physiological solution were tested. The arteries were stretched to 3−10% of their
initial length, and inflated to pressures of 167−197 mmHg. Then the saline so-
lution within the specimen was allowed to transfer to the glass flask, allowing the
inner and outer pressures to equilibrate. The change in water level was a direct
representation of the change in tissue’s volume. Bulk modulus was calculated us-
ing the axial, circumferential and radial stresses, measured by the inner pressure
and axial load. The testing device is shown in Fig. 2. It was concluded that the
volume-change in dog aortas is negligible, and generally under 1%. Tickner and
4

Figure 2: Schematic drawing of the dilatometer as shown in [3]. Saline was pumped into the
artery, and stretched to 3− 10% of its initial length. The capillary tube shown at the topwas
directed horizontally, thus the water leaving the glass flask through the tube did not affect the
outer hydrostatic pressure.
Sacks [19] reported the highest volume-change in comparison with other studies,
20−35% for various human arteries. They placed the tested specimens vertically,
sealed with a small weight at the bottom, designed to stretchthe artery and seal
it (see Fig. 3). The arteries were inflated by air and wall thickness determined by
X-rays so the change in volume was computed for different inner pressures and
axial loads. A decrease in volume of up to 35% for an inflation pressure of 300
mmHg was reported. The dry environment and air used for inflating the artery
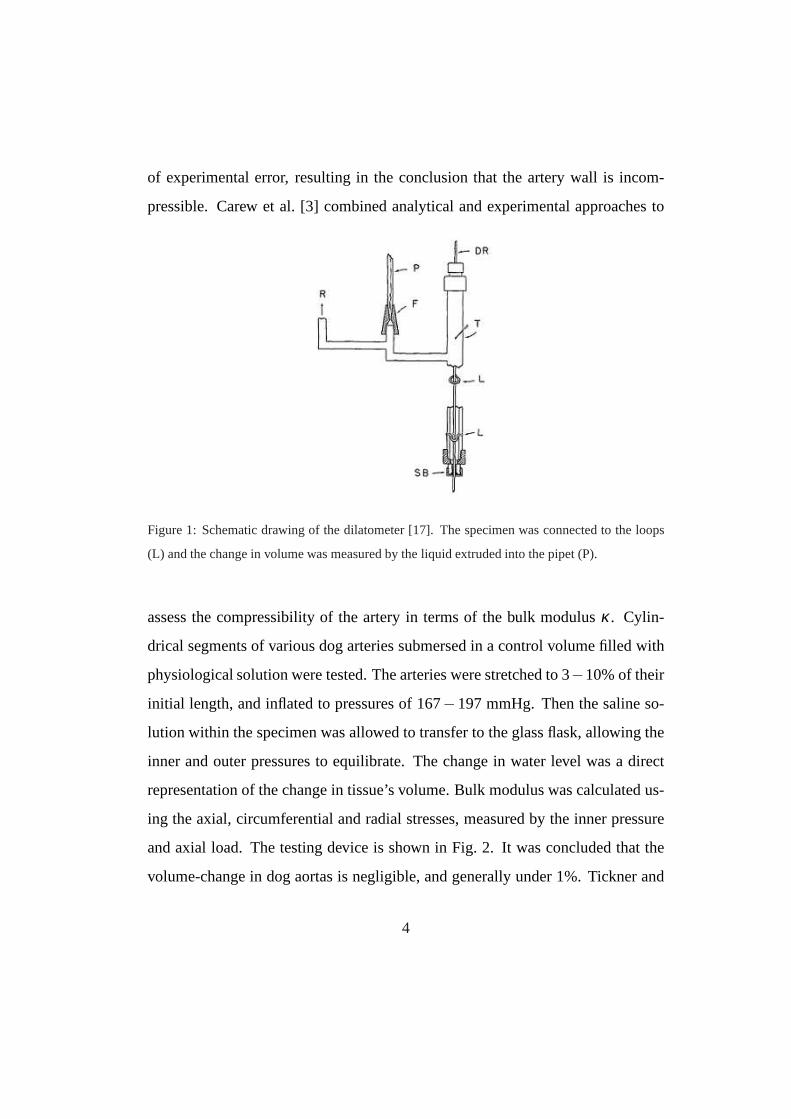
may had resulted in an extreme volume change. Chuong and Fung[5] experi-
mented on rabbit aortas, cutting the artery open into a rectangular segment and
compressing it (Fig. 4) while measuring the amount of liquidextruded from it (as-
sumed to be the volume-change of the tissue). The compressibility for four aorta
specimens was estimated in the range of 0.5−1.26% per 10 kPa of compression
stress, in the range of 0−30 kPa. The maximum change in volume in the results
5

Figure 3:Schematic drawing of the test system shown in [19].
presented was about 3%, for 30 kPa of compression stress, (equivalend to 225
mmHg). The effect of the arterial volume-change was reported to be negligible
and unaffect the computation of stresses. It was not mentioned, however, if the
evaporation of water from the glass slip was taken into account, a parameter which
may influence the results, even in small quantities. In addition the small number
of specimens presented is problematic for definitive conclusions. Furthermore,
the volume-change not associated with water extrusion was not discussed, mak-
ing the assumption that the change in volume was solely represented by the liquid
extruded from the tissue during uniaxial compression. It isalso possible that due
to the slicing of the artery a non representative amount of liquid was extruded.
Girerd et. al [10] used ultrasonic techniques to measure volume-changed on sam-
ples of human mammary and radial arteries under physiological pressure (175
mmHg). The inner diameter and wall thickness were measured,showing incon-
sistent results. Although the results imply a change of 2-15% in the artery wall
area, the authors concluded that no significant change during pressurization oc-
curred and the artery volume is conserved. The small amount of tested specimens
6
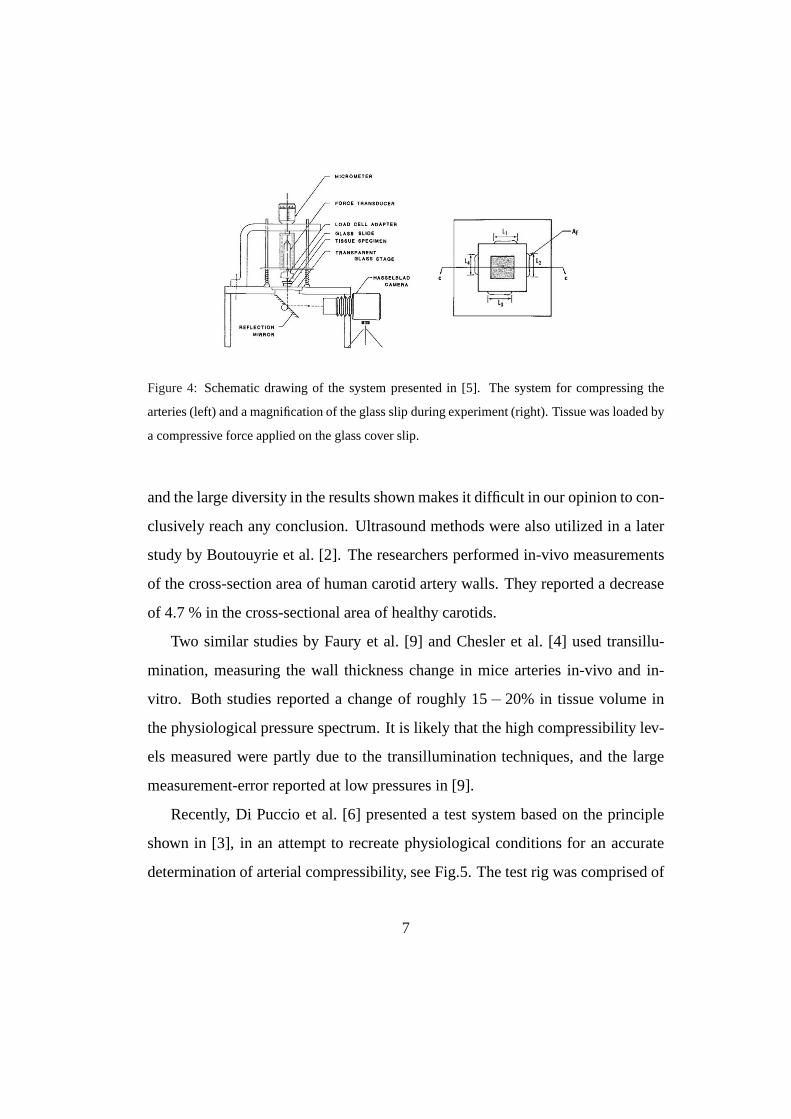
Figure 4: Schematic drawing of the system presented in [5]. The systemfor compressing the
arteries (left) and a magnification of the glass slip during experiment (right). Tissue was loaded by
a compressive force applied on the glass cover slip.
and the large diversity in the results shown makes it difficult in our opinion to con-
clusively reach any conclusion. Ultrasound methods were also utilized in a later
study by Boutouyrie et al. [2]. The researchers performed in-vivo measurements
of the cross-section area of human carotid artery walls. They reported a decrease
of 4.7 % in the cross-sectional area of healthy carotids.
Two similar studies by Faury et al. [9] and Chesler et al. [4] used transillu-
mination, measuring the wall thickness change in mice arteries in-vivo and in-
vitro. Both studies reported a change of roughly 15− 20% in tissue volume in
the physiological pressure spectrum. It is likely that the high compressibility lev-
els measured were partly due to the transillumination techniques, and the large
measurement-error reported at low pressures in [9].
Recently, Di Puccio et al. [6] presented a test system based on the principle
shown in [3], in an attempt to recreate physiological conditions for an accurate
determination of arterial compressibility, see Fig.5. Thetest rig was comprised of
7
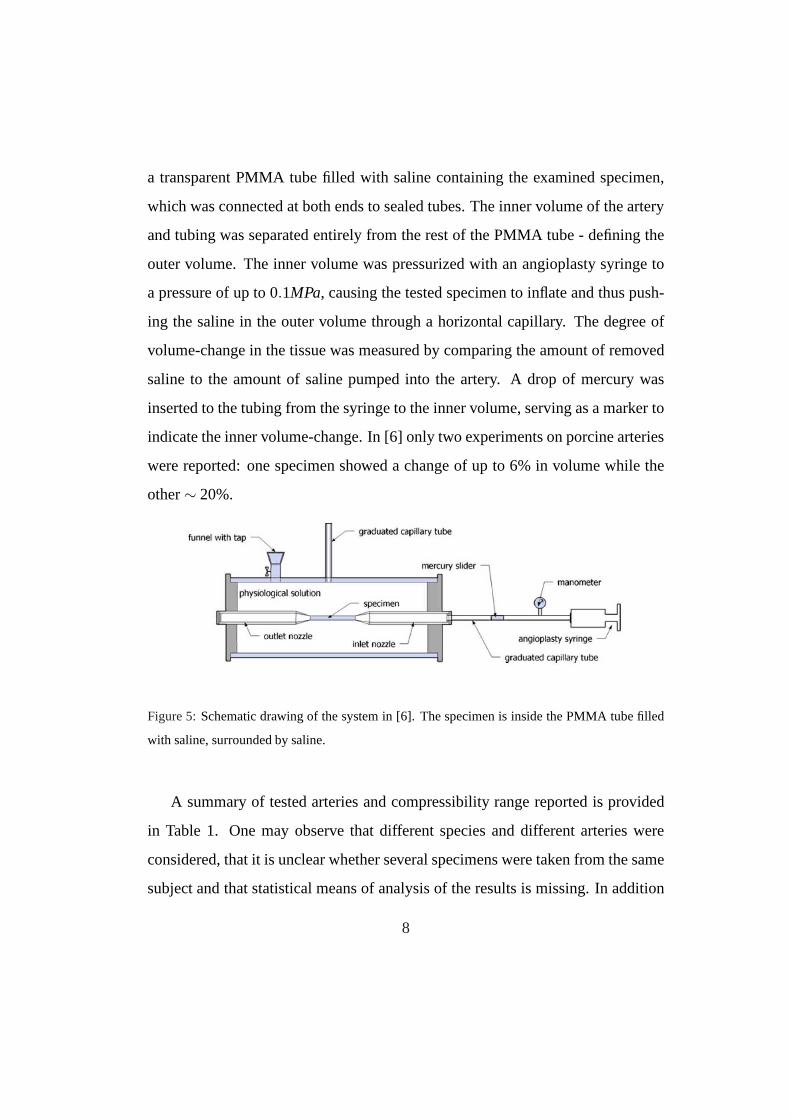
a transparent PMMA tube filled with saline containing the examined specimen,
which was connected at both ends to sealed tubes. The inner volume of the artery
and tubing was separated entirely from the rest of the PMMA tube - defining the
outer volume. The inner volume was pressurized with an angioplasty syringe to
a pressure of up to 0.1MPa, causing the tested specimen to inflate and thus push-
ing the saline in the outer volume through a horizontal capillary. The degree of
volume-change in the tissue was measured by comparing the amount of removed
saline to the amount of saline pumped into the artery. A drop of mercury was
inserted to the tubing from the syringe to the inner volume, serving as a marker to
indicate the inner volume-change. In [6] only two experiments on porcine arteries
were reported: one specimen showed a change of up to 6% in volume while the
other∼ 20%.
Figure 5:Schematic drawing of the system in [6]. The specimen is inside the PMMA tube filled
with saline, surrounded by saline.
A summary of tested arteries and compressibility range reported is provided
in Table 1. One may observe that different species and different arteries were
considered, that it is unclear whether several specimens were taken from the same
subject and that statistical means of analysis of the results is missing. In addition
8

in most cases the experimental protocol and experimental errors are not provided.
These drawbacks suggest that any conclusions on the compressibility of arterial
walls may be misleading, and a precise device together with athorough testing
protocol, a careful selection of arteries and statistical analysis is required for a
definitive evaluation of the artery’s compressibility. We provide therefore a de-
tailed description of the experimental system and all measures undertaken to as-
sure the precise measurements as well as the detailed experimental protocol used
to assess precisely the relative volume change.
2. Methods
A new experimental device was designed and constructed based on [6]. The
artery wall’s volume-change is of orders of micro-liters therefore the experimental
device had to be sensitive and well calibrated. The lumen of an artery was water
filled at increased pressure that resulted in deformation ofthe artery and the ex-
trusion of water surrounding it through a small-diameter tube. The difference in
the volume of the extruded water and the volume inserted intothe artery’s lumen
was the change of the artery’s wall volume.
2.1. The experimental device
Typically arteries having an outer diameter of 3−6 mm and a length of about
20 mm were considered. The initial tissue volume of a specimen of this size was
roughly 200µL (micro liter). To obtain an internal pressure of about 300 mmHg
it was required to pump approximately 300µL of liquid into the artery’s lumen.
The test chamber (see Fig. 6) was a PMMA tube, with an internal diameter of 32
mm, sealed at both ends by rigid plastic caps. System’s components were manu-
factured from materials that do not deform under minor pressures experienced in
9
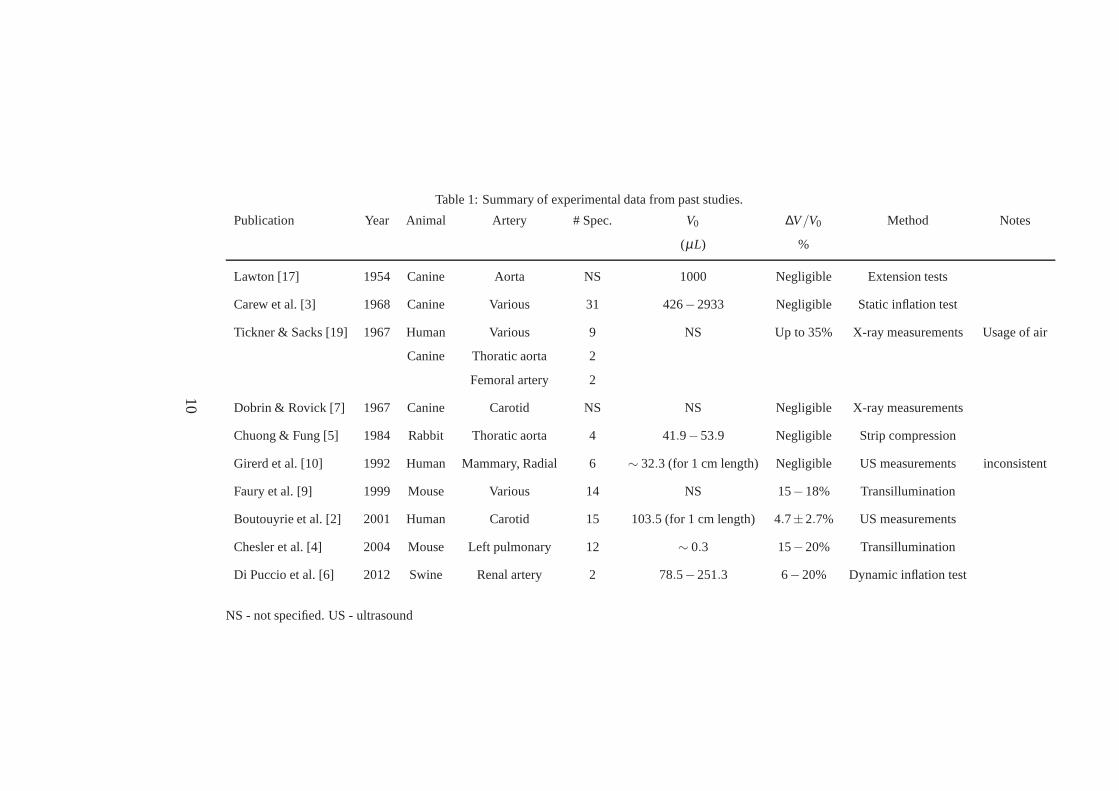
Table 1: Summary of experimental data from past studies.
Publication Year Animal Artery # Spec. V0 ∆V/V0 Method Notes
(µL) %
Lawton [17] 1954 Canine Aorta NS 1000 Negligible Extension tests
Carew et al. [3] 1968 Canine Various 31 426−2933 Negligible Static inflation test
Tickner & Sacks [19] 1967 Human Various 9 NS Up to 35% X-ray measurements Usage of air
Canine Thoratic aorta 2
Femoral artery 2
Dobrin & Rovick [7] 1967 Canine Carotid NS NS Negligible X-ray measurements
Chuong & Fung [5] 1984 Rabbit Thoratic aorta 4 41.9−53.9 Negligible Strip compression
Girerd et al. [10] 1992 Human Mammary, Radial 6 ∼ 32.3 (for 1 cm length) Negligible US measurements inconsistent
Faury et al. [9] 1999 Mouse Various 14 NS 15−18% Transillumination
Boutouyrie et al. [2] 2001 Human Carotid 15 103.5 (for 1 cm length) 4.7±2.7% US measurements
Chesler et al. [4] 2004 Mouse Left pulmonary 12 ∼ 0.3 15−20% Transillumination
Di Puccio et al. [6] 2012 Swine Renal artery 2 78.5−251.3 6−20% Dynamic inflation test
NS - not specified. US - ultrasound
10
experiments, and did not react with any physiologic liquid.Through the center of
each cap a hollow small diameter metallic tube was inserted,enclosing the main
part of the pressurized volumeVp. One cap was perforated at two locations by
medical needles, that were connected to plastic tubes. These needles were used to
fill the test chamber with water and to allow the exit of air bubbles trapped inside
the test chamber.
Figure 6: A schematic figure of the testing device.
The artery specimen was tied to the metal hollow tubes inserted from either
side of the test chamber, using surgical thread, and was checked for any leak-
age prior to the experiment (by inflating it with blue medicalpigment (Methylene
blue) so to make sure no leakage is visible) as shown in Figure7(Top). The long
metallic tubes (extruded from the un-perforated cap) couldhad been moved, so
that the specimen was easily secured to both tubes before it was sealed in the
test chamber and the outer volume isolated. After the specimen was securely
tied it was ready so that pressure inVp could had been monitored (comprising
of the artery lumen and inner volumes of the metal tubes). A pressure sensor
was inserted by a catheter through the long tube into the tiedartery. To the short
metallic tube a syringe pump was connected that inserted colored waterVin, in-
11
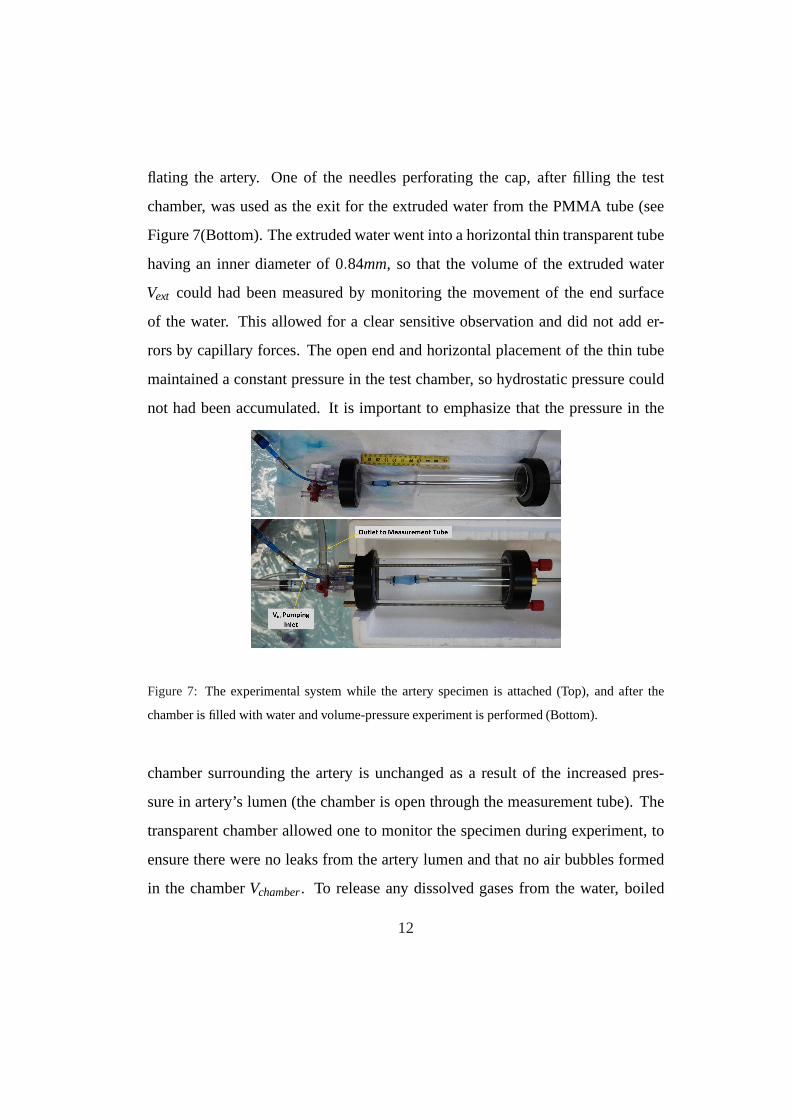
flating the artery. One of the needles perforating the cap, after filling the test
chamber, was used as the exit for the extruded water from the PMMA tube (see
Figure 7(Bottom). The extruded water went into a horizontalthin transparent tube
having an inner diameter of 0.84mm, so that the volume of the extruded water
Vext could had been measured by monitoring the movement of the endsurface
of the water. This allowed for a clear sensitive observationand did not add er-
rors by capillary forces. The open end and horizontal placement of the thin tube
maintained a constant pressure in the test chamber, so hydrostatic pressure could
not had been accumulated. It is important to emphasize that the pressure in the
Figure 7: The experimental system while the artery specimen is attached (Top), and after the
chamber is filled with water and volume-pressure experimentis performed (Bottom).
chamber surrounding the artery is unchanged as a result of the increased pres-
sure in artery’s lumen (the chamber is open through the measurement tube). The
transparent chamber allowed one to monitor the specimen during experiment, to
ensure there were no leaks from the artery lumen and that no air bubbles formed
in the chamberVchamber. To release any dissolved gases from the water, boiled
12

water at room temperature was used. The colored water was pumped into the in-
ner volume to allow the identification of any leaks. A NE-1000programmable
single syringe pump by New Era Pump Systems, Inc. together with a 1 milliliter
glass syringe were used to pump the colored water into the inner volume. This al-
lowed to pump a minimum amount of 1µL at a time. The accuracy of the amount
of liquid inserted by the syringe pump was checked by weighing distilled water
extruded from the syringe using analytical scales, with a measurement error of
0.1 milligram (0.1µL). The volume of water extruded from the chamber’s volume
was measured. EachµL was equivalent to 1.795 mm of liquid in the transparent
tube (factor found experimentally by using the device without a specimen). The
inner pressure was measured by a catheter pressure sensor and a SmartMap moni-
tor made by VOLCANO, with a 0.38mm wire, providing a pressure measurement
in the range of -39−399 mmHg and an accuracy of±3%. The setup of the testing
device and all its components are shown in Fig. 8.
2.2. Calibration of the experimental device
Several verification procedures were performed to ensure the accuracy of the
experimental observations:
• Leakage in the experimental device was checked by insertingwater into the
experimental chamber at a pressure of 250 mmHg without an artery. No
leaks were present.
• The inserted fluid volume (by syringe pump with a glass syringe) was ver-
ified by an analytical scale. The measurement error was less than 0.1µL,
(less than 0.5% of the volume for a pressure of 100 mmHg in the smallest
specimens). No influence of pressure on the accuracy of the inserted fluid
13
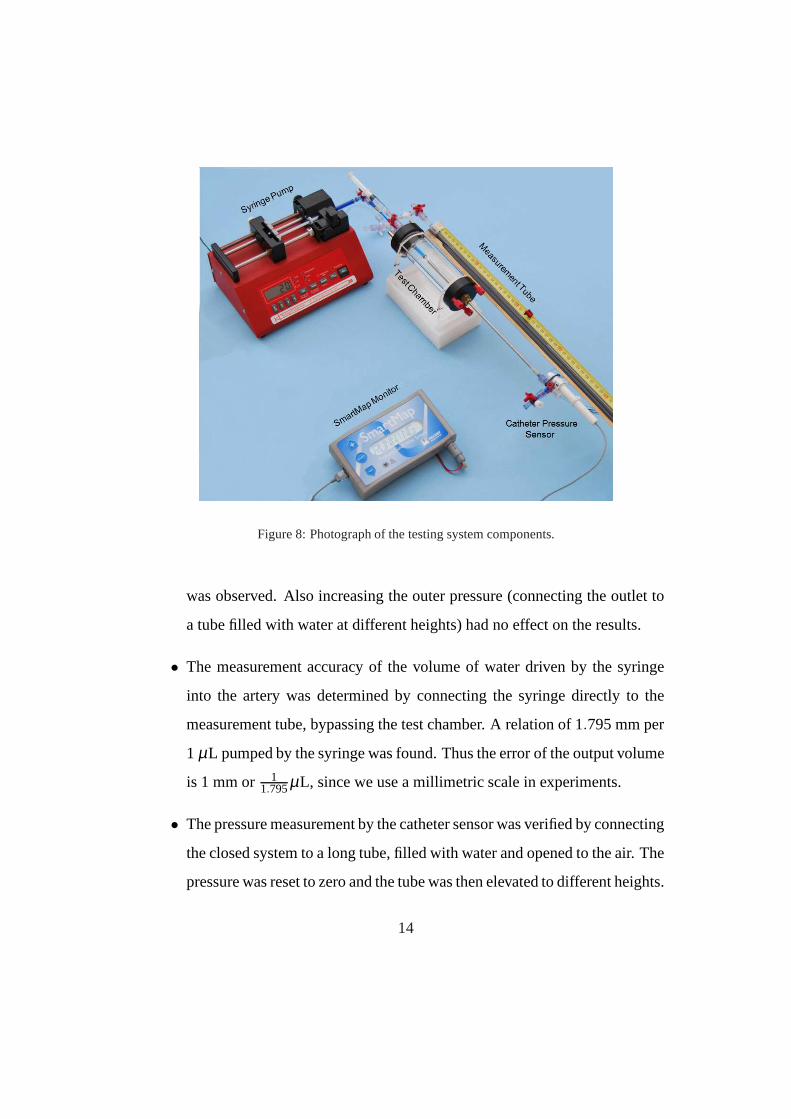
Figure 8: Photograph of the testing system components.
was observed. Also increasing the outer pressure (connecting the outlet to
a tube filled with water at different heights) had no effect onthe results.
• The measurement accuracy of the volume of water driven by thesyringe
into the artery was determined by connecting the syringe directly to the
measurement tube, bypassing the test chamber. A relation of1.795 mm per
1 µL pumped by the syringe was found. Thus the error of the outputvolume
is 1 mm or 11.795µL, since we use a millimetric scale in experiments.
• The pressure measurement by the catheter sensor was verifiedby connecting
the closed system to a long tube, filled with water and opened to the air. The
pressure was reset to zero and the tube was then elevated to different heights.
14
Given the height, hydrostatic pressure in the closed systemwas calculated
and compared to the sensor measurement having a±1 mmHg error.
• The experimental device may be susceptible to temperature change result-
ing in volume change. To prevent this problem, the device wasisolated
from the environment by styrofoam to maintain a constant temperature, and
experiments were performed within a very short time-frame.So to be fur-
ther on the safe-side, during this time-frame the temperature in the lab was
unchanged.
• Artery volume was measured at the end of each experiment, assuming no ir-
reversible change during the experiment. Average wall thickness was mea-
sured under a glass slide by a height indicator, and the surface area was
computed by photograph analysis after the artery was flattened on a mm-
scale. The error of the height indicator was 0.01 mm, and the error in the
area measurement was less than 2%. These errors accumulatedto a total
error of up to≈ 5% in the tissue volume calculation.
• Control experiments were performed on incompressible latex rubber tubes
of several sizes to verify volume change. These were performed exactly as
the experiments on the arteries. Since rubber volume’s change is known to
be negligible at these pressures, any measured change in volume was con-
tributed as inaccuracies of the testing device. Results were used as a cali-
bration for the volume-change measured in the artery wall, see elaboration
in section 3.
• It was noticed that immediately after each volume dose was inserted, the
pressure had a peak value and thereafter slowly and continuously decreased.
15
This phenomenon did not occur in rubber specimens. Therefore, the phe-
nomena was attributed to the relaxation of the arterial wall. To avoid errors,
the pressure was measured immediately after each dose was introduced,
measuring the peak pressure value.
2.3. Experiment protocol
Porcine femoral, saphenous and one carotid arteries were extracted from fe-
male pigs sacrificed for medical research not associated with the vascular system.
Prior to excision, heparan sulfate was given to the sedated animal to prevent blood
clots in the arteries. The excised specimens were kept in saline solution at 2−4◦
C for at most 24 hours. The arteries were skeletonized (connective tissue removed
around the arteries), cut to an appropriate length without bifurcating branches and
attached to the metallic tubes by surgical thread. Colored water was then inserted
into the lumen to remove trapped air and to check for leaks (byincreasing the
inner pressure to a value of≈ 200 mmHg). If leakage was detected the artery was
discarded, otherwise the test chamber was carefully sealedand filled with clear
water, while allowing air bubbles to be pushed out.
A preconditioning protocol was then followed by determining the amount of
inlet water (Vin,300mmHg) that produced 300 mmHg pressure within the lumen, and
repeatedly pumping it in and out until peak pressure in consecutive cycles re-
mained constant. Following preconditioning, increments of a tenth ofVin,300mmHg
were inserted at a pumping rate of 400µLmin . Immediately after each dose, the pres-
sure and the water level in the measurement tube were recorded. Denoting water
volume pumped into the artery byVin and the volume extruded from the test cham-
ber byVext , the tissue volume-change calculated was∆V = Vin −Vext and relative
volume-change was∆VV0[%] whereV0 is the initial volume of the examined spec-
16
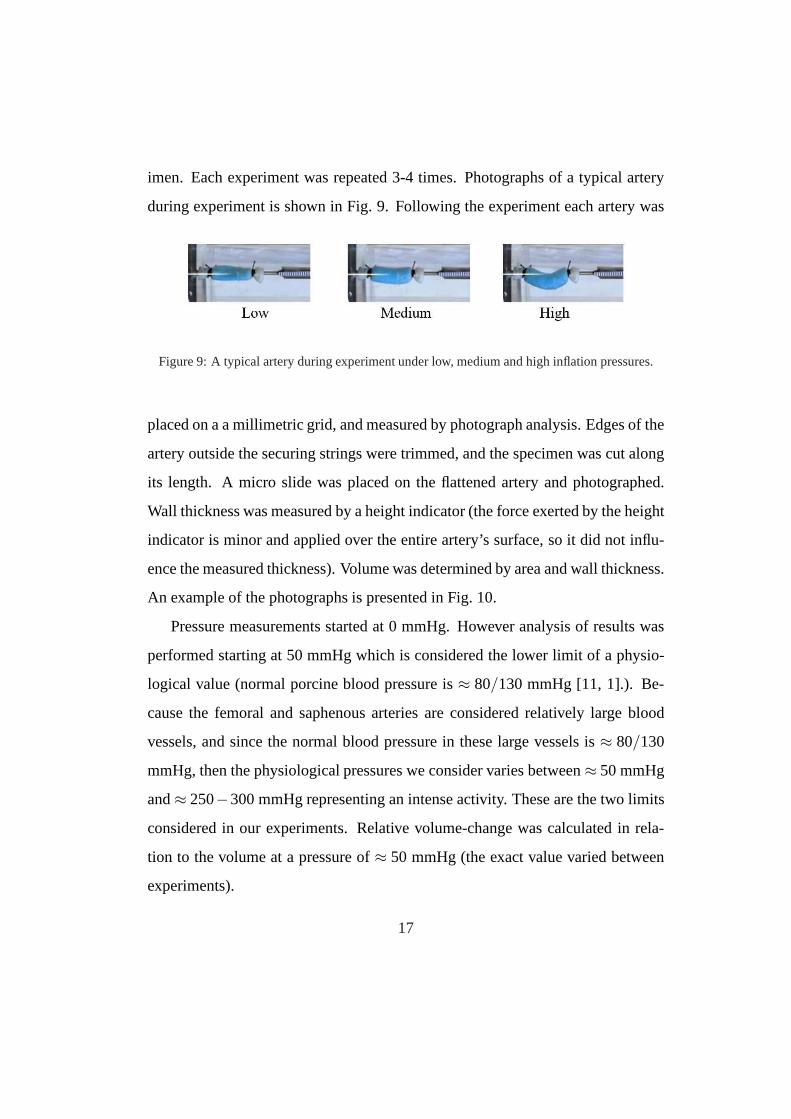
imen. Each experiment was repeated 3-4 times. Photographs of a typical artery
during experiment is shown in Fig. 9. Following the experiment each artery was
Figure 9: A typical artery during experiment under low, medium and high inflation pressures.
placed on a a millimetric grid, and measured by photograph analysis. Edges of the
artery outside the securing strings were trimmed, and the specimen was cut along
its length. A micro slide was placed on the flattened artery and photographed.
Wall thickness was measured by a height indicator (the forceexerted by the height
indicator is minor and applied over the entire artery’s surface, so it did not influ-
ence the measured thickness). Volume was determined by areaand wall thickness.
An example of the photographs is presented in Fig. 10.
Pressure measurements started at 0 mmHg. However analysis of results was
performed starting at 50 mmHg which is considered the lower limit of a physio-
logical value (normal porcine blood pressure is≈ 80/130 mmHg [11, 1].). Be-
cause the femoral and saphenous arteries are considered relatively large blood
vessels, and since the normal blood pressure in these large vessels is≈ 80/130
mmHg, then the physiological pressures we consider varies between≈ 50 mmHg
and≈ 250−300 mmHg representing an intense activity. These are the twolimits
considered in our experiments. Relative volume-change wascalculated in rela-
tion to the volume at a pressure of≈ 50 mmHg (the exact value varied between
experiments).
17
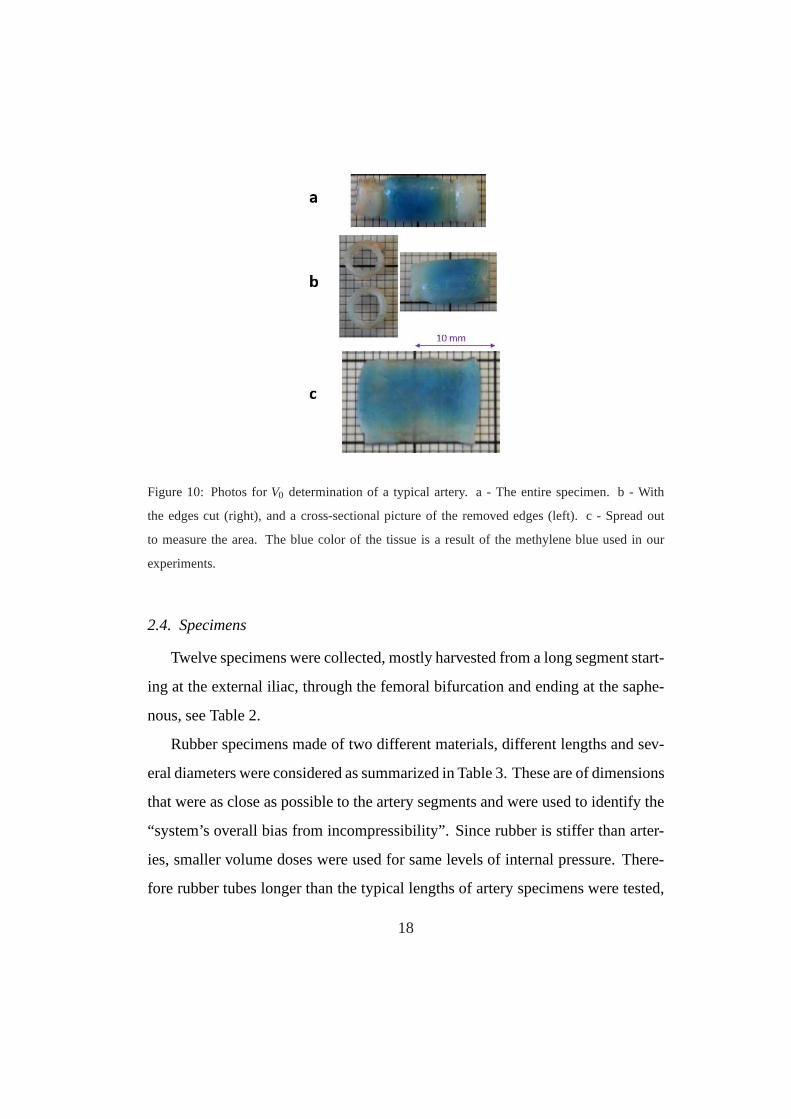
Figure 10: Photos forV0 determination of a typical artery. a - The entire specimen. b- With
the edges cut (right), and a cross-sectional picture of the removed edges (left). c - Spread out
to measure the area. The blue color of the tissue is a result ofthe methylene blue used in our
experiments.
2.4. Specimens
Twelve specimens were collected, mostly harvested from a long segment start-
ing at the external iliac, through the femoral bifurcation and ending at the saphe-
nous, see Table 2.
Rubber specimens made of two different materials, different lengths and sev-
eral diameters were considered as summarized in Table 3. These are of dimensions
that were as close as possible to the artery segments and wereused to identify the
“system’s overall bias from incompressibility”. Since rubber is stiffer than arter-
ies, smaller volume doses were used for same levels of internal pressure. There-
fore rubber tubes longer than the typical lengths of artery specimens were tested,
18
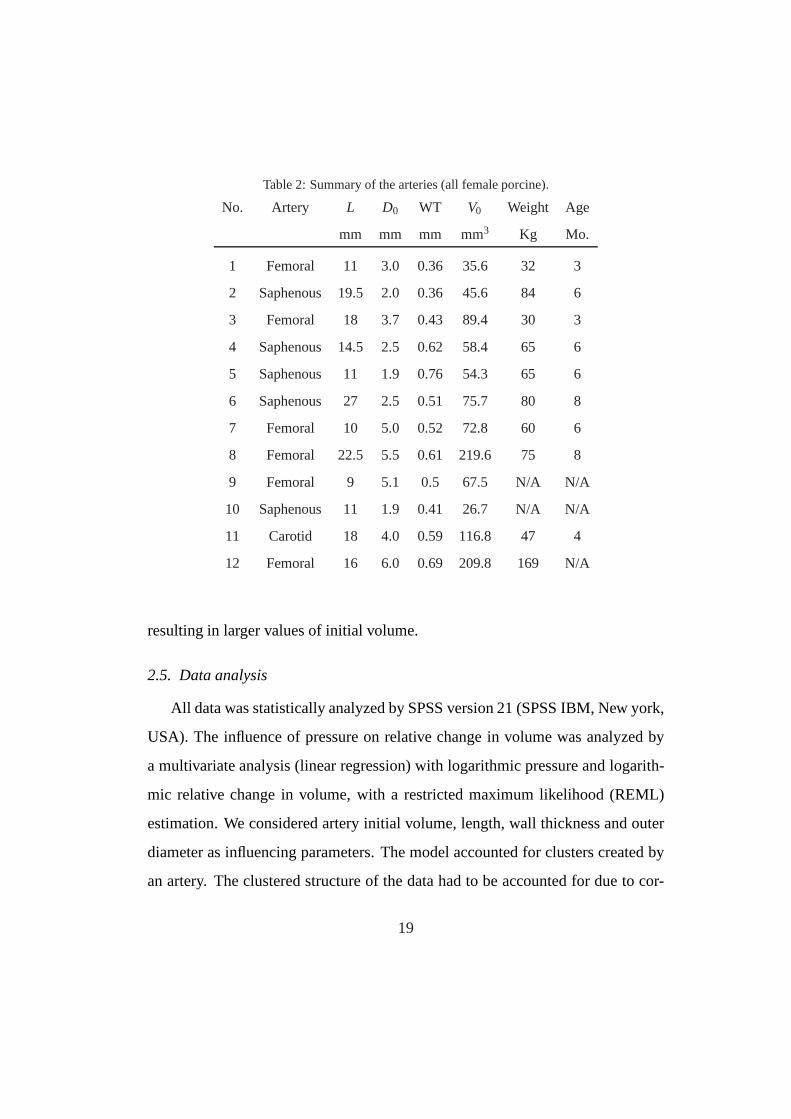
Table 2: Summary of the arteries (all female porcine).
No. Artery L D0 WT V0 Weight Age
mm mm mm mm3 Kg Mo.
1 Femoral 11 3.0 0.36 35.6 32 3
2 Saphenous 19.5 2.0 0.36 45.6 84 6
3 Femoral 18 3.7 0.43 89.4 30 3
4 Saphenous 14.5 2.5 0.62 58.4 65 6
5 Saphenous 11 1.9 0.76 54.3 65 6
6 Saphenous 27 2.5 0.51 75.7 80 8
7 Femoral 10 5.0 0.52 72.8 60 6
8 Femoral 22.5 5.5 0.61 219.6 75 8
9 Femoral 9 5.1 0.5 67.5 N/A N/A
10 Saphenous 11 1.9 0.41 26.7 N/A N/A
11 Carotid 18 4.0 0.59 116.8 47 4
12 Femoral 16 6.0 0.69 209.8 169 N/A
resulting in larger values of initial volume.
2.5. Data analysis
All data was statistically analyzed by SPSS version 21 (SPSSIBM, New york,
USA). The influence of pressure on relative change in volume was analyzed by
a multivariate analysis (linear regression) with logarithmic pressure and logarith-
mic relative change in volume, with a restricted maximum likelihood (REML)
estimation. We considered artery initial volume, length, wall thickness and outer
diameter as influencing parameters. The model accounted forclusters created by
an artery. The clustered structure of the data had to be accounted for due to cor-
19
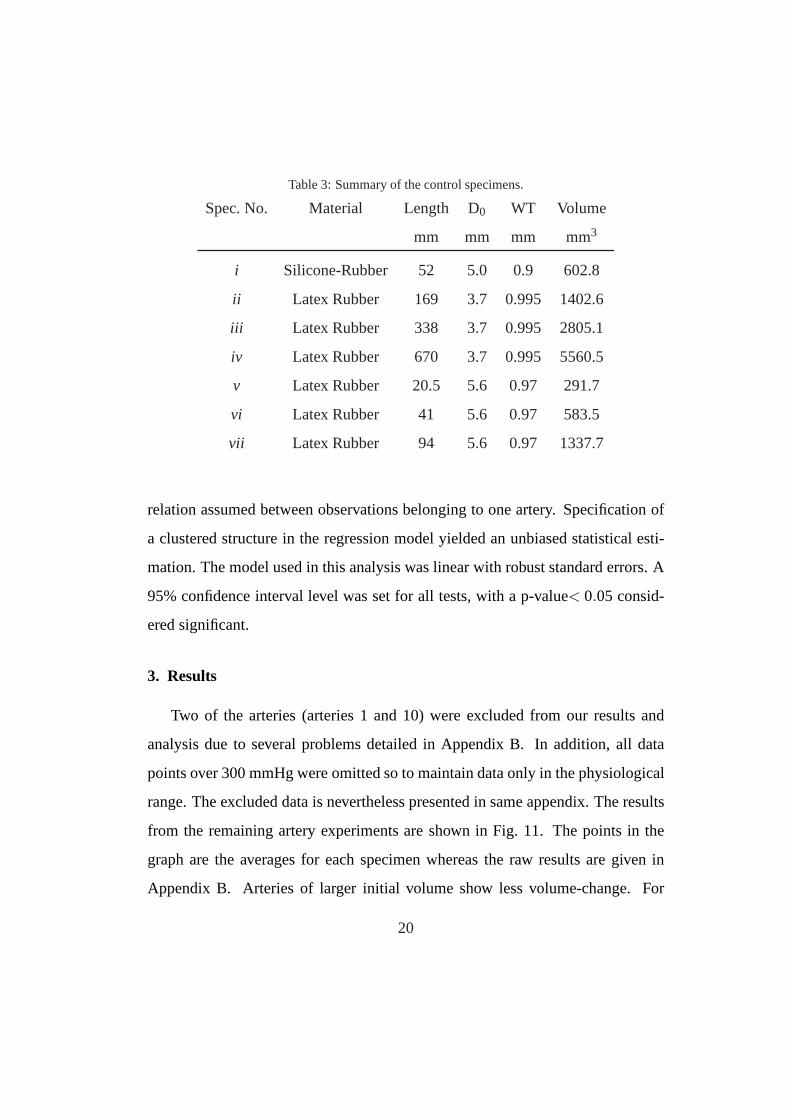
Table 3: Summary of the control specimens.
Spec. No. Material Length D0 WT Volume
mm mm mm mm3
i Silicone-Rubber 52 5.0 0.9 602.8
ii Latex Rubber 169 3.7 0.995 1402.6
iii Latex Rubber 338 3.7 0.995 2805.1
iv Latex Rubber 670 3.7 0.995 5560.5
v Latex Rubber 20.5 5.6 0.97 291.7
vi Latex Rubber 41 5.6 0.97 583.5
vii Latex Rubber 94 5.6 0.97 1337.7
relation assumed between observations belonging to one artery. Specification of
a clustered structure in the regression model yielded an unbiased statistical esti-
mation. The model used in this analysis was linear with robust standard errors. A
95% confidence interval level was set for all tests, with a p-value< 0.05 consid-
ered significant.
3. Results
Two of the arteries (arteries 1 and 10) were excluded from ourresults and
analysis due to several problems detailed in Appendix B. In addition, all data
points over 300 mmHg were omitted so to maintain data only in the physiological
range. The excluded data is nevertheless presented in same appendix. The results
from the remaining artery experiments are shown in Fig. 11. The points in the
graph are the averages for each specimen whereas the raw results are given in
Appendix B. Arteries of larger initial volume show less volume-change. For
20

the physiological normal pressure range≈ 50−200 mmHg the relative volume-
change is≈ 2−6%.
Figure 11:Relative volume-change for arteries. Data points are averages for each artery. The solid
lines are evaluated by (3).
Experimental data for rubber specimens is shown in Fig. 12 (note the different
scale compared to Fig. 11).
3.1. Statistical analysis
Among all relations that were analyzed statistically a multi-linear dependance
was found between the logarithm of the relative volume-change ln∆VV0
to the log-
arithm of the pressurelnP and volume of the specimensV0. The following rela-
tionship was determined:
ln∆VV0
= a · lnP+b ·V0+ c ⇒∆VV0
= Pa·exp(b ·V0) ·exp(c) (3)
21
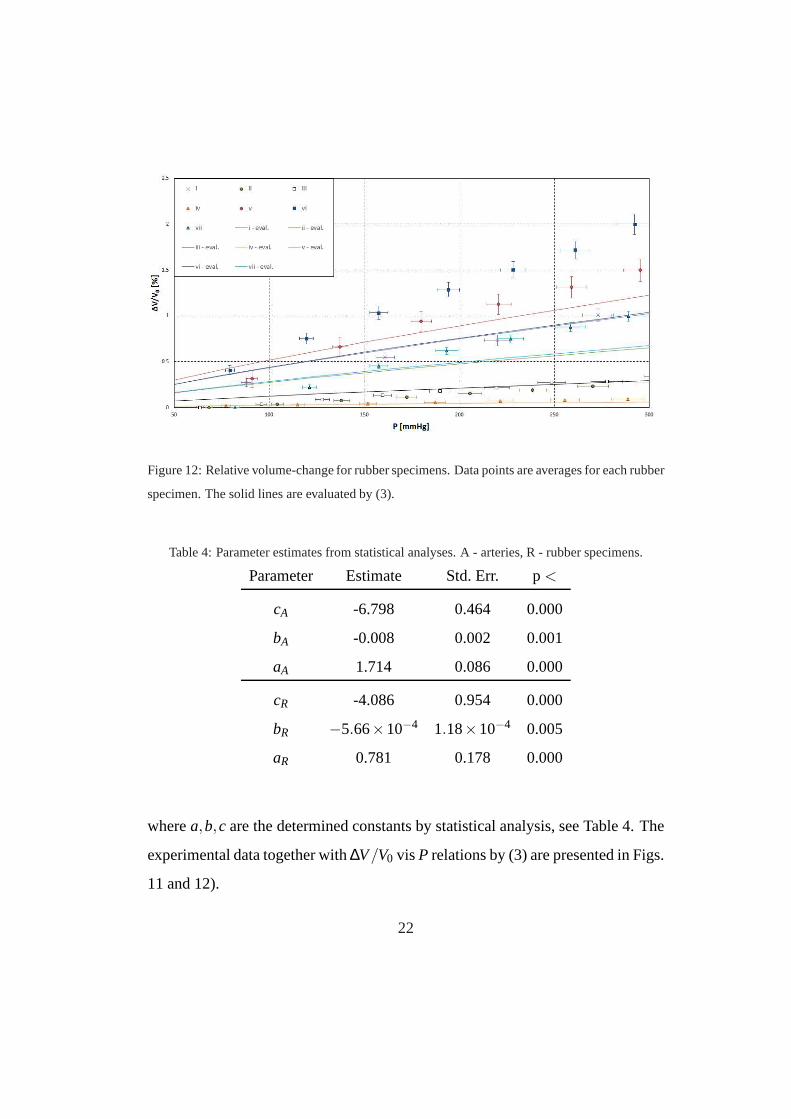
Figure 12: Relative volume-change for rubber specimens. Data points are averages for each rubber
specimen. The solid lines are evaluated by (3).
Table 4: Parameter estimates from statistical analyses. A -arteries, R - rubber specimens.
Parameter Estimate Std. Err. p<
cA -6.798 0.464 0.000
bA -0.008 0.002 0.001
aA 1.714 0.086 0.000
cR -4.086 0.954 0.000
bR −5.66×10⁻⁴ 1.18×10⁻⁴ 0.005
aR 0.781 0.178 0.000
wherea,b,c are the determined constants by statistical analysis, see Table 4. The
experimental data together with∆V/V0 vis P relations by (3) are presented in Figs.
11 and 12).
22

The dependency of the relative volume-change on outer diameter, artery wall-
thickness and length was also investigated statistically.It was found that these
parameters have no influence on the relative volume-change (with p < 0.05).
Since rubber tubes are assumed to be incompressible, then any compressibility
detected by the experimental device for them is associated to experimental errors.
Thus, we may subtract the measured volume-change of the rubber tubes from the
volume change of the arteries, so to eliminate any sources offalse volume change:
∆VV0
= PaA ·exp(bA ·V0) ·exp(cA)−PaR ·exp(bR ·V0) ·exp(cR) (4)
We plot ∆VV0
vis P according to (4) in Fig. 13. Notice that the difference between
arteries is because of the total volume of the tissue. Some ofthe larger arteries
show a negative volume-change in the low pressure regime. This is an artifact of
(4) that will be addressed in Section 4.
Of course that in reality, one does not have access to the volume of the artery
but to its diameter. In Appendix A we provide a similar statistical analysis where
we considerD2 as one of the independent variables instead of the initial volume.
4. Discussion
A high-precision experimental system has been developed tomeasure the
compressibility of arteries at physiological pressures. Preliminary experiments
on nine porcine arteries were performed until all precisionissues and problems
were addressed and corrected - these were not accurate enough and have been
discarded (relative volume change in these experiments wasrelatively high and
similar to the values reported in [6]). After the experimental system has been fi-
nalized and calibrated, twelve more porcine arteries were tested, out of which two
23
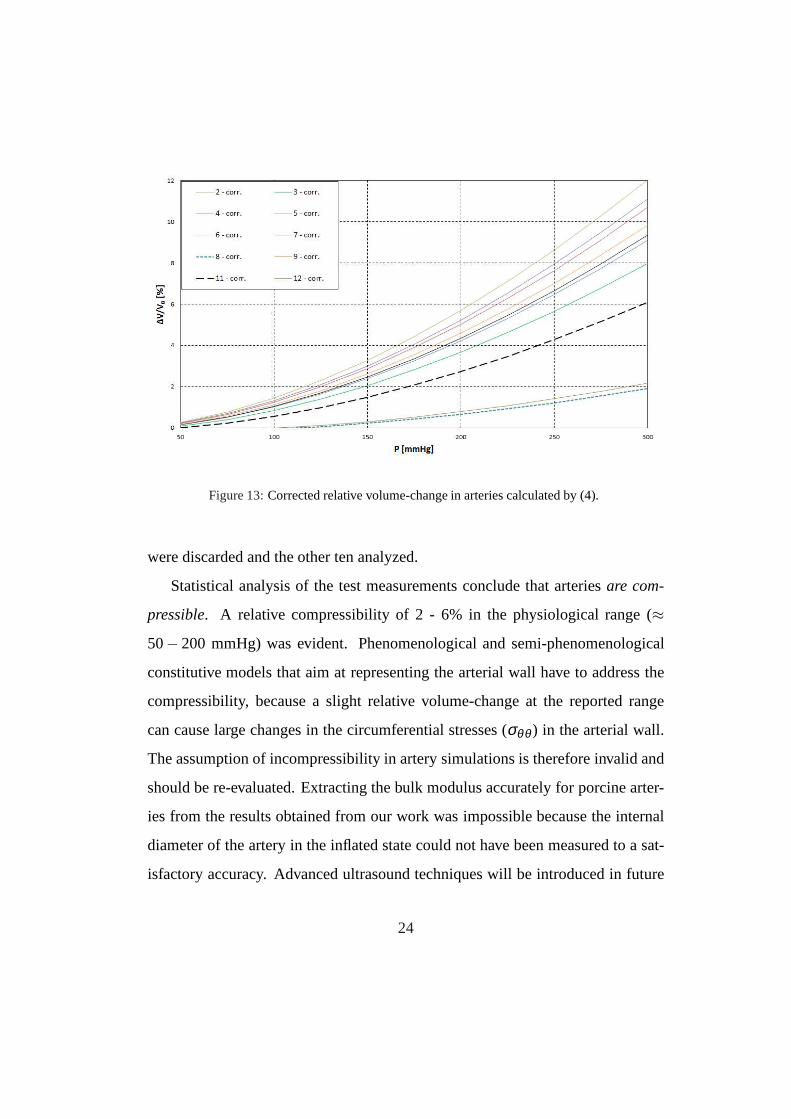
Figure 13:Corrected relative volume-change in arteries calculated by (4).
were discarded and the other ten analyzed.
Statistical analysis of the test measurements conclude that arteriesare com-
pressible. A relative compressibility of 2 - 6% in the physiological range (≈
50− 200 mmHg) was evident. Phenomenological and semi-phenomenological
constitutive models that aim at representing the arterial wall have to address the
compressibility, because a slight relative volume-changeat the reported range
can cause large changes in the circumferential stresses (σθθ ) in the arterial wall.
The assumption of incompressibility in artery simulationsis therefore invalid and
should be re-evaluated. Extracting the bulk modulus accurately for porcine arter-
ies from the results obtained from our work was impossible because the internal
diameter of the artery in the inflated state could not have been measured to a sat-
isfactory accuracy. Advanced ultrasound techniques will be introduced in future
24

experiments to allow the measurement of the artery’s internal diameter with suf-
ficient accuracy to allow the computation of the bulk modulusand its relation to
the shear modulus.
The statistical analysis indicated that artery’s volume (V0) is a significant pa-
rameter correlated to the relative volume change (besides of course the pressure
which is the most significant parameter). Other parameters (initially considered in
our statistical analysis) showed a less significant connection to the relative volume
change. A statistical model with more that one parameter resulted in non signifi-
cant results probably becauseV0 is related already toD0, artery wall thickness and
L.
Figures 11 and 13 show that smaller arteries (with a smallerV0) demonstrate
a significant higher relative volume-change compared to thelarger arteries. This
phenomena may be related to the tissue properties (probablyaffected by the artery’s
dimension). It was anticipated that in larger diameter arteries, higher hoop (or cir-
cumferential) stresses would be obtained for the same internal pressure. As a
result, deformation is larger and the volume-change was anticipated to be larger.
This effect was noticed in rubber tubes but not in artery specimens. A more thor-
ough analysis taking into consideration wall thickness andinternal diameter is
planned to further investigate this issue.
Rubber is considered incompressible since its bulk modulusκ is significantly
larger than the shear modulus. For the relatively low pressures of our experiments
it is reasonable to assume that no measurable volume-changeof the rubber is
obtained. We therefore attribute any measured relative volume-change in the rub-
ber specimens to experimental errors resulting from inaccuracies not considered
(indeed the “relative volume changes” in these tubes was significantly lower com-
25

pared to the arteries). We thus subtracted the predicted relative volume-change in
rubber tubes from the relative volume change of the arteries(equation (4)). As a
result, for two of the arteries a very small negative volume-change was obtained
at the low pressure range, which is clearly an artifact that may be discarded.
Compared to past studies on the topic, the experimental device reported here
and the followed protocol allowed an accurate determination of the relative vol-
ume change in arteries. The statistical analysis substantiated the evidence of
small, but not negligible relative volume-change in arteries at physiological pres-
sures. Hyperelastic constitutive models that are frequently used in the literature
assuming incompressibility of arteries should probably berevisited and predicted
stresses re-examined.
Several limitations are associated with the current study:a) The arteries were
immersed in water and inflated by water instead of a physiological liquid as
Krebs solution [16]. Nevertheless, one additional experiment was performed us-
ing Krebs solution that showed same results as with water. b)Any volume change
in the artery wall as a result of diffusion of liquids in and out of the artery wall
could not have been measured by the presented experimental device, c) The in-
ner diameter of the arteries could not have been measured during inflation by our
experimental device. Thusκ/µ could not be quantified. d) Peak pressures are ob-
served immediately after the quantum process in which we introduceVin into the
artery. Because we only controlVin we could not control the rate of change of pres-
sure. The rate of pressure change in most experiments was about 20mmHg/sec
which is a bit slower than the physiological one which is about 40 mmHg/sec.
Future improvements of the experimental system will consider different pressure
rates.
26
Having demonstrated that the experimental device is precise and small changes
(but yet not negligible) in volume do occur in arteries, a large number of experi-
ments is planned using the device to enable the computation of the material prop-
erties including bulk modulus of a variety of arteries, thusto better estimate the
stress state that develops in artery walls.
AcknowledgementsWe thank the anonymous reviewers for their detailed and
constructive comments. The authors thank M. Neiman and D. Sade from Ben-
Gurion Univeristy for their help with the literature surveyand with the preliminary
steps of the construction of the experimental device. This research was partially
supported by a Grant to ZY from the GIF, the German-Israeli Foundation for
Scientific Research and Development (grant # I-1189-89.2/2012).
27

Conflict of interest None of the authors have any conflict of interest to declare
that could bias the presented work.
References
[1] Bass, L., Yu, D.-Y., L., C., 2009. Comparison of femoral and auricular arte-
rial blood pressure monitoring in pigs 36, 457–463.
[2] Boutouyrie, P., Germain, D., Tropeano, A., Laloux, B., Carenzi, F., Zidi, M.,
Jeunemaitre, X., Laurent, S., 2001. Compressibility of thecarotid artery in
patients with pseudoxanthoma elasticum. J. Hypertens. 38,1181–1184.
[3] Carew, T., Vaishnav, R., Patel, D., 1968. Compressibility of the arterial wall.
Circ. Res. 23, 61–68.
[4] Chesler, N., Thompson-Figueroa, J., Millburne, K., 2004. Measurements of
mouse pulmonary artery biomechanics. Jour. Biomech. Eng. 126, 309–314.
[5] Chuong, C., Fung, Y., 1984. Compressibility and constitutive equation of
arterial wall in radial compression experiments. Jour. Biomech. 17 (1), 35–
40.
[6] Di Puccio, F., Celi, S., Forte, P., 2012. Review of experimental investigations
on compressibility of arteries and introduction of a new apparatus. Experi-
mental Mechanics 52, 895–902.
[7] Dobrin, P., Rovick, A., 1967. Static elastic propertiesof the dog carotid ar-
terial wall. Fed. Proc 26, 1021.
28
[8] Elad, P., October 2011. Investigating passive and active mechanical response
of human artery walls by p-finite element methods. Ph.D. thesis, Ben-Gurion
University.
[9] Faury, G., Maher, G., Li, D., Keating, M., Mecham, R., Boyle, W., 1999.
Relation between outer and luminal diameter incannulated arteries. Am. J.
Physiol. Heart. Circ. Physiol 277, H1745–53.
[10] Girerg, X., Acar, C., Mourad, J., Boutouyrie, P., Safar, M., Laurent, S., 1992.
Incompressibility of the human arterial wall: an in vitro ultrasound study. J.
Hypertens. Suppl 10 (6), S111–S115.
[11] Hannon, J., Bossone, C., Wade, C., 1989. Normal physiological values for
concious pigs used in biomedical research. Tech. rep., Letterman army insti-
tute of research, San Francisco, California 94129.
[12] Holzapfel, G., Gasser, T., Ogden, R., 2000. A new constitutive framework
for arterial wall mechanics and a comparative study of material models. Jour.
Elasticity 61, 1–48.
[13] Holzapfel, G., Ogden, R., 2010. Constitutive modelling of arteries. Proc. R.
Soc. A 466, 1551–1597.
[14] Horgan, C., Murphy, J., 2009. On the volumetric part of strain-energy func-
tions used in the constitutive modeling of slightly compressible solid rubbers
46, 30783085.
[15] Horgan, C., Saccomandi, G., 2003. A description of arterial wall mechan-
ics using limiting chain extensibility constitutive models. Biomechan Model
Mechanobiol 1, 251–266.
29
[16] Krebs, H. A., Henseleit, K., 1932. Untersuchungen uber die harnstoffbildung
im tierkorper. Hoppe-Seyler’s Zeitschrift fur Physiol.Chemie 210, 33–36.
[17] Lawton, R., 1954. The thermoelastic behavior of isolated aortic strip of the
dog. Circ. Res. 2, 344–353.
[18] Misra, J., Chakravarty, S., 1980. Study of incompressibility in vascular rhe-
ology. Rheol Acta 19, 381–388.
[19] Tickner, E., Sacks, A., 1967. A theory for the static elastic behavior of blood
vessels. Biorheology 4, 151–168.
[20] Yosibash, Z., Priel, E., 2011.p-fems for hyperelastic anisotropic nearly in-
compressible materials under finite deformations with applications to arter-
ies simulation. Int. Jour. Num. Meth. Eng. 80, 1152 – 1174.
[21] Yosibash, Z., Priel, E., 2012. Artery active mechanical response: High order
finite element implementation and investigation. Comp. Meth. Appl. Mech.
Eng. 237 - 240, 51 – 66.
30
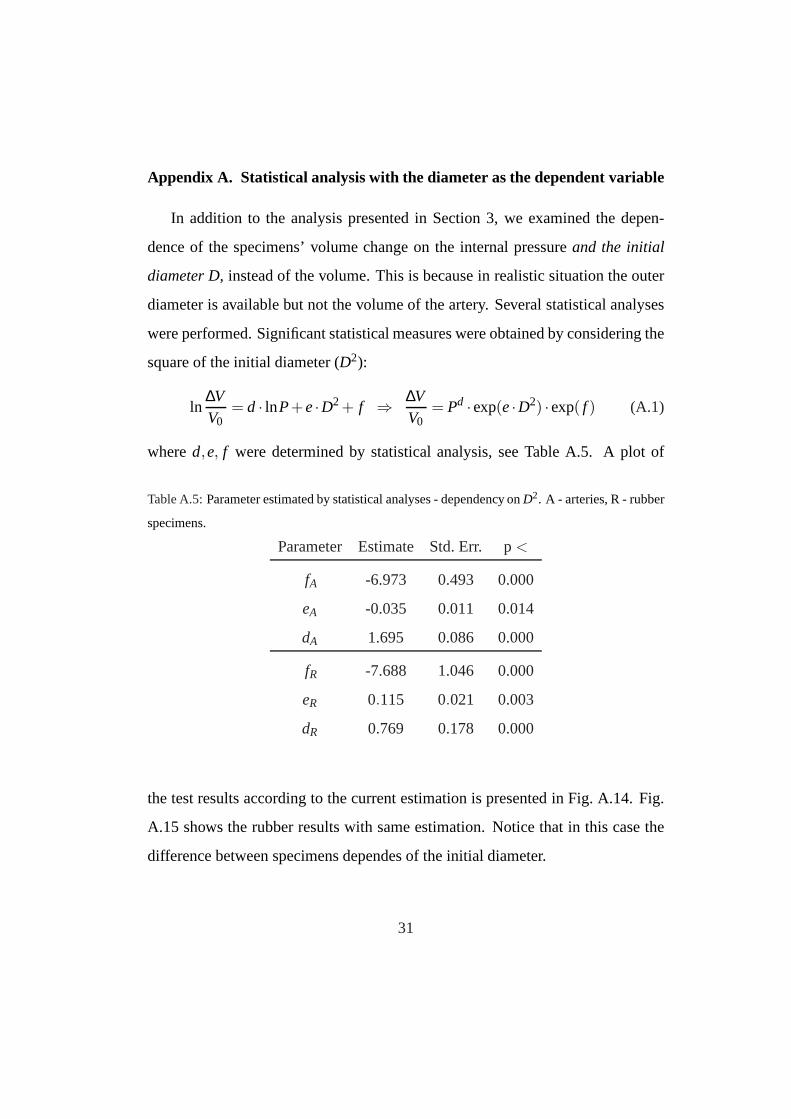
Appendix A. Statistical analysis with the diameter as the dependent variable
In addition to the analysis presented in Section 3, we examined the depen-
dence of the specimens’ volume change on the internal pressure and the initial
diameter D, instead of the volume. This is because in realistic situation the outer
diameter is available but not the volume of the artery. Several statistical analyses
were performed. Significant statistical measures were obtained by considering the
square of the initial diameter (D2):
ln∆VV0
= d · lnP+ e ·D2+ f ⇒∆VV0
= Pd·exp(e ·D2) ·exp( f ) (A.1)
whered,e, f were determined by statistical analysis, see Table A.5. A plot of
Table A.5:Parameter estimated by statistical analyses - dependency on D2. A - arteries, R - rubber
specimens.
Parameter Estimate Std. Err. p<
fA -6.973 0.493 0.000
eA -0.035 0.011 0.014
dA 1.695 0.086 0.000
fR -7.688 1.046 0.000
eR 0.115 0.021 0.003
dR 0.769 0.178 0.000
the test results according to the current estimation is presented in Fig. A.14. Fig.
A.15 shows the rubber results with same estimation. Notice that in this case the
difference between specimens dependes of the initial diameter.
31
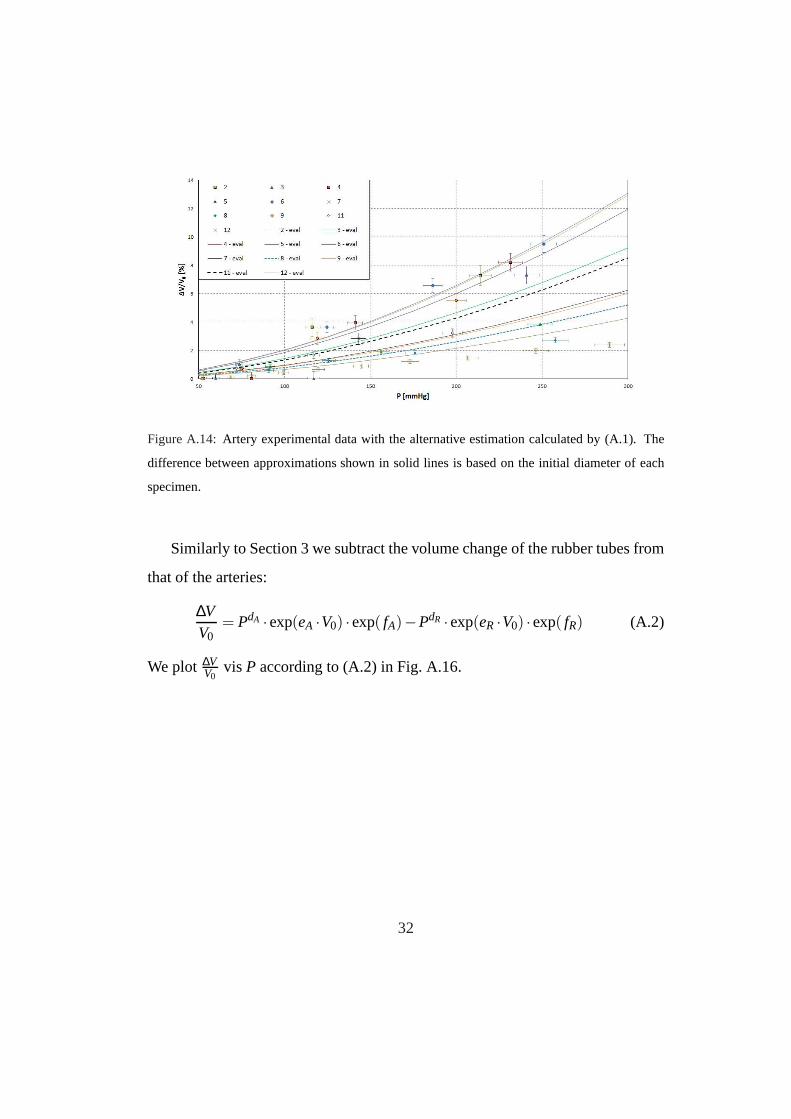
Figure A.14: Artery experimental data with the alternative estimation calculated by (A.1). The
difference between approximations shown in solid lines is based on the initial diameter of each
specimen.
Similarly to Section 3 we subtract the volume change of the rubber tubes from
that of the arteries:
∆VV0
= PdA ·exp(eA ·V0) ·exp( fA)−PdR ·exp(eR ·V0) ·exp( fR) (A.2)
We plot ∆VV0
vis P according to (A.2) in Fig. A.16.
32

Figure A.15:Rubber experimental data with the alternative volume change estimation calculated
by (A.1). The solid lines represent the approximations, notice that some solid lines are correct for
more than one estimation - this is because some rubber specimens were of the same diameter but
had different lengths.
Figure A.16:Alternative corrected relative volume-change in arteriescalculated by (A.2).
33

Appendix B. Experiment Data
Appendix B.1. Excluded arteries
Experiments were conducted on twelve arteries after the experimental device
was thoroughly checked for accuracy. Two arteries were problematic and were
excluded from the statistical analysis. The first excluded artery (spec. no. 1) was
the first experiment we performed in the improved testing device, and the test
protocol was not finalized. The experiment was not repeated more than once and
there is a possibility that a leak was present and was not detected. The second
excluded artery (spec. no. 10) was strangely deformed, leading to difficulty in
determining the accurate initial volume of this specimen. As a result the volume-
change calculated was extreme. In Fig. B.17 we show a photo ofthe the excluded
artery (spec. no. 10). The results from both of excluded experiments are shown in
the next subsection, along with the raw data of all experiments.
Figure B.17: Photo of spec. no. 10 during experiment. The shape of the outer surface is suspicious
and led us to exclude the measurements of this specimen.
Appendix B.2. Raw data
In the following section we present the original calculatedvolume-change as
measured during performed experiments. Tables B.6–B.17 detail the numerical
data for all experiments.
34

Table B.6: Artery results for spec. no. 1
Test # Vin Vext Pin∆VV0
µL µL mmHg %
0 0 36 0
1 20 17.27 134 7.66
40 32.31 382 21.57
Table B.7: Artery results for spec. no. 2
Test # Vin Vext Pin∆VV0
µL µL mmHg %
0 0 53 0
1 5 3.34 116 3.63
10 6.69 214 7.26
15 10.03 346 10.90
35
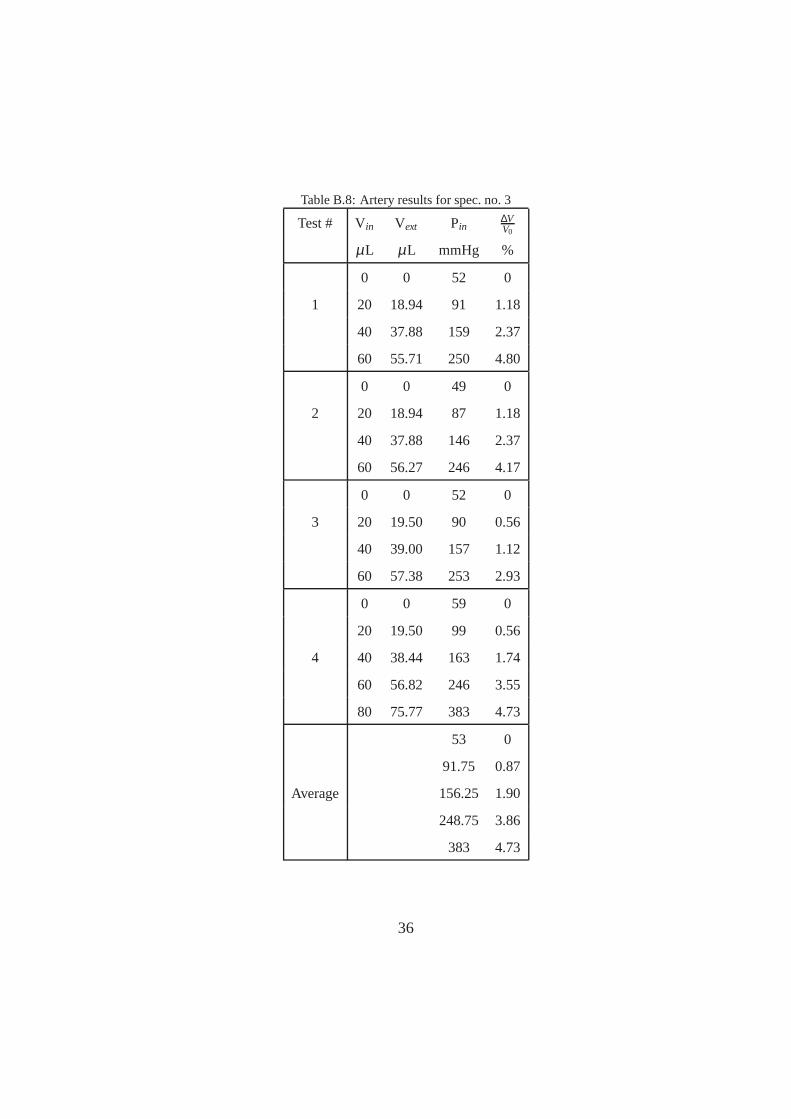
Table B.8: Artery results for spec. no. 3
Test # Vin Vext Pin∆VV0
µL µL mmHg %
0 0 52 0
1 20 18.94 91 1.18
40 37.88 159 2.37
60 55.71 250 4.80
0 0 49 0
2 20 18.94 87 1.18
40 37.88 146 2.37
60 56.27 246 4.17
0 0 52 0
3 20 19.50 90 0.56
40 39.00 157 1.12
60 57.38 253 2.93
0 0 59 0
20 19.50 99 0.56
4 40 38.44 163 1.74
60 56.82 246 3.55
80 75.77 383 4.73
53 0
91.75 0.87
Average 156.25 1.90
248.75 3.86
383 4.73
36
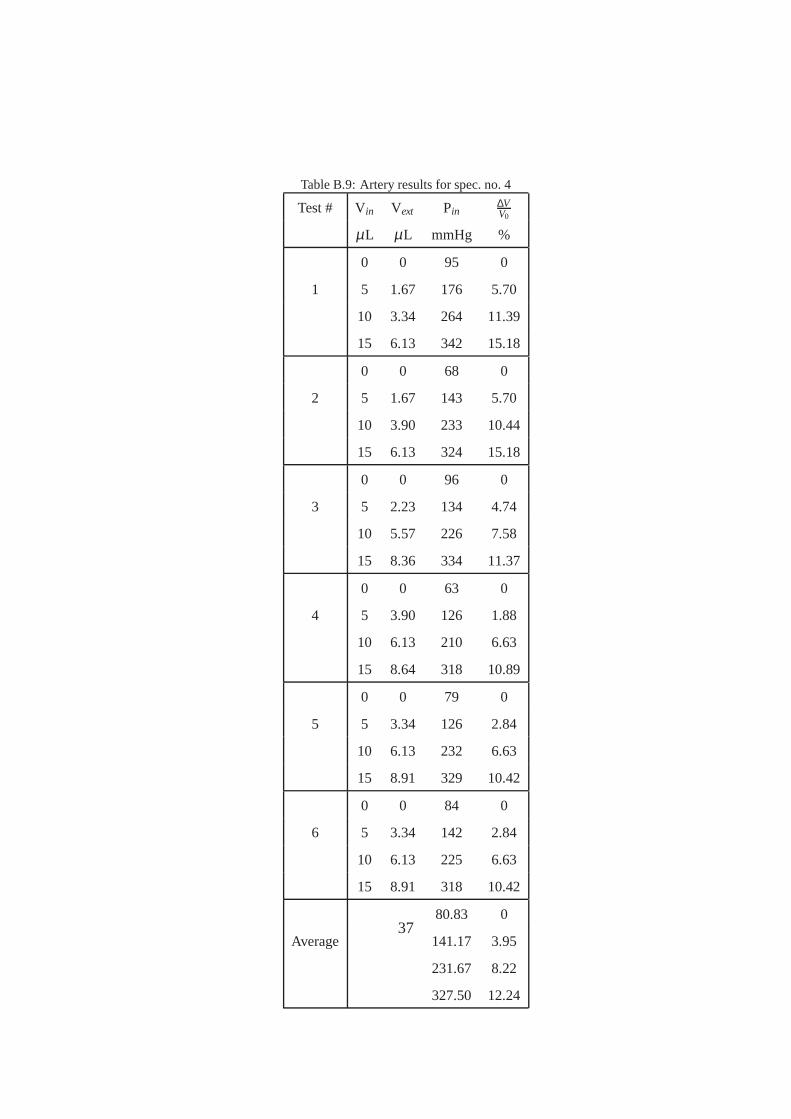
Table B.9: Artery results for spec. no. 4
Test # Vin Vext Pin∆VV0
µL µL mmHg %
0 0 95 0
1 5 1.67 176 5.70
10 3.34 264 11.39
15 6.13 342 15.18
0 0 68 0
2 5 1.67 143 5.70
10 3.90 233 10.44
15 6.13 324 15.18
0 0 96 0
3 5 2.23 134 4.74
10 5.57 226 7.58
15 8.36 334 11.37
0 0 63 0
4 5 3.90 126 1.88
10 6.13 210 6.63
15 8.64 318 10.89
0 0 79 0
5 5 3.34 126 2.84
10 6.13 232 6.63
15 8.91 329 10.42
0 0 84 0
6 5 3.34 142 2.84
10 6.13 225 6.63
15 8.91 318 10.42
80.83 0
Average 141.17 3.95
231.67 8.22
327.50 12.24
37

Table B.10: Artery results for spec. no. 5
Test # Vin Vext Pin∆VV0
µL µL mmHg %
0 0 112 0
1 5 0.56 240 8.18
10 2.51 371 13.79
0 0 127 0
2 5 0.56 248 8.18
10 2.23 383 14.30
0 0 112 0
3 5 1.95 235 5.61
10 3.62 361 11.74
117 0
Average 241 7.32
371.67 13.28
38
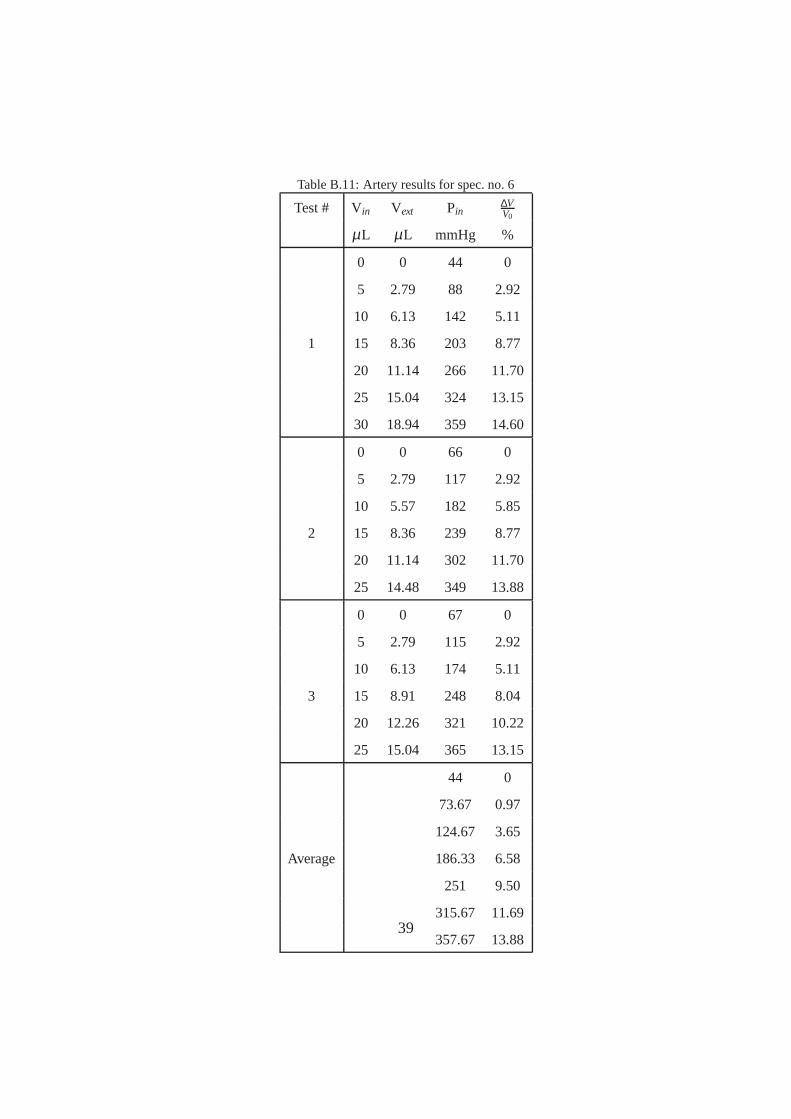
Table B.11: Artery results for spec. no. 6
Test # Vin Vext Pin∆VV0
µL µL mmHg %
0 0 44 0
5 2.79 88 2.92
10 6.13 142 5.11
1 15 8.36 203 8.77
20 11.14 266 11.70
25 15.04 324 13.15
30 18.94 359 14.60
0 0 66 0
5 2.79 117 2.92
10 5.57 182 5.85
2 15 8.36 239 8.77
20 11.14 302 11.70
25 14.48 349 13.88
0 0 67 0
5 2.79 115 2.92
10 6.13 174 5.11
3 15 8.91 248 8.04
20 12.26 321 10.22
25 15.04 365 13.15
44 0
73.67 0.97
124.67 3.65
Average 186.33 6.58
251 9.50
315.67 11.69
357.67 13.8839
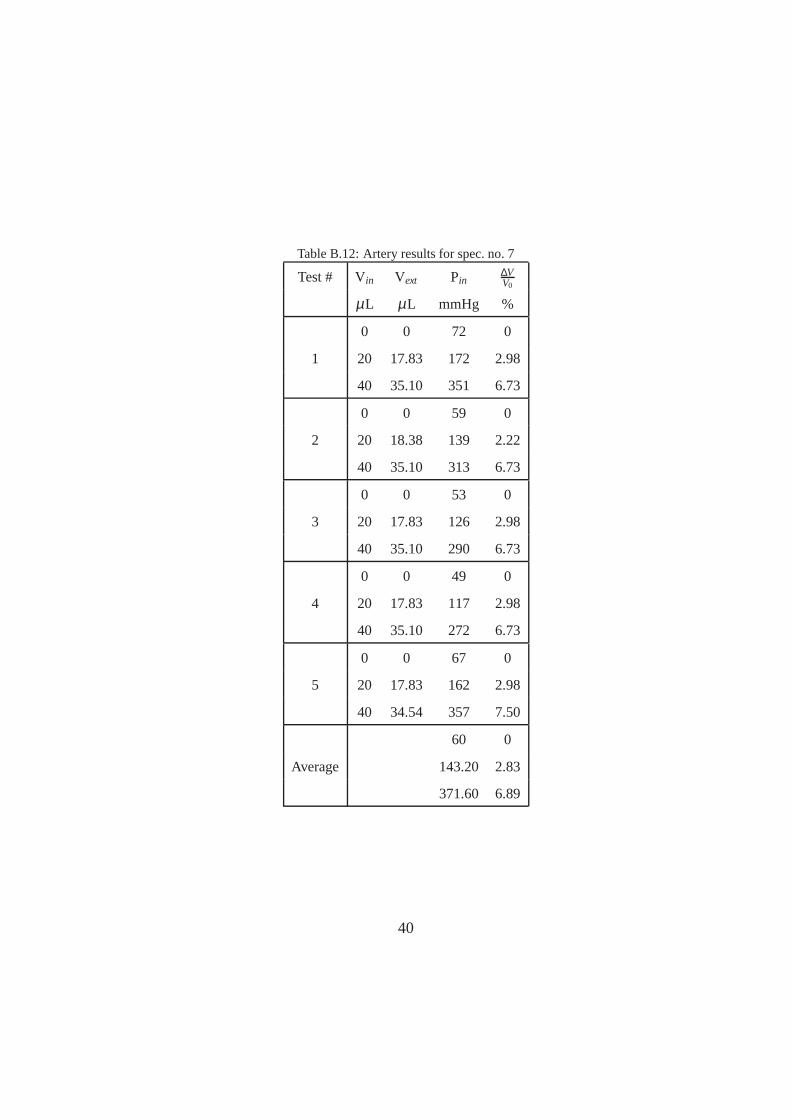
Table B.12: Artery results for spec. no. 7
Test # Vin Vext Pin∆VV0
µL µL mmHg %
0 0 72 0
1 20 17.83 172 2.98
40 35.10 351 6.73
0 0 59 0
2 20 18.38 139 2.22
40 35.10 313 6.73
0 0 53 0
3 20 17.83 126 2.98
40 35.10 290 6.73
0 0 49 0
4 20 17.83 117 2.98
40 35.10 272 6.73
0 0 67 0
5 20 17.83 162 2.98
40 34.54 357 7.50
60 0
Average 143.20 2.83
371.60 6.89
40

Table B.13: Artery results for spec. no. 8
Test # Vin Vext Pin∆VV0
µL µL mmHg %
0 0 63 0
50 49.03 92 0.44
1 100 97.49 127 1.14
150 145.40 175 2.09
200 193.31 253 3.04
250 240.67 345 4.25
0 0 70 0
50 49.03 101 0.44
2 100 96.94 139 1.40
150 144.85 197 2.35
200 192.20 282 3.55
0 0 56 0
3 50 47.91 85 0.95
100 95.26 117 2.16
0 0 49 0
50 48.47 82 0.70
4 100 97.49 116 1.14
150 146.52 156 1.59
200 195.54 229 2.03
250 243.45 333 2.98
0 0 63 0
50 49.03 95 0.44
5 100 98.61 130 0.63
150 147.08 176 1.33
200 194.99 267 2.28
250 242.34 391 3.49
60.20 0
91 0.60
Average 125.80 1.29
176 1.84
257.75 2.73
356.33 3.57
41

Table B.14: Artery results for spec. no. 9
Test # Vin Vext Pin∆VV0
µL µL mmHg %
0 0 52 0
20 19.50 75 0.74
1 40 37.88 117 3.14
60 56.27 193 5.53
80 74.09 335 8.75
0 0 52 0
20 18.94 76 1.57
2 40 37.88 121 3.14
60 55.71 205 6.36
80 72.42 348 11.22
0 0 52 0
20 20.06 75 -0.08
3 40 38.44 119 2.31
60 56.82 202 4.70
80 74.09 344 8.75
52 0
75.33 0.74
Average 119 2.86
200 5.53
342.33 9.57
42
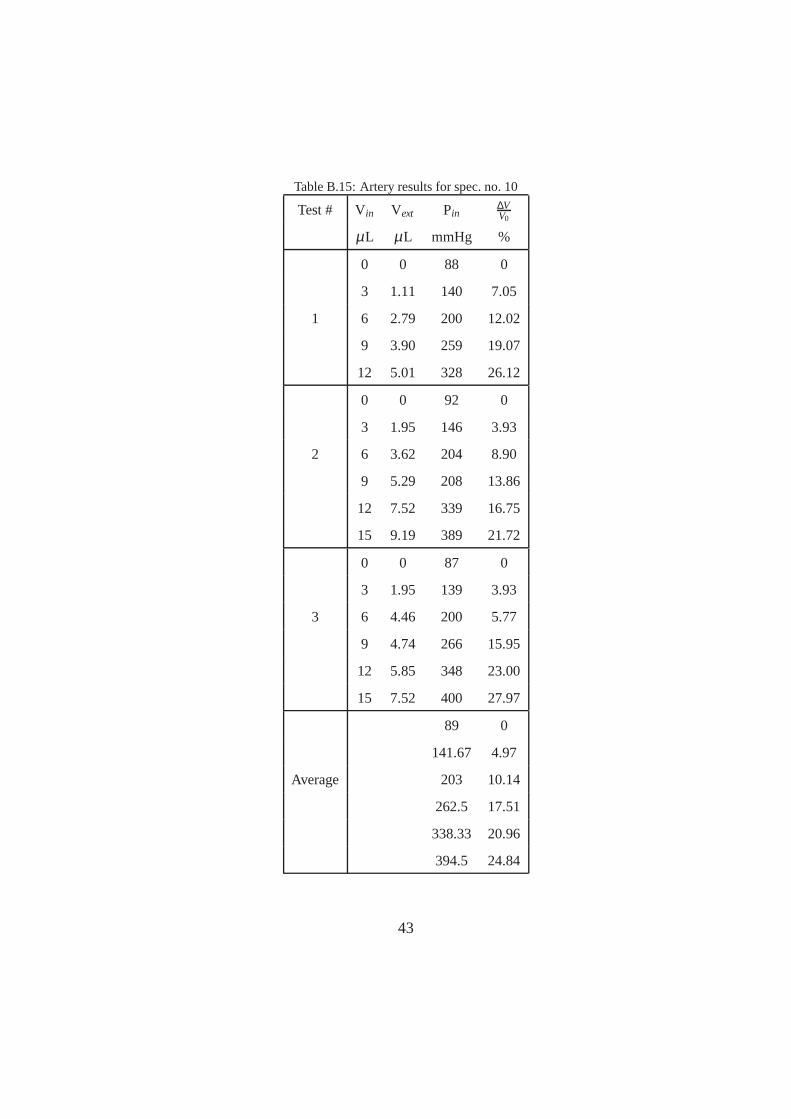
Table B.15: Artery results for spec. no. 10
Test # Vin Vext Pin∆VV0
µL µL mmHg %
0 0 88 0
3 1.11 140 7.05
1 6 2.79 200 12.02
9 3.90 259 19.07
12 5.01 328 26.12
0 0 92 0
3 1.95 146 3.93
2 6 3.62 204 8.90
9 5.29 208 13.86
12 7.52 339 16.75
15 9.19 389 21.72
0 0 87 0
3 1.95 139 3.93
3 6 4.46 200 5.77
9 4.74 266 15.95
12 5.85 348 23.00
15 7.52 400 27.97
89 0
141.67 4.97
Average 203 10.14
262.5 17.51
338.33 20.96
394.5 24.84
43

Table B.16: Artery results for spec. no. 11
Test # Vin Vext Pin∆VV0
µL µL mmHg %
0 0 49 0
15 13.93 76 0.92
1 30 27.30 121 2.31
45 40.11 202 4.19
60 53.48 334 5.58
0 0 44 0
15 13.93 69 0.92
2 30 27.86 111 1.84
45 41.23 187 3.23
60 54.04 308 5.10
0 0 46 0
15 14.48 72 0.44
3 30 28.97 119 0.88
45 42.34 204 2.28
60 54.60 338 4.63
46.33 0
72.33 0.76
Average 117 1.68
197.67 3.23
326.67 5.10
44
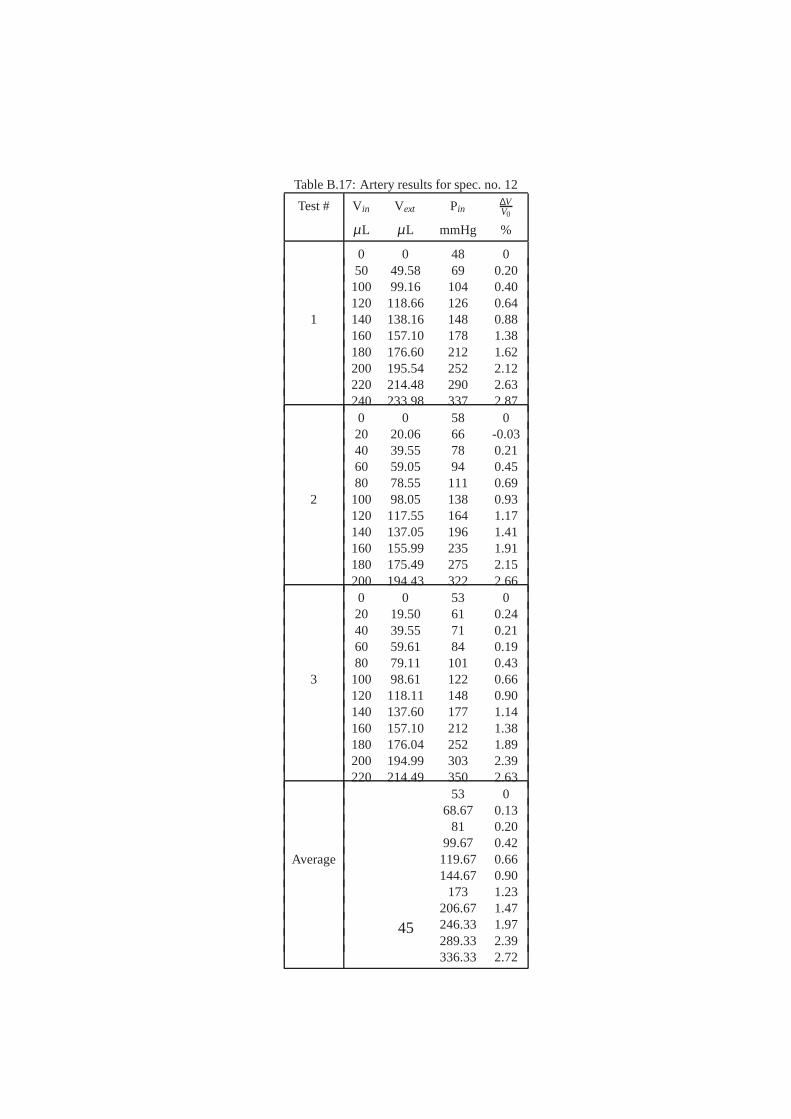
Table B.17: Artery results for spec. no. 12
Test # Vin Vext Pin∆VV0
µL µL mmHg %
0 0 48 050 49.58 69 0.20100 99.16 104 0.40120 118.66 126 0.64
1 140 138.16 148 0.88160 157.10 178 1.38180 176.60 212 1.62200 195.54 252 2.12220 214.48 290 2.63240 233.98 337 2.870 0 58 020 20.06 66 -0.0340 39.55 78 0.2160 59.05 94 0.4580 78.55 111 0.69
2 100 98.05 138 0.93120 117.55 164 1.17140 137.05 196 1.41160 155.99 235 1.91180 175.49 275 2.15200 194.43 322 2.660 0 53 020 19.50 61 0.2440 39.55 71 0.2160 59.61 84 0.1980 79.11 101 0.43
3 100 98.61 122 0.66120 118.11 148 0.90140 137.60 177 1.14160 157.10 212 1.38180 176.04 252 1.89200 194.99 303 2.39220 214.49 350 2.63
53 068.67 0.13
81 0.2099.67 0.42
Average 119.67 0.66144.67 0.90
173 1.23206.67 1.47246.33 1.97289.33 2.39336.33 2.72
45