experimental examination of the benefits of improved
TRANSCRIPT

Spencer et al. - Experimental Examination ofthe BeneJts of Improved Terminal Air 7Taffic Control Planning
separations on the final-approach path. Although the theoretical capacity gain from
precise scheduling of a runway can be deter- mined through calculation, operational consid- erations will affect results during actual use. Therefore, the impact of improved planning and scheduling on a sample of live traffic data re- corded at Boston's Logan Airport was measured.
In the experiment a revised landing schedule was manually produced, and then all the arriv- ing aircraft were relanded by using a simulator. Air traffic controllers with experience in the Boston area assisted in the control of the simu- lated traffic and reviewed the results for opera- tional acceptability. The actual landing rate was then compared with the results of the simula- tion. Because realistic controller interfaces were not available, the study did not explore ways of presenting the plan to controllers or its effect on the controller workload.
Environmental Conditions The traffic data were recorded on 15 Decem-
ber 1987 by the Mode S Experimental Facility (MODSEF) radar beacon interrogator at Lincoln Laboratory. About 70 min of data were recorded, consisting of traffic within 50 nmi of MODSEF, and including Logan Airport and at least a portion of each of the three holding stacks in use at that time.
During the test period, 34 aircraft landed at Logan. At the beginning of data collection, the Logan Automated Terminal Information Service (ATIS) was reporting a 300-ft ceiling, 1/2-nmi visibility, and ice pellets. The wind was 3 knots from 150". By the end of the recording session conditions had improved to a ceiling of 500 ft, broken, with 4-nmi visibility. The wind then was 15 knots from 130". Thus the traffic data were recorded during IMC.
During this time there were active holding stacks at each of the three turbojet entry fixes that feed the terminal area. The capacity of one of the stacks (at Providence, R.I.) was exceeded, and overflow traffic had to be sent to an entry fix over the ocean east of Boston. The stacks kept the aircraft arrival "pipeline" full throughout the measurement. Therefore. excessively large
landing intervals could originate only in the stack or terminal areas and could not result from system-wide flow restrictions or en route delays.
During recording of the live traffic data: There were two runway changes, from run- way 15R to runway 4R and back again. The departure flow was handled largely by a separate, single runway (runway 9) that was largely independent of the landing runways, so that there was negligible in- teraction between departures and arrivals.
Generation of the Revised Schedule
The revised schedule was generated by manually obtaining time-to-fly and speed infor- mation from plots of the 15 December data, and then entering these parameters into a spread- sheet program to produce a revised schedule of landing times. Manual entry of information was used in order to evaluate the benefits of the concept-TATCAwill perform the same analyses in real time.
Standard Traffic Flows
Under the procedures in effect on 15 Decem- ber 1987 [ 1, 21 high-altitude turbojets entered the Boston Terminal Radar Approach Control (TRACON) area (Fig. 1) from one of three fixes. Traffic from the west held at the Gardner (GDM) VOR (VHF Omnidirectional Range-a naviga- tional aid) and entered the TRACON via the LOBBY fix. Traffic from the south held at the Providence (PVD) VOR and entered via the MIXER fm. Oceanic traffic, and some overflow from Providence, held at the SCUPP fuc: over the ocean east of Boston and also entered via that fix. Aircraft arriving via these fixes generally crossed them at 10,000 or 1 1,000 ft, unless their entry point was close enough to the approach for the active runway that a lower altitude had to be assigned.
Low-altitude arrivals were also assigned standard entry points and routes. These aircraft generally entered the TRACON at 4,000 ft via the EXALT, FREDO, WILKI, or LOBBY fixes, or over
The Lincoln Luboratoy Journal, Volume 2, Number 3 (1 989)

Spencer et al. - Experimental Examination of the Benefits of Improved Terminal Air 7 T a . Control Planning
TRACON Area Altitudes A: At and below 14,000 B: At and below 5000 C: At and below 3000 D: At and below 10,000 E : 5000-1 0,000 F: 8000-1 0,000
I) Descent Zones
Fig. 1-Boston TRACON. Descent zones and localizer paths for runways 4R and 15R are shown.
the Lawrence (LWM) VOR. A composite of the paths for the 34 aircraft
arriving in Boston during the 15 December data- taking session is shown in Fig. 2. The photo- graph shows the actual approach paths and holding stacks.
Initial Aircraft
The first runway change (fi-om runway 15R to runway 4R) occurred shortly after the start of the measurement. The seven aircraft that landed on 15R were not rescheduled (see Fig. 3).
Fig. 2-Composite of arrival paths during data-recording period on 15 December 1987. Fig. 3-Initial seven aircraft landing on runway 15R.
?he Lincoln Laboratory Journal. Volume 2. Number 3 (1 989)
Spencer et al. - Experimental Examination of the Bene3ts of Improved Terminal Air Tram Control Planning
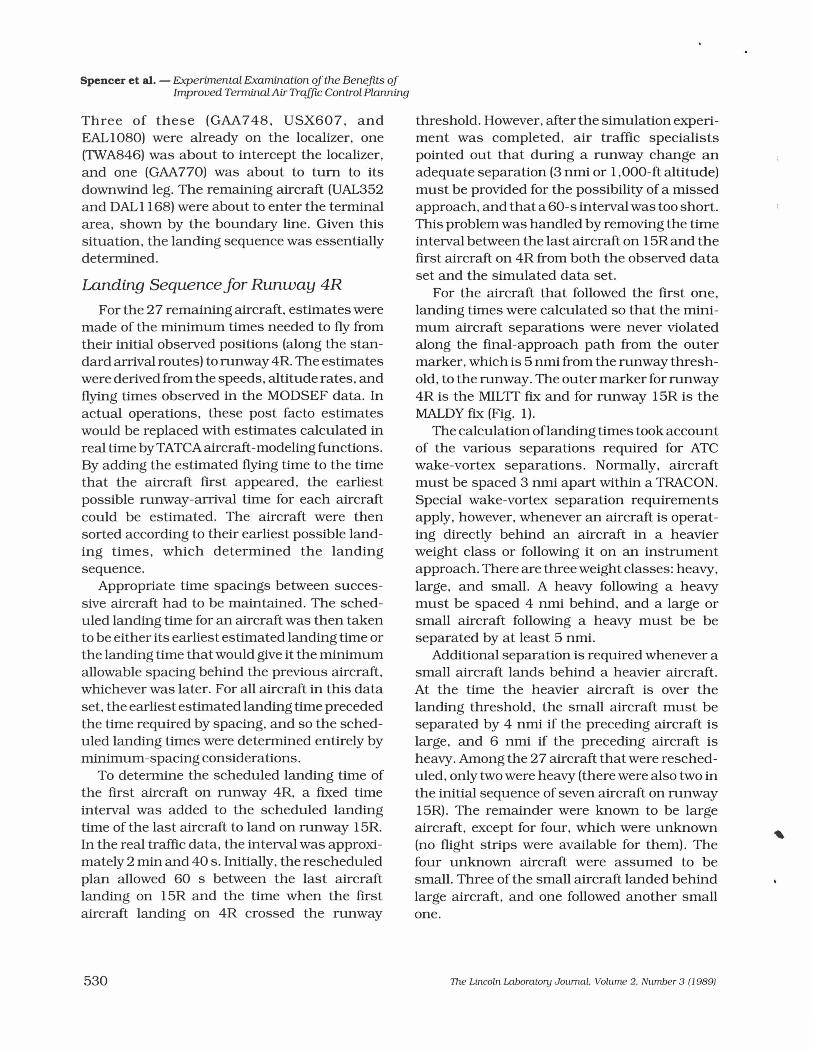
Three of these (GAA748, USX607, and EAL1080) were already on the localizer, one (TWA846) was about to intercept the localizer, and one (GAA770) was about to turn to its downwind leg. The remaining aircraft (UAL352 and DAL1168) were about to enter the terminal area, shown by the boundary line. Given this situation, the landing sequence was essentially determined.
Landing Sequence for Runway 4R
For the 27 remaining aircraft, estimates were made of the minimum times needed to fly from their initial observed positions (along the stan- dard arrival routes) to runway 4R. The estimates were derived from the speeds, altitude rates, and flying times observed in the MODSEF data. In actual operations, these post facto estimates would be replaced with estimates calculated in real time by TATCA aircraft-modeling functions. By adding the estimated flying time to the time that the aircraft first appeared, the earliest possible runway-arrival time for each aircraft could be estimated. The aircraft were then sorted according to their earliest possible land- ing times, which determined the landing sequence.
Appropriate time spacings between succes- sive aircraft had to be maintained. The sched- uled landing time for an aircraft was then taken to be either its earliest estimated landing time or the landing time that would give it the minimum allowable spacing behind the previous aircraft, whichever was later. For all aircraft in this data set, the earliest estimated landing time preceded the time required by spacing, and so the sched- uled landing times were determined entirely by minimum- spacing considerations.
To determine the scheduled landing time of the first aircraft on runway 4R, a fixed time interval was added to the scheduled landing time of the last aircraft to land on runway 15R. In the real traffic data, the interval was approxi- mately 2 min and 40 s. Initially, the rescheduled plan allowed 60 s between the last aircraft landing on 15R and the time when the first aircraft landing on 4R crossed the runway
threshold. However, after the simulation experi- ment was completed, air traffic specialists pointed out that during a runway change an adequate separation (3 nrni or 1,000-ft altitude) must be provided for the possibility of a missed approach, and that a 60-s interval was too short. This problem was handled by removing the time interval between the last aircraft on 15R and the first aircraft on 4R from both the observed data set and the simulated data set.
For the aircraft that followed the first one, landing times were calculated so that the mini- mum aircraft separations were never violated along the final-approach path from the outer marker, which is 5 nrni from the runway thresh- old, to the runway. The outer marker for runway 4R is the MILTT fix and for runway 15R is the MALDY fix (Fig. 1).
The calculation of landing times took account of the various separations required for ATC wake-vortex separations. Normally, aircraft must be spaced 3 nrni apart within a TRACON. Special wake-vortex separation requirements apply, however, whenever an aircraft is operat- ing directly behind an aircraft in a heavier weight class or following it on an instrument approach. There are three weight classes: heavy, large, and small. A heavy following a heavy must be spaced 4 nrni behind, and a large or small aircraft following a heavy must be be separated by at least 5 nmi.
Additional separation is required whenever a small aircraft lands behind a heavier aircraft. At the time the heavier aircraft is over the landing threshold, the small aircraft must be separated by 4 nrni if the preceding aircraft is large, and 6 nrni if the preceding aircraft is heavy. Among the 27 aircraft that were resched- uled, only two were heavy (there were also two in the initial sequence of seven aircraft on runway 15R). The remainder were known to be large aircraft, except for four, which were unknown (no flight strips were available for them). The four unknown aircraft were assumed to be small. Three of the small aircraft landed behind large aircraft, and one followed another small one.
The Lincoln Laboratory Journal, Volume 2, Number 3 (1 989)

Spencer et al. -Experimental Examination ofthe BeneJts of Improved Terminal Air Traflc Control Planning
Fix Departure Time
A fix departure time was calculated for each aircraft, to indicate when it should leave its holding fix. This time was obtained by sub- tracting the fix-to-runway flying time from the scheduled landing time.
Since the low-altitude aircraft often didn't cross a defined entry fx, the time-to-fly could not be measured. Instead, a required delay was calculated by subtracting the earliest estimated landing time from the scheduled landing time. In the simulation, the fix departure time for these aircraft was determined by adding the required delay to the time when each aircraft first reached its desired holding fx.
The Simulation To demonstrate that the schedule could be
implemented without violating any ATC proce- dures, the landing schedule was tested in a simulation. The air traffic simulation program was one that accepted manual input of ATC clearances. The program ran on a Syrnbolics 3670 computer. Aircraft clearances were deter- mined while the simulation ran, and also re- corded in a script that could be followed auto- matically on subsequent simulation runs. Thus repeated runs could be made, each time improving clearances that had not worked out properly, but preserving those actions which had been successful.
We could stop the simulation and continue from the same point, so that decision making and clearance entry (via keyboard and mouse) did not have to be performed in real time. Generation of clearances for all aircraft in a reasonable period of time required three people, including a former air traffic controller familiar with Boston TRACON operations. Appropriate ATC procedures, as defined by Refs. 1 through 4 and the appropriate Boston approach plates (Fig. 4), were followed throughout. The actual procedures in use were also verified by checking the MODSEF data.
Initialization of Aircraft
All simulated aircraft were initialized to ap-
pear at the same points as the corresponding real aircraft, with the same initial speeds and headings. Most aircraft appeared at the point where they were entering their holding stacks, and the simulated aircraft entered the stack in the same way. Several aircraft in the MODSEF data flew past Providence to the stack at SCUPP, probably because the Providence stack had filled. In the simulation the corresponding air- craft were made to do the same, and the speeds and altitude rates were matched to ensure that stack entry times and altitudes corresponded to the real data.
Holding Procedures
Once each simulated aircraft arrived in its assigned stack, it did not follow the path of the real aircraft. This was felt to be unnecessary for the purposes of the simulation. The five aircraft initially in the Providence stack, however, were made to match the actual flight paths in the stack quite closely, in part to demonstrate that the simulator was accurately simulating aircraft behavior.
The remaining aircraft were held according to the Ainnan's Information Manual (AIM) stan- dard procedures [4]. The four small aircraft in low-altitude stacks were held at speeds corre- sponding to those of the real aircraft, if known, or were assigned the holding speeds for propel- ler aircraft from the AIM (1 75 knots). Rather than rigorous adherence to the AIM'S instruc- tions for the length of inbound/outbound legs, the overall stack length was made to conform approximately to the observed stack size, if known. Aircraft were issued altitude clearances that kept them at least 1,000 ft apart at all times.
The initial goal was to bring aircraft out of the stacks very close to their scheduled fix depar- ture time. However, this procedure didn't pro- vide sufficient slack time to allow for the path variations needed to adjust aircraft spacing. To account for this effect, aircraft were maneuvered so that they crossed their entry fix prior to the scheduled fix crossing time, normally by 30 to 60 s, but sometimes as much as 120 s early. This strategy is known as delay discounting. (Ref. 5 uses this term in reference to delays
The Lincoln Laboratory Journal, Volume 2, Number 3 (1 989)

Spencer et al. - Experimental Examination ofthe Benefits of Improved Terminal Air Tta@ Control Planning
hdtl W 1 4
11s RW 4R K#tON,GENERN EDWARD U W I E N C E w O N A N ~ AL-58 ( F M )
Fig. 4--Approach plate for Boston's runway 4 R.
I l j l 9 1- 1.8 DME
GS 3.00. TCH 47.
SIU 47m- b . -- CAT€- A I B 1 c D
218/20 S-WS 4~ 218/18 xX,cxWZhi 100 W*)
S-LOC @ 4 M / 2 4 m (so@ b ) u0,rg411tYXLGI FAF & I Rwys U ond 27 '
620-1 %r 620-2 \ I ~ L , C L R\*r, a, 15R 9 j ClRCl- 62G1 ad 331 a (-1 H ) I a (-2) , A hm RT ln.33R i
App00& minerno rhtn comrol- re- roll vessels on oppooch or- ; HRL Rwyi 41.22R. 4~.2211
taken in en route airspace in order to meet a metering Ax time; Ref. 6 uses a strategy much like that applied in this simulation but with- out giving it any special name.) Providence air- craft, which generally already had the prob- lem of being ahead of schedule in the TRACON, were left crossing their entry fix close to
s - K s ~ ~ * - I 359/5034l(.OO-I) 4aOLM 422 (500-1) SLOC @ - = I
their scheduled time.
. ' 15R.331 ond 9.27 ; i
FAF co MAP 5.1 NM
Separation Requirements
.X ' T ~ ~ ~ T E F I 120 1120; 1507180;
SO6 1 t 2 4 1 233 ( 2-0211r2
ILS RWY 4R 42-2zwt *OOW ) Q I T o N , M A U A m
bOSTONGENERA1 EDWAm U W E N C E LOGAN INTL (ROSI
While aircraft are under the control of the en route center, the required separations are 5 nmi horizontally or 1.000 ft vertically. (Above Flight
The Lincoln Laboratory Journal, Volume 2, Number 3 (1 989)

Spencer et al. - Experimental Examination ofthe BeneBts of Improved Terminal Air Ikafli Control Planning
Level 290-approximately 29,000 ft-a 2,000-ft vertical separation is required.) These condi- tions were easily maintained in the stacks, and the few aircraft that flew to SCUPP from Provi- dence had longitudinal separations well in ex- cess of 5 nmi.
Within the TRACON, 3-nmi radar separation or 1,000-ft altitude separation was required. This requirement was usually easy to satisfjr up to the point where the streams of traffic from the various fixes merged. The aircraft from any given fix usually had large longitudinal separations.
The one problem with aircraft separation occurred in the Providence stack, because the first four aircraft were scheduled to leave the holding fm very close together. The resulting spacings were exactly 5 nrni. Even though this satisfied the en route constraint, and exceeded the TRACON requirements initially, problems arose as the leading aircraft slowed down during their descent, and also as the simulation con- trollers issued speed reductions. To avoid sepa- ration problems on the localizer, several of the Providence aircraft were flown over delaying paths at entry to the TRACON, which increased their initial longitudinal separations.
In those areas where traffic streams merged, altitude separation techniques were occasion-
Fig. 5--Situation at the time when air traffic controllers announced the second runway change.
?he Lincoln Laboratory Journal, Volume 2, Number 3 (1 989)
ally used to maintain separation until the merge was completed and the planned sequence es- tablished. This use of altitude separation techniques did not appear to introduce any problems.
Second Runway Change
The time at which the second runway change (back to runway 15R) was announced was ob- tained from an audio recording. The announce- ment occurred approximately 1 1 rnin before the first aircraft landed on the new runway. Figure 5 shows the situation at that time. When the runway change was announced, all of the remaining aircraft in the study were in the TRACON. A plan for the runway change was then devised. Because of the small number of aircraft remaining, no scheduling aid was used.
Three aircraft were already in the vicinity of runway 15R and they were chosen to be the first to land. ATL405 was a low-altitude arrival and could easily be sent around to intercept the 15R localizer from the right (southwest) side, landing first. COA96 and TWA8 10 required more time and space to make their descents and speed reductions. They were therefore kept in their sequence, sent over the 15R approach, and then put on a downwind leg on the northeast side of the localizer.
UAL898 and EAL644 were approaching run- way 4R from Providence. They could either land on 4R before ATL405 landed on 15R, or ap- proach 15R behind TWA8 10. Neither had yet descended below the minimum allowable alti- tude of 6,000 ft outside the descent zone, and so they could be held at or above 6,000 ft and moved to the 15R descent zone. Moreover, land- ing the two aircraft on 4R would have required finding a way to delay them while other aircraft landed, and would then have delayed the land- ing of ATL405, because the simulation control- ler had fallen approximately 2 min behind the planned schedule at this point. Unlike a real- time TATCA system, the simulated schedule did not adapt to this condition. Because of these potential problems, both aircraft were assigned to 15R.
A scheduling aid such as TATCA would have

Spencer et al. -Experimental Examination of the BeneJts of Improved Terminal Air Ikafic Control Planning
Fig. 6-Composite of paths for the 34 simulated arrivals.
been able to predict whether A m 0 5 would have been delayed under various circumstances. In the original data, there was a gap of 5 min between the last landing on runway 4R and the first one on 15R; in the simulation the gap was only 2 min and 48 s. Yet even that gap may have been long enough that a scheduling aid might have decided to land UAL898 on 4R and send E m 4 4 to 15R. However, that decision could have caused a gap on 15Runtil EAL644 arrived.
An even better procedure might have been to take the aircraft out of order, landing EAL644 on 4R in UAL898's slot and sending UAL898 to 15R. This would require a scheduler that could optimize the choice of runways when two run- ways are available. None of these alternatives have been investigated in simulation. Also, no attempt was made to account for aircraft that followed the 34 in the study. The later aircraft could have affected the choices at the time of the runway change, because some of them might have been able to reach runway 15R before any of the aircraft in the simulation.
Because the time interval between the last simulated landing on 4R and the first one on 15R was larger during the second runway change than the first, the rule for separation of aircraft during a possible missed approach did not affect the results. The time interval of 2:48 was there- fore retained in the analysis data.
Results Figure 6 shows a composite of the paths of all
34 simulated aircraft. These results should be compared with the paths of the real aircraft, which were presented in Fig. 2. In general, the scheduling procedure appeared to work well- the overall landing rate was 34 aircraft per hour, a throughput increase of 13%.
The difference between the outer-marker crossing times observed in the original data and the outer-marker crossing times of the simu- lated aircraft gave an average flying time saved per aircraft of 236 s. Much of the time saved was due to one aircraft, PBA3516, which was de- layed by an unusual amount in the real data. But even if that aircraft were removed from the sample, the average time saving would still be 170 s per aircraft.
As shown in Fig. 7, only eight of the 34 aircraft landed later in the simulation than they did in the original data; 19 aircraft arrived earlier. By the time the 27th aircraft landed, enough time savings had accumulated that all subsequent simulated aircraft landed earlier than the corresponding real aircraft.
The 13% improvement was achieved despite the approximate nature of the time-to-fly esti- mates and the landing-time-interval calcula- tions, despite the fact that the schedule was not dynamically updated in response to events, despite not being able to affect the schedule for
First Runway Second Runway 1000 1 Change Change I
Second-Degree " I 0 -2000 1 Polynomial Curve Fit I -2500 I I I I I I @ I
0 5 10 15 20 25 30 35 Position in Original Landing Sequence
Fig. 7-Delay change after resequencing as a function of position in original landing sequence.
The Lincoln Laboratory Journal, Volume 2, Number 3 (1 9891

Spencer et al. -Experimental Examination of the Benefrts of Improved Terminal Air 7Ya.c Control Planning
the first seven aircraft, and despite the final- approach spacings planned by the scheduler not actually being achieved. Except for the prob- lem in scheduling of the first runway change, the schedule was implemented without violating any aircraft separation standards or other ATC rules and standard operating procedures.
During the simulation, it was noted that minor course adjustments and minor timing adjustments frequently caused significant spacing changes. For example, shortening a downwind leg by 10 s normally shortens the final by an additional 10 s. For a ground speed of 170 knots, the 20-s reduction would result in just under a 1-nmi difference in the position of the aircraft on final approach. This sensitivity made it difficult to achieve the minimum spac- ings assumed by the planned schedule.
In general, spacings within 1 nmi of the minimum were obtained during the simulation. During the data analysis the distribution of spacings achieved by the real controllers were compared with those achieved by the experi- menters. The distributions were quite similar, but many of the very large separations seen in the real data were greatly reduced in the simu- lation because of the improved metering of air- craft over the TRACON entry fixes.
Because minimum spacings were not achieved, the simulated landing times gradually slipped further behind the ideal scheduled times, falling approximately 2 min behind at the time of the second runway change. If the sched- uled landing times had been maintained, UAL898 and EAL644, the last two Rovidence aircraft and the last two simulated aircraft to land, would both have landed on runway 4R well before the time that ATL405 landed on run- way 15R. Thus it would not have been neces- sary to send them around to runway 15R, which would have improved the results by an addi- tional 27 1 s and given an overall 23% improve-
ment in the landing rate relative to the one actually measured on 15 December 1987.
Conclusions This study has demonstrated that significant
capacity benefits can be achieved in the current ATC system by more precisely controlling the timing of traffic flow, even while airspace usage and procedures remain fixed. The TATCA pro- gram will now pursue an intensive effort to address the human-factor and detailed algo- rithm-design issues that must be resolved be- fore the planning system can be placed into operation. This effort will be carried out in a simulation environment, with realis tic dis- plays and a real-time version of the planning algorithms.
Acknowledgments Dr. Steven Boswell of Lincoln Laboratory
assisted in analyzing the data from this experi- ment. James Sturdy of Lincoln Laboratory and Tom Moody of UFA, Inc. spent many hours controlling simulated traffic. This work was supported by the FAA.
References 1. Boston Center/Boston Tower Letter of Agreement, 4
June 1987. 2. Standard Operating Procedures, Boston Air Traffic Con-
trol Tower (ATCT) (1 Dec. 1987). BOS lWR 7 1 10.35F. Boston ATCT.
3. Air Trap= Control, Order 71 10.65E, Department of Transportation, Federal Aviation Administration (9 Apr. 1987).
4. Airman's Information Manual, Department of Transpor- tation, Federal Aviation Administration. Updated ver- sions are issued several times a year.
5. L. Credeur and W.R. Capron, "Simulation Evaluation of TIMER, A Time-Based, Terminal Air Traffic, Flow-Man- agement Concept," NASA Technical Paper 2870 (Feb. 1989).
6. B.G. Sokkappa, "A System Concept of Metering and Spacing," Proc. 22nd Annual Mtg. Air Traff? Control Assoc., 1 0-1 3 Oct. 1 977.
The Lincoln Laboratory Journal, Volume 2, Number 3 (1 989)

Spencer et al. - Experimental Examhation of the Benem of Improved Terminal Air lYaf%c Control Planning
DAVID A. SPENCER is a senior staff member of the System Design and Evalu- ation Group a t Lincoln Laboratory. His focus of re- ' L search has been in com-
puter software systems related to air traffic control. Dave received a B.S.E. in electrical engineering from Princeton University, and an E.E. and S.M. in electrical engineering and computer science from MIT.
JERRY D. WELCH received anS.B. andS.M. inelectrical engineering from MIT and a Ph.D. in electrical engineer- ing from Northeastern Uni- versity. After joining Lincoln
Laboratory in 1962, Jerry worked on laser radars, igtegrated microwave receiver circuits, and microwave semiconductor devices. In 1970 he was part of the team that initiated the de- velopment of the FAA's Mode SAir Traffic Control Radar Bea- con System (ATCRBS). After the Mode S design was com- pleted in 1975, he began work on the Traffic Alert and Collision Avoidance System (TCAS), and became leader of the Laboratory's program to develop surveillance techniques for air-to-air, beacon-based collision avoidance. In 1987 he became manager of the Terminal Air Traffic ControlAutoma- tion (TATCA) Program at the Laboratory. Jerry is a member of IEEE, AIAA, and ATCA.
JOHN W. ANDREWS is an assistant group leader in the System Design and Evalu- ation Group and is currently responsible for technical management of the Termi-
nal Air Tramc Control Automation (TATCA) Program. For 14 years, he was involved in the development of collision avoidance systems. His work on the Traffic Alert and Colli- sion Avoidance System (TCAS) resulted in contributions to aircraft altitude tracking techniques, analysis of computer logic, human-subject flight testing, and the analysis of pilot visual acquisition performance. John has served as a con- sultant to the National Transportation T r d c Board in the investigation of midair collisions, including the Cerritos accident. He has a B.S. degree in physics from the Georgia Institute ofTechnology, and an S.M. degree in aeronautical engineering from MIT.
lhe Lincoln Laboratory Journal, Volume 2, Number 3 (1 989)