experimental investigation of a photovoltaic thermal
TRANSCRIPT

1
Experimental investigation of a photovoltaic thermal collector with energy storage for
power generation, building heating and natural ventilation
Guohui Gan and Yetao Xiang
Department of Architecture and Built Environment, University of Nottingham, University
Park, Nottingham NG7 2RD, UK
Corresponding author: Guohui Gan
Email: [email protected]; Tel. +44 115 9514876

2
Abstract
A phase change material (PCM) can be used for thermal management of photovoltaics and
thermal energy storage. This paper presents a photovoltaic thermal (PVT) system integrated
with a PCM as a thermal storage medium for managing the photovoltaic temperature and
together with a ventilation duct for preheating supply air or natural ventilation of a building.
The novelty of the integrated PVT/PCM system lies in using the PCM as a passive technique
not only for PV cooling but also for building heating and ventilation. Experiments have been
carried out on a prototype PVT system for different sizes of PCM. The results show that a 30
mm thick PCM layer with a phase change temperature of 25ºC can maintain the PV temperature
below 45oC and improve the PV electrical efficiency by 10% for about 210 minutes under 600
W/m2 insolation. Increasing the PCM thickness by 10 mm increases the time for thermal
control by 60 to 70 minutes. The PVT/PCM system is able to generate a 15 L/s ventilation rate
in a vertical duct of 1100 mm wide, 1200 mm high and 100 mm deep during the melting phase
and at least 20 L/s during the solidification phase. Use of metal fins to enhance heat transfer in
the PCM can increase the PV electrical efficiency further by 3% and the ventilation rate by
30%.
Keywords
Photovoltaics, solar absorber, phase change material, energy storage, thermal management,
natural ventilation
1. Introduction
Solar energy has been widely utilised for electricity generation and passive heating, cooling
and ventilation of buildings as well as for other applications. The most widely used technology
that converts solar energy into electricity is photovoltaic (PV) and crystalline silicon is the most
common PV material. The electrical conversion efficiency of a crystalline PV cell decreases
with increasing temperature. To increase the electrical efficiency, excess heat absorbed by the
PV cells needs to be removed. One way to remove and then make use of the excess heat is
combining the PV with solar thermal to form a photovoltaic thermal (PVT) system. A PVT
system is a solar collector that consists of a photovoltaic module as the thermal absorber
coupled with a heat extraction mechanism through air or water to harvest both electrical and
thermal energy. A building integrated PVT (BIPVT for short) is usually designed as a wall- or
roof-mounted PV array with an air gap on the backside as a heat extraction duct through which
heat from the PV is delivered to the building directly during the daytime or stored in a thermal

3
mass medium for use in the night time. A phase change material (PCM) is able to store a large
amount of thermal energy as latent heat at a temperature of phase change. It can also be used
for thermal management of PV.
Extensive research and development of the PVT and BIPVT as well as integration with the
PCM have been carried out in recent years. For simple PVT systems that are designed as a
form of conventional solar thermal collector, water is often used as a heat transfer medium.
Zondag et al. [1] investigated seven different water-based PVT collectors and indicated that
the total efficiency for all types of PVT exceeded 50%. A simulation of hybrid PVT systems
for domestic hot water applications by Kalogirou and Tripanagnostopoulos [2] showed that the
economic viability could be enhanced where there would be a need for both hot water and
electricity.
A PVT system using air as a heat transfer medium can be designed as a conventional air-based
solar collector [3, 4] or as part of a building envelope, i.e., BIPVT. The performance of a
BIPVT system depends on the efficiency of heat transfer to air and varies widely from 14% to
60% [5]. The heated air can be used directly to meet part of the ambient heating demand, to
heat water through a heat exchanger, or to assist natural convection for better building
ventilation. There are different types and structures of BIPVT and one of them is represented
by a double-skin PV façade. However, such a BIPVT structure could lead to a high temperature
in the façade and possible overheating of the building during the hot period without adequate
façade ventilation and internal solar shading [6]. Anderson et al. [7] analysed the design of a
BIPVT collector with fins and their results showed that both the electrical and thermal
efficiencies were greatly affected by the fin efficiency and thermal conductivity between PV
cells and their supporting structures as well as lamination methods. Zogou and Stapountzis [8]
investigated a PVT façade using a combination of flow visualisation and hot wire anemometry
measurements to enhance the understanding of flow and turbulence inside the façade with
natural and forced convection modes. It was demonstrated that the flow rate and heat transfer
characteristics were critical to the performance of the PV façade.
Use of PCMs to control PV temperatures has been studied by many researchers in order to
increase the electrical conversion efficiency in recent years. Hasan et al. [9] experimentally
investigated the performance of five PCMs for four PV/PCM systems under the same
controlled conditions. It was found that a maximum temperature decrease of 18ºC could be

4
reached for about 30 minutes and a 10ºC temperature decrease was maintained for five hours
at 1000 W/m2 insolation. Biwole et al. [10] showed that adding a PCM on the back of a solar
panel could maintain the operating temperature under 40ºC for 80 minutes at 1000 W/m2
insolation. Experimental measurement and simulation of PCM cooling of a PV panel by
Stropnik and Stritih [11] showed that the PCM could decrease the PV surface temperature by
as much as 35.6oC for a duration of one day. Similarly, a PCM led to a maximum PV
temperature drop of 26.3oC even in a cold environment of Tehran [12]. Hachem et al. [13]
showed from measurement and simulation that the electrical efficiency of PV panels was
increased by an average of 3% using white petroleum jelly as a PCM and by 5.8% using a
combination of the PCM, copper and graphite. A simulation by Malvi et al. [14] for a hybrid
PVT system with PCM thermal storage revealed that the electrical efficiency could be typically
increased by 9% but the increase in electrical performance was accompanied by a decrease in
thermal performance. An experimental investigation by Yang et al. [15] revealed that using a
PCM increased the total thermal and electrical efficiency of a PVT system from 63.9% to
76.9%.
Integration of PCMs with BIPV or BIPVT for thermal control has also been investigated.
Huang et al. [16] were among the first researchers to conduct experimental measurements of a
PCM for temperature regulation of BIPV under controlled conditions. Tests were carried out
with and without metallic fins in the PCM. The performance of the PCM was also studied in
more detail using a numerical method [17]. More extensive research was carried out by the
researchers in this field for different PCMs [9] and different climates [18]. Aelenei et al. [19]
investigated a BIPV-PCM system installed in an office building façade. The PCM was however
separate from the PV module with the two components as the opposite sides of a ventilation
passage. A mathematical model was developed for simulation of the system and experiments
were also conducted for model validation with good agreement between simulation and
experimental results. Park et al. [20] numerically and experimentally investigated the
performance of the BIPV-PCM system by varying the melting temperature and the thickness
of the PCM layer and found that using a 100 mm thick PCM layer decreased the PV temperature
by 10°C at an insolation over 700 W/m2 and that the optimal melting temperature of the PCM
was 25°C under the climatic conditions of South Korea. Sharma et al. [21] tested a PCM to
maintain the solar cell operating temperature and improve the performance of building
integrated concentrated PV systems under controlled conditions. It was shown that a relative
electrical efficiency improvement of 7.7% was attained using PCM at 1000 W/m2 irradiance
5
and that the improvement increased with irradiance. Elarga et al. [22] numerically studied the
thermal and electrical performance of a PV-PCM system in a double skin façade under forced
convection. The use of a PCM layer in the cavity of the PV façade decreased the PV
temperature by up to 20°C and the monthly cooling demand by 20–30%. Wang et al. [23]
determined the performance of a BIPVT system integrated with a PCM and a micro-channel
flat-plate heat pipe together with a water pump and storage tank to store excess heat and
enhance the overall efficiency of the system. It was shown that the main benefit of the system
resulted from thermal storage and release by the PCM. Curpek et al. [24] experimentally
investigated the influence of a PCM on a ventilated BIPV façade using an outdoor test cell and
found that the PCM decreased the PV temperature by up to 14°C and air temperature in the
façade by 5°C.
A major weakness of a PCM is its low thermal conductivity. A number of techniques have
been employed to overcome the weakness such as a composite high conductive material, fins
and capsules to extend the heat transfer surface and multiple PCMs. Wang et al. [25] studied
the melting procedures of three PCMs in cylindrical heat storage capsules with the lowest
melting temperature PCM at the centre and the remaining two arranged in the order of
increasing melting temperature from the centre to outer surface. The results showed that the
melting time was 37−42% less in the three-PCM capsules than for a single PCM capsule. Stritih
[26] compared a finned surface with a plain surface for a PCM storage unit and indicated that
the fins increased the thermal release process but reduced heat transfer during heat storage.
Huang et al. [27] studied a PV/PCM system with a range of metal fin configurations
incorporated into the PCM to limit passively the PV temperature increase. A comparison with
a conventional air-cooling system through experiments and simulations demonstrated that
applying metal fins had a significant effect on controlling the PV temperature increase. Further
investigation indicated that optimisation of internal fins could greatly improve the PV
temperature control [28]. Nada and El-Nagar [29] found that integrating a BIPV module with
a PCM box enhanced its daily mean electrical efficiency by about 6% and the enhancement
could be increased further to 13% by adding 2% Al2O3 nanoparticles to improve the thermal
conductivity of the PCM. Salem et al. [30] used a similar approach to enhance the performance
of PV cells and found that a 1% concentration of the nanoparticles in a mixture of Al2O3, PCM
and water would produce the highest PV electrical output.
Previous work has shown that a PCM is able to control the PV temperature increase and that

6
enhancing the rate of heat transfer in the PCM is vital for fast thermal response and long thermal
control periods. However, the extra electrical output produced by incorporating a PCM is
currently insufficient to cover the additional costs. Hasan et al. [31] measured the performance
of a PV-PCM system for the cool climate of Ireland and the hot climate of Pakistan and then
carried out energy and economic analysis of the PV-PCM system for the two climates. It was
shown that the system was not cost effective in a cool climate but would be in a hot climate.
However, the analysis was based on the assumption that the projected future PV cost would be
30% less than that in 2005. The actual PV prices in recent years have dropped much faster than
projected such that the module prices are now only a small fraction of those in 2005 while
PCMs remain relatively expensive. Thus, the financial benefit of using a PCM only for thermal
regulation of PV systems even for a hot climate may not be realised. Japs et a. [32] also
experimentally studied two types of PCM for cooling of two PV modules under outdoor
summer conditions in Germany and their analysis for scaled-up PV power plants up to 10 MWp
showed that their economic benefit was negative for most days but only positive in certain
period of a day because of assumed higher prices for electricity on the spot market when the
energy yield was higher. In other words, there would be no economic benefit using the PCMs
at any time under a fixed unsubsidised daytime electricity price or a flat rate tariff, which is
likely for comparatively small BIPV systems. Therefore, it is important to maximise energy
utilisation from a PV/PCM system in order to make it economically viable. This can be
achieved by combining the system with interior building environment control to reduce heating
load and/or enhance natural ventilation, which has not been thoroughly investigated previously.
The objective of this study is to determine experimentally the performance of a novel PVT
system integrated with a PCM as a thermal storage medium for building applications by means
of natural ventilation. The PVT/PCM system comprised of a PV panel, a PCM unit and a
ventilation duct for energy harvesting, storage and utilisation. The heat stored in the PCM unit
could be utilised to enhance natural ventilation or preheating supply air. The novelty of the
work lies in using the PCM not only for PV temperature control but also for passive heating
and ventilation of a building. The system was designed and the thermal and electrical
performance measured under laboratory conditions. The laboratory was naturally ventilated
and centrally heated through thermostatically controlled radiators.
In the following sections, key materials for the PVT/PCM system and experimental methods
are first presented. Results from the experiments are then analysed and discussed followed by

7
an uncertainty analysis of experimental measurements. Finally, conclusions from the study are
provided.
2. Materials and methods
The PVT/PCM system for this study consisted of a PV panel, a PCM unit made of an
aluminium container accommodating the PCM and a ventilation duct. The PV panel served as
the absorber plate of a thermal collector and was integrated with a PCM on the backside to
control the temperature and store the absorbed heat. The stored heat was released to air in the
duct behind the PCM container by means of natural ventilation. The system was positioned
vertically as a type of wall-mounted PVT for better natural ventilation. A schematic diagram
is shown in Figure 1.
Figure 1 Schematic diagram and photos of the experimental system
2.1 Materials
Key materials for the PVT/PCM system were PV modules and PCM.
2.1.1 PV modules
In a BIPVT system, PV modules produce not only electricity but also usable heat. Both
electrical and thermal outputs depend on the type of PV as well as environmental conditions.
Most PVT systems make use of crystalline silicon PV due to the high efficiency and
monocrystalline silicon PVs are most beneficial in terms of longevity and efficiency. For the

8
present study, two monocrystalline PV modules (Biard 100W Solar Panel) were used and the
key specifications are given in Table 1.
Table 1 Specifications of the photovoltaic module
Peak power 100 W
Cell type Monocrystalline
Maximum power voltage 19.3 V
Maximum power current 5.18A
Open circuit voltage (Voc) 22.9 V
Short circuit current (Isc) 5.56 A
Maximum system voltage 750 V
Cell efficiency 18%
Temperature coefficient of Isc 0.06±0.01
Coefficient of Voc -(78±10)
Coefficient of peak power -(0.5±0.05) %/oC
Power tolerance ±3%
Normal operating cell temperature 45℃±2℃
Dimension 1200×540×30 mm
Weight 8 kg
Number of solar cells 36 (4×9)
Standard Test Conditions (STC) Irradiance = 1000 W/m2, AM = 1.5 spectrum,
and cell temperature = 25°C
Manufacturer reference CHN10036MB
The two modules were placed side by side to form a PV panel of 1080 mm wide and 1200
mm high.
2.1.2 PCM
For residential applications, heat stored in the PVT/PCM system would mainly be used for
night heating or ventilation. Selection of a PCM would then depend on not only the requirement
for thermal management of PV (preferring a material with a low phase change temperature for
given ambient conditions) but also the need for the stored heat for later use (a high phase change
temperature). Generally, the optimal melting temperature for a PCM integrated in a building

9
fabric is close to indoor thermal comfort temperatures and it is about 25oC as shown by Park
et al. [20]. Although the material (container) for the present system is not directly exposed to
the occupants in a building, the comfort temperature can still be used as one of the criteria for
selection. Besides, the system could be adapted to form part of a (double skin) building façade
with transparent glazing as the back side of the ventilation duct. Such a low phase change
temperature may present a problem for solidifying the PCM at night due to its low thermal
conductivity if the ambient temperature is too high. However, the nighttime air temperature in
the UK is generally low (about 15oC in the warmest summer month July) and is much lower
for the heating season with an average of about 5oC. The low nighttime temperature together
with measures to enhance heat transfer within the material such as metal fins would enable
solidification of the PCM to be completed and this is discussed for the effect of fins. After
careful consideration, salt hydrates PCM (PLUSICE S25) was chosen due to its relatively high
thermal conductivity and high phase change enthalpy. The PCM solidifies and melts at 25ºC.
Its main constituent is calcium chloride hexahydrate (CaCl2·6H2O). The phase change
temperature of pure calcium chloride hexahydrate is about 30oC but the temperature can be
adjusted to, e.g., 25oC when mixed with another type of salt such as magnesium chloride
hexahydrate (MgCl2·6H2O). Table 2 shows the properties of the selected PCM, including the
latent heat of fusion during phase change (phase change enthalpy or latent heat capacity),
density, volumetric heat capacity (the product of latent heat and density), specific heat and
thermal conductivity. The density and thermal conductivity of the PCM in the liquid state were
lower than those in the solid state whereas the specific heat of liquid PCM was higher.
Table 2 Thermal and physical properties of PCM
Phase Phase
change
temperature
(ºC)
Latent heat
of fusion
(kJ/kg)
Volumetric
heat
capacity
(MJ/m3)
Density
(kg/m3)
Specific
heat
(kJ/kgK)
Thermal
conductivity
(W/mK)
Liquid 25 180 275 1530 2.2 0.54
Solid 1710 1.4 1.09
The capacity (quantity) of PCM used in the experiments was estimated from the weather data
of a peak sunny day in the UK using the method introduced by Jiang et al. [33] who developed
a simple analytical method to estimate the optimal phase change characteristics. For a PCM

10
with a melting temperature of 25ºC, the optimum capacity was found to be in the range of
thicknesses between 20 mm and 50 mm when attached to the backside of PV.
An aluminium box with an adjustable depth (1100 mm wide and 1200 mm high with depths of
20 mm to 50 mm) was constructed as a container for the PCM. Figure 1 also shows a
photograph of a PCM container with two holes cut out on the back near the top. These holes
were used to fill the container with a liquid state PCM. Another container labelled ‘container
attached on PV back’ in the figure was constructed with the PCM filled at the top. This was
however used for preliminary investigation of the system.
2.2 Experimental system
The experimental setup is shown in Figure 1. To construct the test system and ensure high
conductivity, the PV panel and aluminium box were bonded together with a special thermal
grease to provide a good thermal contact and prevent short-circuiting the cells. A rectangular
air duct of 1100 mm wide, 1200 mm high and 100 mm deep was made behind the PCM
container using the backside of the PCM container as a duct wall. The duct was connected to
horizontal inlet and outlet openings of 100 mm high and the vertical duct height between the
centres of the openings was 1100 mm. Celotex Insulation board with a thermal conductivity
of 0.022 W/mK and thickness of 100 mm was used for insulation of the duct as well as the top,
bottom and two sides of the PV and PCM container.
Accurate measurements of the PV performance require the use of a solar simulator to produce
a desired spectrum of thermal radiation. The emphasis of the present study was however on the
phenomena associated with heat from heat transfer and storage to natural ventilation. Therefore,
insolation was simulated simply with nine 500 W halogen lamps. The distance between the
lamps and PV panel was adjusted to achieve radiation on the panel as uniform as possible. The
resulting mean insolation (heat flux) was 600 W/m2 for the tests. This level of heat flux was
close to the maximum hourly mean direct solar radiation or the maximum mean global
radiation averaged for the sunshine hours on a vertical surface in the UK [34].
The assembled system was tested for two processes – thermal charging and discharging. In the
first phase, the artificial lights were switched on to simulate the heat charging and storage and
the electrical performance of the PV panel was also recorded. In the second phase, the lights
were turned off to simulate the energy release process.
11
Poor conductivity of PCMs is known to be a common problem in heat storage and release.
Therefore, another aluminium box of 30 mm internal thickness was fabricated with vertical
aluminium fins 2 mm thick and 30 mm spacing to improve the thermal performance.
2.3 Instrumentation
Temperatures of the materials and air, air velocity, insolation and electrical output were
measured. A total of 24 T-type thermocouples were used to measure temperatures of the
PVT/PCM system. Six thermocouples were positioned on the front and back surfaces of the
PV panel to measure the surface temperature as a representation of PV cell temperature. Twelve
thermocouples were located at three depths within the PCM to measure spatial temperature
variations. Three thermocouples were fixed in the vertical duct and two thermocouples in the
duct inlet and outlet to measure air temperatures. An additional thermocouple was used to
measure the ambient temperature in the laboratory. Table 3 presents the positions of
temperature measuring points for the system with a 30 mm deep PCM container. The bottom
back corner of the PV panel was designated as the reference point (X = 0, Y = 0). The
thermocouples were calibrated with a digital thermometer with an accuracy of ±0.2ºC for a
range of 10ºC to 80ºC. Figure 2 shows the calibration curve for the thermocouples.
Table 3 Position of temperature measuring points
Point Position (m), in terms of number x (X, Y)
6 for PV panel (2 along each height) 2 x (0, 0.25); 2 x (0, 0.5); 2 x (0, 0.75)
4 for PCM at bottom (0.008, 0.3); 2 x (0.016, 0.3); (0.024, 0.3)
4 for PCM at middle height (0.008, 0.6); 2 x (0.016, 0.6); (0.024, 0.6)
4 for PCM at top (0.008, 0.9); 2 x (0.016, 0.9); (0.024, 0.9)
1 for air duct at bottom (0.08, 0.3)
1 for air duct at middle (0.08, 0.6)
1 for air duct at top (0.08, 0.9)
1 for air inlet (0.13, 0.05)
1 for air outlet (0.13, 1.15)

12
Figure 2 Calibration of thermocouples against a digital thermometer
The air velocity was measured at the duct outlet using a hot wire anemometer (TESTO 425)
with an accuracy of ±0.03 m/s. The mean air velocity at the outlet was obtained from the
measurement of air velocities at 20 points. That is, the rectangular opening was divided equally
into 20 smaller rectangular areas (five divisions along the width and four divisions along the
height) and the air velocity at the centre of each area was measured. The average for the 20
measured points was taken as the mean air velocity at the outlet which was then used to
calculate the ventilation rate through the duct.
The insolation on the PV panel from the artificial lights was measured using a solar power
meter (ISM 400) with an accuracy of ±10 W/m2 or ±5%, whichever is greater. A plate ammeter
shunt (10 A and 75 mV) and two 100 W resistors were connected and used to measure the
electrical output of the PV panel. All temperature and electrical data were recorded at an
interval of 60 seconds using a DT800 data logger.
2.4 Experimental design and procedure
Figure 3 shows a schematic diagram of three steps for setting up the experimental system. First,
the PCM in liquid form was poured into the aluminium box attached to the back of the PV
panel (Fig. 3a). The ventilation duct was then configured behind the PV/PCM unit (Fig. 3b).
After the PCM solidified and the temperature for the whole system stabilised, the lights were
switched on to start an experiment with the temperatures for the PV, PCM and air together with

13
the air velocity, insolation and PV output monitored to establish the electrical and thermal
performance (Fig. 3c). The artificial lights were on continuously until the PCM completely
melted for the melting process and then the lights were switched off to observe thermal release
during the solidification process.
Figure 3 Schematic diagram for setting up the experimental system
Four different configurations for the PVT/PCM system were tested as listed in Table 4. A
number of tests were carried out for the first configuration to establish the performance of the
system and efficient experimental procedure in terms of duration of each process. An additional
test was carried out without the PCM in the container to assess the effect. All tests were carried
out under the same conditions with the ambient temperature maintained at about 20ºC during
the period for electricity generation by the PV. The duration of the processes for testing varied
with the configurations.
Table 4 Test configurations
Case PCM thickness (mm) Fins installed
1 30 No
2 No PCM No
3 20 No
4 50 No
5 30 Yes

14
3. Results and discussion
The thermal charging and discharging processes are analysed for the first case followed by the
analysis of the effects of the PCM thickness and metal fins.
3.1 Thermal energy charging process
The PV temperature management by the PCM depends on the thermal performance of the PCM.
Figure 4 shows the temperature at three points inside the PCM - front, middle and back
positions (8 mm, 16 mm and 24 mm, respectively, from the backside of PV) of the PCM unit.
As the melting temperature of the PCM was 25oC, when the temperature at a point exceeded
this value, the PCM would have started to melt there. After the artificial lights were turned on,
it took about 50, 130 and 180 minutes, respectively, for the PCM at the front, middle and back
points to melt. A rapid temperature increase after completion of melting was observed at the
front point between 275 and 295 minutes and at the middle and back points between 300 and
320 minutes.
Figure 4 Temperature at three points in the PCM (Case 1)
The effectiveness of the PCM for thermal management is shown in Figure 5 from the
comparison of the mean PV temperature for the PVT/PCM (Case 1) with that of PVT without
the PCM (Case 2). The mean PV temperature was taken as the average temperature for six
different points at the front and back sides of PV panel. The PVT system without the PCM
reached a steady state at 61oC in about 70 minutes, while the system with the PCM reached its
steady state at a much lower temperature of 45oC in 90 minutes. For both cases, initially, the

15
temperature increased rapidly but the rate of increase was slower with the PCM than without.
For the PVT/PCM system, when the temperature of a layer of PCM close to the heat-absorbing
PV exceeded its melting temperature, the PCM absorbed the heat transferred from the PV
mainly as latent heat and thus kept the PV temperature stable until all the PCM in contact with
the PV changed from solid to liquid completely at about 210 minutes. Afterwards, the PV
temperature increased again as the sensible heat of the melted PCM increased but remained
lower than that without the PCM at the end of thermal charging period (350 minutes). From
the comparison, it is concluded that a 30 mm thick PCM with a phase change temperature of
25oC can maintain the PV temperature below 45oC for about 210 minutes under 600 W/m2
insolation.
Figure 5 Comparison of mean PV temperature with and without PCM (Case 1 vs Case 2)
The improvement of electrical performance using the PCM can be assessed from the
relationship between the electricity conversion efficiency with temperature, i.e.,
η = η୰ ቀͳ െ Ⱦ൫�୮ − T୰ ൯ቁ (1)
The efficiency improvement is then defined as
(ηଵ − ηଶ)/ηଶ ൌ ൫�୮ଶߚ − T୮ଵ൯Ȁቀͳ െ Ⱦ൫�୮ଶ − T୰ ൯ቁ (2)
where is the temperature coefficient of peak power, equal to 0.005 (1/oC) according to module
specifications, Tp is the measured PV temperature (oC), Tref andref are the PV temperature (oC)

16
and efficiency (%) under the standard test conditions, respectively. Subscripts 1 and 2 represent
the values for the systems with and without the PCM, respectively.
Figure 6 shows the electrical performance improvement owing to the PCM. The improvement
resulted from the lower PV temperature offered by the PCM and consequent less decrease of
electrical efficiency for the system with the PCM. In terms of variation with time, initially, the
increase was rapid because of the slower PV temperature increase with the PCM than without.
During the melting phase of the PCM, the improvement in the electrical efficiency remained
nearly constant. Due to the limited amount of PCM, the PCM effectively fully melted at 210
minutes and from then on the level of improvement in the efficiency decreased.
Figure 6 PV efficiency increase due to PCM (Case 1 vs Case 2)
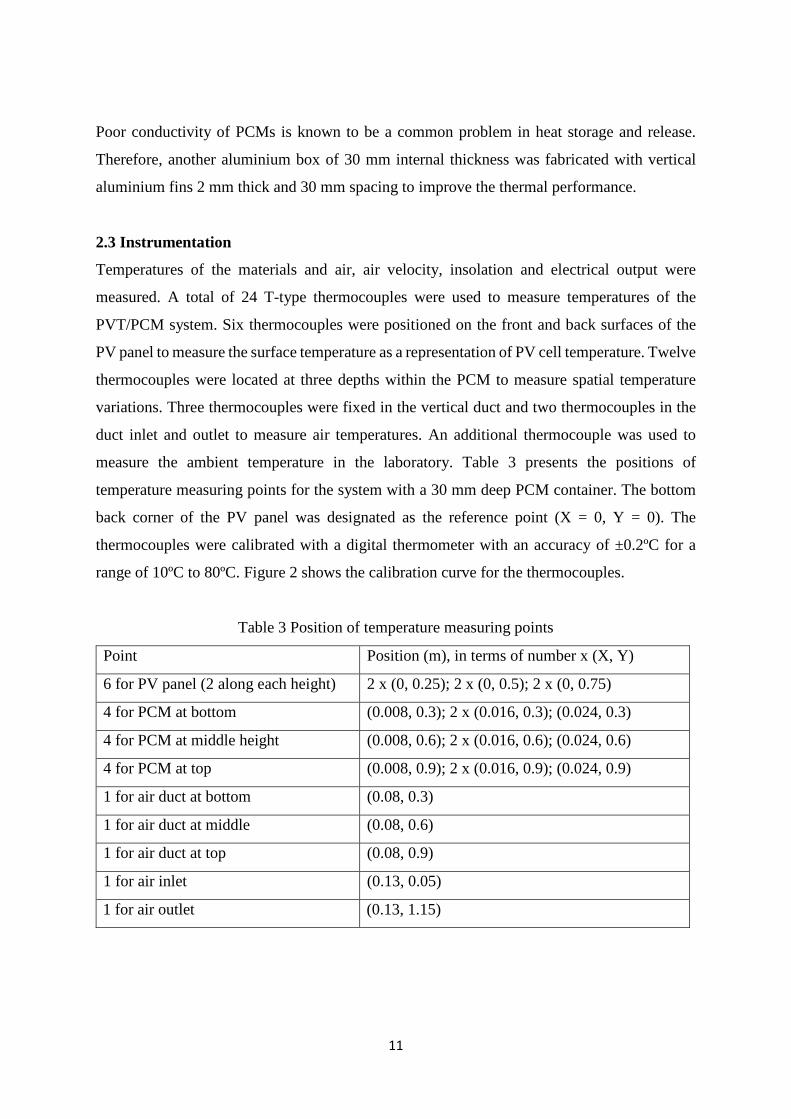
The ventilation rate resulting from the buoyancy effect in the duct is another important
parameter for this study. Figure 7 shows the ventilation rate through the duct. The ventilation
rate increased rapidly to 13 L/s during the first 50 minutes as the temperatures of PV and PCM
increased, after which the increase became considerably less with an average ventilation rate
of 15 L/s for about 200 minutes during the PCM melting process. The ventilation rate rose
rapidly again after the PCM fully melted, reaching a maximum value of 28 L/s over the test
period. Note that the second phase of rapid increase in the ventilation rate occurred at about
255 minutes rather than 210 minutes. This was because completion of melting of the PCM
layer near the backside in contact with the ventilation duct was later than that near the front
side as seen from the variation of PCM temperatures in Figure 4. Natural ventilation was
17
allowed to take place in the duct during the tests. However, if such a system was designed to
make use of the stored heat for nighttime operation, the duct would be closed to reduce the
ventilation heat loss. Hence, to maximise the benefits of the system, the volume of PCM should
be sufficient to store all the thermal energy that is absorbed by and transferred from the PV in
a hot day for given environmental conditions in order to keep the PCM unit function as desired
all the time.
Figure 7 Ventilation rate in the duct (Case 1)
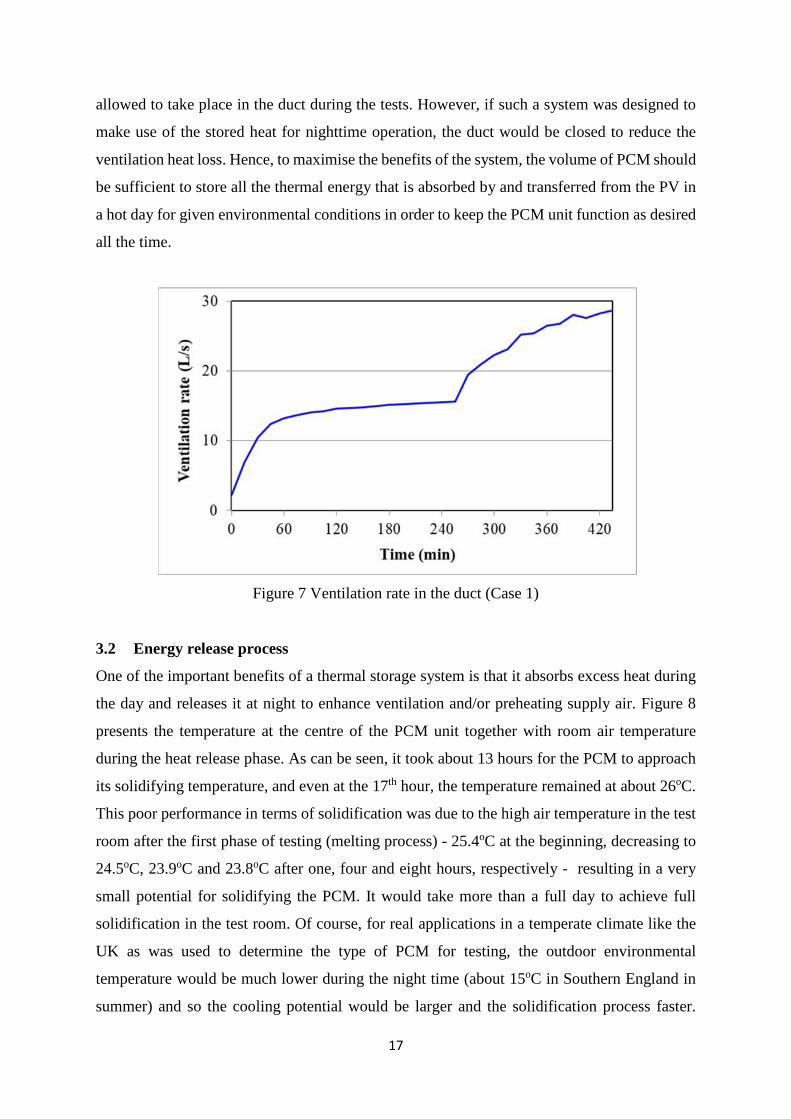
3.2 Energy release process
One of the important benefits of a thermal storage system is that it absorbs excess heat during
the day and releases it at night to enhance ventilation and/or preheating supply air. Figure 8
presents the temperature at the centre of the PCM unit together with room air temperature
during the heat release phase. As can be seen, it took about 13 hours for the PCM to approach
its solidifying temperature, and even at the 17th hour, the temperature remained at about 26oC.
This poor performance in terms of solidification was due to the high air temperature in the test
room after the first phase of testing (melting process) - 25.4oC at the beginning, decreasing to
24.5oC, 23.9oC and 23.8oC after one, four and eight hours, respectively - resulting in a very
small potential for solidifying the PCM. It would take more than a full day to achieve full
solidification in the test room. Of course, for real applications in a temperate climate like the
UK as was used to determine the type of PCM for testing, the outdoor environmental
temperature would be much lower during the night time (about 15oC in Southern England in
summer) and so the cooling potential would be larger and the solidification process faster.
18
However, because heat transfer within the PCM was also slow, solidification would not be
complete in such a summer night without additional measures [35]. It was thus necessary to
enhance heat transfer in the PCM such as inserting metal fins so as to achieve full solidification
at night time and be ready for the next cycle of thermal management.
Figure 8 PCM and air temperatures in the thermal release phase (Case 1)
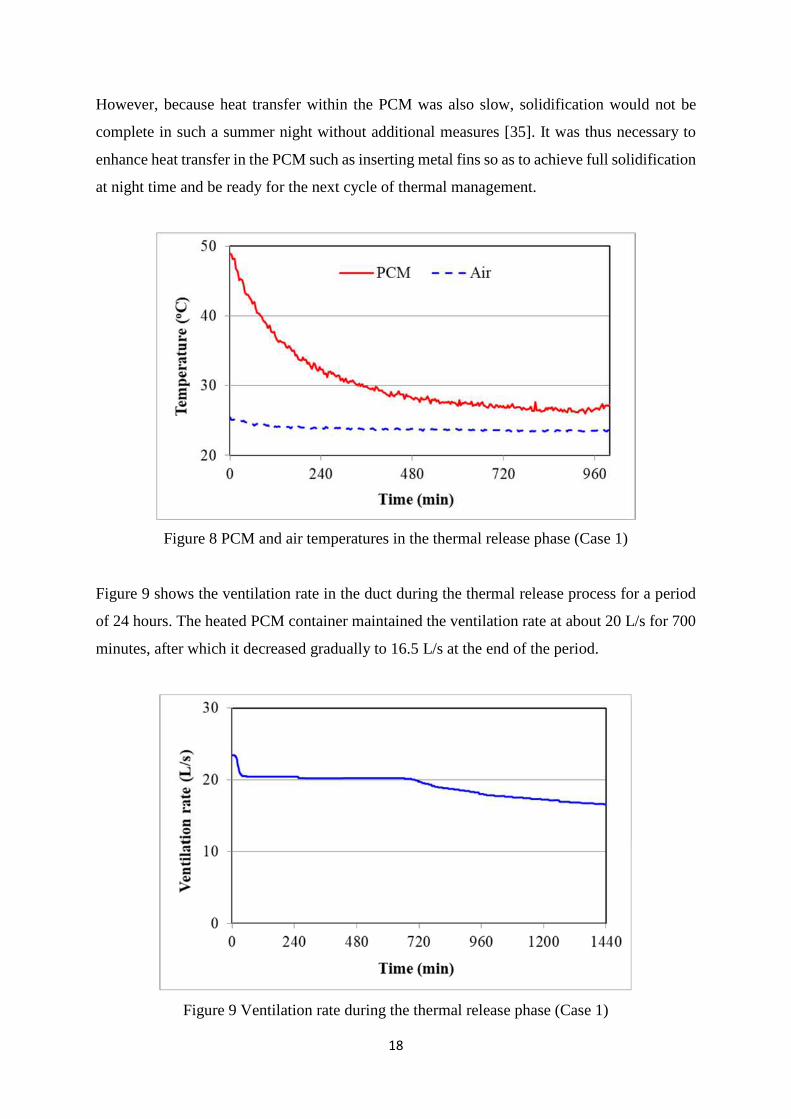
Figure 9 shows the ventilation rate in the duct during the thermal release process for a period
of 24 hours. The heated PCM container maintained the ventilation rate at about 20 L/s for 700
minutes, after which it decreased gradually to 16.5 L/s at the end of the period.
Figure 9 Ventilation rate during the thermal release phase (Case 1)

19
At night times, the PVT/PCM system designed as part of a building envelope would behave as
a thermal mass in the building, delaying and decreasing indoor temperature fluctuations. As
the ambient would be cooler, a higher ventilation rate than that from the test could be expected.
In summer, heat absorbed by the PCM during the day would be released at night and the
ventilation duct in such a system would function as a chimney to draw cool air through the
building and keep the indoor environment thermally comfortable. In winter, the stored heat
would be released at night to the incoming air for the building, helping to increase the
temperature. The ability of generating natural ventilation was one of the important benefits of
the PCM unit for this study, as it helped absorb excess heat gains from the PV in the daytime
and release it for use in the night time.
Ventilation air absorbed heat from the PCM container when flowing through the duct. Figure
10 illustrates the heat gain by air flowing through the ventilation duct during the thermal release
phase. The amount of heat gain was obtained from the measured ventilation rate and inlet and
outlet temperatures as well as the calculated air density and specific heat. The cumulative heat
gain by ventilation air increased with time to 326 Wh in eight hours. The rate of heat gain
decreased with increasing time and the gain was only 100 Wh for the next eight hours.
Figure 10 Heat gain by ventilation air during the thermal release phase (Case 1)
20
3.3 Effects of PCM configuration
In this section, the test results for four different PCM configurations of the experimental system
presented in Table 4 are discussed.
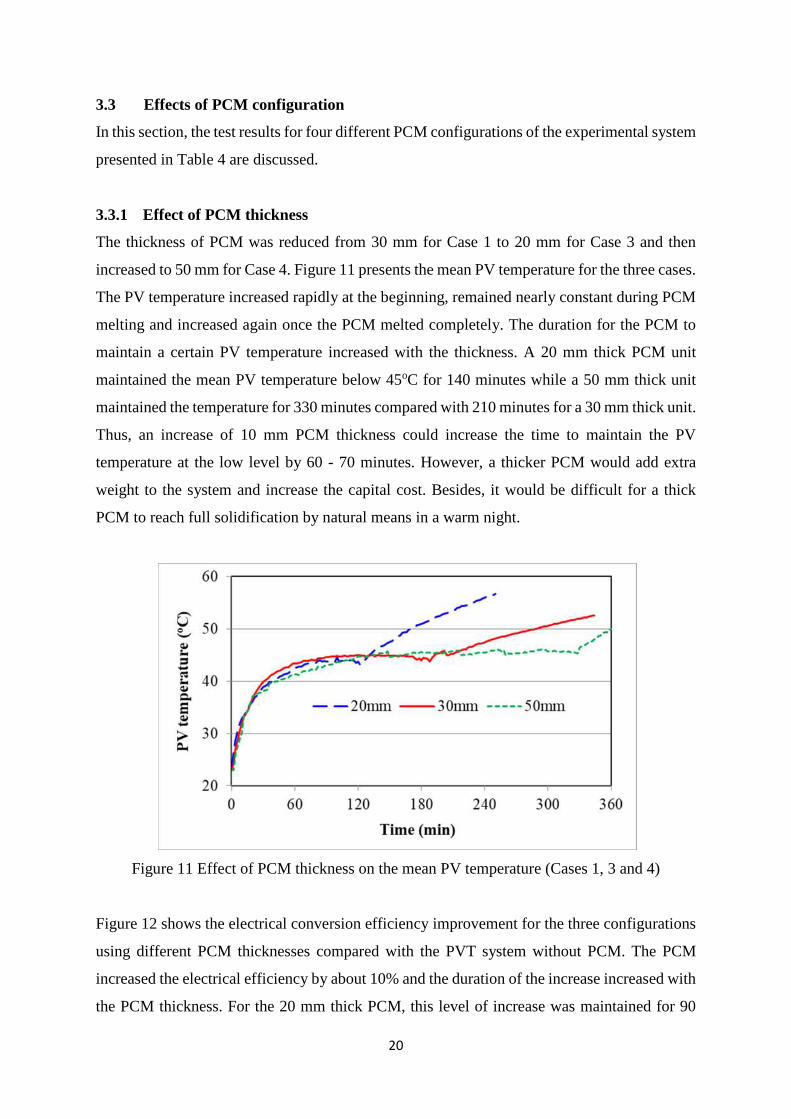
3.3.1 Effect of PCM thickness
The thickness of PCM was reduced from 30 mm for Case 1 to 20 mm for Case 3 and then
increased to 50 mm for Case 4. Figure 11 presents the mean PV temperature for the three cases.
The PV temperature increased rapidly at the beginning, remained nearly constant during PCM
melting and increased again once the PCM melted completely. The duration for the PCM to
maintain a certain PV temperature increased with the thickness. A 20 mm thick PCM unit
maintained the mean PV temperature below 45oC for 140 minutes while a 50 mm thick unit
maintained the temperature for 330 minutes compared with 210 minutes for a 30 mm thick unit.
Thus, an increase of 10 mm PCM thickness could increase the time to maintain the PV
temperature at the low level by 60 - 70 minutes. However, a thicker PCM would add extra
weight to the system and increase the capital cost. Besides, it would be difficult for a thick
PCM to reach full solidification by natural means in a warm night.
Figure 11 Effect of PCM thickness on the mean PV temperature (Cases 1, 3 and 4)
Figure 12 shows the electrical conversion efficiency improvement for the three configurations
using different PCM thicknesses compared with the PVT system without PCM. The PCM
increased the electrical efficiency by about 10% and the duration of the increase increased with
the PCM thickness. For the 20 mm thick PCM, this level of increase was maintained for 90

21
minutes, after which electrical efficiency started to decrease due to the increasing PV
temperature whereas the temperature of the PV without PCM was stable by the time (see Figure
5). The same trend was observed for thicker PCM units - the time for about 10% efficiency
improvement being 160 minutes and 290 minutes, respectively, for the 30 mm and 50 mm thick
PCM units.
Figure 12 Effect of PCM thickness on the electrical efficiency increase (Cases 1, 3 and 4)
3.3.2 Effect of fins
Due to the low thermal conductivity of PCM, the thermal charging and discharging processes
were slow. Therefore, heat transfer within the PCM was enhanced by means of internal
aluminium fins in another aluminium container 30 mm deep (Case 5). Vertical fins were placed
inside the 30 mm thick PCM container. The fins had a length of 1100mm, a thickness of 2 mm
and both height and spacing of 30 mm.
Figure 13 shows the mean PV temperature with fins installed inside the PCM container in
comparison with that without fins. It can be seen that the fins were effective in moderating the
PV temperature increase. This was achieved because the heat absorbed by the PV transferred
to the interior of the PCM container faster such that more PCM could effectively play the
cooling role. Without the fins, only a thin layer of PCM in contact with PV and container was
effective in cooling at the beginning of the melting process. It took only 22 minutes with fins
instead of 50 minutes without fins for the PV temperature to reach a steady state. The
temperature decrease resulting from the use of fins varied between 4oC and 7oC with an average

22
of 5.5oC during the PCM melting period when the PV temperature was nearly stable (from 50
min to 210 min). This was on average equivalent of a 3% improvement in the electrical
efficiency according to Equation 2 where subscripts 1 and 2 become the values for the systems
with and without fins, respectively. The enhanced heat transfer from the use of fins in the PCM
implies that the solidification process could be completed at night time the temperature of
which was one of the parameters for deciding the phase change temperature and quantity of
PCM. This was confirmed by a numerical simulation for the system with the air temperature
fixed at 15oC [35]. The nighttime air temperature in the UK for the heating season is much
lower. For example, at the beginning of October the mean air temperature at night in southern
England is less than 10oC and the average for the heating season is around 5oC. Therefore, the
30 mm thick PCM with a phase change temperature of 25oC and integrated with metal fins
would be able to solidify completely during the night in the heating season.
Figure 13 Effect of fins on the mean PV temperature (Case 1 vs Case 5)
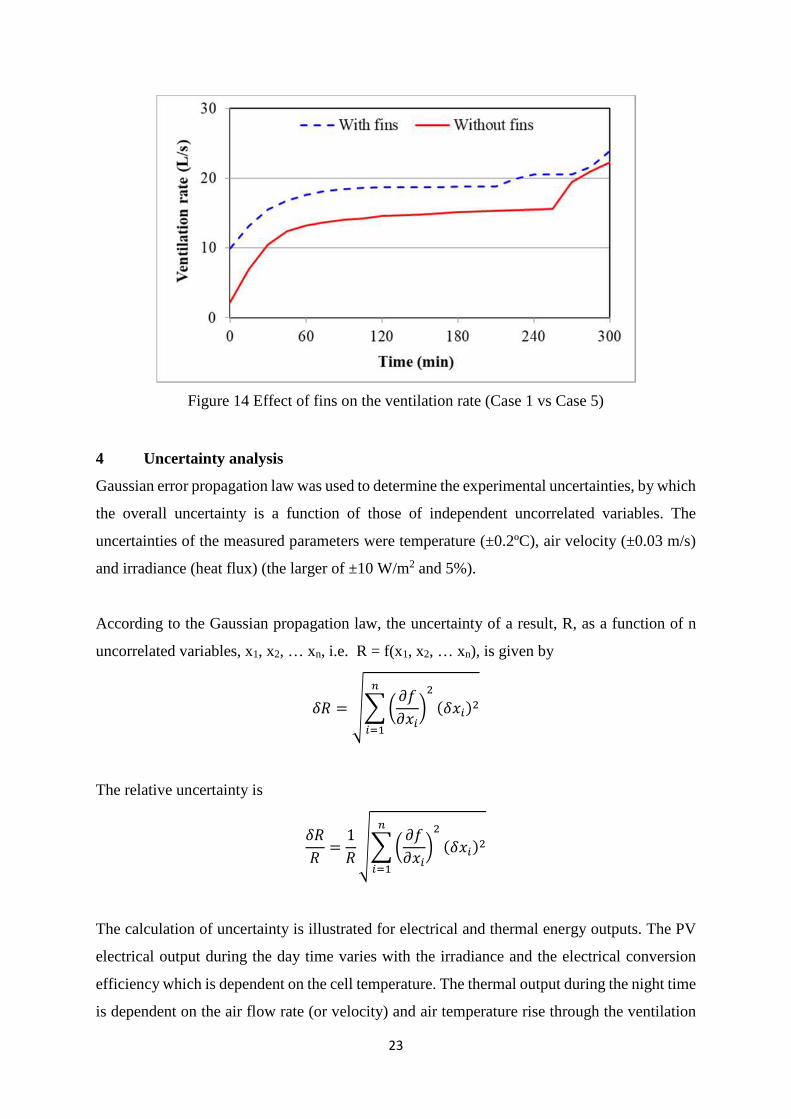
The fins also enabled faster transfer of heat from the absorber to the duct, leading to a higher
buoyancy-induced natural ventilation in the duct as shown in Figure 14. The system with fins
increased the ventilation rate by about 30%. However, the difference decreased when the PCM
with fins fully melted such that the backside temperature of the PCM container and the air flow
rate in the duct approached those without fins as indicated for the ventilation rate after 270
minutes.
23
Figure 14 Effect of fins on the ventilation rate (Case 1 vs Case 5)
4 Uncertainty analysis
Gaussian error propagation law was used to determine the experimental uncertainties, by which
the overall uncertainty is a function of those of independent uncorrelated variables. The
uncertainties of the measured parameters were temperature (±0.2ºC), air velocity (±0.03 m/s)
and irradiance (heat flux) (the larger of ±10 W/m2 and 5%).
According to the Gaussian propagation law, the uncertainty of a result, R, as a function of n
uncorrelated variables, x1, x2, … xn, i.e. R = f(x1, x2, … xn), is given by
ߜ ൌ ඩ ൬
ݔ൰ଶ
ୀଵ
ଶ(ݔߜ)
The relative uncertainty is
ߜ
=
1
ඩ ൬
ݔ൰ଶ
ୀଵ
ଶ(ݔߜ)
The calculation of uncertainty is illustrated for electrical and thermal energy outputs. The PV
electrical output during the day time varies with the irradiance and the electrical conversion
efficiency which is dependent on the cell temperature. The thermal output during the night time
is dependent on the air flow rate (or velocity) and air temperature rise through the ventilation

24
duct as a result of transfer of stored heat in the PCM. Thus, the uncertainty for the PV-PCM
outputs can be estimated as follows.
4.1 Electrical output
The PV electrical output (Pe in W) is given by
Pe = I A (3)
where I is the irradiance on the PV panel (W/m2) and A is the PV area (m2).
Substituting Equation (1) into Equation (3) yields
= I A η୰ ቀ1 − β൫T୮ − T୰ ൯ቁ (4)
Since
∂P∂I
= A η୰ ቀ1 − β൫T୮ − T୰ ൯ቁ
and
= −I A η୰ ߚ
The uncertainty in electrical output is then
ߜ = ඨቀడ
డூቁଶ
ଶ(ܫߜ) + ൬డ
డ ൰ଶ
൫ߜ ൯ଶ
(5)
i.e.
ߜ = A η୰ ටቀ1 − β൫T୮ − T୰ ൯ቁଶ
ଶ(ܫߜ) + ߜଶ൫(ߚܫ) ൯ଶ
(6)
where I is the uncertainty in measured irradiance I (W/m2) and Tp is the uncertainty in
measured PV temperature Tp (oC).
The relative uncertainty is
ఋ
= ඨ
(ఋூ)మ
ூమ+
ఉమ൫ఋ ൯మ
ቀଵஒ൫౦౨൯ቁమ (7)

25
For = 0.5 %/oC and Tref = 25oC,
ߜ
= ඩ
ଶ(ܫߜ)
ଶܫ+
൫ߜ ൯ଶ
൫225 − T୮൯ଶ ≈
ܫߜ
ܫ
i.e., it is 5%, greater of 10/600 and 5% for insolation measurement.
Similarly the relative uncertainty in estimated PV efficiency according to Equation (1) based
on the measured temperature would be about 1% at the start of experiments when the PV
temperature was close to air temperature, decreasing to about 0.5% when the PV temperature
was stabilised under constant irradiation.
4.2 Thermal output
The heat gain by air flowing through the ventilation duct of constant cross section (Pt in W) is
related to three measured parameters - velocity, inlet temperature and outlet temperature, i.e.
Pt = V Ad Cp (To – Ti) (8)
where V is the duct mean air velocity (m/s), Ad is the cross sectional area of the duct (m2),
and Cp are the air density (kg/m3) and specific heat (J/kgK), respectively, Ti and To are the inlet
and outlet temperatures (oC), respectively.
Since
∂P௧∂V
= Aܥߩ(T୭ − T୧)
௧
= −V Aܥߩ
and
௧
= V Aܥߩ
Therefore, the uncertainty in thermal output is
ߜ ௧ = ටቀడ
డቁଶ
ߜ) )ଶ + ቀడ
డ ቁଶ
ߜ) )ଶ + ቀడ
డቁଶ
ߜ) )ଶ (9)
i.e.

26
ߜ ௧ = Aܥߩඥ(T୭ − T୧)ଶ(ߜ )ଶ + ଶ((ߜ )ଶ + ߜ) )ଶ) (10)
The relative uncertainty is then
ఋ
= ට
(ఋ)మ
మ+
(ఋ )మା(ఋ)మ
()మ
= ට(ఋ)మ
మ+
ଶ(ఋ)మ
()మ
(11)
where T (= Ti = To) is the uncertainty in temperature measurement (oC).
The estimated relative uncertainty would be below 10% at the beginning of night cooling when
the air temperature rise through the ventilation duct was over 4oC. However, as heat was
released from the liquid PCM accompanied with decreasing temperature, the air temperature
rise would decrease gradually to e.g. 2oC and 1oC after two and six hours, respectively. The
corresponding uncertainty would increase to about 15% and 30%. Thus, the estimated
uncertainty in heat gain measurement was considerable despite careful calibration of the
temperature sensors to an accuracy of 0.2oC. Without calibration, the uncertainty for standard
T-type thermocouples with an accuracy of 1oC would be four times larger.
The uncertainty estimated above appears quite large. This is because the derived uncertainty
equation involves the air temperature increase/decrease as the denominator for estimating the
uncertainty in temperature measurement rather than the temperature magnitude as often
implicitly assumed or explicitly used for analysis in literature in the following incorrect form.
ఋ
= ට
(ఋ)మ
మ+
(ఋ)మ
మ +
(ఋ )మ
మ (12a)
or more likely
ఋ
= ට
(ఋ)మ
మ+
(ఋ)మ
మ(12b)
The temperature increase or decrease for fluid flow through a smooth passage such as a
ventilation duct or a liquid pipe is normally quite small in comparison with the temperature
magnitude. Typically, e.g., it is only a few degrees for liquid heating solar collectors [36] or
even less for much longer borehole heat exchangers for ground source heat pumps (say 2 to
3oC for a 100 m deep and 200 m long U-tube heat exchanger). If equations similar to Equation
(11) were used, the estimated relative uncertainty in the thermal output or efficiency of such

27
systems based on the measured fluid temperature rise/drop would likely be much larger than
expected or reported in literature. For PVT or solar thermal collectors, the difference in
estimated uncertainty using Equation (12) and Equation (11) would be around 10 fold. For
comparison, using the temperature magnitude as the denominator, the relative uncertainty
would be less than 1.5% for air temperature measurement in the ventilation duct employed in
this study.
5 Conclusions
A PVT/PCM system for thermal control of PV and natural ventilation of a building has been
designed and tested under laboratory conditions. The experimental results revealed that a PCM
layer of 30 mm thickness with a phase change temperature of 25ºC can maintain the PV
temperature below 45oC for about 210 minutes under 600 W/m2 insolation. A thicker PCM can
maintain the low PV temperature for a longer time and every 10 mm increase in the PCM
thickness can increase the time for thermal control by 60 - 70 minutes.
A limited number of tests from this study show that the thermal control by this type of PCM
can increase the electrical conversion efficiency of crystalline PV by 10% under the testing
conditions. The PVT/PCM system can also generate a 15 L/s ventilation rate in a vertical duct
of 1100 mm wide, 1200 mm high and 100 mm deep during the melting phase and 20 L/s during
the solidification phase even at an air temperature close to the phase change temperature.
Higher ventilation rates can be achieved during the solidification phase when the ambient
temperature is lower at night. Natural ventilation as well as PV temperature control can be
enhanced by increasing heat transfer in the PCM. Integration of thermally conducting fins in
the PCM increases the PV efficiency further by 3% and the ventilation rate by 30%. More
importantly for the system studied, it would facilitate complete solidification of the PCM at
night.
Even though experiments were conducted only at one set of conditions due to the fixed testing
environment, the capability of the PVT/PCM system for both PV temperature control and
building ventilation has been demonstrated. Besides, the results are useful for validation of a
simulation model for this type of PVT/PCM for preheating and natural ventilation of a building
which in turn can be used for investigation into the influence of different environmental
conditions on the performance of the system and different designs of components for system
optimisation.

28
Experiments were conducted in a laboratory with relatively stable conditions in order to make
use of one apparatus for assessing the effects of PCM thickness and integration of thermally
conducting fins within. However, the outdoor environmental conditions such as solar radiation
and air temperature vary with time in a day and consequently it might not be possible to achieve
complete melting and solidifying processes in the PCM for minimising the PV temperature rise
while maximising the thermal energy storage every day in both cooling and heating seasons.
Therefore, it is recommended to test the building-integrated PVT/PCM system with metal fins
in the PCM container under real climatic conditions.
Acknowledgement
This research did not receive any specific grant from funding agencies in the public,
commercial, or not-for-profit sectors.
References
1. H.A. Zondag, D.W. de Vries, W.G. J. van Helden, R.J.C. van Zolingen and A.A. van
Steenhoven, The yield of different combined PV-thermal collector designs, Solar Energy
74(2003) 253-269.
2. S.A. Kalogirou and Y. Tripanagnostopoulos, Hybrid PVT solar systems for domestic hot
water and electricity production, Energy Conversion and Management 47(2006) 3368-3382.
3. N. Aste, G. Chiesa and F. Verri, Design, development and performance monitoring of a
photovoltaic-thermal (PVT) air collector, Renewable Energy 33(2008) 914-927.
4. Y. Tripanagnostopoulos, Photovoltaic/Thermal Solar Collectors, In A. Sayigh (Ed),
Comprehensive Renewable Energy, Elsevier, Oxford, 3(2012) 255-300.
5. H.A. Zondag, Flat-plate PV-Thermal collectors and systems: A review, Renewable and
Sustainable Energy Reviews 12(2008) 891-959.
6. L. Mei, D. Infield, U. Eicker, and V. Fux, Thermal modelling of a building with an
integrated ventilated PV façade, Energy and Buildings 35(2003) 605-617.
7. T.N. Anderson, M. Duke, G.L. Morrison and J.K. Carson, Performance of a building
integrated photovoltaic/thermal solar collector, Solar Energy 83(2009) 445-455.
8. O. Zogou and H. Stapountzis, Flow and heat transfer inside a PVT collector for building
application, Applied Energy 91(2012) 103-115.
9. A. Hasan, S.J. McCormack, M.J. Huang and B. Norton, Evaluation of phase change
materials for thermal regulation enhancement of building integrated photovoltaics, Solar

29
Energy 84(2010) 1601-1612.
10. P.H. Biwole, P. Eclache and F. Kuznik, Phase-change materials to improve solar panel's
performance, Energy and Buildings 62(2013) 59-67.
11. R. Stropnik and U. Stritih, Increasing the efficiency of PV panel with the use of PCM,
Renewable Energy 97(2016) 671-679.
12. M. Rezvanpour, D. Borooghani, F. Torabi and M. Pazoki, Using CaCl2.6H2O as a phase
change material for thermo-regulation and enhancing photovoltaic panels’ conversion
efficiency: Experimental study and TRNSYS validation, Renewable Energy 146(2020)
1907-1921.
13. F. Hachem, B. Abdulhay, M. Ramadan, H. El Hage, M.G. El Rab and M. Khaled, Improving
the performance of photovoltaic cells using pure and combined phase change materials –
Experiments and transient energy balance, Renewable Energy 107(2017) 567-575.
14. C.S. Malvi, D.W. Dixon-Hardy and R. Crook, Energy balance model of combined
photovoltaic solar-thermal system incorporating phase change material, Solar Energy
85(2011) 1440-1446.
15. X. Yang, L. Sun, Y. Yuan, X. Zhao and X. Cao, Experimental investigation on performance
comparison of PV/T-PCM system and PV/T system, Renewable Energy 119(2018) 152-
159.
16. M.J. Huang, P.C. Eames, B. Norton, Thermal regulation of building-integrated
photovoltaics using phase change materials, International Journal of Heat and Mass
Transfer 47(2004) 2715–2733.
17. M.J. Huang, P.C. Eames, B. Norton, Comparison of a small scale 3D PCM thermal control
model with a validated 2D PCM thermal control model, Solar Energy Materials and Solar
Cells 90(2006) 1961–1972.
18. H. Hasan, S.J. McCormack, M.J. Huang, J. Sarwar and B. Norton, Increased photovoltaic
performance through temperature regulation by phase change materials: Materials
comparison in different climates, Solar Energy 115 (2015) 264–276.
19. L. Aeleneia, R. Pereiraa, H. Gonçalvesa and A. Athienitis, Thermal performance of a hybrid
BIPV-PCM: Modeling, design and experimental investigation, Energy Procedia 48 (2014)
474 – 483.
20. J. Park, T. Kim, S.B. Leigh, Application of a phase-change material to improve the
electrical performance of vertical-building-added photovoltaics considering the annual
weather conditions, Solar Energy 105(2014) 561–674.
21. S. Sharma, A. Tahir, K.S. Reddy and T.K. Mallick, Performance enhancement of a building-

30
integrated concentrating photovoltaic system using phase change material, Solar Energy
Materials and Solar Cells 149(2016) 29-39.
22. H. Elarga, F. Goia, A. Zarrella, A. Dal Monte and E. Benini, Thermal and electrical
performance of an integrated PV-PCM system in double skin façades: A numerical study,
Solar Energy 136(2016) 112-124.
23. Z. Wang, Z. Huang, F. Chen, X. Zhao and P. Guo, The integration of solid-solid phase
change material with micro-channel flat plate heat pipe-based BIPV/T, Building Services
Engineering Research and Technology 39(2018) 712–732
24. J. Curpek M. Cekon and J. Hraska, PCM integrated in BiPV ventilated façade concepts:
experimental test cell platform and initial full-scale measurements, in IOP Conference
Series.: Earth and Environmental Science 290(2019) 012072.
25. J. Wang, Y. Ouyang and G. Chen, Experimental study on charging processes of a cylindrical
heat storage capsule employing multiple phase change materials, Energy Research 25(2001)
439-447.
26. U. Stritih, An experimental study of enhanced heat transfer in rectangular PCM thermal
storage, International Journal of Heat and Mass Transfer 47(2004) 2841-2847.
27. M.J. Huang, P.C. Eames and B. Norton, Phase change materials for limiting temperature
rise in building integrated photovoltaics, Solar Energy 80(2006) 1121-1130.
28. M.J. Huang, P.C. Eames, B. Norton and N.J. Hewitt, Natural convection in an internally
finned phase change material heat sink for the thermal management of photovoltaics, Solar
Energy Materials and Solar Cells 95(2011) 1598-1603.
29. S.A. Nada and D.H. El-Nagar, Possibility of using PCMs in temperature control and
performance enhancements of free stand and building integrated PV modules, Renewable
Energy 127(2018), 630-641.
30. M.R. Salem, M.M. Elsayed, A.A. Abd-Elaziz and K.M. Elshazly, Performance
enhancement of the photovoltaic cells using Al2O3/PCM mixture and/or water cooling-
techniques, Renewable Energy 138(2019) 876-890.
31. H. Hasan, S.J. McCormack, M.J. Huang and B. Norton, Energy and cost saving of a
photovoltaic-phase change materials (PV-PCM) system through temperature regulation and
performance enhancement of photovoltaics, Energies 7(2014) 1318-1331.
32. E. Japs, G. Sonnenrein, S. Krauter and J. Vrabec, Experimental study of phase change
materials for photovoltaic modules: Energy performance and economic yield for the EPEX
spot market, Solar Energy 140(2016) 51-59.
33. F. Jiang, X. Wang and Y.P. Zhang, A new method to estimate optimal phase change material

31
characteristics in a passive solar room, Energy Conversion and Management 52(2011)
2437-2441.
34. CIBSE Guide A – Environmental Design, Chartered Institution of Building Services
Engineers, London, 2015.
35. Y. Xiang and G. Gan, Optimization of building integrated photovoltaic thermal air system
combined with thermal storage, Low Carbon Technologies 10(2015) 146-156.
36. J.A. Duffie and W.A. Beckman, Solar Engineering of Thermal Processes (4th Edition), John
Wiley & Sons, New Jersey, 2013.