experimental investigation of the interaction of local and
TRANSCRIPT

School of Civil Engineering Sydney NSW 2006 AUSTRALIA http://www.civil.usyd.edu.au/ Centre for Advanced Structural Engineering
Experimental Investigation of the Interaction of Local and Overall Buckling of Stainless Steel I-Columns Research Report No R887 Jurgen Becque, BASc, MSc Kim JR Rasmussen, MScEng, PhD
December 2007 ISSN 1833-2781

School of Civil Engineering
Centre for Advanced Structural Engineering http://www.civil.usyd.edu.au/
Experimental Investigation of the Interaction of Local and Overall Buckling of Stainless Steel I-Columns
Research Report No R887
Jurgen Becque, BASc, MSc Kim Rasmussen, MScEng, PhD
December 2007
Abstract: This report describes an experimental program carried out at the University of Sydney to study the interaction of local and overall flexural buckling in stainless steel back-to-back channels under compression. Two stainless steel alloys were considered: austenitic 304 and ferritic 404. Tests were carried out to determine the material properties. The results reveal nonlinear stress-strain behaviour with low proportionality limit, anisotropy and enhanced strength as a result of cold-working. 24 columns were tested under an axial load, applied with a nominal eccentricity of Le/1500. The length of the specimens varied between 500 mm and 3000 mm in 500 mm increments. Twin specimens were tested for each length. All columns were tested between pinned ends. This report rectifies the lack of experimental data on local-overall interaction buckling in stainless steel columns with open cross-section. The results will be used in further research, specifically the development of a reliable finite element model, the assessment of the current design guidelines and the proposal of a direct strength design approach for stainless steel columns.
Keywords: Stainless steel, interaction buckling, local buckling, overall buckling, non-linear material, inelastic, anisotropy, cold-formed sections, back-to-back channels, doubly-symmetric cross-section.

Experimental Investigation of the Interaction of Local and Overall Buckling of Stainless Steel I-Columns
School of Civil Engineering Research Report No R887
2
Copyright Notice
School of Civil Engineering, Research Report R887
Experimental Investigation of the Interaction of Local and Overall Buckling of
Stainless Steel I-Columns
© 2007 Jurgen Becque, Kim JR Rasmussen
ISSN 1833-2781
This publication may be redistributed freely in its entirety and in its original form
without the consent of the copyright owner.
Use of material contained in this publication in any other published works must be
appropriately referenced, and, if necessary, permission sought from the author.
Published by:
School of Civil Engineering The University of Sydney Sydney NSW 2006 AUSTRALIA
December 2007
This report and other Research Reports published by the School of Civil Engineering
are available on the Internet:
http://www.civil.usyd.edu.au

Experimental Investigation of the Interaction of Local and Overall Buckling of Stainless Steel I-Columns
School of Civil Engineering Research Report No R887
3

Experimental Investigation of the Interaction of Local and Overall Buckling of Stainless Steel I-Columns
School of Civil Engineering Research Report No R887
4
Table of Contents Table of Contents .............................................................................................................. 4
List of Tables .................................................................................................................... 5
List of Figures ................................................................................................................... 6
List of Symbols ................................................................................................................. 8
1. Introduction and Scope ............................................................................................. 10
2 Experimental Investigation......................................................................................... 11
2.1 Material Properties ............................................................................................ 11
2.1.1 Tensile Properties of the Flat Material ................................................. 11
2.1.2 Compressive Properties of the Flat Material ....................................... 15
2.1.3 Material Properties of the Corners ....................................................... 20
2.2 Section Design and Geometry ................................................................................ 24
2.3 Imperfection Measurements ................................................................................... 31
2.4 Interaction Buckling Tests ...................................................................................... 37
2.4.1 Test Set-Up 1 ....................................................................................... 37
2.4.2 Test Set-Up 2 ....................................................................................... 42
2.4.3 Observations and Test Results ............................................................. 43
2.4.3.1 Inelastic Local Buckling Load ................................................. 43
2.4.3.2 Specimen Behaviour................................................................. 46
2.4.3.3 Load Eccentricity ..................................................................... 54
2.4.3.4 Ultimate Loads ......................................................................... 56
3. Conclusions ................................................................................................................ 61
References ...................................................................................................................... 64
Appendix A ..................................................................................................................... 65
Appendix B ..................................................................................................................... 73
Appendix C ................................................................................................................... 106

Experimental Investigation of the Interaction of Local and Overall Buckling of Stainless Steel I-Columns
School of Civil Engineering Research Report No R887
5
List of Tables Table 2.1. Coupon Test Results: Tensile Properties of the Flat Material ........................ 13
Table 2.2. Average Measured Tensile Properties of the Flat Material ............................ 14
Table 2.3. Specified Tensile Properties of the 304 Alloy ............................................... 14
Table 2.4. Coupon Test Results: Compressive Properties of the Flat Material .............. 17
Table 2.5. Average Measured Compressive Properties of the Flat Material .................. 19
Table 2.6. Specified Compressive Properties of the 304 Alloy ...................................... 20
Table 2.7. Coupon Test Results: Tensile Properties of the Corners ................................ 21
Table 2.8. Average Measured Tensile Properties of the Corners .................................... 23
Table 2.9. 304 Specimen Dimensions ............................................................................ 29
Table 2.10. 404 Specimen Dimensions .......................................................................... 30
Table 2.11. Cross-Sectional Slenderness Values ............................................................ 30
Table 2.12. Imperfection Measurements at Mid-Length ................................................ 35
Table 2.13. 304 Column Test Results ............................................................................. 58
Table 2.14. 404 Column Test Results ............................................................................. 59

Experimental Investigation of the Interaction of Local and Overall Buckling of Stainless Steel I-Columns
School of Civil Engineering Research Report No R887
6
List of Figures Figure 2.1. Compressive Coupon Test Set-Up ............................................................... 16
Figure 2.2. 304 Compressive Stress-Strain Curves ........................................................ 18
Figure 2.3. 404 Compressive Stress-Strain Curves ........................................................ 18
Figure 2.4. Corner Coupons ........................................................................................... 20
Figure 2.5. 304 Tensile Stress-Strain Curves .................................................................. 22
Figure 2.6. 404 Tensile Stress-Strain Curves .................................................................. 22
Figure 2.7. a. Test Set-Up, b. Coupons Before and After Testing .................................. 24
Figure 2.8. Nominal Channel Dimensions (mm) ........................................................... 25
Figure 2.9. ThinWall Analysis ........................................................................................ 26
Figure 2.10. Back-to-Back Connections ........................................................................ 27
Figure 2.11. Milling the Specimen Ends ........................................................................ 28
Figure 2.12. Cross-Sectional Dimensions ...................................................................... 29
Figure 2.13. Imperfection Measurements: Set-Up ......................................................... 31
Figure 2.14. Imperfection Measurements ....................................................................... 32
Figure 2.15a. 404_2500_1 Flange Imperfections ........................................................... 33
Figure 2.15b. 404_2500_1 Web Imperfections .............................................................. 33
Figure 2.16. Local Flange Imperfection ......................................................................... 34
Figure 2.17. Test Set-Up 1 .............................................................................................. 38
Figure 2.18. Top and Bottom Hinge Assemblies ............................................................ 39
Figure 2.19. Load Eccentricity ....................................................................................... 40
Figure 2.20. Location of the Strain Gauges .................................................................... 40
Figure 2.21. Test Set-Up 2 .............................................................................................. 41
Figure 2.22. Hinge Assemblies ....................................................................................... 42
Figure 2.23. Inelastic Local Buckling Load ................................................................... 44
Figure 2.24. Observed Onset of Local Buckling ............................................................ 45
Figure 2.25. I304_1000_2 Specimen Behaviour ............................................................ 47
Figure 2.26. I304_3000_1 Specimen Behaviour ............................................................ 49

Experimental Investigation of the Interaction of Local and Overall Buckling of Stainless Steel I-Columns
School of Civil Engineering Research Report No R887
7
Figure 2.28. Sign Conventions ....................................................................................... 54
Figure 2.29. I304_2000_1 Initial Load Eccentricity ...................................................... 55
Figure 2.30. I304_500_1 and I304_500_2: Failed Shape .............................................. 56
Figure 2.31. 304 Test Results ......................................................................................... 60
Figure 2.32. 404 Test Results ......................................................................................... 60

Experimental Investigation of the Interaction of Local and Overall Buckling of Stainless Steel I-Columns
School of Civil Engineering Research Report No R887
8
List of Symbols A = cross-sectional area
b = overall width
d = overall depth of the section
dG = distance between the centerlines of the strain gauges on the flanges
D1 = reading of LVDT D1
D2 = reading of LVDT D2
eo,end = initial end eccentricity
eo,mid = eo = initial eccentricity at mid-length
E0 = initial Young’s modulus
Iyy = second moment of area about the minor axis
L = length
Lcr = elastic local buckling half wave-length
Le = effective length
n = Ramberg-Osgood parameter
Pcr = elastic local buckling load
Pu = ultimate capacity
r = corner radius, measured along the centerline of the plate
rcy = radius of gyration of one channel about the principal axis parallel to its web
ry = radius of gyration of the cross-section
t = thickness
vo = overall imperfection about the minor axis at mid-length
vflange = amplitude of the local imperfection of the flange
vm = overall imperfection about the major axis at mid-length
vweb = amplitude of the local imperfection of the web
x = coordinate along the longitudinal specimen axis
ε1 = average reading of strain gauges SG1 and SG3
ε2 = average reading of strain gauges SG2 and SG4

Experimental Investigation of the Interaction of Local and Overall Buckling of Stainless Steel I-Columns
School of Civil Engineering Research Report No R887
9
θ = angle between the rolling direction and the direction under consideration
λo = overall slenderness
λs = cross-sectional slenderness
σ0.01% = proportionality limit (0.01% proof stress)
σ0.2% = 0.2% proof stress
σcr = elastic local buckling stress
σu = ultimate material strength

Experimental Investigation of the Interaction of Local and Overall Buckling of Stainless Steel I-Columns
School of Civil Engineering Research Report No R887
10
1. Introduction and Scope
The aim of the research described in this report was to experimentally investigate the
behaviour and the load capacity of stainless steel I-shaped columns subject to the
interaction of local and overall buckling. The specimen cross-section consisted of two
cold-formed plain channels, which were connected back-to-back by sheet metal screws.
All specimens were tested between pinned end conditions under a compressive axial
load with a nominal eccentricity of Le/1500, where Le is the effective length.
The experimental program comprised a total of 24 specimens and was in its entirety
carried out in the J.W. Roderick Materials and Structures Laboratory at the University of
Sydney. Two different stainless steel alloys were included in the program: austenitic
AISI304 and ferritic AISI404. For both alloys the material was supplied in sheets of
1.2mm thickness, with a length in the rolling direction of 3048mm and a transverse
width of 1219mm.
No data is currently available in literature on the interaction buckling of stainless steel
columns with an I-shaped cross-section. In this context it should be noted that Johnson
and Winter (1966) conducted a series of 11 column tests on back-to-back 304 alloy
channels. However, these results relate exclusively to overall flexural buckling.
The aim of this research report is to generate previously non-existent data pertaining to
the interaction buckling of stainless steel back-to-back channels. In order to have a high
degree of interaction reflected in the column strength curve, a high target value of 2.0
was chosen for the cross-sectional slenderness of the test specimens.
The cross-sectional slenderness λs is defined in terms of the measured 0.2% proof stress
of the flat material σ0.2% and the elastic critical buckling stress σcr as obtained from a
finite strip analysis:

Experimental Investigation of the Interaction of Local and Overall Buckling of Stainless Steel I-Columns
School of Civil Engineering Research Report No R887
11
cr
%2.0s σ
σ=λ
(1)
Similarly the overall slenderness of the specimens is defined as:
E
%2.0o σ
σ=λ
(2)
where σE is the elastic overall Euler buckling stress.
The data presented in this report will serve as a basis for further research, in particular
the calibration of finite element models, the evaluation of current design practices and
the proposal of a direct strength method for stainless steel columns.
2 Experimental Investigation
2.1 Material Properties
An extensive test program was set up to determine the material properties of the 304
and 404 alloys, taking into account that stainless steel generally exhibits different
properties in tension and compression, combined with a certain degree of anisotropy.
Furthermore, its strain-hardening ability results in the cold-worked corner areas
typically revealing significantly higher strength compared to the flat plate material.
2.1.1 Tensile Properties of the Flat Material
Six tension coupons were cut from the flat plate material for each alloy. Three coupons
were cut along the longitudinal direction of the plate (the rolling direction), while the
other three coupons were cut in the transverse direction, perpendicular to the rolling

Experimental Investigation of the Interaction of Local and Overall Buckling of Stainless Steel I-Columns
School of Civil Engineering Research Report No R887
12
direction. All coupons had a nominal width of 12.5 mm and a gauge length of 50 mm
with all dimensions conforming to the specifications of AS/NZS:1391 (1991).
The coupons were tested in a 300 kN capacity MTS Sintech 65/G machine operated in
displacement control mode. A constant displacement rate of 2.00 mm/min was
maintained. This corresponds to a strain rate of approximately 5x10⁻⁴/s, which is near
the low end of the range set by AS/NZS:1391. The tests were halted repeatedly for 2
minutes at a time to allow for the static material properties to be determined.
Two out of every group of three nominally identical coupons were instrumented with a
40 mm base extensometer. The extensometer has a range of 4.2 mm. Resetting the
extensometer several times during the test allowed for the complete stress-strain curve
to be determined. The third specimen in every set was instrumented with two 5 mm
strain gauges at mid-length, to allow an accurate check of the initial modulus E0 and the
proportionality stress σ0.01%.
The coupons were identified by a label carrying the alloy, the direction of the coupon
axis relative to the rolling direction (LT = Longitudinal Tension; TT = Transverse
Tension) and a serial number. For instance, 304_LT_1 is the first coupon in the
longitudinal direction of the 304 alloy.
Table 2.1 lists the details of every individual test. The resulting stress-strain curves can
be found in Appendix A. Table 2.2 displays the (static) material properties of each alloy,
obtained as averages for each set of coupons. The initial modulus E0 is listed, as well as
the proportionality limit σ0.01%, the 0.2% proof stress σ0.2%, the ultimate tensile strength
σu, the Ramberg-Osgood parameter n, and the elongation after fracture. It also shows
the anisotropy ratio, defined as the ratio of the 0.2% proof stress in a particular direction
to the 0.2% proof stress in the rolling direction.

Experimental Investigation of the Interaction of Local and Overall Buckling of Stainless Steel I-Columns
School of Civil Engineering Research Report No R887
13
Table 2.1. Coupon Test Results: Tensile Properties of the Flat Material
Specimen Material θ Instrumen- Strain Rate b A E0 σ0.01% σ0.2% σu n Elongation
- - o (1) tation (2) mm/min mm mm2 GPa MPa MPa MPa - %
304_LT_1 304 0 SG 2.00 12.51 15.01 186 137 263 656 4.5 69
304_LT_2 304 0 Ex 2.00 12.51 15.01 195 139 263 705 4.5 73
304_LT_3 304 0 Ex 2.00 12.51 15.02 197 104 252 707 3.5 70
304_TT_1 304 90 SG 2.00 12.51 15.01 194 146 258 672 5 74
304_TT_2 304 90 Ex 2.00 12.49 14.99 202 177 264 687 7.5 74
304_TT_3 304 90 Ex 2.00 12.55 15.06 189 207 263 686 12.5 74
404_LT_1 404 0 SG 2.00 12.52 15.03 207 219 302 451 9.5 33
404_LT_2 404 0 Ex 2.00 12.52 15.02 194 240 300 449 13.5 35
404_LT_3 404 0 Ex 2.00 12.54 15.04 202 235 305 449 11.5 35
404_TT_1 404 90 SG 2.00 12.54 15.05 220 269 310 450 21 34
404_TT_2 404 90 Ex 2.00 12.48 14.98 218 275 310 452 25 36
404_TT_3 404 90 Ex 2.00 12.54 15.05 209 272 311 451 22 35
(1) θ is the angle between the rolling direction and the longitudinal axis of the test coupon.
(2) Ex = Extensometer, SG = Strain Gauges

Experimental Investigation of the Interaction of Local and Overall Buckling of Stainless Steel I-Columns
School of Civil Engineering Research Report No R887
14
Table 2.2. Average Measured Tensile Properties of the Flat Material
Material Dir. θ E0 σ0.01% σ0.2% σu n Aniso. Elong.
o (1) GPa MPa MPa MPa - Ratio % (2)
304 LT 0 193 127 259 689 4 1.00 71
TT 90 195 177 262 682 7.5 1.01 74
404 LT 0 201 231 302 450 11 1.00 34
TT 90 216 272 310 451 22.5 1.03 35
(1) θ is the angle between the rolling direction and the direction considered. (2) Elongation after fracture.
It can be concluded that the 304 austenitic steel displays virtually no anisotropy, while
the 404 ferritic steel exhibits very modest anisotropy in tension. It can also be seen that
non-linear behaviour and early loss of stiffness are more pronounced in the austenitic
304. This is reflected in a lower proportionality limit and a lower n-value, indicating a
more rounded stress-strain curve. Both alloys demonstrate good ductility, with the 404
alloy reaching an elongation after fracture of around 35%, while the 304 alloy achieved
values in excess of 70%.
Both AS/NZS:4673 (2001) and EN 1993-1-4 (2004) specify tensile properties for 304
austenitic stainless steel. The predictions are listed in Table 2.3. It can be seen that both
standards are conservative with respect to the 0.2% proof stress: AS/NZS:4673
underestimates σ0.2% by 20%, while EN 1993-1-4 underestimates σ0.2% by roughly 10%.
Both standards underestimate the ultimate tensile strength σu by 20-25%.
Table 2.3. Specified Tensile Properties of the 304 Alloy
Material Dir. θ Eo σ0.01% σ0.2% σu n Aniso.
o (1) GPa MPa MPa MPa - Ratio
AS 4673 LT 0 195 140 205 520 7.5 1.00
TT 90 195 118 205 520 5.5 1.00
EC3 LT 0 200 140 230 540 6 1.00
TT 90 200 158 230 540 8 1.00
(1) θ is the angle between the rolling direction and the direction considered.
Experimental Investigation of the Interaction of Local and Overall Buckling of Stainless Steel I-Columns
School of Civil Engineering Research Report No R887
15
2.1.2 Compressive Properties of the Flat Material
The compressive properties of the 304 and 404 alloys were measured in the longitudinal
(rolling) direction of the plate, the transverse direction, and the diagonal direction
(under a 45 degree angle with the rolling direction). Uniaxial tests in three independent
directions are necessary to determine the coefficients in Hill’s anisotropic yield criterion
(1950).
A special jig was devised for compression coupon testing, which is shown in Fig. 2.1.
The concept was successfully used before by Rasmussen and Hancock (1993), Gardner
and Nethercot (2003), and Lecce and Rasmussen (2005). Rectangular coupons with
nominal dimensions of 25 mm by 93 mm were cut from the flat plate material. Seven
coupons were glued together to build up a nominal thickness of 8.4 mm and were
machined square. The specimens were instrumented with two 5 mm strain gauges at
mid-length, applied on the laminated sides. The gauges typically reached the end of
their measuring range around 1.5% strain, which allowed a sufficient portion of the
stress-strain curve to be determined. When placed in the jig, the coupons protruded
approximately 3 mm beyond the top of the jig, which was again amply sufficient to
reach 1.5% strain. The specimens were greased before being placed in the jig, to
eliminate friction between the specimen surfaces and the jig. The six bolts were loosely
tightened to prevent buckling of the specimen about its weak axis, while at the same
time allowing lateral expansion of the specimen due to the Poisson’s effect. The
rotational base was initially left free to rotate to allow flush contact between the top and
bottom surfaces of the specimen and the end platens, after which it was locked in place
for the remainder of the test, to ensure a fixed-ended support condition.
A consistent strain rate of 0.1 mm/min was applied. Each test was repeatedly halted for
2 minutes in order to obtain the static material properties.

Experimental Investigation of the Interaction of Local and Overall Buckling of Stainless Steel I-Columns
School of Civil Engineering Research Report No R887
16
Figure 2.1. Compressive Coupon Test Set-Up

Experimental Investigation of the Interaction of Local and Overall Buckling of Stainless Steel I-Columns
School of Civil Engineering Research Report No R887
17
Table 2.4. Coupon Test Results: Compressive Properties of the Flat Material
Specimen Material θ Strain Rate Number b A L E0 σ0.01% σ0.2% n
- - o (1) mm/min of Plies mm mm2 mm GPa MPa MPa -
304_LC_1 304 0 0.1 7 25.01 210.04 92.90 190 86 240 3
304_LC_2 304 0 0.1 7 24.97 209.78 92.85 191 82 246 3
304_DC_1 304 45 0.1 8 25.02 240.19 92.96 196 127 246 4.5
304_DC_2 304 45 0.1 7 25.00 209.97 92.97 190 118 243 4
304_TC_1 304 90 0.1 7 24.98 209.86 92.84 207 108 251 4
304_TC_2 304 90 0.1 7 24.98 209.83 92.86 211 120 248 4
404_LC_1 404 0 0.1 7 25.00 210.00 92.97 193 206 293 8.5
404_LC_2 404 0 0.1 7 24.98 209.86 93.01 197 215 286 10.5
404_DC_1 404 45 0.1 7 25.02 210.14 92.92 199 262 322 14.5
404_DC_2 404 45 0.1 7 24.98 209.80 92.88 201 253 318 13
404_TC_1 404 90 0.1 7 24.99 209.89 92.91 199 226 326 8
404_TC_2 404 90 0.1 7 25.03 210.25 92.90 217 247 323 11
(1) θ is the angle between the rolling direction and the longitudinal axis of the test coupon.

Experimental Investigation of the Interaction of Local and Overall Buckling of Stainless Steel I-Columns
School of Civil Engineering Research Report No R887
18
0
50
100
150
200
250
300
350
400
0 0.5 1 1.5 2
Strain (%)
Stre
ss (M
Pa)
304_LC_1
304_LC_2
304_DC_1
304_DC_2
304_TC_1
304_TC_2
Figure 2.2. 304 Compressive Stress-Strain Curves
0
50
100
150
200
250
300
350
400
450
0 0.5 1 1.5 2
Strain (%)
Stre
ss (M
Pa)
404_LC_1
404_LC_2
404_DC_1
404_DC_2
404_TC_1
404_TC_2
Figure 2.3. 404 Compressive Stress-Strain Curves

Experimental Investigation of the Interaction of Local and Overall Buckling of Stainless Steel I-Columns
School of Civil Engineering Research Report No R887
19
Table 2.4 contains the details of each individual test. A total of 12 specimens were tested,
with twin tests being performed in each of the three directions considered for each of
the two alloys. The symbol b denotes the coupon width, L is the coupon length and A
stands for the cross-sectional area. Fig. 2.3 and Fig. 2.4 provide the resulting stress-
strain curves of the 304 and the 404 tests respectively.
Table 2.5 shows the measured (static) compressive properties in each direction for each
alloy, averaged out over each pair of tests.
Table 2.5. Average Measured Compressive Properties of the Flat Material
Material Dir. θ E0 σ0.01% σ0.2% n Aniso.
o (1) GPa MPa MPa - Ratio
304
LC 0 191 84 243 3 1.00
DC 45 193 123 245 4.5 1.01
TC 90 209 114 250 4 1.03
404
LC 0 195 210 290 9.5 1.00
DC 45 200 257 321 13.5 1.10
TC 90 208 236 325 9.5 1.12
(1) θ is the angle between the rolling direction and the direction considered.
The non-linear behaviour of both alloys is even more pronounced in compression than
in tension, reflected by lower proportionality limits and lower n-values. The austenitic
304 alloy displays only very moderate anisotropy, while the anisotropic behaviour is
more evident in the ferritic alloy and reaches 12% in the transverse direction. The
transverse directions reveal the highest 0.2% proof stress, while the longitudinal
directions exhibit the lowest 0.2% proof stress. Properties are different in tension (Table
2.2) and compression (Table 2.5). These conclusions concur with earlier research by
Becque and Rasmussen (2006) and Lecce and Rasmussen (2005).
Table 2.6 summarizes the compressive properties of the 304 alloy specified by the
Australian and European standards. Both standards correctly predict little or no

Experimental Investigation of the Interaction of Local and Overall Buckling of Stainless Steel I-Columns
School of Civil Engineering Research Report No R887
20
anisotropy. AS/NZS:4673 (2001) underestimates the 0.2% proof stress by 20%, while
EN1993-1-4 (2004) is more accurate with only a 5% error. It is felt however that the n-
values put forward by the Eurocode are on the high side.
Table 2.6. Specified Compressive Properties of the 304 Alloy
Material Dir. θ E0 σ0.01% σ0.2% n Aniso.
o (1) GPa MPa MPa - Ratio
AS4673 LC 0 195 90 195 4 1.00
TC 90 195 135 205 7 1.05
EC3 LC 0 200 140 230 6 1.00
TC 90 200 158 230 8 1.00
(1) θ is the angle between the rolling direction and the direction considered.
2.1.3 Material Properties of the Corners
Longitudinal tensile tests were carried out on small coupons cut from the corner zones
to assess the influence of cold-working on the material properties. Compressive tests
proved to be impractical due the limited thickness of the material and the small corner
radius. The coupons were manufactured with a nominal width of 6 mm, as illustrated in
Fig. 2.4, and a gauge length of 24 mm. All dimensions conformed to the specifications
of AS/NZS:1391.
6 mm
Figure 2.4. Corner Coupons
Experimental Investigation of the Interaction of Local and Overall Buckling of Stainless Steel I-Columns
School of Civil Engineering Research Report No R887
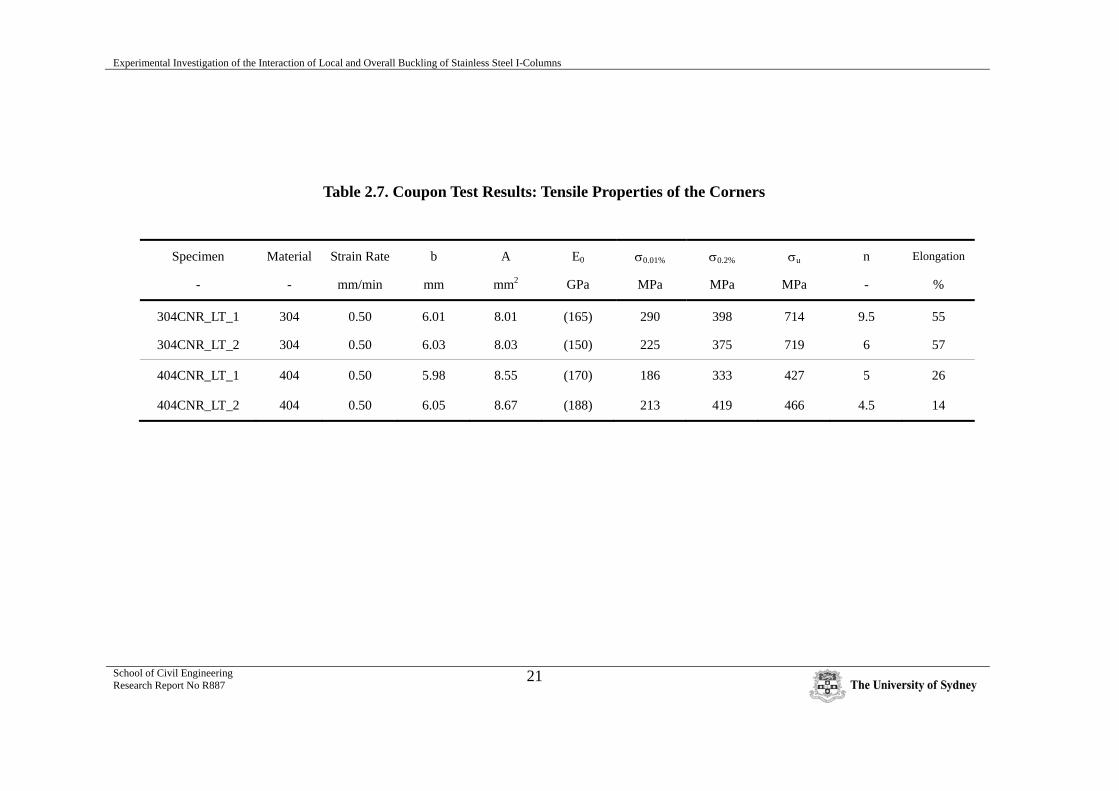
21
Table 2.7. Coupon Test Results: Tensile Properties of the Corners
Specimen Material Strain Rate b A E0 σ0.01% σ0.2% σu n Elongation
- - mm/min mm mm2 GPa MPa MPa MPa - %
304CNR_LT_1 304 0.50 6.01 8.01 (165) 290 398 714 9.5 55
304CNR_LT_2 304 0.50 6.03 8.03 (150) 225 375 719 6 57
404CNR_LT_1 404 0.50 5.98 8.55 (170) 186 333 427 5 26
404CNR_LT_2 404 0.50 6.05 8.67 (188) 213 419 466 4.5 14
Experimental Investigation of the Interaction of Local and Overall Buckling of Stainless Steel I-Columns
School of Civil Engineering Research Report No R887
22
0
100
200
300
400
500
600
0 0.25 0.5 0.75 1 1.25 1.5
Strain (%)
Stre
ss (M
Pa)
304CNR_LT_1
304CNR_LT_2
304_LT_1
304_LT_2
304_LT_3
Figure 2.5. 304 Tensile Stress-Strain Curves
0
100
200
300
400
500
600
0 0.25 0.5 0.75 1 1.25 1.5
Strain (%)
Stre
ss (M
Pa)
404CNR_LT_1
404CNR_LT_2
404_LT_1
404_LT_2
404_LT_3
Figure 2.6. 404 Tensile Stress-Strain Curves

Experimental Investigation of the Interaction of Local and Overall Buckling of Stainless Steel I-Columns
School of Civil Engineering Research Report No R887
23
Two coupons were tested for each alloy. The specimens were identified by a label
specifying the alloy, followed by “CNR” to indicate they were cut from a corner area,
“LT” to indicate longitudinal tension, and a serial number. For instance 304CNR_LT_2
is the second coupon cut from the corner material of a 304 channel.
All four specimens were instrumented with two 2 mm strain gauges at mid-length, one
on either side of the specimen.
The coupons were tested in a 100kN MTS 810 material testing machine with hydraulic
wedge grips. The ends of the coupons were flattened to allow the testing machine to
develop sufficient grip. A constant displacement rate of 0.5 mm/min was applied, which
corresponds to a strain rate of approximately 2x10⁻⁴/s. This is near the low end of the
range specified by AS/NZS:1391. The test was repeatedly halted for 2 minutes to obtain
the static material properties.
Table 2.7 lists the details of each test. Average (static) material properties are provided
in Table 2.8. Since a small eccentricity inevitably existed between the centroid of the
corner area and the work line of the applied load, introduced at the flattened coupon
ends, the initial part of the measured stress-strain curve was to some degree affected by
bending. The effect of bending cannot simply be eliminated by averaging the strain
gauge readings, since the mid-point between the gauges does not coincide with the
centroid. This explains the lower-than-expected values of the initial Young’s moduli E0,
listed in brackets in Table 2.7. However, it was observed that the readings of both strain
gauges converged towards each other as the load increased and the effect of bending
diminished.
Table 2.8. Average Measured Tensile Properties of the Corners
Material Dir. θ σ0.01% σ0.2% σu n Elongation
o (1) MPa MPa MPa - %
304 LT 0 257 387 717 7.5 56
404 LT 0 199 376 447 4.5 20
(1) θ is the angle between the rolling direction and the direction considered.

Experimental Investigation of the Interaction of Local and Overall Buckling of Stainless Steel I-Columns
School of Civil Engineering Research Report No R887
24
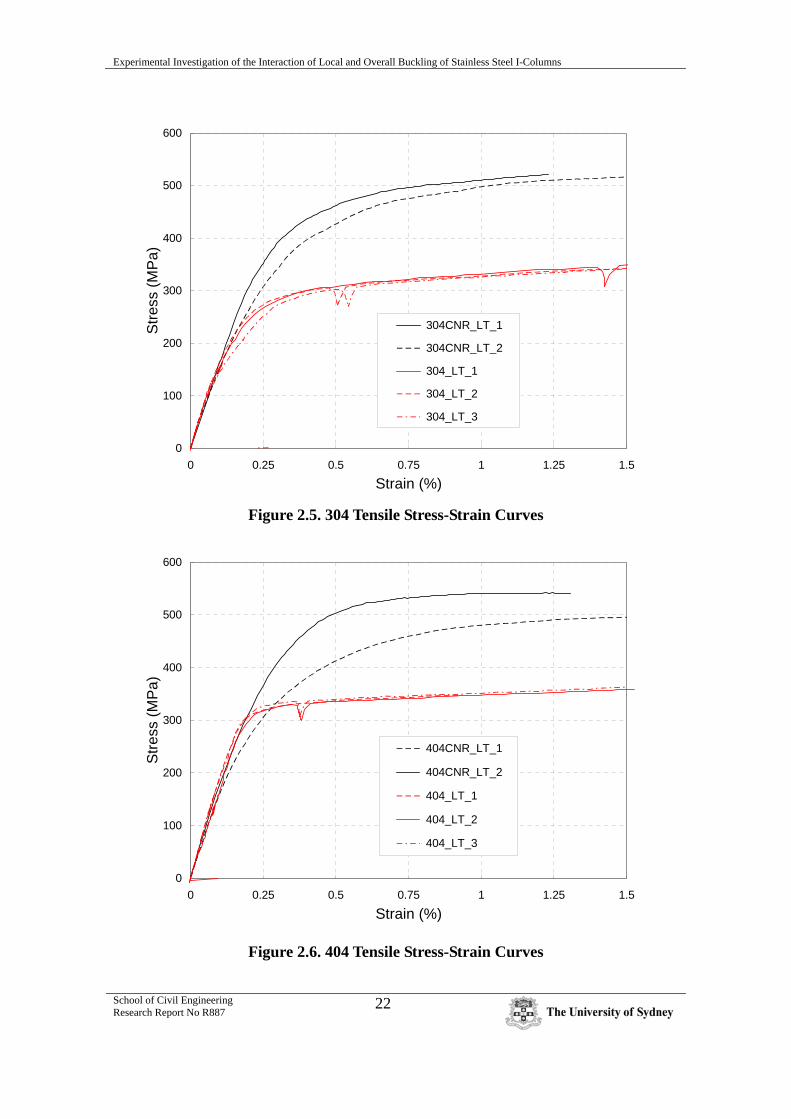
Figures 2.5 and 2.6 display the stress-strain curves of the corner tensile coupons and
make a graphic comparison with the longitudinal tensile stress-strain curves of the flat
material.
It can be concluded that cold-working has a profound effect on the material properties.
The effect is most pronounced in the austenitic 304 alloy, where the 0.2% proof stress
increased by 50%, while the ferritic 404 alloy showed a gain of 25%. The ultimate
tensile strength σu stayed roughly the same, while the ductility, measured on the gauge
lengths prescribed by the Australian standards, decreased by roughly 15% in each alloy.
Fig. 2.7b shows the coupons before and after testing, while Fig. 2.7a illustrates the test
set-up.
304
404
Figure 2.7. a. Test Set-Up, b. Coupons Before and After Testing
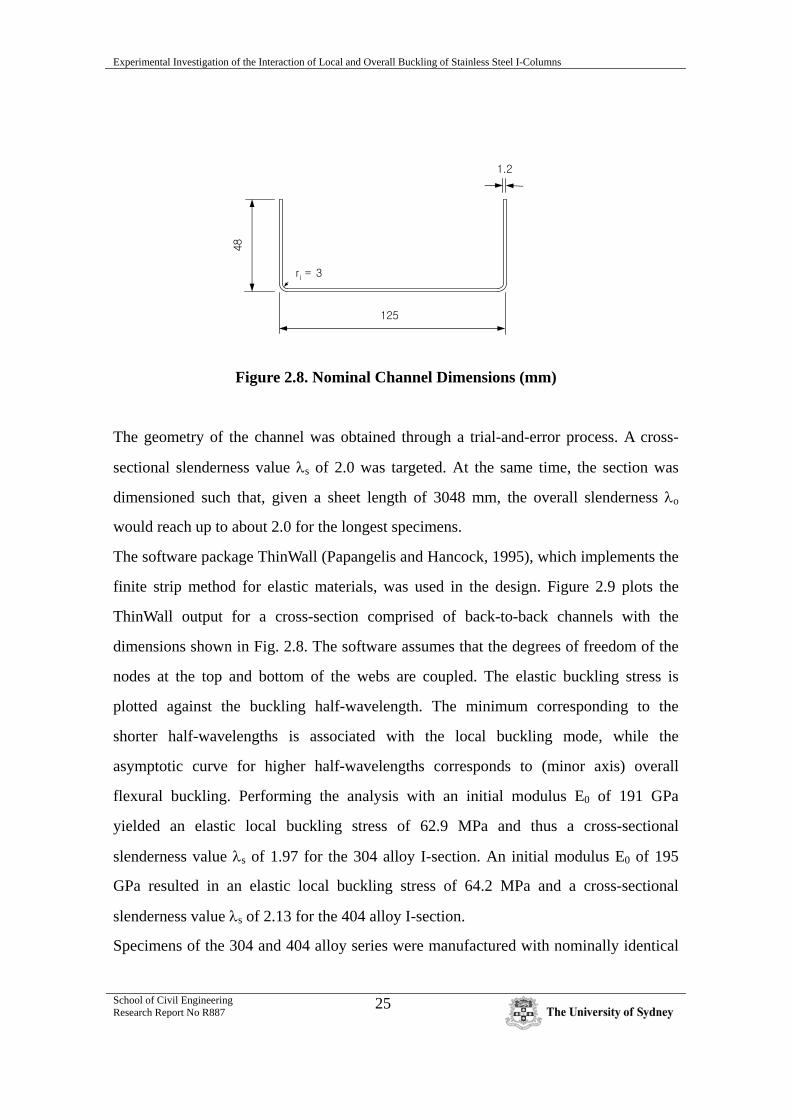
2.2 Section Design and Geometry
I-sections were manufactured by connecting brake-pressed plain channels in a back-to-
back position. The nominal dimensions shown in Fig. 2.8 were submitted to a
specialized sheet metal fabrication shop.
Experimental Investigation of the Interaction of Local and Overall Buckling of Stainless Steel I-Columns
School of Civil Engineering Research Report No R887
25
48
125
ri = 3
1.2
Figure 2.8. Nominal Channel Dimensions (mm)
The geometry of the channel was obtained through a trial-and-error process. A cross-
sectional slenderness value λs of 2.0 was targeted. At the same time, the section was
dimensioned such that, given a sheet length of 3048 mm, the overall slenderness λo
would reach up to about 2.0 for the longest specimens.
The software package ThinWall (Papangelis and Hancock, 1995), which implements the
finite strip method for elastic materials, was used in the design. Figure 2.9 plots the
ThinWall output for a cross-section comprised of back-to-back channels with the
dimensions shown in Fig. 2.8. The software assumes that the degrees of freedom of the
nodes at the top and bottom of the webs are coupled. The elastic buckling stress is
plotted against the buckling half-wavelength. The minimum corresponding to the
shorter half-wavelengths is associated with the local buckling mode, while the
asymptotic curve for higher half-wavelengths corresponds to (minor axis) overall
flexural buckling. Performing the analysis with an initial modulus E0 of 191 GPa
yielded an elastic local buckling stress of 62.9 MPa and thus a cross-sectional
slenderness value λs of 1.97 for the 304 alloy I-section. An initial modulus E0 of 195
GPa resulted in an elastic local buckling stress of 64.2 MPa and a cross-sectional
slenderness value λs of 2.13 for the 404 alloy I-section.
Specimens of the 304 and 404 alloy series were manufactured with nominally identical

Experimental Investigation of the Interaction of Local and Overall Buckling of Stainless Steel I-Columns
School of Civil Engineering Research Report No R887
26
geometry, which allowed a direct comparison between the behaviour of the two alloys.
Figure 2.9. ThinWall Analysis
A range of six different lengths was selected for the specimens: 500 mm, 1000 mm,
1500 mm, 2000 mm, 2500 mm and 3000 mm. A length of 3000 mm corresponds to an
overall slenderness λo of 1.90 for the 304 alloy and a λo of 2.06 for the 404 alloy. Twin
specimens were fabricated for each length for each alloy, amounting to a total of 24
specimens.
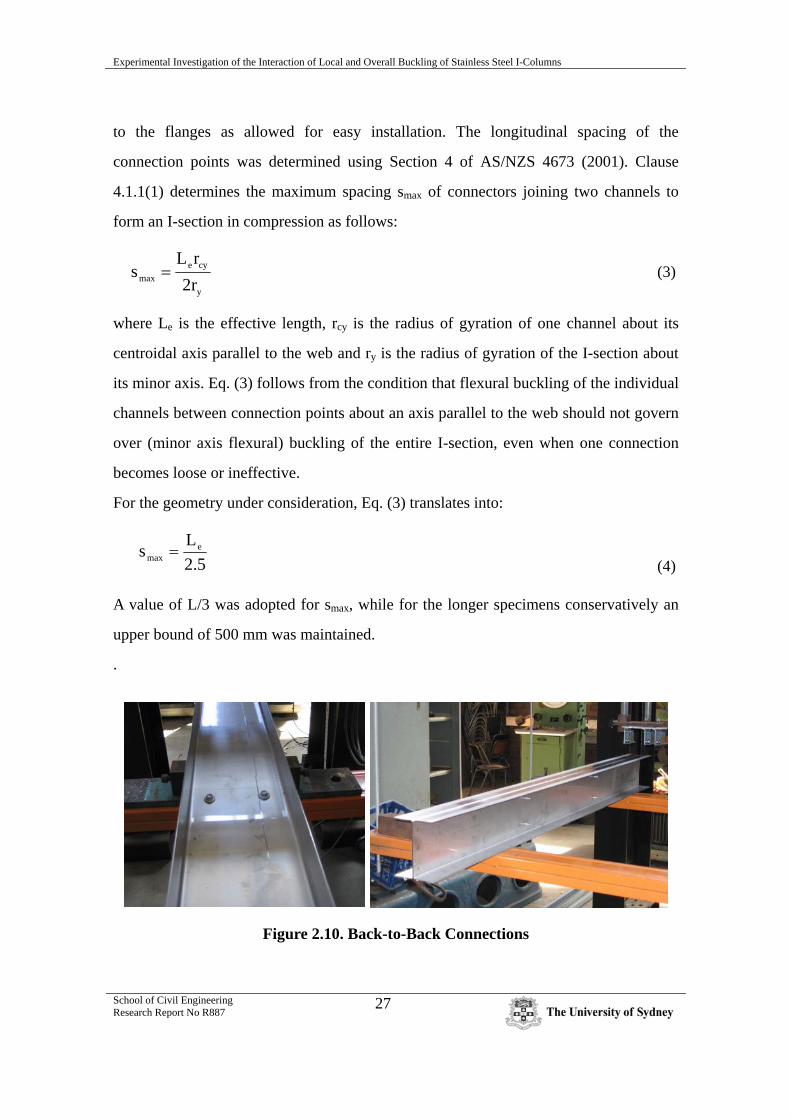
48 channels of suitable lengths were connected back-to-back using sheet metal screws,
as illustrated by Fig. 2.10. The screws were installed on either side of the webs, as close
Experimental Investigation of the Interaction of Local and Overall Buckling of Stainless Steel I-Columns
School of Civil Engineering Research Report No R887
27
to the flanges as allowed for easy installation. The longitudinal spacing of the
connection points was determined using Section 4 of AS/NZS 4673 (2001). Clause
4.1.1(1) determines the maximum spacing smax of connectors joining two channels to
form an I-section in compression as follows:
y
cyemax r2
rLs = (3)
where Le is the effective length, rcy is the radius of gyration of one channel about its
centroidal axis parallel to the web and ry is the radius of gyration of the I-section about
its minor axis. Eq. (3) follows from the condition that flexural buckling of the individual
channels between connection points about an axis parallel to the web should not govern
over (minor axis flexural) buckling of the entire I-section, even when one connection
becomes loose or ineffective.
For the geometry under consideration, Eq. (3) translates into:
5.2Ls e
max = (4)
A value of L/3 was adopted for smax, while for the longer specimens conservatively an
upper bound of 500 mm was maintained.
.
Figure 2.10. Back-to-Back Connections
Experimental Investigation of the Interaction of Local and Overall Buckling of Stainless Steel I-Columns
School of Civil Engineering Research Report No R887
28
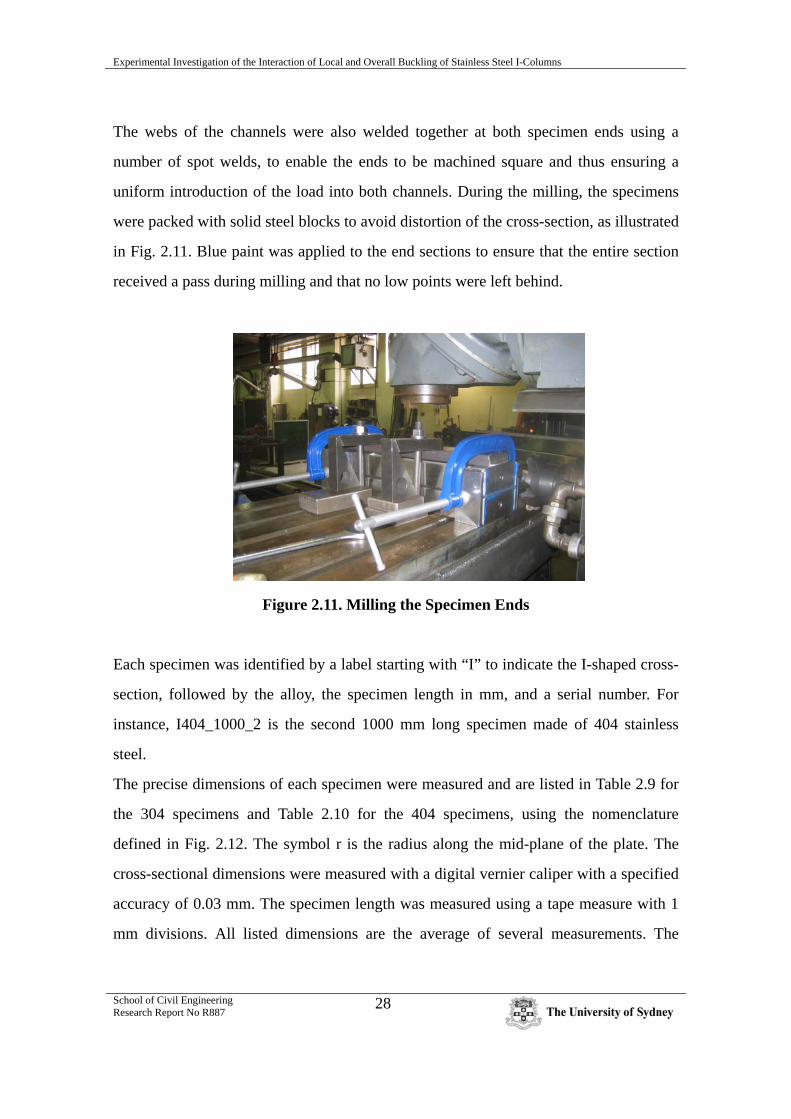
The webs of the channels were also welded together at both specimen ends using a
number of spot welds, to enable the ends to be machined square and thus ensuring a
uniform introduction of the load into both channels. During the milling, the specimens
were packed with solid steel blocks to avoid distortion of the cross-section, as illustrated
in Fig. 2.11. Blue paint was applied to the end sections to ensure that the entire section
received a pass during milling and that no low points were left behind.
Figure 2.11. Milling the Specimen Ends
Each specimen was identified by a label starting with “I” to indicate the I-shaped cross-
section, followed by the alloy, the specimen length in mm, and a serial number. For
instance, I404_1000_2 is the second 1000 mm long specimen made of 404 stainless
steel.
The precise dimensions of each specimen were measured and are listed in Table 2.9 for
the 304 specimens and Table 2.10 for the 404 specimens, using the nomenclature
defined in Fig. 2.12. The symbol r is the radius along the mid-plane of the plate. The
cross-sectional dimensions were measured with a digital vernier caliper with a specified
accuracy of 0.03 mm. The specimen length was measured using a tape measure with 1
mm divisions. All listed dimensions are the average of several measurements. The

Experimental Investigation of the Interaction of Local and Overall Buckling of Stainless Steel I-Columns
School of Civil Engineering Research Report No R887
29
average cross-sectional dimensions of each alloy series are also listed with their
standard deviations.
2b
d
r
t
Figure 2.12. Cross-Sectional Dimensions
Table 2.9. 304 Specimen Dimensions
Specimen L Le d 2b t r
I304_500_1 500 636 126.48 97.02 1.198 4.63
I304_500_2 501 636 126.37 96.77 1.195 4.39
I304_1000_1 999 1135 126.30 96.82 1.208 4.31
I304_1000_2 999 1135 126.35 96.74 1.205 4.37
I304_1500_1 1499 1635 126.42 96.80 1.195 4.17
I304_1500_2 1498 1634 126.24 96.73 1.195 4.59
I304_2000_1 2000 2118 126.61 96.85 1.193 4.07
I304_2000_2 2000 2118 126.42 96.79 1.203 4.34
I304_2500_1 2497 2615 126.50 96.86 1.203 4.31
I304_2500_2 2497 2615 126.34 96.85 1.195 4.49
I304_3000_1 2999 3117 126.31 97.02 1.190 4.28
I304_3000_2 3000 3118 126.23 97.07 1.203 4.06
Average - - 126.38 96.86 1.198 4.33
St. Dev. - - 0.11 0.12 0.005 0.18
All dimensions are in mm.
Experimental Investigation of the Interaction of Local and Overall Buckling of Stainless Steel I-Columns
School of Civil Engineering Research Report No R887
30
Table 2.10. 404 Specimen Dimensions
Specimen L Le d 2b t r
I404_500_1 499 635 125.05 96.63 1.220 3.08
I404_500_2 499 635 124.99 96.60 1.213 3.19
I404_1000_1 999 1135 125.48 96.53 1.218 3.04
I404_1000_2 999 1135 125.24 96.60 1.215 3.14
I404_1500_1 1500 1636 125.34 96.35 1.208 3.16
I404_1500_2 1499 1635 125.47 96.54 1.195 3.30
I404_2000_1 1999 2117 125.36 96.25 1.210 3.16
I404_2000_2 1999 2117 125.28 96.52 1.210 3.17
I404_2500_1 2497 2615 125.12 96.80 1.213 3.02
I404_2500_2 2499 2617 125.16 96.81 1.215 2.99
I404_3000_1 3001 3118 125.28 96.68 1.213 3.05
I404_3000_2 2999 3117 125.12 96.64 1.208 3.06
Average - - 125.24 96.58 1.211 3.11
St. Dev. - - 0.16 0.16 0.006 0.09
All dimensions are in mm.
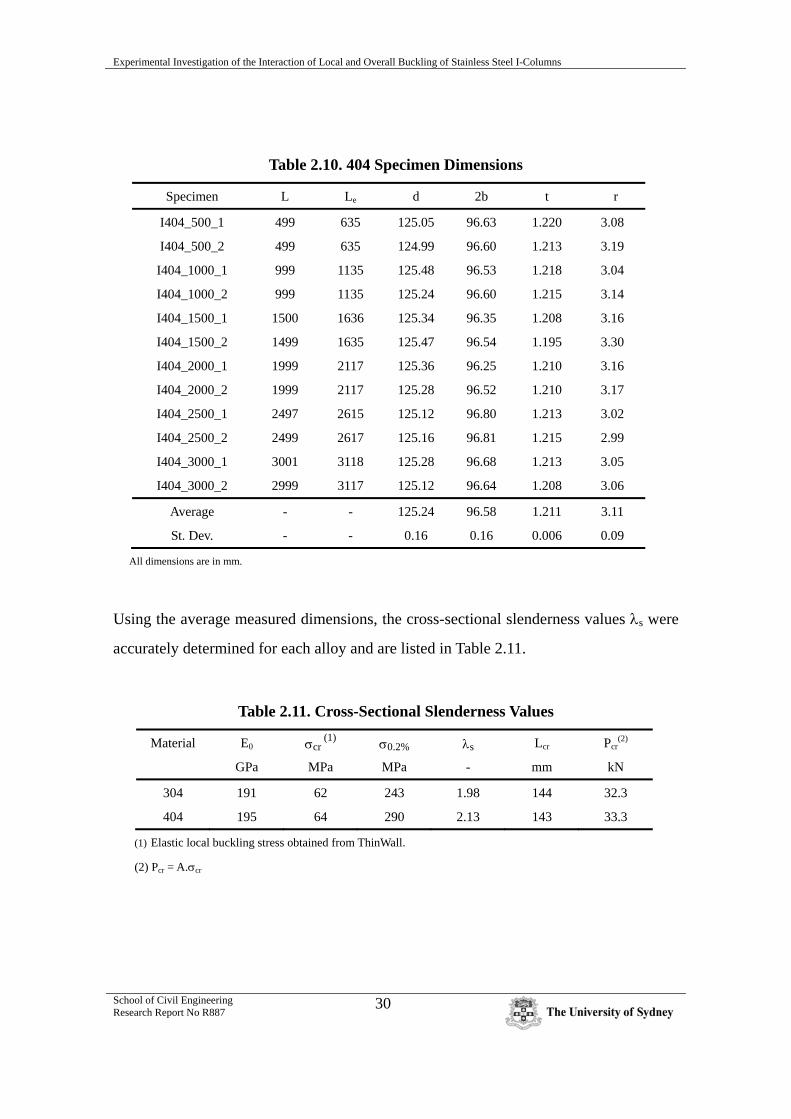
Using the average measured dimensions, the cross-sectional slenderness values λs were
accurately determined for each alloy and are listed in Table 2.11.
Table 2.11. Cross-Sectional Slenderness Values
Material E0 σcr (1) σ0.2% λs Lcr Pcr
(2)
GPa MPa MPa - mm kN
304 191 62 243 1.98 144 32.3
404 195 64 290 2.13 143 33.3
(1) Elastic local buckling stress obtained from ThinWall. (2) Pcr = A.σcr
Experimental Investigation of the Interaction of Local and Overall Buckling of Stainless Steel I-Columns
School of Civil Engineering Research Report No R887
31
2.3 Imperfection Measurements
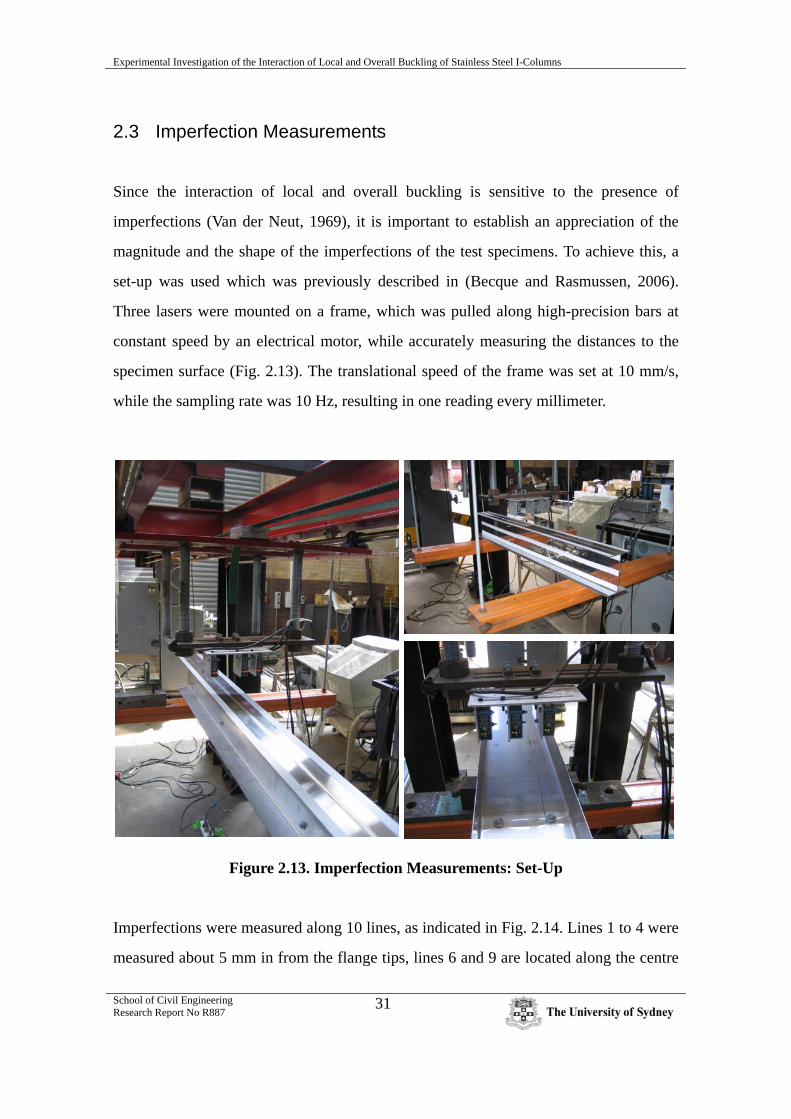
Since the interaction of local and overall buckling is sensitive to the presence of
imperfections (Van der Neut, 1969), it is important to establish an appreciation of the
magnitude and the shape of the imperfections of the test specimens. To achieve this, a
set-up was used which was previously described in (Becque and Rasmussen, 2006).
Three lasers were mounted on a frame, which was pulled along high-precision bars at
constant speed by an electrical motor, while accurately measuring the distances to the
specimen surface (Fig. 2.13). The translational speed of the frame was set at 10 mm/s,
while the sampling rate was 10 Hz, resulting in one reading every millimeter.
Figure 2.13. Imperfection Measurements: Set-Up
Imperfections were measured along 10 lines, as indicated in Fig. 2.14. Lines 1 to 4 were
measured about 5 mm in from the flange tips, lines 6 and 9 are located along the centre

Experimental Investigation of the Interaction of Local and Overall Buckling of Stainless Steel I-Columns
School of Civil Engineering Research Report No R887
32
lines of the webs, and lines 5, 7, 8 and 10 lie about 5 mm in from the rounded corners.
By convention, the imperfections were considered positive in the directions indicated by
Fig. 2.14. As the stainless steel finish was highly reflective, it proved necessary to apply
white tape along the measuring lines to obtain stable readings. The inside of the 304
channels formed an exception since one side of the plate had received a different, duller,
finish and stable readings could be obtained without tape.
1 2
3 4
5 8
6 9
7 10
++
++
++
++
++
Figure 2.14. Imperfection Measurements
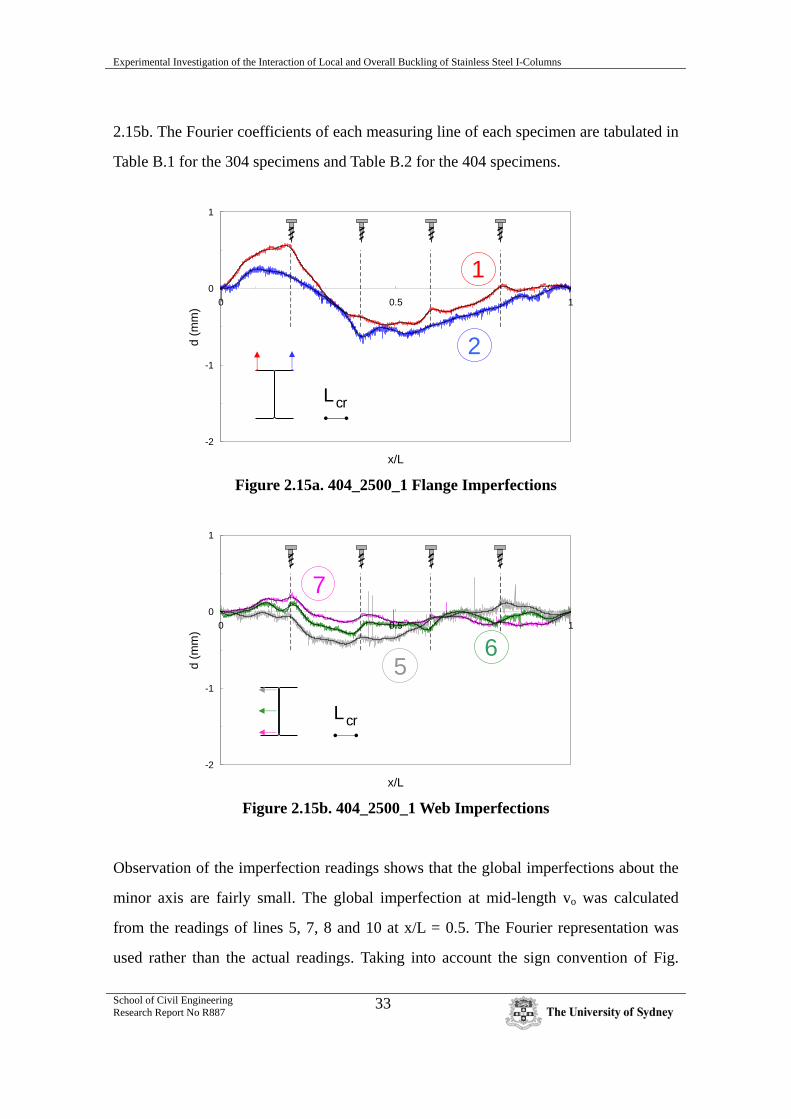
An example of the imperfection readings of a typical specimen (I404_2500_1) can be
found in Figs. 2.15a and 2.15b, for one of the flanges and one of the webs respectively.
The readings are slightly affected by vibrations in the set-up, but good accuracy was
nevertheless achieved. The location of the connectors is indicated in the diagrams and
usually shows up in the readings as a local bump or dent. Similar figures were prepared
for all imperfection data of all 24 specimens and can be found in Appendix B. A Fourier
analysis was performed on the data of each measuring line and the Fourier series was
truncated after a number of terms to eliminate the contribution of the high-frequency
vibrations. However, terms well beyond the local buckling half-wavelength were
retained. The truncated Fourier series is shown in solid black line in Figs. 2.15a and
Experimental Investigation of the Interaction of Local and Overall Buckling of Stainless Steel I-Columns
School of Civil Engineering Research Report No R887
33
2.15b. The Fourier coefficients of each measuring line of each specimen are tabulated in
Table B.1 for the 304 specimens and Table B.2 for the 404 specimens.
-2
-1
0
1
0 0.5 1
x/L
d (m
m)
1
2
Lcr
Figure 2.15a. 404_2500_1 Flange Imperfections
-2
-1
0
1
0 0.5 1
x/L
d (m
m)
56
7
Lcr
Figure 2.15b. 404_2500_1 Web Imperfections
Observation of the imperfection readings shows that the global imperfections about the
minor axis are fairly small. The global imperfection at mid-length vo was calculated
from the readings of lines 5, 7, 8 and 10 at x/L = 0.5. The Fourier representation was
used rather than the actual readings. Taking into account the sign convention of Fig.
Experimental Investigation of the Interaction of Local and Overall Buckling of Stainless Steel I-Columns
School of Civil Engineering Research Report No R887
34
2.14:
vo = [(line 5) + (line 7) – (line 8) – (line 10)] / 4 (5)
The global imperfection vo of each specimen is listed in Table 2.12. Averaged over all
24 specimens, a mean value of L/10500 emerged. It can logically be expected that,
when connecting channels in a back-to-back position, the resulting overall imperfection
is less than that of the individual channels, which explains the fairly small value of vo.
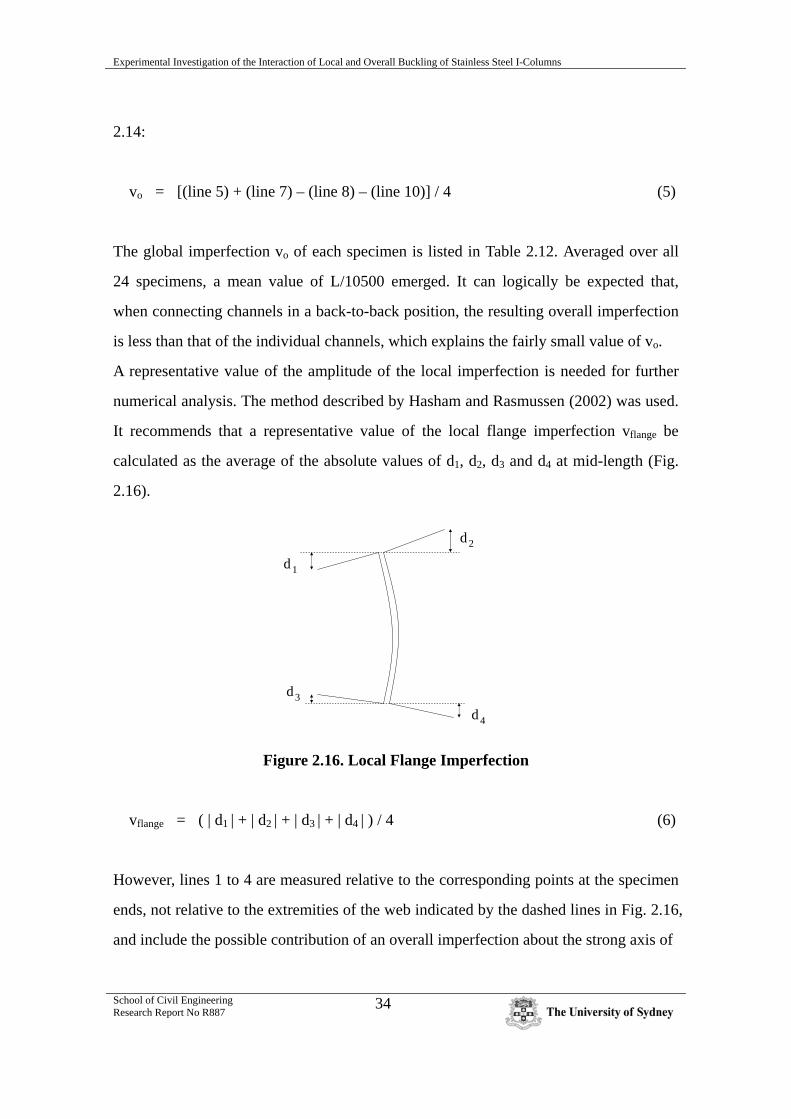
A representative value of the amplitude of the local imperfection is needed for further
numerical analysis. The method described by Hasham and Rasmussen (2002) was used.
It recommends that a representative value of the local flange imperfection vflange be
calculated as the average of the absolute values of d1, d2, d3 and d4 at mid-length (Fig.
2.16).
d
dd
d
1
3
4
2
Figure 2.16. Local Flange Imperfection
vflange = ( | d1 | + | d2 | + | d3 | + | d4 | ) / 4 (6)
However, lines 1 to 4 are measured relative to the corresponding points at the specimen
ends, not relative to the extremities of the web indicated by the dashed lines in Fig. 2.16,
and include the possible contribution of an overall imperfection about the strong axis of

Experimental Investigation of the Interaction of Local and Overall Buckling of Stainless Steel I-Columns
School of Civil Engineering Research Report No R887
35
Table 2.12. Imperfection Measurements at Mid-Length (All dimensions in mm) 1 2 3 4 vm vflange 6 9 vweb 5 7 8 10 vo I304_500_1 -0.004 -0.023 -0.475 0.264 0.046 0.214 -0.148 -0.078 0.184 0.255 0.113 -0.005 -0.078 0.113 I304_500_2 -0.116 -0.303 -0.055 0.475 -0.209 0.179 0.058 -0.121 0.012 0.110 0.033 -0.102 -0.121 0.092 I304_1000_1 0.247 0.077 -0.204 -0.003 0.133 0.093 0.046 -0.050 0.040 0.018 0.037 0.073 -0.050 0.008 I304_1000_2 0.092 0.100 0.167 -0.104 0.032 0.100 -0.098 0.113 0.102 -0.122 0.053 -0.166 0.113 -0.004 I304_1500_1 -0.219 -1.816 -0.730 -0.118 -0.297 0.759 -0.344 -0.132 0.045 -0.315 -0.319 -0.257 -0.132 -0.061 I304_1500_2 -0.258 0.388 -0.212 0.061 0.070 0.230 -0.171 -0.158 0.024 -0.263 -0.110 -0.223 -0.158 0.002 I304_2000_1 -0.374 -0.774 -0.545 -0.398 -0.051 0.523 -0.063 -0.349 0.113 -0.015 -0.259 -0.043 -0.349 0.030 I304_2000_2 -0.465 -0.812 -0.620 -0.367 -0.073 0.566 0.018 -0.503 0.027 0.069 0.057 -0.520 -0.503 0.287 I304_2500_1 -0.841 -0.761 -0.248 -0.988 -0.092 0.709 0.204 -1.064 0.093 0.357 0.171 -0.814 -1.064 0.602 I304_2500_2 0.115 -1.092 -0.042 -1.756 0.205 0.775 1.049 -1.809 0.375 1.248 0.336 -0.824 -1.809 1.054 I304_3000_1 -0.227 -0.554 -0.634 -0.006 -0.035 0.355 -0.203 -0.331 0.107 -0.206 0.013 -0.545 -0.331 0.171 I304_3000_2 -0.584 -0.687 -0.452 -0.350 -0.118 0.518 -0.306 -0.308 0.084 -0.150 -0.245 -0.189 -0.308 0.026
Average -0.032 0.419 0.100I404_500_1 0.456 0.308 0.305 0.401 0.015 0.368 0.123 -0.050 0.058 0.030 0.009 -0.077 -0.050 0.041 I404_500_2 0.488 0.319 0.660 0.455 -0.077 0.480 -0.128 -0.091 0.069 0.012 -0.075 -0.007 -0.091 0.009 I404_1000_1 0.245 0.171 -0.118 0.263 0.068 0.165 0.275 0.041 0.089 0.126 0.071 0.037 0.041 0.030 I404_1000_2 -0.090 0.344 0.162 0.105 -0.003 0.174 0.035 0.071 0.017 -0.108 0.163 0.124 0.071 -0.035 I404_1500_1 -0.891 0.417 -0.540 -0.148 0.054 0.473 -0.244 0.774 0.327 -0.246 0.302 0.010 0.774 -0.182 I404_1500_2 -0.077 0.246 -0.298 -0.470 0.234 0.156 0.139 0.929 0.226 0.364 0.238 0.351 0.929 -0.170 I404_2000_1 0.092 -0.563 -0.383 -0.359 0.068 0.315 -0.586 -0.371 0.208 -0.204 -0.637 0.132 -0.371 -0.151 I404_2000_2 -0.590 -0.662 -0.407 -0.518 -0.081 0.544 -0.412 -0.487 0.120 -0.200 -0.433 -0.197 -0.487 0.013 I404_2500_1 -0.456 -0.555 -0.428 -1.272 0.172 0.678 -0.175 -0.635 0.076 -0.133 -0.337 -0.449 -0.635 0.154 I404_2500_2 -0.800 -0.531 -1.024 -0.246 -0.015 0.650 -0.400 -0.140 0.215 -0.808 -0.269 -0.723 -0.140 -0.054 I404_3000_1 -0.042 -0.624 -0.486 -0.998 0.204 0.538 -0.130 -1.009 0.216 -0.027 -0.485 -0.400 -1.009 0.224 I404_3000_2 -1.663 0.139 -1.597 -0.009 0.021 0.848 0.361 -0.857 0.286 -0.229 0.995 -1.959 -0.857 0.895
Average 0.055 0.449 0.159

Experimental Investigation of the Interaction of Local and Overall Buckling of Stainless Steel I-Columns
School of Civil Engineering Research Report No R887
36
the specimen. If the specimens were to have no overall imperfection in this direction,
the statistic average of the variable
vm = [(line 1) + (line 2) – (line 3) – (line 4)] / 4 (7)
over a theoretically infinite number of measurements would be zero. Thus, in the
presence of an overall imperfection, an estimate of this imperfection can be obtained by
calculating vm at mid-length. The local flange imperfection vflange can subsequently be
calculated as:
vflange = [ |(line 1) – vm| + |(line 2) – vm| + |(line 3) + vm| + |(line 4) + vm| ] / 4 (8)
where the readings of line 1 to line 4 are obtained at mid-length.
vflange, averaged over all available specimens, is then accepted as a representative value
of the local flange imperfection. Table 2.12 shows that the average value of vm over all
specimens is roughly zero, which is consistent with our rationale.
The local web imperfection vweb of each specimen can be calculated as:
vweb = ( |vweb1| + |vweb2| ) / 2
vweb1 = (line 6) – [ (line 5) + (line 7) ] / 2
vweb2 = (line 9) – [ (line 8) + (line 10) ] / 2 (9)
where all measurements are taken at mid-length. The average value of vweb over all
available specimens constitutes a representative value of the local web imperfection.
The calculations are summarized in Table 2.12. The average value of vflange is 0.42 mm
for the 304 specimens and 0.45 mm for the 404 specimens. The average vweb value is
Experimental Investigation of the Interaction of Local and Overall Buckling of Stainless Steel I-Columns
School of Civil Engineering Research Report No R887
37
0.10 mm for the 304 specimens and 0.16 mm for the 404 specimens.
2.4 Interaction Buckling Tests
2.4.1 Test Set-Up 1
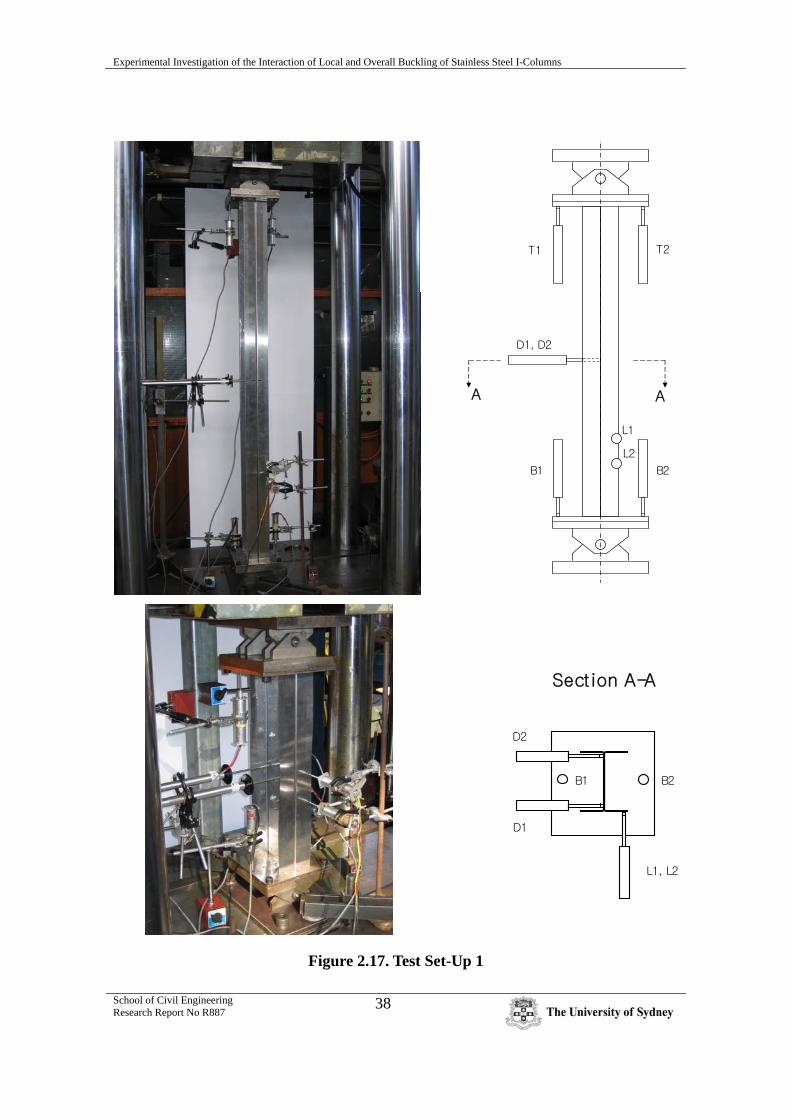
All specimens were tested between pinned ends under an axial load, applied with a
nominal eccentricity of Le/1500. The test set-up pictured in Fig. 2.17 was used for all
304 and 404 specimens with a nominal specimen length up to (and including) 2000 mm.
Eight LVDTs were used to record the specimen deformations. LVDTs B1 and B2
allowed for the bottom end rotation to be determined, while T1 and T2 registered the
top end rotation. The axial shortening of the centroidal axis could be calculated from the
T1, T2, B1 and B2 readings. D1 and D2 were placed at mid-length, at the extremities of
the web, just in from the rounded corners. They recorded the overall lateral
displacement of the mid-section, while keeping watch for a possible twist of the cross-
section about the longitudinal axis. LVDTs L1 and L2 were used to measure the local
buckling displacements of the flange tips. L1 and L2 were placed 75 mm apart, which is
approximately one quarter-wavelength, so that the onset of local buckling could be
detected even when one LVDT coincidentally coincided with an inflexion point of the
local buckling pattern. L1 was located at mid-length for the 500 mm long specimens,
and at a distance of 425 mm from the bottom end section for all other specimens. L1
and L2 were placed relatively close to the specimen end to minimize the effect of the
overall displacements on the readings. Indeed, as the specimens bent out about the
minor axis, L1 and L2 slid towards the web. Nevertheless, they could be used to give a
reliable measurement of the local buckling load and the initial local buckling
displacements. The load was consistently applied with an eccentricity towards the left in
Fig. 2.17, so that the overall bending superimposed tension on the flange tips located on
the right-hand side.
Experimental Investigation of the Interaction of Local and Overall Buckling of Stainless Steel I-Columns
School of Civil Engineering Research Report No R887
38
T1 T2
B1 B2
D1, D2
L1
L2
AA
Sect ion A-A
L1, L2
D1
D2
B2B1
Figure 2.17. Test Set-Up 1
Experimental Investigation of the Interaction of Local and Overall Buckling of Stainless Steel I-Columns
School of Civil Engineering Research Report No R887
39
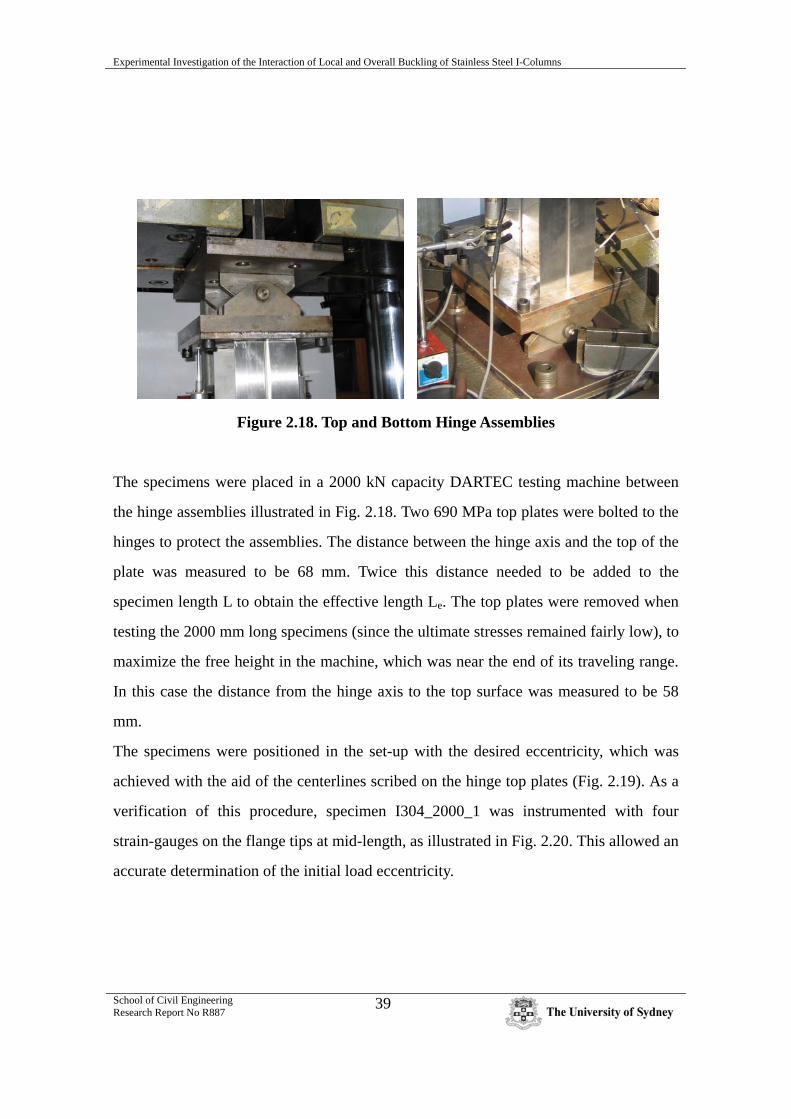
Figure 2.18. Top and Bottom Hinge Assemblies
The specimens were placed in a 2000 kN capacity DARTEC testing machine between
the hinge assemblies illustrated in Fig. 2.18. Two 690 MPa top plates were bolted to the
hinges to protect the assemblies. The distance between the hinge axis and the top of the
plate was measured to be 68 mm. Twice this distance needed to be added to the
specimen length L to obtain the effective length Le. The top plates were removed when
testing the 2000 mm long specimens (since the ultimate stresses remained fairly low), to
maximize the free height in the machine, which was near the end of its traveling range.
In this case the distance from the hinge axis to the top surface was measured to be 58
mm.
The specimens were positioned in the set-up with the desired eccentricity, which was
achieved with the aid of the centerlines scribed on the hinge top plates (Fig. 2.19). As a
verification of this procedure, specimen I304_2000_1 was instrumented with four
strain-gauges on the flange tips at mid-length, as illustrated in Fig. 2.20. This allowed an
accurate determination of the initial load eccentricity.

Experimental Investigation of the Interaction of Local and Overall Buckling of Stainless Steel I-Columns
School of Civil Engineering Research Report No R887
40
Figure 2.19. Load Eccentricity
SG1 SG2
SG4SG3
dG
Figure 2.20. Location of the Strain Gauges
A consistent strain rate of 1.7x10⁻⁶/s was applied to all specimens. This was achieved by
varying the displacement rate between 0.05 mm/min for the 500 mm long columns and
0.2 mm/min for the 2000 mm long columns.
A VISHAY 5100B data acquisition system was used to sample the data at a rate of 1 Hz.
Experimental Investigation of the Interaction of Local and Overall Buckling of Stainless Steel I-Columns
School of Civil Engineering Research Report No R887
41
Reaction Frame
500 kN Jack
Hinge
HingeT1, T2 B1, B2D2
D1L2L1
Elevation
Plan
T1
T2
B1
B2
D1, D2
L1 L2
Tension Element
Figure 2.21. Test Set-Up 2
Experimental Investigation of the Interaction of Local and Overall Buckling of Stainless Steel I-Columns
School of Civil Engineering Research Report No R887
42
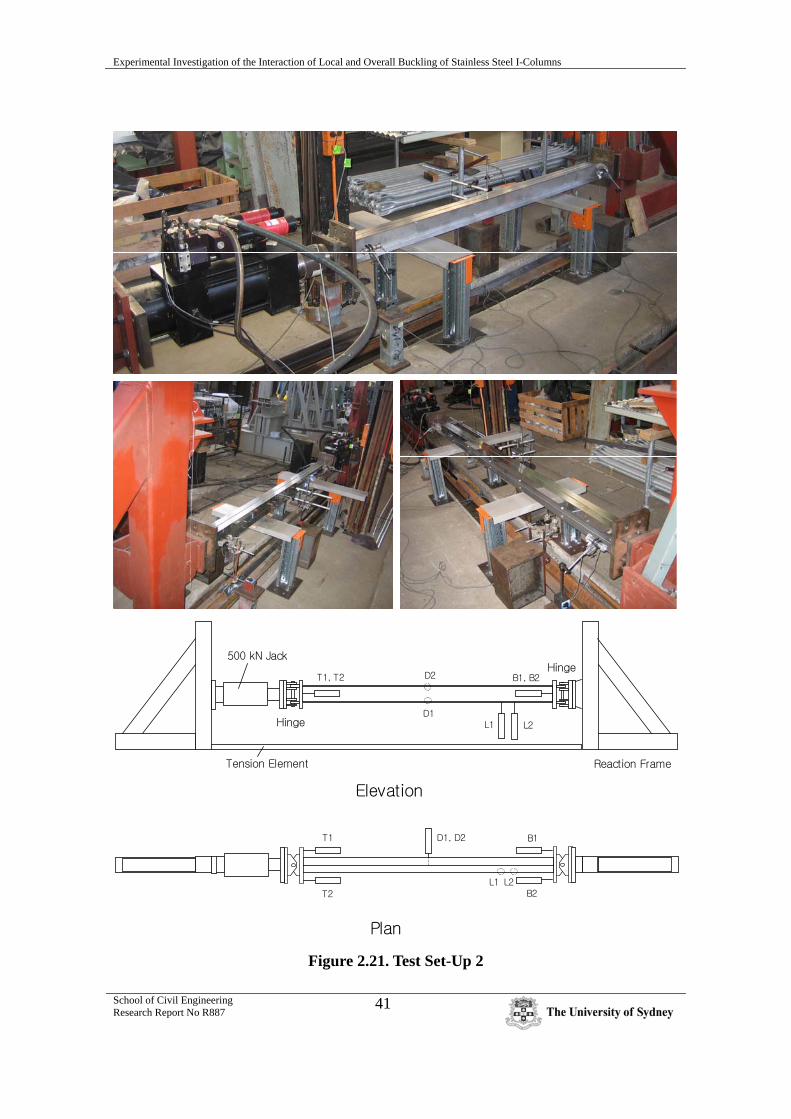
2.4.2 Test Set-Up 2
Since the DARTEC testing machine did not have sufficient free height to accommodate
the 2500 mm and 3000 mm long specimens, a separate set-up was devised, which is
shown in Fig. 2.21. The columns were tested in a horizontal position. The self-weight of
the columns is a mere 0.041 kN/m and caused negligible bending moments about the
major axis. The two triangular frames shown in Fig. 2.21 were clamped onto a rail
system which was anchored in the structural floor, and were connected by angle
sections functioning as a tension element. After testing the 2500 mm long columns, the
angles were cut, the frames moved apart and a new tension element welded in to
accommodate the 3000 mm specimens.
The load was applied by a 500 kN capacity jack, which was connected to MTS controls
to allow stroke-controlled operation of the set-up. A constant displacement rate of 0.2
mm/min was maintained.
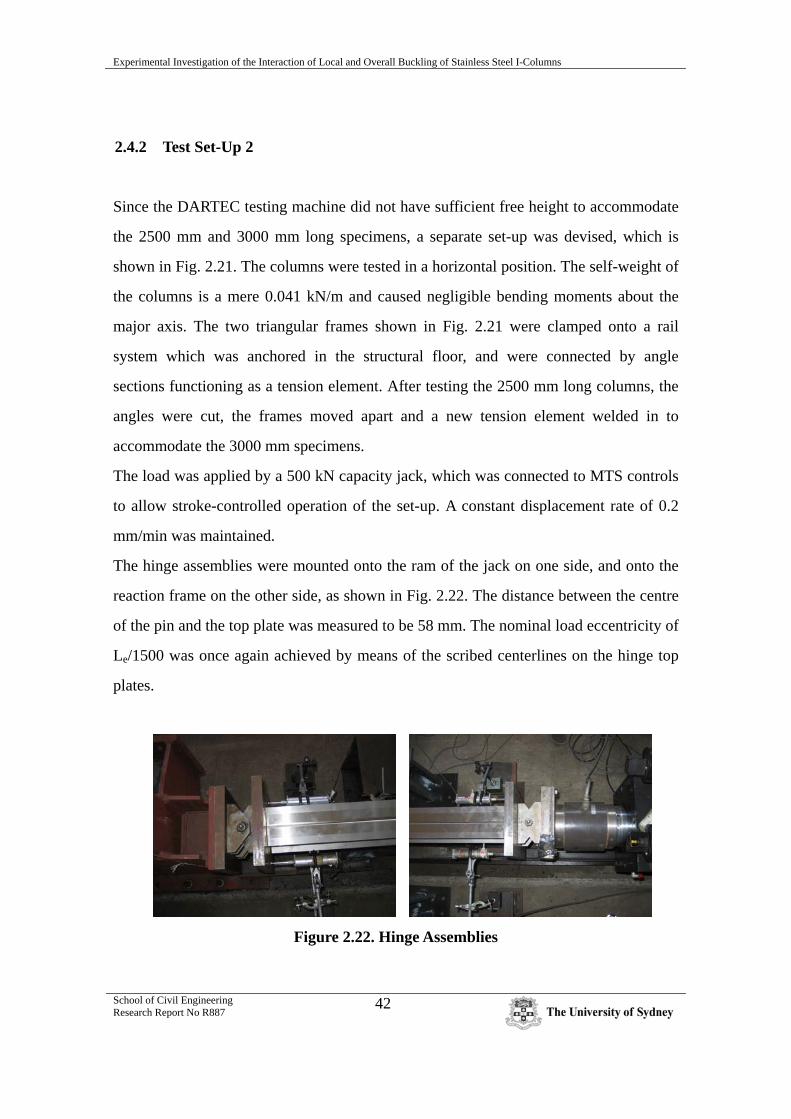
The hinge assemblies were mounted onto the ram of the jack on one side, and onto the
reaction frame on the other side, as shown in Fig. 2.22. The distance between the centre
of the pin and the top plate was measured to be 58 mm. The nominal load eccentricity of
Le/1500 was once again achieved by means of the scribed centerlines on the hinge top
plates.
Figure 2.22. Hinge Assemblies

Experimental Investigation of the Interaction of Local and Overall Buckling of Stainless Steel I-Columns
School of Civil Engineering Research Report No R887
43
Eight LVDTs were placed in locations similar to test set-up 1. T1 and T2 measured the
end rotations at the jack, while B1 and B2 measured the rotations at the opposite end.
The foursome of T1, T2, B1 and B2 determined the axial shortening of the column. D1
and D2, placed near the web-flange corners, recorded the overall lateral displacements
of the column at mid-length. L1 and L2, placed at the flange tips, measured the local
buckling displacements. L1 and L2 were placed 75 mm apart, with L2 at a distance of
400 mm from the specimen end.
The data was recorded using a VISHAY 5100B data acquisition system with the
sampling rate set at 2Hz.
2.4.3 Observations and Test Results
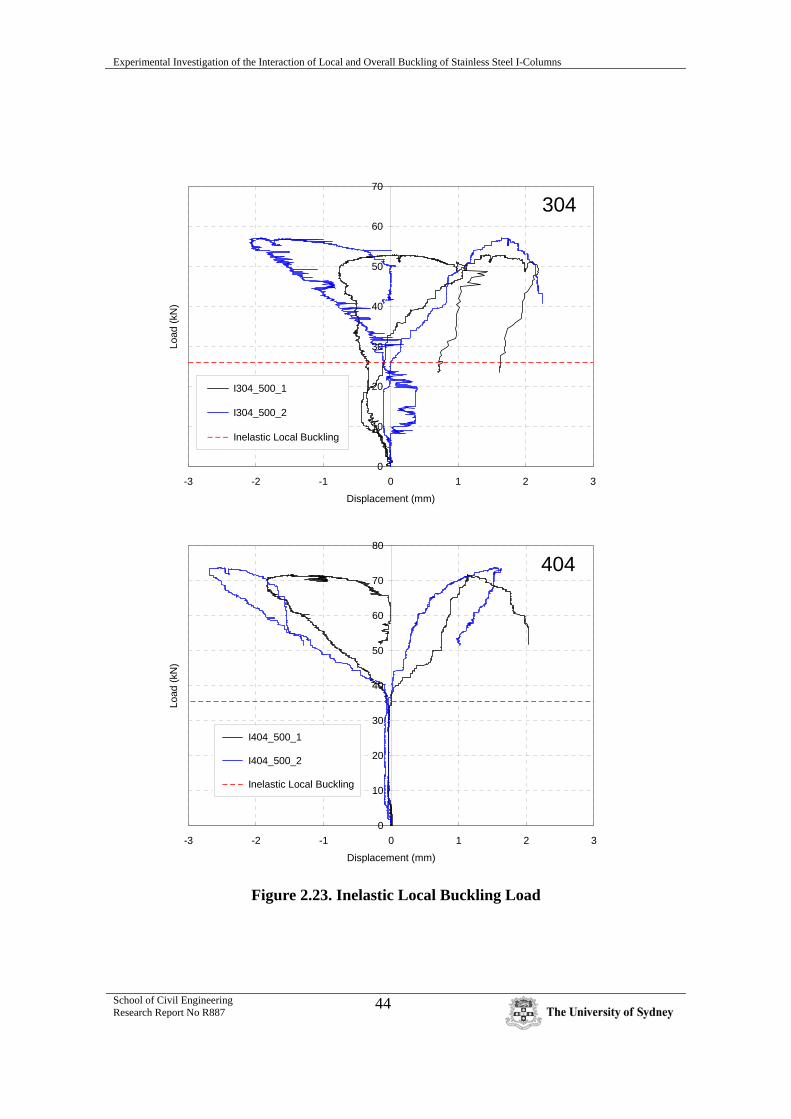
2.4.3.1 Inelastic Local Buckling Load
Figure 2.23 shows the readings of the L1 and L2 transducers of the 500 mm long 304
and 404 specimens. They indicate the onset of (inelastic) local buckling at a load of
approximately 26 kN for the 304 specimens and at an average load of 35.5 kN for the
404 specimens. The elastic local buckling load was previously calculated in Section 2.2
using the ThinWall software, and was found to be 32.3 kN for the 304 specimens and
33.3 kN for the 404 specimens. The corresponding stresses were 62.5 MPa and 64.2
MPa respectively. While for the 404 material, the elastic and inelastic local buckling
loads show good correspondence, indicating a fairly linear stress-strain diagram below
the local buckling stress, the inelastic local buckling load of the 304 specimens is
clearly affected by the highly non-linear behaviour of the 304 alloy in compression.
This non-linearity is reflected in a low n-value of 3 and a low proportionality limit of
just 84 MPa. By comparison, the 404 alloy displayed a proportionality limit of 210 MPa
and an n-value of 9.5.
Experimental Investigation of the Interaction of Local and Overall Buckling of Stainless Steel I-Columns
School of Civil Engineering Research Report No R887
44
0
10
20
30
40
50
60
70
-3 -2 -1 0 1 2 3
Displacement (mm)
Load
(kN
)
I304_500_1
I304_500_2
Inelastic Local Buckling
304
0
10
20
30
40
50
60
70
80
-3 -2 -1 0 1 2 3
Displacement (mm)
Load
(kN
)
I404_500_1
I404_500_2
Inelastic Local Buckling
404
Figure 2.23. Inelastic Local Buckling Load

Experimental Investigation of the Interaction of Local and Overall Buckling of Stainless Steel I-Columns
School of Civil Engineering Research Report No R887
45
0
5
10
15
20
25
30
35
0 500 1000 1500 2000 2500 3000 3500
Specimen Length (mm)
Load
(kN
)
Visual Observation
LVDTs
304
0
5
10
15
20
25
30
35
40
45
0 500 1000 1500 2000 2500 3000 3500
Specimen Length (mm)
Load
(kN
)
Visual Observation
LVDTs
404
Figure 2.24. Observed Onset of Local Buckling
Figure 2.24 displays the load at which the onset of local buckling was observed during
the tests. These values were derived from the L1 and L2 LVDT readings. It is noted that
no values are included for the I304_1500_2, I304_2500_1, I404_2000_2 and
I404_3000_2 tests, since no conclusive data could be derived from the L1 and L2
readings. The load at which local buckling was first visually observed during the test is
Experimental Investigation of the Interaction of Local and Overall Buckling of Stainless Steel I-Columns
School of Civil Engineering Research Report No R887
46
also indicated in the diagrams. It can be seen that the local buckling pattern emerged at
progressively lower loads when the specimen length increased, due to the effect of
overall bending and the increase in load eccentricity. The consistent gap between the
visually registered onset of local buckling and the values derived from the transducer
readings illustrate the difficulty in accurately pinpointing the onset of buckling from
visual observation.
2.4.3.2 Specimen Behaviour
Local buckling was observed in all specimens before the peak load. In all cases, failure
took place through interaction of local buckling and overall flexural buckling.
Figure 2.25 illustrates the behaviour of a typical specimen I304_1000_2. Fig. 2.25a
illustrates the initial set-up, while picture 2.25b was taken when local buckling was first
observed. The shorter (500 mm and 1000 mm long) specimens initially displayed a local
buckling pattern with roughly equal amplitude in the flanges of both channels. As the
axial load increased and the specimen bent out about the minor axis, the amplitude of
the buckles in the compression flange increased more significantly, thus highlighting the
interaction effect. This is illustrated by picture 2.25c, which was taken at the peak load.
It should be noted that the terms ‘tension flanges’ and ‘compression flanges’ herein refer
to the superimposed effect of overall bending only, and not necessarily to the actual
stress state in the flanges.
Past the peak load, the local buckling pattern localized on the compression side near
mid-length, while the local buckles straightened out near the ends of the specimen and
in the tension flange. Yield lines eventually started to appear, as illustrated by Fig. 2.25d.

Experimental Investigation of the Interaction of Local and Overall Buckling of Stainless Steel I-Columns
School of Civil Engineering Research Report No R887
47
Figure 2.25. I304_1000_2 Specimen Behaviour
a. Initial b. Local Buckling Load
c. Peak Load

Experimental Investigation of the Interaction of Local and Overall Buckling of Stainless Steel I-Columns
School of Civil Engineering Research Report No R887
48
Figure 2.25 (cont’d). I304_1000_2 Specimen Behaviour
d. Post-Peak
Experimental Investigation of the Interaction of Local and Overall Buckling of Stainless Steel I-Columns
School of Civil Engineering Research Report No R887
49
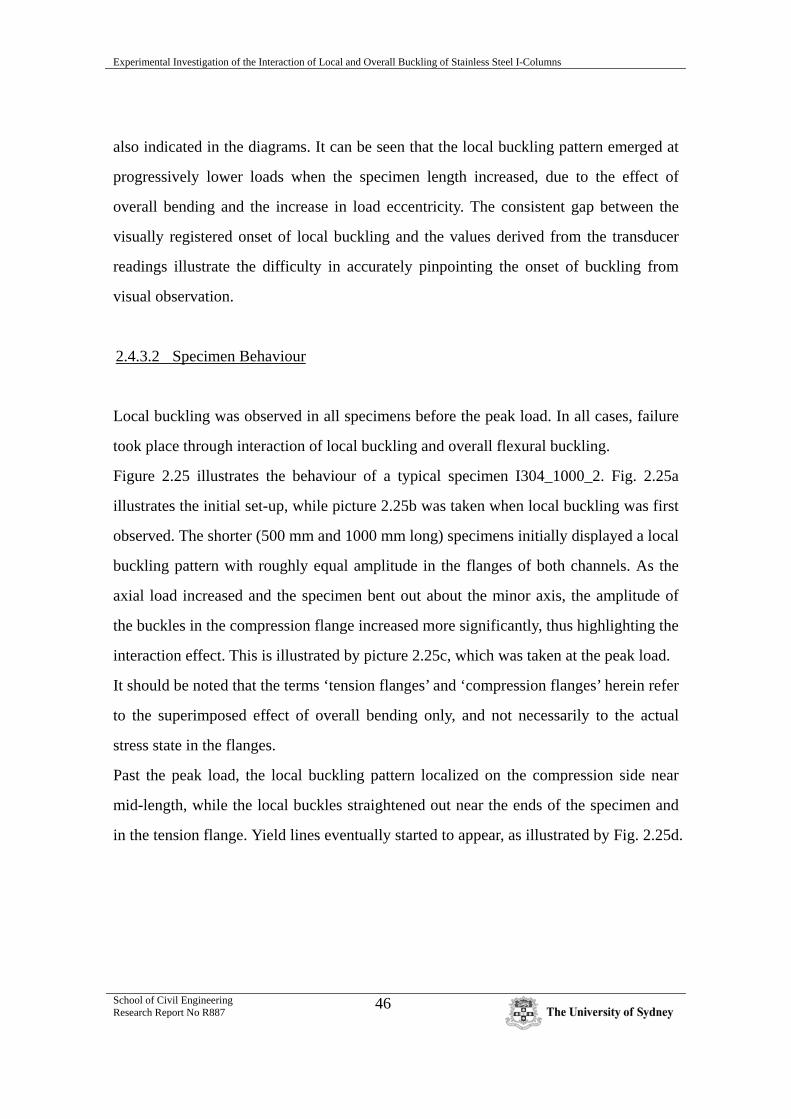
Figure 2.26. I304_3000_1 Specimen Behaviour
a. Initial
b. Local Buckling Load
c. Peak Load

Experimental Investigation of the Interaction of Local and Overall Buckling of Stainless Steel I-Columns
School of Civil Engineering Research Report No R887
50
Figure 2.26 (cont’d). I304_3000_1 Specimen Behaviour
d. Post-Peak Deformations
e. Post-Peak Deformations (End of Test)

Experimental Investigation of the Interaction of Local and Overall Buckling of Stainless Steel I-Columns
School of Civil Engineering Research Report No R887
51
Figure 2.26 illustrates the behaviour of one of the longer specimens, I304_3000_1,
tested in set-up 2. Fig. 2.26a shows the initial set-up at zero load, while Fig. 2.26b
illustrates the onset of local buckling. For the longer specimens, the local buckling
pattern initially appeared with noticeably larger amplitude on the side where the load
was eccentrically applied, as a result of the associated bending. As the load increased,
the interaction effect continued to manifest itself through amplitude modulation (fig
2.26 c, d and e). The local buckles localized at mid-length on the compression side in
the post-peak range.
The complete set of experimental data related to each test can be found in Appendix C.
For each specimen four graphs are included. An example for a typical specimen
(I404_1000_1) is given in Figure 2.27. A first graph (Fig. 2.27a) shows the axial
shortening of the column versus the axial load or average axial stress. The axial
shortening is calculated from the T1, T2, B1 and B2 LVDT readings and thus represents
the specimen shortening between the platens of the pinned end supports. A second graph
(Fig. 2.27b) displays the lateral displacements versus the axial load. It is seen that the
measurements of LVDTs D1 and D2, located near the web-to-flange corners, show
excellent agreement, indicating that no significant twisting of the mid-section about the
longitudinal axis took place. This conclusion can be generalized to include all 24
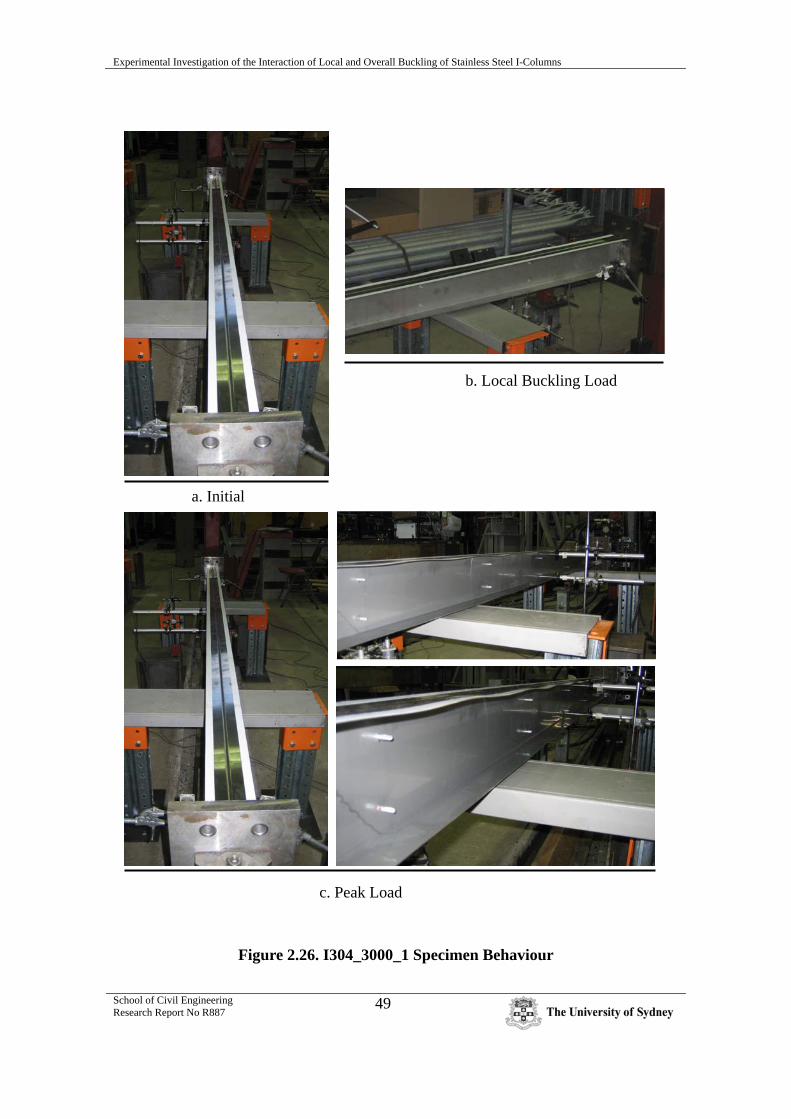
specimens. Fig. 2.27c plots the rotations of the end sections against the axial load. Fig.
2.27d displays the readings of LVDTs L1 and L2, which measure the local buckling
displacements of a flange tip. End rotations, lateral displacements and local
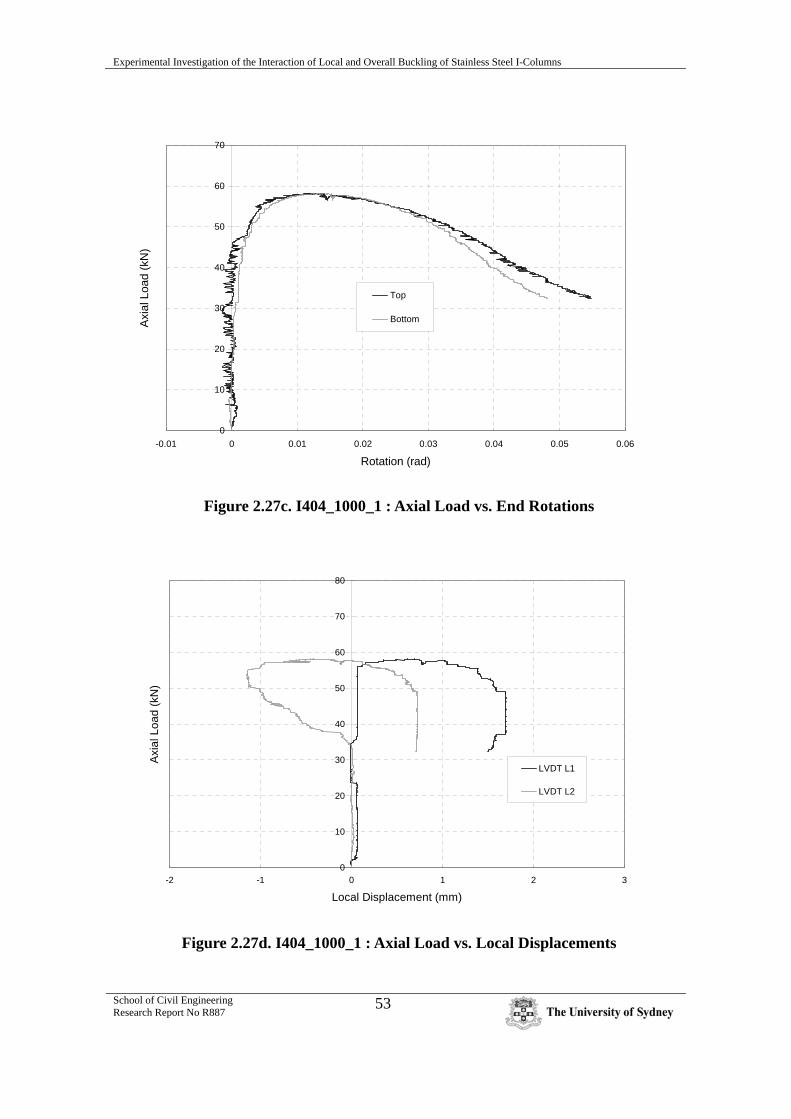
displacements are considered positive according to the sign convention shown in Fig.
2.28.

Experimental Investigation of the Interaction of Local and Overall Buckling of Stainless Steel I-Columns
School of Civil Engineering Research Report No R887
52
0
10
20
30
40
50
60
70
0 1 2 3 4
Axial Shortening (mm)
Axi
al L
oad
(kN
)
0
20
40
60
80
100
120
Ave
rage
Axi
al S
tress
(MP
a)
Figure 2.27a. I404_1000_1 : Axial Load vs. Axial Shortening
0
10
20
30
40
50
60
70
0 5 10 15 20 25 30
Lateral Displacement (mm)
Axi
al L
oad
(kN
)
LVDT D1
LVDT D2
Figure 2.27b. I404_1000_1 : Axial Load vs. Lateral Displacement
Experimental Investigation of the Interaction of Local and Overall Buckling of Stainless Steel I-Columns
School of Civil Engineering Research Report No R887
53
0
10
20
30
40
50
60
70
-0.01 0 0.01 0.02 0.03 0.04 0.05 0.06
Rotation (rad)
Axi
al L
oad
(kN
)
Top
Bottom
Figure 2.27c. I404_1000_1 : Axial Load vs. End Rotations
0
10
20
30
40
50
60
70
80
-2 -1 0 1 2 3
Local Displacement (mm)
Axi
al L
oad
(kN
)
LVDT L1
LVDT L2
Figure 2.27d. I404_1000_1 : Axial Load vs. Local Displacements
Experimental Investigation of the Interaction of Local and Overall Buckling of Stainless Steel I-Columns
School of Civil Engineering Research Report No R887
54
+
+
+
+
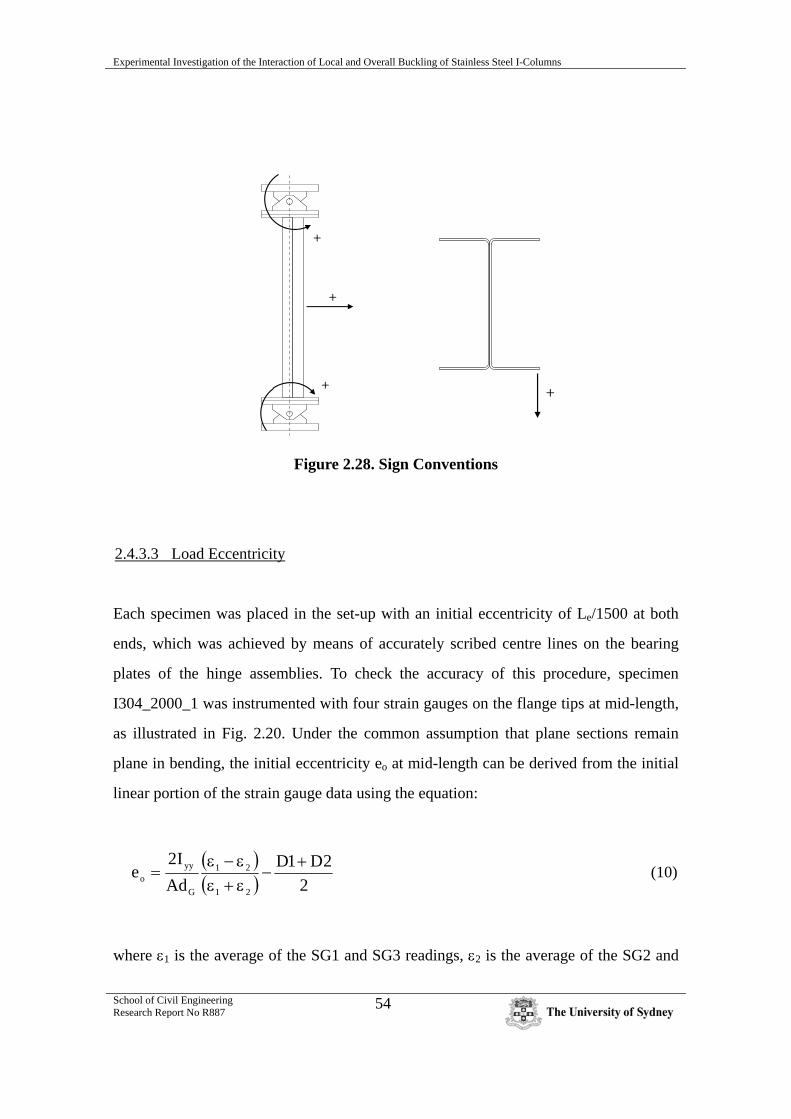
Figure 2.28. Sign Conventions
2.4.3.3 Load Eccentricity
Each specimen was placed in the set-up with an initial eccentricity of Le/1500 at both
ends, which was achieved by means of accurately scribed centre lines on the bearing
plates of the hinge assemblies. To check the accuracy of this procedure, specimen
I304_2000_1 was instrumented with four strain gauges on the flange tips at mid-length,
as illustrated in Fig. 2.20. Under the common assumption that plane sections remain
plane in bending, the initial eccentricity eo at mid-length can be derived from the initial
linear portion of the strain gauge data using the equation:
( )( ) 2
2D1DAd
I2e
21
21
G
yyo
+−
ε+εε−ε
= (10)
where ε1 is the average of the SG1 and SG3 readings, ε2 is the average of the SG2 and
Experimental Investigation of the Interaction of Local and Overall Buckling of Stainless Steel I-Columns
School of Civil Engineering Research Report No R887
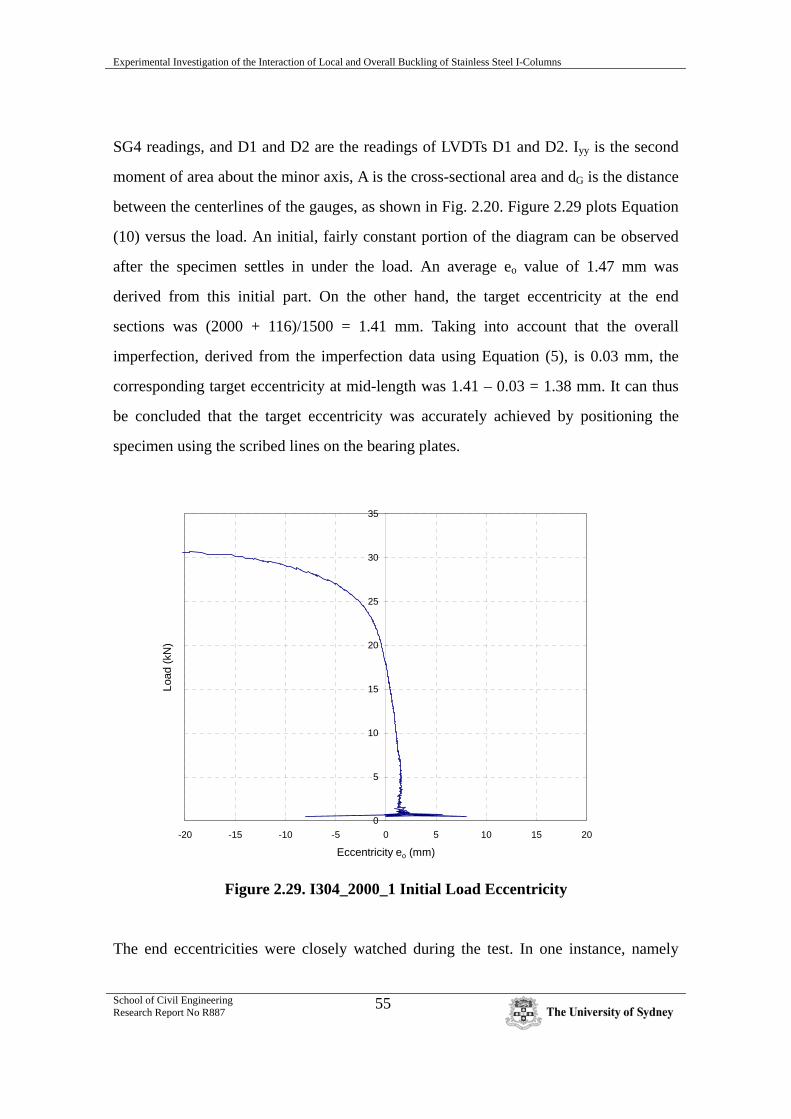
55
SG4 readings, and D1 and D2 are the readings of LVDTs D1 and D2. Iyy is the second
moment of area about the minor axis, A is the cross-sectional area and dG is the distance
between the centerlines of the gauges, as shown in Fig. 2.20. Figure 2.29 plots Equation
(10) versus the load. An initial, fairly constant portion of the diagram can be observed
after the specimen settles in under the load. An average eo value of 1.47 mm was
derived from this initial part. On the other hand, the target eccentricity at the end
sections was (2000 + 116)/1500 = 1.41 mm. Taking into account that the overall
imperfection, derived from the imperfection data using Equation (5), is 0.03 mm, the
corresponding target eccentricity at mid-length was 1.41 – 0.03 = 1.38 mm. It can thus
be concluded that the target eccentricity was accurately achieved by positioning the
specimen using the scribed lines on the bearing plates.
0
5
10
15
20
25
30
35
-20 -15 -10 -5 0 5 10 15 20
Eccentricity eo (mm)
Load
(kN
)
Figure 2.29. I304_2000_1 Initial Load Eccentricity
The end eccentricities were closely watched during the test. In one instance, namely
Experimental Investigation of the Interaction of Local and Overall Buckling of Stainless Steel I-Columns
School of Civil Engineering Research Report No R887
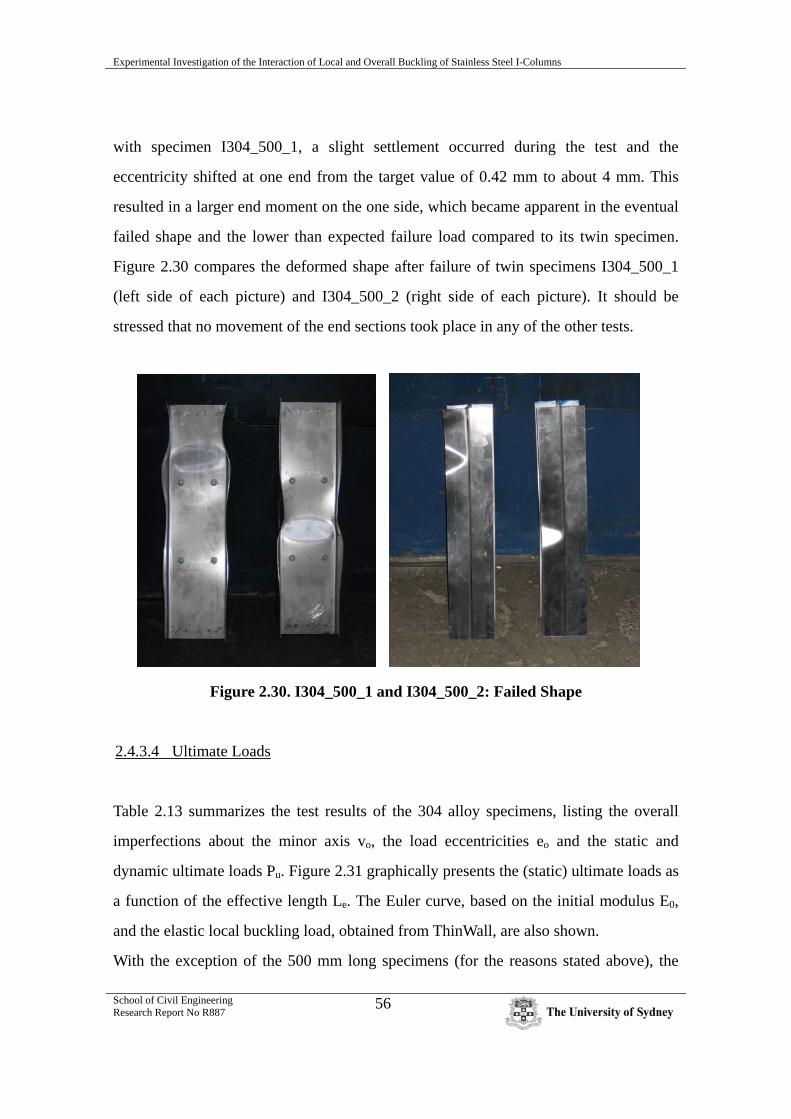
56
with specimen I304_500_1, a slight settlement occurred during the test and the
eccentricity shifted at one end from the target value of 0.42 mm to about 4 mm. This
resulted in a larger end moment on the one side, which became apparent in the eventual
failed shape and the lower than expected failure load compared to its twin specimen.
Figure 2.30 compares the deformed shape after failure of twin specimens I304_500_1
(left side of each picture) and I304_500_2 (right side of each picture). It should be
stressed that no movement of the end sections took place in any of the other tests.
Figure 2.30. I304_500_1 and I304_500_2: Failed Shape
2.4.3.4 Ultimate Loads
Table 2.13 summarizes the test results of the 304 alloy specimens, listing the overall
imperfections about the minor axis vo, the load eccentricities eo and the static and
dynamic ultimate loads Pu. Figure 2.31 graphically presents the (static) ultimate loads as
a function of the effective length Le. The Euler curve, based on the initial modulus E0,
and the elastic local buckling load, obtained from ThinWall, are also shown.
With the exception of the 500 mm long specimens (for the reasons stated above), the

Experimental Investigation of the Interaction of Local and Overall Buckling of Stainless Steel I-Columns
School of Civil Engineering Research Report No R887
57
ultimate loads obtained from twin tests of the 304 series are a close match. All pairs of
results lie less than 3% apart (typically about 1%), with the exception of the 3000 mm
long specimens, where the difference is 2.3 kN or 13%. It should be noted that the 3000
mm long specimens are situated in an area of the strength curve which was identified by
Van der Neut (1969) as being the most sensitive to imperfections. The capacity of these
specimens is slightly lower than the inelastic buckling load, which was found in section
2.4.3.1 to be approximately 26 kN, and the corresponding strength points are located on
the part of the strength curve which transitions from the local buckling load into the
overall buckling curve. Here, a small difference in the specimen imperfections results in
a significant difference in ultimate load.
Table 2.14 provides an overview of the test data of the 404 alloy specimens. Figure 2.32
plots the (static) ultimate loads of these specimens versus the effective length Le, while
also showing the Euler curve and the elastic local buckling load (both of them are again
based on the initial modulus E0). It is seen that the results of twin tests of the 404 series
again closely match each other. They are in all cases separated by a difference of less
than 3%, except for the 2500 mm long specimens, where the difference is 10%, and the
3000 mm long specimens, where the difference is 13%. The greater variability in test
results for the longer specimens can again be attributed to the imperfection sensitivity of
the strength curve around the local buckling load. In section 2.4.3.1, the elastic and
inelastic buckling loads of the 404 section were found to be in each others vicinity,
reaching around 35 kN. The strength curve (Fig. 2.32) reveals a fairly pronounced
‘flattening’ around the local buckling load, in agreement with Van der Neut’s theory.
The 304 strength curve (Fig. 2.31) hints towards the same trend, although more data
points at longer lengths would be necessary to draw a definite conclusion.
Since the 304 and 404 specimens were designed with identical geometry, a direct
comparison of the test results is possible. It can be concluded that the more pronounced
non-linearity, the earlier loss of stiffness and the lower 0.2% proof stress of the 304
alloy are reflected in the lower ultimate capacities of the 304 specimens.

Experimental Investigation of the Interaction of Local and Overall Buckling of Stainless Steel I-Columns
School of Civil Engineering Research Report No R887
58
Table 2.13. 304 Column Test Results
Specimen Material Length Overall Imp. Eccentricity Ultimate Load Pu
L Le vo eo,end eo,mid Dynamic Static
(mm) (mm) (mm) (mm) (mm) - (kN) (kN)
I304_500_1 304 500 636 0.113 0.42/4.00 2.10 Le/303 52.92 51.09
I304_500_2 304 501 637 0.092 0.42 0.33 Le/1912 57.20 55.24
I304_1000_1 304 999 1135 0.008 0.76 0.75 Le/1516 49.02 47.25
I304_1000_2 304 999 1135 -0.004 0.76 0.76 Le/1492 49.14 47.43
I304_1500_1 304 1499 1635 -0.061 1.09 1.15 Le/1420 39.98 38.67
I304_1500_2 304 1498 1634 0.002 1.09 1.09 Le/1503 38.75 37.63
I304_2000_1 304 2000 2116 0.030 1.41 1.38 Le/1532 32.29 31.37
I304_2000_2 304 2000 2116 0.287 1.41 1.12 Le/1883 32.05 31.07
I304_2500_1 304 2497 2613 0.602 1.74 1.14 Le/2291 23.15 22.71
I304_2500_2 304 2497 2613 1.054 1.74 0.69 Le/3798 23.40 22.94
I304_3000_1 304 2999 3115 0.171 2.08 1.91 Le/1634 21.14 20.62
I304_3000_2 304 3000 3116 0.026 2.08 2.05 Le/1519 18.66 18.30

Experimental Investigation of the Interaction of Local and Overall Buckling of Stainless Steel I-Columns
School of Civil Engineering Research Report No R887
59
Table 2.14. 404 Column Test Results
Specimen Material Length Overall Imp. Eccentricity Ultimate Load Pu
L Le vo eo,end eo,mid Dynamic Static
(mm) (mm) (mm) (mm) (mm) - (kN) (kN)
I404_500_1 404 499 635 0.041 0.42 0.38 Le/1663 71.73 69.83
I404_500_2 404 499 635 0.009 0.42 0.41 Le/1531 73.74 71.79
I404_1000_1 404 999 1135 0.030 0.76 0.73 Le/1562 58.17 56.53
I404_1000_2 404 999 1135 -0.035 0.76 0.79 Le/1433 57.81 56.22
I404_1500_1 404 1500 1636 -0.182 1.09 1.27 Le/1285 41.94 40.96
I404_1500_2 404 1499 1635 -0.170 1.09 1.26 Le/1298 43.04 42.00
I404_2000_1 404 1999 2115 -0.151 1.41 1.56 Le/1355 39.37 37.91
I404_2000_2 404 1999 2115 0.013 1.41 1.40 Le/1514 38.64 37.48
I404_2500_1 404 2497 2613 0.154 1.74 1.59 Le/1645 30.70 29.90
I404_2500_2 404 2499 2615 -0.054 1.74 1.80 Le/1455 27.61 27.24
I404_3000_1 404 3001 3117 0.224 2.08 1.85 Le/1681 21.33 21.20
I404_3000_2 404 2999 3115 0.895 2.08 1.18 Le/2637 24.77 24.42

Experimental Investigation of the Interaction of Local and Overall Buckling of Stainless Steel I-Columns
School of Civil Engineering Research Report No R887
60
0
10
20
30
40
50
60
0 500 1000 1500 2000 2500 3000 3500
Le (mm)
Pu (
kN)
0
20
40
60
80
100
Ave
rage
Stre
ss (M
Pa)
304 Test Results
Euler Curve
Elastic Local Buckling
Figure 2.31. 304 Test Results
0
10
20
30
40
50
60
70
80
0 500 1000 1500 2000 2500 3000 3500
Le (mm)
Pu (
kN)
0
25
50
75
100
125
150
Ave
rage
Stre
ss (M
Pa)
404 Test Results
Euler Curve
Elastic Local Buckling
Figure 2.32. 404 Test Results

Experimental Investigation of the Interaction of Local and Overall Buckling of Stainless Steel I-Columns
School of Civil Engineering Research Report No R887
61
3. Conclusions
A material testing program was carried out to determine the properties of austenitic 304
and ferritic 404 stainless steel. For each alloy, the tensile properties of the flat plate
material were determined in three directions: along the rolling direction of the plate,
transverse to the rolling direction and under a 45 degree angle with the rolling direction.
Compressive properties were measured in the same directions, using a specially
designed test jig. The results reveal non-linear behaviour with a relatively low
proportionality limit, which is especially pronounced in the austenitic 304 alloy. The
non-linearity is reflected in a low Ramberg-Osgood parameter n, and is more distinct in
compression than in tension. Anisotropy is minimal in the 304 alloy and more
pronounced in the 404 alloy, reaching 12% in transverse compression.
Small tensile coupons were cut from the rounded corner zones of the specimens to
investigate the effect of cold-working on the material properties. It was concluded that
cold-working significantly increases the 0.2% proof stress of the stainless steel alloys.
The effect is more pronounced in the austenitic 304 alloy, where σ0.2% increased by 50%,
while the ferritic 404 alloy showed a gain of 25%.
24 long columns were tested under axial compression, applied with a nominal
eccentricity of Le/1500. All specimens were tested between pinned ends. The specimen
cross-section consisted of back-to-back channels, connected with sheet metal screws.
For each alloy, six different specimen lengths were considered, ranging from 500mm to
3000mm in 500mm increments. Twin specimens were tested for each length. The tests
were successful in achieving interaction between local and overall buckling. It was
observed that the increase in local buckling amplitude under increasing load was most
pronounced near mid-length on the side where the load was applied eccentrically, thus
highlighting the interaction effect. The results from twin specimen test were generally in
good agreement. A slightly larger variability in the test results was observed near the
Experimental Investigation of the Interaction of Local and Overall Buckling of Stainless Steel I-Columns
School of Civil Engineering Research Report No R887
62
inelastic local buckling load, as a result of the heightened sensitivity to imperfections. A
flattening of the strength curve around the local buckling load was observed in the 404
specimens. For an identical geometry, the 304 specimens displayed significantly less
capacity than the 404 specimens, reflecting the higher degree of non-linearity and lower
0.2% proof stress.
Given the imperfection-sensitive nature of interaction buckling, imperfections were
carefully measured for each specimen using reflected laser beams. A representative
value of the local flange and web imperfections was derived for each alloy for further
use in numerical modeling.
This research remedies the lack of experimental data available on the interaction
buckling of stainless steel I-columns. It provides the basis for further research, in
particular the verification of a finite element model used in parametric studies, the
evaluation of the current design guidelines and the development of a direct strength
design approach.

Experimental Investigation of the Interaction of Local and Overall Buckling of Stainless Steel I-Columns
School of Civil Engineering Research Report No R887
63
References AS/NZS:1391. (1991). “Methods for Tensile Testing of Metals.” Australian Standard/New
Zealand Standard 1391:1991, Standards Australia, Sydney, Australia. AS/NZS:4673. (2001). “Cold-Formed Stainless Steel Structures.” Australian Standard/New
Zealand Standard 1391:1991, Standards Australia, Sydney, Australia.
Becque, J., and Rasmussen, K.J.R. (2006). “Experimental Investigation of the Interaction of Local and Overall Buckling of Cold-Formed Stainless Steel Columns.” Research Report No. 873, School of Civil Engineering, University of Sydney, Sydney.
Eurocode3-1.4 (1996). “Eurocode3: Design of Steel Structures.”, Part 1.4: “Supplementary Rules for Stainless Steel.”, prENV-93-1-4, European Committee for Standardization, Brussels.
Gardner, L., and Nethercot, D.A. (2003). “Experiments on Stainless Steel Hollow Sections-Part 1: Material and Cross-Sectional Behaviour.”, Journal of Constructional Steel Research 60, 1291-1318.
Hasham, A.S., and Rasmussen, K.J.R. (2002). “Nonlinear Analysis of Locally Buckled I-Section Steel Beam-Columns.”, Australian Journal of Structural Engineering 3(3), 171-199.
Hill, R. (1950). “The Mathematical Theory of Plasticity.” Oxford University Press, London.
Johnson, A., and Winter, G.. (1966). “Behaviour of Stainless Steel Columns and Beams.” Journal of Structural Engineering, American Society of Civil Engineers, ASCE 92(ST5): 97-118.
Lecce, M., and Rasmussen, K.J.R. (2005). “Experimental Investigation of the Distortional Buckling of Cold-Formed Stainless Steel Sections.” Research Report No. 844, School of
Experimental Investigation of the Interaction of Local and Overall Buckling of Stainless Steel I-Columns
School of Civil Engineering Research Report No R887
64
Civil Engineering, University of Sydney, Sydney.
Papangelis, J.P., and Hancock, G.J. (1995). “Computer Analysis of Thin-walled Structural Members.” Computers and Structures 56(1):157-176.
Rasmussen, K.J.R., and Hancock, G. (1993). “Stainless Steel Tubular Members. I: Columns.”
Journal of Structural Engineering, American Society of Civil Engineers, ASCE 119(8): 2349-2367.
van der Neut, A. (1969). “The interaction of Local Buckling and Column Failure of Thin-walled Compression Members.” Proceedings of the 12th International Congress on Applied Mechanics: 389-399.
van der Neut, A. (1973). “The Sensitivity of Thin-walled Compression Members to Column
Axis Imperfection.” Int. J. Solids Structures, Vol. 9, 999-1011.
Experimental Investigation of the Interaction of Local and Overall Buckling of Stainless Steel I-Columns
School of Civil Engineering Research Report No R887
65
Appendix A
Appendix A presents the results of tensile coupon tests carried out on the 303 and 304
alloys. The coupons were cut from the flat sheets. The reader is referred to section 2.1.1
of the main text for further details.
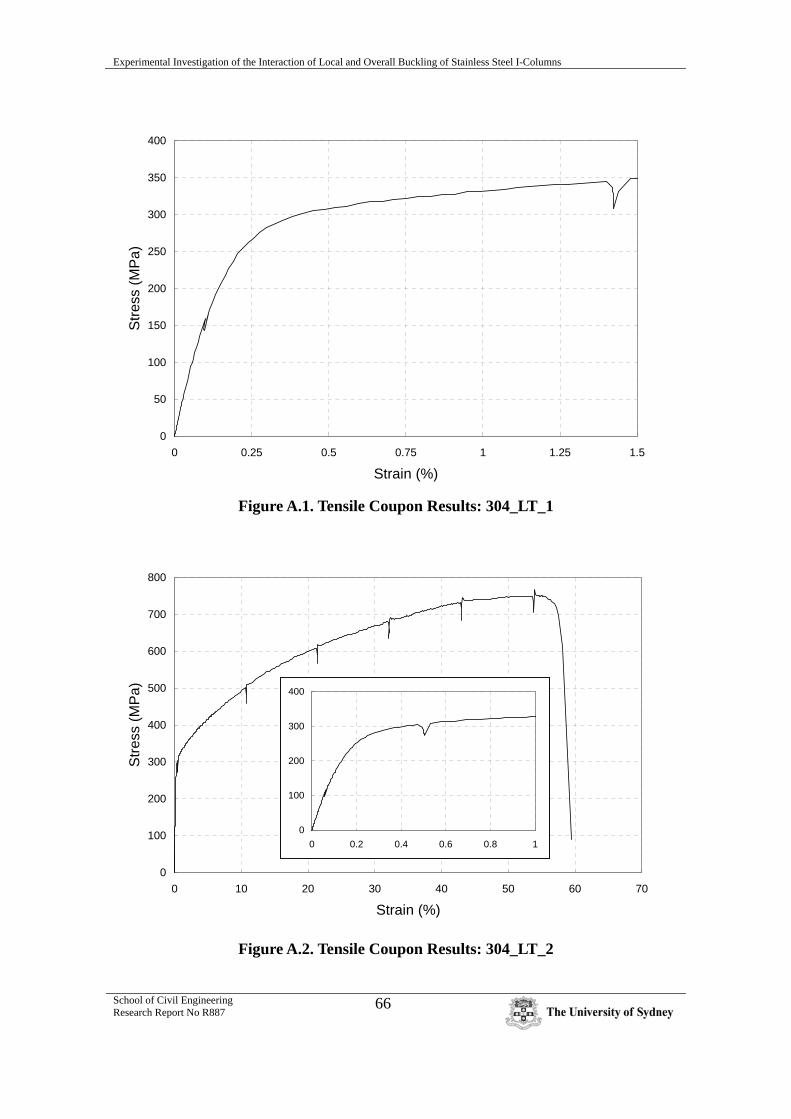
Experimental Investigation of the Interaction of Local and Overall Buckling of Stainless Steel I-Columns
School of Civil Engineering Research Report No R887
66
0
50
100
150
200
250
300
350
400
0 0.25 0.5 0.75 1 1.25 1.5
Strain (%)
Stre
ss (M
Pa)
Figure A.1. Tensile Coupon Results: 304_LT_1
0
100
200
300
400
500
600
700
800
0 10 20 30 40 50 60 70
Strain (%)
Stre
ss (M
Pa)
0
100
200
300
400
0 0.2 0.4 0.6 0.8 1
Figure A.2. Tensile Coupon Results: 304_LT_2

Experimental Investigation of the Interaction of Local and Overall Buckling of Stainless Steel I-Columns
School of Civil Engineering Research Report No R887
67
0
100
200
300
400
500
600
700
800
0 10 20 30 40 50 60 70
Strain (%)
Stre
ss (M
Pa)
0
100
200
300
400
0 0.2 0.4 0.6 0.8 1
Figure A.3. Tensile Coupon Results: 304_LT_3
0
50
100
150
200
250
300
350
400
0 0.25 0.5 0.75 1 1.25 1.5
Strain (%)
Stre
ss (M
Pa)
Figure A.4. Tensile Coupon Results: 304_TT_1

Experimental Investigation of the Interaction of Local and Overall Buckling of Stainless Steel I-Columns
School of Civil Engineering Research Report No R887
68
0
100
200
300
400
500
600
700
800
0 10 20 30 40 50 60 70
Strain (%)
Stre
ss (M
Pa)
0
100
200
300
400
0 0.2 0.4 0.6 0.8 1
Figure A.5. Tensile Coupon Results: 304_TT_2
0
100
200
300
400
500
600
700
800
0 10 20 30 40 50 60 70
Strain (%)
Stre
ss (M
Pa)
0
100
200
300
400
0 0.2 0.4 0.6 0.8 1
Figure A.6. Tensile Coupon Results: 304_TT_3

Experimental Investigation of the Interaction of Local and Overall Buckling of Stainless Steel I-Columns
School of Civil Engineering Research Report No R887
69
0
50
100
150
200
250
300
350
400
0 0.2 0.4 0.6 0.8 1
Strain (%)
Stre
ss (M
Pa)
Figure A.7. Tensile Coupon Results: 404_LT_1
0
100
200
300
400
500
600
0 5 10 15 20 25 30 35
Strain (%)
Stre
ss (M
Pa)
0
100
200
300
400
0 0.2 0.4 0.6 0.8 1
Figure A.8. Tensile Coupon Results: 404_LT_2

Experimental Investigation of the Interaction of Local and Overall Buckling of Stainless Steel I-Columns
School of Civil Engineering Research Report No R887
70
0
100
200
300
400
500
600
0 5 10 15 20 25 30 35
Strain (%)
Stre
ss (M
Pa)
0
100
200
300
400
0 0.2 0.4 0.6 0.8 1
Figure A.9. Tensile Coupon Results: 404_LT_3
0
50
100
150
200
250
300
350
400
0 0.25 0.5 0.75 1 1.25 1.5
Strain (%)
Stre
ss (M
Pa)
Figure A.10. Tensile Coupon Results: 404_TT_1

Experimental Investigation of the Interaction of Local and Overall Buckling of Stainless Steel I-Columns
School of Civil Engineering Research Report No R887
71
0
100
200
300
400
500
600
0 5 10 15 20 25 30 35
Strain (%)
Stre
ss (M
Pa)
0
100
200
300
400
0 0.2 0.4 0.6 0.8 1
Figure A.11. Tensile Coupon Results: 404_TT_2
0
100
200
300
400
500
600
0 5 10 15 20 25 30 35
Strain (%)
Stre
ss (M
Pa)
0
100
200
300
400
0 0.2 0.4 0.6 0.8 1
Figure A.12. Tensile Coupon Results: 404_TT_3

Experimental Investigation of the Interaction of Local and Overall Buckling of Stainless Steel I-Columns
School of Civil Engineering Research Report No R887
72
Appendix B
Appendix C contains the results of the imperfection measurements on all 24 back-to-
back channel specimens. The imperfections were measured along 10 lines, as indicated
below:
For numerical modeling purposes the measurements are also represented by their
(truncated) Fourier decomposition. The Fourier coefficients are listed in Tables B.1 and
B.2.
1
3
2
4
5 8
6
7 10
9
+
+
+
+
+ +
+ +
+ +

Experimental Investigation of the Interaction of Local and Overall Buckling of Stainless Steel I-Columns
School of Civil Engineering Research Report No R887
73
-0.5
0
0.5
0 0.5 1
x/L
d (m
m)
1
2
Lcr
-0.5
0
0.5
0 0.5 1
x/L
d (m
m) 5
6
7 Lcr
-1
-0.5
0
0.5
0 0.5 1
x/L
d(m
m)
3
4
Lcr
-0.5
0
0.5
0 0.5 1
x/L
d (m
m)
10
8
Lcr
9
Figure B.1. I304_500_1 Im
perfections

Experimental Investigation of the Interaction of Local and Overall Buckling of Stainless Steel I-Columns
School of Civil Engineering Research Report No R887
74
-0.6
0.6
0 0.5 1
x/L
d (m
m) 1
2Lcr
-0.6
0.6
0 0.5 1
x/L
d (m
m)
5
67
Lcr
-0.6
0.6
0 0.5 1
x/L
d (m
m)
3
4Lcr
-0.6
0.6
0 0.5 1
x/L
d (m
m) 8
9
10
Lcr
Figure B.2. I304_500_2 Im
perfections

Experimental Investigation of the Interaction of Local and Overall Buckling of Stainless Steel I-Columns
School of Civil Engineering Research Report No R887
75
-1
0
1
0 0.5 1
x/L
d (m
m)
1
2Lcr
-1
0
1
0 0.5 1
x/L
d (m
m)
5
6 7
Lcr
-1
0
1
0 0.5 1
x/L
d (m
m)
3
4
Lcr
-1
0
1
0 0.5 1
x/L
d (m
m)
8
9
10
Lcr
Figure B.3. I304_1000_1 Im
perfections
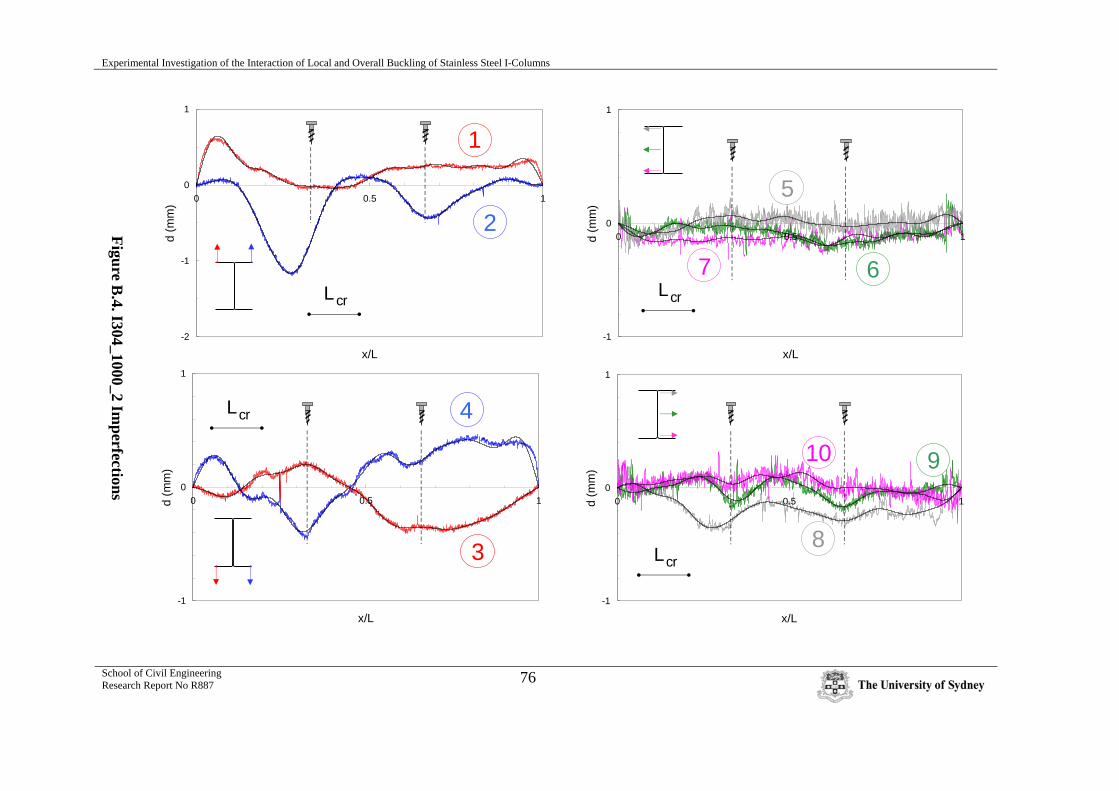
Experimental Investigation of the Interaction of Local and Overall Buckling of Stainless Steel I-Columns
School of Civil Engineering Research Report No R887
76
-2
-1
0
1
0 0.5 1
x/L
d (m
m)
L cr
1
2
-1
0
1
0 0.5 1
x/L
d (m
m)
Lcr
5
67
-1
0
1
0 0.5 1
x/L
d (m
m)
Lcr
3
4
-1
0
1
0 0.5 1
x/L
d (m
m)
Lcr8
910
Figure B.4. I304_1000_2 Im
perfections

Experimental Investigation of the Interaction of Local and Overall Buckling of Stainless Steel I-Columns
School of Civil Engineering Research Report No R887
77
-2
-1
0
1
0 0.5 1
x/L
d (m
m)
L cr1
2
-1
0
1
0 0.5 1
x/L
d (m
m)
Lcr 56
7
-1
0
1
0 0.5 1
x/L
d (m
m)
Lcr
3
4
-1
0
1
0 0.5 1
x/L
d (m
m)
L cr8
9
10
Figure B.5. I304_1500_1 Im
perfections

Experimental Investigation of the Interaction of Local and Overall Buckling of Stainless Steel I-Columns
School of Civil Engineering Research Report No R887
78
-1
0
1
0 0.5 1
x/L
d (m
m)
L cr1
2
-1
0
1
0 0.5 1
x/L
d (m
m)
L cr
56
7
-1
0
1
0 0.5 1
x/L
d (m
m)
Lcr3
4
-1
0
1
0 0.5 1
x/Ld
(mm
)
L cr8
9
10
Figure B.6. I304_1500_2 Im
perfections

Experimental Investigation of the Interaction of Local and Overall Buckling of Stainless Steel I-Columns
School of Civil Engineering Research Report No R887
79
-2
-1
0
1
0 0.5 1
x/L
d (m
m)
L cr
1
2
-1
0
1
0 0.5 1
x/L
d (m
m)
L cr 5
6 7
-2
-1
0
1
0 0.5 1
x/L
d (m
m)
L cr
3
4
-1
0
1
0 0.5 1
x/Ld
(mm
)
910
8
Lcr
Figure B.7. I304_2000_1 Im
perfections

Experimental Investigation of the Interaction of Local and Overall Buckling of Stainless Steel I-Columns
School of Civil Engineering Research Report No R887
80
-2
-1
0
1
0 0.5 1
x/L
d (m
m)
L cr
1
2
-1
0
1
0 0.5 1
x/L
d (m
m)
L cr
6
75
-2
-1
0
1
0 0.5 1
x/L
d (m
m)
L cr3
4
-1
0
1
0 0.5 1
x/Ld
(mm
)9
10
8
Lcr
Figure B.8. I304_2000_2 Im
perfections

Experimental Investigation of the Interaction of Local and Overall Buckling of Stainless Steel I-Columns
School of Civil Engineering Research Report No R887
81
-2
-1
0
1
0 0.5 1
x/L
d (m
m)
1
2Lcr
-2
-1
0
1
0 0.5 1
x/L
d (m
m)
56
7
Lcr
-2
-1
0
1
0 0.5 1
x/L
d (m
m)
3
4
Lcr
-2
-1
0
1
0 0.5 1
x/L
d (m
m)
Lcr
89
10
Figure B.9. I304_2500_1 Im
perfections
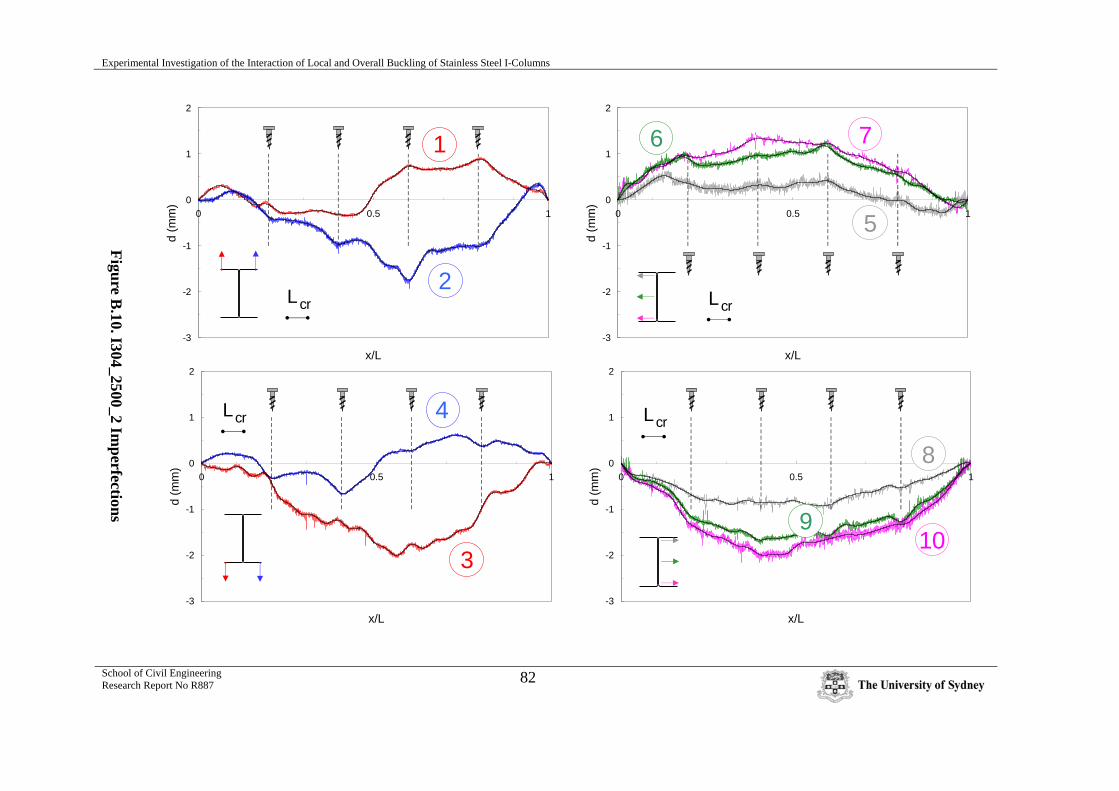
Experimental Investigation of the Interaction of Local and Overall Buckling of Stainless Steel I-Columns
School of Civil Engineering Research Report No R887
82
-3
-2
-1
0
1
2
0 0.5 1
x/L
d (m
m)
1
2Lcr
-3
-2
-1
0
1
2
0 0.5 1
x/L
d (m
m)
5
76
Lcr
-3
-2
-1
0
1
2
0 0.5 1
x/L
d (m
m)
3
4Lcr
-3
-2
-1
0
1
2
0 0.5 1
x/L
d (m
m)
10
8
Lcr
9
Figure B.10. I304_2500_2 Im
perfections
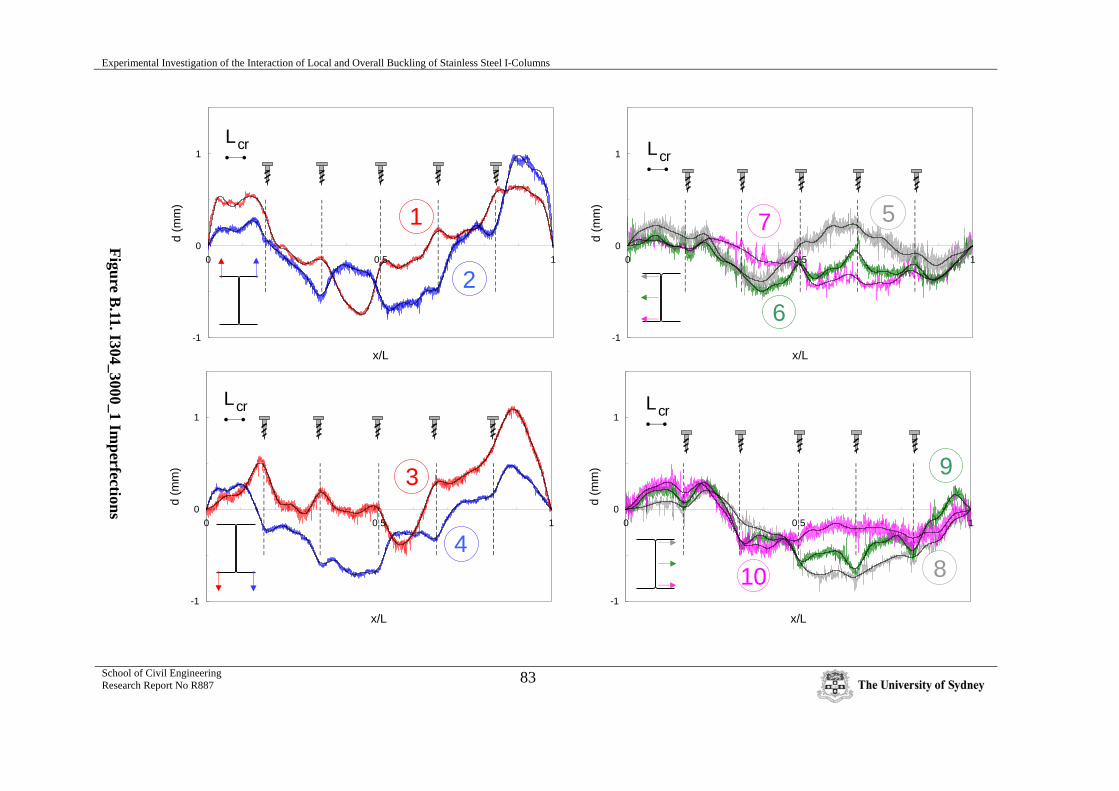
Experimental Investigation of the Interaction of Local and Overall Buckling of Stainless Steel I-Columns
School of Civil Engineering Research Report No R887
83
-1
0
1
0 0.5 1
x/L
d (m
m)
1
2
Lcr
-1
0
1
0 0.5 1
x/L
d (m
m)
Lcr
6
7 5
-1
0
1
0 0.5 1
x/L
d (m
m) 3
4
Lcr
-1
0
1
0 0.5 1
x/L
d (m
m)
Lcr
9
10 8
Figure B.11. I304_3000_1 Im
perfections

Experimental Investigation of the Interaction of Local and Overall Buckling of Stainless Steel I-Columns
School of Civil Engineering Research Report No R887
84
-1.5
-1
-0.5
0
0.5
1
1.5
0 0.5 1
x/L
d (m
m)
1
2
Lcr
-1.5
-1
-0.5
0
0.5
1
1.5
0 0.5 1
x/L
d (m
m)
56
7
Lcr
-1.5
-1
-0.5
0
0.5
1
1.5
0 0.5 1
x/L
d (m
m) 3
4
Lcr
-1.5
-1
-0.5
0
0.5
1
1.5
0 0.5 1
x/L
d (m
m)
9
10
8
Lcr
Figure B.12. I304_3000_2 Im
perfections

Experimental Investigation of the Interaction of Local and Overall Buckling of Stainless Steel I-Columns
School of Civil Engineering Research Report No R887
85
-0.5
0
0.5
0 0.5 1
x/L
d (m
m)
1
2
Lcr
-0.5
0
0.5
0 0.5 1
x/L
d (m
m)
5
6
7
Lcr
-0.5
0
0.5
0 0.5 1
x/L
d(m
m)
3
4
Lcr
-0.5
0
0.5
0 0.5 1
x/L
d (m
m) 108
Lcr9
Figure B.13. I404_500_1 Im
perfections
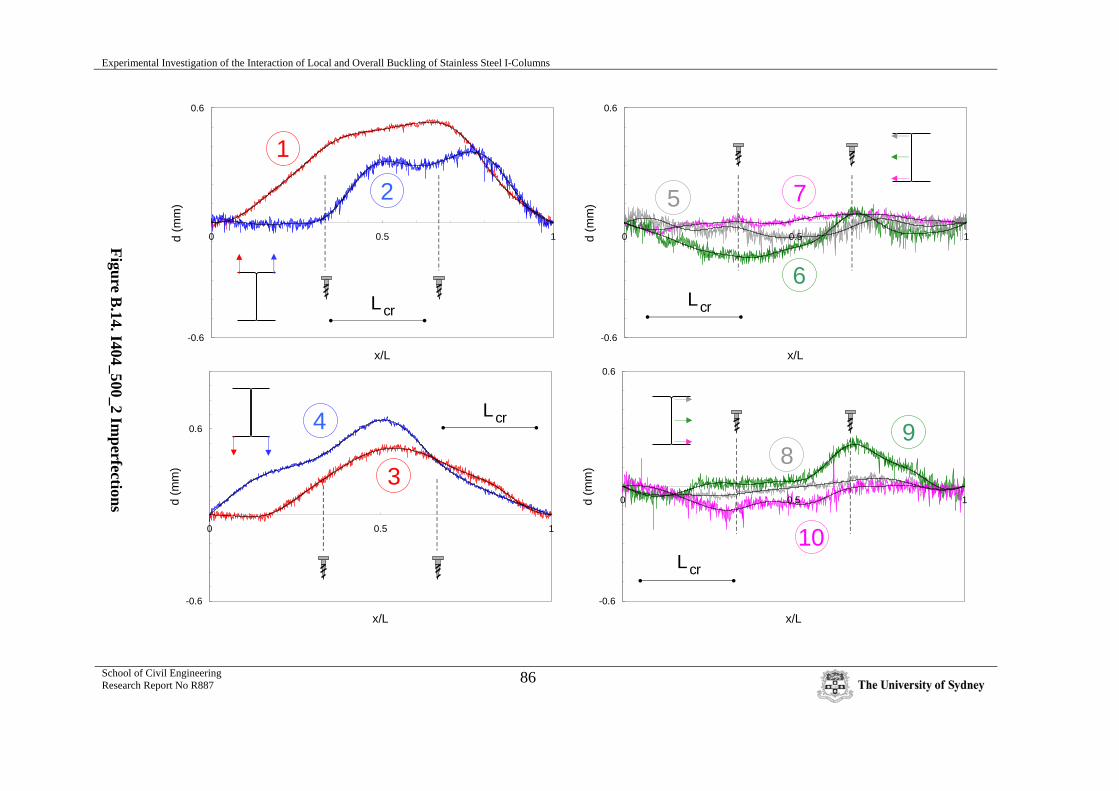
Experimental Investigation of the Interaction of Local and Overall Buckling of Stainless Steel I-Columns
School of Civil Engineering Research Report No R887
86
-0.6
0.6
0 0.5 1
x/L
d (m
m)
1
2
Lcr
-0.6
0.6
0 0.5 1
x/L
d (m
m) 5
6
7
Lcr
-0.6
0.6
0 0.5 1
x/L
d (m
m) 3
4 Lcr
-0.6
0.6
0 0.5 1
x/L
d (m
m) 8
9
10Lcr
Figure B.14. I404_500_2 Im
perfections
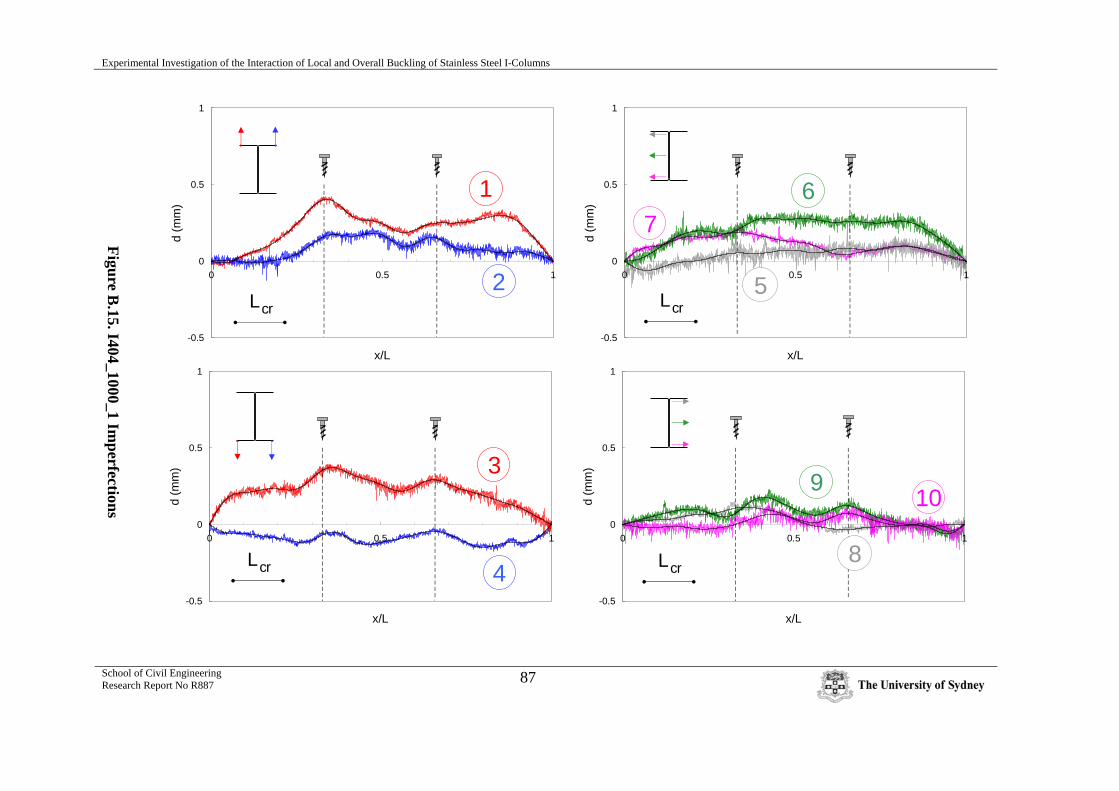
Experimental Investigation of the Interaction of Local and Overall Buckling of Stainless Steel I-Columns
School of Civil Engineering Research Report No R887
87
-0.5
0
0.5
1
0 0.5 1
x/L
d (m
m)
1
2Lcr
-0.5
0
0.5
1
0 0.5 1
x/L
d (m
m)
5
67
Lcr
-0.5
0
0.5
1
0 0.5 1
x/L
d (m
m) 3
4Lcr
-0.5
0
0.5
1
0 0.5 1
x/L
d (m
m)
8
9 10
Lcr
Figure B.15. I404_1000_1 Im
perfections
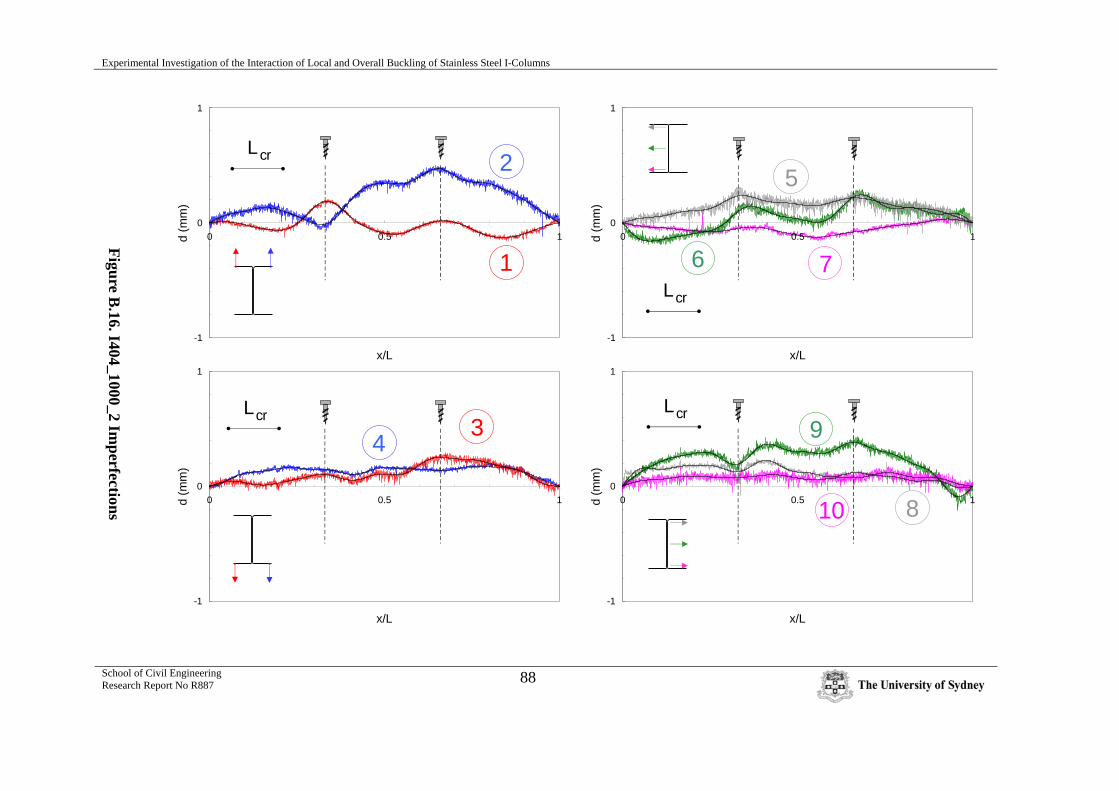
Experimental Investigation of the Interaction of Local and Overall Buckling of Stainless Steel I-Columns
School of Civil Engineering Research Report No R887
88
-1
0
1
0 0.5 1
x/L
d (m
m)
L cr
1
2
-1
0
1
0 0.5 1
x/L
d (m
m)
Lcr
5
6 7
-1
0
1
0 0.5 1
x/L
d (m
m)
Lcr 34
-1
0
1
0 0.5 1
x/L
d (m
m)
Lcr
8
9
10
Figure B.16. I404_1000_2 Im
perfections

Experimental Investigation of the Interaction of Local and Overall Buckling of Stainless Steel I-Columns
School of Civil Engineering Research Report No R887
89
-1
0
1
0 0.5 1
x/L
d (m
m)
Lcr
1
2
-1
0
1
0 0.5 1
x/L
d (m
m)
Lcr 5
6
7
-1
0
1
0 0.5 1
x/L
d (m
m)
L cr
3
4
-1
0
1
0 0.5 1
x/L
d (m
m)
Lcr
8
9
10
Figure B.17. I404_1500_1 Im
perfections

Experimental Investigation of the Interaction of Local and Overall Buckling of Stainless Steel I-Columns
School of Civil Engineering Research Report No R887
90
-1
0
1
0 0.5 1
x/L
d (m
m)
L cr
1
2
-1
0
1
0 0.5 1
x/L
d (m
m)
Lcr
56
7
-1
0
1
0 0.5 1
x/L
d (m
m)
L cr
3
4
-1
0
1
0 0.5 1
x/L
d (m
m)
Lcr
8
910
Figure B.18. I404_1500_2 Im
perfections

Experimental Investigation of the Interaction of Local and Overall Buckling of Stainless Steel I-Columns
School of Civil Engineering Research Report No R887
91
-1
0
1
0 0.5 1
x/L
d (m
m)
L cr1
2
-1
0
1
0 0.5 1
x/L
d (m
m)
L cr
6
7
5
-1
0
1
0 0.5 1
x/L
d (m
m)
Lcr
3
4
-1
0
1
0 0.5 1
x/L
d (m
m) 9
8
Lcr 10
Figure B.19. I404_2000_1 Im
perfections

Experimental Investigation of the Interaction of Local and Overall Buckling of Stainless Steel I-Columns
School of Civil Engineering Research Report No R887
92
-1
0
1
0 0.5 1
x/L
d (m
m)
L cr
1
2
-1
0
1
0 0.5 1
x/L
d (m
m)
L cr6
7
5
-1
0
1
0 0.5 1
x/L
d (m
m)
L cr
3
4
-1
0
1
0 0.5 1
x/L
d (m
m) 98
Lcr
10
Figure B.20. I404_2000_2 Im
perfections
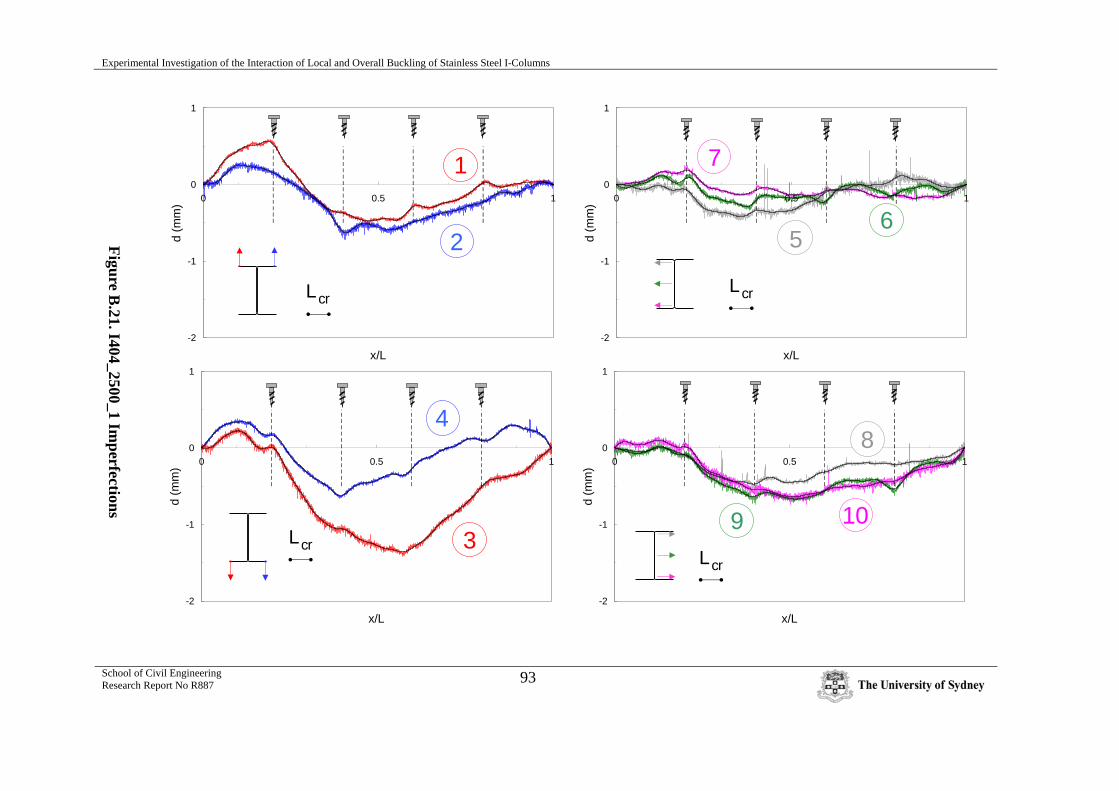
Experimental Investigation of the Interaction of Local and Overall Buckling of Stainless Steel I-Columns
School of Civil Engineering Research Report No R887
93
-2
-1
0
1
0 0.5 1
x/L
d (m
m)
1
2
Lcr
-2
-1
0
1
0 0.5 1
x/L
d (m
m)
56
7
Lcr
-2
-1
0
1
0 0.5 1
x/L
d (m
m)
3
4
Lcr
-2
-1
0
1
0 0.5 1
x/L
d (m
m)
Lcr
8
9 10
Figure B.21. I404_2500_1 Im
perfections

Experimental Investigation of the Interaction of Local and Overall Buckling of Stainless Steel I-Columns
School of Civil Engineering Research Report No R887
94
-2
-1
0
1
0 0.5 1
x/L
d (m
m)
1
2
Lcr
-2
-1
0
1
0 0.5 1
x/L
d (m
m)
7
6
Lcr
5
-2
-1
0
1
0 0.5 1
x/L
d (m
m)
3
4Lcr
-2
-1
0
1
0 0.5 1
x/L
d (m
m)
8
Lcr
9
10
Figure B.22. I404_2500_2 Im
perfections

Experimental Investigation of the Interaction of Local and Overall Buckling of Stainless Steel I-Columns
School of Civil Engineering Research Report No R887
95
-1.5
-1
-0.5
0
0.5
1
0 0.5 1
x/L
d (m
m)
1
2
Lcr
-1.5
-1
-0.5
0
0.5
1
0 0.5 1
x/L
d (m
m)
Lcr
67
5
-1.5
-1
-0.5
0
0.5
1
0 0.5 1
x/L
d (m
m)
3
4
Lcr
-1.5
-1
-0.5
0
0.5
1
0 0.5 1
x/L
d (m
m)
Lcr
8
10
9
Figure B.23. I404_3000_1 Im
perfections

Experimental Investigation of the Interaction of Local and Overall Buckling of Stainless Steel I-Columns
School of Civil Engineering Research Report No R887
96
-2
-1
0
1
2
0 0.5 1
x/L
d (m
m)
1
2
Lcr
-2
-1
0
1
2
0 0.5 1
x/L
d (m
m)
5
7Lcr
6
-2
-1
0
1
2
0 0.5 1
x/L
d (m
m) 3
4Lcr
-3
-2
-1
0
1
0 0.5 1
x/L
d (m
m)
910
8Lcr
Figure B.24. I404_3000_2 Im
perfections

Experimental Investigation of the Interaction of Local and Overall Buckling of Stainless Steel I-Columns
School of Civil Engineering Research Report No R887
97
Line A1 A2 A3 A4 A5 A6 A7 A8 A9 A10 A11 A12 A13 A14 A15 A16 A17 A18 A19 A20
1 -313 -934 -411 -498 -94 17 68 26 26 25 2 -1406 -348 13 -104 744 78 -400 -175 121 -12 3 -6640 -1025 -492 240 1097 5 -385 136 -79 -18 4 1898 115 -782 -506 -163 -279 -45 78 74 61 5 3083 548 389 -358 -202 -225 -224 -84 -166 49 6 -1887 -106 -678 -71 -427 20 -155 -26 -209 -36 7 1274 601 -168 -20 -380 -107 -95 -52 -25 93 8 -535 -156 211 19 531 -49 -228 7 -67 -52 9 6 66 365 -14 646 13 -139 -65 -27 -97 10 -1506 101 -259 150 365 85 -161 78 -60 -39
1 -1441 -604 -400 128 -156 43 -65 -5 -23 -32 2 -3805 206 -530 -268 246 -175 0 45 -12 2 3 -1299 769 200 152 521 202 -444 -277 -19 -25 4 5433 -556 1361 -468 693 -578 173 -7 298 -67 5 1560 506 454 -67 15 54 36 94 14 130 6 792 313 131 -125 -126 84 6 39 2 82 7 324 567 -265 252 -262 284 -95 52 -90 87 8 -1228 875 171 35 447 305 109 106 44 220 9 -4369 322 -723 109 -33 57 -270 -25 -75 20 10 -2223 553 -624 224 57 248 -354 117 -25 44
1 3616 -2461 1549 1611 1021 767 983 312 578 266 438 402 314 -78 92 19
2 -586 4226 588 -1054 1601 122 -243 19 507 17 355 -26 105 49 161 -7
3 -3309 -2593 -264 257 505 -25 -407 203 183 72 109 68 -9 8 -31 5
4 -177 1668 -658 -816 -550 -95 131 -83 -26 -6 -144 -121 61 55 14 53
5 28 -220 -42 -157 -200 -178 190 78 61 -108 -167 -39 325 5 51 -44
6 744 -294 15 -10 -402 -57 173 4 -31 40 -192 51 162 9 15 69
7 247 -181 -168 -100 -280 -341 5 23 -12 -64 -193 -19 83 7 25 42
8 -396 19 -256 -291 365 149 -396 -90 138 -19 43 -104 -37 74 -51 -85
9 -1391 672 101 -106 448 53 -389 -52 -64 13 87 22 -181 -53 35 -20
10 -642 198 -10 -409 94 -21 -194 -62 -5 -131 104 -16 -57 -102 -13 16
1 1928 -724 1773 1130 1367 306 975 401 755 146 568 219 435 -16 245 -27
2 -3395 -2287 -2143 -320 3259 1736 264 -103 -607 -473 115 195 -104 -11 -87 -14
3 1162 -2967 1052 446 1578 45 175 -8 700 -44 647 179 151 -267 46 -51
4 -1450 2511 -481 -749 -387 -36 -80 -155 14 -13 -91 21 157 65 22 6
5 -1727 -148 -418 -220 -249 54 -161 -96 32 -14 -134 -11 101 -59 92 -2
6 -1198 616 -140 -269 -88 17 -196 -52 -93 -40 -96 -17 62 -1 93 48
7 131 24 -232 -491 -150 -279 -118 -108 108 -111 -9 -151 38 -61 -45 -93
8 -2668 196 -699 266 394 696 -124 -34 -105 -86 112 103 27 124 22 36
9 -260 448 -77 -120 376 -115 -595 -198 210 27 171 -99 -133 -54 26 -47
10 624 535 -307 208 24 105 -296 84 -2 74 3 149 -102 -33 11 124
I304_500_1
Table B.1. Fourier Coefficients Ak (in 10-4 mm)
for the Imperfections of the 304 I-
Specimens (continued on next pages)
∫=L
k Lxkxf
LA
0
sin)(2 π
∑∞
=
=1
sin)(k
k LxkAxf π
I304500
2I304_1000_1
I3041000
2

Experimental Investigation of the Interaction of Local and Overall Buckling of Stainless Steel I-Columns
School of Civil Engineering Research Report No R887
98
A1 A2 A3 A4 A5 A6 A7 A8 A9 A10 A11 A12 A13 A14 A15 A16 A17 A18 A19 A20 A21 A22 A23 A24 A25 1 -285 -2719 1610 1256 -318 -920 335 28 361 139 -299 57 -36 53 185 -48 -4 -98 34 -53 -48 3
2 -17730 243 59 -477 981 216 1291 -140 1081
-220 641 -267 -149 -163 330 -12 263 -217 167 43 -114 128 3 -4838 -1276 1410 1002 -325 -957 -229 381 -302 55 225 60 -262 -78 97 143 -97 -15 -56 -10 -32 -66 4 328 4513 1508 -747 -212 83 41 265 87 141 -325 -22 79 118 75 42 -128 -35 32 22 32 16 5 -2717 145 -140 172 -366 -117 149 245 88 -11 -31 -66 -45 94 159 77 -69 23 27 132 126 85 6 -3570 154 -697 -460 -933 -426 -341 107 -19 -113 -372 -313 -157 -13 83 -59 -161 -173 -52 -26 18 4 7 -3509 2068 -976 367 -845 259 -240 213 -145 180 -237 93 -118 24 -23 67 -128 79 -105 4 -28 89 8 -3357 865 -532 820 -164 491 -253 286 -81 160 -160 157 -74 136 16 74 71 174 -98 50 3 9 9 -3372 854 -347 307 -159 139 -561 139 132 97 -342 -122 -18 124 -28 -13 144 3 -182 -62 34 25 10 -1947 1473 -362 274 -183 169 -211 268 -2 73 -163 56 -127 58 23 -61 87 43 -85 -51 52 24
1 -1974 -2149 686 1174 -102 -609 -129 -125 -53 125 -183 -76 162 -30 115 62 -38 -50 73 -6 -13 -5 2 4455 2295 2141 -2438 1716 -381 197 -769 645 -366 434 -213 113 -157 356 -231 330 -352 347 -218 93 -91 3 -2533 -1885 467 750 301 -565 -645 -39 -47 115 27 32 -117 -43 -14 79 1 36 -151 -35 -40 -15 4 1873 2924 1419 -836 16 136 -90 -114 -39 66 -86 -15 147 125 23 3 -52 -55 22 53 -44 1 5 -3148 629 -1096 -68 -364 -5 212 -217 -13 -162 -116 -131 40 62 -144 20 -174 81 70 90 -49 -73 6 -2235 530 -1179 300 -421 -57 294 -209 -81 82 -104 -9 46 -84 -127 196 -128 81 32 -129 20 197 7 -1478 844 -929 390 -497 86 197 -232 104 54 -113 -79 151 -114 -65 106 -109 -32 113 -23 -66 102 8 -2851 729 -377 290 -23 422 -131 164 -51 141 -40 25 -201 189 -127 32 143 2 -140 94 -58 -63 9 -1340 617 311 -59 240 388 -102 156 182 -51 -28 51 -148 105 46 -63 31 -5 -128 24 -22 -30 10 -1790 830 -119 340 34 471 -179 151 0 181 -5 160 -174 44 42 26 43 86 -100 18 -56 41
1 -3458 -1853 2031 872 610 -9 -56 248 645 -112 -73 40 -141 -98 -238 -10 100 27 -90 50 -71 -36 -71 -24 83
2 -4963 2986 2035 -1054 1141 908 958 -299 -335 148 -11 -136 -55 -8 320 43 -150 -2 -72 18 -6 56 116 38 -30
3 -3009 -2948 1802 928 911 -397 1045 309 -236 -32 -124 151 -69 -45 137 -108 -165 -39 -98 -28 18 -46 106 -12 -31
4 -2354 3521 2724 -2202 63 625 -141 -449 607 123 99 209 -204 -47 -172 -112 254 68 47 50 37 17 -65 14 107
5 -1603 -952 -844 -224 -491 -235 -486 -286 224 -217 4 -127 80 -192 -13 -213 99 -16 21 -38 58 -86 -88 18 75
6 -2028 8 -859 229 -715 -110 -830 -4 229 -20 230 71 40 -114 -131 -20 129 -67 28 21 -49 -18 -190 5 8
7 -3713 293 -997 9 -603 -325 -597 -166 86 25 41 39 103 -78 -71 -65 42 -103 152 -62 -5 -10 -27 -49 4
8 -1031 80 -694 60 -39 -45 -25 -83 14 -32 -22 -35 27 -148 79 -5 -23 -71 36 24 112 2 116 34 -4
9 -3853 304 -1024 -33 -194 -169 302 -229 -312 -107 -106 -103 -3 -35 187 -44 -139 -130 13 -8 12 -25 138 -83 -91
10 -3598 480 -572 -44 -488 -361 -44 119 -258 105 -85 -155 85 16 44 -45 -50 -172 -22 23 140 -74 48 28 47
1 -3795 -1708 1845 283 135 -914 -197 409 659 -192 241 47 -311 21 -224 -143 74 33 -22 -138 -93 -9 -188 -16 134
2 -3994 2602 1461 -1461 208 379 1359 -106 -555 233 120 21 -102 233 338 54 -275 -58 -97 -22 1 21 122 74 -98
3 -2451 -1477 2488 1421 337 -488 1053 662 46 -85 -44 251 -184 284 71 205 -201 -76 37 -187 128 -150 150 -15 -120
4 -4747 3160 895 -1876 -167 69 -903 -318 694 401 -162 190 -235 271 -356 -9 204 39 2 10 -29 54 -126 34 -37
5 327 388 71 -167 -386 -121 -399 -285 148 -114 10 -70 5 -35 -37 -59 86 11 -90 -25 65 22 -53 -60 -50
6 -2113 57 -1381 -115 -777 -270 -990 -149 -46 -2 -171 4 -136 -67 -441 -10 -58 4 -211 -35 -130 16 -272 31 -27
7 -1194 -144 -1092 83 -397 -291 -562 -219 -17 -181 52 -53 153 -75 -87 -56 138 -15 -19 -81 1 -14 -123 -4 50
8 -4843 584 -269 -110 -195 -194 -91 -357 -163 -42 75 -163 62 -95 101 -57 -109 -38 43 -6 56 -4 79 -26 -66
9 -5447 139 -29 50 -256 40 580 -200 -467 -46 72 -76 73 -80 272 104 -371 38 -86 7 -13 22 114 -2 -92
10 -5185 -62 -701 154 -235 -147 17 1 -76 44 50 28 137 -2 208 5 -67 -70 -30 17 47 -4 6 80 -99
I304_1500_I304
15002
I304_2000_1 I304
20002

Experimental Investigation of the Interaction of Local and Overall Buckling of Stainless Steel I-Columns
School of Civil Engineering Research Report No R887
99
Line A1 A2 A3 A4 A5 A6 A7 A8 A9 A10 A11 A12 A13 A14 A15 A16 A17 A18 A19 A20 1 -6014 -3791 2659 1669 317 -343 157 727 -327 -297 158 117 186 -17 3 185 -86 -125 -256 2
2 -8122 3642 1366 -650 1043 1279 552 -549 877 109 -694 -288 183 -239 173 -189 50 -31 260 -105
3 -703 -3901 3051 1880 774 45 804 688 940 -414 -395 162 133 -288 102 216 147 -112 167 -102
4 -8737 3953 708 -54 -44 997 114 -734 -78 -148 29 -504 -7 68 -24 -4 -112 -124 -66 -150
5 3764 516 -32 464 -69 399 -316 -56 -490 71 -12 82 -65 -1 -23 47 -26 -17 -63 -5
6 1403 102 -895 947 -198 218 -661 -98 -900 -81 -86 -72 -96 16 -114 -111 -155 -162 -241 -127
7 94 863 -1556 1759 -119 467 -327 295 -605 -14 -64 34 -70 -62 -159 126 23 -51 -202 -34
8 -8276 1280 157 215 185 617 -67 -42 -105 66 -264 3 -35 129 -46 -74 -54 68 107 -7
9 -10106 656 310 539 810 671 439 4 232 -111 -459 -141 -82 -132 157 -9 161 1 303 43
10 -11956 1476 -906 1412 320 507 131 388 -135 -195 -334 35 -136 -138 -58 118 89 -6 99 58
1 2642 -5135 1914 1434 613 -145 446 1239 -61 -175 323 142 403 -129 47 -47 -42 -76 -159 44
2 -10954 3544 1648 -631 892 449 950 -1119 1300 -344 -514 -598 268 -228 80 -134 -22 -158 459 -306
3 632 -4013 2035 1451 368 -338 586 760 794 -435 -591 36 -32 15 58 -42 214 -48 267 26
4 -16115 3009 1734 -510 1058 374 97 -589 -594 103 -14 -354 343 -170 405 -423 105 -92 -314 -16
5 12725 1562 13 989 225 811 -178 270 -558 239 3 287 -86 179 75 78 92 119 -145 105
6 10515 1252 439 1692 675 443 -15 313 -460 -71 140 66 -33 265 -7 -52 38 29 -154 -128
7 2966 1660 -323 1739 318 440 -76 259 -441 -215 -8 -181 -118 -197 -9 -14 81 -37 -58 7
8 -9136 -855 -414 -165 -44 342 2 -339 5 -178 -230 -170 20 -124 -146 -25 83 -115 17 -153
9 -16810 -31 -1047 974 9 209 194 -48 75 -309 -460 -165 -208 -103 -145 -28 150 -181 264 -29
10 -19622 -353 -1261 1395 -100 -35 119 192 -43 -452 -346 -283 -151 -171 -142 -14 131 -143 74 -45
1 -895 -1729 4361 744 1862 -555 1414 529 628 -353 -496 173 730 -124 168 163 470 110 308 244
2 -2700 -1281 3905 -1946 2389 35 1172 -1592 742 -476 663 -103 -352 121 -33 16 389 77 288 -331
3 -3396 -1871 2840 328 1149 -436 647 586 514 -134 265 311 -576 -83 -115 15 115 12 167 89
4 1648 -1695 4166 -1925 1646 -204 1012 -1241 160 -138 -884 -41 394 361 -121 203 157 62 177 -107
5 -2701 2131 -145 175 -362 208 -142 223 88 444 -6 -254 226 -12 -46 -111 110 50 -28 57
6 -3052 617 164 1459 -308 -67 -269 138 138 505 -194 -168 343 -157 -91 -142 -54 -85 -19 47
7 -354 -527 297 2319 111 -138 -159 154 233 320 106 6 113 17 -46 -172 40 -20 72 106
8 -4501 3578 582 -253 -362 101 -229 -149 228 283 267 -287 -195 31 -88 -143 47 69 35 -13
9 -3554 2355 1471 316 335 -323 -76 -347 579 12 800 -243 -458 -70 -117 -175 58 23 21 -74
10 -2284 1405 1108 1863 115 -247 -259 -29 298 167 294 -77 -119 -118 -55 -106 41 -37 63 29
1 -4276 -1711 2973 1378 1139 -323 474 595 -283 -475 -744 503 68 110 71 135 165 25 -55 34
2 1249 1283 6561 -1068 1507 257 1617 -674 147 605 566 158 -650 439 197 161 289 232 30 133
3 -4303 -2291 2485 1194 2315 -272 933 367 953 -562 339 65 -220 -27 -375 70 129 211 12 77
4 -1831 2211 3615 -1392 1702 534 1097 -939 107 -56 -589 460 467 350 229 215 168 197 55 -121
5 -2510 -353 -130 -727 186 -2 -508 -343 15 -22 -14 -262 29 -103 0 -194 -50 -152 -20 34
6 -3104 -274 241 261 147 -364 -335 -370 -99 28 54 -171 129 29 167 -297 -85 -102 41 64
7 -2624 59 72 1357 -276 -367 -275 -214 7 -34 88 -26 243 21 106 -227 -55 -238 16 57
8 -1432 2173 572 -220 521 -181 -233 -226 246 155 414 -244 -68 -241 -41 -113 -95 -65 129 -56
9 -1075 3004 1665 1407 702 -118 94 160 668 387 903 14 -92 -78 -28 121 -6 16 195 177
10 -2252 2458 1103 2132 103 -241 -108 -45 352 168 372 5 8 1 14 -64 9 -31 42 54
Continued on next page.
I304 _2500_I304
25002
I304_3000_1 I304
30002

Experimental Investigation of the Interaction of Local and Overall Buckling of Stainless Steel I-Columns
School of Civil Engineering Research Report No R887
100
Lin A21 A22 A23 A24 A25 A26 A27 A28 A29 A30 1 233 -149 -2 12 75 -70 -8 10 -88 3
2 -208 56 -28 -40 73 9 13 -39 135 27
3 -81 -60 54 -29 112 -27 43 -43 27 -40
4 130 -32 175 86 -95 -30 -96 23 -94 32
5 58 128 82 85 75 85 52 -2 15 45
6 32 30 -11 37 -8 -36 -39 -24 -85 -29
7 127 3 -1 9 74 -39 17 27 -108 15
8 -168 67 -32 47 62 79 -84 -79 19 13
9 -127 18 -46 -98 114 -35 32 24 181 -15
10 -14 34 21 3 -14 -91 -35 75 118 89
1 161 -111 75 53 98 -145 -23 -45 -45 -28
2 -132 51 36 -177 138 92 -87 -11 162 -53
3 -135 -125 -14 -46 21 -112 81 12 140 -69
4 -33 120 51 103 143 -14 176 123 -335 -147
5 19 164 103 218 97 110 151 89 -14 85
6 122 43 38 69 79 89 -71 85 -76 -13
7 128 -88 70 -75 83 -170 31 -20 -35 19
8 -88 -9 -53 41 19 -71 -15 -113 64 16
9 -215 -26 -14 35 -23 37 13 -134 162 32
10 0 -119 -42 5 -75 -110 -66 43 107 -12
1 234 69 -116 10 304 -76 90 76 129 29
2 283 -127 360 -172 -89 15 -21 -141 134 -39
3 100 84 288 57 -168 16 0 64 12 62
4 -23 -184 -238 -125 130 48 30 0 -32 -33
5 12 20 -24 -79 89 33 -34 27 53 23
6 3 125 -223 -94 122 -70 -48 74 96 41
7 15 91 -150 1 34 -49 -16 103 42 -25
8 79 13 39 -18 -123 32 -19 46 -37 50
9 140 -38 161 -67 -305 70 -76 50 -38 30
10 70 30 70 9 -179 -63 -27 69 -57 -10
1 -84 54 -120 82 86 -11 86 10 26 7
2 149 109 323 -15 -220 40 15 96 -36 53
3 225 97 230 -75 -70 133 -105 -15 -27 112
4 -32 26 -140 6 224 6 146 -40 106 17
5 -22 -45 -129 -3 11 -68 -40 -64 -3 1
6 -9 43 -78 -4 22 -66 22 26 49 36
7 122 -62 -89 -80 44 -75 79 -2 84 -76
8 136 -89 154 39 -193 -93 0 74 -13 -45
9 315 114 241 116 -144 15 -102 74 50 56
10 93 42 128 61 -2 95 -159 17 -3 -28
I3043000
2 I304_3000_1
I3042500
2I304_2500_
Continued from
previous page.

Experimental Investigation of the Interaction of Local and Overall Buckling of Stainless Steel I-Columns
School of Civil Engineering Research Report No R887
101
Line A1 A2 A3 A4 A5 A6 A7 A8 A9 A10 A11 A12 A13 A14 A15 A16 A17 A18 A19 A20
1 4975 -178 82 386 -276 -23 79 -21 23 15 2 2654 -1357 -461 -20 19 -32 69 -10 24 33 3 2758 461 -339 195 -33 30 -17 5 -35 3 4 3726 -465 -610 -357 -280 74 -33 5 -81 -23 5 751 53 316 55 -87 105 42 53 -7 18 6 1898 -381 785 7 139 247 96 198 98 0 7 538 -199 390 182 -52 102 108 47 102 41 8 -858 -508 -187 86 -142 -12 -146 -94 -101 99 9 -1733 183 -258 -127 -364 -23 -127 34 -146 1
10 -508 -268 -28 -89 -67 44 -32 -16 12 28 1 4909 -654 -360 57 -385 86 1 -61 -4 -43
2 2556 -1648 -84 -25 227 290 -313 31 18 70 3 5224 520 -746 298 503 -27 -117 34 9 -26 4 3671 -932 -850 -94 0 45 -36 106 -23 52 5 187 -263 -33 -16 -123 -68 -31 -3 -12 -34 6 -1138 -728 -88 396 -230 67 89 -96 31 57 7 -441 -94 220 33 -122 146 53 81 83 -16 8 -108 -394 -97 13 -103 49 -73 -4 -30 -8 9 787 -832 65 147 -469 30 4 -74 -42 116
10 -763 -425 88 115 19 178 32 -37 -49 61 1 3151 -171 561 -926 -196 -149 217 54 4 -20 -162 -39 51 26 -55 -31
2 1370 -105 -287 -295 -41 41 180 -52 42 50 -65 -67 122 33 -50 19
3 -1174 94 -437 231 -313 52 118 -11 -155 -27 -103 86 -7 -9 -53 -17
4 3255 376 455 5 33 326 363 21 1 41 -18 36 126 57 -16 11
5 1470 518 380 -178 138 79 -17 80 14 -34 0 55 49 10 44 9
6 2975 -352 388 -214 200 -29 -81 -118 -123 -19 6 29 7 -54 -5 4
7 694 -389 12 -259 -80 -91 -67 -39 -64 -2 -75 -58 8 14 -23 13
8 405 556 -4 -244 -10 117 16 -12 -5 -1 15 12 20 10 15 -32
9 1082 294 -149 171 -53 276 13 -193 -172 147 -8 66 -13 -3 -54 30
10 261 -156 -263 25 -72 145 34 -118 -93 100 -82 15 -19 31 -25 32
1 -172 548 -286 -149 -672 160 528 117 44 -96 -89 -21 64 50 17 -25
2 3182 -1598 221 518 470 156 -84 -291 -85 248 30 -66 39 -16 -5 70
3 1805 -95 553 2 154 -69 -77 62 45 -24 -39 0 3 20 -54 -44
4 1561 -850 390 56 -229 45 125 87 57 129 -69 -20 46 81 -64 -5
5 -822 -99 135 -308 -5 59 106 -77 -27 -38 15 -12 12 -2 -19 3
6 811 -1028 -183 -602 -590 73 255 -322 -117 -72 -169 -6 146 -118 -1 -50
7 2087 -116 202 -166 -164 32 228 -20 2 -12 -76 9 60 59 6 -9
8 1636 563 337 142 156 279 86 -73 26 170 126 125 -22 -2 6 129
9 3549 24 401 495 -53 412 -152 -115 -213 314 -2 136 -123 -35 -101 133
10 1016 -30 332 -52 61 108 -13 -44 11 14 56 8 -20 61 -21 16
I404_500_1 I404
5002
Table B.2. Fourier Coefficients Ak (in 10-4 mm)
for the Imperfections of the 404 I-
Specimens (continued on next pages)
∫=L
k Lxkxf
LA
0
sin)(2 π
∑∞
=
=1
sin)(k
k LxkAxf π
I404_1000_1 I404
10002

Experimental Investigation of the Interaction of Local and Overall Buckling of Stainless Steel I-Columns
School of Civil Engineering Research Report No R887
102
A1 A2 A3 A4 A5 A6 A7 A8 A9 A10 A11 A12 A13 A14 A15 A16 A17 A18 A19 A20 A21 A22 A23 A24 A25 1 -8579 -317 505 433 502 -274 722 -203 311 151 -53 -99 210 -51 86 5 -32 -14 74 -32 7 -19
2 4476 -890 1621 85 1551 -562 343 -90 251 270 255 -184 -29 -9 -3 139 107 -25 -62 -31 -29 37 3 -4236 -708 2509 -81 1247 -472 12 316 167 -304 54 -286 -118 90 -9 -96 15 -124 -67 30 22 -53 4 -1467 714 551 358 301 316 90 521 287 205 -84 -107 164 -66 217 -211 225 -85 220 -36 -21 -115 5 -2139 640 505 -79 180 -204 -86 10 -39 -23 -62 -79 113 18 72 -7 -88 -73 79 40 24 -18 6 -2936 -394 -462 191 -402 -607 -628 -195 -361 -20 -256 -313 -67 -31 -46 43 -112 -189 -66 -32 -16 41 7 3393 -343 454 484 -34 -278 -101 -22 -105 117 -96 -39 73 46 -24 46 -68 -11 8 8 -3 23 8 527 263 873 1 498 -242 27 -138 29 209 78 -19 16 -21 24 32 29 -29 -7 8 -7 20 9 8162 656 1870 235 964 -580 76 -14 106 284 160 -144 8 89 28 80 66 -137 -79 65 8 77
10 8178 921 705 247 190 -396 -91 105 -36 116 -4 -20 -18 139 -3 -6 -15 -11 -42 32 7 49 1 -77 -31 1989 -939 1390 12 188 -340 127 -153 -15 -65 104 -24 -17 4 -66 -8 69 -34 -32 23
2 2258 -724 1582 -504 1401 -221 -587 -110 -19 69 182 34 -49 -16 -43 110 76 34 58 -58 -11 45 3 -2310 -1819 2078 -713 1481 138 131 -282 170 -353 -15 -55 4 -70 11 -125 -112 -32 -7 -28 -14 -28 4 -4118 2260 1349 457 787 692 167 205 535 -160 60 23 -1 19 201 -48 -72 -30 90 8 39 -9 5 4447 1094 1198 -58 421 212 -42 66 -9 -47 21 12 62 1 102 16 -8 -3 52 45 54 -59 6 814 1811 384 -56 317 256 -953 290 -101 -212 -27 45 -310 68 108 -88 60 3 -123 63 -4 -29 7 2277 -300 467 71 428 -151 -197 -53 -30 -100 -49 -70 3 -55 17 61 -37 -42 36 -7 13 -7 8 3805 80 970 -132 642 135 -194 -133 -13 53 78 -7 -26 -39 16 19 16 15 24 -33 -23 -29 9 9450 -828 1538 -523 1270 -69 -542 -127 -168 -216 249 102 -164 7 17 -48 68 18 -103 -19 -43 -63
10 9332 -15 465 107 455 -127 -154 -36 -70 -76 -68 -38 -55 22 24 12 -69 -3 11 15 -20 -43 1 3248 -1564 3884 -1016 904 -124 98 -128 376 342 139 234 109 133 -156 110 19 16 -181 73 -126 -71 -231 25 -63
2 -4397 -2469 2658 -141 1660 52 425 619 -47 223 -159 295 274 223 151 114 -90 49 -115 105 -3 94 30 47 -33
3 -3019 795 2101 52 1530 283 450 296 61 252 55 191 264 89 28 -89 -174 -119 -115 -8 101 126 95 47 18
4 -658 1638 4275 1336 1148 120 617 689 242 -404 202 -41 206 -77 -96 88 126 79 -164 24 -53 60 -153 -123 74
5 -2262 -109 -174 -169 -31 247 202 132 119 -35 15 -1 62 26 45 -5 80 -72 43 -11 43 -66 -22 5 57
6 -5749 -325 -470 19 -286 -20 86 201 -129 -135 -96 79 -86 30 71 60 60 -89 108 -16 -39 -132 -10 29 62
7 -7106 -1331 -544 165 86 16 233 363 186 55 44 112 52 79 12 65 72 30 46 52 46 27 -33 -9 52
8 1156 392 -64 -158 183 310 390 191 34 79 -64 96 167 50 82 -15 -48 -61 -86 24 45 -1 -16 24 29
9 -1623 -312 -627 -259 154 153 392 212 -105 132 -49 164 250 77 -40 -163 -338 -147 -178 35 105 131 89 87 -57
10 -4104 -972 -524 4 180 59 321 345 -21 89 -92 124 58 50 49 -3 -86 4 -38 49 20 76 7 33 -31
1 -4969 1685 1525 148 320 -262 -5 600 501 305 199 31 -166 121 -142 -28 14 -158 -8 -158 -36 92 74 89 82
2 -5476 -2588 923 -754 816 -194 596 235 -239 2 -331 -9 -71 194 320 161 34 83 -14 -38 -26 80 118 110 -39
3 -2769 2509 1886 399 852 54 -2 -12 14 -212 23 -29 -14 -14 132 32 -75 -80 42 -58 26 -84 51 -52 23
4 -3687 -1918 1623 -490 2 56 -328 439 -30 197 193 208 -27 200 -16 113 5 12 67 131 45 119 -4 67 48
5 -1543 1416 321 -12 -68 338 345 333 92 100 72 52 123 40 27 -21 30 -67 -29 6 25 -10 -20 36 56
6 -3574 786 -574 -224 -550 61 507 581 76 291 115 25 32 20 -35 -104 -171 -135 -134 -33 64 139 141 101 27
7 -4698 -597 -525 -66 -127 -19 289 460 135 153 71 62 52 72 2 11 54 29 -22 0 -13 34 -39 42 41
8 -667 486 469 -95 102 299 542 265 -122 -27 -2 -3 27 -31 139 27 -19 -56 8 -4 -24 -28 83 75 -29
9 -2381 -1204 -407 -178 279 219 635 320 -266 -207 -319 -48 62 48 70 141 -35 -61 -190 20 -17 -2 18 56 -11
10 -5396 -1947 -943 129 43 79 379 363 -155 -9 -75 49 18 66 -20 24 -90 36 -72 45 -8 35 -17 46 -30
I404_1500_I404
15002
I404_2000_1 I404
20002

Experimental Investigation of the Interaction of Local and Overall Buckling of Stainless Steel I-Columns
School of Civil Engineering Research Report No R887
103
Line A1 A2 A3 A4 A5 A6 A7 A8 A9 A10 A11 A12 A13 A14 A15 A16 A17 A18 A19 A20 1 -2011 1683 3201 1332 604 -44 -192 -167 -235 -6 199 -104 131 12 -22 -26 -58 -46 -183 -11
2 -3846 1437 2162 757 149 -206 -23 17 134 14 -223 -237 79 45 -11 -262 -44 -5 56 -77
3 -2229 -821 3127 1071 1018 -136 187 -232 408 35 10 -10 65 75 -112 -73 -44 -98 201 22
4 -10497
2254 3005 809 382 487 -470 -126 -73 261 27 24 -21 -262 -71 -152 -127 -103 -53 55
5 -913 921 206 834 -13 153 -171 -331 -288 141 10 -25 1 -17 34 -6 -86 -31 -2 82
6 -1453 -46 516 683 129 118 -151 -469 -82 219 -268 105 -85 -85 -21 -25 -139 -152 103 140
7 -2272 -1413 870 560 134 61 -108 -95 -396 74 -12 57 -1 21 60 11 -71 -14 -76 84
8 -3724 -137 524 828 -66 148 -108 -310 -187 45 -47 -41 -35 88 26 -30 -54 30 71 17
9 -5739 773 641 920 -76 -62 5 -447 -201 169 -284 141 -212 200 -116 -33 -39 -36 113 125
10 -5329 1448 880 923 81 124 -49 -84 -243 134 -33 133 -11 137 -26 13 -56 14 100 124
1 -4822 -1038 2795 -28 385 37 361 -91 -234 -166 401 95 103 -119 -45 131 26 -20 -58 -1
2 -4593 1190 2296 674 167 290 -811 47 447 -195 -397 -292 107 -162 -99 -100 -127 18 212 -20
3 -7420 -450 3024 88 -85 656 -84 563 219 8 58 -74 117 -266 95 161 -16 -33 56 101
4 -9 1442 2953 386 426 -14 -201 -276 -382 -170 115 -11 71 -357 -16 -188 35 -51 -167 -17
5 -7657 1180 504 153 259 212 -166 -326 -228 138 68 -4 -40 -29 56 -33 9 55 -25 69
6 -2889 45 1359 -36 794 -207 308 -530 -112 78 104 58 -150 -106 52 -141 137 -8 -29 78
7 -2045 361 682 542 191 -62 -190 -189 -229 73 90 68 -93 -8 15 28 12 53 3 49
8 -7196 744 228 627 183 393 -321 -226 -69 139 -71 -37 -44 43 47 -12 -100 54 144 52
9 -6317 805 -218 1001 58 351 -642 74 4 263 -457 -63 -77 95 -33 -2 -139 147 124 139
10 -1723 471 54 779 160 89 -405 -76 -189 68 -134 56 -47 15 6 3 -66 63 56 76
1 -324 1517 1498 779 -644 -36 -103 -30 578 45 -205 -213 163 -388 -216 -41 173 11 -209 75
2 -1511 2640 4512 1033 -47 -1000 550 -68 869 331 98 7 -541 64 -184 -256 234 -35 90 -101
3 -2691 1658 1817 144 -525 311 -619 384 333 16 100 -88 -637 111 -275 141 73 -17 35 -65
4 -7887 -56 2624 -169 -1284 -961 -526 34 698 -229 -441 -212 -235 -44 -245 126 128 151 -24 -174
5 -1293 1857 -233 187 -138 -182 -209 -69 256 4 -331 -195 80 -117 -78 -48 28 17 -21 -66
6 -3102 726 57 480 130 -502 -287 -297 529 -162 -198 -418 248 -146 -212 -131 88 156 -98 -124
7 -5264 1388 498 1275 -349 -188 -176 320 328 68 -360 -133 138 -78 -119 -25 100 113 -30 -97
8 -4195 1808 171 385 -45 -147 -70 148 163 199 -141 -75 -149 23 -77 -48 51 14 -71 0
9 -6609 2385 789 636 133 -101 -239 473 201 378 -181 -4 -363 184 -180 -133 -24 20 -160 -73
10 -8745 1746 1275 1127 -288 -49 -16 490 208 96 -117 -51 -220 -39 -103 -24 37 22 -45 -52
1 -13579
970 3098 791 -1485 -217 -189 -169 256 27 -778 -3 -21 -298 -102 -78 73 -139 87 -56
2 4411 1256 3184 1930 -851 -464 -242 -354 600 377 -288 -194 -438 -271 -280 -65 194 1 33 -43
3 -11907
4144 3326 514 -1001 977 10 398 427 -452 -143 -120 -373 -80 -194 265 85 76 -7 19
4 2546 2739 3374 978 -429 -422 350 516 947 120 -314 333 134 145 24 333 100 242 104 -87
5 -1233 912 1104 869 -577 -50 154 -59 311 78 -266 -106 139 -67 -12 -46 17 38 43 -26
6 4613 -1495 461 451 -786 -631 272 -275 242 -265 -248 -287 59 -274 -87 -172 -77 -29 56 -71
7 9779 -1010 337 974 -304 -299 70 357 314 23 -305 -151 124 -150 -36 -5 71 -8 50 -26
8 -19136
3115 284 1023 -545 -25 -38 137 165 214 -188 -36 -99 -16 -49 6 40 21 -57 89
9 -14733
3617 604 1829 -664 320 211 384 260 308 -175 94 -39 95 -53 -21 -18 115 -132 98
10 -8410 1190 -62 1455 -674 52 -27 459 194 34 -270 -63 -103 -20 -55 -21 2 75 -52 -1
Continued on next page.
I404 _2500_I404
25002
I404_3000_1 I404
30002
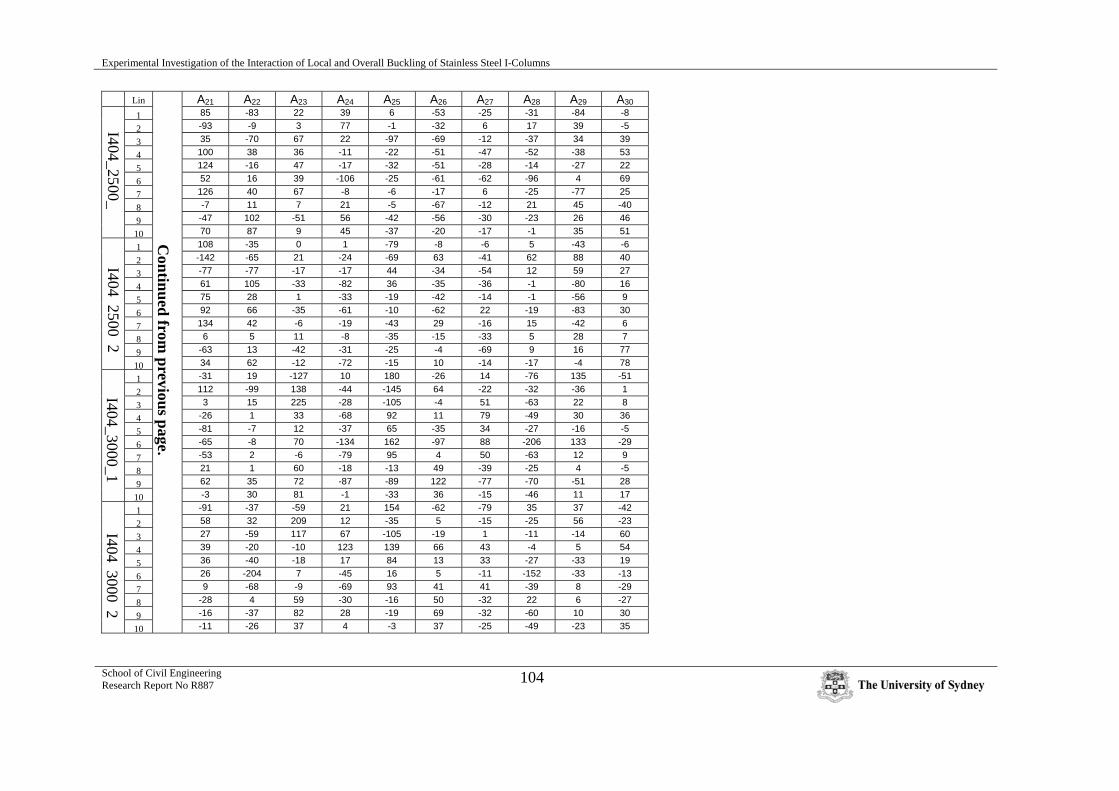
Experimental Investigation of the Interaction of Local and Overall Buckling of Stainless Steel I-Columns
School of Civil Engineering Research Report No R887
104
Lin A21 A22 A23 A24 A25 A26 A27 A28 A29 A30 1 85 -83 22 39 6 -53 -25 -31 -84 -8
2 -93 -9 3 77 -1 -32 6 17 39 -5
3 35 -70 67 22 -97 -69 -12 -37 34 39
4 100 38 36 -11 -22 -51 -47 -52 -38 53
5 124 -16 47 -17 -32 -51 -28 -14 -27 22
6 52 16 39 -106 -25 -61 -62 -96 4 69
7 126 40 67 -8 -6 -17 6 -25 -77 25
8 -7 11 7 21 -5 -67 -12 21 45 -40
9 -47 102 -51 56 -42 -56 -30 -23 26 46
10 70 87 9 45 -37 -20 -17 -1 35 51
1 108 -35 0 1 -79 -8 -6 5 -43 -6
2 -142 -65 21 -24 -69 63 -41 62 88 40
3 -77 -77 -17 -17 44 -34 -54 12 59 27
4 61 105 -33 -82 36 -35 -36 -1 -80 16
5 75 28 1 -33 -19 -42 -14 -1 -56 9
6 92 66 -35 -61 -10 -62 22 -19 -83 30
7 134 42 -6 -19 -43 29 -16 15 -42 6
8 6 5 11 -8 -35 -15 -33 5 28 7
9 -63 13 -42 -31 -25 -4 -69 9 16 77
10 34 62 -12 -72 -15 10 -14 -17 -4 78
1 -31 19 -127 10 180 -26 14 -76 135 -51
2 112 -99 138 -44 -145 64 -22 -32 -36 1
3 3 15 225 -28 -105 -4 51 -63 22 8
4 -26 1 33 -68 92 11 79 -49 30 36
5 -81 -7 12 -37 65 -35 34 -27 -16 -5
6 -65 -8 70 -134 162 -97 88 -206 133 -29
7 -53 2 -6 -79 95 4 50 -63 12 9
8 21 1 60 -18 -13 49 -39 -25 4 -5
9 62 35 72 -87 -89 122 -77 -70 -51 28
10 -3 30 81 -1 -33 36 -15 -46 11 17
1 -91 -37 -59 21 154 -62 -79 35 37 -42
2 58 32 209 12 -35 5 -15 -25 56 -23
3 27 -59 117 67 -105 -19 1 -11 -14 60
4 39 -20 -10 123 139 66 43 -4 5 54
5 36 -40 -18 17 84 13 33 -27 -33 19
6 26 -204 7 -45 16 5 -11 -152 -33 -13
7 9 -68 -9 -69 93 41 41 -39 8 -29
8 -28 4 59 -30 -16 50 -32 22 6 -27
9 -16 -37 82 28 -19 69 -32 -60 10 30
10 -11 -26 37 4 -3 37 -25 -49 -23 35
I4043000
2 I404_3000_1
I4042500
2I404_2500_
Continued from
previous page.

Experimental Investigation of the Interaction of Local and Overall Buckling of Stainless Steel I-Columns
School of Civil Engineering Research Report No R887
105
Appendix C
Appendix D contains the experimental data of all 24 I-column tests. For each test 4 graphs
are presented, showing:
a. The load vs. axial shortening.
b. The load vs. lateral displacement.
c. The load vs. end rotations.
d. The load vs. local displacements.
The locations of the LVDTs D1, D2, L1 and L2 are shown in Figure 2.17 and 2.21. The
sign convention shown in Figure 2.28 has been used.
The reader is referred to section 2.4 of the main text for further details.

Experimental Investigation of the Interaction of Local and Overall Buckling of Stainless Steel I-Columns
School of Civil Engineering Research Report No R887
106
0
10
20
30
40
50
60
0 0.5 1 1.5 2 2.5
Axial Shortening (mm)
Axi
al L
oad
(kN
)
0
20
40
60
80
100
Ave
rage
Axi
al S
tress
(MP
a)
Figure C1.a. I304_500_1 : Axial Load vs. Axial Shortening
0
10
20
30
40
50
60
0 2 4 6 8 10 12
Lateral Displacement (mm)
Axi
al L
oad
(kN
)
LVDT D1
LVDT D2
Figure C1.b. I304_500_1 : Axial Load vs. Lateral Displacement
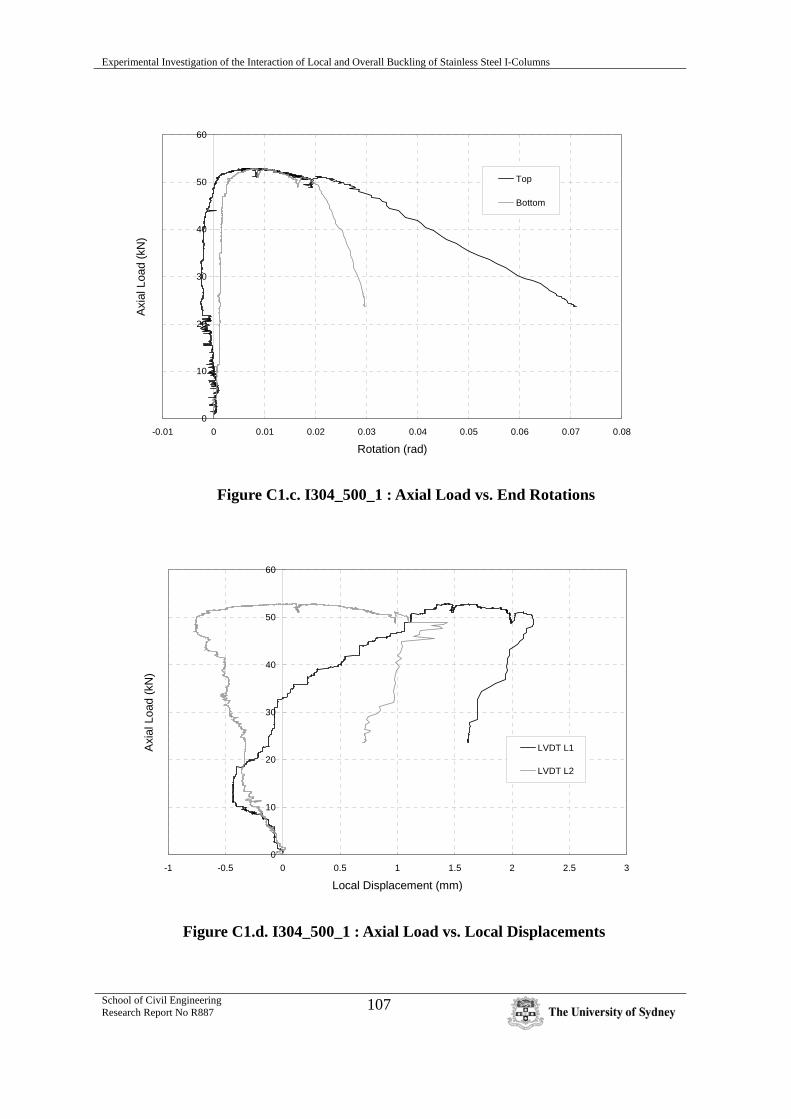
Experimental Investigation of the Interaction of Local and Overall Buckling of Stainless Steel I-Columns
School of Civil Engineering Research Report No R887
107
0
10
20
30
40
50
60
-0.01 0 0.01 0.02 0.03 0.04 0.05 0.06 0.07 0.08
Rotation (rad)
Axi
al L
oad
(kN
)
Top
Bottom
Figure C1.c. I304_500_1 : Axial Load vs. End Rotations
0
10
20
30
40
50
60
-1 -0.5 0 0.5 1 1.5 2 2.5 3
Local Displacement (mm)
Axi
al L
oad
(kN
)
LVDT L1
LVDT L2
Figure C1.d. I304_500_1 : Axial Load vs. Local Displacements

Experimental Investigation of the Interaction of Local and Overall Buckling of Stainless Steel I-Columns
School of Civil Engineering Research Report No R887
108
0
10
20
30
40
50
60
0 0.5 1 1.5 2 2.5
Axial Shortening (mm)
Axi
al L
oad
(kN
)
0
20
40
60
80
100
Ave
rage
Axi
al S
tress
(MP
a)
Figure C2.a. I304_500_2 : Axial Load vs. Axial Shortening
0
10
20
30
40
50
60
0 2 4 6 8 10 12 14
Lateral Displacement (mm)
Axi
al L
oad
(kN
)
LVDT D1
LVDT D2
Figure C2.b. I304_500_2 : Axial Load vs. Lateral Displacement

Experimental Investigation of the Interaction of Local and Overall Buckling of Stainless Steel I-Columns
School of Civil Engineering Research Report No R887
109
0
10
20
30
40
50
60
-0.005 0 0.005 0.01 0.015 0.02 0.025 0.03
Rotation (rad)
Axi
al L
oad
(kN
)
Top
Bottom
Figure C2.c. I304_500_2 : Axial Load vs. End Rotations
0
10
20
30
40
50
60
-3 -2 -1 0 1 2 3
Local Displacement (mm)
Axi
al L
oad
(kN
)
LVDT L1
LVDT L2
Figure C2.d. I304_500_2 : Axial Load vs. Local Displacements
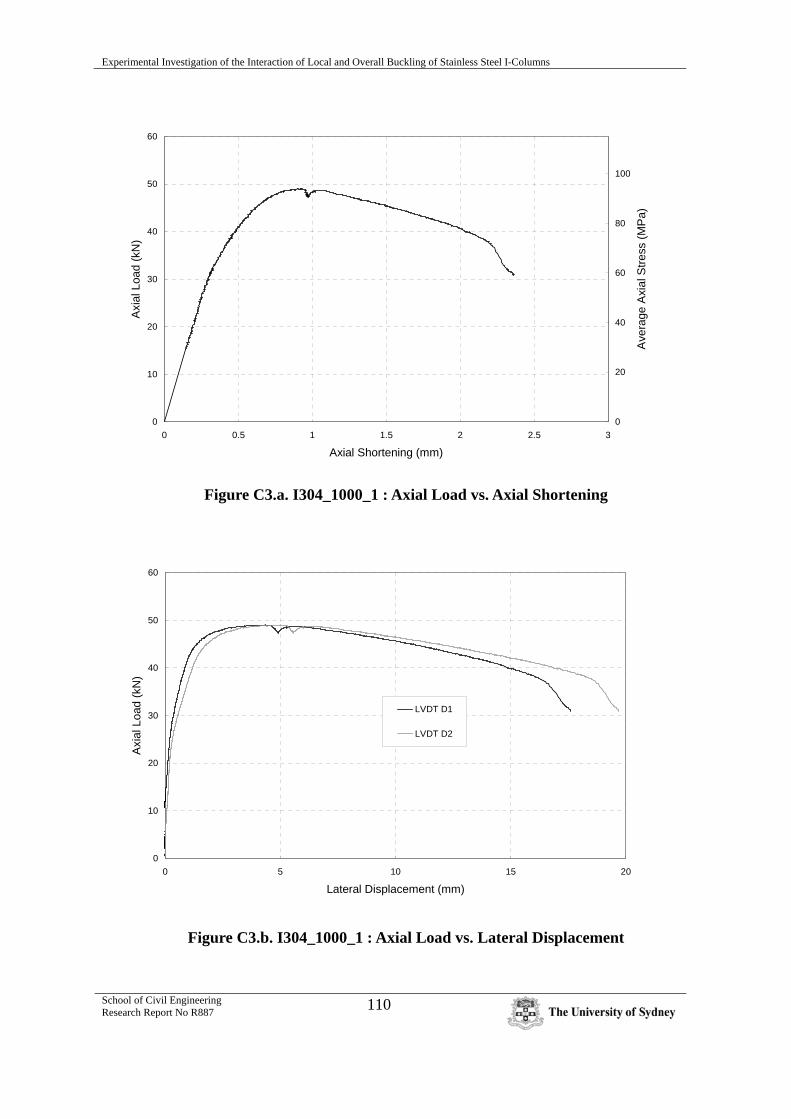
Experimental Investigation of the Interaction of Local and Overall Buckling of Stainless Steel I-Columns
School of Civil Engineering Research Report No R887
110
0
10
20
30
40
50
60
0 0.5 1 1.5 2 2.5 3
Axial Shortening (mm)
Axi
al L
oad
(kN
)
0
20
40
60
80
100
Ave
rage
Axi
al S
tress
(MP
a)
Figure C3.a. I304_1000_1 : Axial Load vs. Axial Shortening
0
10
20
30
40
50
60
0 5 10 15 20
Lateral Displacement (mm)
Axi
al L
oad
(kN
)
LVDT D1
LVDT D2
Figure C3.b. I304_1000_1 : Axial Load vs. Lateral Displacement

Experimental Investigation of the Interaction of Local and Overall Buckling of Stainless Steel I-Columns
School of Civil Engineering Research Report No R887
111
0
10
20
30
40
50
60
-0.01 0 0.01 0.02 0.03 0.04 0.05 0.06 0.07
Rotation (rad)
Axi
al L
oad
(kN
)
Top
Bottom
Figure C3.c. I304_1000_1 : Axial Load vs. End Rotations
0
10
20
30
40
50
60
-1.5 -1 -0.5 0 0.5 1 1.5 2 2.5 3
Local Displacement (mm)
Axi
al L
oad
(kN
)
LVDT L1
LVDT L2
Figure C3.d. I304_1000_1 : Axial Load vs. Local Displacements

Experimental Investigation of the Interaction of Local and Overall Buckling of Stainless Steel I-Columns
School of Civil Engineering Research Report No R887
112
0
10
20
30
40
50
60
0 0.5 1 1.5 2 2.5 3
Axial Shortening (mm)
Axi
al L
oad
(kN
)
0
20
40
60
80
100
Ave
rage
Axi
al S
tress
(MP
a)
Figure C4.a. I304_1000_2 : Axial Load vs. Axial Shortening
0
10
20
30
40
50
60
0 5 10 15 20 25
Lateral Displacement (mm)
Axi
al L
oad
(kN
)
LVDT D1
LVDT D2
Figure C4.b. I304_1000_2 : Axial Load vs. Lateral Displacement

Experimental Investigation of the Interaction of Local and Overall Buckling of Stainless Steel I-Columns
School of Civil Engineering Research Report No R887
113
0
10
20
30
40
50
60
-0.01 0 0.01 0.02 0.03 0.04 0.05
Rotation (rad)
Axi
al L
oad
(kN
)
Top
Bottom
Figure C4.c. I304_1000_2 : Axial Load vs. End Rotations
0
10
20
30
40
50
60
-1 -0.5 0 0.5 1 1.5 2 2.5 3
Local Displacement (mm)
Axi
al L
oad
(kN
)
LVDT L1
LVDT L2
Figure C4.d. I304_1000_2 : Axial Load vs. Local Displacements
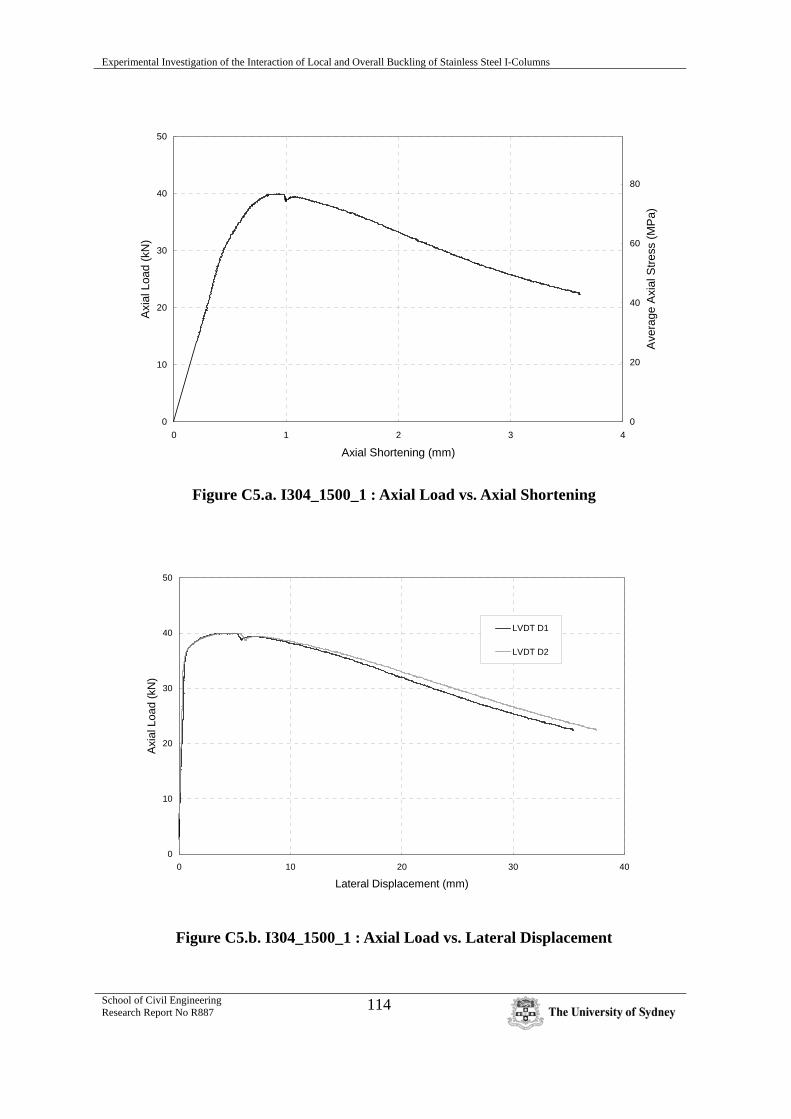
Experimental Investigation of the Interaction of Local and Overall Buckling of Stainless Steel I-Columns
School of Civil Engineering Research Report No R887
114
0
10
20
30
40
50
0 1 2 3 4
Axial Shortening (mm)
Axi
al L
oad
(kN
)
0
20
40
60
80
Ave
rage
Axi
al S
tress
(MP
a)
Figure C5.a. I304_1500_1 : Axial Load vs. Axial Shortening
0
10
20
30
40
50
0 10 20 30 40
Lateral Displacement (mm)
Axia
l Loa
d (k
N)
LVDT D1
LVDT D2
Figure C5.b. I304_1500_1 : Axial Load vs. Lateral Displacement

Experimental Investigation of the Interaction of Local and Overall Buckling of Stainless Steel I-Columns
School of Civil Engineering Research Report No R887
115
0
10
20
30
40
50
-0.01 0 0.01 0.02 0.03 0.04 0.05 0.06 0.07
Rotation (rad)
Axia
l Loa
d (k
N)
Top
Bottom
Figure C5.c. I304_1500_1 : Axial Load vs. End Rotations
0
10
20
30
40
50
-0.5 0 0.5 1 1.5 2 2.5 3
Local Displacement (mm)
Axi
al L
oad
(kN
)
LVDT L1
LVDT L2
Figure C5.d. I304_1500_1 : Axial Load vs. Local Displacements
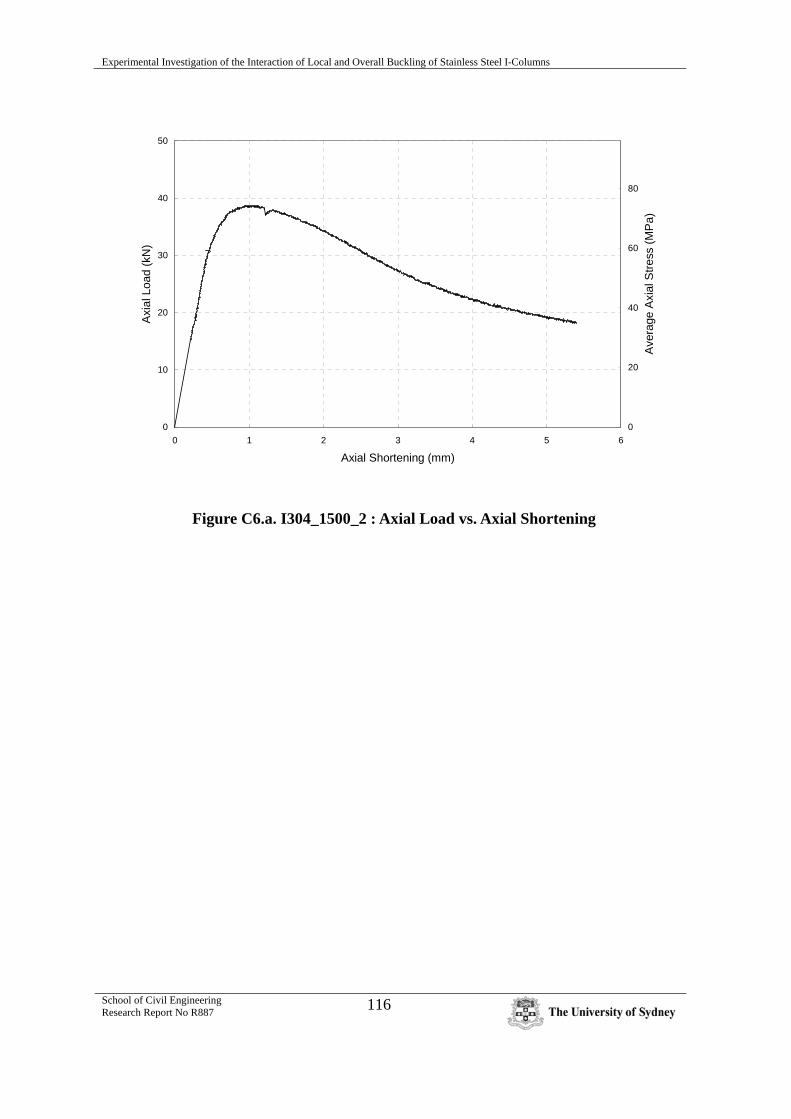
Experimental Investigation of the Interaction of Local and Overall Buckling of Stainless Steel I-Columns
School of Civil Engineering Research Report No R887
116
0
10
20
30
40
50
0 1 2 3 4 5 6
Axial Shortening (mm)
Axi
al L
oad
(kN
)
0
20
40
60
80
Ave
rage
Axi
al S
tress
(MP
a)
Figure C6.a. I304_1500_2 : Axial Load vs. Axial Shortening

Experimental Investigation of the Interaction of Local and Overall Buckling of Stainless Steel I-Columns
School of Civil Engineering Research Report No R887
117
0
10
20
30
40
0 1 2 3 4 5
Axial Shortening (mm)
Axi
al L
oad
(kN
)
0
20
40
60
Ave
rage
Axi
al S
tress
(MP
a)
Figure C7.a. I304_2000_1 : Axial Load vs. Axial Shortening
0
10
20
30
40
0 10 20 30 40 50 60
Lateral Displacement (mm)
Axi
al L
oad
(kN
)
LVDT D1
LVDT D2
Figure C7.b. I304_2000_1 : Axial Load vs. Lateral Displacement
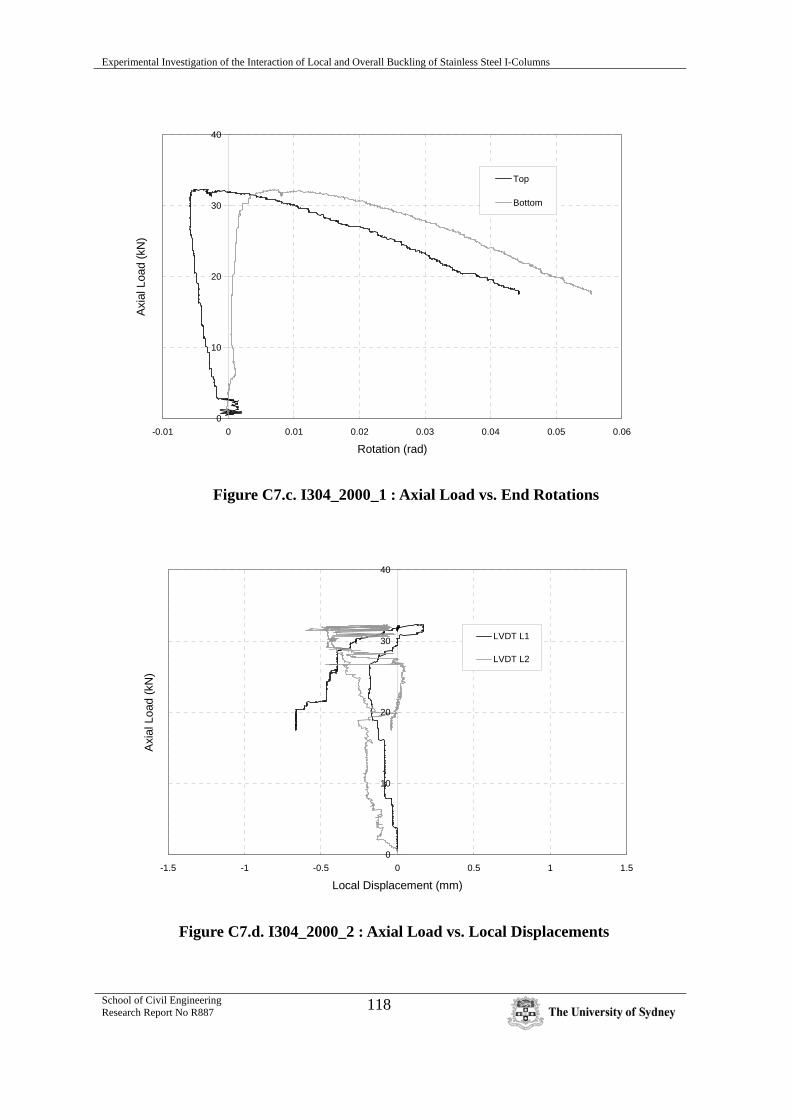
Experimental Investigation of the Interaction of Local and Overall Buckling of Stainless Steel I-Columns
School of Civil Engineering Research Report No R887
118
0
10
20
30
40
-0.01 0 0.01 0.02 0.03 0.04 0.05 0.06
Rotation (rad)
Axia
l Loa
d (k
N)
Top
Bottom
Figure C7.c. I304_2000_1 : Axial Load vs. End Rotations
0
10
20
30
40
-1.5 -1 -0.5 0 0.5 1 1.5
Local Displacement (mm)
Axi
al L
oad
(kN
)
LVDT L1
LVDT L2
Figure C7.d. I304_2000_2 : Axial Load vs. Local Displacements
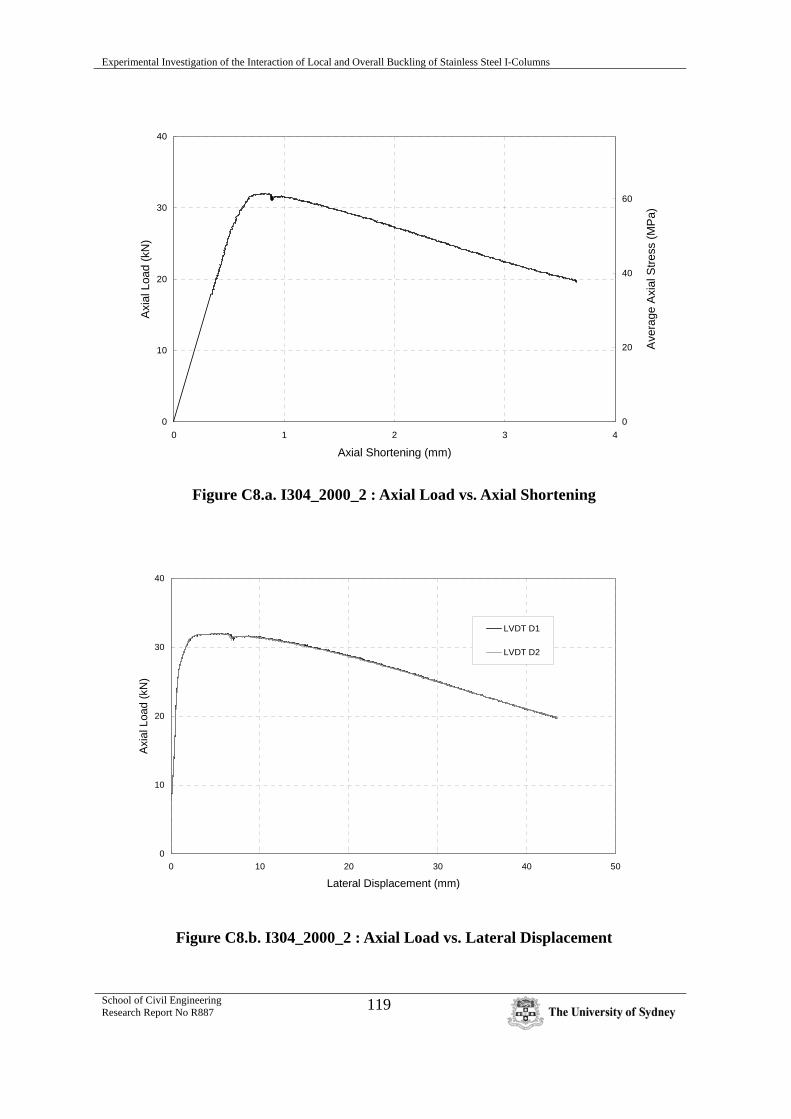
Experimental Investigation of the Interaction of Local and Overall Buckling of Stainless Steel I-Columns
School of Civil Engineering Research Report No R887
119
0
10
20
30
40
0 1 2 3 4
Axial Shortening (mm)
Axi
al L
oad
(kN
)
0
20
40
60
Ave
rage
Axi
al S
tress
(MP
a)
Figure C8.a. I304_2000_2 : Axial Load vs. Axial Shortening
0
10
20
30
40
0 10 20 30 40 50
Lateral Displacement (mm)
Axia
l Loa
d (k
N)
LVDT D1
LVDT D2
Figure C8.b. I304_2000_2 : Axial Load vs. Lateral Displacement

Experimental Investigation of the Interaction of Local and Overall Buckling of Stainless Steel I-Columns
School of Civil Engineering Research Report No R887
120
0
10
20
30
40
-0.01 0 0.01 0.02 0.03 0.04 0.05 0.06
Rotation (rad)
Axia
l Loa
d (k
N)
Top
Bottom
Figure C8.c. I304_2000_2 : Axial Load vs. End Rotations
0
10
20
30
40
-1 -0.5 0 0.5 1 1.5 2
Local Displacement (mm)
Axi
al L
oad
(kN
)
LVDT L1
LVDT L2
Figure C8.d. I304_2000_2 : Axial Load vs. Local Displacements

Experimental Investigation of the Interaction of Local and Overall Buckling of Stainless Steel I-Columns
School of Civil Engineering Research Report No R887
121
0
10
20
30
0 1 2 3 4 5
Axial Shortening (mm)
Axi
al L
oad
(kN
)
0
10
20
30
40
50
Ave
rage
Axi
al S
tress
(MP
a)
Figure C9.a. I304_2500_1 : Axial Load vs. Axial Shortening
0
10
20
30
0 10 20 30 40 50 60
Lateral Displacement (mm)
Axi
al L
oad
(kN
)
LVDT D1
LVDT D2
Figure C9.b. I304_2500_1 : Axial Load vs. Lateral Displacement

Experimental Investigation of the Interaction of Local and Overall Buckling of Stainless Steel I-Columns
School of Civil Engineering Research Report No R887
122
0
10
20
30
0 0.01 0.02 0.03 0.04 0.05 0.06
Rotation (rad)
Axi
al L
oad
(kN
)
Top
Bottom
Figure C9.c. I304_2500_1 : Axial Load vs. End Rotations
0
10
20
30
-3 -2.5 -2 -1.5 -1 -0.5 0 0.5 1
Local Displacement (mm)
Axi
al L
oad
(kN
)
LVDT L1
LVDT L2
Figure C9.d. I304_2500_1 : Axial Load vs. Local Displacements

Experimental Investigation of the Interaction of Local and Overall Buckling of Stainless Steel I-Columns
School of Civil Engineering Research Report No R887
123
0
10
20
30
0 1 2 3 4 5
Axial Shortening (mm)
Axi
al L
oad
(kN
)
0
10
20
30
40
50
Ave
rage
Axi
al S
tress
(MP
a)
Figure C10.a. I304_2500_2 : Axial Load vs. Axial Shortening
0
10
20
30
0 10 20 30 40 50 60 70
Lateral Displacement (mm)
Axia
l Loa
d (k
N)
LVDT D1
LVDT D2
Figure C10.b. I304_2500_2 : Axial Load vs. Lateral Displacement
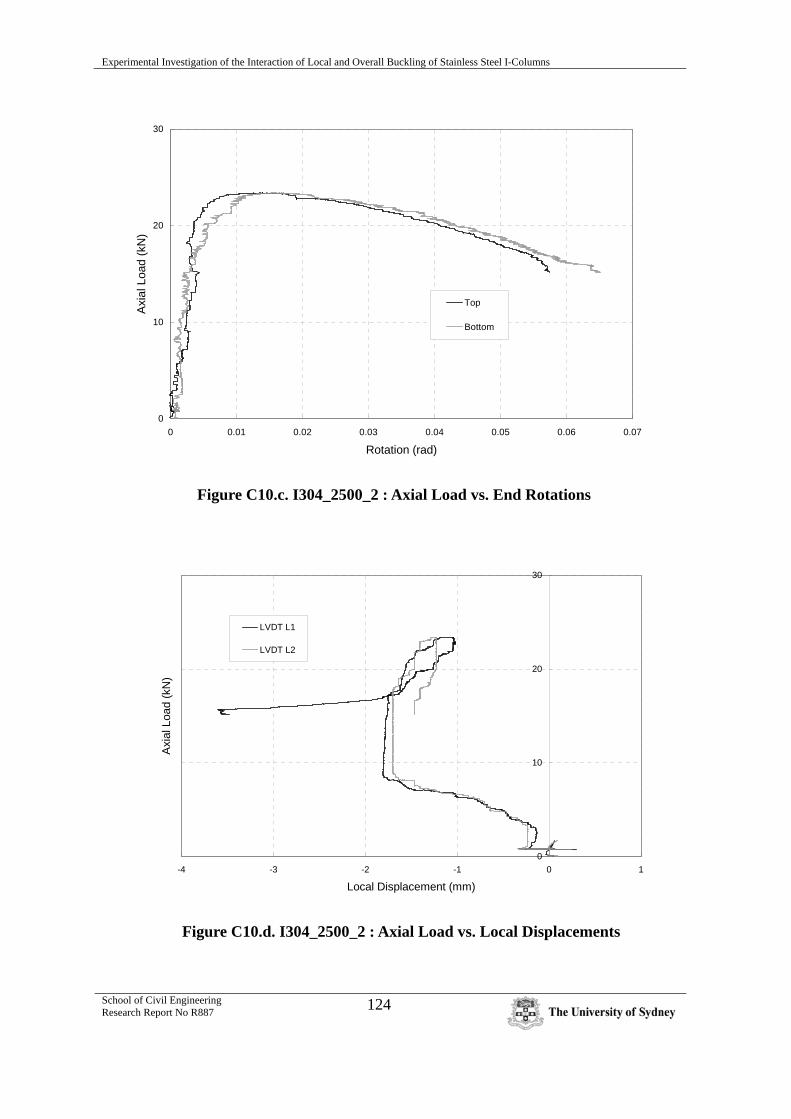
Experimental Investigation of the Interaction of Local and Overall Buckling of Stainless Steel I-Columns
School of Civil Engineering Research Report No R887
124
0
10
20
30
0 0.01 0.02 0.03 0.04 0.05 0.06 0.07
Rotation (rad)
Axi
al L
oad
(kN
)
Top
Bottom
Figure C10.c. I304_2500_2 : Axial Load vs. End Rotations
0
10
20
30
-4 -3 -2 -1 0 1
Local Displacement (mm)
Axi
al L
oad
(kN
)
LVDT L1
LVDT L2
Figure C10.d. I304_2500_2 : Axial Load vs. Local Displacements
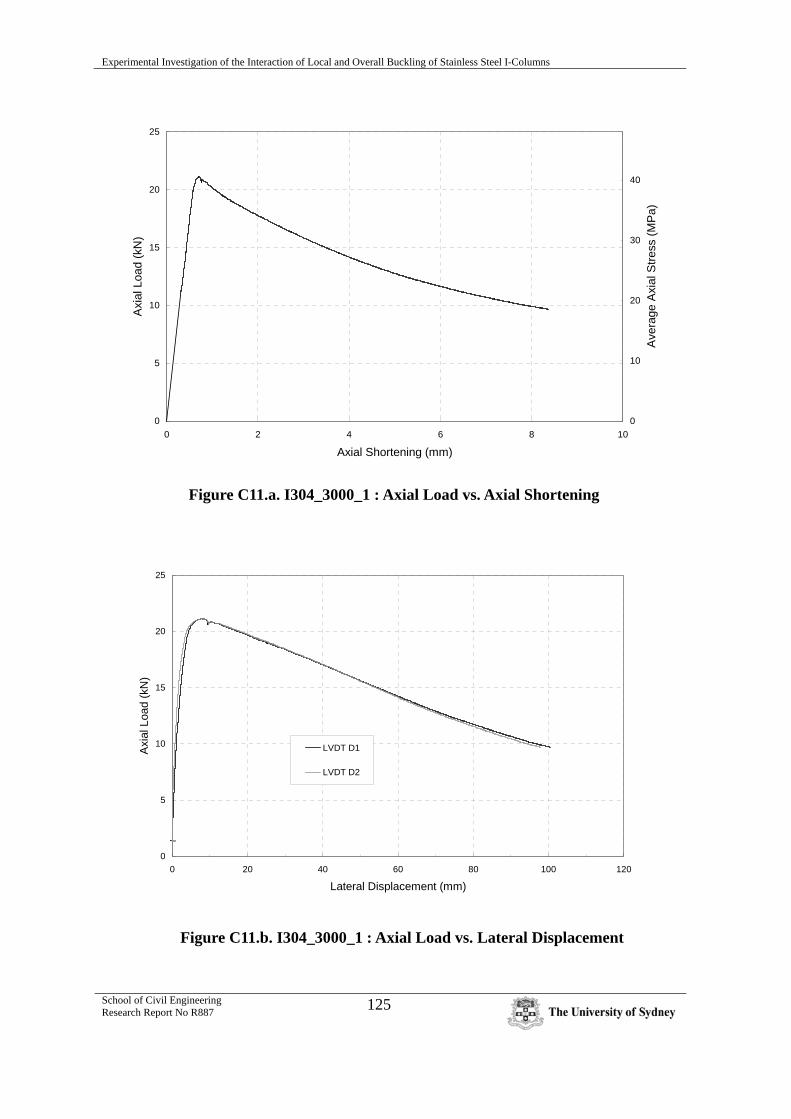
Experimental Investigation of the Interaction of Local and Overall Buckling of Stainless Steel I-Columns
School of Civil Engineering Research Report No R887
125
0
5
10
15
20
25
0 2 4 6 8 10
Axial Shortening (mm)
Axi
al L
oad
(kN
)
0
10
20
30
40
Ave
rage
Axi
al S
tress
(MP
a)
Figure C11.a. I304_3000_1 : Axial Load vs. Axial Shortening
0
5
10
15
20
25
0 20 40 60 80 100 120
Lateral Displacement (mm)
Axi
al L
oad
(kN
)
LVDT D1
LVDT D2
Figure C11.b. I304_3000_1 : Axial Load vs. Lateral Displacement

Experimental Investigation of the Interaction of Local and Overall Buckling of Stainless Steel I-Columns
School of Civil Engineering Research Report No R887
126
0
5
10
15
20
25
-0.02 0 0.02 0.04 0.06 0.08
Rotation (rad)
Axi
al L
oad
(kN
)
Top
Bottom
Figure C11.c. I304_3000_1 : Axial Load vs. End Rotations
0
5
10
15
20
25
-3 -2 -1 0 1 2
Local Displacement (mm)
Axi
al L
oad
(kN
)
LVDT L1
LVDT L2
Figure C11.d. I304_3000_1 : Axial Load vs. Local Displacements

Experimental Investigation of the Interaction of Local and Overall Buckling of Stainless Steel I-Columns
School of Civil Engineering Research Report No R887
127
0
5
10
15
20
25
0 1 2 3 4
Axial Shortening (mm)
Axi
al L
oad
(kN
)
0
10
20
30
40
Ave
rage
Axi
al S
tress
(MP
a)
Figure C12.a. I304_3000_2 : Axial Load vs. Axial Shortening
0
5
10
15
20
25
0 20 40 60 80
Lateral Displacement (mm)
Axi
al L
oad
(kN
)
LVDT D1
LVDT D2
Figure C12.b. I304_3000_2 : Axial Load vs. Lateral Displacement

Experimental Investigation of the Interaction of Local and Overall Buckling of Stainless Steel I-Columns
School of Civil Engineering Research Report No R887
128
0
5
10
15
20
25
-0.01 0 0.01 0.02 0.03 0.04 0.05 0.06
Rotation (rad)
Axi
al L
oad
(kN
)
Top
Bottom
Figure C12.c. I304_3000_2 : Axial Load vs. End Rotations
0
5
10
15
20
25
-3 -2 -1 0 1 2
Local Displacement (mm)
Axi
al L
oad
(kN
)
LVDT L1
LVDT L2
Figure C12.d. I304_3000_2 : Axial Load vs. Local Displacements

Experimental Investigation of the Interaction of Local and Overall Buckling of Stainless Steel I-Columns
School of Civil Engineering Research Report No R887
129
0
10
20
30
40
50
60
70
80
0 0.5 1 1.5 2 2.5
Axial Shortening (mm)
Axi
al L
oad
(kN
)
0
20
40
60
80
100
120
140
Ave
rage
Axi
al S
tress
(MP
a)
Figure C13.a. I404_500_1 : Axial Load vs. Axial Shortening
0
10
20
30
40
50
60
70
80
0 2 4 6 8 10 12
Lateral Displacement (mm)
Axi
al L
oad
(kN
)
LVDT D1
LVDT D2
Figure C13.b. I404_500_1 : Axial Load vs. Lateral Displacement

Experimental Investigation of the Interaction of Local and Overall Buckling of Stainless Steel I-Columns
School of Civil Engineering Research Report No R887
130
0
10
20
30
40
50
60
70
80
-0.005 0 0.005 0.01 0.015 0.02 0.025 0.03
Rotation (rad)
Axi
al L
oad
(kN
)
Top
Bottom
Figure C13.c. I404_500_1 : Axial Load vs. End Rotations
0
10
20
30
40
50
60
70
80
-3 -2 -1 0 1 2 3
Local Displacement (mm)
Axia
l Loa
d (k
N)
LVDT L1
LVDT L2
Figure C13.d. I404_500_1 : Axial Load vs. Local Displacements

Experimental Investigation of the Interaction of Local and Overall Buckling of Stainless Steel I-Columns
School of Civil Engineering Research Report No R887
131
0
10
20
30
40
50
60
70
80
0 0.5 1 1.5 2
Axial Shortening (mm)
Axi
al L
oad
(kN
)
0
20
40
60
80
100
120
140
Ave
rage
Axi
al S
tress
(MP
a)
Figure C14.a. I404_500_2 : Axial Load vs. Axial Shortening
0
10
20
30
40
50
60
70
80
-2 -1 0 1 2 3 4 5
Lateral Displacement (mm)
Axi
al L
oad
(kN
)
LVDT D1
LVDT D2
Figure C14.b. I404_500_2 : Axial Load vs. Lateral Displacement

Experimental Investigation of the Interaction of Local and Overall Buckling of Stainless Steel I-Columns
School of Civil Engineering Research Report No R887
132
0
10
20
30
40
50
60
70
80
-0.005 0 0.005 0.01 0.015 0.02 0.025 0.03
Rotation (rad)
Axi
al L
oad
(kN
)
Top
Bottom
Figure C14.c. I404_500_2 : Axial Load vs. End Rotations
0
10
20
30
40
50
60
70
80
-3 -2 -1 0 1 2 3
Local Displacement (mm)
Axi
al L
oad
(kN
)
LVDT L1
LVDT L2
Figure C14.d. I404_500_2 : Axial Load vs. Local Displacements

Experimental Investigation of the Interaction of Local and Overall Buckling of Stainless Steel I-Columns
School of Civil Engineering Research Report No R887
133
0
10
20
30
40
50
60
70
0 1 2 3 4
Axial Shortening (mm)
Axi
al L
oad
(kN
)
0
20
40
60
80
100
120
Ave
rage
Axi
al S
tress
(MP
a)
Figure C15.a. I404_1000_1 : Axial Load vs. Axial Shortening
0
10
20
30
40
50
60
70
0 5 10 15 20 25 30
Lateral Displacement (mm)
Axi
al L
oad
(kN
)
LVDT D1
LVDT D2
Figure C15.b. I404_1000_1 : Axial Load vs. Lateral Displacement
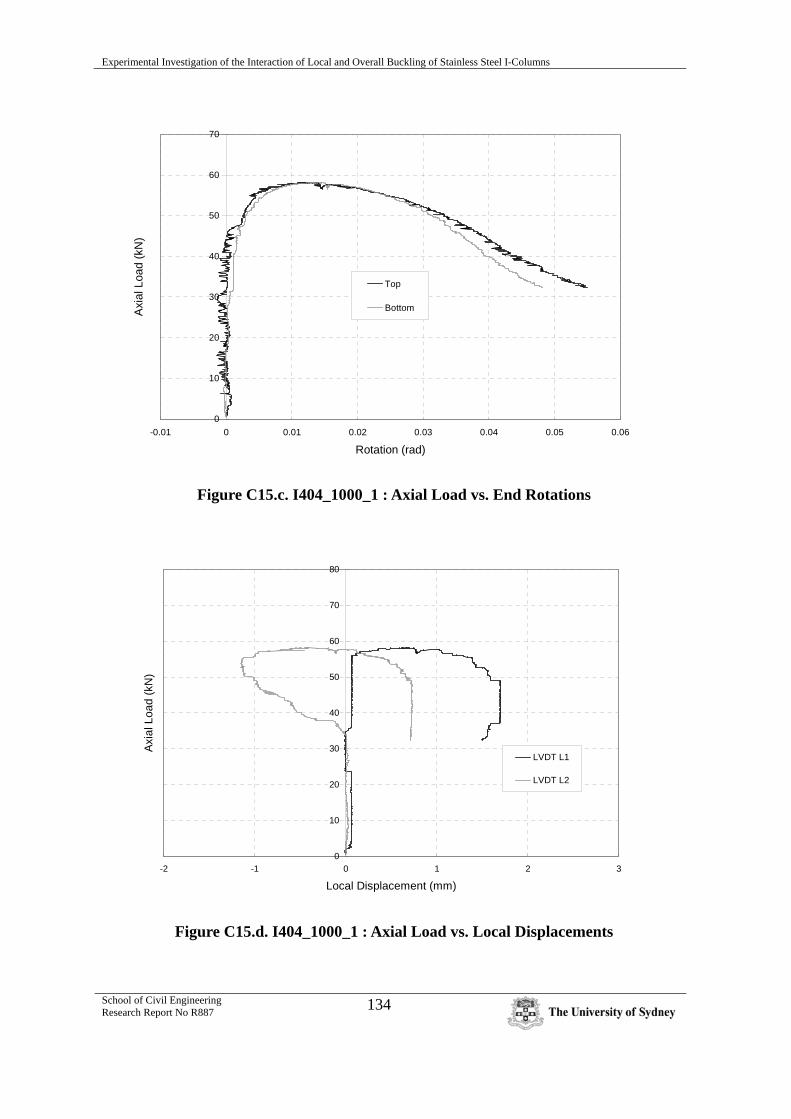
Experimental Investigation of the Interaction of Local and Overall Buckling of Stainless Steel I-Columns
School of Civil Engineering Research Report No R887
134
0
10
20
30
40
50
60
70
-0.01 0 0.01 0.02 0.03 0.04 0.05 0.06
Rotation (rad)
Axi
al L
oad
(kN
)
Top
Bottom
Figure C15.c. I404_1000_1 : Axial Load vs. End Rotations
0
10
20
30
40
50
60
70
80
-2 -1 0 1 2 3
Local Displacement (mm)
Axia
l Loa
d (k
N)
LVDT L1
LVDT L2
Figure C15.d. I404_1000_1 : Axial Load vs. Local Displacements

Experimental Investigation of the Interaction of Local and Overall Buckling of Stainless Steel I-Columns
School of Civil Engineering Research Report No R887
135
0
10
20
30
40
50
60
70
0 0.5 1 1.5 2 2.5 3
Axial Shortening (mm)
Axi
al L
oad
(kN
)
0
20
40
60
80
100
120
Ave
rage
Axi
al S
tress
(MP
a)
Figure C16.a. I404_1000_2 : Axial Load vs. Axial Shortening
0
10
20
30
40
50
60
70
0 5 10 15 20 25
Lateral Displacement (mm)
Axi
al L
oad
(kN
)
LVDT D1
LVDT D2
Figure C16.b. I404_1000_2 : Axial Load vs. Lateral Displacement

Experimental Investigation of the Interaction of Local and Overall Buckling of Stainless Steel I-Columns
School of Civil Engineering Research Report No R887
136
0
10
20
30
40
50
60
70
-0.01 0 0.01 0.02 0.03 0.04 0.05 0.06 0.07 0.08 0.09
Rotation (rad)
Axia
l Loa
d (k
N)
Top
Bottom
Figure C16.c. I404_1000_2 : Axial Load vs. End Rotations
0
10
20
30
40
50
60
70
-2 -1 0 1 2 3
Local Displacement (mm)
Axi
al L
oad
(kN
)
LVDT L1
LVDT L2
Figure C16.d. I404_1000_2 : Axial Load vs. Local Displacements

Experimental Investigation of the Interaction of Local and Overall Buckling of Stainless Steel I-Columns
School of Civil Engineering Research Report No R887
137
0
10
20
30
40
50
0 1 2 3 4
Axial Shortening (mm)
Axi
al L
oad
(kN
)
0
20
40
60
80
Ave
rage
Axi
al S
tress
(MP
a)
Figure C17.a. I404_1500_1 : Axial Load vs. Axial Shortening
0
10
20
30
40
50
0 5 10 15 20 25 30 35 40
Lateral Displacement (mm)
Axi
al L
oad
(kN
)
LVDT D1
LVDT D2
Figure C17.b. I404_1500_1 : Axial Load vs. Lateral Displacement

Experimental Investigation of the Interaction of Local and Overall Buckling of Stainless Steel I-Columns
School of Civil Engineering Research Report No R887
138
0
10
20
30
40
50
-0.01 0 0.01 0.02 0.03 0.04 0.05 0.06 0.07
Rotation (rad)
Axi
al L
oad
(kN
)
Top
Bottom
Figure C17.c. I404_1500_1 : Axial Load vs. End Rotations
0
10
20
30
40
50
-0.5 0 0.5 1 1.5
Local Displacement (mm)
Axi
al L
oad
(kN
)
LVDT L1
LVDT L2
Figure C17.d. I404_1500_1 : Axial Load vs. Local Displacements

Experimental Investigation of the Interaction of Local and Overall Buckling of Stainless Steel I-Columns
School of Civil Engineering Research Report No R887
139
0
10
20
30
40
50
0 1 2 3 4 5
Axial Shortening (mm)
Axi
al L
oad
(kN
)
0
20
40
60
80
Ave
rage
Axi
al S
tress
(MP
a)
Figure C18.a. I404_1500_2 : Axial Load vs. Axial Shortening
0
10
20
30
40
50
0 10 20 30 40 50
Lateral Displacement (mm)
Axi
al L
oad
(kN
)
LVDT D1
LVDT D2
Figure C18.b. I404_1500_2 : Axial Load vs. Lateral Displacement

Experimental Investigation of the Interaction of Local and Overall Buckling of Stainless Steel I-Columns
School of Civil Engineering Research Report No R887
140
0
10
20
30
40
50
-0.01 0 0.01 0.02 0.03 0.04 0.05 0.06 0.07
Rotation (rad)
Axi
al L
oad
(kN
)
Top
Bottom
Figure C18.c. I404_1500_2 : Axial Load vs. End Rotations
0
10
20
30
40
50
-1 -0.5 0 0.5 1 1.5 2
Local Displacement (mm)
Axi
al L
oad
(kN
)
LVDT L1
LVDT L2
Figure C18.d. I404_1500_2 : Axial Load vs. Local Displacements

Experimental Investigation of the Interaction of Local and Overall Buckling of Stainless Steel I-Columns
School of Civil Engineering Research Report No R887
141
0
10
20
30
40
50
0 1 2 3 4 5
Axial Shortening (mm)
Axi
al L
oad
(kN
)
0
20
40
60
80
Ave
rage
Axi
al S
tress
(MP
a)
Figure C19.a. I404_2000_1 : Axial Load vs. Axial Shortening
0
10
20
30
40
50
0 10 20 30 40 50 60
Lateral Displacement (mm)
Axi
al L
oad
(kN
)
LVDT D1
LVDT D2
Figure C19.b. I404_2000_1 : Axial Load vs. Lateral Displacement
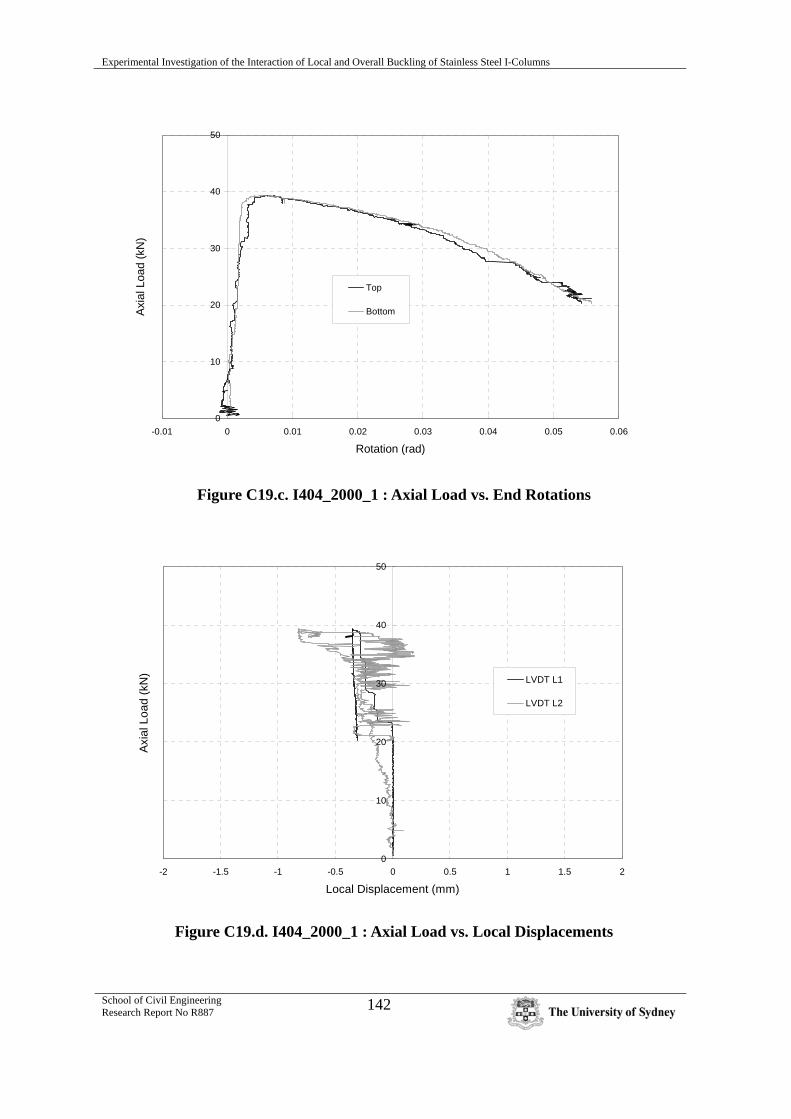
Experimental Investigation of the Interaction of Local and Overall Buckling of Stainless Steel I-Columns
School of Civil Engineering Research Report No R887
142
0
10
20
30
40
50
-0.01 0 0.01 0.02 0.03 0.04 0.05 0.06
Rotation (rad)
Axi
al L
oad
(kN
)
Top
Bottom
Figure C19.c. I404_2000_1 : Axial Load vs. End Rotations
0
10
20
30
40
50
-2 -1.5 -1 -0.5 0 0.5 1 1.5 2
Local Displacement (mm)
Axia
l Loa
d (k
N) LVDT L1
LVDT L2
Figure C19.d. I404_2000_1 : Axial Load vs. Local Displacements

Experimental Investigation of the Interaction of Local and Overall Buckling of Stainless Steel I-Columns
School of Civil Engineering Research Report No R887
143
0
10
20
30
40
50
0 1 2 3 4 5
Axial Shortening (mm)
Axia
l Loa
d (k
N)
0
20
40
60
80
Ave
rage
Axi
al S
tress
(MP
a)
Figure C20.a. I404_2000_2 : Axial Load vs. Axial Shortening
0
10
20
30
40
50
0 5 10 15 20 25 30
Lateral Displacement (mm)
Axi
al L
oad
(kN
)
LVDT D1
LVDT D2
Figure C20.b. I404_2000_2 : Axial Load vs. Lateral Displacement

Experimental Investigation of the Interaction of Local and Overall Buckling of Stainless Steel I-Columns
School of Civil Engineering Research Report No R887
144
0
10
20
30
40
50
-0.02 -0.01 0 0.01 0.02 0.03 0.04 0.05 0.06
Rotation (rad)
Axi
al L
oad
(kN
)
Top
Bottom
Figure C20.c. I404_2000_2 : Axial Load vs. End Rotations
0
10
20
30
40
50
-1 -0.5 0 0.5 1
Local Displacement (mm)
Axia
l Loa
d (k
N)
LVDT L1
LVDT L2
Figure C20.d. I404_2000_2 : Axial Load vs. Local Displacements

Experimental Investigation of the Interaction of Local and Overall Buckling of Stainless Steel I-Columns
School of Civil Engineering Research Report No R887
145
0
10
20
30
0 1 2 3 4 5 6
Axial Shortening (mm)
Axi
al L
oad
(kN
)
0
10
20
30
40
50
60
Ave
rage
Axi
al S
tress
(MP
a)
Figure C21.a. I404_2500_1 : Axial Load vs. Axial Shortening
0
10
20
30
0 10 20 30 40 50 60 70
Lateral Displacement (mm)
Axi
al L
oad
(kN
)
LVDT D1
LVDT D2
Figure C21.b. I404_2500_1 : Axial Load vs. Lateral Displacement

Experimental Investigation of the Interaction of Local and Overall Buckling of Stainless Steel I-Columns
School of Civil Engineering Research Report No R887
146
0
10
20
30
-0.01 0 0.01 0.02 0.03 0.04 0.05 0.06 0.07
Rotation (rad)
Axi
al L
oad
(kN
)
Top
Bottom
Figure C21.c. I404_2500_1 : Axial Load vs. End Rotations
0
10
20
30
-4 -3 -2 -1 0 1
Local Displacement (mm)
Axi
al L
oad
(kN
)
LVDT L1
LVDT L2
Figure C21.d. I404_2500_1 : Axial Load vs. Local Displacements

Experimental Investigation of the Interaction of Local and Overall Buckling of Stainless Steel I-Columns
School of Civil Engineering Research Report No R887
147
0
10
20
30
0 1 2 3 4 5
Axial Shortening (mm)
Axi
al L
oad
(kN
)
0
10
20
30
40
50
60
Ave
rage
Axi
al S
tress
(MP
a)
Figure C22.a. I404_2500_2 : Axial Load vs. Axial Shortening
0
10
20
30
0 10 20 30 40 50 60 70
Lateral Displacement (mm)
Axi
al L
oad
(kN
)
LVDT D1
LVDT D2
Figure C22.b. I404_2500_2 : Axial Load vs. Lateral Displacement

Experimental Investigation of the Interaction of Local and Overall Buckling of Stainless Steel I-Columns
School of Civil Engineering Research Report No R887
148
0
10
20
30
-0.01 0 0.01 0.02 0.03 0.04 0.05 0.06 0.07
Rotation (rad)
Axi
al L
oad
(kN
)
Top
Bottom
Figure C22.c. I404_2500_2 : Axial Load vs. End Rotations
0
10
20
30
-4 -3 -2 -1 0 1
Local Displacement (mm)
Axi
al L
oad
(kN
)
LVDT L1
LVDT L2
Figure C22.d. I404_2500_2 : Axial Load vs. Local Displacements

Experimental Investigation of the Interaction of Local and Overall Buckling of Stainless Steel I-Columns
School of Civil Engineering Research Report No R887
149
0
5
10
15
20
25
0 1 2 3 4 5 6 7 8
Axial Shortening (mm)
Axia
l Loa
d (k
N)
0
10
20
30
40
Ave
rage
Axi
al S
tress
(MP
a)
Figure C23.a. I404_3000_1 : Axial Load vs. Axial Shortening
0
5
10
15
20
25
0 20 40 60 80 100
Lateral Displacement (mm)
Axi
al L
oad
(kN
)
LVDT D1
LVDT D2
Figure C23.b. I404_3000_1 : Axial Load vs. Lateral Displacement
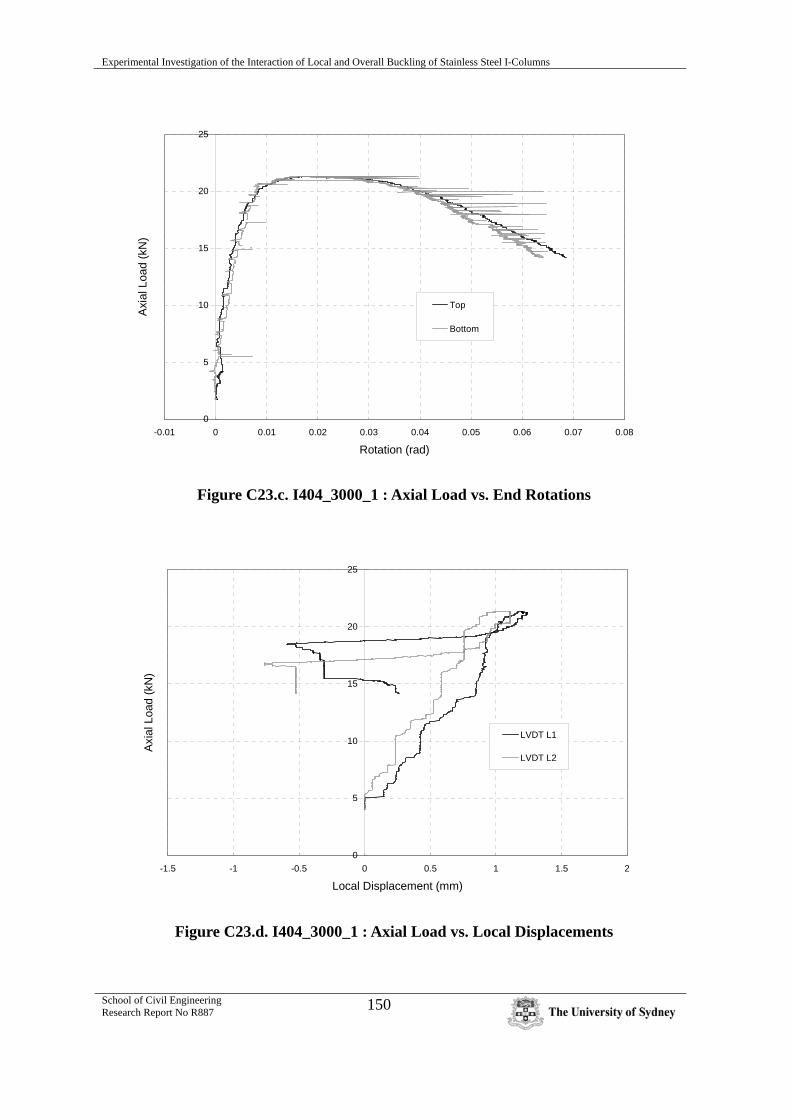
Experimental Investigation of the Interaction of Local and Overall Buckling of Stainless Steel I-Columns
School of Civil Engineering Research Report No R887
150
0
5
10
15
20
25
-0.01 0 0.01 0.02 0.03 0.04 0.05 0.06 0.07 0.08
Rotation (rad)
Axi
al L
oad
(kN
)
Top
Bottom
Figure C23.c. I404_3000_1 : Axial Load vs. End Rotations
0
5
10
15
20
25
-1.5 -1 -0.5 0 0.5 1 1.5 2
Local Displacement (mm)
Axi
al L
oad
(kN
)
LVDT L1
LVDT L2
Figure C23.d. I404_3000_1 : Axial Load vs. Local Displacements

Experimental Investigation of the Interaction of Local and Overall Buckling of Stainless Steel I-Columns
School of Civil Engineering Research Report No R887
151
0
10
20
30
0 1 2 3 4 5 6
Axial Shortening (mm)
Axia
l Loa
d (k
N)
0
10
20
30
40
50
Ave
rage
Axi
al S
tress
(MP
a)
Figure C24.a. I404_3000_2 : Axial Load vs. Axial Shortening
0
10
20
30
0 10 20 30 40 50 60 70 80
Lateral Displacement (mm)
Axi
al L
oad
(kN
)
LVDT D1
LVDT D2
Figure C24.b. I404_3000_2 : Axial Load vs. Lateral Displacement
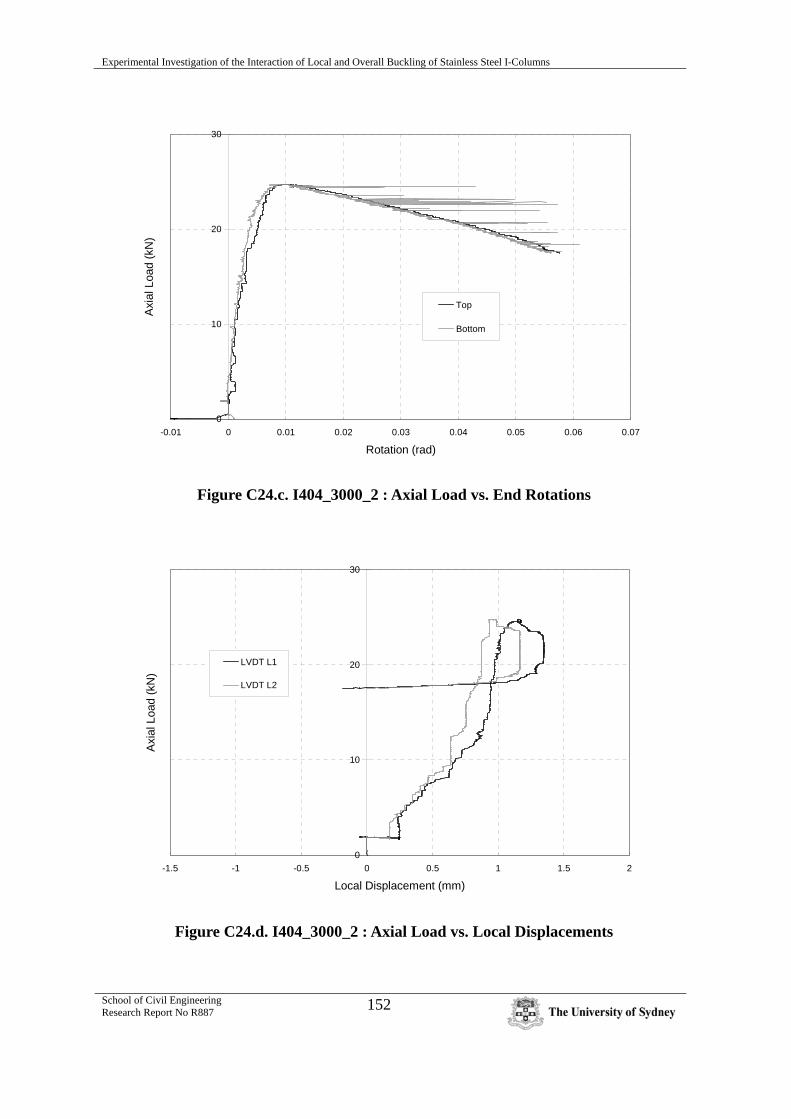
Experimental Investigation of the Interaction of Local and Overall Buckling of Stainless Steel I-Columns
School of Civil Engineering Research Report No R887
152
0
10
20
30
-0.01 0 0.01 0.02 0.03 0.04 0.05 0.06 0.07
Rotation (rad)
Axi
al L
oad
(kN
)
Top
Bottom
Figure C24.c. I404_3000_2 : Axial Load vs. End Rotations
0
10
20
30
-1.5 -1 -0.5 0 0.5 1 1.5 2
Local Displacement (mm)
Axi
al L
oad
(kN
)
LVDT L1
LVDT L2
Figure C24.d. I404_3000_2 : Axial Load vs. Local Displacements

Experimental Investigation of the Interaction of Local and Overall Buckling of Stainless Steel I-Columns
School of Civil Engineering Research Report No R887
153