experimental study of an underlay cognitive radio system ... · pdf fileexperimental study of...
TRANSCRIPT

Experimental Study of an Underlay CognitiveRadio System:
Model Validation and Demonstration
Hanna Becker1, Ankit Kaushik1, Shree Krishna Sharma2, SymeonChatzinotas2, and Friedrich Jondral1
1 Communications Engineering Lab, Karlsruhe Institute of Technology (KIT),Germany,
[email protected],ankit.kaushik,[email protected] SnT - securityandtrust.lu, University of Luxembourg, Luxembourg,
shree.sharma,[email protected]
Abstract. Cognitive radio is one of the potential contenders that ad-dress the problem of spectrum scarcity by making efficient use of thecurrently allocated spectrum below 6 GHz. A secondary access to thelicensed spectrum is only possible, if the cognitive radio systems restrictthe interference to the primary systems. However, the performance analy-sis of such a cognitive radio system is a challenging task. Currently, per-formance evaluation of underlay systems is limited to theoretical analysis.Most of the existing theoretical investigations make certain assumptionsin order to sustain analytical tractability, which could be unrealistic fromthe deployment perspective. Motivated by this fact, in this work, we val-idate the performance of an underlay system by means of laboratorymeasurements, and consequently propose a hardware demonstrator ofsuch a system. Moreover, we present a graphical user interface to pro-vide insights to the working of the proposed demonstrator and highlightthe main issues faced during this experimental study.
1 Introduction
The amount of data transmitted over wireless channels is constantly increasing.However, the available spectrum is scarce and expensive, with more and moreoperators competing for their share of it. Therefore, ways have to be foundto use the available spectrum more efficiently. Cognitive radio networks do soby enabling dynamic spectrum access to multiple systems. Secondary access tothe licensed spectrum has been extensively investigated in the literature and ismainly categorized in terms of three cognitive radio paradigms [1]:
This work was partially supported by the National Research Fund, Luxembourgunder the CORE projects ”SeMIGod” and ”SATSENT”.

2 Hanna Becker et al.
1. An interweave system exploits time gaps in the spectrum of primary usersfor data transmission.
2. An overlay system involves higher network layers to employ advanced codingalgorithms to transmit data simultaneously with other systems.
3. In an underlay system, spectrum access is enabled only if the interferencepower received at primary users is below a certain amount. This can beachieved, for instance, by employing a power control mechanism at the sec-ondary transmitter.
The existing investigations in [2], [3], and [4] depicted the performance limitsin terms of throughput achieved at the secondary receiver for the underlay sys-tem. However, the performance evaluation has been limited to theoretical analy-sis, which tends to make certain assumptions (for instance, perfect knowledgeof channel), that are not applicable in hardware implementations [5]. Recently,hardware implementations in context to cognitive radio systems have started toreceive significant attention ([6], [7], [8]), however these deployments are mainlyconcerned with the interweave system. In this regard, we provide insights forthe deployment of underlay systems, in this paper. More specifically, we extendthe mathematical framework derived in [9] to validate the performance of un-derlay systems by means of experimental analysis. To complement the analysispresented in [9], the main contributions of this paper are as follows:
1. Empirical validation: We set up a suitable hardware environment, performmeasurements and evaluate their results by comparing them with the theo-retical expressions.
2. Upon validating the mathematical model, we propose to deploy a hardwaredemonstrator of the underlay system. We present a graphical user interfaceto provide further insights to the working of the demonstrator.
This paper is organized as follows: Section 2 introduces the system model.Section 3 describes the experimental setup and the validation of the mathe-matical model. Section 4 portrays the implementation of the underlay system’shardware demonstrator. Finally, Section 5 concludes the paper.
2 System Model
The analysis done is this paper is based on the signal model illustrated in [9].
2.1 Underlay Scenario
Cognitive Relay (CR) is a cognitive radio small cell deployment that facilitatessecondary access to indoor devices (IDs) [10]. Fig. 1 shows such a scenario, wherethe CR acts as a secondary transmitter (ST), transmitting data to a secondaryreceiver (SR) represented by an ID. The channels between the primary receiver(PR) and ST and between the ST and SR are modeled in terms of path lossfactors (αp, αs) and small-scale fading gains (gp, gs). A power control mechanism

Underlay System: Validation & Demonstration 3
is employed at the ST to ensure that interference received at the PR is belowa certain level. For this mechanism, it is necessary to acquire the knowledge ofthe channel between the ST and the PR. As proposed in [9], the ST can retrievethis information by listening to a pilot or beacon signal transmitted by the PR.
PR
SR/ID
SU
ST/CR
Backhaul
AccessEstimationInterferenceBackhaul
a , gp p a , gs s
Fig. 1. Underlay scenario and frame structure [9]
We consider slotted medium access for the secondary system with a frameduration of T . For the ST to be able to satisfy the interference constraints atthe PR, we consider channel reciprocity of the primary link. T is designed suchthat the channel can be assumed to remain constant within it. Based on thispremise, gp and gs are constant within one frame and included in αp and αs forfurther analysis.
In order to implement a power control mechanism, we have divided the frameinterval in two phases, refer to Fig. 1. During the first phase of duration τest (esti-mation time), the ST measures the received power of the pilot signal transmittedby the PR. Based on this received power, the ST estimates αp by relating it tothe known PR transmit power (Ptran) and adapts its own transmit power forthe secondary link (Pcont) accordingly. During the second phase duration i.e.,T − τest, the ST transmits data to the ID with the controlled power Pcont.
The sequence of events portrayed by the underlay scenario from Fig. 1 canbe summarized as:
1. The PR sends a pilot signal with power Ptran to the ST.2. The ST measures the power received (Prcvd) from this signal.3. From Prcvd, the ST estimates αp. We assume that the ST has the knowledge
of Ptran.4. From αp, the ST calculates Pcont. It is scaled such that, in case of perfect
channel reciprocity and the absence of noise on the primary link, the in-terference power arriving at the PR (Pp) has the value of the interferencetemperature (θI). In control theory terms, θI is the setpoint for Pp.
5. The ST transmits data to the SR with Pcont. In the context of this work, wesend an unmodulated sinusoidal signal. This is mathematically equivalentto the constant power signal sent by the PR (refer to [9] and the referencestherein).

4 Hanna Becker et al.
6. The SR receives the data signal with power Ps. It provides this value backover a feedback channel to the ST, where it is used to estimate the expectedthroughput of the secondary link (Rs).
7. Due to the presence of noise at the ST, the ST encounters variations inPrcvd, which further affects Pcont and, in addition with noise at the PR,finally translates to variations in Pp around θI. This may severely degradethe performance of the cognitive radio system. In order to control thesevariations, an interference constraint in terms of probability of confidence(Pc) has been proposed in [9].
2.2 Stochastic Model
According to [9], Prcvd can be modeled as a non-central chi-squared distributionwith the following probability density function (pdf) [11]:
fPrcvd(x) =
N
2σ2p
(Nx
λ
)N−24
exp
(−Nx+ λ
2σ2p
)IN
2 −1
(√Nxλ
σ2p
), (1)
where N is the degree of freedom, i.e. the number of samples used for determiningPrcvd, σ2
p is the noise variance of the in-phase or quadrature-phase component ofthe received pilot signal (yrcvd, refer to [9]), and IN
2 −1(·) is the modified Bessel
function of the first kind of order N2 − 1 [12]. Furthermore,
λ =
N∑n=1
|E [yrcvd[n]] |2 = N ×A2 (2)
is the non-centrality parameter, where yrcvd[n] represents the discrete sample atthe ST [9]. As our pilot signal is a sinusoid with a constant amplitude which isdown-converted by an IQ demodulator at the ST, the complex samples have aconstant envelope of value A, which explains the simplification in (2).
The system variables Pcont, Pp, and Rs are derived from Prcvd in [9], wherethe respective pdfs fPcont
(·) and fPp(·) are also provided. In [9], fRs
(·) representeda pdf of the capacity. Here, we modify this expression to determine the pdf ofthe secondary throughput
fRs (x) =T
T − τestNKθIαs ln 2
2σ2pσ
2s
(p (x) + 1
[p (x)]2
)e− N
2σ2p
(KθIαs
p(x)σ2s+αpPtran
)(3)
×(
KθIαs
p (x)αpPtranσ2s
)N4 − 1
2
IN2 −1
(N
σ2p
√KθIαpPtranαs
p (x)σ2s
),
with p (x) = 2Tx
T−τest − 1 .
The definition of Pc can be retrieved from [9]. It is based on the cumulativedistribution function (cdf) of Pp
1
1 In [9], we discovered a small typing error in the cdf of Pp, in this paper, we presentthe exact version of it.

Underlay System: Validation & Demonstration 5
FPp(x) = QN
2
(√NPtranαp
σ2p
,
√NαpθIK
σ2px
), (4)
with parameters defined in [9]. QN2
(·) is the Marcum Q-function [12].
It is challenging to determine the parameter σ2p utilized in most of the theo-
retical expressions, accurately. We decided to approximate σ2p by setting it equal
to the variance of the envelope of yrcvd, as this provided the best fit of the modelfunction to the measurement values.
3 Validation
3.1 Experimental Setup
Fig. 2 illustrates the experimental setup used for validation. The primary link isimplemented via a cable and attenuators. By doing so, we were able to acquire alarge number of system variable realizations measured under similar conditions,which we needed for validating the stochastic model.
The CR/ST is implemented in a Universal Software Radio Peripherals(USRP) B210 from Ettus Research [13]. There, upon arrival, the pilot sig-nal is down-converted to an intermediate frequency, band-pass filtered, down-converted to baseband and decimated. The first two steps were carried out toavoid I/Q imbalance and remove the receiver’s DC offset and the flicker noise(1/f) around the DC. Due to the small bandwidth of the pilot signal, these ef-fects were the bottleneck of our validation and had to be accounted for. Thedecimation is performed to reduce the effect of correlation between the samplesdue to oversampling, since the model function fPrcvd
(·) required independentand identically distributed energy samples [9]. Finally, the measurement data isanalyzed offline using Matlab.
Fig. 2. Measurement setup for the validation of the stochastic model, laptop imagefrom [14]
3.2 Validation of System Variables
Since the stochastic model is the basis of the further performance analysis thatwill be carried out over Pc and Rs, as a first step, we validate the pdfs of thesystem variables Prcvd, Pcont, Pp, and Rs, from Section 2.2 and [9]. To this end,measurements with the setup in Fig. 2 have been performed for different values

6 Hanna Becker et al.
of received signal-to-noise ratio at the ST over the primary link (SNRrcvd2). The
measurement data was plotted in terms of histograms and scaled such that itrepresented the relative frequency (frel). Fig. 3 compares the histograms fromthe measurements and plotted pdfs using the analytical expressions for differ-ent system parameters. The plots show that the theoretical expressions veryaccurately capture the performance of real world cognitive radio systems.
Fig. 3. Theoretical expressions of the pdf and experimental results of different systemvariables (parameters from Table 1)
We repeated the experiment for different values of SNRrcvd. It was observedthat for a considerable range of SNRrcvd ∈ (4, 30) dB, the theoretical expressionsdepicted a significant accuracy to the experimental data, refer to Table 2. Theaccuracy was quantified in terms of relative error (erel) defined as
erel =1
nbins×nbins∑n=1
fPrcvd[n]− frel[n]
frel[n], (5)
where nbins is the number of histogram bins with frel[n] 6= 0.
2 As noise power, we used the measured receiver noise floor.3 The channel gain of the ST-SR link αs ∈ (0, 1) was set to its maximum theoretical
value for this analysis.4 The value represents the measured receiver noise floor (digital value) of the in-phase
or quadrature-phase components.
Underlay System: Validation & Demonstration 7
Table 1. Values of the parameters used for the performing experiments.
Parameter SNRrcvd N/τest θI T αs σ2s
Value 22 dB 100/0.5 ms -110 dBm 100 ms 1 3 2.1355× 10⁻¹⁰ 4
Table 2. erel from 5 for various SNRrcvd (parameters from Table 1)
SNRrcvd/[dB] 4.08 9.10 14.11 19.12 24.09 29.09 34.03 39.38 45.08
erel 0.0568 0.0601 0.0522 0.0437 0.0506 0.0634 0.1179 0.0800 0.1695
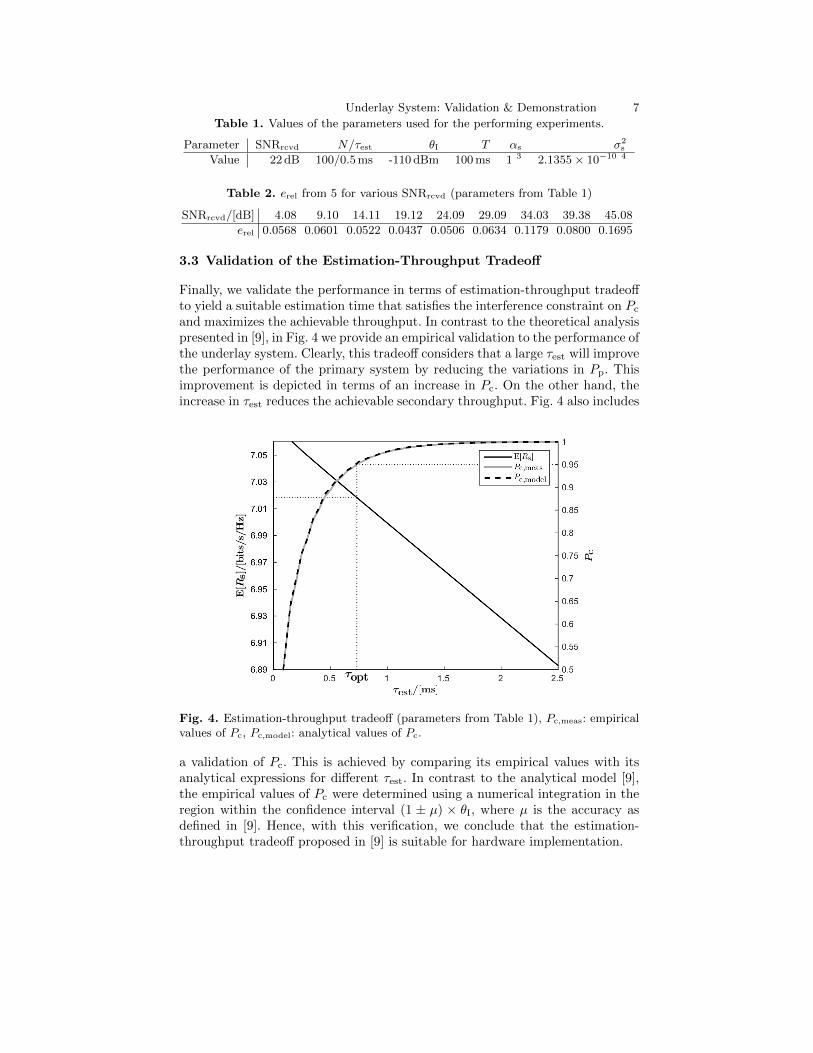
3.3 Validation of the Estimation-Throughput Tradeoff
Finally, we validate the performance in terms of estimation-throughput tradeoffto yield a suitable estimation time that satisfies the interference constraint on Pc
and maximizes the achievable throughput. In contrast to the theoretical analysispresented in [9], in Fig. 4 we provide an empirical validation to the performance ofthe underlay system. Clearly, this tradeoff considers that a large τest will improvethe performance of the primary system by reducing the variations in Pp. Thisimprovement is depicted in terms of an increase in Pc. On the other hand, theincrease in τest reduces the achievable secondary throughput. Fig. 4 also includes
Fig. 4. Estimation-throughput tradeoff (parameters from Table 1), Pc,meas: empiricalvalues of Pc, Pc,model: analytical values of Pc.
a validation of Pc. This is achieved by comparing its empirical values with itsanalytical expressions for different τest. In contrast to the analytical model [9],the empirical values of Pc were determined using a numerical integration in theregion within the confidence interval (1 ± µ) × θI, where µ is the accuracy asdefined in [9]. Hence, with this verification, we conclude that the estimation-throughput tradeoff proposed in [9] is suitable for hardware implementation.

8 Hanna Becker et al.
4 Implementation of a Demonstrator
In this section, we provide the details on the implementation of a demonstratorfor the underlay system.
4.1 Estimation Time
As we already verified the dependence of Pc and Rs on τest (refer to Fig. 4),it is challenging to select τest such that the system adheres to the interferenceconstraints at the PR and still achieves the highest possible secondary through-put. To analyze this problem, we introduce a new parameter called the optimizedestimation time (τopt). It is the τest that maximizes the secondary throughput ac-cording to equation (11) in [9] for a certain value of SNRrcvd, µ and a target valueof Pc defined as Pc. In Fig. 4, this optimization process is indicated graphicallyby the dotted lines, where, from a fixed Pc = 0.95, we acquire τopt ≈ 0.75 ms,which corresponds to E [Rs] ≈ 7.02 bits/s/Hz.
However, this analysis is carried out for a fixed value of SNRrcvd. Under realconditions, due to channel fading, SNRrcvd is not known. In this sense, it isnot possible to determine τopt. To resolve this issue, we propose a procedure,whereby we analyze the variations of τopt for different values of SNRrcvd, referto Fig. 5, and select τopt’s maximum value. By doing this, we are able to satisfythe interference constraint for all realizations of the channel. In addition, weconsider different values of Pc. It is observed that τopt increases with the decreasein SNRrcvd and attains saturation below a certain SNRrcvd.5
The explanation of this behavior is given in the following: For large valuesof SNRrcvd, Pcont is low, hence the variations of Pp around θI are low and con-sequently a lower value of τopt is needed to maintain these variations withinthe confidence interval. Very weak received signals, on the other hand, cannotbe distinguished from noise by the USRP, due to the quantization limit of theanalog-to-digital converter in the receiver chain. This is why, below a certainSNRrcvd, all received signals yield the same value of τopt.
We use this analysis for determining the τest in the implementation of ourdemonstrator. Since we target Pc = 0.95, we choose a fixed τest of 24 ms, whichis the maximum value determined from Fig. 5. By doing so, we seek to satisfythe interference constraints at the PR, at the cost of a decreased performancein Rs, particularly at higher SNRrcvd, where τopt achieves a low value.
4.2 Simplifications
The main objective of this paper is to demonstrate the basic principle of anunderlay scenario, in view of this, we will consider the following reasonable sim-plifications in the proposed analytical framework:
5 For varying θI, while the shape of the curves changed slightly, the upper limits forτopt remained constant.

Underlay System: Validation & Demonstration 9
SNRrcvd/[dB]-15 -10 -5 0 5 10 15
=opt/
[ms]
0
5
10
15
20
25
30
35
40
457Pc = 0:907Pc = 0:957Pc = 0:99
Fig. 5. τopt over SNRrcvd, θI = -110 dBm, µ = 0.05
1. We do not consider the hardware implementation of the SR, that is, it isregarded virtual in the system (refer to Fig. 6).
2. According to the model, the path loss is determined using [9]
αp =E [Prcvd]− σ2
p
Ptran. (6)
This is not possible in practical situations, where only a single realization ofPrcvd is available. Hence, we determine the path loss based on this realization.As σ2
p is negligible compared to Prcvd, it can be further simplified
αp =E [Prcvd]− σ2
p
Ptran≈Prcvd − σ2
p
Ptran≈ Prcvd
Ptran= αp . (7)
By not averaging over multiple realizations of Prcvd, we expect a highervariance in the resulting powers Pcont and Pp.
3. The model involves a frame synchronization (in case of Time Division Du-plexing) between PR and ST, which is complicated. To simplify this matter,we propose Frequency Division Duplexing between the PR and the ST: Wetransmit and receive the signals using two different frequencies (2.422 GHzand 2.423 GHz) over two separate antennas, as illustrated in Fig. 6. Withthis technique, the channel reciprocity may be compromised.
Mapping the steps described in Section 2.1 onto hardware and applying theabove-mentioned simplifications, we acquire the signal flow illustrated in Fig. 6,which we have implemented in GNU Radio using the available blocks therein.

10 Hanna Becker et al.
Fig. 6. Setup and block diagram of demonstrator
4.3 User Interaction and Observations
Fig. 7 shows the user interfaces of the demonstrator, providing insights to theparameters evaluated at the PR (for instance, Pp and Pc) and the CR/ST (forinstance, Prcvd, Pcont, and Rs). We have performed hardware calibration in thedemonstrator to provide physical significance to the digital values obtained fromthe USRPs, hence the displayed units. As the SR has not been implemented inthe hardware, to incorporate the effect of αs on the performance of the system,we employ a slider to modify its value.
As expected, changing the value of θI at the CR/ST changes the measuredvalue of Pp at the PR to approximately the same value. This phenomenon ishighlighted in Fig. 7. At the same time, the values of Rs and Pcont adapt ac-cordingly. This demonstrates that the received power estimation done at theST by listening to the pilot based channel, thereby acquiring the channel knowl-edge and performing the power control, is working in accordance to the underlayprinciple.
The response to the dynamic conditions can be verified by changing thedistance between the PR and ST, the effect can be captured by observing thechanges in Prcvd and other parameters depending on it. As the distance is in-creased beyond a certain value, the ST operates at its maximum transmit power.This event is indicated in the user interface.
With µ = 0.05, the demonstrator does not provide the target value of 0.95 forPc, as the variations in Pp are higher as expected. Certainly, this issue is partlycaused by the simplifications undertaken in 7, which have to be accounted forin future implementations. Another possible reason for this observation is thatwe used a pilot signal produced by a signal generator in the previous analysis,which offers a higher signal quality than the one produced by a USRP in thedemonstrator. Moreover, because of the separate links for sensing and trans-mission and the frequency separation of 1 MHz, the channel reciprocity in ourdemonstrator may be compromised compared with the theoretical model. To

Underlay System: Validation & Demonstration 11
Fig. 7. A snapshot of the performance parameters displayed in the user interfaces
resolve this issue, we increase the tolerance limit to µ = 0.20, which leads to thedesired Pc of 0.95. On this account, we will consider the signals being transmit-ted by a USRP for validation, in the future. Despite this, we have been able todemonstrate the principle working of an underlay system that employs a powercontrol mechanism at the ST to limit the excessive interference at the PR.
5 Conclusion
In this paper, we have analyzed the performance of an underlay system from a de-ployment perspective. To this end, an existing analytical framework [9] has beenvalidated. In this regard, the validation of a stochastic model that incorporatesthe pdfs of the system parameters has been considered. In addition, the perfor-mance analysis in terms of estimation-throughput tradeoff has been validated.Based on this validation, it has been illustrated that the proposed frameworkis suitable for real world deployments. Upon the experimental analysis, a hard-ware demonstrator that depicts the principle working of the underlay system hasbeen proposed. More importantly, the hardware challenges and simplificationsconsidered while deploying the demonstrator have been briefly discussed.

12 Hanna Becker et al.
In the future, we intend to reconsider certain simplifications made whiledeploying the demonstrator, for instance, we propose to deploy a USRP for theSR and try to synchronize the frame structure at the ST and the PR in orderto respect channel reciprocity.
References
1. Goldsmith, A., Jafar, S., Maric, I., Srinivasa, S.: Breaking spectrum gridlock withcognitive radios: An information theoretic perspective. Proceedings of the IEEE97(5) (May 2009) 894–914
2. Ghasemi, A., Sousa, E.: Fundamental limits of spectrum-sharing in fading environ-ments. Wireless Communications, IEEE Transactions on 6(2) (Feb 2007) 649–658
3. Kang, X., Liang, Y.C., Nallanathan, A., Garg, H., Zhang, R.: Optimal powerallocation for fading channels in cognitive radio networks: Ergodic capacity andoutage capacity. Wireless Communications, IEEE Transactions on 8(2) (Feb 2009)940–950
4. Musavian, L., Aissa, S.: Fundamental capacity limits of cognitive radio in fadingenvironments with imperfect channel information. Communications, IEEE Trans-actions on 57(11) (Nov 2009) 3472–3480
5. Sharma, S., Bogale, T., Chatzinotas, S., Ottersten, B., Le, L., Wang, X.: Cognitiveradio techniques under practical imperfections: A survey. Communications SurveysTutorials, IEEE 17(4) (Fourthquarter 2015) 1858–1884
6. Nguyen, T., Nguyen, T., Nguyen, H., Dang, K.: Hardware implementation of recep-tion diversity techniques for spectrum sensing efficiency enhancement in cognitiveradio network. In: Information and Communication Technologies (WICT), 2013Third World Congress on. (Dec 2013) 69–73
7. Anas, N., Mohamad, H., Tahir, M.: Cognitive Radio test bed experimentationusing USRP and Matlab/Simulink. In: Computer Applications and IndustrialElectronics (ISCAIE), 2012 IEEE Symposium on. (Dec 2012) 229–232
8. Combes, R., Proutiere, A.: Dynamic rate and channel selection in cognitive radiosystems. Selected Areas in Communications, IEEE Journal on 33(5) (May 2015)910–921
9. Kaushik, A., Sharma, S., Chatzinotas, S., Ottersten, B., Jondral, F.: Estimation-throughput tradeoff for underlay cognitive radio systems. In: Communications(ICC), 2015 IEEE International Conference on. (June 2015) 7701–7706
10. Kaushik, A., Raza, M., Jondral, F.: On the deployment of cognitive relay as under-lay systems. In: Cognitive Radio Oriented Wireless Networks and Communications(CROWNCOM), 2014 9th International Conference on. (2014) 329–334
11. Charalambous, C., Menemenlis, N.: Stochastic models for short-term multipathfading channels: chi-square and Ornstein-Uhlenbeck processes. In: Decision andControl, 1999. Proceedings of the 38th IEEE Conference on. Volume 5. (1999)4959–4964 vol.5
12. Jeffrey, A., Zwillinger, D.: Table of Integrals, Series, and Products. Elsevier Science(2000)
13. Ettus Research. http://www.ettus.com/ [Online; accessed December 2, 2015].14. Sedykh, I.: laptop-icon 500x500. https://www.flickr.com/photos/shmectorcom/
8616375606 (2013) [Online; accessed December 2, 2015; Copyright information:Creative Commons Attribution 2.0 Generic (CC BY 2.0)].