experimental study of high speed plate ditching - i · experimental study of high speed plate...
TRANSCRIPT

Experimental study of high speed plate ditching
A. Iafrati1, M. H. Siemann2, L. Benıtez Montanes3,1 INSEAN-CNR, Rome, Italy; 2 DLR, Stuttgart, Germany; 3 Airbus-Military, Madrid, Spain.
E-mail: [email protected]
SUMMARYIn the present paper experimental results of the water entry of a flat plate with a high horizontal speed are presented. Theactivity is part of an extensive study, still ongoing, aimed at achieving a deeper comprehension of the physical phenomenainvolved in the aircraft ditching problem. Measurements are conducted in terms of velocity, acceleration, pressures, strainsand total forces acting on the plate. In order to avoid any misleading effect due to the scaling, experiments are carriedout at quasi-full scale velocity. This required the construction of a new experimental facility at INSEAN-CNR. In thiswork an analysis of the data of two different values of the pitch angle of the plate is conducted along with an estimate ofthe test-to-test dispersion. Furthermore, the effect of entrained air is discussed.
1. INTRODUCTION
In this paper results of an experimental activity on the waterentry of a plate at high horizontal speed are presented. Themotivation stems from the need of developing more reliablesimulation tools for the aircraft ditching analysis. An im-portant step in the design stage of aircraft is the assessmentof the ditching capabilities. To this purpose the industryneeds simulation tools which can model, in a reliable man-ner and with limited computational effort, the fluid struc-ture interaction taking into account the elastic/plastic struc-tural behavior, including failure. Accounting for all these as-pects in a computational model is rather challenging owingto the difficulties in capturing the highly localized pressureand velocity distributions, air cushion effects, hydroelasticcoupling, as well as cavitation and ventilation phenomena(Climent et al., 2006). The development of those tools re-quires a reliable set of experimental data to be used forvalidation. Due to the difficulty in scaling all the parame-ters involved, experiments have to be performed in full scaleconditions. To this purpose a new experimental facility hasbeen built and installed at the end of towing tank # 1 ofINSEAN-CNR. The facility and some preliminary resultswere presented at the previous Workshop edition (Iafratiand Calcagni, 2013).
In the experimental campaign, which is conducted withinthe SMAES-FP7 project, the influence of several parame-ters is analyzed. These are: velocity, pitch angle, plate cur-vature, plate thickness, material. In this work results arepresented for a flat plate, 15 mm aluminum alloy.
Without any experience on the facility, an importantstep in the test campaign concerned the estimate of the test-to-test dispersion. It is worth noticing that, as discussedin Iafrati and Calcagni (2013), the model is accelerated bya set of elastic cords which make a precise control of thevelocity at the impact essentially impossible. Furthermore,although rather rigid, the guide undergoes some oscillatorymotion during the test and it is important to understandhow those effects influence the measurements. In order toevaluate the dispersion of the measurements, ten repeats ofthe same test have been performed. This is done for twodifferent pitch angles, which are 4 and 10 degrees. In bothcases the vertical/horizontal velocity ratio was 1.5/40.
Figure 1: Position of the pressure probes and straingauges as seen from the back of the plate. The trailingedge of the plate is on the left and the plate is movingto the right.
Figure 2: Entry of the plate in case of 4 degrees pitchangle. The two figures refer to the same test and havea time delay of about 0.045 s. The plate and the alu-minum frame appear in light gray beneath the steelframe.
2. EXPERIMENTAL SETUP
In the following a short description of the instrumentationinstalled on the plate is provided. A more detailed descrip-tion of the experimental facility and of the on board instru-mentation can be found in Iafrati and Calcagni (2013) andit is not repeated here for the sake of space.
The plate, which is thick enough to remain in the elas-tic regime, is instrumented by 18 flush mounted pressureprobes and six biaxial rosettes for the strain measurement.The positions of the pressure probes and strain gauges areillustrated in Fig. 1. The plate is installed onto an aluminumframe which is connected to carriage by a more rigid steelframe (Fig. 2). The connection between the steel frame andthe trolley is made by a total of six piezoelectric load cells,four of them measuring the force acting normal to the plateand two measuring the force along the plate.
3. EXPERIMENTAL RESULTS
In Fig. 3 the pressure measured by the probes located at dif-ferent longitudinal positions along the centerline are shownfor the case with 4 degrees pitch angle. The figure highlightsthe time delay occurring between the sharp rises of the dif-ferent sensors, which is the time needed for the jet root tomove from one position to the next. Note that for each runwe assume as reference time the time at which the sharp riseoccurs at probe P4 (see Fig. 1). Figure 3 also shows a varia-tion in the pressure peak recorded at the different positions.For a rigid plate in uniform motion, we had expected thepeak to be constant (Iafrati and Calcagni, 2013), and thuswe believe that other phenomena are acting. One point tobe checked is the dispersion of the data.
-0.5
0
0.5
1
1.5
2
2.5
3
-0.02 0 0.02 0.04 0.06 0.08 0.1
Cp
t (s)
Figure 3: Pressure recorded at the pressure probes lo-cated at the centerline (i.e. P4, P8, P12, P16, P18)during the run 1 of the test for 4 degrees pitch angle.Results are given in terms of the pressure coefficientp/( 1
2%(U2 + V 2)).
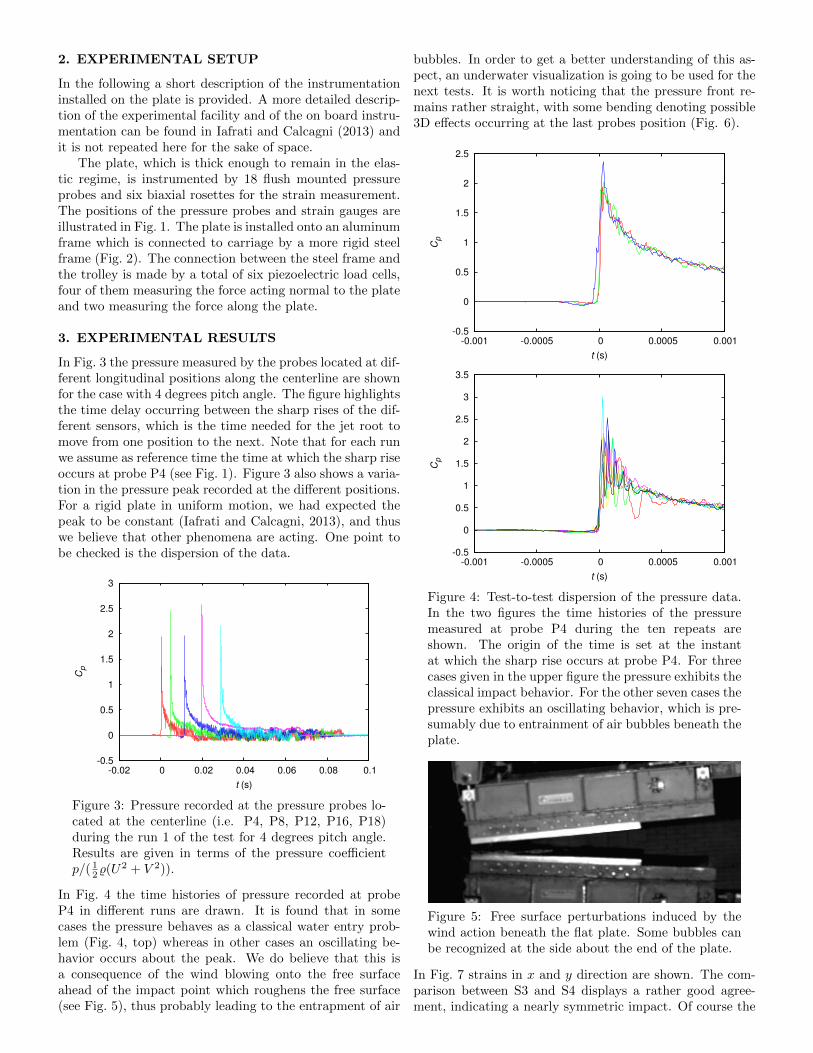
In Fig. 4 the time histories of pressure recorded at probeP4 in different runs are drawn. It is found that in somecases the pressure behaves as a classical water entry prob-lem (Fig. 4, top) whereas in other cases an oscillating be-havior occurs about the peak. We do believe that this isa consequence of the wind blowing onto the free surfaceahead of the impact point which roughens the free surface(see Fig. 5), thus probably leading to the entrapment of air
bubbles. In order to get a better understanding of this as-pect, an underwater visualization is going to be used for thenext tests. It is worth noticing that the pressure front re-mains rather straight, with some bending denoting possible3D effects occurring at the last probes position (Fig. 6).
-0.5
0
0.5
1
1.5
2
2.5
-0.001 -0.0005 0 0.0005 0.001
Cp
t (s)
-0.5
0
0.5
1
1.5
2
2.5
3
3.5
-0.001 -0.0005 0 0.0005 0.001
Cp
t (s)
Figure 4: Test-to-test dispersion of the pressure data.In the two figures the time histories of the pressuremeasured at probe P4 during the ten repeats areshown. The origin of the time is set at the instantat which the sharp rise occurs at probe P4. For threecases given in the upper figure the pressure exhibits theclassical impact behavior. For the other seven cases thepressure exhibits an oscillating behavior, which is pre-sumably due to entrainment of air bubbles beneath theplate.
Figure 5: Free surface perturbations induced by thewind action beneath the flat plate. Some bubbles canbe recognized at the side about the end of the plate.
In Fig. 7 strains in x and y direction are shown. The com-parison between S3 and S4 displays a rather good agree-ment, indicating a nearly symmetric impact. Of course the

largest values occur at the center of the plate, where S2 andS5 are located. In all cases the strains go back to their initialvalues, i.e. only elastic deformation occurs in this condition.
-0.5
0
0.5
1
1.5
2
2.5
3
3.5
-0.005 0 0.005 0.01 0.015 0.02 0.025 0.03 0.035 0.04 0.045
Cp
t (s)
p1p2p3p4p5p9
p10p11p12p13p17p18
Figure 6: Time histories of pressure recorded at dif-ferent sensors located at three longitudinal positions.It is seen that a delay occurs for probes P17 and P18,which identifies possible 3D effects.
-200
-100
0
100
200
300
400
-0.02 0 0.02 0.04 0.06 0.08 0.1
µm
/m
t (s)
s1xs2xs3xs4xs5xs6x
-100
0
100
200
300
400
500
600
700
-0.02 0 0.02 0.04 0.06 0.08 0.1
µm
/m
t (s)
s1ys2ys3ys4ys5ys6y
Figure 7: Time histories of the strain in x (top) and y(bottom) direction for run 1 of the 4 degrees pitch anglecase.
An indication of the dispersion of the strains can be derivedfrom Fig. 8. The curves display a rather good overlappingabout the peak. Some differences can be noticed in thelate stage which seem mainly related to a phase shift in theoscillations rather than in the amplitude.
-100
0
100
200
300
400
500
600
700
-0.02 0 0.02 0.04 0.06 0.08 0.1
µm
/m
t (s)
Figure 8: Dispersion of the strains measured by S2yand S5y for ten repeats of the 4 degrees pitch anglecondition.
The coefficient of the force normal to the plate is computedas CF = Fz/( 1
2%(U2 + V 2)BL), where B and L are thebreadth and the length of the plate, respectively, which are0.5 m and 1 m. The time histories for the tests at 4 degreespitch angle are drawn in Fig. 9 for several repeats. Thereis a good agreement among the different repeats althoughsome scatter characterize the data after the sharp rise in theinterval t ∈ (0.02, 0.04). At about t = 0.04 s the jet leavesthe plate and the force diminishes but does not go to zeroas the plate is still entering into the fluid.
-0.02
0
0.02
0.04
0.06
0.08
0.1
0.12
-0.02 0 0.02 0.04 0.06 0.08 0.1
CF
t (s)
Figure 9: Time histories of the total force coefficientacting normal to the plate of the ten repeats for thetests in the 4 degrees pitch angle condition.
Similar results can be shown for the 10 degrees pitch anglecase. In Fig. 10 the pressure history at probe P4 is shownfor the ten repeats. It is worth noticing that in this casethe curve are well overlapped each other and there are nooscillations. This is because at larger pitch angles the windcan exit on the side of the plate and the impact is onto analmost undisturbed free surface. In Fig. 11 the time histo-ries of the pressure measured at different probes located atthe same longitudinal position are shown. Differently fromthe 4 degrees case, the peak arrives earlier at the probeslocated closer to center, which means that the wetted line iscurved due to some three dimensional effects. This time de-lay grows while moving forward. Compared to the 4 degreescase, the pressure peak exhibits a more evident reduction

moving forward. An interesting aspect concerns the occur-rence of a time interval with negative pressures before thepeak. Note that the pressure gets the same negative valuefor different probes, but the time interval grows moving for-ward.
-0.2
0
0.2
0.4
0.6
0.8
1
1.2
1.4
1.6
1.8
2
-0.001 -0.0005 0 0.0005 0.001
Cp
t (s)
Figure 10: Test-to-test dispersion of the pressure datafor the 10 degrees pitch angle condition. As in Fig. 4,the time histories of the pressure recorded by the probeP4 in ten repeats of the test are displayed.
-0.2
0
0.2
0.4
0.6
0.8
1
1.2
1.4
1.6
1.8
2
-0.02 0 0.02 0.04 0.06 0.08 0.1 0.12 0.14
Cp
t (s)
P1P4P6P8P9
P12P14P16P17P18
Figure 11: Time histories of the pressure at differentprobes for the 10 degrees case. Negative pressure oc-curs at several probes before the sharp rise, durationof which grows moving forward.
The time histories of the strain are drawn in Fig. 12. It canbe seen that the values are about 30% larger than the onesmeasured in the 4 degrees case. This is because, due to thelarger pitch angle, in average the pressure is higher thanin the 4 degrees case. Similar considerations can be drawnalso looking at the force coefficient provided in Fig. 13. Notethat, also in terms of forces, the dispersion is much smallercompared to the 4 degrees case.
4. ACKNOWLEDGMENTS
The work has been done in the framework of the SMAES-FP7 project (Grant Agreement N. 266172). The activitiesby A.I. have been partially funded by the Flagship ProjectRITMARE - The Italian Research for the Sea - coordinatedby the Italian National Research Council and funded bythe Italian Ministry of Education, University and Researchwithin the National Research Program 2011-2013.”
-300
-200
-100
0
100
200
300
400
500
600
-0.02 0 0.02 0.04 0.06 0.08 0.1 0.12 0.14
µm
/m
t (s)
s1xs2xs3xs4xs5xs6x
-200
0
200
400
600
800
1000
1200
-0.02 0 0.02 0.04 0.06 0.08 0.1 0.12 0.14
µm
/m
t (s)
s1ys2ys3ys4ys5ys6y
Figure 12: Time histories of the strain in x (top) andy (bottom) direction for run 1 of the 10 degrees pitchangle case.
-0.05
0
0.05
0.1
0.15
0.2
0 0.05 0.1 0.15 0.2 0.25
CF
t (s)
Figure 13: Time histories of the total force acting nor-mal to the plate of the ten repeats for the tests in the10 degrees pitch angle condition.
5. REFERENCES
H. Climent, L. Benıtez Montanes, F. Rosich, F. Rueda andN. Pentecote (2006) Aircraft Ditching Numerical Simula-tion, 25th International Congress of the Aeronautical Sci-ences, Hamburg, Germany.
A. Iafrati, D. Calcagni, (2013) Numerical and experimentalstudies of plate ditching, 28th IWWWFB, Marseille, France.