experimental study of polymer interactions in a bad solvent
TRANSCRIPT

HAL Id: jpa-00210411https://hal.archives-ouvertes.fr/jpa-00210411
Submitted on 1 Jan 1987
HAL is a multi-disciplinary open accessarchive for the deposit and dissemination of sci-entific research documents, whether they are pub-lished or not. The documents may come fromteaching and research institutions in France orabroad, or from public or private research centers.
L’archive ouverte pluridisciplinaire HAL, estdestinée au dépôt et à la diffusion de documentsscientifiques de niveau recherche, publiés ou non,émanant des établissements d’enseignement et derecherche français ou étrangers, des laboratoirespublics ou privés.
Experimental study of polymer interactions in a badsolvent
R. Perzynski, M. Delsanti, M. Adam
To cite this version:R. Perzynski, M. Delsanti, M. Adam. Experimental study of polymer interactions in a bad solvent.Journal de Physique, 1987, 48 (1), pp.115-124. �10.1051/jphys:01987004801011500�. �jpa-00210411�

115
Experimental study of polymer interactions in a bad solvent
R. Perzynski, M. Delsanti (*) and M. Adam (*)
Lab. d’Ultrasons, Univ. P. et M. Curie, Tour 13, 75252 Paris Cedex 05, France(*) Service de Physique du Solide et de Résonance Magnétique, CEN-Saclay, 91191 Gif-sur-Yvette Cedex,France
(Reçu le 2 juin 1986, accepté le 25 septembre 1986)
Résumé. 2014 Les interactions entre chaînes polymériques dans un mauvais solvant (polystyrène-cyclohexane à destempératures plus petites que 35 °C) ont été étudiées en utilisant des mesures d’intensité de lumière diffusée. Lesrésultats obtenus, dans des solutions diluées, montrent que la concentration de demixtion, CD, est reliée au secondcoefficient du viriel, A2, de la pression osmotique. Les variables réduites à utiliser pour avoir une courbe universellene sont pas celles prédites par les théories de champ moyen ou de loi d’échelle. Il est trouvé empiriquement que
CD/Cc et A2/Ac2 sont fonction de Tc - T/Tc M0,31w. Mw est la masse moléculaire, Cc et Ac2 sont respectivement laconcentration critique et Ie second coefficient du viriel à la température critique Tc.
Abstract. 2014 The interactions between polymer chains in a bad solvent (polystyrene-cyclohexane at temperatureslower than 35 °C) was studied using light scattering intensity measurements. The results obtained in dilute solutionsshow that the demixing concentration CD is related to the second virial coefficient A2 of the osmotic pressure. Usingthe reduced variables predicted by mean-field or scaling theories the demixion curves are dependent on
Mw, the molecular weight. Empirically, it is found that CD/Cc and A2/Ac2 are only functions of Tc - T/Tc M0.31w. Cc
and Ac2 are the critical concentration and the second virial coefficient at the critical temperature Tc.
J. Physique 48 (1987) 115-124 JANVIER 1987, 1
Classification
Physics Abstracts05.40 - 61.40K - 82.90
1. Introduction.
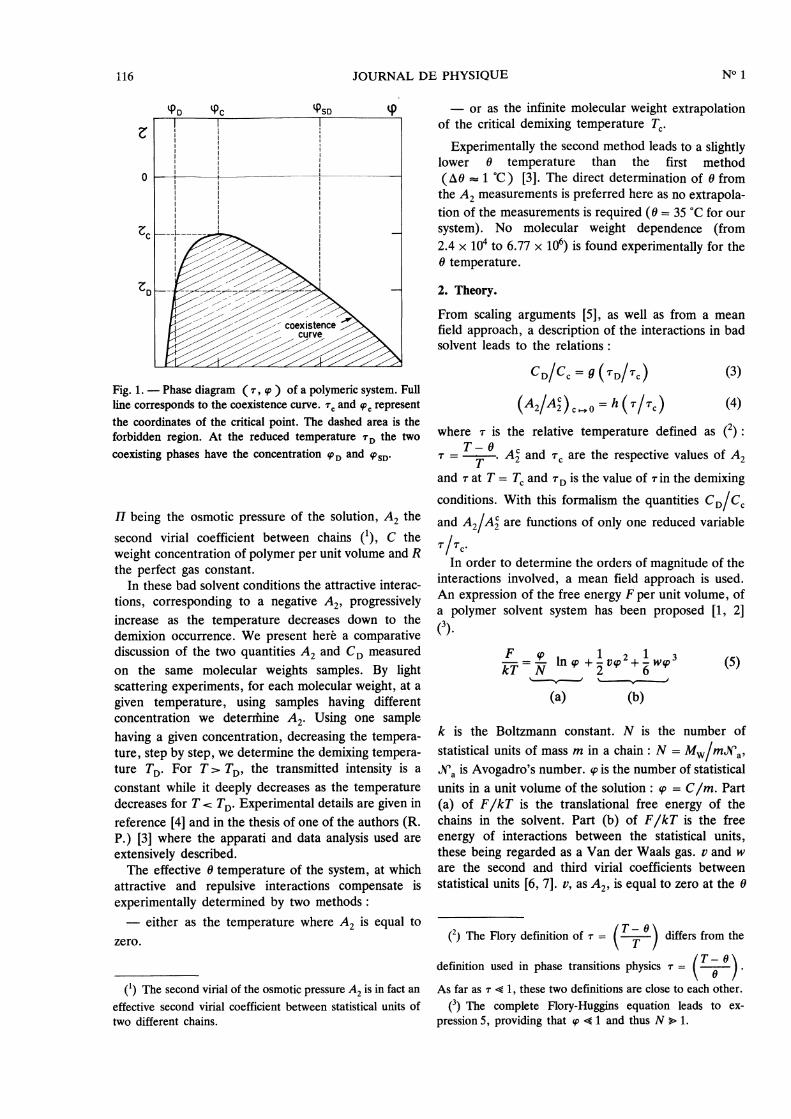
In a polymeric system of linear and flexible chainsdiluted in a bad solvent, attractive interactions can bestrong enough to induce a phase separation in thesolution. Among the two coexisting phases one isdiluted while the other is more concentrated in thechain concentration. The phase diagram (Fig. 1), tem-perature T versus concentration C, presents a complete-ly forbidden range of concentrations limited by a
coexistence curve and with a critical point (Tc, Cc) atits maximum (UCST). Above Tc and in the vicinity ofTc [1, 2], intermolecular interactions are, within a meanfield framework, directly related to intramolecularinteractions. These interactions govern the deswellingof an isolated chain which has been extensively studiedand is well described, at first order, by existingtheories. The purpose of this paper is to analyseintermolecular interactions, whatever the temperatureand the molecular weight, in the very dilute regime
(C « C c ). Experiments are performed on polys-
tyrene-cyclohexane system with chain molecular weightMw ranging from 1.71 x 10⁵ to 2.06 x 10⁷ daltons, overa temperature domain from 10 °C to 35 °C, correspond-ing to a bad solvent situation. Using light scatteringmeasurements [3], two quantities are determined : thedemixing concentration CD and the inverse of the
osmotic compressibility C ac . The demixing concen-8C
tration C D, in the dilute phase (CD .r. CC) of the
coexistence curve, is a function of temperature andmolecular weight:
The coexisting conditions are defined by equalizing thechemical potential and the osmotic pressure in the twocoexisting phases. The inverse of the osmotic compress-ibility of the dilute solution is given by :
Article published online by EDP Sciences and available at http://dx.doi.org/10.1051/jphys:01987004801011500
116
Fig. 1. - Phase diagram (T, cp ) of a polymeric system. Fullline corresponds to the coexistence curve. Tc and (p,, representthe coordinates of the critical point. The dashed area is theforbidden region. At the reduced temperature TD the two
coexisting phases have the concentration cp D and ’P SD’
H being the osmotic pressure of the solution, A2 the
second virial coefficient between chains (1), C theweight concentration of polymer per unit volume and Rthe perfect gas constant.
In these bad solvent conditions the attractive interac-
tions, corresponding to a negative A2, progressivelyincrease as the temperature decreases down to thedemixion occurrence. We present here a comparativediscussion of the two quantities A2 and CD measuredon the same molecular weights samples. By lightscattering experiments, for each molecular weight, at agiven temperature, using samples having different
concentration we determine A2. Using one samplehaving a given concentration, decreasing the tempera-ture, step by step, we determine the demixing tempera-ture TD. For T > Tp, the transmitted intensity is a
constant while it deeply decreases as the temperaturedecreases for T Tp. Experimental details are given inreference [4] and in the thesis of one of the authors (R.P.) [3] where the apparati and data analysis used areextensively described.The effective 0 temperature of the system, at which
attractive and repulsive interactions compensate is
experimentally determined by two methods :- either as the temperature where A2 is equal to
zero.
(’) The second virial of the osmotic pressure A2 is in fact aneffective second virial coefficient between statistical units of
two different chains.
- or as the infinite molecular weight extrapolationof the critical demixing temperature TC.
Experimentally the second method leads to a slightlylower 0 temperature than the first method
(A o ztz 1 °C ) [3]. The direct determination of 0 fromthe A2 measurements is preferred here as no extrapola-tion of the measurements is required (6 = 35 °C for oursystem). No molecular weight dependence (from2.4 x 104 to 6.77 x 10⁶) is found experimentally for the0 temperature.
2. Theory.
From scaling arguments [5], as well as from a meanfield approach, a description of the interactions in badsolvent leads to the relations :
where T is the relative temperature defined as (2)T-(J
T = T o. A’ and ? are the respective values of AT 2 c 2
and T at T = Tc and TD is the value of T in the demixingconditions. With this formalism the quantities CDICCand A 2/A2 c are functions of only one reduced variableTI Tc.
In order to determine the orders of magnitude of theinteractions involved, a mean field approach is used.An expression of the free energy F per unit volume, ofa polymer solvent system has been proposed [1, 2](3). .
k is the Boltzmann constant. N is the number of
statistical units of mass m in a chain : N = Mw/mXa,Xa is Avogadro’s number. cp is the number of statisticalunits in a unit volume of the solution : cp = C /m. Part(a) of F/kT is the translational free energy of thechains in the solvent. Part (b) of F/kT is the freeenergy of interactions between the statistical units,these being regarded as a Van der Waals gas. v and ware the second and third virial coefficients betweenstatistical units [6, 7]. v, as A2, is equal to zero at the 0
(2 ) The Flory definition of T = T T 0) differs from the
definition used in phase transitions physics = T - e .B /As far as T 1, these two definitions are close to each other.
(3) The complete Flory-Huggins equation leads to ex-
pression 5, providing that cp 1 and thus N > 1.

117
temperature [1] and is proportional to the relative
temperature T ; the proportionality factor b = v / T is aconstant. w is weakly temperature dependent and isoften taken to be a constant [2, 7].
This expression of the free energy leads to the
coordinates (cp c’ 7-C ) (see Fig. 1) of the critical point
using, a2F- a’F
-0using a2F 2 = a3F 3 = 0acp2 acp3
On the coexistence curve (Fig. 1) the two phases(’PD and ’PSD) coexisting at the same temperature
(TD) have identical chemical potential ( aF 1 andawidentical osmotic pressures (1T = cP 2 a ( F/ cp) ) : :a~
Far from the critical point ( PD Pc ’PSD ) these
identities lead to [3] :
Then cp 0 IN is function only of T J N, in agreementwith relation (3). One must note that
fPo/fPc oc cp D IN and T /Tc OC T N/N. Using exper-imental quantities this can be written as :
This theory leads to coexistence curves independent ofmolecular weight if the variables CD J Mw and
T J Mw are used. For the second virial coefficient A2,formula (4) may be justified by the following argument.In the good solvent situation it is experimentallyverified [8] that :
and that :
where CT is the overlap concentration at the tempera-ture T. Since C Tc Cc, relation (4) corresponds to anextension of relation (11) for T 0.So this mean field description, as well as scaling,
would lead to representations of coexistence curves andinteractions between chains on single master curves,whatever the temperature and the molecular weight.The reduced variable would be r J Mw. It must be
pointed out that T ,Imw is also the reduced variableof expansion factors of an isolated chain.
3. Experimental results and discussion.
3.1 INTRAMOLECULAR INTERACTIONS. - In the so-
called 0 domain [9] (I T V/M, 1,-5 10) where meanfield theory can be applied, the osmotic compressibilitymeasured by elastic light scattering allows both v in thedilute regime (C « CQ ) and w in the semi-dilute
regime ( C > C 0 -, T = 0 ) to be determined.
a 7rIn the dilute regime, 2013 is found to be a linear
dCfunction of concentration. In the 0 domain, A2 is
experimentally independent of Mw and proportional toT for T2:0 and for Ts 0 if T ( _ 2 x 10- 2 (seeFig. 2). This agrees with the mean field description :A2, the second virial coefficient between chains is
directly proportional to v the second virial coefficientbetween statistical units. This leads experimentally to :
From this expression one can deduce the Yamakawaexcluded volume parameter [3, 10] : z = 8.10- 3 x
T J Mw. This agrees with the z value deduced, forexample, from the expansion factor of the intrinsic
vicosity measured in the 0 domain [11, 12]:
Fig. 2. - Second virial coefficient of the osmotic pressure
(A2 (CM’ x mole/g2 ) ) versus the relative temperature T isthe 0 domain ( ) T j£ ) s 10) + : measurements from
references [14, 21, 28, 29] for 1.3 x 10⁵ Mw _ 5.7 x10⁷ ;0 : measurements for 2.4 x 10⁴ _ Mw 6.77 x 10⁶ (see ap-pendix 1). The absolute accuracy on A2 is smaller than
5 x 10⁻⁵ cm3 . mole/g2; e : correspond to the quantity- 1.4 , plotted versus Tc, as determined from referencesmw C,’ c
p
[18-20]. The straight line corresponds to relation (12).

118
z = 7 x 10- 3 x T JMw. For our system z is exper-
imentally the reduced variable of the expansion factorof isolated chain inside and outside the 0 domain forboth T >_ B and T s 0 [9, 11, 13-15]. The intrachaininteraction is thus experimentally only a function of thereduced variable T JMW whatever the temperatureand the molecular weight. It must be noticed in figure 2that for the lower values of T, A2 determinations in the0 domain deviate from expression (12).
In the semi-dilute regime, at the 0 temperature,
airlac is experimentally proportional to C 2 [4]. Thisleads to a determination of W [3] which is found to beindependent of MW :
From this experimental determination a value of y maybe derived: y = 10- 2. y is the three body interactioncoefficient of the modified Flory equation for the
deswelling of an isolated chain (4). A comparisonbetween experimental expansion factors and the mod-ified Flory equation [3, 11], in the collapsed regime,leads to higher y values ( 0. 1 :5 y :5 1 ) . On the
contrary a comparison between experimental expansionfactors and a tricritical model [16] in the vicinity of 0 isin good agreement with determination (13) of the threebody interaction.
3.2. COMPARISON WITH THEORETICAL PREDIC-
TIONS. - Substituting experimental values (12) and(13) for v and w, determined in 0 domain, in (6) and (8)gives :
I ,
These numerical values are to be compared with theexperimental determinations of T c and C c of the
system. From the literature [18-22], it is found that’ .
(5) (see Fig. 3a) :
(4) If the modified Flory equation for expansion factor a iswritten as [17] :
-
I
one obtains y- ( 9 ± 2 ) x 10-B using relations [3]
w = 3 yl 6 and 2 I2 M W ; ; 1 is the length of thew = 3 y/6 and a d mJY’a / is the length of the
statistical unit and Ro, the radius of gyration at the 0
temperature, equal to 0.29 x MW ( A ) for PS-cyclohex-ane (mean value from literature measurements).
(5) As previously mentioned T, (M,, , oo34.0 ± 0.2 ( °C) is not equal to the temperature where A2 is
experimentally equal to zero (35 ± 0.5 °C).
which agrees with (14). On the contrary one can see infigure 3b that relation (14) is not verified for Cc andthat :
If the mean field description predicts a satisfactoryvalue of T c it only gives an order of magnitude for Cc.The molecular weight dependence (Eq. (16)) wouldimply a molecular weight dependence of w in the
model ; this is in opposition with the experimentalobservation (13).The relation ,Tc _ M- w 0.5 and Cc _ M- 0.38 obtained
Fig. 3. - Variation of the critical coordinates as a function ofthe molecular weight. Fig. 3a : T- 1 versus Mw 1/2 for thepolystyrene-cyclohexane system. Symbols : +, V, x, 0, *
correspond to references [18 to 22] respectively. Fig. 3b :Cc versus MW in log-log scale for polystyrene-cyclohexanesystem : V reference [18] ; 0 reference [19] ; + reference [20].The full line corresponds to Cc = 6.8 x MW-0.38 (g/cm3) andthe dashed line to Cc = 28/Nlm--w (g/cm,) -

119
for polystyrene-cyclohexane system, may well be moregeneral as they remain valid [3] for a different system :polystyrene-methylcyclohexane, which was extensivelystudied experimentally in the vicinity of the critical
point [23].A tricritical theory [24] has been proposed to describe
the concentration effects in 0 solvents. It leads to
logarithmic corrections to the mean field expressions.Providing a proportionality between the boundaries ofthe diluted 0 regime and the critical point coordinates,the tricritical effect is a weak correction for T c
Tc oc N - l2 . ( ln N ) - 3/2) and a stronger correctionfor Cc (Cc oc N- . (InN) ) - This effect
could explain the discrepancy between the meanfieldtheory (6) and experimental results (15), (16).
If C c is not well described by the mean field
formalism, a strong observation is that Ac 2 and mw 1 Cc2 MW Cc
are experimentally found to be of the same order ofmagnitude (see Fig. 4) :
The two physical magnitudes A2 and C,, quantitiesboth related to interchain interactions, deviate togetherfrom the mean field behaviour (straight line in Fig. 2)for relative temperatures r 5 - 2 x 10- 2. In goodsolvents, A2 is proportional to R 9 3IM2,, Rg being theradius of gyration of an isolated chain. An interestingcomparison would be to plot also Rgl MW in figure 2.Unfortunately no Rg measurements are available, forPS-cyclohexane system, in the range of T where thesecond virial coefficient deviates from expression (12).
Considering now the coexistence curve, far from the
Fig. 4. - A; versus M w 1. C c in log-log scale. C c measurementsfrom references [18-20] and Ai are interpolated throughmeasurements of the present work. The straight line corres-
ponds to the law A2 = - 1.4 (Mw Cc) -0.99:t0.04.
critical conditions, a comparison is given in figure 5between mean field predictions (2d-part of formula(14)) and experimental determinations. The mean fielddescription gives only a good order of magnitude forCp, but with molecular weight distortions. Thus
c c JMw, CD -B/ /R.-, w and A2 . JMW are not functionsof the single reduced variable T B/Mw. This is not
surprising because a mean field description is not
strictly valid either in the vicinity of the critical point orin the dilute regime : it neglects the concentrationfluctuations.
Fig. 5. - Experimental phase diagram 1 In C
Mw - 6’TDversus - T 2. The absolute accuracy on Tp is 0.5 ° C and Cdetermination better than 2 %. The molecular weight symbolsare : + 1.71 x 10⁵ ; * 4.22 x 10⁵; 0 1.26 x 10⁶; x 3.84 x 10⁶;V6.77 x 106. The straight line corresponds to the mean fieldcalculation (formula (14)). Dashed lines have been drawn justto have a visual guide.
3.3 ANALYSIS OF THE INTERCHAIN INTERACTIONS.- In this section we shall try to find the reduced
parameter of interchain interactions. First of all one
may go back to relations .(3) and (4), using onlyexperimental determinations of the various critical
quantities (formulae (15), (16), (17)). In figure 6,
CD/C,, and A 2/A2 c are plotted (6) versus T / T c: asystematic splitting with MW subsists for the two
quantities in these representations.A second attempt is shown in figure 7. If T / T c is
neither the reduced variable of CD /cc nor of A2I A2,on the contrary the quantity C D/Cc is only function of
(6) It must be noted that owing to (15) the reduced quantity
T / T c is proportional to T MW.

120
Fig. 6. - Mean field universal coordinates for demixion curveand second virial coefficient. Fig. 6a : Semi-logarithmic plot
/ / A Bof C D/ C c versus T / T c’ Fig. 6b : Linear plot of A2 - 1
Ac 2 /versus T rc.For molecular weight symbols see figure 5. The meaning ofthe other symbols is : V MW = 2.06 x 10⁷, E MW =
1.71 x 10⁵, · MW = 1.26 x 10⁶. 1 and 0 correspond to A2determination from quasi elastic light scattering measure-ments [3, 9] (see appendix 2 and 3). Full lines have been
drawn just to have a visual guide.
A2/A2. The empirical relation between A 2 and CD (7)is :
If in the critical conditions, the quantity Mw A’ 2 Cc isequal to - 1.4, on the contrary, far from the critical
conditions (c of C c 2.5 x 10⁻²) it becomes :
(7) Simultaneous determinations of both A2 and CD
( C D C c) for a given MW is only possible in a narrow
temperature range.
CFi . g 7. - Lo g -lo g P lot of C D/ C C versus A-z - c 2. ForFig. 7. - Log-log plot of CD e c versus -. For
AC 2molecular weight symbols see figure 6. The straight line
corresponds to relation (18). For a given M, and a given T,A -Ac
A2 _ AZ C is the measured quantity and C n/ C C are interpolatedAC 2values or extrapolated values for r - T cST c/ 4.
This relation shows that, even in the vicinity of thecoexistence curve, the low concentration expansion ofthe osmotic pressure (relation (2)) is valid. The molecu-lar weight independent relation (18) between A2/A2and C 01 C c means that the interactions between chainsare really the physical cause of demixion.
In a third attempt, we shall consider the system to bea critical binary mixture. For mixtures of identical sizemolecules, the analysis of the phase diagram is done
7,-rusing a reduced temperature E - T which meas-Tcures the relative distance to the critical temperatureTc. For mixtures of different size molecules, the
difference in size must be compensated by a function ofthe molecular weight [25]. In order to determine thisfunction, the reduced temperature E is plotted as afunction of molecular weight at a given reduced concen-tration CDICC (see Fig. 8). It is found that, over twodecades of molecular weight, E is proportional to
M- 0.31 ± 0.04W .
Indeed E x Mo- 31 is the reduced variable of both
quantities CD/cc and A2/A2 (see Fig. 9). The diluteside of the coexistence curve (Fig. 9a) has an exponen-tial behaviour:
In figure 9b the analytical expression of Cp (20)transformed into an analytical expression for A2through relation (18) is a good extension of the

121
T - TDFig. 8. - Log-log plot of e = 2013_20132013 versus M w for
T,
CD/C, = 3.2 x 10⁻³. The straight line is the best fit
e =1.1 x Mw 0.31:!: 0.04.
A2 measurements. A second virial coefficient of theosmotic pressure, between chains, which is an exponen-tial function of temperature, qualitatively agrees with adescription of the dilute polymeric solution in badsolvent as a Van der Waals gas of independent statisticallinks [26].Two points must be noted. First, expansion factors of
isolated chain plotted versus EMO- 31 exhibit a wide
molecular weight dependence which does not exist
versus r J Mw. Secondly, Sanchez [27] has reanalysedthe coexistence measurements from reference [23]obtained with the system polystyrene-methylcyclo-hexane, in the vicinity of the critical point, over a rangeof molecular weights : 1.02 x 10⁴:5 Mw :5 7.19 x 105.A symmetrization of the two sides of the coexistencecurves, with respect to the critical conditions wascarried out, using two specific reduced variables. Oneof these, EMO- 31 is identical to that obtained here fromA2 and CD measurements. Thus EMO- 31 is the reducedvariable of the coexistence curves both near to and farfrom the critical point.
4. Conclusion.
In bad solvents, expansion factors and interchaininteractions do not scale with the same reduced vari-able. For polystyrene-cyclohexane system expansionfactors of an isolated chain may be described as
functions of the single variable T J Mw, during theevolution towards collapse [3, 9, 11, 14, 15] and in thecollapsed state [3, 11]. A mean field approach thenallows a qualitative description for expansion factorvariations to be obtained but gives only an estimationof the interchain interactions.A coherent description is obtained for interactions
between chains in diluted solutions: the second virial
Fig. 9. - Universal coordinates for demixion curve and
second virial coefficient. Fig. 9a : Semi-logarithmic plot of
CD / C versus eMo,". The straight line is the best fit (relation20 . Fi . 9b : Linear lot of
A2 _ A2 c versus eM0.31 The20). Fig. 9b : Linear plot of A2 - Ac 2. versus EMO.31. The20). Fig. 9b: Linear plot of Ac 2 / versus w The
full line A2 - AZ
c
= 0.16 x ex 3.5 x EM°31 , For s mbolsfull line is 2 -Ac 2 = 0.16 x exp (3.5 x 0-3’) . For symbolsfull c = 0.16 x 16 x exp (3.5 x emw For symbols2
see figure 6.
coefficient of osmotic pressure is related to the coexist-
ence curve
which occurs owing to the thermodynamic interactionsbetween chains, may be described with the samereduced variable in the vicinity of the critical point andin the very dilute range where co/Cc and A,/Ac 2 areonly functions of
duced variable EMw seems to be quite general as it isobtained :
- from two different polymeric systems,- from different physical quantities : A2 and CD,- from measurements both near to and far from the
critical point,
122
- using various samples of various polydispersity/ mw B( 1.01 M n 1.2 over a wide range of molecularB M. /weights (105 _ Mw:5 107).
Acknowledgments.We are greatly indebted to B. Duplantier, P. G. deGennes, J. F. Joanny and L. Leibler for fruitful discus-sions and I. C. Sanchez for the communication of hispreprint.
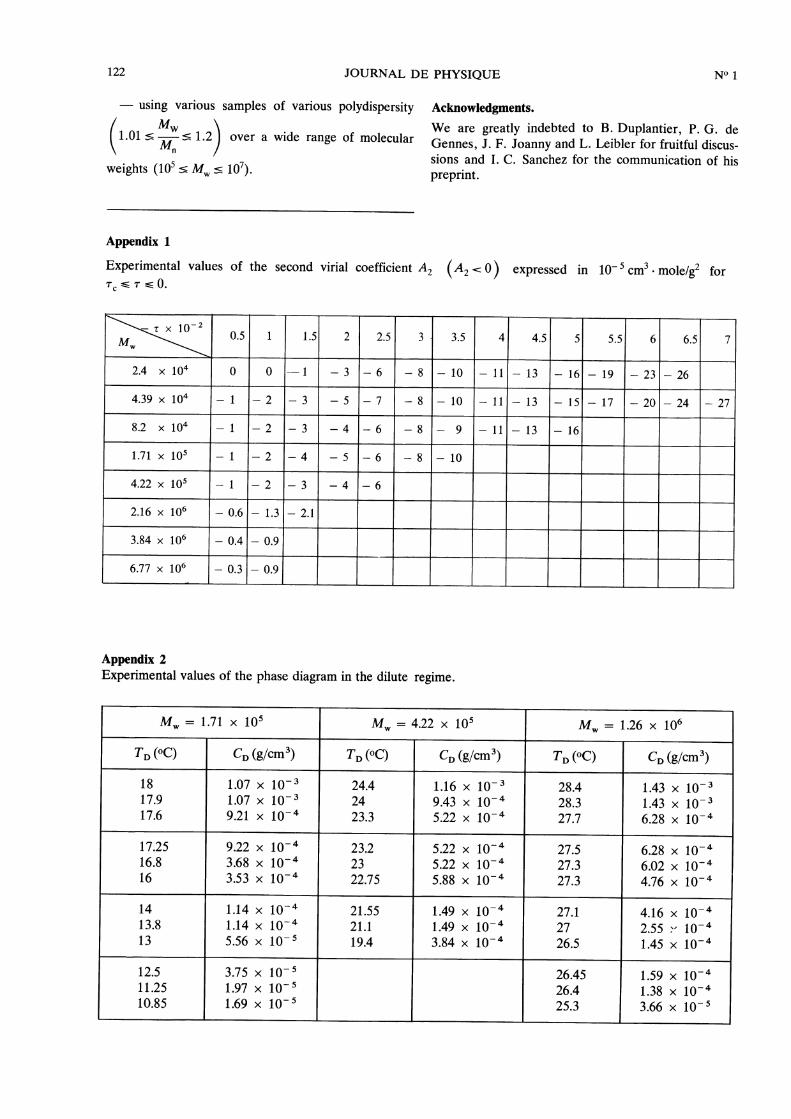
Appendix 1
Experimental values of the second virial coefficient Az ( A2 0 ) expressed in 10-5 cm3. molelg2 forTc T 0.
Appendix 2Experimental values of the phase diagram in the dilute regime.

123
Appendix 3Experimental values of the reduced second virial coeffi-cient : A -Ac)/Ac for T S Tc.
(*) Values deduced from quasielastic light scattering measu-rements.

124
References
[1] FLORY, P. J., Principles of Polymer Chemistry (CornellUniv. Press, Ithaca) 1953.
[2] DE GENNES, P. G., Scaling concepts in Polymer Physics(Cornell Univ. Press, London) 1979.
[3] PERZYNSKI, R., Thesis, Université Pierre et Marie
Curie, France (1984).[4] STEPANEK, P., PERZYNSKI, R., DELSANTI, M., and
ADAM, M., Macromolecules 17 (1984) 2340.[5] IZUMI, Y., and MIYAKE, Y., Rep. Prog. Polym. Phys.
Japan 26 (1983) 5.[6] LANDAU, L., and LIFSHITZ , E., Statistical Physics (Perga-
mon Press) 1959.[7] OONO, Y., and OYAMA, T., J. Phys. Soc. Japan 44
(1978) 301.HIRSCHFELDER, J. O., CURTISS, C. F., and BIRD, R. B.,
Molecular Theory of Gases and Liquids (Wiley-New York) 1954, p. 1114.
[8] NODA, I., KATO, N., KITANO, T. and NOGASAWA, M.,Macromolecules 14 (1981) 668.
[9] PERZYNSKI, R., ADAM, M. and DELSANTI, M., J.
Physique 43 (1982) 129.[10] YAMAKAWA, H., Modern Theory of Polymer Solutions
(Harper and Row. Pub. New York) 1971.[11] PERZYNSKI, R., DELSANTI, M. and ADAM, M., J.
Physique 45 (1984) 1765.[12] SHIMADA, J. and YAMAKAWA, H., J. Polym. Sci. 16
(1978) 1927.KURATA, M. and YAMAKAWA, H., J. Chem. Phys. 29
(1958) 311.[13] ADAM, M. and DELSANTI, M., J. Physique 41 (1980)
713.
[14] MIYAKI, Y., Thesis (Univ. of Osaka, Japan, 1981).
MIYAKI, Y. and FUJITA, H., Polymer J. 13 (1981) 749.[15] OYAMA, T. O., SHIOKAWA, K. and BABA, K., Polymer
J. 13 (1981) 167.[16] DUPLANTIER, B., JANNINK, G. and DES CLOIZEAUX, J.,
Phys. Rev. 56 (1986) 2420.[17] DE GENNES, P. G., J. Physique Lett. 36 (1975) L55.[18] KONINGSVELD, R., KLEINTJENS, L. A. and SHULTZ,
A. R., J. Polym. Sci. A-2 8 (1970) 1261.[19] SAEKI, S., KUWAHARA, N., KONNO, S. and KANEKO,
M., Macromolecules 6 (1973) 247.[20] DERHAM, K. W., GOLDBROUH, J. and GORDON, M.,
Pure Appl. Chem. 38 (1974) 97.[21] STRAZIELLE, C. and BENOIT, H., Macromolecules 8
(1975) 203.STRAZIELLE, C., private communication.
[22] NAKATA, M., DOBASHI, T., KUWAHARA, N., KANEKO,M. and CHU, B., Phys. Rev. A 18 (1978) 2683.
[23] DOBASHI, T., NAKATA, M. and KANEKO, M., J. Chem.Phys. 72 (1980) 6685.
DOBASHI, T., NAKATA, M. and KANEKO, M., J. Chem.Phys. 80 (1984) 948.
[24] DUPLANTIER, B., Thèse (Univ. Pierre et Marie Curie,Paris, France) (1982).
DUPLANTIER, B., J. Physique 43 (1982) 991.[25] Reference [2] p. 121.[26] Reference [6] p. 223.[27] SANCHEZ, I. C., J. Appl. Phys. 58 (1985) 2871.[28] KRIGBAUM, W. R. and CARPENTER, D. K., J. Phys.
Chem. 59 (1955) 1166.[29] YAMAMOTO, A., FUJII, M., TANAKA, G. and
YAMAKAWA, H., Polymer J. 2 (1971) 79.