experimental study on droplet size of dispersed oil-water flow
TRANSCRIPT

Experimental study on droplet size of dispersed oil-water flow
Milad Khatibi
Natural Gas Technology
Supervisor: Zhilin Yang, EPTCo-supervisor: Bjørnar Hauknes Pettersen, Statoil ASA
Ole Jørgen Nydal, EPT
Department of Energy and Process Engineering
Submission date: June 2013
Norwegian University of Science and Technology


I
Preface
This study was carried out within the scope of a Statoil project at the Statoil multiphase flow
laboratory in Research, development and Innovation (RDI) in Rotvoll-Trondheim office. I
gratefully acknowledge the technical and financial support from the flow assurance and
multiphase flow department in RDI.
My main word of thank goes to Bjørnar Hauknes Pettersen. I would like to thank him for giving
me many detailed instructions on my thesis and helping me to setup the experiment, processing
the data and finding solutions to my questions.
I would also like to thank my supervisor at Statoil, Zhilin Yang. He gave me a lot of trust and
flexibility when working on the thesis. Without him, I could not have dealt with such a
challenging project.
And finally I would like to thank professor Ole Jørgen Nydal and Robert Orr for their helpful
advices through experiments and data analysis.
This section would not be complete without thanking my parents who have always supported me
during my education.

II
Abstract
Experimental investigation on droplet sizing measurement techniques both in flow of oil-in-
water dispersion and water-in-oil dispersion were performed at the Statoil multiphase flow
laboratory in Rotvoll. The focus of these experiments was to analyze the accuracy of chord
length distribution (CLD) measured by focus beam reflectance measurement (FBRM
technology) in comparison with the droplet size distribution (DSD) measured by a particle video
microscope (PVM technology). A beaker – batch test and a flow loop test were employed for a
variety of oils spanning over an order of magnitudes in viscosity. The PVM was found to be a
useful and accurate measurement device for determining the real droplet sizes and as a
calibration method for the FBRM. In the beaker test, The Sauter mean diameter d32 was found to
be proportional to the maximum (99th percentile) droplet size for both oil-water emulsions and
water-oil emulsions. Since the CLD values were underestimating the size in comparison with
DSD values, an empirical correlation was developed based on a log-normal distribution to
improve the predictive power of the CLD. The dynamic properties of both FBRM and PVM
probes were evaluated in beaker tests and flow loop tests. The beaker tests were found to be a
reliable and reasonable alternative to flow loop tests. The simplicity of both testing and data
collection, combined with the reduced effect of distance between the probes, allow the beaker
tests to provide a good estimate of the uncertainty of the FBRM measurement for the water-oil
flow in the pipe.

III
Table of Contents
Preface.............................................................................................................................................. I
Abstract ........................................................................................................................................... II
Abbreviation ................................................................................................................................... 1
1 Introduction ............................................................................................................................. 2
Project Work .................................................................................................................... 2 1.1
Aim of the study ............................................................................................................... 3 1.2
Background ...................................................................................................................... 3 1.3
2 Method .................................................................................................................................... 6
Experimental set-up.......................................................................................................... 6 2.1
2.1.1 Beaker – Batch tests .................................................................................................. 6
2.1.2 Flow Loop Tests ....................................................................................................... 8
Measurement Techniques ............................................................................................... 10 2.2
2.2.1 Focused Beam Reflection Measurement (FBRM) Probe ....................................... 10
2.2.2 Particle Video Microscope (PVM) Probe ............................................................... 12
Image Processing............................................................................................................ 14 2.3
2.3.1 Image Binarisation .................................................................................................. 16
2.3.2 Circular Hough Transformation (CHT) .................................................................. 18
Uncertainty assessment of image post processing ......................................................... 20 2.4
Uncertainty assessment of FBRM and PVM in polyvinyl chloride reference system ... 21 2.5
3 Experiments (Test Matrix) .................................................................................................... 24
Fluid parameters ............................................................................................................. 24 3.1
Test Matrix ..................................................................................................................... 25 3.2
4 Results and Discussion ......................................................................................................... 27
Beaker Test ..................................................................................................................... 27 4.1
4.1.1 Water-in-Oil Dispersions ........................................................................................ 27
4.1.2 Oil-in-Water Dispersions ........................................................................................ 35
4.1.3 Stabilized water-in-oil dispersion ........................................................................... 39
Flow loop tests ............................................................................................................... 41 4.2

IV
4.2.1 Flow of unstable water-in-oil dispersion ................................................................ 41
4.2.2 Flow of stabilized water-in-oil dispersion .............................................................. 43
5 Conclusion and Future Work ................................................................................................ 48
Conclusion ...................................................................................................................... 48 5.1
Recommendations .......................................................................................................... 49 5.2
6 References: ............................................................................................................................ 50
7 Attachments .......................................................................................................................... 51
Attachment I: Matlab Codes of Post Processing of PVM Images ................................. 51 7.1
Attachment II: Tables and Figures Results (Beaker and Flow Loop test) ..................... 53 7.2

1
Abbreviation
BSD Bubble Size Distribution
CHT Circular Hough Transformation
CLD Chord length distribution
DSD Droplet Size Distribution
d32 Sauter Mean Diameter, [𝜇𝑚]
d43 Momentum-Volume mean Diameter, [𝜇𝑚]
d99 99 Percentile of Maximum Diameter Size, [𝜇𝑚]
dmax Maximum Diameter Size, [𝜇𝑚]
d50 Median diameter of droplet size distribution, [𝜇𝑚]
f Friction factor (fanning)
𝑓(𝑥) Frequency function
FBRM Focused Beam Reflectance Measurement
HX Heat Exchanger
L50 Median Length of Chord Length Distribution, [𝜇𝑚]
PSD Particle Size Distribution
PVC PolyVinyl Chloride
PVM Particle Video Microscope
WC Water Cut
𝜇 Diameter Median of Droplet Size Distribution, [𝜇𝑚]
𝜎 Standard Deviation of Droplet Size Distribution, [𝜇𝑚]

2
1 Introduction
The formation of crude oil-water dispersions (emulsions) during oil transportation in
pipelines has been a challenge due to the higher effective viscosity of the mixture and the
consequent increase in pressure drop. A stable water continuous flow has been found to be a
feasible solution of long distance transport of offshore heavy oil. This is due to the reduced
impact of temperature and oil viscosity on the mixture pressure drop. In contrast, when the oil is
continuous phase, pressure drop is highly affected by temperature and oil viscosity, since the oil
viscosity is changed with temperature. The droplet size in a dispersed oil-water flow has been
found to be one of the key physical parameters that influence the effective (emulsion) viscosity
and the stability of water continuous flow. (Arirachakaran, Oglesby et al. 1989; Angeli and
Hewitt 2000; Lovick and Angeli 2004)
Project Work 1.1
In the specialization project (Khatibi 2012), an experimental investigation of viscous oil-
water flow was performed. This experiment was conducted in medium scale flow loop (I.D. = 69
mm, Length ~ 52 m) at the SINTEF Multiphase Flow Laboratory at Tiller. Primol-352 oil and
salt water were used in the tests, the oil viscosity ranged from 140-180 cp. The focus of this
experiment was on the droplet formation and droplet size development along a horizontal pipe.
Oil droplets were generated via a choke downstream the oil-water mixing location. Different
choke openings were used to test the droplet formation and evolution process. Two FBRM
probes (Lasentec) were installed in the flow line. The experimental data provided the basis for
the model development and validation. These models were the maximum droplet size model, the
friction model and the log-normal distribution model. It was found that while the FBRM could
successfully identify system changes, certain inaccuracies exist in the chord length distributions.
For modeling the flow behavior, it needs to have the accurate droplet size information. In this
context, the future works were suggested to determinate the uncertainty of FBRM technology.
Accurate particle size analysis is a key to study mixing intensity, mixture velocity and the effect
of surfactant on viscos oil-in-water emulsion. The basic instrumentation should be proven to
work satisfactorily in the parameter range studied. The challenging questions are what is the
uncertainty when calculating DSD based on FBRM-CLD measurements? How accurate is it? To
answer these questions, an intensive study on FBRM technology under properly defined
experiment conditions was needed.

3
Aim of the study 1.2
The FBRM probe measures the chord length of the droplets CLD, while the PVM probe
captures the actual droplets diameter DSD. The aim of this report is to study the uncertainty and
limitation of FBRM technology when used to determine the chord length of droplets and provide
a proper correlation to convert CLD to DSD. PVM is used as a direct visual method to test the
reliability of the FBRM results. Two kinds of test were prepared, beaker – batch tests and flow
loop tests. The uncertainty and limitation of PVM technology and image post processing is
evaluated in beaker –batch test. The FBRM and PVM probes were employed in the beaker test to
study the water-in-oil dispersions and the oil-in-water dispersions for a variety of oils spanning
on viscosity. The dynamic behavior for the FBRM and PVM probes were evaluated in beaker
tests and flow loop tests for the flow of water-in-oil dispersion. Surfactant was also added to
stabilize the water-oil emulsion.
Background 1.3
There are limited experimental literatures in this field of study to find out the uncertainty
of FBRM technology. A similar experiment was done on water-oil emulsions, ice and clathrate
hydrate formation. In addition, several mathematical techniques exist to translate the CLD into
its corresponding PSD.
D. Greaves et al. (2008) found that the FBRM gives undersized droplet distribution in
water-oil emulsions. They used PVM to study the uncertainty of CLD measured by FBRM
technology in water emulsions, ice and clathrate hydrate formation. While the FBRM can
successfully identify changes in ice, hydrate nucleation and growth, certain inaccuracies exist in
the CLD. Practically; the FBRM underestimate the droplet size in an emulsion and is unable to
measure full agglomerate sizes. He also suggests that any calibration of the FBRM may be
highly dependent on physical properties such as refractive index and also dispersion quantity
(Greaves, Boxall et al. 2008).

4
Ruf A. Worlischek and Mazzotti (2000) suggested a mathematical expression for a chord length
distribution for spherical particles. A theoretical chord length distribution for each system is
generated by importing the measured particles size distribution into equation 1.1:
𝑞�𝑠,𝑑𝑝� = 𝑠
𝑑𝑝�𝑑𝑝2−𝑠2 𝑓𝑜𝑟 0 < 𝑠 < 𝑑𝑝 (eq.1.1)
Where s is a chord length, dp is the actual particle diameter, and q(s, dp) is the relative
probability of obtaining a chord s given the diameter dp (Ruf, Worlitschek et al. 2001).
Bin Hu et al (2005) defined a physical model to originate the probability density function
of the CLD for a given DSD, and vice versa. The distribution of the drop size R is described by
P(R). The chord length distribution P(L), defined as finding chords of length L among all the
intersected chords, will be governed by the following issues: Firstly, the size distribution
function P(R) of drops in the system; Secondly, the conditional probability function 𝑃(𝐿|𝑅) of
cutting a chord of length L from a drop intersected by the probe with a specific size R; Thirdly,
the biased sampling probability function PB(R), which describes the likelihood that a drop of size
R will be sampled by the probe if a uniform spatial distribution is assumed (Hu, Angeli et al.
2005).
𝑃(𝐿) = ∫ 𝑃(𝐿|𝑅)𝑃𝐵(𝑅)𝑃(𝑅)𝑑𝑅 = ∞0 ∫ 𝑃(𝐿|𝑅)𝑃𝐵(𝑅)𝑃(𝑅)𝑑𝑅∞
𝐿/2 (eq.1.2)
The values of the probability functions 𝑃(𝐿|𝑅),𝑃𝐵(𝑅) depend on the sensor geometry (i.e.
needle-tip probe, optical sensor, or laser sheet), the drop shape, and the drop motion. The
conditional sampling by FBRM is proportional to r (distance of the closest-approach between the
particle center and the probe tip) which leads to:
𝐿 = √𝐷2 − 4𝑟 (eq.1.3)
D=2R (eq.1.4)

5
Mingzhong Li et al. (2006) proposed an effectiveness PSD-CLD model and iterative
inversion method which has been validated by experiments. In this model, it is assumed that all
particles in a given distribution have the same shape. The model represented as a simple matrix
function.
𝐶 = 𝑁𝑝𝑀𝐶𝐴𝑋 = 𝐴𝑋 (eq.1.5)
Where 𝐴 = [𝐴1 … 𝐴𝑗 … 𝐴𝑀]𝑇is a 𝑀 × 𝑁 matrix and 𝐶 = [𝑐1 … 𝑐𝑗 … 𝑐𝑀]𝑇is the
normalized CLD. The matrix A translate the PSD into CLD. 𝑁𝑝is the total number of particles
and 𝑀𝐶 is the total number of measured chords (Li, Wilkinson et al. 2006).
John A Boxall (2010) has estimated a correlation between PVM and FBRM with an
average fitness error of less than 20% given by equation 1.6 and 1.7. The setup was a mixing cell
(0.102m internal diameter, 0.229 m height) with a single six-blade impeller (0.051 m diameter)
50.8 mm from the bottom of the cell. The experiment was for the water droplet size in
continuous crude oil. The water volume fractions were in a range from 10% to 20% and the oil
viscosities were in the range of 1.3 cP-100 cP (Boxall, Koh et al. 2009)
𝑃𝑉𝑀 𝑚𝑒𝑎𝑛 = 0.1481 × (𝐹𝐵𝑅𝑀 𝑚𝑒𝑎𝑛)2 + 2.9804 × (𝐹𝐵𝑅𝑀 𝑚𝑒𝑎𝑛) (eq.1.6)
𝑃𝑉𝑀 𝑚𝑒𝑎𝑛 = 1.1455 × (𝐹𝐵𝑅𝑀 𝑚𝑒𝑎𝑛)1.5469 (eq.1.7)
An average absolute percentage error on polynomial function (eq. 1.6) is 17.2% and on power
law function (eq.1.7) is 17.9%. The process of determining the droplet size from the PVM
images is done by manually measuring of the droplet diameters.
6
2 Method
In this chapter, the experimental set-up, measurement techniques, and image processing will
be described. In addition, the uncertainty of the PVM probe and the codes in image processing
will be evaluated.
Experimental set-up 2.1
The Experiments were performed in two types of arrangement, beaker – batch tests and
flow loop tests.
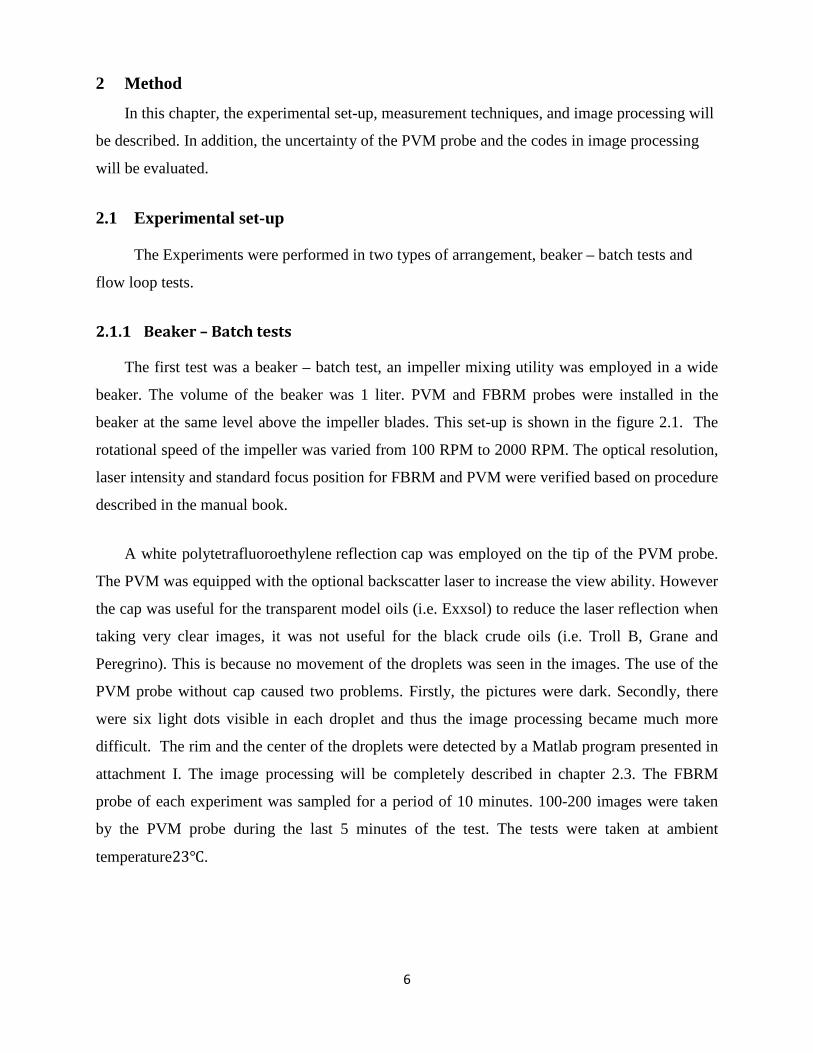
2.1.1 Beaker – Batch tests
The first test was a beaker – batch test, an impeller mixing utility was employed in a wide
beaker. The volume of the beaker was 1 liter. PVM and FBRM probes were installed in the
beaker at the same level above the impeller blades. This set-up is shown in the figure 2.1. The
rotational speed of the impeller was varied from 100 RPM to 2000 RPM. The optical resolution,
laser intensity and standard focus position for FBRM and PVM were verified based on procedure
described in the manual book.
A white polytetrafluoroethylene reflection cap was employed on the tip of the PVM probe.
The PVM was equipped with the optional backscatter laser to increase the view ability. However
the cap was useful for the transparent model oils (i.e. Exxsol) to reduce the laser reflection when
taking very clear images, it was not useful for the black crude oils (i.e. Troll B, Grane and
Peregrino). This is because no movement of the droplets was seen in the images. The use of the
PVM probe without cap caused two problems. Firstly, the pictures were dark. Secondly, there
were six light dots visible in each droplet and thus the image processing became much more
difficult. The rim and the center of the droplets were detected by a Matlab program presented in
attachment I. The image processing will be completely described in chapter 2.3. The FBRM
probe of each experiment was sampled for a period of 10 minutes. 100-200 images were taken
by the PVM probe during the last 5 minutes of the test. The tests were taken at ambient
temperature23℃.

7
Figure2.1: Beaker - Batch test equipped with FBRM and PVM probes.

8
2.1.2 Flow Loop Tests
The second experimental arrangement was a closed flow loop. The flow loop with all the
equipment is shown in figure 2.2. The major components in the system are two FBRM probes,
one located upstream and one located downstream of the flow loop relative to the PVM location,
a PVM probe in the middle of stream line, a low shear pump (high pressure displacement pump,
Universal II series), a Promass 63M coriolis flowmeter (constraint of 0 - 0,5 Kg/s), a Julabo HC
F18 temperature controlled water bath ( Maximum temperature 60°C) as a heat exchanger, and
horizontal pipe sections with 0.0221 m inner diameter (1 inch) and 0.010 m inner diameter (1/2
inch). A pressure transducer was mounted on each pipe section measuring the pressure drop
over a 3m section. The type of heat exchanger was a tube in tube HX. The hot or cold water is
circulated around the pipe and moderates the temperature along the pipeline. All piping in the
system was made of stainless steel and was insulated. Inner diameter and relative roughness of
the pipe in the test section were determined by performing the flow tests of water in the laminar
and turbulent flow regimes.
As shown in the figure 2.3, the preferable orientation of the probe is between 30 and 60°
to the flow. This directs the flow onto the window surface without creating droplet accumulation.
The flow carries droplets close to the window of the best measurement presentation. The pump
was controlled by changing the flow rate (0-0.5 Kg/s) by the computer. The useful values (i.e.
mass flow water, pressure drop along the pipes, temperatures) were collected for further
processing and discussion. The pressure drop and CLD of two FBRM probes in each
experimental test were sampled for a period of 15 minutes. Temperature, mass flow rate and
pressure drop were measured for every 5 seconds. The 100-200 images were taken by PVM
probe in last 5 minutes of the test to ensure that the flow had developed and was in a steady state.
Details regarding the droplet size measurements (FBRM and PVM) are given in section 2.2. The
tests were taken at ambient temperature23℃.

9
Figure2.2: Schematic illustration of the close flow loop system.
Figure 2.3: Position of the probes in the pipe.
ΔP (3 m)
T, P
Flowmeter Low shear pump
Heat exchanger
Expansion tank
Pipeline ID 20mm, 6m
Stainless steel, insulated pipe
(ID 20mm, insulated) PVM probe
Flow Direction
FBRM Probe-Downstream
FBRM Probe-Upstream
ΔP (3 m) Pipeline ID 10mm, 6m
10
Measurement Techniques 2.2
The two main measurement devices, namely the FBRM probe and the PVM probe, will be
described in details. These probes can provide in situ droplet characterization at high pressures. It
is important to understand how these two measurements work and what procedure they use to
measure the droplet size.
2.2.1 Focused Beam Reflection Measurement (FBRM) Probe
The direct measurement of droplet size and its distribution in the flow condition has been
a challenge for a long time. Figure 2.4 shows the FBRM Technology (focused beam reflectance
measurement). It provides a real time measurement method for changes in droplets dimension
and droplets count. On the other hand, it tracks the rate and degree of change in time at full
process concentration. The FBRM calculates chord length of the droplets. A chord length (a
fundamental measurement of particle dimension) is simply defined as the straight line distance
from one edge of a droplet to another edge as shown in figure 2.5. A rotating optical lens at the
probe tip deflects the laser. The laser emitted is reflected when it scans across the surface of a
particle. Thousands of individual chord lengths are typically measured each second to produce
the CLD (O’SULLIVAN, SMITH et al. 2010). The focal point of the FBRM laser can be
adjusted into the fluid (+) or inside the probe(−). The focal point position is −20µm for the
standard FBRM (Group 2004). Heath et al. (2002) discovered the impact of the focal point
position on the FBRM measurements, perceiving that changing the focal point more into the
fluid increased the number of measured longer chords due to larger particles being less able to
approach the measurement window (Heath, Fawell et al. 2002). Turner (2005) recommended that
the coarse setting would be more sensitive to agglomerate sizes than primary particle sizes
compared to the fine setting, bypassing less detectable edges (Turner 2005).

11
Figure2.4: FBRM probe (Tuner, 2005).
Figure2.5: Intensity profile in measuring the chord length of a particle (Tuner, 2005).

12
2.2.2 Particle Video Microscope (PVM) Probe
PVM Technology is a particle video microscope. It provides in situ digital images and
visualizes how particles and droplets are changing as they naturally exist in process. Figure 2.6
shows a PVM probe with high resolution CCD camera and internal illumination source to obtain
high quality images even in dark and concentrated suspension or emulsions. The system consists
of six independent laser sources arranged circularly in angles of 60° around the objective tube.
The probe records digital images of the illuminated lasers with a field view of 1075µm × 850
µm. Figure 2.7 shows how the PVM probe captures images in focus and defocus of the
collecting lens. The collecting lens should always be tuned to capture a visible image in detecting
the rim of droplets. There is a tunable screw (micrometer adjustment) on top of the CCD camera.
This gives us the possibility to tune the collecting lens in focus by looking at the monitor.
Figure2.6: PVM probe (PVM manual, 2012).

13
Figure2.7: Illustration of being in focus and defocus of the droplets in PVM probe (PVM manual, 2012).
14
Image Processing 2.3
Post processing of PVM images was done in Matlab programming software. The main
goal of image post processing is to accurately detect the rims of the droplets, measure the
diameter of the droplets and give the DSD as an output. It is important to get the accurate
approach in the image analysis and understand how Matlab script interprets the images to get the
right distribution.
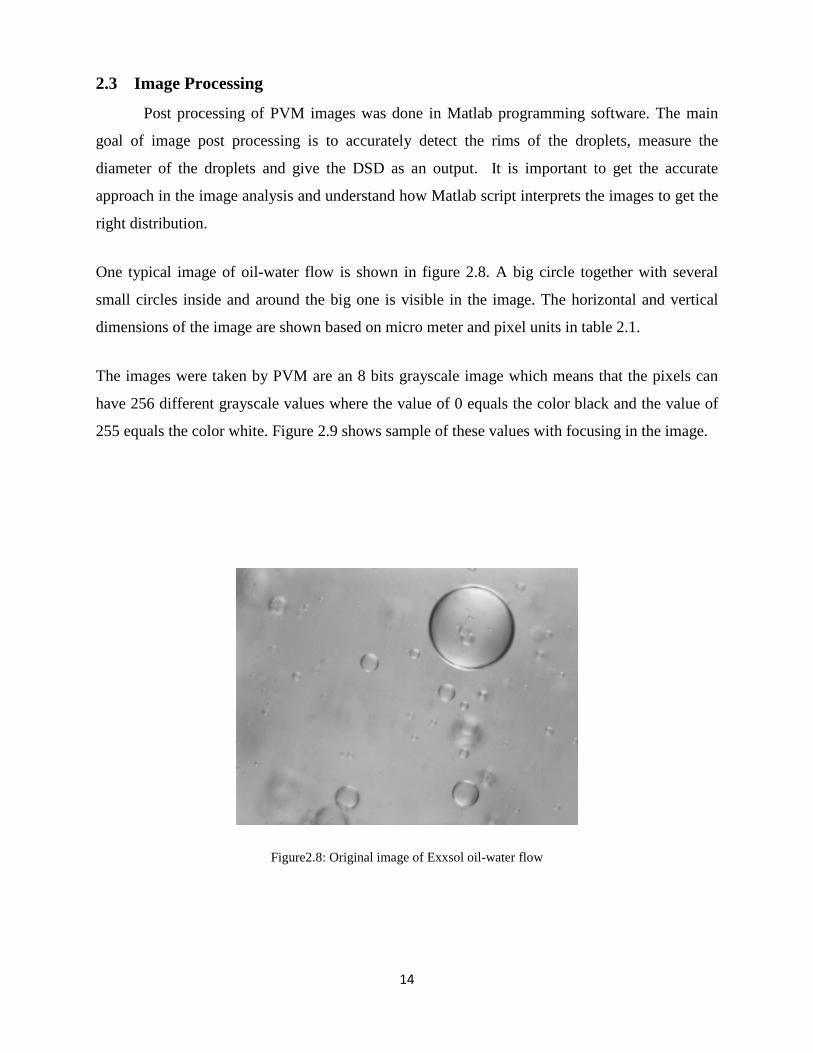
One typical image of oil-water flow is shown in figure 2.8. A big circle together with several
small circles inside and around the big one is visible in the image. The horizontal and vertical
dimensions of the image are shown based on micro meter and pixel units in table 2.1.
The images were taken by PVM are an 8 bits grayscale image which means that the pixels can
have 256 different grayscale values where the value of 0 equals the color black and the value of
255 equals the color white. Figure 2.9 shows sample of these values with focusing in the image.
Figure2.8: Original image of Exxsol oil-water flow

15
Table 2.1: Horizontal and Vertical dimensions of the images
Description Value
Horizontal dimension of imaging volume 1075 μm
Vertical dimension of imaging volume 850 μm
Number of horizontal CCD pixels 680 Pixels
Number of vertical CCD pixels 512 Pixels
Figure2.9: Magnifier image with pixels grayscale.
16
As can be seen in the figure 2.9, the pixels of some parts of the droplet rim are very dark
compared to the inside or outside of the droplets. The droplet features cannot be related to
specific grayscale value because of having bright pixel values in the droplet and the dark pixel
values in and out of droplets. So a sophisticated solution is required to detect the droplets. The
algorithm used to detect the droplets is described below:
• Image binarisation (adjustment, morphological opening on grayscale, dilating images)
• Edge detection by Circular Hough Transformation, CHT (object polarity, sensitivity and
computation method)
• Reverse Circular Hough Transformation, RCHT
• Sum-up and diameter measurement collection
• Histogram anaylsis – DSD output
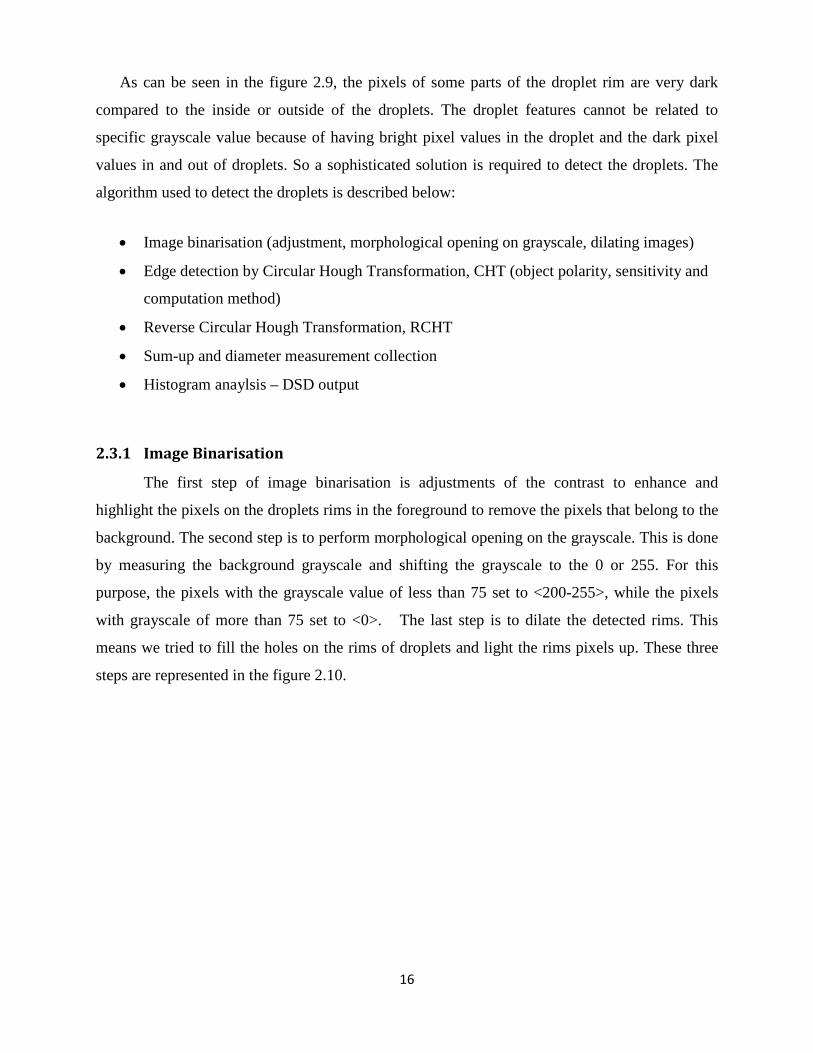
2.3.1 Image Binarisation
The first step of image binarisation is adjustments of the contrast to enhance and
highlight the pixels on the droplets rims in the foreground to remove the pixels that belong to the
background. The second step is to perform morphological opening on the grayscale. This is done
by measuring the background grayscale and shifting the grayscale to the 0 or 255. For this
purpose, the pixels with the grayscale value of less than 75 set to <200-255>, while the pixels
with grayscale of more than 75 set to <0>. The last step is to dilate the detected rims. This
means we tried to fill the holes on the rims of droplets and light the rims pixels up. These three
steps are represented in the figure 2.10.
17
Figure2.10: Features of steps in image Binarisation
Adjustment
Morphological Opening on Grayscale
Dilating

18
2.3.2 Circular Hough Transformation (CHT)
The circular Hough transformation is defined as an equation for circle that relies on three
parameters which are a radius (r) and two dimensions (a and b) representing the coordinate of
the circle. The equation of a circle is written as:
𝑟2 = (𝑥 − 𝑎)2 + (𝑦 − 𝑏)2 (eq.2.1)
The parametric variable of the circle is written as equation 2.2:
𝑥 = 𝑎 + 𝑟 × cos(𝜃)
𝑦 = 𝑎 + 𝑟 × sin(𝜃) (eq.2.2)
The CHT is used as a 3D array vector with the two dimensions (representing center
coordinate) and the radius (𝑥,𝑦, 𝑟). For each edge point, a circle is drawn. The values in the array
are increased every time and a circle is drawn with the desired radius over every edge point. The
accumulator keep counts of how many circles pass through coordinates of each edge point. The
highest count is considered as a diameter of the circles. The coordinates of these highest radius is
considered as coordinates center of the circle. Three parameters were considered in this
detection. The first one is the object polarity that indicates whether the circular rim is brighter
than background. Only circles with the fraction of white pixels larger than 70% (i.e. grayscale
value = 178) are accepted. This means only circles that are centered on the brightest spots of the
original images are considered for calculation of DSD. The second parameter is a sensitivity
factor of the circular Hough transform accumulator array. Higher sensitivity value means higher
risk of false detection. The Third one is the computational method of the accumulator array.
“Two-Stage” was chosen to compute the CHT accurately. (Baier 2001; Rizon, Haniza et al.
2005).
The reversed Hough transform converts the obtained circles to the image containing
circles of radius r. Finally all the diameters are summed up by the for-loop and saved in the excel
file for the later calculation of DSD. The histogram distribution analysis according to the DSD
range (FBRM: 1-1000 µm) was done in excel sheet. The summary of this procedure for detection
of the circles is shown in the figure 2.11. The codes in Matlab software are described in the
attachment I.

19
Figure2.11: CHT and RCHT of image processing, diameter collection, and Histogram analysis.
20
Uncertainty assessment of image post processing 2.4
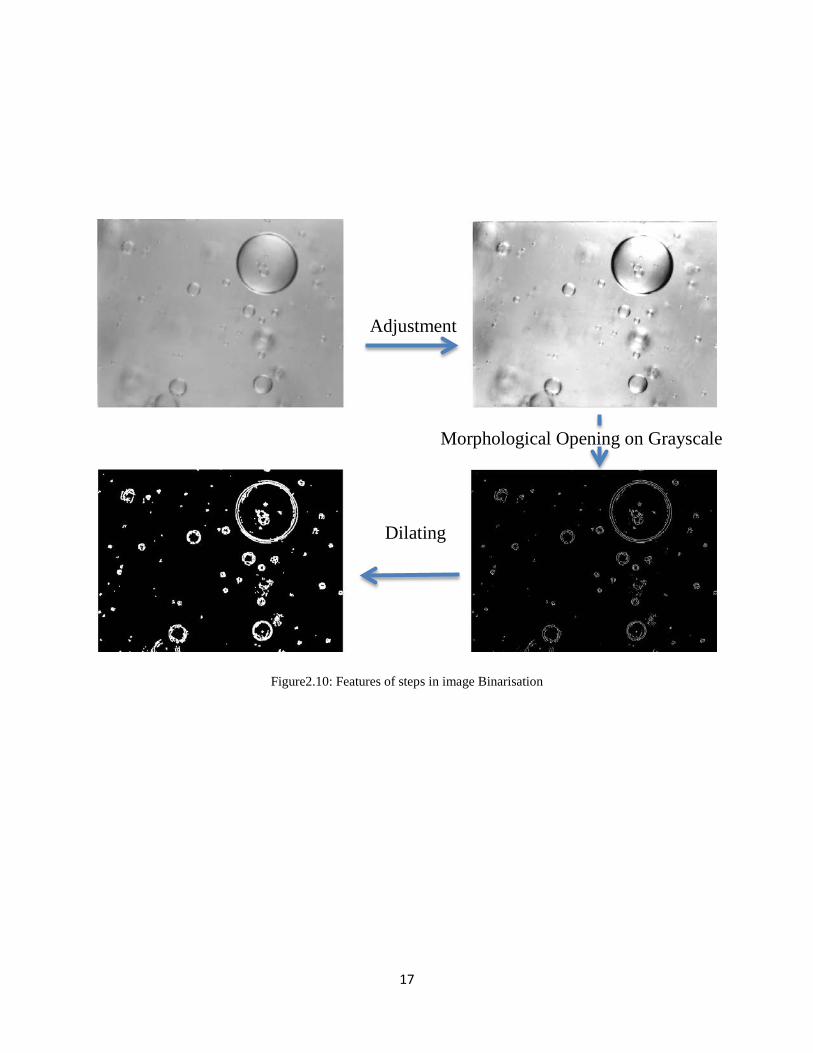
The main issue of post processing is to check the uncertainty and limitation of the Matlab
script in detecting the droplets. To find out how accurate this post processing is, several samples
were chosen. These images were opened and measured manually in IC-FBRM software and then
the results were compared with Matlab results. The IC-FBRM is a software for controlling the
FBRM probes, monitoring and collecting the raw data in an excel file.
The comparison between DSD from Matlab analysis and DSD from manual calculation is
done for different oils to verify the Matlab calculation. The size of population in counting the
droplets is one of the key in calculating the uncertainty. The size of population for Matlab
Analysis is around 1000 and the size of population for Manual distribution is around 800. The
higher the number of counting, the more precise the DSD will be. Figure 2.12 represents the
trends of Matlab and manual calculation of DSD with parametric studies of d32 and d99 for
Exxsol, Troll B and Grane oils. As can be seen in the figure, the trend of d32 and d99 shows the
accuracy of Matlab analysis very well. 0% to 7% uncertainty is found and is mostly due to the
unclear images captured from the crude oils.
Figure 2.12: Comparison of the d32 (in the left graph), and d99 (in the right graph) calculated from Matlab analysis with d32, and d99 calculated from manual measurement in IC-FBRM software for Exxsol, Troll B and Grane oils at
different WC (10% -90%)

21
Uncertainty assessment of FBRM and PVM in polyvinyl chloride reference 2.5system
The polyvinyl chloride (PVC) suspended at 8.33% mass fraction in water phase was
provided as a calibration reference sample. The reference particle size distribution (Reference
PSD) was also prepared from Lasentec/Mettler Toledo. The beaker test was employed with the
mixing velocity of 400 rpm. The raw data measured with FBRM and PVM probes were used to
evaluate the uncertainty of the chord length distribution (CLD) and the particle size distribution
(PSD) in comparison with the Reference PSD in the PVC system. The PVM images were
analyzed with the PVM software. The shapes of particles were not round and could not be
detected with the Matlab script, so the blob algorithm in the PVM software, made by the Mettler
Toledo Company, was utilized for detecting the particles in the PVC system. In addition, the
normalized volume distribution is utilized for comparison the CLD, the PSD and the Reference
PSD in figure 2.13. As can be seen in normalized distribution, both the CLD and the PSD
profiles are closely matched to the Reference PSD profile, while in the cumulative distribution,
the PSD is matched better to the reference PSD for the big particles. Table 2.2 represents the
parametric studies of d32, d43, and d99 for CLD, PSD, and Reference PSD. The maximum
diameter d99 in CLD is larger than d99 in Reference PSD, while it is almost the same for PSD and
the Reference PSD (𝑑99 = 397𝜇𝑚). In contrast, the d32 is larger for the PSD than the CLD in
comparison with the d32 in the Reference PSD. The figure 2.14 is a normalized abundance for the
CLD and the Reference PSD. As can be seen, very small particles (1µm < Cord Length <
10µm) are detected by FBRM that gives an uncertainty in the particle sizing.

22
Figure 2.13: Normalized volume and cumulative volume of the CLD measured with the FBRM probe, the PSD measured with the PVM probe, and the Reference PSD from PVC system.
Table 2.2: Main parametric studies d32, d43, and d99 on the Reference PSD from the PVC system, the CLD measured with the FBRM probe and the PSD measured with the PVM probe.
Distributions d32 d43 d99
Reference PSD – PVC System 153 182 397
CLD – FBRM probe 175 214 484
PSD – PVM probe 189 207 371

23
Figure 2.14: Normalized Abundance of the CLD measured with the FBRM probe and the Reference PSD from the PVC system.
1𝜇𝑚 < 𝐶𝐿 < 10𝜇𝑚

24
3 Experiments (Test Matrix)
In this chapter the fluid properties used in the experiments, test matrix, and variable parameters changed in beaker – batch test and flow loop test are described.
Fluid parameters 3.1
The liquids in this study were Exxsol oil, Troll B oil, Grane oil, Pregrino oil and water
(3.5% NaCl). Table 3.1 shows the material information of these oils. Some tests were tried to be
done with Pregrino oil for this study. Due to the high stickiness of this oil, it stuck on the lenses
of both the FBRM and the PVM probes and reduced the accuracy of measurement. At high water
cut (more than 60 %), the viscosity and the stickiness of the oil increased rapidly and converted
to tar. the fluids in the beaker distinct to separate tar and water. This also caused the tar stuck to
the glass, the rod and the blades of the impeller, and then the impeller started to rotate the beaker.
So the test stopped. The experiment continued with Grane oil which also has a high viscosity but
it is not sticky.
Table 3.1: Fluid properties at atmospheric pressure and temperature
Fluids
Density (tabulated)
[kg/m3]
Dynamic Viscosity
[cP] (@23°C)
Kinematic Viscosity
[mm2/s] (@23°C)
Shear rate
[S-1] (@23°C)
Water + 3.5% NaCl ~1023 1 1 -
Exxsol D60 786 1.3 1.65 1047
Exxsol + 0.1% Span 80 786 1.3 1.65 1045
Troll B 895 24.5 27.5 355
Grane 934 245 262 47.8
Pregrino 925 (@50°C) 391.5 (@50°C) 423 27.3
25
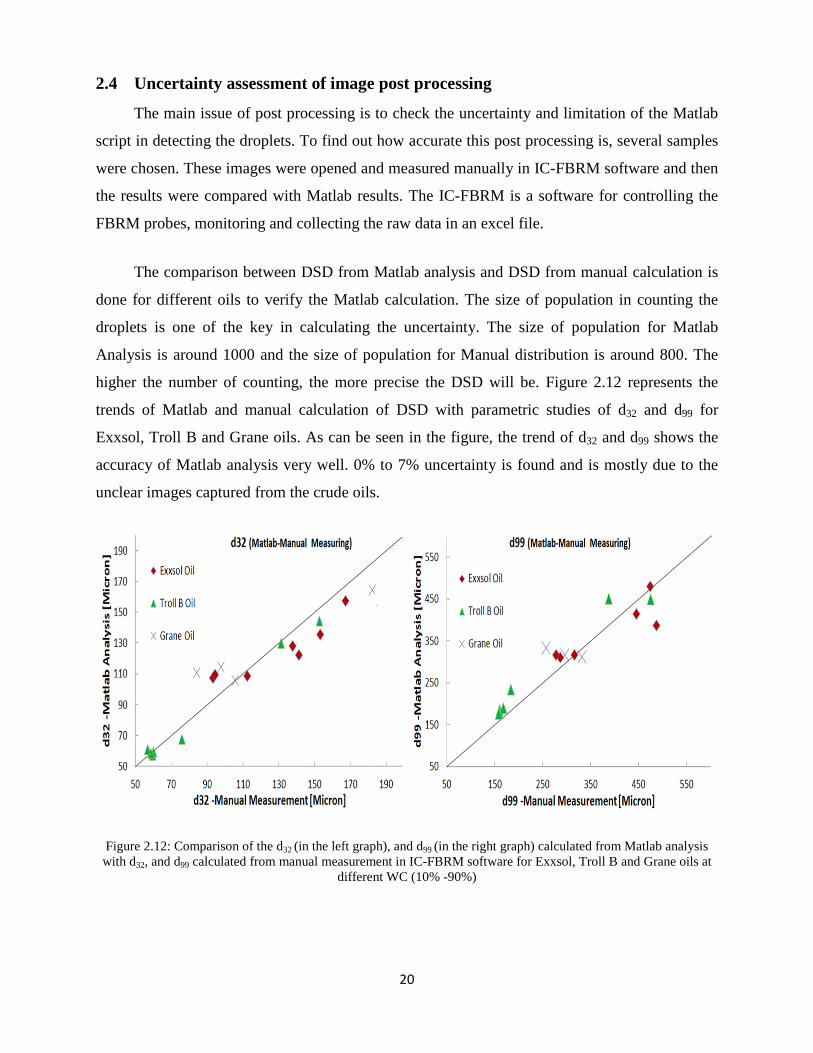
Test Matrix 3.2
The parameters that were varied in beaker - batch test are:
• Oil • Surfactant • Mixture velocity • Water cut (volume of water divided to the total volume)
A summary of the set parameters for beaker test are shown in table 3.2.
Table 3.2: Overview of the experimental set-parameters used in beaker – batch test. Column 1: mixer, column 2: various oils, column 3: nominal mixture velocity, column 4: nominal water cut.
Mixer Oils Umix [RPM] WC [%]
Impeller Exxsol 1500 10, 30, 40, 50, 60, 70, 90
Impeller Troll B 1500 10, 30, 40, 50, 60, 70, 90
Impeller Grane 1500 10, 30, 40, 50, 60, 70, 90
Impeller Pregrino 1500 10,30,40,50,60
Impeller Exxsol 400, 700 , 1000, 1300, 1500,
1700, 2000 10, 20
Impeller Exxsol + 0.1% Span 80 400, 700 , 1000, 1300, 1500,
1700, 2000 10, 20

26
The parameters that were varied in flow loop test are:
• Surfactant (with and without Span 80) • Mass flow rate [kg/s]
A summary of the set parameters for flow loop test are shown in table 3.3.
Table 3.3: Overview of the experimental set-parameters used in flow loop test. Column 1: mixer, column 2: Exxsol with and without surfactant, column 3: nominal mass flow rate, column 4: nominal water cut.
Mixer Oils Mass Flow rate [Kg/s] Umix [m/s] WC
Shear Pump Exxsol 0.064, 0.136, 0.196, 0.247, 0.0297, 0.326 0.16, 0.33, 0.47, 0.59, 0.70, 0.77 10%
Shear Pump Exxsol + 0.05% Span 80 0.075, 0.138, 0.192 0.18, 0.33, 0.46 10%
Shear Pump Exxsol + 0.1% Span 80 0.080, 0.141, 0.194 0.19, 0.34, 0.47 10%

27
4 Results and Discussion
In this chapter, the results of both beaker test and flow loop test are used to study the
uncertainty of CLD measured by FBRM probe. Normalized volume distributions and cumulative
distributions are used to develop proper correlations to convert the CLD to the DSD for water-in-
oil dispersion and oil-in-water dispersion flow. The surfactant was added at water cut 10% to
study the dynamic change of CLD and DSD at different velocities. In addition, the flow loop test
and the beaker test are compared in the last chapter.
Beaker Test 4.1
In the beaker test, the CLD and DSD at Water cut 10% - 30% are chosen to study the
uncertainty of FBRM on water-in-oil dispersion flow and water cut 70% - 90% are chosen to
study the uncertainty of FBRM on oil-in-water dispersion flow. All the calculations were done
based on volume distribution. The important parameters of droplet distribution such as square
weighted diameter d32, and d99 (99 percentile size of droplet distribution) are calculated to
develop the distribution models and correlations. The d99 from CLD and d99 from DSD are
estimated as maximum droplet size.
4.1.1 Water-in-Oil Dispersions
In this part of the study, the uncertainty of CLD using FBRM probe in water-in-oil
dispersion is evaluated. The experimental data of the beaker test at water cut 10% and 30% are
chosen. The CLD and DSD of the water-in-oil dispersion are shown for Exxol oil and Troll B oil
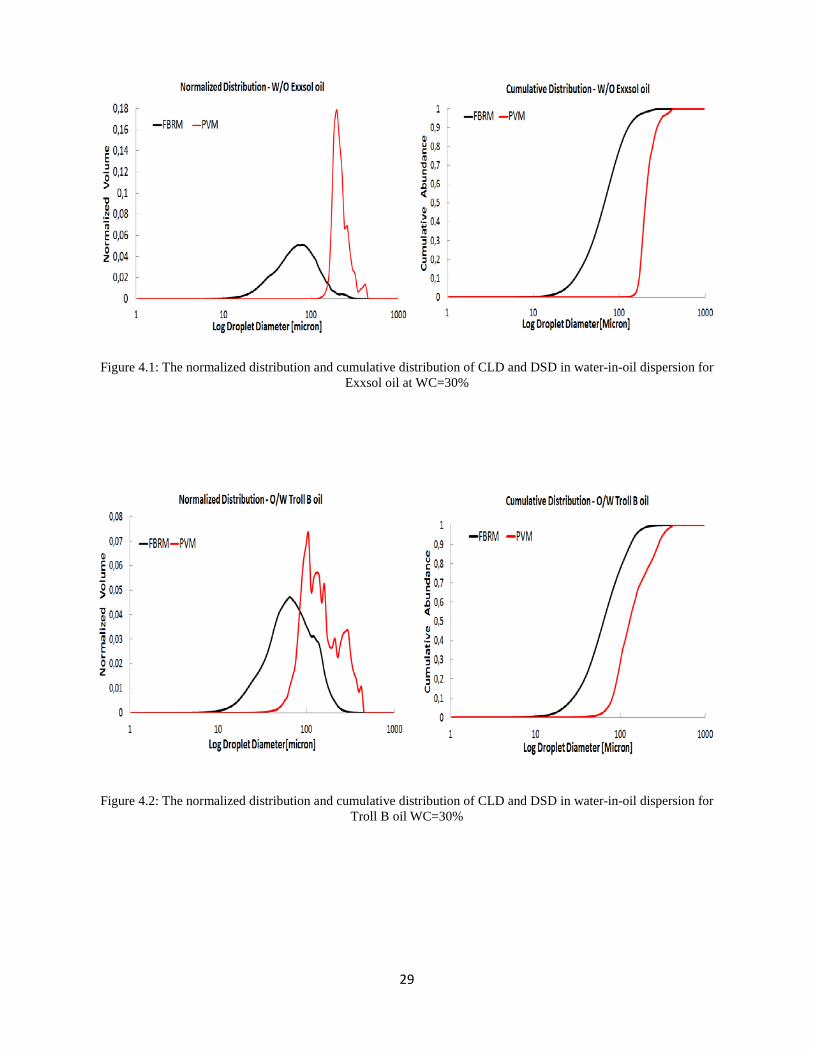
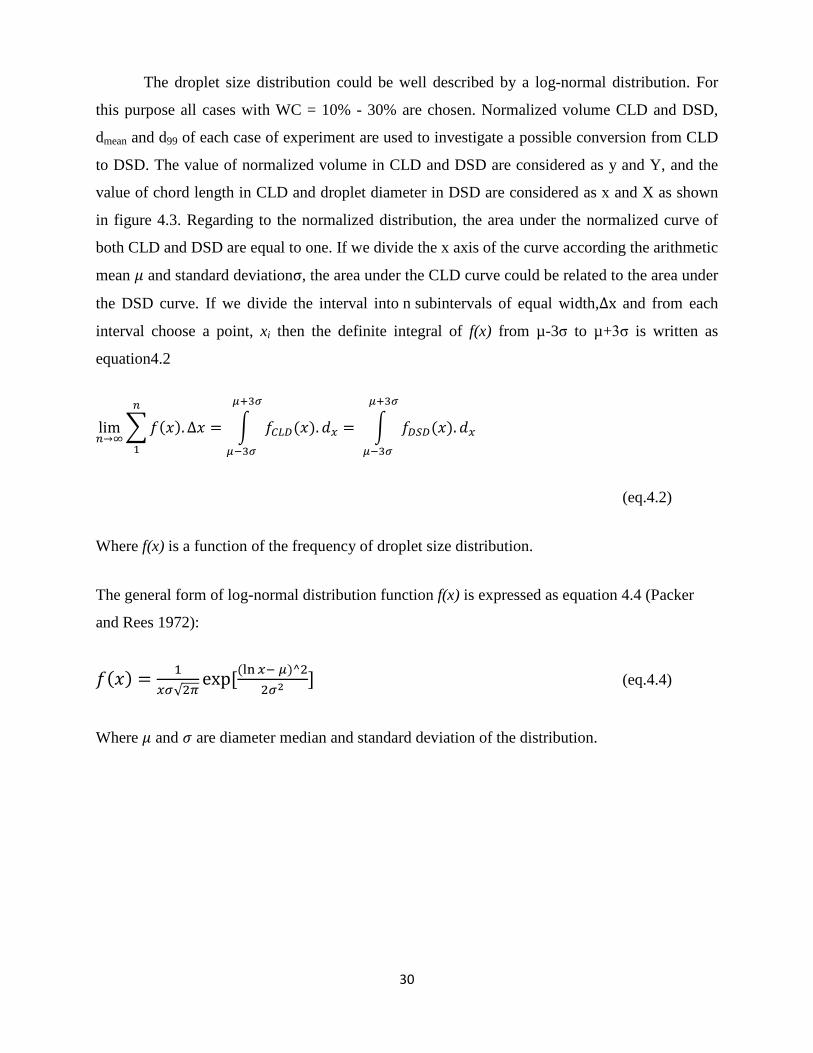
in figure 4.1 and 4.2. In the left pictures the normalized volume distribution of droplets are
shown. The CLD profile is flatten for both oils; this means the FBRM probe measures a wide
range of droplet size. In contrast, the DSD profile is narrow with higher abundance; this means
the PVM probe measures the accurate droplet size in limited range which can be supported by
images in attachment II. In the right pictures the cumulative distribution of both CLD and DSD
are shown. The chord length cumulative distribution extends well beyond the size of the droplets.
In addition, the FBRM probe detected small droplets less than 50 micron which were not
captured in the PVM images; however, the droplet size distribution is vastly undersized by the
FBRM probe.

28
The difference of d32 and the difference of d99 in CLD and DSD are calculated as equation 4.1.
𝑑32−𝐷𝑖𝑓𝑓𝑒𝑟𝑒𝑛𝑐𝑒 = 𝑑32−𝐷𝑆𝐷− 𝑑32−𝐶𝐿𝐷𝑑32−𝐷𝑆𝐷
𝑑99−𝐷𝑖𝑓𝑓𝑒𝑟𝑒𝑛𝑐𝑒 = 𝑑99 𝑣𝑜𝑙𝑢𝑚𝑒 −𝐷𝑆𝐷− 𝑑99 𝑣𝑜𝑙𝑢𝑚𝑒−𝐶𝐿𝐷𝑑99 𝑣𝑜𝑙𝑢𝑚𝑒−𝐷𝑆𝐷
(eq. 4.1)
The table 4.1 shows the average of differences in d32 and d99 between CLD and DSD.
The difference in d99 is higher for Troll B oil than the Exxsol oil, while the Troll B oil has the
lower differences in d32 than the Exxsol oil. The reason of this behavior could be due to be
different type of oils. The Troll B is a kind of black crude oil and more viscos than Exxsol oil,
while Exxsol oil is a transparent model oil. For the cases with Grane oil, The PVM images were
not captured clearly because the droplets were not clear at low water cut due to darkness and
high viscosity of Grane oil, hence it was not possible to draw the distributions for this oil.
Table 4.1: Average of differences in d32 and d99 between CLD and DSD for water-in-oil dispersions
Oil Speed WC d32-CLD d32-DSD d99volume-CLD d99volume-DSD Average
d32-Difference
Average
d99 –Difference
- RPM % 𝜇𝑚 𝜇𝑚 𝜇𝑚 𝜇𝑚 % %
Exxsol 1500 30 63 213 227 401 70 43
Troll B 1500 30 33 103 151 320 68 53
29
Figure 4.1: The normalized distribution and cumulative distribution of CLD and DSD in water-in-oil dispersion for Exxsol oil at WC=30%
Figure 4.2: The normalized distribution and cumulative distribution of CLD and DSD in water-in-oil dispersion for Troll B oil WC=30%
30
The droplet size distribution could be well described by a log-normal distribution. For
this purpose all cases with WC = 10% - 30% are chosen. Normalized volume CLD and DSD,
dmean and d99 of each case of experiment are used to investigate a possible conversion from CLD
to DSD. The value of normalized volume in CLD and DSD are considered as y and Y, and the
value of chord length in CLD and droplet diameter in DSD are considered as x and X as shown
in figure 4.3. Regarding to the normalized distribution, the area under the normalized curve of
both CLD and DSD are equal to one. If we divide the x axis of the curve according the arithmetic
mean 𝜇 and standard deviationσ, the area under the CLD curve could be related to the area under
the DSD curve. If we divide the interval into n subintervals of equal width,∆x and from each
interval choose a point, xi then the definite integral of f(x) from µ-3σ to µ+3σ is written as
equation4.2
lim𝑛→∞
�𝑓(𝑥).∆𝑥𝑛
1
= � 𝑓𝐶𝐿𝐷(𝑥).𝑑𝑥
𝜇+3𝜎
𝜇−3𝜎
= � 𝑓𝐷𝑆𝐷(𝑥).𝑑𝑥
𝜇+3𝜎
𝜇−3𝜎
(eq.4.2)
Where f(x) is a function of the frequency of droplet size distribution.
The general form of log-normal distribution function f(x) is expressed as equation 4.4 (Packer
and Rees 1972):
𝑓(𝑥) = 1𝑥𝜎√2𝜋
exp [(ln 𝑥− 𝜇)^22𝜎2
] (eq.4.4)
Where 𝜇 and 𝜎 are diameter median and standard deviation of the distribution.

31
Figure 4.3: Normalized CLD and DSD of Exxsol at water cut 30%.
The Sauter mean diameter d32 of DSD agreed very well with the mean droplet diameter
(µ) for the best fit log normal distribution. An average absolute percentage error between the two
means is 2.3%. Based on normal droplet size distribution model, the arithmetic mean 𝜇 and
standard deviation 𝜎 can be calculated with equation 4.5. These equations are closely matched to
the experimental data of CLD and DSD.
𝜇𝐶𝐿𝐷 = ln𝑑32−𝐶𝐿𝐷 , 𝜇𝐷𝑆𝐷 = ln𝑑32−𝐷𝑆𝐷
𝜎𝐶𝐿𝐷 = �2 ∗ (ln𝑑43−𝐶𝐿𝐷 − ln𝑑32−𝐶𝐿𝐷)
𝜎𝐷𝑆𝐷 = �2 ∗ (ln𝑑43−𝐷𝑆𝐷 − ln𝑑32−𝐷𝑆𝐷) (eq.4.5)
Where Sauter mean diameter d32 and moment–volume mean diameter d43 are defined as equation
4.6:
𝑑32 = ∑ 𝑁𝑖×𝑑3𝑛1
∑ 𝑁𝑖×𝑑2𝑛1
𝑑43 = ∑ 𝑁𝑖×𝑑4𝑛1
∑ 𝑁𝑖×𝑑3𝑛1
(eq.4.6)

32
Where 𝑁𝑖 is the abundance of the droplets size.
The correlations for 𝑑32 and 𝑑43 with d99 in DSD are calculated in equation 4.7 and shown in
figure 4.4. The d99 is considered as maximum droplet diameter.
𝑑32 = 0,43 ∗ 𝑑99
𝑑43 = 0,47 ∗ 𝑑99
(eq.4.7)
Figure 4.4: The correlation between d32 with d99 based on volume distribution in the left picture and the correlation
between d43 with d99 based on volume distribution in the right picture.

33
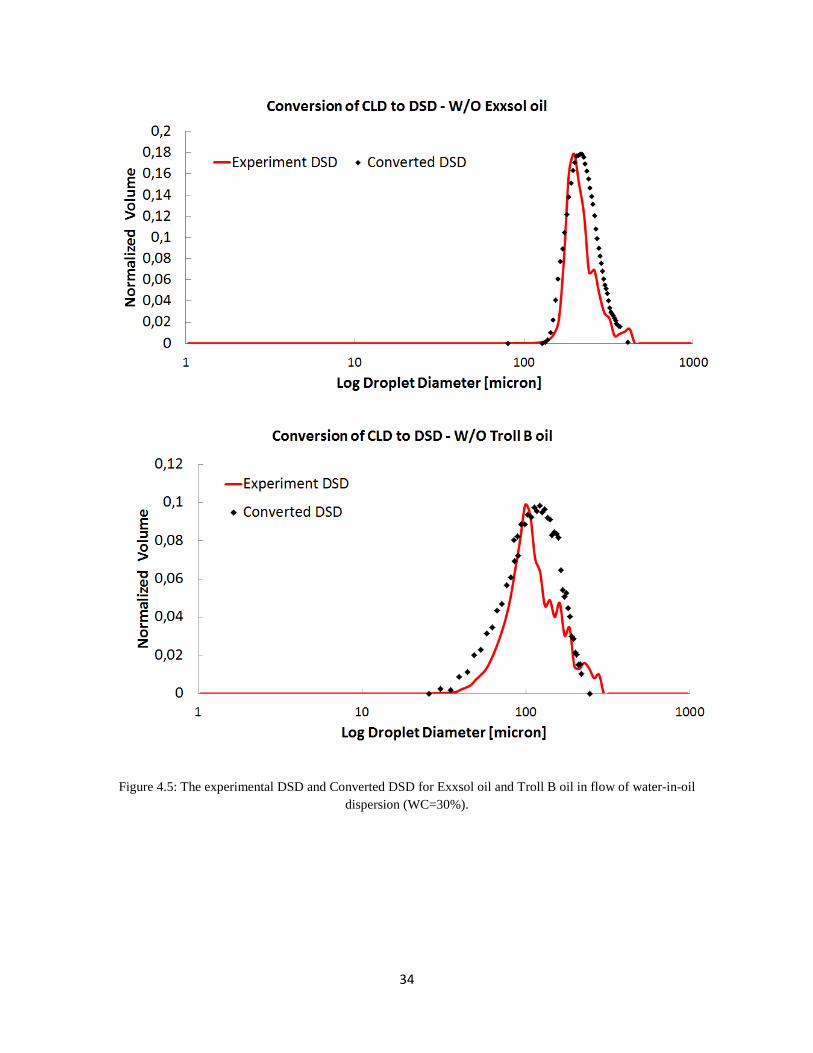
The convert CLD-DSD model is developed as shown in equation 4.8. The conversion of
CLD to DSD for Exxsol oil and Troll B oil at WC=30% are calculated based on n = 40
subinterval in integral and shown in figure 4.5. The conversion will be more accurate by
increasing subintervals. The converted DSD is closely matched to the experimental DSD that
confirms the robustness of these correlations.
1 ≤ 𝑥 ≤ 𝜇 − 2𝜎 → �́� − 3�́� ≤ 𝑋 ≤ �́� − 2�́� , 𝑌1 = 0, (𝑌1 + 𝑌2) = (𝑦1+𝑦2)(𝑥2−𝑥1)(𝑋2−𝑋1)
𝜇 − 2𝜎 < 𝑥 ≤ 𝜇 − 1.8𝜎 → �́� − 2�́� < 𝑋 ≤ �́� − 1.8�́� , (𝑌�́�−2�́� + 𝑌�́�−1.8�́�) =(𝑦𝜇−2𝜎 + 𝑦𝜇−1.8𝜎)(𝑥𝜇−2𝜎 − 𝑥𝜇−1.8𝜎)
(𝑋�́�−2�́� − 𝑋�́�−1.8�́�)
…
𝜇 < 𝑥 ≤ 𝜇 + 0.2𝜎 → �́� < 𝑋 ≤ �́� + 0.2�́� , (𝑌�́�−2�́� + 𝑌�́�−1.8�́�) =(𝑦𝜇 + 𝑦𝜇+0.2𝜎)(𝑥𝜇 − 𝑥𝜇+0.2)
(𝑋�́� − 𝑋�́�+0.2)
…
𝜇 + 2.8𝜎 < 𝑥 ≤ 𝜇 + 3𝜎 ≈ 𝑑99 → �́� + 2.8�́� < 𝑋 ≤ �́� + 3�́� ≈ 𝑑99́́ , … (eq.4.8)
34
Figure 4.5: The experimental DSD and Converted DSD for Exxsol oil and Troll B oil in flow of water-in-oil dispersion (WC=30%).

35
4.1.2 Oil-in-Water Dispersions
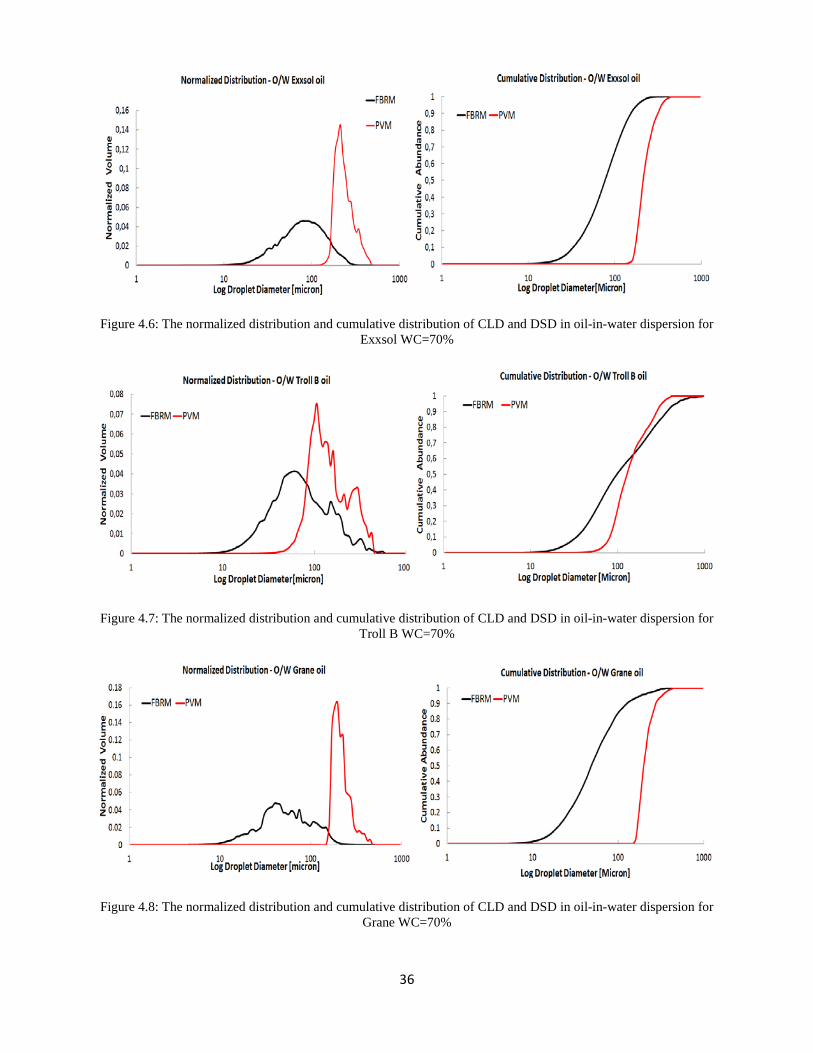
In this part of the study, the uncertainty of CLD using FBRM probe in oil-in-water
dispersion is evaluated. The experiment data of beaker test at water cut 70% and 90% are chosen.
The CLD and DSD of the oil-in-water dispersion are shown for Exxol oil, Troll B oil and Grane
oil in figure 4.6, 4.7 and 4.8. In the left pictures the normalized volume distribution of droplets
are shown. It is also clear here that the FBRM probe detects small droplets less than 50 micron
which they were not captured in the PVM images, while the droplet size distribution is
undersized by the FBRM technology. The difference of d32 and the difference of d99 in CLD and
DSD are also calculated based on equation 4.1. The table 4.2 shows the average of differences in
d32 and d99 between CLD and DSD of the oils. The average of differences in d99 is lower for the
Exxsol oil (43%) and higher for the Grane oil (59%), while the differences in d32 is almost the
same for these oils. The reason could be because of different types of oil. Troll B is a black crude
oil and more viscos than Exxsol oil, However, Grane oil is much more viscos than Troll B.
Exxsol is a transparent model oil. For the Grane oil, The PVM images were captured very clearly
because the oil droplets are big and have very clear rims in water phase.
Table 4.2: Average of differences in d32 and d99 between CLD and DSD for oil-in-water dispersions
Oil Speed WC d32-CLD d32-DSD d99volume-CLD d99volume-DSD Average
d32-Difference
Average
d99 -Difference
- RPM % 𝜇𝑚 𝜇𝑚 𝜇𝑚 𝜇𝑚 % %
Exxsol 1500 70 68 225 235 411 70 43
Troll B 1500 70 36 128 202 394 72 49
Grane 1500 70 66 215 175 400 69 56
36
Figure 4.6: The normalized distribution and cumulative distribution of CLD and DSD in oil-in-water dispersion for Exxsol WC=70%
Figure 4.7: The normalized distribution and cumulative distribution of CLD and DSD in oil-in-water dispersion for Troll B WC=70%
Figure 4.8: The normalized distribution and cumulative distribution of CLD and DSD in oil-in-water dispersion for Grane WC=70%
37
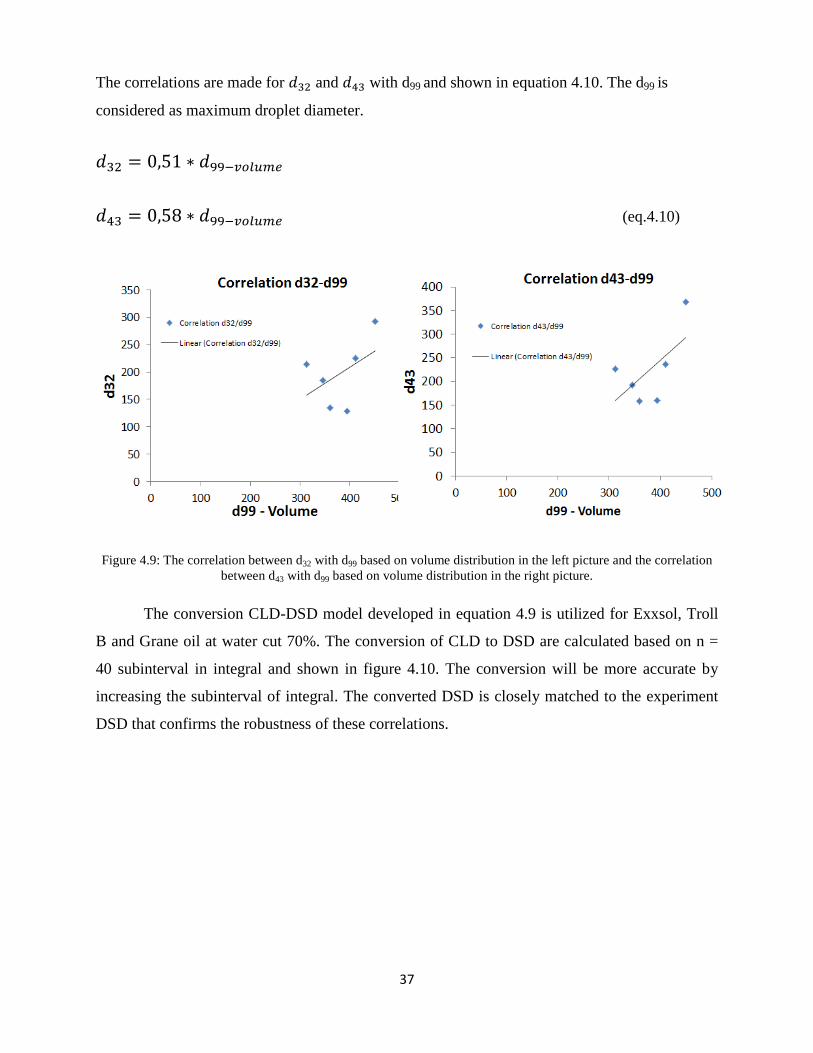
The correlations are made for 𝑑32 and 𝑑43 with d99 and shown in equation 4.10. The d99 is
considered as maximum droplet diameter.
𝑑32 = 0,51 ∗ 𝑑99−𝑣𝑜𝑙𝑢𝑚𝑒
𝑑43 = 0,58 ∗ 𝑑99−𝑣𝑜𝑙𝑢𝑚𝑒 (eq.4.10)
Figure 4.9: The correlation between d32 with d99 based on volume distribution in the left picture and the correlation between d43 with d99 based on volume distribution in the right picture.
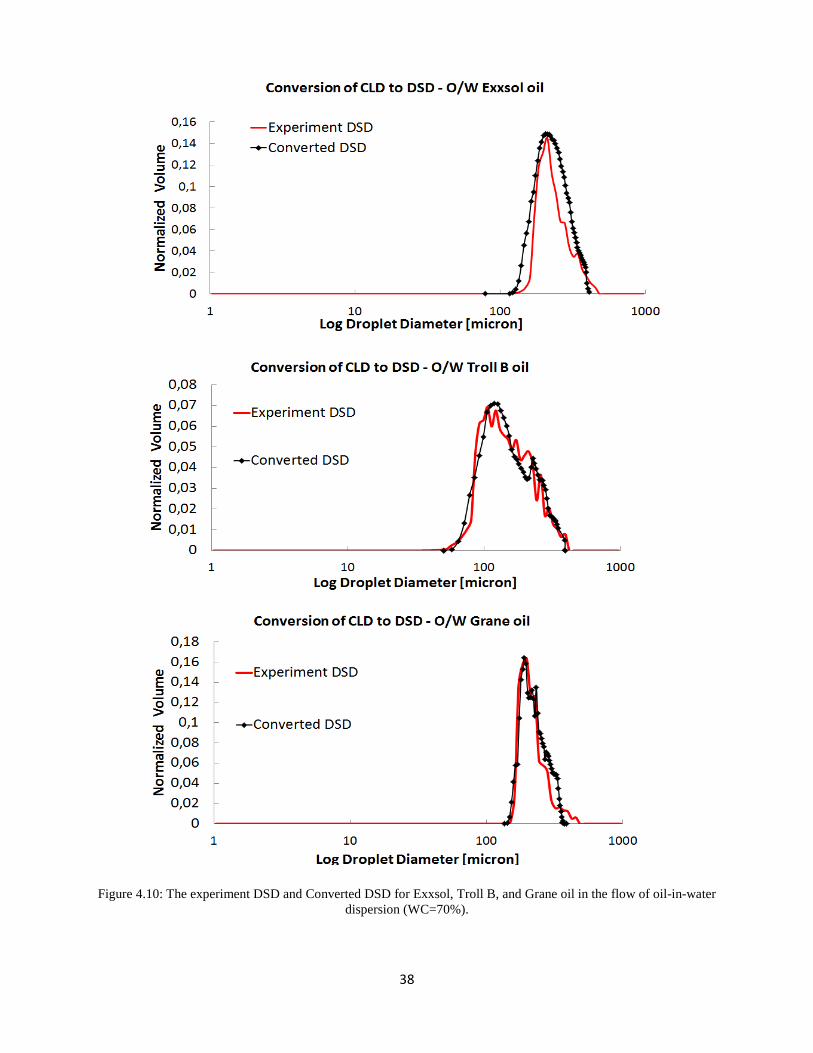
The conversion CLD-DSD model developed in equation 4.9 is utilized for Exxsol, Troll
B and Grane oil at water cut 70%. The conversion of CLD to DSD are calculated based on n =
40 subinterval in integral and shown in figure 4.10. The conversion will be more accurate by
increasing the subinterval of integral. The converted DSD is closely matched to the experiment
DSD that confirms the robustness of these correlations.
38
Figure 4.10: The experiment DSD and Converted DSD for Exxsol, Troll B, and Grane oil in the flow of oil-in-water dispersion (WC=70%).
39
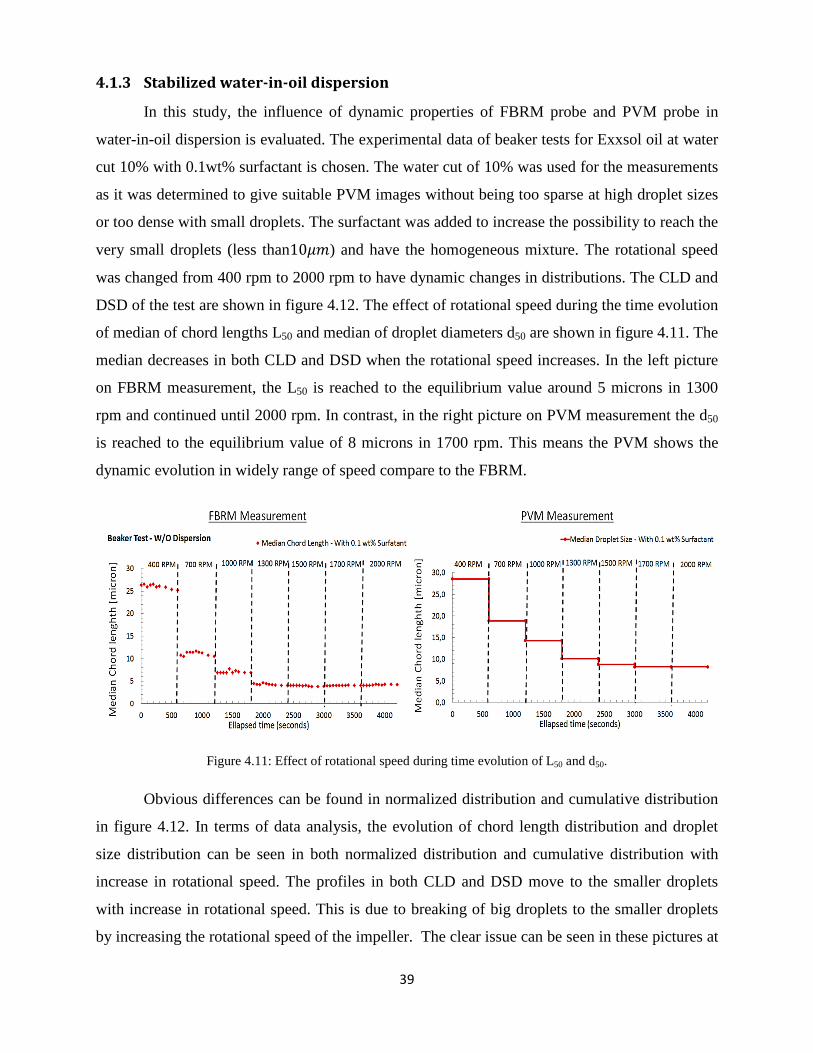
4.1.3 Stabilized water-in-oil dispersion
In this study, the influence of dynamic properties of FBRM probe and PVM probe in
water-in-oil dispersion is evaluated. The experimental data of beaker tests for Exxsol oil at water
cut 10% with 0.1wt% surfactant is chosen. The water cut of 10% was used for the measurements
as it was determined to give suitable PVM images without being too sparse at high droplet sizes
or too dense with small droplets. The surfactant was added to increase the possibility to reach the
very small droplets (less than10𝜇𝑚) and have the homogeneous mixture. The rotational speed
was changed from 400 rpm to 2000 rpm to have dynamic changes in distributions. The CLD and
DSD of the test are shown in figure 4.12. The effect of rotational speed during the time evolution
of median of chord lengths L50 and median of droplet diameters d50 are shown in figure 4.11. The
median decreases in both CLD and DSD when the rotational speed increases. In the left picture
on FBRM measurement, the L50 is reached to the equilibrium value around 5 microns in 1300
rpm and continued until 2000 rpm. In contrast, in the right picture on PVM measurement the d50
is reached to the equilibrium value of 8 microns in 1700 rpm. This means the PVM shows the
dynamic evolution in widely range of speed compare to the FBRM.
Figure 4.11: Effect of rotational speed during time evolution of L50 and d50.
Obvious differences can be found in normalized distribution and cumulative distribution
in figure 4.12. In terms of data analysis, the evolution of chord length distribution and droplet
size distribution can be seen in both normalized distribution and cumulative distribution with
increase in rotational speed. The profiles in both CLD and DSD move to the smaller droplets
with increase in rotational speed. This is due to breaking of big droplets to the smaller droplets
by increasing the rotational speed of the impeller. The clear issue can be seen in these pictures at

40
high rotational speed is that the normalized count rate of chord length decreases slightly in CLD
profiles with increase in rotational speed, while the normalized count rate of droplets in DSD
profiles rises and is almost constant at high rotational speed.
Figure 4.12: Effect of change in rotational speed on normalized distribution and cumulative distribution of CLD using FBRM measurement in the left pictures and DSD using PVM measurement in the right pictures.
41
Flow loop tests 4.2
The closed flow loop was employed to study the dynamic properties of FBRM and PVM
for the flow in the pipe in comparison with Beaker test. The flow loop consists of two FBRM
probes in upstream and downstream regarding to the PVM probe. The PVM probe was located in
the middle of the stream. Firstly, The Exxsol oil with water cut 10% was used to study the flow
of unstable water-in-oil dispersion. Secondly, the surfactant was added to this flow to study the
flow of stabilized water-in-oil dispersion. Meanwhile, the uncertainty of FBRM measurement for
this study is evaluated.
4.2.1 Flow of unstable water-in-oil dispersion
The mixture velocity was changed from 0.16 m/s to 0.77 m/s to have a dynamic change
in CLD and DSD. Figure 4.13 shows the count number of chord length by the FBRM probes
positioned upstream and downstream. The chord lengths were divided into four groups. For the
upstream FBRM, the number of chord length less than 50 microns increases by an increase in
velocity due to break up of droplets after the pump, while the number of chord length more than
50 micron decreases. The flow developed along the pipeline and was measured by the
downstream FBRM probe. The number of chord length less than 50 microns is almost constant
until velocity 0.59 m/s and rapidly increases 0.6% in velocity 0.77m/s, while the number of
chord length between 50 and 150 microns is gradually raised until 0.33 m/s and rapidly jumped
to 0.15% in velocity 0.59 m/s. In contrast, the number of chord length between 150 and 300
microns increases until velocity 0.59 m/s and decreases to almost 0% in 0.77m/s. In addition,
Figure 4.14 shows the dynamic change of DSD with increase in velocity of the flow. Regarding
to the location of PVM probe in the middle of the stream, the effect of distance between PVM
probe and FBRM probes should be reduced. This is done by adding surfactant to stabilize the
water-in-oil dispersion. In the next chapter it is tried to analyze the fully developed flow as an
approach of evaluating the accuracy of FBRM probe.

42
Figure 4.13: Effect of changes in velocity on chord length of droplets for the flow of unstable water-in-oil dispersion at water cut 10% in flow loop test.
Figure 4.14: Effect of changes in velocity on DSD for the flow of unstable water-in-oil dispersion at water cut 10% in flow loop test.

43
4.2.2 Flow of stabilized water-in-oil dispersion
To stabilize the water dispersion, the surfactant was added to the flow in two steps, 0.05
wt% and 0.1 wt% of surfactant. The mixture velocity was changed from 0.18 m/s to 0.47 m/s for
each case. Due to limitation in capturing PVM images(unclear rims of very small droplets), the
test stopped at 0.47m/s. Figure 4.15 shows the count number of chord length in upstream and
downstream for water-in-oil flow when 0.05wt% surfactant was added. At U=0.47 m/s, the
number of chord length less than 50 microns in upstream is larger than downstream; However,
the flow was not fully developed and needed more surfactant to be added. In addition, the figure
4.16 shows the dynamic change of DSD captured by PVM probes with increase in velocity of the
flow.
Figure 4.15: Effect of changes in velocity on chord length of droplets for the flow of stabilized water-in-oil dispersion at water cut 10% with 0,05 wt% surfactant added in flow loop test.

44
Figure 4.16: Effect of changes in velocity on DSD for the flow of stabilized water-in-oil dispersion at water cut 10% with 0,05wt % surfactant added in flow loop test.
Figure 4.17 shows the count number of chord length in upstream and downstream for
water-in-oil flow when 0.1 wt% surfactant is added. The chord lengths divide into four groups.
The numbers of chord length at upstream and downstream are almost the same. This means the
flow was fully developed at velocity of 0.47 m/s in upstream and it continued to downstream.
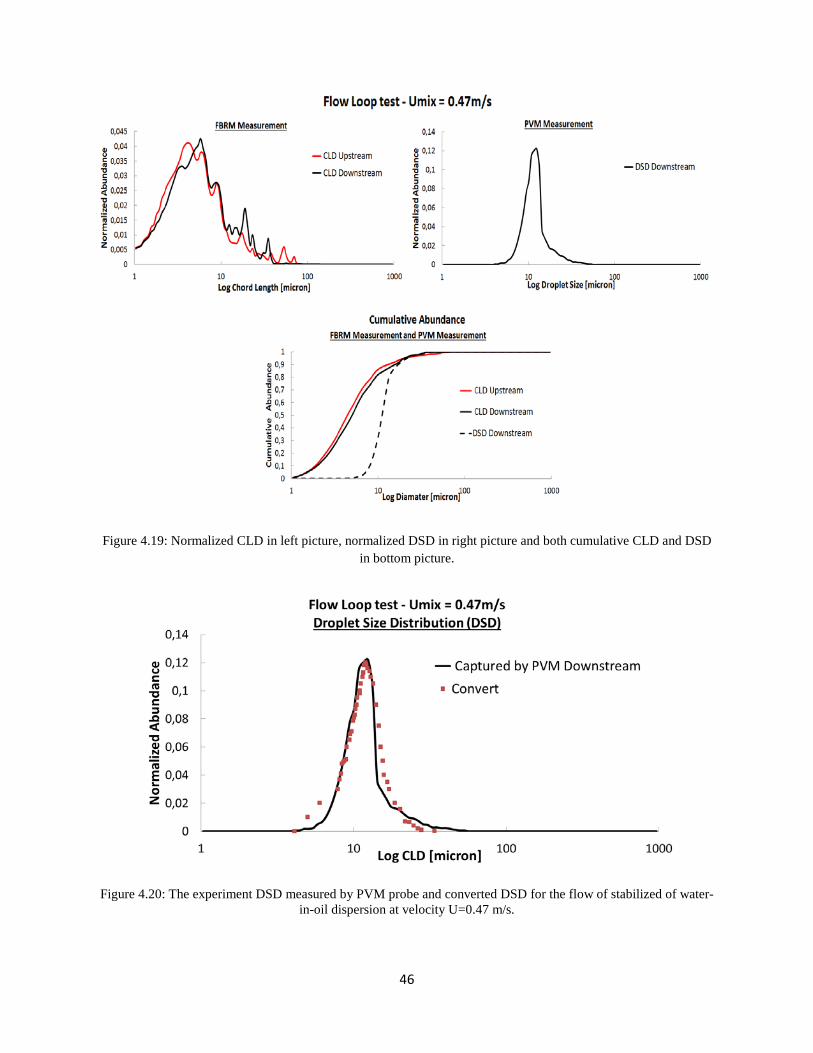
This is also clear in figure 4.19 that show the CLD profiles of the upstream and downstream
FBRM together. The reduction in effect of distance between PVM probe and FBRM probes
gives the possibility to compare the CLD and DSD. The CLD measured by downstream FBRM
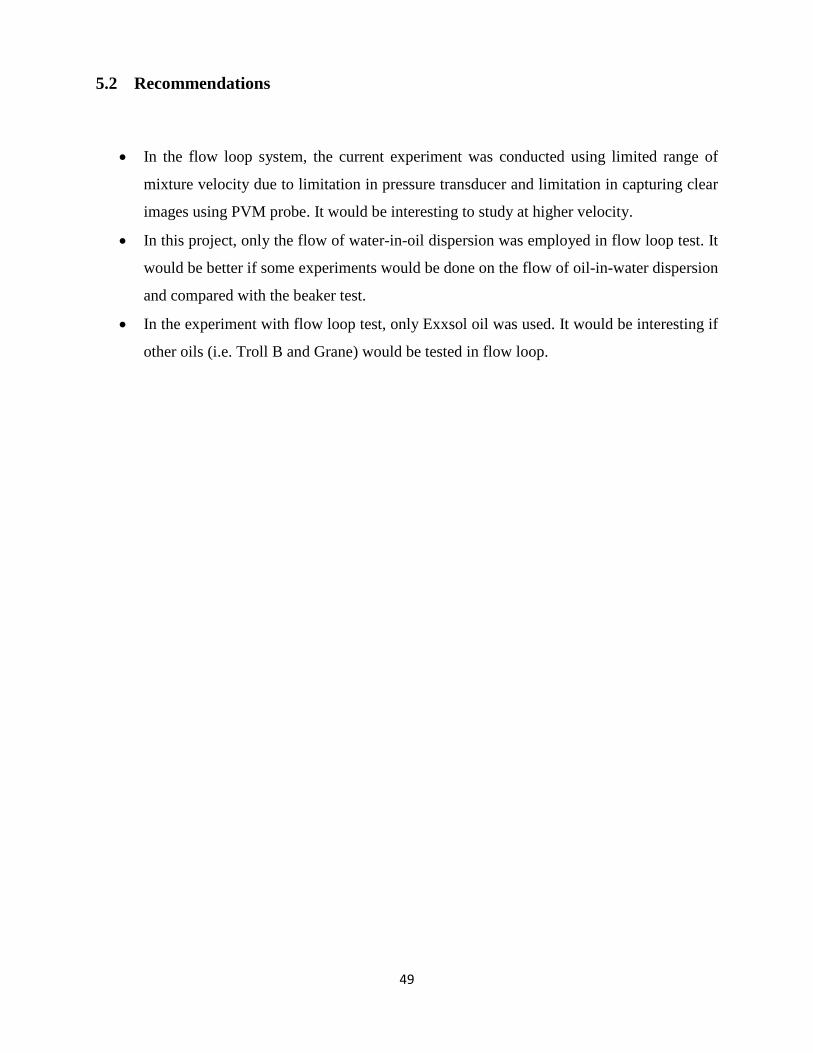
at U=0.47 m/s is chosen for the conversion to DSD and shown in figure 4.20.

45
Figure 4.17: Effect of changes in velocity on chord length of droplets for the flow of stabilized water-in-oil dispersion at water cut 10% with 0.1 wt% surfactant added in flow loop test.
Figure 4.18: Effect of change in velocity on DSD for the flow of stabilized water-in-oil dispersion at water cut 10% with 0.1wt % surfactant added in flow loop test.
46
Figure 4.19: Normalized CLD in left picture, normalized DSD in right picture and both cumulative CLD and DSD in bottom picture.
Figure 4.20: The experiment DSD measured by PVM probe and converted DSD for the flow of stabilized of water-in-oil dispersion at velocity U=0.47 m/s.

47
In this project two kinds of test were done, beaker test and flow loop test. According to the
following reasons, The Beaker test is a good approximation on studying the uncertainty of
FBRM probe in measuring the droplet size of the water-oil flow instead of using the close flow
loop.
• The simplicity in running the beaker test and in controlling the temperature and rotational
speed.
• The effect of distance between FBRM probes and PVM in the flow loop test. The flow
should be completely developed in upstream and continued to downstream to have less
effect of distance. So it causes to make the experiments with the flow loop very difficult.
• The results of water-in-oil flow in the flow loop test confirmed the CLD-DSD conversion
model that was developed in beaker test.

48
5 Conclusion and Future Work
Conclusion 5.1
The experimental data in the present case studies provided a basis of comparison between the
CLD measured by a FBRM probe and the DSD measured by a PVM probe. The droplet size was
shown to be dramatically undersized by the FBRM probe for both the flow of water-in-oil
dispersion and the flow of oil-in-water dispersion. An empirical fit was found to give reasonable
agreement between the FBRM and PVM mean and maximum sizes measured for droplets. In this
work, an experimental analysis gives us significant results:
• The PVM probe was found to be a useful tool for determining the droplet size
distribution for different crude oils with a wide variety of viscosities.
• The exterior smooth surface of droplets was leading to strong errors in the measurement
of the size of the droplets using FBRM probe. The FBRM probe undersized the droplet
diameters of oil-water emulsions and water-oil emulsions by a factor of 43% - 56% for
maximum droplet size.
• In stabilized water-in-oil dispersion, it was found that the PVM probe is limited to
capturing the droplets larger than 5 μm.
• A universal conversion model was developed between the CLD and DSD based on
experimental data and a log-normal distribution. This model is applicable to any oil-water
system with various types of oil, different water cut, and different fluid properties including density, viscosity and surface tension.
• The mean droplet size was slightly overestimated with the PVM when the smallest
droplets were not included, but this does not fully account for the under sizing of the
droplets that was found using the FBRM probe.
Nevertheless, the chord length measured with the FBRM probe gives a good approximation of
the droplet size distributions if the correction factors are considered. Due to using a good
conversion CLD-DSD model, FBRM can be used for both the comparison and development of
flow behavior models including maximum droplet size model and friction factor model.
49
Recommendations 5.2
• In the flow loop system, the current experiment was conducted using limited range of
mixture velocity due to limitation in pressure transducer and limitation in capturing clear
images using PVM probe. It would be interesting to study at higher velocity.
• In this project, only the flow of water-in-oil dispersion was employed in flow loop test. It
would be better if some experiments would be done on the flow of oil-in-water dispersion
and compared with the beaker test.
• In the experiment with flow loop test, only Exxsol oil was used. It would be interesting if
other oils (i.e. Troll B and Grane) would be tested in flow loop.

50
6 References:
Angeli, P. and G. Hewitt (2000). "Flow structure in horizontal oil–water flow." International journal of multiphase flow 26(7): 1117-1140.
Arirachakaran, S., K. Oglesby, et al. (1989). An analysis of oil/water flow phenomena in horizontal pipes. SPE Production Operations Symposium.
Baier, F. O. (2001). "Mass Transfer Charectristics of a Novel Gas-Liquid Contactor, The Advanced Buss Lopp Reactor." (Ph.D Dissertation, Swiss Federal Institute of Technology Zurich Switzerland).
Boxall, J. A., C. A. Koh, et al. (2009). "Measurement and calibration of droplet size distributions in water-in-oil emulsions by particle video microscope and a focused beam reflectance method." Industrial & Engineering Chemistry Research 49(3): 1412-1418.
Greaves, D., J. Boxall, et al. (2008). "Measuring the particle size of a known distribution using the focused beam reflectance measurement technique." Chemical Engineering Science 63(22): 5410-5419.
Group, M. T. L. P. (2004). "FBRM Control Interface version 6.0 Users Manual."
Heath, A. R., P. D. Fawell, et al. (2002). "Estimating average particle size by focused beam reflectance measurement (FBRM)." Particle & Particle Systems Characterization 19(2): 84-95.
Hu, B., P. Angeli, et al. (2005). "Evaluation of drop size distribution from chord length measurements." AIChE journal 52(3): 931-939.
Khatibi, M. (2012). "Study of droplet size distribution of viscous oil water flow." (Specialization project, Norwegian University of Science and Technology,NTNU and Statoil multiphase flow laboratory in Research, development and Innovation (RDI) in Rotvoll-Trodnheim).
Li, M., D. Wilkinson, et al. (2006). "Obtaining particle size distribution from chord length measurements." Particle & Particle Systems Characterization 23(2): 170-174.
Lovick, J. and P. Angeli (2004). "Experimental studies on the dual continuous flow pattern in oil–water flows." International journal of multiphase flow 30(2): 139-157.
O’SULLIVAN, B., B. SMITH, et al. (2010). "Optimization of particulate and droplet processes using FBRM® and PVM® technologies." Inżynieria i Aparatura Chemiczna Selected full texts(4): 76-77.
Packer, K. and C. Rees (1972). "Pulsed NMR studies of restricted diffusion. I. Droplet size distributions in emulsions." Journal of Colloid and interface Science 40(2): 206-218.
Rizon, M., Y. Haniza, et al. (2005). "Object detection using circular Hough transform." American Journal of Applied Sciences 2(12): 1606-1609.
Ruf, A., J. Worlitschek, et al. (2001). "Modeling and experimental analysis of PSD measurements through FBRM." Particle & Particle Systems Characterization 17(4): 167-179.
Turner, D. (2005). "Clathrate hydrate formation in water-in-oil dispersions." (Ph.D. Dissertation, Colorado School of Mines, Golden, CO).

51
7 Attachments
Attachment I: Matlab Codes of Post Processing of PVM Images 7.1
For running the Matlab codes to detect the droplets circle and make the droplets distribution, it is needed to have the license of image processing toolbox in Matlab. The codes for this purpose are shown as below:
% % Detection of droplets radiust1=zeros(25,100); radiust2=zeros(25,100); radiust3=zeros(25,100); radiust4=zeros(25,100); radiust5=zeros(25,100); D=(Rizon, Haniza et al. 2005); for i=1:100 K=i-1; D(Baier)=strcat(num2str(K),'.bmp'); I = imread(D(Baier)); figure, imshow(I), title('original image');
%%Image Binarisation (Adjustment) background = imopen(I,strel('disk',100)); I2 = I - background; figure, imshow(I2)
%%Morphological Opening on Grayscale, and Dilating images I3 = imadjust(I2); figure, imshow(I3); level = graythresh(I2); bw = im2bw(I3,level); bw = bwareaopen(bw, 100); figure, imshow(bw); [junk threshold] = edge(bw, 'prewitt'); fudgeFactor = 0.1; BWs = edge(I,'prewitt', threshold * fudgeFactor); figure, imshow(BWs), title('binary gradient mask'); se90 = strel('line', 4, 90); se0 = strel('line', 4, 0); BWsdil = imdilate(BWs, [se90 se0]); figure, imshow(BWsdil), title('dilated gradient mask');
%% measuring the diameter imshow(I) [center1, radius1] = imfindcircles(BWsdil,[10 , 50], 'Sensitivity',0.60, 'EdgeThreshold', 0.3, 'ObjectPolarity', 'bright', 'Method', 'TwoStage') ); [center2, radius2] = imfindcircles(BWsdil,[51 , 100], 'Sensitivity',0.60, 'EdgeThreshold', 0.3, 'ObjectPolarity', 'bright', 'Method', 'TwoStage'); [center3, radius3] = imfindcircles(BWsdil,[101 , 200], 'Sensitivity',0.60, 'EdgeThreshold', 0.3, 'ObjectPolarity', 'bright', 'Method', 'TwoStage'); [center4, radius4] = imfindcircles(BWsdil,[201 , 300], 'Sensitivity',0.60, 'EdgeThreshold', 0.3, 'ObjectPolarity', 'bright', 'Method', 'TwoStage');

52
[center5, radius5] = imfindcircles(BWsdil,[301 , 600], 'Sensitivity',0.60, 'EdgeThreshold', 0.3, 'ObjectPolarity', 'bright', 'Method', 'TwoStage');
%%Display the circle imshow(BWsdil) viscircles(center1,radius1); viscircles(center2,radius2); viscircles(center3,radius3);
%%Adding diameters into the separate charts radiust1(1:numel(radius1),i)=radius1(:,1); if size(radius2)~=[0,0]; radiust2(1:numel(radius2),i)=radius2(:,1); end if size(radius3)~=[0,0]; radiust3(1:numel(radius3),i)=radius3(:,1); end if size(radius4)~=[0,0]; radiust4(1:numel(radius4),i)=radius4(:,1); end if size(radius5)~=[0,0]; radiust5(1:numel(radius5),i)=radius5(:,1); end end
%%Processing the charts for different range of diameter radt=[]; for j=1:100 r1=radiust1(:,j); r1(r1==0)=[]; r2=radiust2(:,j); r2(r2==0)=[]; r3=radiust3(:,j); r3(r3==0)=[]; r4=radiust4(:,j); r4(r4==0)=[]; r5=radiust5(:,j); r5(r5==0)=[]; radt(1:numel(r1),j)=r1(:,1); if size(r2)~=[0,0]; radt(numel(r1)+1:numel(r1)+numel(r2),j)=r2(:,1); end if size(r3)~=[0,0]; radt(numel(r1)+numel(r2)+1:numel(r1)+numel(r2)+numel(r3),j)=r3(:,1); end if size(r4)~=[0,0]; radt(numel(r1)+numel(r2)+numel(r3)+1:numel(r1)+numel(r2)+numel(r3)+numel(r4),j)=r4(:,1); end if size(r5)~=[0,0]; radt(numel(r1)+numel(r2)+numel(r3)+numel(r4)+1:numel(r1)+numel(r2)+numel(r3)+numel(r4)+numel(r5),j)=r5(:,1); end end diameter=radt*2*1.5;

53
Attachment II: Tables and Figures Results (Beaker and Flow Loop test) 7.2
The relevant tables and figures are represented here. The excel sheets of the data and process analysis has been attached to the report.
Beaker Test:
Table II.1: Parametric measurement with FBRM and PVM for Exxsol oil - water flow (WC=10%-90%)
WC Speed d32 d43 d99-volume d32 d43 d99-volume
% RPM FBRM FBRM FBRM PVM PVM PVM
10 1500 56 82 400 192 203 353
30 1500 63 70 227 213 222 401
70 1500 68 73 235 225 237 411
90 1500 59 43 189 184 193 346
Table II.2: Parametric measurement with FBRM and PVM for Troll B oil water flow (WC=10%-90%)
WC Speed d32 d43 d99-volume d32 d43 d99-volume
% RPM FBRM FBRM FBRM PVM PVM PVM
10 1500 37 76 872 118 128 266
30 1500 33 68 151 103 118 320
70 1500 36 83 202 128 160 394
90 1500 53 90 254 135 158 359
54
Table II.3: Parametric measurement with FBRM and PVM for Grane oil water flow (WC=10%-90%)
WC Speed d32 d43 d99-volume d32 d43 d99-volume
% RPM FBRM FBRM FBRM PVM PVM PVM
60 1500 146 239 865 221 235 421
70 1500 66 91 175 215 227 400
90 1500 40 38 305 293 368 802
Table II.4: Parametric measurement with FBRM and PVM for stabilized water-in-oil dispersion (Exxsol oil, WC=10%, and 0.1wt% surfactant is added)
Speed d32 d43 d99-volume d32 d43 d99-volume
RPM FBRM FBRM FBRM PVM PVM PVM
400 19 20 69 52 75 171
700 30 57 495 29 53 80
1000 41 70 550 20 28 69
1300 56 108 847 16 22 40
1500 76 152 888 8 10 28
1700 81 174 948 7 9 26
2000 87 187 902 6 8 21

55
Flow Loop Test:
Table II.5: Parametric measurement with pressure transducer (length 3m) for water-in-oil dispersion flow (Exxsol oil and WC=10%)
Umix Temp PDT1 PDT2
m/s °C mbar/m mbar/m
0,16 22 5,8 34,4
0,33 22,3 8,7 118,5
0,47 22,7 14,8 206,6
0,59 23,3 19,1 306,2
0,70 24 23,0 425,6
0,77 25,6 25,1 498,5
Table II.6: Parametric measurement with pressure transducer (length 3m) for water-in-oil dispersion flow (Exxsol oil, WC=10%, and 0.05wt% surfactant is added)
Umix Temp PDT1 PDT2
m/s °C mbar/m mbar/m
0,18 26,4 7,5 40,8
0,33 25,9 9,2 126,0
0,46 25,8 12,4 224,0

56
Table II.7: Parametric measurement with pressure transducer (length 3m) for water-in-oil dispersion flow (Exxsol oil, WC=10%, and 0.1wt% surfactant is added)
Umix Temp PDT1 PDT2
m/s °C mbar/m mbar/m
0,19 24,6 6,8 49,8
0,34 23,4 9,3 128,2
0,47 23,4 13,1 226,1

57
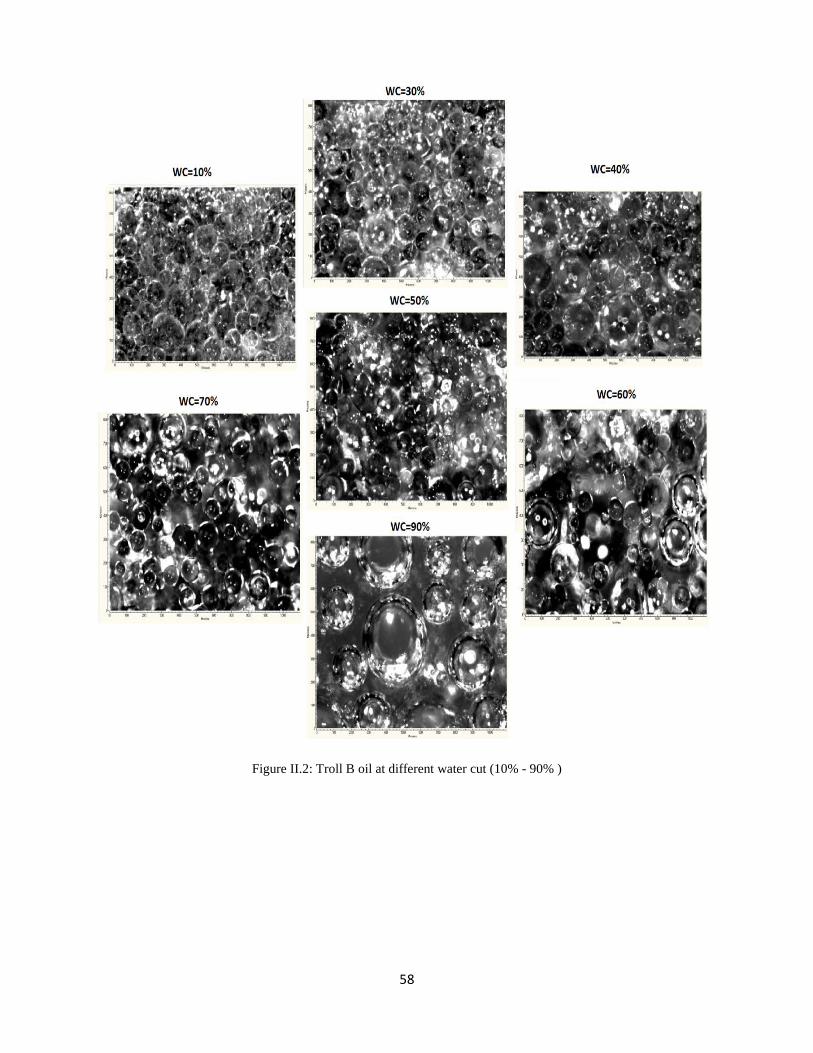
Figure II.1: Exxsol oil at different water cut (10% - 90%)
58
Figure II.2: Troll B oil at different water cut (10% - 90% )

59
Figure II.3: Grane oil at different water cut (10% - 90%)