experiments on an exhaust hood for the paint industry
TRANSCRIPT
Aalborg Universitet
Experiments on an Exhaust Hood for the Paint Industry
Nielsen, Peter V.; Madsen, Ulla; Tveit, David J.
Publication date:1991
Document VersionPublisher's PDF, also known as Version of record
Link to publication from Aalborg University
Citation for published version (APA):Nielsen, P. V., Madsen, U., & Tveit, D. J. (1991). Experiments on an Exhaust Hood for the Paint Industry. Dept.of Building Technology and Structural Engineering. Indoor Environmental Technology Vol. R9146 No. 18
General rightsCopyright and moral rights for the publications made accessible in the public portal are retained by the authors and/or other copyright ownersand it is a condition of accessing publications that users recognise and abide by the legal requirements associated with these rights.
- Users may download and print one copy of any publication from the public portal for the purpose of private study or research. - You may not further distribute the material or use it for any profit-making activity or commercial gain - You may freely distribute the URL identifying the publication in the public portal -
Take down policyIf you believe that this document breaches copyright please contact us at [email protected] providing details, and we will remove access tothe work immediately and investigate your claim.
Downloaded from vbn.aau.dk on: March 19, 2022
INSTITUTTET FOR BYGNINGSTEKNIK DEPT. OF BUILDING TECHNOLOGY AND STRUCTURAL ENGINEERING AALBORG UNIVERSITETSCENTER • AUC • AALBORG • DANMARK
INDOOR ENVIRONMENTAL TECHNOLOGY PAPER NO. 18
Presented at Ventilation '91, Cincinnati, Ohio, 1991
P. V. NIELSEN, U. MADSEN & D. J. TVEIT EXPERIMENTS ON AN EXHAUST HOOD FOR THE PAINT INDUSTRY DECEMBER 1991 ISSN 0902-7513 R9146

The papers on INDOOR ENVIRONMENTAL TECHNOLOGY are issued for early dissemination of research results from the Indoor Environmental Technology Group at the University of Aalborg. These papers are generally submitted to scientific meetings, conferences or journals and should therefore not be widely distributed. Whenever possible reference should be given to the final publications (proceedings, journals, etc.) and not to the paper in this series.
INSTITUTTET FOR BYGNINGSTEKNIK DEPT. OF BUILDING TECHNOLOGY AND STRUCTURAL . ENGINEERING AALBORG UNIVERSITETSCENTER • AUC • AALBORG • DANMARK
INDOOR ENVIRONMENTAL TECHNOLOGY PAPER NO. 18
Presented at Ventilation '91, Cincinnati, Ohio, 1991
P. V. NIELSEN, U. MADSEN & D. J. TVEIT EXPERIMENTS ON AN EXHAUST HOOD FOR THE PAINT INDUSTRY DECEMBER 1991 ISSN 0902-7513 R9146

EXPERIMENTS ON AN EXHAUST HOOD FOR THE PAINT INDUSTRY
Peter V. Nielsen, Ulla Madsen and David J. Tveit The University of Aalborg
Aalborg, Denmark
SUMMARY
Field measurements in the industry are used to identify some details of the emission from a filling machine. A full-scale model of the machine is made for laboratory tests.
The influence of a worker is studied in a full-scale model. The worker is simulated by a thermal manikin which influences the surroundings with a convective boundary layer. A number of experiments show the efficiency of the local exhaust at different sequences of the filling process. It is obvious that the efficiency is high at the actual layout of the exhaust but it is mainly due to a very high flow rate in the exhaust system and small disturbances from the surroundings. The influence from a disturbance given as a horizontal air velocity is also studied. Due to the high flow rate in the exhaust system a decrease in efficiency will first take place at a cross flow of 50 cm/s.
A new design of exhaust is based on the information obtained in the experiments. The exhaust is integrated into the filling machine and it is possible to reduce the exhaust flow from 120 m3 /h to 65 m3 /h. The design is also less influenced by cross air velocity. A reduction in efficiency will first take place at a velocity level of 90 cm/s.

EXPERIMENTS ON AN EXHAUST HOOD FOR THE PAINT INDUSTRY
Peter V. Nielsen, Ulla Madsen and David J. Tveit The University of Aalborg
Aalborg, Denmark
INTRODUCTION
The use of organic solvents in the paint industry involves a health risk, where the major problem is the danger of brain damage. The ideal solution is of course to subsitute the organic solvents with less dangerous substances, but this is not possible for all types of paint.
The worker in the paint industry can be protected from an exposure to organic solvents by the use of a local exhaust system, or by the use of personal protection as e.g. mask and gloves, but the last possibility should only be considered in special cases.
There is a great variation of production machinery and pollution sources in the paint industry. This paper shows the examination of a process where wood preservation is filled into cans in a process which releases organic solvents to the surrounding air.
The method, discussed in the following, can be used for any process in the paint industry where gases, as organic solvents, are the contaminating components.
CONTAMINANT SOURCE
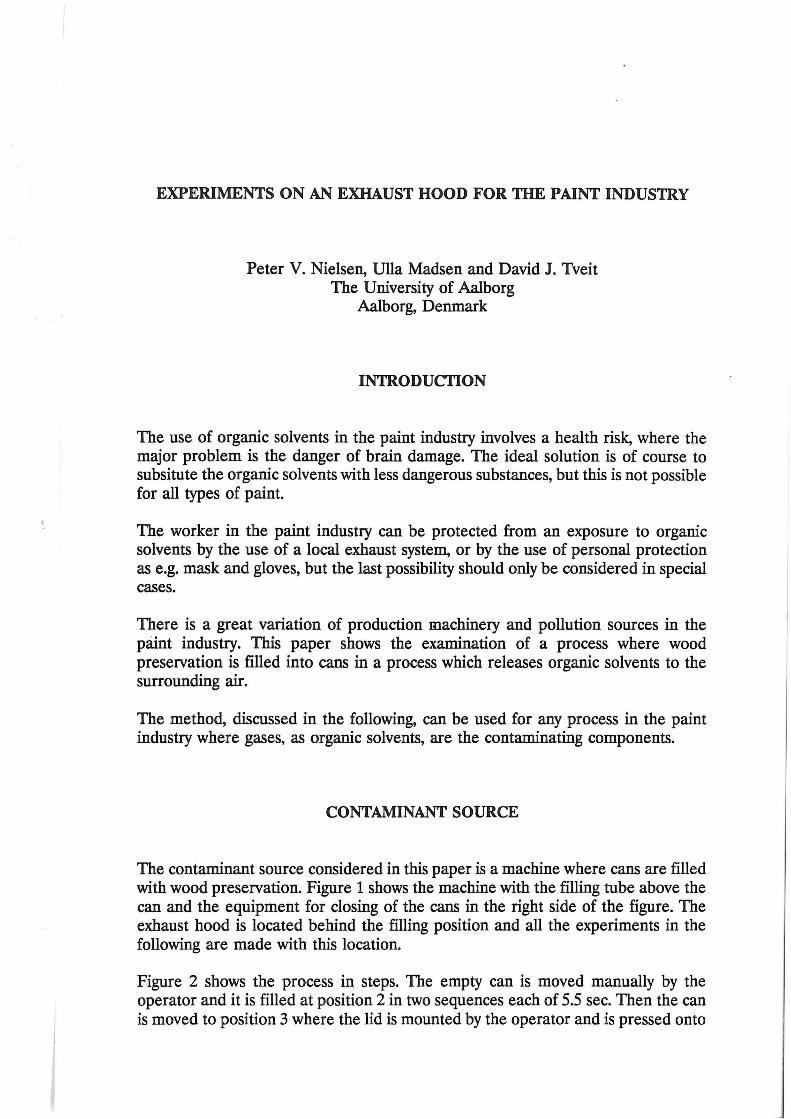
The contaminant source considered in this paper is a machine where cans are filled with wood preservation. Figure 1 shows the machine with the filling tube above the can and the equipment for closing of the cans in the right side of the figure. The exhaust hood is located behind the filling position and all the experiments in the following are made with this location.
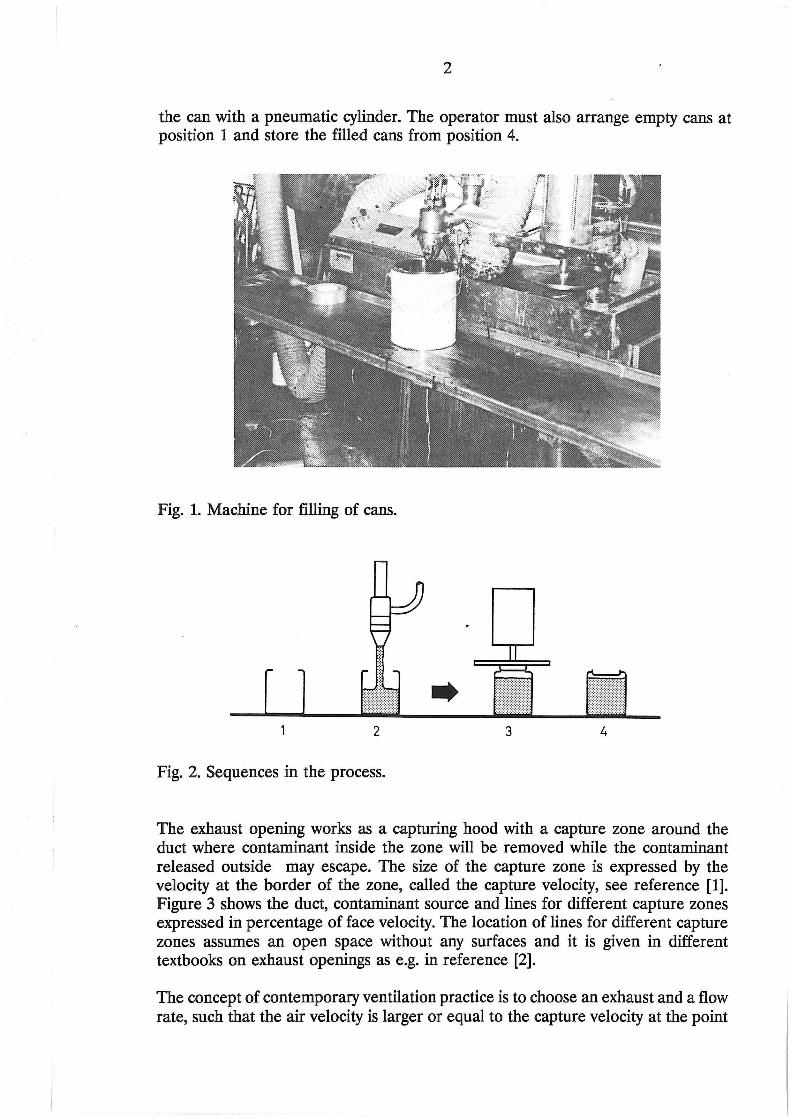
Figure 2 shows the process in steps. The empty can is moved manually by the operator and it is filled at position 2 in two sequences each of 5.5 sec. Then the can is moved to position 3 where the lid is mounted by the operator and is pressed onto
2
the can with a pneumatic cylinder. The operator must also arrange empty cans at position 1 and store the filled cans from position 4.
Fig. 1. Machine for filling of cans .
• 2 3 4
Fig. 2. Sequences in the process.
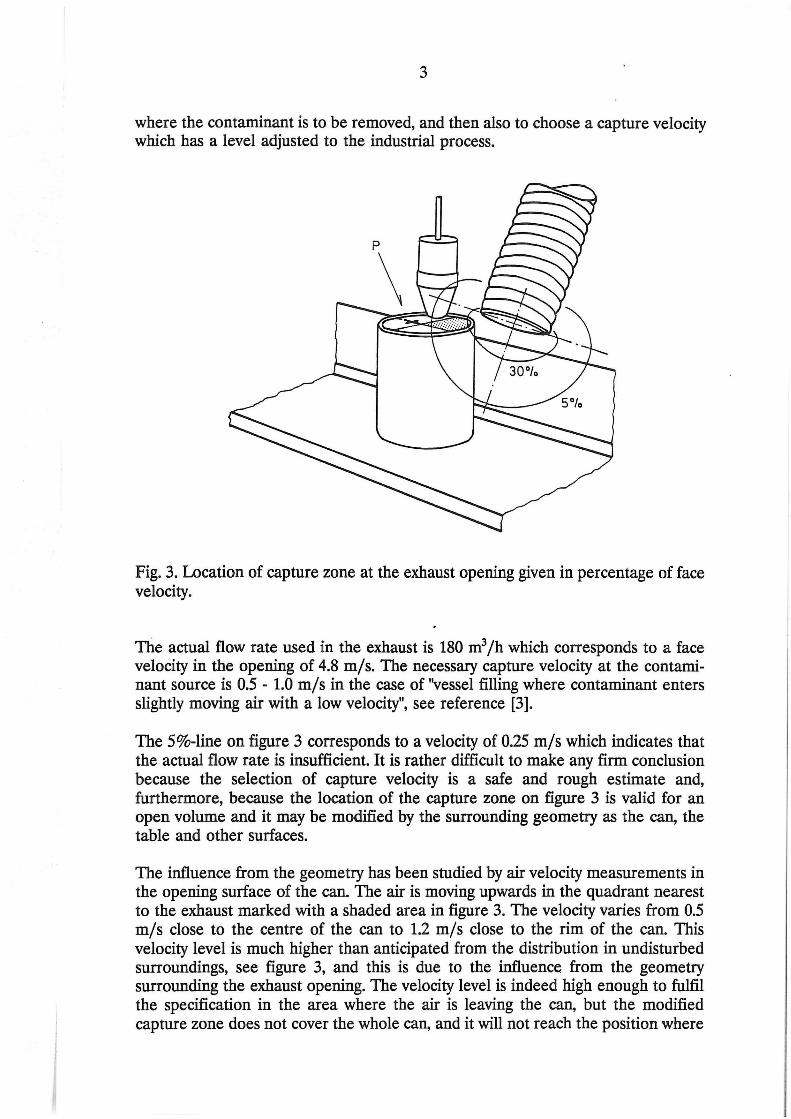
The exhaust opening works as a capturing hood with a capture zone around the duct where contaminant inside the zone will be removed while the contaminant released outside may escape. The size of the capture zone is expressed by the velocity at the border of the zone, called the capture velocity, see reference [1]. Figure 3 shows the duct, contaminant source and lines for different capture zones expressed in percentage of face velocity. The location of lines for different capture zones assumes an open space without any surfaces and it is given in different textbooks on exhaust openings as e.g. in reference [2].
The concept of contemporary ventilation practice is to choose an exhaust and a flow rate, such that the air velocity is larger or equal to the capture velocity at the point
3
where the contaminant is to be removed, and then also to choose a capture velocity which has a level adjusted to the industrial process.
Fig. 3. Location of capture zone at the exhaust opening given in percentage of face velocity.
Tlie actual flow rate used in the exhaust is 180 m3 /h which corresponds to a face velocity in the opening of 4.8 m/s. The necessary capture velocity at the contaminant source is 0.5- 1.0 m/sin the case of "vessel filling where contaminant enters slightly moving air with a low velocity", see reference [3].
The 5%-line on figure 3 corresponds to a velocity of 0.25 m/s which indicates that the actual flow rate is insufficient. It is rather difficult to make any firm conclusion because the selection of capture velocity is a safe and rough estimate and, furthermore, because the location of the capture zone on figure 3 is valid for an open volume and it may be modified by the surrounding geometry as the can, the table and other surfaces.
The influence from the geometry has been studied by air velocity measurements in the opening surface of the can. The air is moving upwards in the quadrant nearest to the exhaust marked with a shaded area in figure 3. The velocity varies from 0.5 m/ s close to the centre of the can to 1.2 m/ s close to the rim of the can. This velocity level is much higher than anticipated from the distribution in undisturbed surroundings, see figure 3, and this is due to the influence from the geometry surrounding the exhaust opening. The velocity level is indeed high enough to fulfil the specification in the area where the air is leaving the can, but the modified capture zone does not cover the whole can, and it will not reach the position where
4
the can is closed.
Measurements at the operator show that the concentration in the breathing zone is of background level, which means that the exhaust hood has a sufficient efficiency.
It is decided to make a full-scale model of the machine to study the contaminant source in more details and to develop a new exhaust hood.
FULL-SCALE MODEL
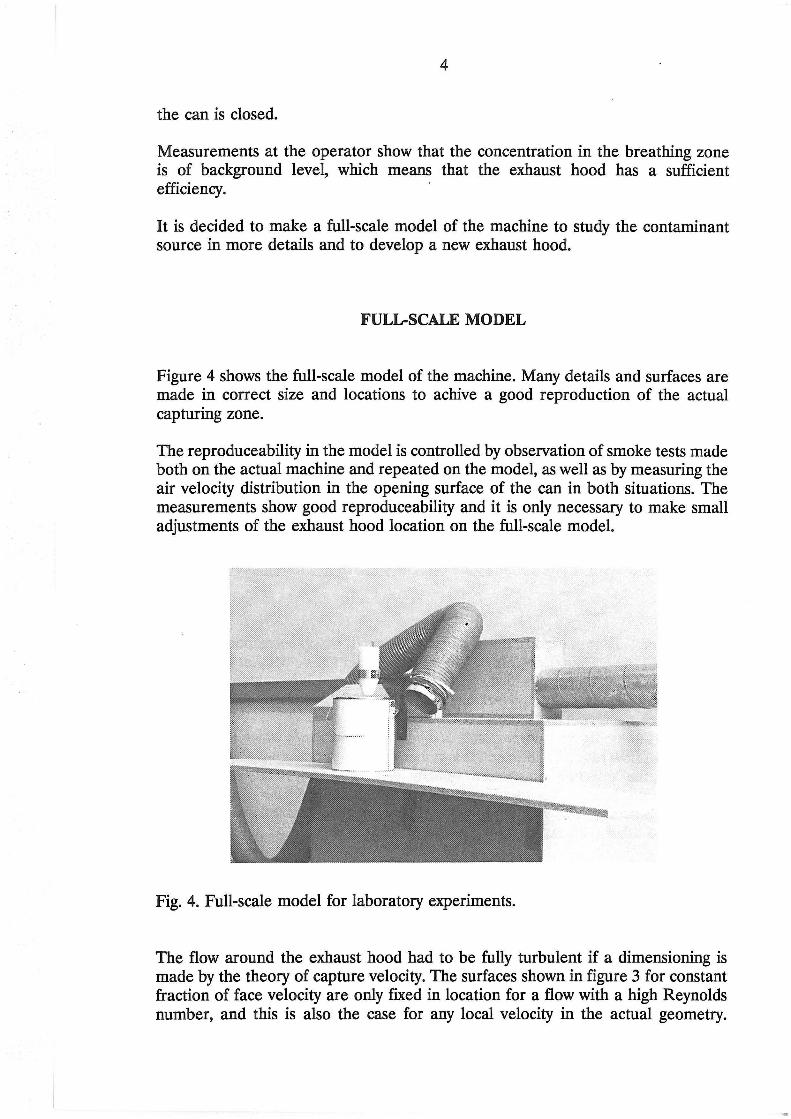
Figure 4 shows the full-scale model of the machine. Many details and surfaces are made in correct size and locations to achive a good reproduction of the actual capturing zone.
The reproduceability in the model is controlled by observation of smoke tests made both on the actual machine and repeated on the model, as well as by measuring the air velocity distribution in the opening surface of the can in both situations. The measurements show good reproduceability and it is only necessary to make small adjustments of the exhaust hood location on the full-scale model.
Fig. 4. Full-scale model for laboratory experiments.
The flow around the exhaust hood had to be fully turbulent if a dimensioning is made by the theory of capture velocity. The surfaces shown in figure 3 for constant fraction of face velocity are only fixed in location for a flow with a high Reynolds number, and this is also the case for any local velocity in the actual geometry.
.. ·.·. ~ .·.
5
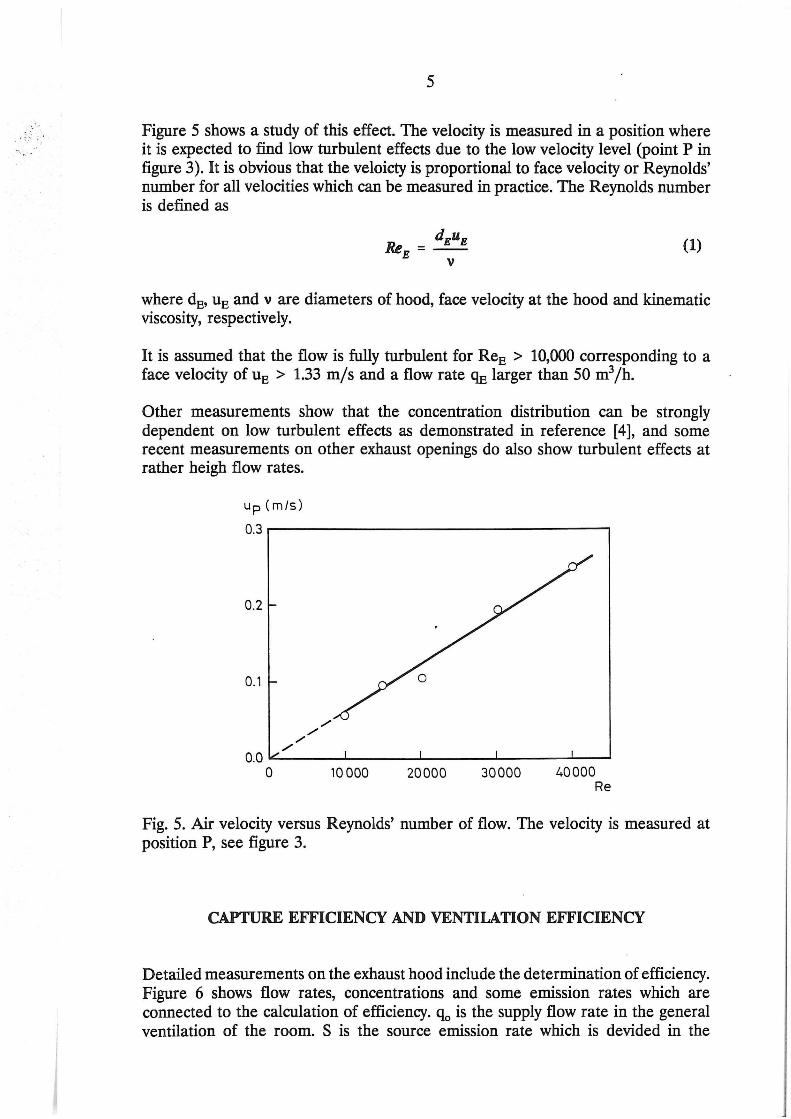
Figure 5 shows a study of this effect. The velocity is measured in a position where it is expected to find low turbulent effects due to the low velocity level (point P in figure 3). It is obvious that the veloicty is proportional to face velocity or Reynolds' number for all velocities which can be measured in practice. The Reynolds number is defined as
(1)
where d19 uE and v are diameters of hood, face velocity at the hood and kinematic viscosity, respectively.
It is assumed that the flow is fully turbulent for ReE > 10,000 corresponding to a face velocity of uE > 1.33 m/s and a flow rate 'lE larger than 50 m3 /h.
Other measurements show that the concentration distribution can be strongly dependent on low turbulent effects as demonstrated in reference [4], and some recent measurements on other exhaust openings do also show turbulent effects at rather heigh flow rates.
up (m/s)
0.3 r--------------------,
0.2
0.1
0.0 .c;._---L--------1-------1------l.-~ 0 10000 20000 30000 40000
Re
Fig. 5. Air velocity versus Reynolds' number of flow. The velocity is measured at position P, see figure 3.
CAPTURE EFFICIENCY AND VENTILATION EFFICIENCY
Detailed measurements on the exhaust hood include the determination of efficiency. Figure 6 shows flow rates, concentrations and some emission rates which are connected to the calculation of efficiency. q0 is the supply flow rate in the general ventilation of the room. S is the source emission rate which is devided in the
6
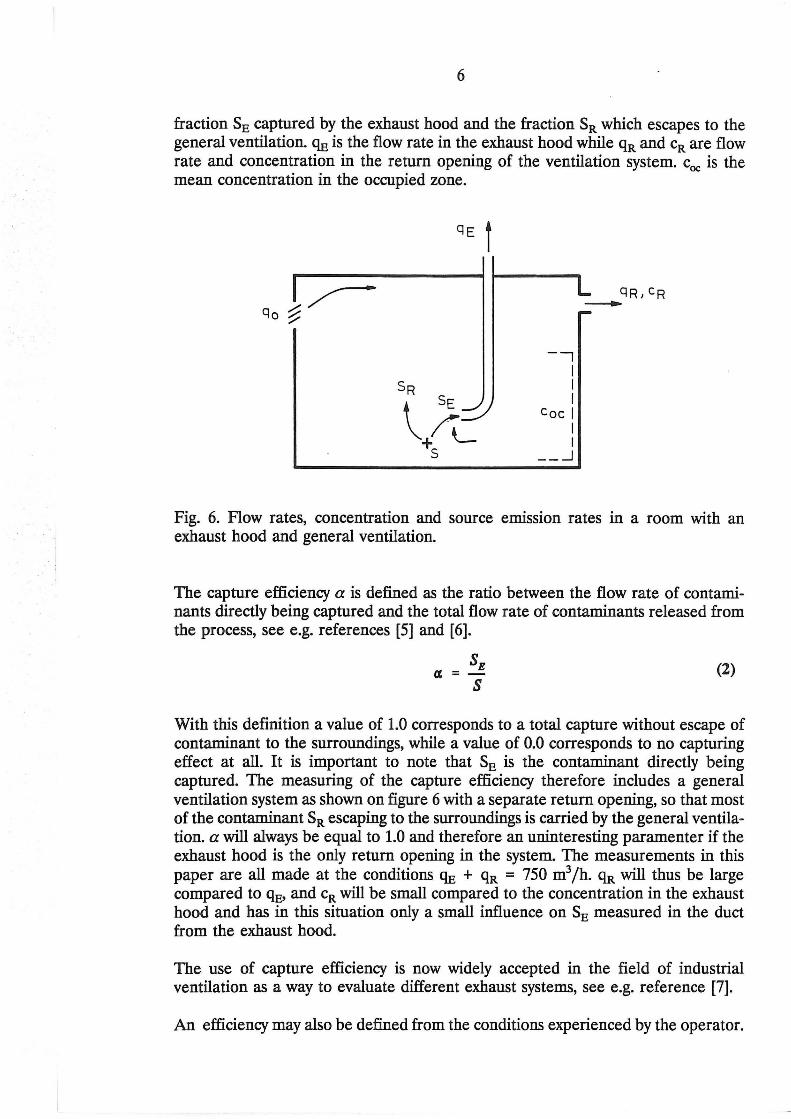
fraction SE captured by the exhaust hood and the fraction SR which escapes to the general ventilation. Cffi is the flow rate in the exhaust hood while qR and eR are flow rate and concentration in the return opening of the ventilation system. coc is the mean concentration in the occupied zone.
--, I I I
Coc I I I
__ _j
Fig. 6. Flow rates, concentration and source emission rates in a room with an exhaust hood and general ventilation.
The capture efficiency a is defined as the ratio between the flow rate of contaminants directly being captured and the total flow rate of contaminants released from the process, see e.g. references [5] and [6].
SE « =- (2)
s
With this definition a value of 1.0 corresponds to a total capture without escape of contaminant to the surroundings, while a value of 0.0 corresponds to no capturing effect at all. It is important to note that SE is the contaminant directly being captured. The measuring of the capture efficiency therefore includes a general ventilation system as shown on figure 6 with a separate return opening, so that most of the contaminant SR escaping to the surroundings is carried by the general ventilation. a will always be equal to 1.0 and therefore an uninteresting paramenter if the exhaust hood is the only return opening in the system. The measurements in this paper are all made at the conditions 'lE + qR = 750 m3 /h. qR will thus be large compared to Cffi, and eR will be small compared to the concentration in the exhaust hood and has in this situation only a small influence on SE measured in the duct from the exhaust hood.
The use of capture efficiency is now widely accepted in the field of industrial ventilation as a way to evaluate different exhaust systems, see e.g. reference [7].
An efficiency may also be defined from the conditions experienced by the operator.
7
This efficiency is defined in reference [ 6] as
cl-c2 '11 =-
cl-coc (3)
where c1 is the concentration in the breathing zone of the operator without exhaust on the equipment, and ~ is the concentration with the use of an exhaust hood. coc is the background concentration. This efficiency will be 1.0 in the best case where ~ - cClC' and 0.0 in the worst case where ~ - c1, which means that the exhaust has no effect.
A ventilation efficiency for the general ventilation system is defined as
eR e =-
oc c oc
(4)
where eoc is equal to 1.0 when the flow in the room is well mixed eR - coc. This ventilation efficiency can be up to the level of 2.0 to 5.0 for displacement ventilation and around 0.5 to 1.0 for mixing ventilation, but large variations are seen in practice.
MEASUREMENTS ON FULL-SCALE MODEL
This chapter will show measurements of capture efficiency for the full-scale model in different situations. The model is installed in a room with an additional ventilation system.
The real contaminant release is periodic, but all the results presented in this paper are steady state situations. The tracer gas consists of a buoyancy neutral mixture of C02 and He. It is supplied through the can in openings which simulate the surface of the paint level. This surface is also the emission source in practice because the periodic paint jet will entrain air which will be released in the bottom of the can.
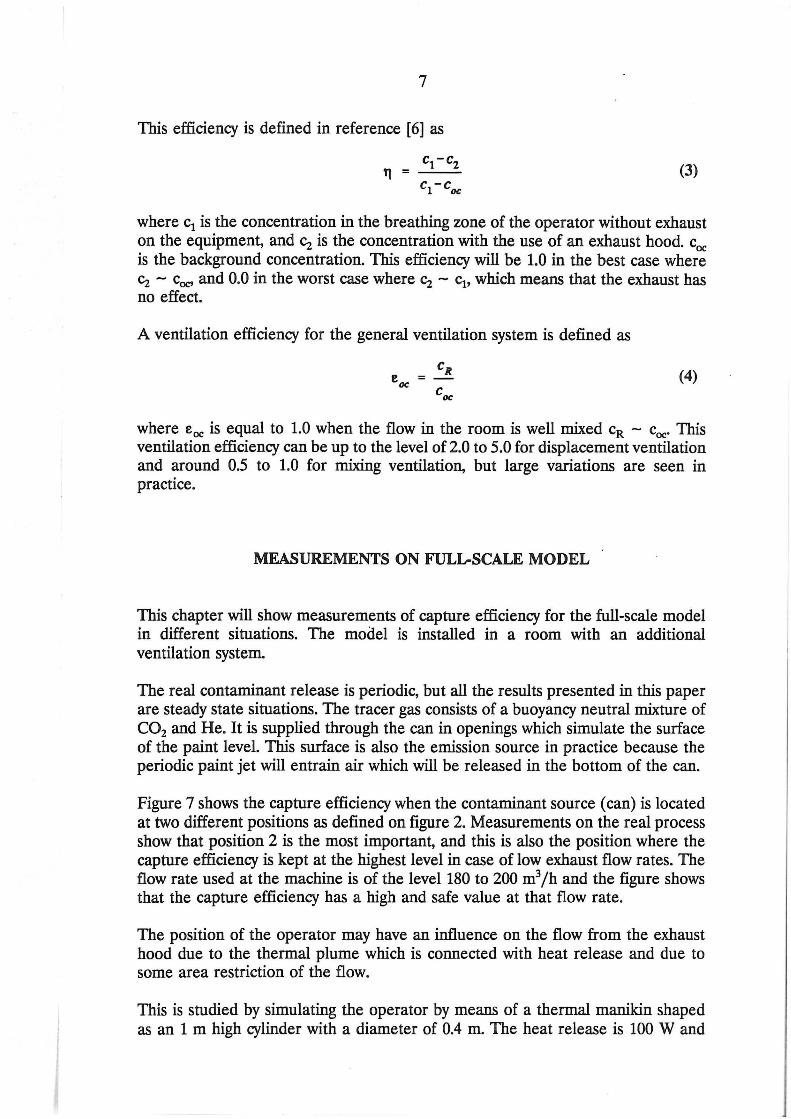
Figure 7 shows the capture efficiency when the contaminant source (can) is located at two different positions as defmed on figure 2. Measurements on the real process show that position 2 is the most important, and this is also the position where the capture efficiency is kept at the highest level in case of low exhaust flow rates. The flow rate used at the machine is of the level 180 to 200 m3 /h and the figure shows that the capture efficiency has a high and safe value at that flow rate.
The position of the operator may have an influence on the flow from the exhaust hood due to the thermal plume which is connected with heat release and due to some area restriction of the flow.
This is studied by simulating the operator by means of a thermal manikin shaped as an 1 m high cylinder with a diameter of 0.4 m. The heat release is 100 W and
8
the manikin is located with the centre of gravity 0.86 m above the floor at a distance of 0.06 m from the machine.
1.0
0.8
0 .6
0.4
0.2 o Position 2 0 Position 3
0.0 ......_ _ __,_ __ ...~....-_---.~ __ ......L... __ .J...._ _ ___.J.. __ ......_ _ ____.~
0 25 50 75 100 125 150
Fig. 7. Capture efficiency for the exhaust hood. The contaminant source is located at two different positions.
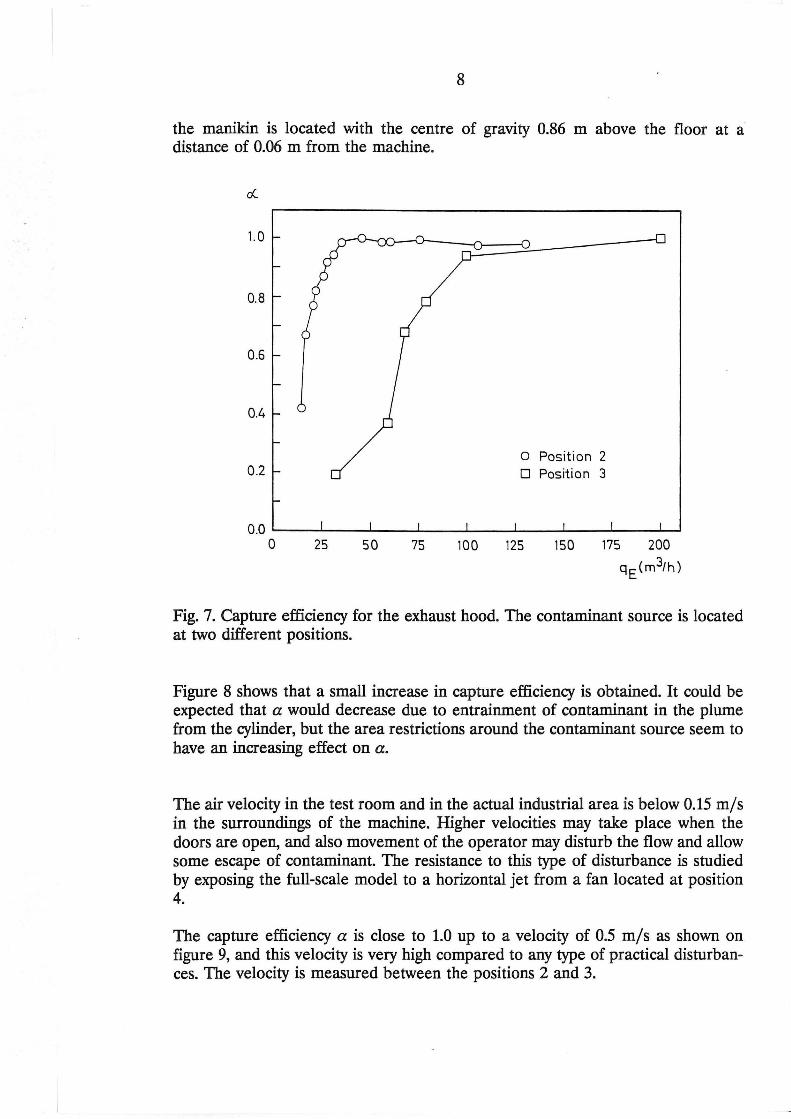
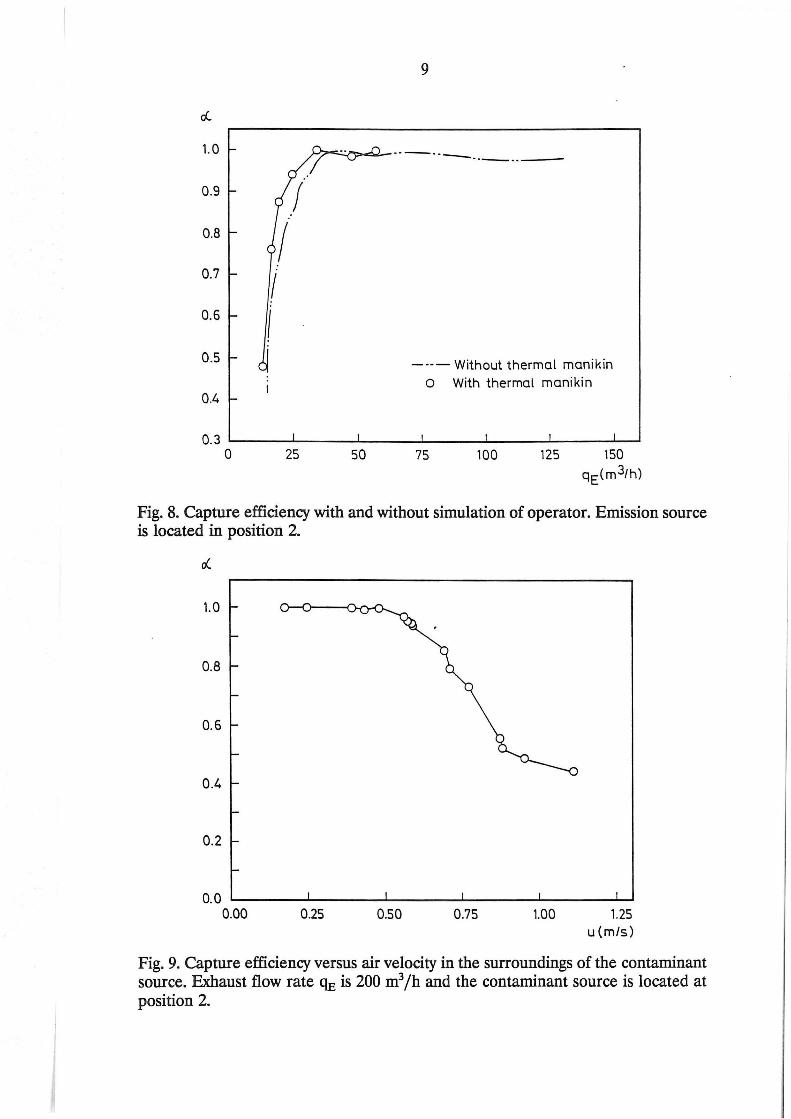
Figure 8 shows that a small increase in capture efficiency is obtained. It could be expected that a would decrease due to entrainment of contaminant in the plume from the cylinder, but the area restrictions around the contaminant source seem to have an increasing effect on a.
The air velocity in the test room and in the actual industrial area is below 0.15 m/s in the surroundings of the machine. Higher velocities may take place when the doors are open, and also movement of the operator may disturb the flow and allow some escape of contaminant. The resistance to this type of disturbance is studied by exposing the full-scale model to a horizontal jet from a fan located at position 4.
The capture efficiency a is close to 1.0 up to a velocity of 0.5 mjs as shown on figure 9, and this velocity is very high compared to any type of practical disturbances. The velocity is measured between the positions 2 and 3.
rJ_
1.0
0.9
0.8
0.7
0.6 I
0.5
0.4
0.3 0
:
I
25
9
---.... --... ____ _
----Without thermal manikin o With thermal manikin
Fig. 8. Capture efficiency with and without simulation of operator. Emission source is located in position 2.
1.0
0.8
0.6
0.4
0.2
0.0 ~------._------~------~------_.------~~ 0.00 0.25 0.50 0.75 1.00 1.25
u (m/s)
Fig. 9. Capture efficiency versus air velocity in the surroundings of the contaminant source. Exhaust flow rate ern is 200 m3 /h and the contaminant source is located at position 2.
10
NEW DESIGN OF EXHAUST HOOD
The final part of the project looks upon the possibilities which may be obtained in a new design of exhaust hood. There are more reasons. Firstly, it is necessary to find the most energy efficiency solution, that means a solution with a high capture efficiency a at a low exhaust flow rate (ffi. Secondly, it is questionable to use a solution where the operator personally decides the position of the exhaust hood as the one described in this paper. Finally, a future solution should be an integrated part of the total design of the machine to obtain the best and most safe solution.
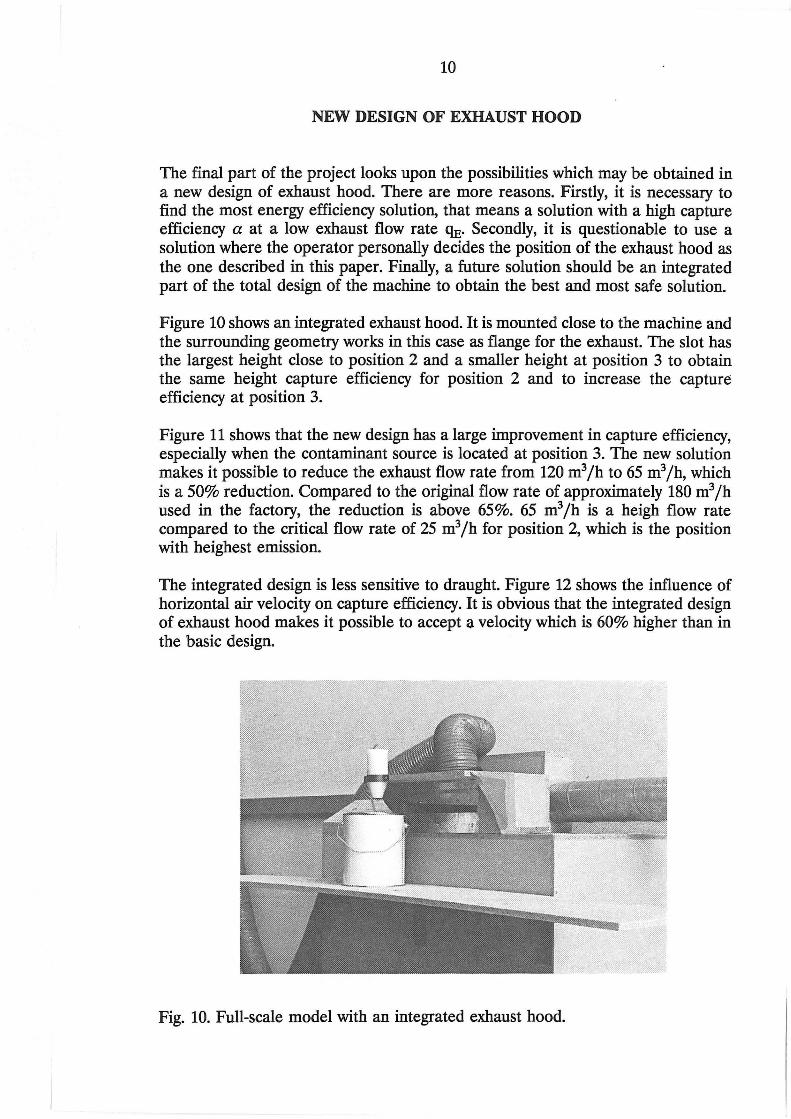
Figure 10 shows an integrated exhaust hood. It is mounted close to the machine and the surrounding geometry works in this case as flange for the exhaust. The slot has the largest height close to position 2 and a smaller height at position 3 to obtain the same height capture efficiency for position 2 and to increase the capture efficiency at position 3.
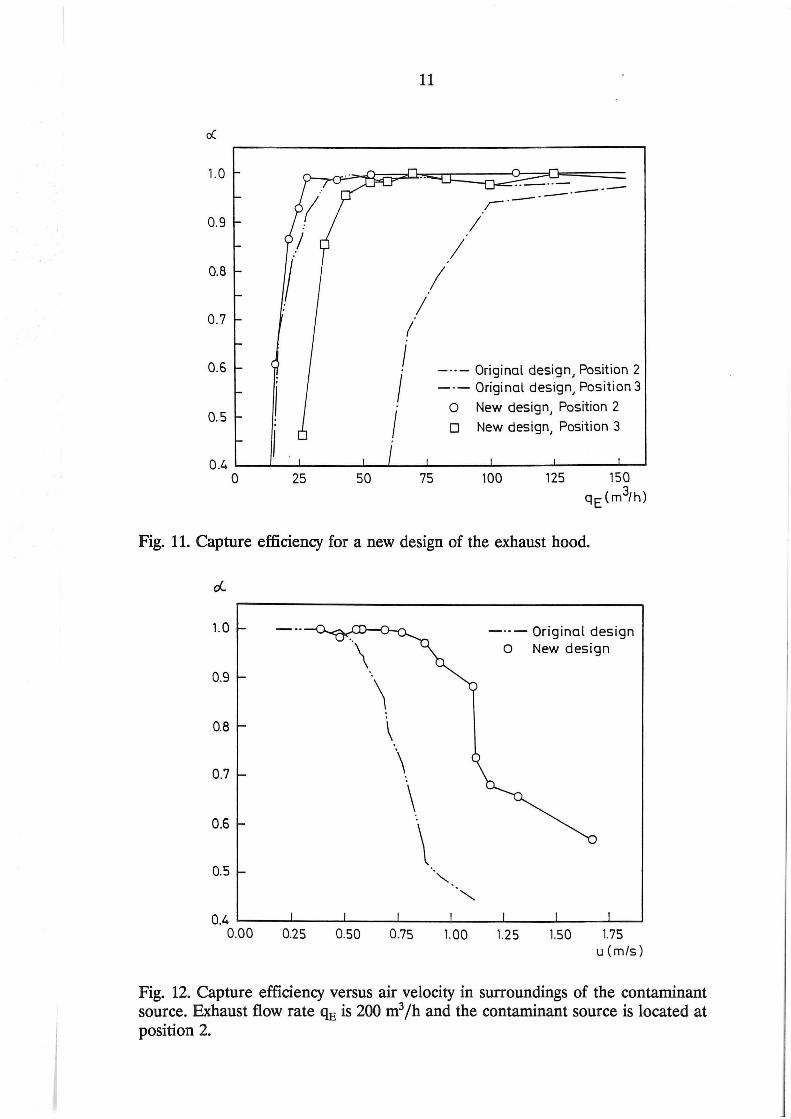
Figure 11 shows that the new design has a large improvement in capture efficiency, especially when the contaminant source is located at position 3. The new solution makes it possible to reduce the exhaust flow rate from 120 m3 /h to 65 m3 /h, which is a 50% reduction. Compared to the original flow rate of approximately 180 m3 /h used in the factory, the reduction is above 65%. 65 m3 /h is a heigh flow rate compared to the critical flow rate of 25 m3 /h for position 2, which is the position with heighest emission.
The integrated design is less sensitive to draught. Figure 12 shows the influence of horizontal air velocity on capture efficiency. It is obvious that the integrated design of exhaust hood makes it possible to accept a velocity which is 60% higher than in the basic design.
Fig. 10. Full-scale model with an integrated exhaust hood.
d:.
1.0
0.9
0.8
0.7
0.6
0.5 I I
0.4 0 25 50
(
I I
I
11
/
I I
I I
75
- --- Original design, Position 2 ---Original design, Position 3
0 New design, Position 2
0 New design, Position 3
100
Fig. 11. Capture efficiency for a new design of the exhaust hood.
d..
1.0
0.9
0.8 \ 0.7 \
\ 0.6 ·.
\ 0.5
0.25 0.50 0.75
" ""'
1.00
-·-- Original design 0 New design
1.25 1.50 1.75 u(m/s)
Fig. 12. Capture efficiency versus air velocity in surroundings of the contaminant source. Exhaust flow rate % is 200 m3 /h and the contaminant source is located at position 2.
12
CONCLUSION
It is difficult to make an efficient design of an exhaust hood by working with the capture velocity concept. The velocity distribution in the surroundings of an exhaust hood will in some cases be heigher than given in textbooks for undisturbed surroundings. It is possible to improve the method by taking account of the local geometry. Full-scale experiments make it possible to work with capture efficiency and to measure source emission rates. The capture efficiency concept makes it possible to design a good and efficient exhaust hood, and it is possible to study the influence from different parameters.
LITERATURE
[1] Me. Dermott, HJ. "Handbook of Ventilation for Contaminan Control". Ann Arbor Science Publishers Inc., Ann Arbor, (1976).
[2] Dalla Valle, J.M. "Exhaust Hoods". The Industrial Press, New York, (1952).
[3] Committee on Industrial Ventilation, American Conference of Governmental Industrial Hygienists, Industrial Ventilation. "A Manual of Recommended Practice, 20th ed.". Committee on Industrial Ventilation, Lansing MI, (1988).
[4] Heiselberg, P. and Nielsen, P.V. "The Contaminant Distribution in a Ventilated Room with DifTerent Air Terminal Devices". ROOMVENT '87, International Conference on Air Distribution in Ventilated Spaces, Stockholm, (1987).
[5] Jansson, A "Local Exhaust Ventilation and Aerosol Behaviour in Industrial Workplace Air". Arbete och Halsa 1990:43, Ventilation Division, National Institute of Occupational Health, Sweden, (1990).
[6] Valbj0m, 0. "Point Exhaust and General Ventilation" (In Danish), VVS, Nr. 9, Copenhagen, (1977).
[7] Jansson, A "Capture Efficiencies of Local Exhaust for Hand Grinding". Drilling and Welding, Staub-Reinhalt. Luft, 40, Nr. 3, (1980).
PAPERS ON INDOOR ENVIRONMENTAL TECHNOLOGY
PAPER NO. 1: C. E. Hyldgard: Aerodynamic Control of Exhaust. ISSN 0902-7513 R8712.
PAPER NO. 2: Per Heiselberg, Peter V. Nielsen: The Contaminant Distribution in a Ventilated Room with Different Air Terminal Devices. ISSN 0902-7513 R8713.
PAPER NO. 3: Peter V. Nielsen, L. Evensen, Peter Grabau, J . H. Thulesen-Dahl: Air Di.dribution in Rooms with Ceiling-Mounted Obstacles and Three-Dimensional Flow. ISSN 0902-7513 R8714.
PAPER NO. 4: Peter V. Nielsen, Ake T. A. Moller: Measurements on Buoyant Wall Jet Flows in Air-Conditioned Rooms. ISSN 0902-7513 R8715.
PAPER NO. 5: Peter V. Nielsen: Numerical Prediction of Air Distribution in Rooms. Status and Potentials. ISSN 0902-7513 R8823.
PAPER NO. 6: Peter V. Nielsen, Ake T. Moller: Measurements on Buoyant Jet Flows from a Ceiling-Mounted Slot Diffuser. ISSN 0902-7513 R8832.
PAPER NO. 7: Peter Kofoed, Peter V. Nielsen: Thermal Plumes in Ventilated Rooms- An Experimental Research Work. ISSN 0902-7513 R8833.
PAPER NO. 8: Peter V. Nielsen, Lars Hoff, Lars Germann Pedersen: Displacement Ventilation by Different Types of Diffusers. ISSN 0902-7513 R8834.
PAPER NO. 9: Per Heiselberg, Peter V. Nielsen: Flow Conditions in a Mechanically Ventilated Room with a Convective Heat Source. ISSN 0902-7513 R8835.
PAPER NO. 10: Peter V. Nielsen: Displacement Ventilation in a Room with LowLevel Diffusers. ISSN 0902-7513 R8836.
PAPER NO. 11: Peter V. Nielsen: Airflow Simulation Techniques - Progress and Trends. ISSN 0902-7513 R8926.
PAPER NO. 12: M. Skovgaard, C. E. Hyldgaard & P. V. Nielsen: High and Low Reynolds Number Measurements in a Room with an Impinging Isothermal Jet. ISSN 0902-7513 R9003
PAPER NO. 13: M. Skovgaard, P. V. Nielsen: Numerical Prediction of Air Distribution in Rooms with Ventilation of the Mixing Type using the Standard K, £
Model. ISSN 0902-7513 R9042.
PAPER NO. 14: P. Kofoed, P. V. Nielsen: Thermal Plumes in Ventilated RoomsMeasurements in Stratified Surroundings and Analysis by Use of an Extrapolation Method. ISSN 0902-7513 R9043.
PAPER NO. 15: P. Heiselberg, M. Sandberg: Convection from a Slender Cylinder in a Ventilated Room. ISSN 0902-7513 R9044.
PAPERS ON INDOOR ENVIRONMENTAL TECHNOLOGY
PAPER NO. 16: C. E. Hyldgaard: Water Evaporation in Swimming Bat~. ISSN 0902-7513 R9045.
PAPER NO. 17: H. Overby, M. Steen-Th0de: Calculation of Vertical Temperature Gradient3 in Heated Room3. ISSN 0902-7513 R9046.
PAPER NO. 18: P. V. Nielsen, U. Madsen, D. Tveit: Experiment3 on an Exhaust Hood for the Paint Industry. ISSN 0902-7513 R9146.
PAPER NO. 19: L. Germann Pedersen, P. V. Nielsen: Exhau3t Sy3tem Reinforced by Jet Flow. ISSN 0902-7513 R9147.
PAPER NO. 20: P. V. Nielsen: Model3 for the Prediction of Room Air Distribution. ISSN 0902-7513 R9148.
PAPER NO. 21: M. Skovgaard, P. V. Nielsen: Modelling Complex Inlet Geometrie3 in CFD - Applied to Air Flow in Ventilated Room3. ISSN 0902-7513 R9149.
PAPER NO. 22: M. Skovgaard, P. V. Nielsen: Numerical Inve3tigation of Transitional Flow over a Backward Facing Step u3ing a Low Reynold3 Number k- c;
Model. ISSN 0902-7513 R9150.
PAPER NO. 23: P. Kofoed, P. V. Nielsen: Auftrieb33tromungen ver3chiedener Warmequellen - Einflus3 der umgebenden Wande auf den geforderten Volumenstrom. ISSN 0902-7513 R9151.
· PAPER NO. 24: P. Heiselberg: Concentration Di3tribution in a Ventilated Room under Isothermal Condition3. ISSN 0902-9152.
Department of Building Technology and Structural Engineering The University of Aalborg, Sohngaardsholmsvej 57. DK 9000 Aalborg Telephone: 45 98 15 85 22 Telefax: 45 98 14 82 43