experiments on the effectiveness of dataflow- and controlflow
TRANSCRIPT

Experiments on the Effectiveness of
Dataflow- and Controlflow-Based Test Adequacy CriteriaResearch Paper
Monica Hutchins, Herb Foster, Tarak Goradia, Thomas Ostrand
Siemens Corporate Research, Inc.
755 College Road East, Princeton, NJ 08540 U.S.A.
Email: {mhutchins,hfoster, tgoradia,tostrand } @scr.siemens.com
Abstract
This paper reports an experimental study investigating
the effectiveness of two code-based test adequacy criteria
for identifying sets of test cases that detect faults. The all-
edges and all-D Us (modified all-uses) coverage criteria
were applied to 130 faulty program versions derived from
seven moderate size base programs by seeding realistic
faults. We generated several thousand test sets for each
faulty program and examined the relationship between
fault detection and coverage. Within the limited domain
of our experiments, test sets achieving coverage levels
over 90?Zo usually showed sigrdjlcantly better fault
detection than randomly chosen test sets of the same size.
In addition, sigrd$cant improvements in the effectiveness
of coverage-based tests usually occurred as coverage
increased from 90% to 100Yo. Howeve~ the results also
indicate that 100?Zo code coverage alone is not a reliable
indicator of the effectiveness of a test set. We also found
that tests based respectively on controljlow and dataflow
criteria are frequently complementary in their
effectiveness.
1 Introduction
Control flow-based code coverage criteria have beenavailable to monitor the thoroughness of software tests atleast since the 1960’s [11, 12, 24]. More recently,dataflow-based methods have been defined andimplemented in several tools [7, 10, 15, 20]. Variouscomparisons have been made of the theoretical relationsbetween coverage methods [4]. However, the questions ofreal concern to researchers and potential users of theseadequacy criteria deal with their actual effectiveness indetecting the presence of faults in programs. Testmanagers and developers would like to know whether theinvestment in systems to monitor code coverage isworthwhile, and whether the effort to look for additionaltests that increase coverage is well-spent. They wouldlike to know the additional cost of achieving adequatecoverage, the payback for that cost, and in particular,whether fault detection increases significantly if test setsare adequate or close to adequate according to the criteria.
In an effort to answer these questions, we haveperformed experiments comparing dataflow coverage andcontrolflow coverage using the dataflow coverage systemTactic developed at Siemens Corporate Research [20]. Tomake our results as relevant as possible to professionalsoftware developers and testers, we searched availablepublic archives for specifications and C programs thatwould be suitable for the study. We ended up with sevenmoderate-size C programs, into which we seeded 130different faults.
Section 2 of the paper describes the test adequacycriteria that are monitored by Tactic. Section 3 brieflydescribes some previous work relating to evaluation ofadequacy criteria. Section 4 lpresents the goals of ourstudy, discusses assumptions and the design of theexperiments, and describes the programs used in thestudy. Section 5 explains some of the data analysis. InSection 6 we describe our observations. Section 7contains conclusions.
2 The Test Adequacy Criteria
2.1 Dataflow Coverage
Dataflow-based adequacy criteria stipulate that a testset must exercise certain clef-use associations that exist inthe code. A def of a memory location is an operation thatwrites a value to the location. A use of a location is anoperation that reads the location’s current value. A def-
use association (DU) for a given location is a pairconsisting of a def and a use of the location, such thatthere is a controlflow path in the code from the def to theuse on which there is no intermediate redefinition orundefinition of the location. A test case exercises aparticular clef-use association if the test case causesexecution to arrive at the site of the def operation andexecute the clef, and subsequently arrive at the site of theuse operation and execute the use, without havingexecuted any other def or undefinition of the memorylocation. A test set exercises a DU if at least one test casein the set exercises the DU.
Note that a DU is defined in terms of static propertiesof the code, i.e., in terms of the existence of a path in thecode’s controlflow graph, while exercising a DU isdefined in terms of dynamic execution. To satisfy the all-
0270-5257/94 $3.00 @ 1994 IEEE
191
DUS criterion, a test set must exercise every executableDU in the program.
Test adequacy criteria based on dataflow wereproposed by Rapps and Weyuker [22, 23], Ntafos [18],and Laski and Korel [16] as alternatives to thecontrol flow-based measures of test adequacy.
The first dataflow adequacy tool was implemented byFrankl, Weiss, and Weyuker [7,8], who built the ASSETsystem that operated on Pascal code in accordance withthe definitions of Rapps and Weyuker. The inputs toASSET are a Pascal program and a set of test data; itsoutput is a determination of whether or not the test dataare adequate with respect to one of the Rapps-Weyukerdataflow criteria.
The Tactic system for C programs evaluates test setsfor all-DUs adequacy, as well as for all-edges adequacy.Since our ultimate goal is to produce a test adequacy toolthat is usable in production environments, Tactic handlesalmost all of standard C, including structures, arrays,pointer references, and interprocedural dataflow. A keyfeature of Tactic is its ability to perform accurate analysisof code for clef-use associations where one or both of thedef and use are indirect references [20, 21]. Although thiscapability greatly enhances the system’s ability to trackdataflow accurately, it also greatly increases the numberof clef-use associations detected for a program, as well ascreating the problem of determining whether or not thereexists a runtime clef-use association that corresponds to astatically found clef-use association involving a pointerreference or a structure element.
Our dataflow criterion all-DUs differs from the anu-
ses criterion originally defined by Rapps and Weyukerand used as the basis of ASSET. Because of the followingthree major differences, test sets satisfying all-DUs are ingeneral not comparable to sets satisfying all-uses. First,we do not distinguish between c-uses and p-uses; a use isany occurrence in the program where a value is accessedfrom memory. In the Rapps-Weyuker theory, p-uses weredefined so that satisfaction of all-uses would implysatisfaction of branch coverage, since a p-use of everyvariable that appears in the predicate of a decisionstatement is placed on every branch that leads away fromthe predicate. In our system, all-DUs does not subsumebranch coverage, since our definition does not provide away to force execution of any particular branch leaving apredicate node. We do not combine DU and branchcoverage in a single criterion since each measure has itsseparate benefits. In addition, for these experiments, wewere interested in studying the effects of ~he individualtest requirements induced by each type of coverage.
Second, our definition of use is not restricted to namedvariables, since in C it is possible to reference a memorylocation through a pointer without having a variableassociated with the location. Thus, a def occurs whendynamically allocated memory is assigned a value with astatement such as *p = 15; a corresponding use occurs ina statement such as x = *q + 5, if there have been nointervening definitions of the location, and q points to thelocation assigned to through p. We aiso capture
interprocedural clef-use associations, where the def occursin a calling procedure, and the use in the called procedureis through a dereferenced pointer or a global variablereference.
Third, our method of checking test execution forsatisfaction of the dataflow criteria differs from that usedin ASSET, where a DU is considered exercised if a def-clear path from a def node to a use node is executed. Inthe presence of pointer dereferences, it is not sufficient tomonitor the execution of paths from def sites to use sites,since this does not guarantee that the def and use are ofthe same memory location, or even that a def or use havebeen executed. Hence Tactic considers a DU to beexercised only when an actual write of a memory location(the clef) is followed by an actual fetch from that location(the use).
2.2 Controlflow Coverage
Edge coverage by Tactic extends traditional branchcoverage by considering not only edges based on explicitcontrolflow statements in the code, but also edges basedon implicit controlflow in Boolean expressions. Forexample, Tactic considers the C statement
if (a && b && c) x=5;
else x=1O;
to have 6 edges, not 2; four sets of values for a, b, and care required to exercise all the edges. Beizer [3] refers tothis level of coverage as predicate coverage.
3 Other Experimental WorkFrankl and Weiss conducted a study [6] which
compared the all-edges criterion to the all-uses criterionfor nine Pascal programs. For some of the subjectprograms, they concluded that test sets satisfying the anu-ses criterion were more effective at detecting faults thansets satisfying all-edges. We discuss the FrankI-Weissstudy in greater detail in Section 4.2.3.
A study by Basili and Selby [2] attempted to comparethree techniques: code reading by stepwise abstraction,functional testing using equivalence partitioning andboundary value analysis, and structural testing usingstatement coverage. Seventy-four programmers appliedthe three techniques to four unit-sized programscontaining a total of 36 faults in a fractional factorialexperiment, giving observations from 222 testing sessionson the effectiveness of the testing methods. They also dida cost analysis and a characterization of the faultsdetected.
A study by Thevenod-Fosse, Waeselynck, and Crouzet[25] used mutation scores to compare the effectiveness ofdeterministic structural testing techniques to their ownmethod of test generation (structural statistical testing).The mutations were automatically created from four smallC programs, creating a total of2914 mutants; equivalentmutants were eliminated by hand. The test sets for thedeterministic part of the testing were created by hand foreach criterion under consideration; for each criterion andfor each program, at most 10 test sets were designed, withat most 19 members in each test set. The resulting
192

mutation scores of these test sets were used to determinethe relative effectiveness of the methods. The studyconcluded that structural statistical testing was moreeffective.
Foreman and Zweben’s [5] study examined theeffectiveness of several variants of controlflow anddataflow criteria in detecting thirty of the real faults thatwere documented by Knuth [14] during development ofthe TeX program. A testing criterion was consideredeffective at detecting a fault only when all test setssatisfying the criterion revealed the fault. Application ofthe all-uses criterion guaranteed detection of thirteen ofthe thirty faults. Eleven of these thirteen were alsoguaranteed to be detected by tests satisfying branchcoverage.
4 Goals and Design of the Experimental Study
4.1 Goals
Broadly stated, our goal for these experiments was toobtain meaningful information about the effectiveness ofcontrolflow and dataflow coverage methods for faultdetection. We hoped to document the differentcapabilities of the two coverage methods. We also tried toanswer questions concerning the use of code-basedcoverage criteria, e.g., whether it is necessary to achieve1009. coverage to benefit from using a criterion.
An important goal was to carry out the experiment onrealistic programs, using test generation techniques thatare similar to actual practice.
4.2 Experimental Design
While designing an experiment for comparing the faultdetection ability of two testing strategies, the choice ofsubject faulty programs is clearly very important. Ideally,they should represent both the program space and thefault space. Our sampling of the program space wasseverely restricted, partly due to the availability ofresources for carrying out the experiments and partly dueto the limitations of our prototype. Our sampling of thefault space was also restricted. Ideally, the most desirabletypes of faults to study would be real faults that have beenrecorded in the course of development of productionsoftware. However, since there is only scant informationavailable to us about production faults, we decided tomanually create and seed faults into the subject programs.For the experiment, we created 130 faulty programversions from seven moderate size base programs by
seeding realistic faults. Characteristics of the baseprograms and the seeded faults are described in Section4.3.
The results of this study should be interpreted keepingin mind this limited representation of the program spaceand the fault space.
Adequacy criteria such as all-DUs or all-edges define astopping rule, but do not specify how the test cases are tobe generated, analyzed, and validated. There are severalpossible models for a testing strategy using a coverage-based test adequacy criterion. In this section, we firstdescribe one such model and discuss the compromisesmade in order to implement this model in ourexperiments. Then we describe the experimentalprocedure based on the compromised model.
4.2.1 Model of Coverage-based Testing
As shown in Figure 1, our experimental design isbased on the following model of a coverage-based testingstrategy. First, the tester generates an initial set of testcases and runs the coverage analysis on it. If the coverageis inadequate, the tester generates additional test casesuntil adequate coverage is attained. The resultingintermediate test set may be too big or may contain testcases that are redundant with respect to the goal ofachieving adequate coverage. Hence the tester mayemploy a strategy to prune the intermediate test set andobtain a test set with a smaller number of test caseshaving the same coverage. The purpose of this pruningmay be to reduce the effort for validating the test casesand/or the effort for maintenance of the test set.
Ideally, satisfaction of an adequacy criterion by a testset would assure a specific level of fault detectionregardless of the methods used in generating the test casesand in pruning the test sets. However, our experience inthis study indicates that for (he all-DUs and all-edgescriteria, this is not true: two test sets satisfying the samecoverage criterion may differ widely in their faultdetection ability. The quality of the final test set producedmay be affected by the methods used for initial testgeneration, additional test generation, and test setpruning. Usually the initial lest generation method isindependent of the coverage criterion, while theadditional test generation and test set pruning methodsuse the coverage information produced by the test casespreviously generated. Below, we discuss the practicalproblems encountered in specifying these methods and
I I Coverage Info
Initial Intermediate
Test Cases Test Set‘@*
Figure 1: ModeI of Coverage-based Testing
193

describe the compromises made to work around theproblems.
Test Generation
Testers use their own expertise and domain knowledgein designing initial and additional test cases. We foundthat adequate test sets produced by different testers variedin their effectiveness at detecting faults. Interestingly,adequate test sets produced by the same tester also vanedin their effectiveness. Therefore, in order to compare twotesting strategies for a given program, it was necessary tocarry out a statistical comparison of the fault detectionabilities of a large number of independent test sets thatwere produced by using each of the testing strategies.Towards this goal, we introduce the notion of a test pool
and describe the test set generation method used forchoosing test sets from the test pool. Ideally, the test poolfor a specific (program, specification, tester) combinationshould be the set of all test cases that are accessible to thetester while testing the program against the specification.By accessible test cases, we mean those from which thetester is likely to choose, given his/her expertise andknowledge of the program domain. In reality, the testcases accessible while following one testing strategy maybe very different from those accessible while followinganother strategy. For simplicity, we assume that the
accessible test cases do not vary significantly between the
testing strategies based on the all-DUs and all-edges
criteria. Also, the likelihood of choosing a test case maydiffer across the test pool, hence we would also need aprobability distribution function to accompany the testpool. For lack of a better option, we use a uniform
distribution. To minimize the bias introduced by aspecific tester, we used two to three testers for generatingthe test pool. Given the test pool, the test set generationmethod was straightforward: test cases are randomlyselected from the test pool until a desired size test set isobtained. We hope that the test sets thus produced wouldrepresent the variety of test cases that the testers are likelyto produce. The actual procedure used to generate the testpools for the subject programs is described later.
Test Pruning
As mentioned earlier, the purpose of test set pruningcould be to reduce the effort for validating the test casesand/or the effort for maintenance of the test set. Since ourgoal was to examine the effectiveness of test adequacycriteria, test cases that did not improve coverage were oflittle value. If an intermediate test set consisted of n testcases, t,through tn,generated in that order, the test setpruning method eliminated a test case tiif it did notimprove the cumulative coverage obtained by test cases t,through ti.l.
Summary
In our experiment, we consider a f@ed set of faultyprograms and a fixed group of testers. In order to simulatethe behavior of the testers for selecting test cases severaltimes using each of two coverage criteria, we introducethe notion of a test pool that approximates the set of testcases accessible to the testers while testing a specific
(program, specification) pair. Random selection from thistest pool is used as the test generation method. The testpruning method is dependent on the coverage criteria:following the order of test generation, test cases that donot improve coverage are eliminated.
Below. we elaborate the actual twocedure used forgenerating the test pool and test sets: and for collectingthe experimental data.
4.2.2 Actual Experimental Procedure
Test Pool Generation
We produced the test pool for each program in twostages that correspond to the way a tester might use anadequacy criterion in practice. The first stage consisted ofcreating a set of test cases according to good testingpractices, based on the tester’s understanding of theprogram’s functionality and knowledge of special valuesand boundary points that are easily observable in thecode. To create this initial test pool (ITP), the testerapplied the category-partition method to write testspecification scripts for the Siemens TSL 1 tool [1, 19] toproduce test cases. The, tester examined the coverageachieved by the TSL-produced tests, and modified the testspecification to improve coverage. At some point, thetester decided that it was time to move on to the secondstage where helshe individually examined the unexercisedcoverage units in the code and attempted to write testcases to exercise them. In fact, the goal was to insure thateach exercisable coverage unit was covered by at least 30diflerent test cases, where two test cases are considereddifferent if the simple control paths that they exercisediffer2. Since the test pools as described so far wereconstructed from the base versions of the programs, wealso examined each faulty version, and added necessarytest cases to the pool to insure that each exercisablecoverage unit in the faulty versions was covered by atleast 30 cases. The cases in this additional test pool (ATP)
were mostly hand generated, although sometimes newTSL scripts were written to specify the test cases. Thefinal set of test cases produced by augmenting the initialpool is called the test pool (TP). Table 2 gives the sizes ofthe test pools for each base program and indicates therelative size of the corresponding initial and additionaltest pools. For every test case in a test pool, we ran eachof the faulty versions of the program and recorded in atable the outcome (correct = no fault detection, incorrect= fault detection) and the list of edges and DUS exercisedby the test case.
1TSL is a compiler whose input includes a specification of thefunctional characteristics of the software to be tested, togetherwith a description of the runtime testing environment. Thetool’s output is an executable test script of the test cases.
ZThe rea50n for requiring 30 different test casesfor each cOver-
age unit is to ensure that the results are not biased by the abilityof a small number of test casesto detect fauks. The sample sizeof 30 ensures that any observed correlation between a coverageunit and fault detection has reasonable statistical significance.
194

Generating Test Sets
To measure the fault detecting ability of test sets atdifferent levels of Edge and DU coverage, we generatedfor each criterion approximately 5000 test sets for eachfaulty program from the program’s test pool. We realizedthat it is generally not possible to generate test sets thatexactly achieve a specified coverage level. Therefore, weused the following strategy to indirectly obtain test setswith a variety of coverage levels.
To generate a test set of desired size N for a givenprogram, we applied the test generation and test pruning
3 The test cases were randomlymethods in parallel.selected out of the test pool. If a selected test caseincreased the coverage achieved by the previouslyselected tests on the program, it was added to the test set.The set was considered complete as soon as either its sizereached N or its coverage reached 100% (since no testcase can increase coverage after that). In some cases,therefore, the resulting test set size was smaller than thedesired test set size. In order to generate test sets with awide variety of coverage levels, the desired sizes werechosen randomly from the integers 1,2,.. .,R, where R wasdetermined for each program %y trial and error as anumber slightly larger than the size of the largest test setreaching 100% coverage.
4.2.3 Comparison with the Experimental Design of
Frankl and Weiss
The design of our experiment is somewhat similar tothat of the Frankl and Weiss experiment [6] comparingdataflow- and control flow-based adequacy criteria.Below, we briefly describe their experiment and compareit with ours.
Frankl and Weiss used the ASSET system to studynine Pascal programs, each with a single existing error.For each program, they first generated a large set of testcases called the universe. Each test case was executed, itsoutput was checked for correctness, and the program pathit exercised was recorded by ASSET. In the evaluationphase of the study, the recorded information was used todetermine each test set’s edge coverage and clef-usecoverage.
Test sets of a chosen size S were built by randomlyselecting S test cases from the universe. Each test set’sall-uses coverage percentage was calculated, and it wasrecorded whether or not one or more test cases in the setdetected the fault. The size S was chosen such thatsignificant numbers of both all-uses adequate and all-edges adequate test sets would be chosen. On average, theall-uses adequate test sets were larger in size than the all-edges adequate test sets. The largest of the programsconsidered had 74 executable edges and 106 executableuses.
3 The resulting test sets are the same regardless of whether the
test generation and test pruning methods are applied in se-quence or in parallel.
Thus, the Frankl and Weiss study differed from ourstudy in the following aspects:●
●
●
✎
small Pascal programs vs. moderate-size C programs
ASSET system vs. Tactic system
existing faults vs. seeded faults
very few faults vs. relatively large number of faults,
no test set pruning vs. removal of test cases tlhat do not
improve coverage,
all-uses vs. all-DUs, and
different methods used for generating the test pool (uni-verse).
4.3 Subject Faulty Programs
Base Programs
The base programs were chosen to meet specialcriteria. To allow creation of a reasonable test pool, theymust have an understandable specification. Because eachprogram must be understood by several people (to seedfaults, to create tests, and to examine the code forinfeasible clef-use associations and edges), they must notbe overly complex. But they also have to be large andcomplex enough to be considered realistic, and to permitthe seeding of many hard-to-find errors. Each programmust be compilable and executable as a stand-alone unit.The programs used for the experiment are C programsobtained from various sources, ranging in length from141 to 512 lines of code. Table 1 shows the number oflines of code (excluding blanks and comments) in each ofthe base programs, the number of executable edges andDUS, and a brief description of each program.
Table 1: Base Programs
ExecutableProgram LOC Description
Edges Dus
replace
teas % :: 6=~~~tion
US1.123 472 97
E
1268 lexical analyzer
USI.128 399 159 240 lexical analyzer
schedule 1 292 62 ’294 priority scheduler
schedule2 301 80 217 priority scheduler
tot_info 440 83 292 information measure
Seeding Faults
We created faulty versions of each base program byseeding individual faults info the code. The faults aremostly changes to single lines of code, but a few involvemultiple changes. Many of the faults take the form ofsimple mutations or missing code. Creating N faultyversions from the same base program has significantbenefits: the understanding gained from studying the codeapplies to all N versions, and the work involved ingenerating the test pools applies to all the versions.Perhaps most significant, the existence of the (presumed
195

Table 2: Faulty Versions and Test Pools
“S’‘“’~”f-’’~l:~Program‘erslOns Tests (ITP) Tests (ATP) (ITP + ATP)
replace I 32 I 79% I 21% I 5548 I .0005-.056
teas I 39 I 65% I 35% I 1562 I .0006-.084
US1.123 7 99% 1% 4092 .0007-.056
US].128 10 99% 1% 4076 .0079-.086
schedulel I 9 I 90% \ 10% I 2637 I .0027-.100
schedule2 I 10 I 77% I 23% \ 2666 \ .0008-.024
tot_info 23 64% 36% 1067 .0019-.159
correct) base version supplies us with an oracle to checkthe results of test cases executed on the faulty versions.
To produce meaningful results, we had to place certainrequirements on the seeded faults. The faults had to beneither too easy nor too hard to detect. If they were toohard, then all fault detection ratios would have beenessentially zero, and no visible differences among thetechniques would have been observable. If they were tooeasy, then almost any test set would have detected them,and there would have been no measurable effect of thecoverage to observe. We set a lower bound of 3 detectingtest cases, and an upper bound of 350 for each faultyprogram. The program US1.128, for instance, with a testpool size of 4076 cases, had 10 faulty versions; thehardest fault was detected by 32 test cases (detection ratio.0079), and the easiest by 350 (detection ratio .086). Morethan 55 of the originally seeded faults were not includedin the study because of very low detection and more than113 were not included because of very high detection.The 130 faults included in the study were created by 10different people, mostly without knowledge of eachother’s work; their goal was to be as realistic as possible,by introducing faults that reflected their experience withreal programs. For each base program, Table 2 gives thenumber of faulty versions, the composition and sizes ofthe test pool, and the range of failure ratios of the test poolover the faulty versions of the program.
5 Data AnalysisThe basic data collected for the experiments was the
fault detecting ability of the test sets generated for eachfaulty program. Since we wanted to see how faultdetection varied as coverage levels increased towards100%, the test generation procedure was designed toproduce a wide range both of test set sizes and coveragepercentages, specifically to produce at least 30 test setsfor each 2% coverage interval for each program.
The resulting data allowed us to examine therelationships among the coverage level, size, and faultdetection attributes of the test sets produced by applyingeach of the testing strategies to each faulty program.
Figure 2 shows an example of the graphs we used to studythese relationships for each individual faulty program.The coverage graph shows the relationship between faultdetection and the coverage levels of test sets, and the sizegraph shows the relationship between fault detection andthe sizes of test sets.
The horizontal axis of the coverage graph is dividedinto 290 wide intervals (e.g., 9 l-93~0) ending at 99’%0,andthe rightmost interval which is 1% wide (99-100%). Eachplotted point represents the fault detection ratio of all thetest sets whose coverage is within an interval. The faultdetection ratio for a given interval is tin, where n is thetotal number of test sets whose coverage percent is in theinterval, and m is the number of these sets that contain afault-detecting test case. The fault detection ratio for eachinterval is plotted against the midpoint of the interval. Thegraph shows two plots, one for DU coverage and one forEdge coverage. In the example, .75 of the test sets with a97-99% DU coverage level and .43 of the test sets with a97-99% Edge coverage level detected the fault.
The horizontal axis of the size graph is divided intosize intervals of width 2. For each interval and for eachcoverage type, the fault detection ratio is defined as tin,
where n is the total number of test sets of that coveragetype in the size interval, and m is the number of these setsthat contain at least one test case that detects the fault inthe program. The fault detection ratios for each intervalare plotted against the midpoint of the interval. We alsoanalytically computed the fault detection ratio for test setsof sizes that are randomly chosen from the program’s testpOOl. This function is referred to as Frandc)m,and is shown
on the size graph together with the two plots for thecoverage-based strategies. This makes it possible toinvestigate the role of test set size in determining faultdetection. In the example of Figure 2, test sets for theinterval 22-23 had the following fault detection ratios:
random sets (of size 23): .42
Edge-based sets: .48
DU-based sets: ,70
196

Coveraae Granh
1.o-
0
~ 0.8-
co
“$ 0.6-
s=a 0.4 -L
0.2-
●
EEz!!l ‘“● ++
● +++● ++
●
+9+’
1.0-
.g
$ 0.8 -co.-GS! 0.8 -
:~
j, 0.4 -
.-l
~
●9*”””●
●
●☛ ●
‘/ /●
+“ .+++ ●“$●
dI 1 1 I ““’L’=
60 70 80 90 100 10 20 30 40 50Percent Coverage Test Set Size
Figure 2: Fault Detection Ratios for One Faulty Program
In the example of Figure 2, DU-based test sets atcoverage levels from 90- 100% clearly outperform Edge-based test sets, and in addition DU-based test sets of size10 or greater outperform random test sets. In general,however, the performance of both types of coveragevaried widely. Therefore, we attempted to classify eachfaulty program according to the method that seemed mosteffective in detecting its fault. To do this, we first definedsix relations DU> Edge, Edge> DU, DU> Random,
Edge >Random, Random >DU and Random> Edge asdescribed below.
For each faulty program, we fitted second order, leastsquares curves to the coverage and size plots for eachstrategy. The curves fitted to the coverage plots are FCDUand FCedpe, and the curves fitted to the size plots areFSDU arido~Se@e.
For each fault, we say that DU>Edge if FCnll(lOO%)
is greater than FCedge( 1MY%), and the differenc~~s largerthan the standard deviation of the difference between themeasured fault detection ratios and their least squaresapproximations [9]. A similar definition applies forEdge>DU, with “Edge” and “DU’ interchanged.
For a given test set sizes, the notation Frand,)m(s) is theprobability that a randomly chosen set ofs test cases fromthe test pool contains at least one fault-detecting test case,i.e., Frmdom (s) is the expected fault detection ratio ofrandom test sets of size s. To avoid bias in favor of thecoverage strategies, Frand{)mis always calculated from thetest pool with the higher failure ratio, either TP or ITP. Letd be the size of the largest test set generated for DUcoverage, and let M~Du be the maximum value ofFSDU(S) for the sizes (1 ,...,d). Similarly, let e be the sizeof the largest test set generated for Edge coverage, and letMaxed ~ be the maximum vahle of FSedge(s) for the sizes(1 ,...,f’f. We say that DU>Random if Max~u> F,and,)m(d),
and Edge >Random if Maxed8e >Frdn&~(e), and these
differences satisfy a standard cieviation property similar tothat for DU>Edge and Edge> DU. Similarly, we say thatDU < Random if MaxDU<FrurLdc)m(d) and Edge <Random
( ).‘f ‘aed e< ‘random eiFor 2 faults, all detection ratios were so low that it did
not make sense to compute the above relations, hence werefer to them as low detection faults. Specifically, a faultis a low detection fault if its detection ratios were lower
Table 3: Classification of Faults
NumberFault Detection Ratio
Class Characteristics at 10070 coverageof faults
rein, avg, max
DU DU > Edge and DU > Random 31 .19, .67, 1.0
Edge Edge > DU and Edge> Random 25 .17, .57,.99
DU-&-Edge DU > Random and Edge> Random 32.14, .59, 1.0
and not (DU > Edge or Edge> DU)
Coverage Total I DU > Random or Edge> Random \ 88 I
Non-Coverage DU c Random and Edge< Random 9
Other cannot classify 9
197
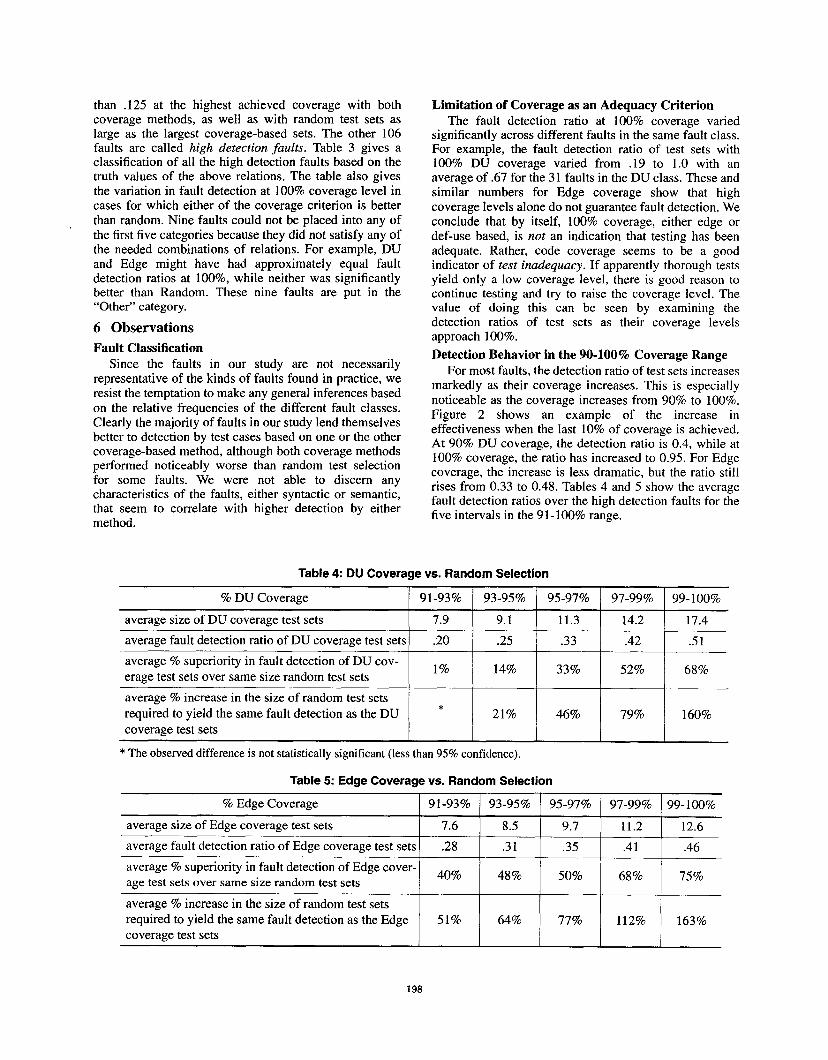
than .125 at the highest achieved coverage with bothcoverage methods, as well as with random test sets aslarge as the largest coverage-based sets. The other 106faults are called high detection faults. Table 3 gives aclassification of all the high detection faults based on thetruth values of the above relations. The table also givesthe variation in fault detection at 100% coverage level incases for which either of the coverage criterion is betterthan random. Nine faults could not be placed into any ofthe first five categories because they did not satisfy any ofthe needed combinations of relations. For example, DUand Edge might have had approximately equal faultdetection ratios at 100%, while neither was significantlybetter than Random. These nine faults are put in the“Other” category.
6 Observations
Fault ClassificationSince the faults in our study are not necessarily
representative of the kinds of faults found in practice, weresist the temptation to make any general inferences basedon the relative frequencies of the different fault classes.Clearly the majority of faults in our study lend themselvesbetter to detection by test cases based on one or the othercoverage-based method, although both coverage methodsperformed noticeably worse than random test selectionfor some faults. We were not able to discern anycharacteristics of the faults, either syntactic or semantic,that seem to correlate with higher detection by eithermethod.
Limitation of Coverage as an Adequacy CriterionThe fault detection ratio at 100% coverage varied
significantly across different faults in the same fault class.For example, the fault detection ratio of test sets with100% DU coverage varied from .19 to 1.0 with anaverage of .67 for the 31 faults in the DU class. These andsimilar numbers for Edge coverage show that highcoverage levels alone do not guarantee fault detection. Weconclude that by itself, 100?ZOcoverage, either edge orclef-use based, is not an indication that testing has beenadequate. Rather, code coverage seems to be a goodindicator of test inadequacy. If apparently thorough testsyield only a low coverage level, there is good reason tocontinue testing and try to raise the coverage level. Thevalue of doing this can be seen by examining the
detection ratios of test sets as their coverage levelsapproach 100%.
Detection Behavior in the 90-100~0 Coverage Range
For most faults, the detection ratio of test sets increasesmarkedly as their coverage increases. This is especiallynoticeable as the coverage increases from 90% to 100%.Figure 2 shows an example of the increase ineffectiveness when the last 10% of coverage is achieved.At 9070 DU coverage, the detection ratio is 0.4, while at100% coverage, the ratio has increased to 0.95. For Edgecoverage, the increase is less dramatic, but the ratio stillrises from 0.33 to 0.48. Tables 4 and 5 show the averagefault detection ratios over the high detection faults for thefive intervals in the91 - 100% range.
Table 4: DU Coverage vs. Random Selection
% DU Coverage / 91-93% [ 93-95% / 95-97% I 97-99% I 99-loo%
average size of DU coverage test sets I 7.9 I 9.1 I 11.3 I 14.2 I 17.4
average fault detection ratio of DU coverage test sets I .20 I .25 \ .33 I .42 I .51
average ?ZOsuperiority in fault detection of DU cov-
erage test sets over same size random test sets
average YOincrease in the size of random test sets
required to yield the same fault detection as the DU
coverage test sets
1%
*
14%
21%
*
46% 79%
68%
160%
* The observed difference is not statistically significant (less than 95% confidence).
Table 5: Edge Coverage vs. Random Selection
VO Edge Coverage 91-93% 93-95% 95-97% 97-99% 99-loo%
average size of Edge coverage test sets 7.6 8.5 9.7 11.2 12.6
average fault detection ratio of Edge coverage test sets .28 .31 .35 .41 .46
average 70 superiority in fault detection of Edge cover-40% 48%
age test sets over same size random test sets50% 68% 75%
1 1 i 1 I
average ?to increase in the size of random test sets
required to yield the same fault detection as the Edge 51% 64% 77% 11270 163%coverage test sets
198
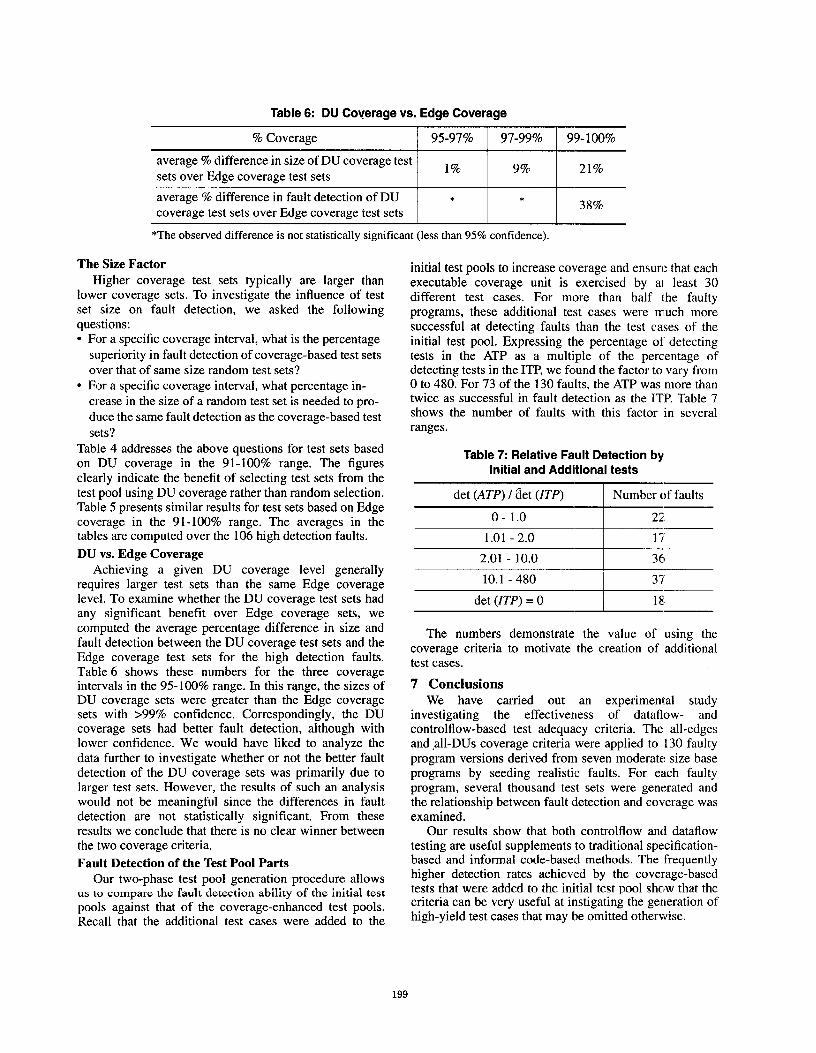
Table 6: DU Coverage vs. Edge Coverage
% Coverage I 95-97% I 97-99% I 99-loo%
average YOdifference in size of DU coverage test170 9% 21%
sets over Edge coverage test sets
average ?6 difference in fault detection of DU * *38%
coverage test sets over Edge coverage test sets
*The observed difference is not statistically significant (less than 95?10confidence).
The Size Factor
Higher coverage test sets typically are larger thanlower coverage sets. To investigate the influence of testset size on fault detection, we asked the followingquestions:● For a specific coverage interval, what is the percentage
superiority in fault detection of coverage-based test setsover that of same size random test sets?
● For a specific coverage interval, what percentage in-
crease in the size of a random test set is needed to pro-
duce the same fault detection as the coverage-based test
sets?
Table 4 addresses the above questions for test sets basedon DU coverage in the 91- 10@Zo range. The figuresclearly indicate the benefit of selecting test sets from thetest pool using DU coverage rather than random selection.Table 5 presents similar results for test sets based on Edgecoverage in the 91-100% range. The averages in thetables are computed over the 106 high detection faults.
DU vs. Edge Coverage
Achieving a given DU coverage level generallyrequires larger test sets than the same Edge coveragelevel. To examine whether the DU coverage test sets hadany significant benefit over Edge coverage sets, wecomputed the average percentage difference in size andfault detection between the DU coverage test sets and theEdge coverage test sets for the high detection faults.Table 6 shows these numbers for the three coverageintervals in the 95-100% range. In this range, the sizes ofDU coverage sets were greater than the Edge coveragesets with >9990 confidence. Correspondingly, the DUcoverage sets had better fault detection, although withlower confidence. We would have liked to analyze the
data further to investigate whether or not the better faultdetection of the DU coverage sets was primarily due tolarger test sets. However, the results of such an analysiswould not be meaningful since the differences in faultdetection are not statistically significant. From theseresults we conclude that there is no clear winner betweenthe two coverage criteria.
Fault Detection of the Test Pool Parts
Our two-phase test pool generation procedure allowsus to compare the fault detection ability of the initial test
pools against that of the coverage-enhanced test pools.Recall that the additional test cases were added to the
initial test pools to increase coverage and ensure that eachexecutable coverage unit is exercised by al least 30different test cases. For more than half the faultyprograms, these additional test cases were much moresuccessful at detecting faults than the test cases of theinitial test pool. Expressing the percentage of detectingtests in the ATP as a multiple of the percentage ofdetecting tests in the ITP, we found the factor to vary fromO to 480. For 73 of the 130 faults, the ATP was more thantwice as successful in fault detection as the ITP. Table 7shows the number of faults with this factor in severalranges.
Table 7: Relative Fault Detection byInitial and Additional tests
det (ATP) / Get (ITP)
--l=
Number of faults
0- 1.0
1.01 -2.0 I 17
2.01 -10.0 I 36
10.1-480 I 37
det (ITP) = O~$
The numbers demonstrate the vahte of using thecoverage criteria to motivate the creation of additionaltest cases.
7 ConclusionsWe have carried ottt an experimental study
investigating the effectiveness of dataflow- andcontrolflow-based test adequacy criteria. The all-edgesand ,all-DUs coverage criteria were applied to 130 faultyprogram versions derived from seven moderate size baseprograms by seeding realistic faults. For each faultyprogram, several thousand test sets were generated andthe relationship between fault detection and coverage wasexamined.
Our results show that both controlflow and dataflowtesting are useful supplements to traditional specification-based and informal code-based methods. The frequentlyhigher detection rates achieved by the coverage-basedtests that were added to the initial test pool show that thecriteria can be very useful at instigating the generation ofhigh-yield test cases that may be omitted otherwise.
199

On the other hand, achieving 100% coverage is notnecessarily a good indication that the testing is adequate,as shown by the large number of low detection faults, aswell as by the wide variation in the fault detection ratiosat 10090 coverage.
The analysis of detection ratios as coverage increasesshows that 100% coverage, although not a guarantee offault detection, is much more valuable than 90 or 95Y0.
Finally, we saw an approximately equal split betweenfaults that were detected at higher ratios by Edgecoverage and by DU coverage, leading us to conclude thatthe two methods, according to the way they are measuredby Tactic, are frequently complementary in theireffectiveness.
Acknowledgements
Surya Kasu, Yu Lu, and Evelyn Duesterwaldperformed exhaustive (and sometimes exhausting)analysis of the subject programs using Tactic. MaryamShahraray gave us advice with the statistical analysis ofour experimental data. Elaine Weyuker providedinsightful advice and comments on the experimentaldesign and interpretation of the results.
We are grateful to Arun Lakohtia of the University ofSouthern Louisiana, for contributing two of our subjectprograms.
1
2
3
4
5
6
7
8
9
10
References
M. J. Balcer, W. Hasling, and T.J. Ostrand, “Automatic
Generation of Test Scripts from Formal Test
Specifications”, Proc. of the Third Symposium on Testing,Analysis, and Verification, ACM Press, New York, (1989),210-218.
V. Basili and R. Selby, “Comparing the Effectiveness ofSoftware Testing Strategies”, IEEE Trans. Softw. Eng. SE-
13, (December 1987).
B. Beizer, Software Testing Techniques, 2nd cd., VanNostrand Reinhold, New York, 1990.
L. Clarke, A. Podgurski, D. Richardson, and S. Zeil, “A
Formal Evaluation of Data Flow Path Selection Criteria”,IEEE Trans. Softw. Eng. SE-15, (November 1989).
L. Foreman and S. Zweben, “A Study of the Effectiveness
of Control and Data Flow Testing Strategies”, J. SystemsSoftware 21 (1993), 215-228.
P.G. Frankl and S.N. Weiss, “An Experimental Comparisonof the Effectiveness of the All-uses and All-edgesAdequacy Criteria”, Proc. of the Fourth Symposium onTesting, Analysis, and Verification, ACM Press, New York,(1991) 154-164.
P.G. Frank], S.N. Weiss, and E.J. Weyuker, “ASSET ASystem to Select and Evaluate Tests”, Proc. IEEE Conf.
Software Tools, New York, (April 1985).
P.G. Frank] and E.J. Weyuker, “A Dataflow Testing Tool”,Proc. IEEE Softfair II, San Francisco, (December 1985).
C. R. Hicks, Fundamental Concepts in the Design ofExperiments, Saunders College Publishing, Fort Worth,1982.
J.R. Horgan and S. London, “Data Flow Coverage and theC Language”, Proc. of the Fourth Symposium on Testing,
11
12
13
14
15
16
17
18
19
20
21
22
23
24
25
Analysis, and Verification, ACM Press, New York, (1991)87-97.
W.E. Howden, “Reliability of the Path Analysis Testing
Strategy”, IEEE Trans. Softw. Eng. SE-2, (July 1976).
J.C. Huang, “An Approach to Program Testing”, ACM
Comp. Surveys 7 (Sept. 1975), 113-128.
B. W. Kemighan and P. J. Plauger, Software Tools in
Pascal, Addison-Wesley, Reading, MA, 1981.
D. Knuth, “The Errors of TeX”, Software: Practice and
Experience 19, (1989), 607-685.
J. Laski, “Data Flow Testing in STAD’, J. SystemsSoftware 12(1 990), 3-14.
J.W. Laski and B. Korel, “A Data Flow Oriented ProgramTesting Strategy”, IEEE Trans. Softw. Eng. SE-9, no 3,(May 1983), 347-354.
N. B. Leveson, M. P. E. Heimdahl, H. Hildreth, and J. D.
Reese, “Requirements Specification for Process-Control
Systems”, University of California at Irvine, CA,Information and Computer Science Technical Report,1992.
S. Ntafos, “An Evaluation of Required Element Testing
Strategies”, Proc. Seventh Int. Conf. Software Engineering,(March 1984), 250-256.
T. J. Ostrand and M. J. Balcer, “The Category-PartitionMethod for Specifying and Generating Functional Tests”,
Communications of the ACM31, 6 (June 1988), 676-686.
T. J. Ostrand and E. J. Weyuker, “Data Flow-Based
Adequacy Analysis for Languages with Pointers”, Proc. ofthe Fourth Symposium on Testing, Analysis, andVerification, ACM Press, New York, (199 1) 74-86.
H. D. Pande, B. G. Ryder, and W. A. Landi,“Interprocedural Def-Use Associations in C Programs”,Proc. of the Fourth Symposium on Testing, Analysis, andVerification, ACM Press, New York, (199 1), 139-153.
S. Rapps and E.J. Weyuker, “Data Flow AnalysisTechniques for Test Data Selection”, Proc. Sixth Int. Conf.Software Engineering, Tokyo, (September 1982).
S. Rapps and E.J. Weyuker, “Selecting Software Test DataUsing Data Flow Information”, IEEE Trans. Softw. Eng.
SE- 11, (April 1985).
H. Schiller, “lJsing MEMIMAP to measure the extent of
program testing”, Report TR 1836, IBM SystemsDevelopment Division, Poughkeepsie, NY, (Feb. 1969).
P. Thevenod-Fosse, H. Waeselynck, Y. Crouzet, “AnExperimental Study on Software Structural Testing:Deterministic Versus Random Input Generation”, Proc.
Twenty-First International Symposium on Fault-TolerantComputing, Montreal, Canada, (June 199 1), 410-417.
200