expert scientific opinion on the tier ... - montana deq … · expert scientific opinion on the...
TRANSCRIPT
EXPERT SCIENTIFIC OPINION
ON THE TIER-2 METHODOLGY
Report to the Wyoming Environmental Quality Council
Jan M.H. Hendrickx Bruce A. Buchanan
New Mexico Tech
Socorro, NM 87801
Buchanan Consultants, Ltd.
Farmington, NM 87499
May 2009


ii
EXECUTIVE SUMMARY
All Wyoming surface waters are protected to some extent for agricultural uses. The
primary agricultural uses are stock watering or irrigation. The uses are protected under
the AGRICULTURAL USE PROTECTION POLICY (AUPP) which was finalized
August 2006 in conjunction with the Triennial Review of the Chapter 1 Surface Water
Standards. The policy is contained in Chapter 1, Section 20 of the AUPP. This policy is
under consideration by the Wyoming Environmental Quality Council (WEQC) for
adoption as an Appendix to the Chapter 1 rules. Until a final decision is rendered on the
rulemaking, the provisions of the policy remain in effect for establishing effluent limits
on discharges that may affect agricultural use.
The purpose of this report is to provide an expert, scientific opinion regarding the
methods proposed for estimation of the EC (Electrical Conductivity) and SAR (Sodium
Adsorption Ratio) of produced Coal Bed Methane (CBM) water. These produced waters
are discharged into ephemeral drainages in Wyoming such that degradation of the
receiving water will not affect crop production.
Chapter 2 lists the services to be provided by the contractors and specifically formulates
two specific questions by the Council: Question A. Whether the Tier 2 methodology as
set forth in Appendix H section c(vi)(B) is reasonable and scientifically valid for
determining the EC and SAR of water that can be discharged into an ephemeral drainage
in Wyoming so that degradation of the receiving water will not be of such an extent to
cause a measurable decrease in crop production. Question B. Whether the method set
forth in Appendix H section c(vi)(B) for determining EC and SAR for permitting the
discharge of produced water is reasonable, sufficiently defined and scientifically
defensible for the conditions in Wyoming, and provides a uniform testing procedure that
is reasonably accurate and unbiased for the determination of soil EC from which you can
reasonably infer the quality of the water EC and SAR that historically flowed within the
drainage that will support the establishment of effluent limits for discharge permits in a
given drainage that will not cause a measurable decrease in crop production.

iii
Chapter 3 educates the reader on the causes of soil salinity focusing on the relation
between soil salinity and the quality of irrigation water. Major causes for soil salinity are
soil characteristics, ground water table depth, climate, presence of saline seepages, and
irrigation management but not the quality of the irrigation water. No evidence has been
found in the peer-reviewed literature in support of the assumption on which Tier 2 is
based: “soil salinity in artificially and naturally irrigated lands in ephemeral drainages is
entirely determined by pre-existing background water quality”.
In Chapter 4 a succinct review of the testimony to the Council is discussed under three
headings: Assumption for Tier 2 Methodology, Soil Testing Procedure for Unbiased
Determination of Soil EC and SAR, and Managed and Unmanaged Irrigation with CBM
Waters.
Finally, in Chapter 5 the expert scientific opinions are presented in answer to the two
questions A and B by the Council. Scientific Expert Opinion A. The Tier 2 methodology
as set forth in Appendix H section c(vi)(B) is not reasonable nor scientifically valid for
determining the EC and SAR of water that can be discharged into an ephemeral drainage
in Wyoming so that degradation of the receiving water will not be of such an extent to
cause a measurable decrease in crop production. Scientific Expert Opinion B. The method
set forth in Appendix H section c(vi)(B) for determining electrical conductivity (EC) and
sodium adsorption ratio (SAR) for permitting the discharge of produced water is not
reasonable nor sufficiently defined nor scientifically defensible for the conditions in
Wyoming. It does not provide a uniform testing procedure that is reasonably accurate and
unbiased for the determination of soil EC from which you can reasonably infer the
quality of the water EC and SAR that historically flowed within the drainage that will
support the establishment of effluent limits for discharge permits in a given drainage that
will not cause a measurable decrease in crop production.
Scientific Expert Opinion on Way Forward. Since it is not scientifically defensible to use
Tier 2, the question is how to move forward. The use of Tier 1 can be continued since it
is conservative and has been accepted by the community. If the water quality

iv
requirements of Tier 1 cannot be met, the Irrigation Waiver seems the preferred
alternative since it requires an irrigation management plan that provides reasonable
assurance that the lower quality water will be confined to the targeted lands. In this
manner, the Irrigation Waiver will deal with the issue of water quantity. Given the large
scale on which CBM water is produced it seems justifiable to implement an aggressive
applied and basic research program to develop guidelines on how to use CBM water in a
beneficial manner.

v
TABLE OF CONTENTS
Page
EXECUTIVE SUMMARY ii
TABLE OF CONTENTS v
1. PURPOSE 1
2. SERVICES TO BE PROVIDED BY CONTRACTOR 2
3. WHAT CAUSES SOIL SALINITY? 4
4. REVIEW OF TESTIMONY AND SUBMITTALS TO THE COUNCIL 11
5. EXPERT SCIENTIFIC OPINIONS 21
6. REFERENCES 24

1
1. PURPOSE
All Wyoming surface waters are protected to some extent for agricultural uses. The
primary agricultural uses are stock watering or irrigation. The uses are protected under
the AGRICULTURAL USE PROTECTION POLICY (AUPP) which was finalized
August 2006 in conjunction with the Triennial Review of the Chapter 1 Surface Water
Standards. The policy is contained in Chapter 1, Section 20 of the AUPP. This policy is
under consideration by the Wyoming Environmental Quality Council (WEQC) for
adoption as an Appendix to the Chapter 1 rules. Until a final decision is rendered on the
rulemaking, the provisions of the policy remain in effect for establishing effluent limits
on discharges that may affect agricultural use.
The purpose of this AUPP report is to provide an expert, scientific opinion regarding the
methods proposed for estimation of the EC (Electrical Conductivity) and SAR (Sodium
Adsorption Ratio) of produced water. These produced waters are discharged into
ephemeral drainages in Wyoming such that degradation of the receiving water will not
affect crop production.
This report contains five chapters. Chapter 1 discusses the purpose of this report. Chapter
2 describes the services to be provided by the contractor and is followed by Chapter 3
that educates the reader on the causes of soil salinity focusing on the possible effects of
EC and SAR of precipitation, irrigation, and flood waters. Chapter 4 presents highlights
of the submittals and testimony presented to the Council while Chapter 5 presents the
contractors’ expert scientific opinions.

2
2. SERVICES TO BE PROVIDED BY CONTRACTOR
Drs. Buchanan and Hendrickx have been contracted to review the AGRICULTURAL
USE PROTECTION POLICY and basically determine if making the policy a rule is
reasonable and scientifically valid. Three specific services have been requested by the
Wyoming Environmental Quality Council.
Service One:
Review the following:
A. Appendix H Section c(vi)(B) of the Rule as proposed by the DEQ on
11/20/2008 (see Appendix A).
B. Transcripts of the testimony received by the Council on October 24th
and
28th
, 2008.
C. Section 20 of the Rule as proposed by DEQ on November 11, 2008 (see
Appendix A).
D. Written submittals, responses to comments, and other documents
submitted to the Council under Docket No. 08-3101.
Service Two:
Based upon Contractor’s training, education, and work experience provide, in
written form, a report outlining Contractor’s expert scientific opinion regarding:
A. Whether the Tier 2 methodology as set forth in Appendix H section
c(vi)(B) is reasonable and scientifically valid for determining the EC and SAR of
water that can be discharged into an ephemeral drainages in Wyoming so that
degradation of the receiving water will not be of such an extent to cause a
measurable decrease in crop production.
B. Whether the method set forth in Appendix H section c(vi)(B) for
determining EC and SAR for permitting the discharge of produced water is
reasonable, sufficiently defined and scientifically defensible for the conditions in
Wyoming, and provides a uniform testing procedure that is reasonably accurate
and unbiased for the determination of soil EC from which you can reasonably

3
infer the quality of the water EC and SAR that historically flowed within the
drainage that will support the establishment of effluent limits for discharge
permits in a given drainage that will not cause a measurable decrease in crop
production.
Service Three:
Consult with DEQ to the degree necessary to achieve the goals of Section 2 of the
Contract. Communicate any suggested improvements or procedures to EQC and
DEQ.
Drs. Buchanan and Hendrickx have reviewed all documents listed under Service One and
present a review summary in Chapter 4. They have made one consultation with DEQ in
the form of eight questions on the subject of the permitting process. The clear response
by Mr. John Wagner of DEQ to these questions was very helpful. Their expert scientific
opinions are presented in Chapter 5.
The basic processes of soil salinization are reviewed in Chapter 3 since they are the
scientific basis of the opinion. Moreover, these processes need to be understood –at least
a conceptual level– in order to successfully implement the expert scientific opinion into a
fair and balanced system for discharge permits of produced waters into ephemeral
drainages in Wyoming.
4
3. WHAT CAUSES SOIL SALINITY?
Soil salinity is the amount of soluble salts in a soil (Soil Science Glossary Terms
Committee, 2008)1 but the term is often used in the sense that the salt content of the soil
is too high for satisfactory crop production2: the soil is saline or salty. Important natural
sources of salts in arid and semi-arid regions are atmospheric deposition (wet and dry)
(Bresler et al., 1982; Scanlon, 1991), mineral weathering (Bresler et al., 1982; Rhoades et
al., 1974), “fossil” salts (built up in poorly drained flood-plain or playa sediments)
(Bresler et al., 1982; Carter and Robbins, 1978), seepage from uplands (Stephanie J.
Moore, 2008), and upwelling from deep ground water brines (Hogan et al., 2007; Phillips
et al., 2003; Stephanie J. Moore, 2008). Four common anthropogenic salt sources are:
irrigation water (Rhoades et al., 1973; Rhoades et al., 1974), fertilizers (Darwish et al.,
2005), discharge of treated sewage water (Gonçalves et al., 2007; Mills, 2003), and
discharge of saline waters during coalbed methane (Ganjegunte et al., 2005) or oil and
gas extraction (Hendrickx et al., 2005a). Most soil salinity is caused by mineral
weathering and application of waters containing salt on irrigated lands. The importance
of each source of salinity depends on soil type, climate and irrigation management
(Bresler et al., 1982; Keren, 2000).
Salinity is common in arid and semi-arid areas where evapotranspiration exceeds annual
precipitation as is the case in Wyoming. Evapotranspiration is defined as the evaporation
of water from soil combined with the transpiration of water from plants. Since salts do
not vaporize at atmospheric pressure, they are left behind during the processes of
evapotranspiration and accumulate in the soil. Soil salinity will affect crop growth when
the concentration of soluble salts in the root zone exceeds a critical threshold level
(Hanson et al., 2006). For the purpose of this report three common scenarios of salt
accumulation in the root zone of semi-arid lands will be described: soil water chloride
profiles in semi-arid uplands with deep ground water tables where the only source of
1 Scientific references are listed in Appendix xx.
2 http://waterwiki.net/index.php/Soil_salinity on May 8, 2009.

5
water is precipitation, soil salinity in semi-arid riparian lands with shallow ground water
tables, and soil salinity in irrigated fields.
Scenario I: Soil Salinity in Semi-arid Uplands with Deep Ground Water Tables.
Figure 1 shows the chloride distribution with depth in two desert soil profiles in southern
New Mexico. Although the chloride concentration of the incoming precipitation is the
same for both profiles, the chloride content at depth is 1000 times larger in the profile
that does not receive run-on water. Similar differences do occur due to changes in land
use (Hendrickx and Walker, 1997; Stephens, 1995), soil and bedrock characteristics
(Heilweil and Solomon, 2004), or geomorphic setting (Hendrickx and Walker, 1997;
Johnston, 1987; Scanlon, 1991; Scanlon, 1992). For example, in Australia the chloride
concentration in soil profiles beneath native Eucalyptus vegetation is about 4000 mg/l
versus 1000 mg/l under fields cleared from native vegetation 12 years previously. The
lower water use of the crops that replaced the native vegetation lead to an increased
recharge and salt leaching (Walker et al., 1991). Thus, in semi-arid uplands with deep
ground water tables no unique relationship exists between salt concentration of
precipitation and soil salinity.
Scenario II: Soil Salinity in Semi-arid Riparian Lands with Shallow Ground Water
Tables. In riparian areas soil salinity is often variable and can change over short
distances (Amezketa and Lersundi, 2008; Hendrickx et al., 1994; Hendrickx et al., 1997;
Sheets et al., 1994). For example, in the Horse Creek riparian area on the Rottman Ranch,
Hawk Springs, Wyoming, soil samples indicated an “extremely high variability” of soil
salinity depending on soil age and texture, topography, and depth to ground water3.
Salinization in these areas is caused by discharge of groundwater to the atmosphere, a
process that can result from three different mechanisms: (i) deep-rooted plants tap
directly into the ground water to acquire water for transpiration, (ii) capillary rise from
3 http://wsare.usu.edu/pro/fieldrep_00/pdf/refinal/aw96014.pdf on May 15, 2009.

6
Figure 1. Soil water chloride profiles in two nearby loam soil profiles with a deep ground water table in southern New
Mexico receiving precipitation with a chloride concentration of less than 5 mg/liter (Eppes and Harrison, 2003; Hogan
et al., 2007). Despite the low chloride concentration of the precipitation the maximum chloride concentration in the “no
run-on” profile exceeds 5000 mg/liter.
the ground water table to the soil surface where the water evaporates, or (iii) capillary rise
to the bottom of the root zone where it becomes available for transpiration by vegetation.
The dissolved salts in the evaporated and transpired water are left behind and accumulate
in the soil. The rate of salt accumulation depends on the quantity or rate of ground water
discharge as well as the quality or salt concentration of the ground water (Rose, 2004).
A dry sponge in contact with water will suck up the water and even make it flow upwards
due to capillary forces. In the same way, water can flow from the ground water table to
the soil surface or the bottom of the root zone. The resulting discharge rate depends on
the depth of the ground water, the texture and sequence of different soil horizons, and the
rooting depth (Hoffman and Durnford, 1999; Weeks et al., 1987). For example, during a
seven year study near Buckeye, Arizona, the annual evapotranspiration of salt cedar
varied from 2150 mm with ground water level at 1.5 m to less than 1000 mm with ground
water level at 2.7 m (Van Hylckama, 1974). A computer simulation based on field
observations during the 1999 growing season in the Bosque del Apache (Socorro, New
Mexico) evaluated the effect of soil texture, ground water depth, and rooting depth on
ground water discharge. The average discharge in a virtual homogeneous clay profile was
49 cm versus 19 cm in a virtual homogeneous sand profile; the average discharges from
7
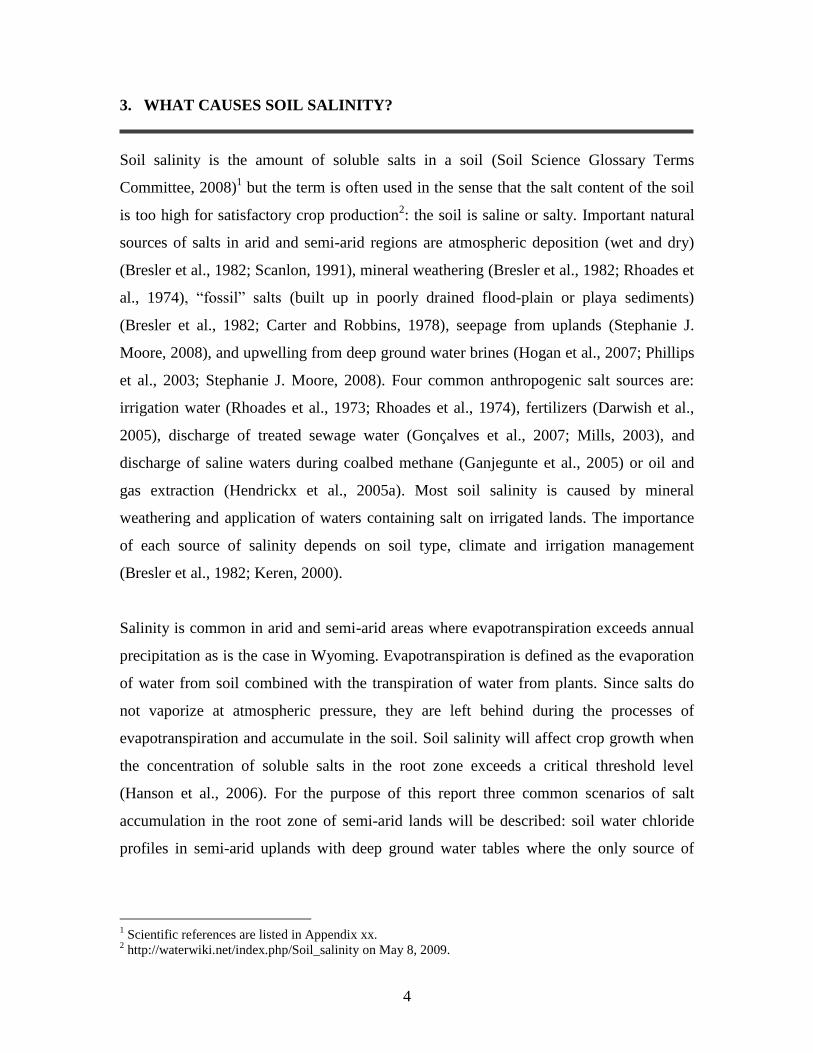
ground water depth 100, 200, and 500 cm were 66, 31, and 5 cm; the average discharges
with rooting depths 30 and 300 cm were 21 and 47 cm, respectively (Moayyad et al.,
2003). Several authors have shown that discharge from ground water tables less than 5 m
(15 feet) deep can be considerable (Hendrickx et al., 2003; Jolly et al., 1993; Moayyad et
al., 2003) while it typically can be ignored when the ground water table falls below 10 m4
but not always (Hoffman and Durnford, 1999).
During a soil reclamation project in a riparian area close to Albuquerque (Caplan et al.,
2001), the authors of this report evaluated soil salinity dynamics in a non-flooded riparian
area combining a detailed soil salinity survey using electromagnetic induction (Hendrickx
and Kachanoski, 2002; Hendrickx et al., 1994; Sheets et al., 1994), extensive soil
descriptions and laboratory analyses of representative riparian soils, ground water depth
measurements, ground water quality measurements, and simulations with the forward
model for prediction of electromagnetic induction responses (Borchers et al., 1997;
Hendrickx and Kachanoski, 2002; Hendrickx et al., 2002) as well as simulations with the
model HYDRUS1D for prediction of soil water contents and soil water salt
concentrations (Šimůnek et al., 2008). Although all soils in this riparian area received
their water from the river (salt concentration about 200-400 ppm) and precipitation, the
soil salinity profiles are widely different (Hong, 2002). Figure 2 shows Profile 1 with
almost no salt accumulation while Profile 6 has accumulated a considerable amount of
salts since the construction of Cochiti reservoir around 1970 that prevented flooding of
our riparian study area. The difference in soil salinity is caused by the interaction
between soil texture, capillary rise, and ground water level fluctuations. Thus, this case
study is strong evidence that no unique relationship exists between the historic salt
concentrations in the Rio Grande and current soil salinity profiles in riparian areas with
shallow ground water tables. Soil salinity depends on soil texture and ground water table
depth rather than on historic water quality in the Rio Grande. Similar trends are observed
in the River Murray region of Australia5. Thus, in semi-arid riparian areas with
4 http://www.clw.csiro.au/research/rivers/flows/floodplain/timescales.html on May 15, 2009.
5 http://www.clw.csiro.au/research/rivers/flows/floodplain/timescales.html on May 15, 2009.

8
Figure 2. Soil stratigraphy and texture of representative profiles 1 and 6 with the simulated profiles of the water
content, soil-salt content, and soil-water concentration. Initial ground water and time-independent bottom solute
boundary conditions are 200 ppm. (SIL: silty loam, SL: sandy loam, S: sand, L: loam, LS: loamy sand, CS: coarse
sand). The simulated salinity profiles have been confirmed in the field with electromagnetic induction measurements
(Hong, 2002).
9
shallow ground water tables no unique relationship exists between historic salt
concentration in the river and soil salinity.
Scenario III: Soil Salinity in Irrigated Fields. The purpose of irrigation is to provide
sufficient water to agricultural lands in arid and semi-arid regions to meet crop water
requirements during the growing season. Since even good-quality irrigation waters
contain some salts, soil salinization will be certain unless sufficient water is supplied to
leach the salts below the root zone. As a matter of fact 100 cm of good-quality irrigation
water, i.e. a typical amount normally applied in a single irrigation season, contains about
5 tons of salt per hectare which is sufficient to salinate an initially salt-free soil (Hillel,
1998). Therefore, leaching of salt at the bottom of the root zone should be adequate to
prevent salt accumulation in the root zone. Most irrigation projects need a drainage
infrastructure to accomplish the leaching necessary to keep the root zone at salt levels
that are tolerable for the crops (Hoffman and Durnford, 1999).
The soil salinity of irrigated fields depends mainly on the farmer’s management. For a
given irrigation water quality the farmer can regulate salinity conditions in the root zone
by adjusting the leaching fraction which equals the volume of water drained from the
field divided by the volume of water applied by irrigation. The larger the leaching
fraction, the more water is drained, and the more salts are removed from the root zone
(Hanson et al., 2006; Hillel, 1998; Hoffman and Durnford, 1999; Rose, 2004). For
example, the senior author of this report used electromagnetic induction for the
assessment of soil salinity in a 37 ha representative experimental drainage area located 35
km southwest of Faisalabad in the Punjab Province of Pakistan. Although the site
received the same quality irrigation water on all fields, it had a wide range of salinity
conditions from 269 dS/m on abandoned fields to 20 dS/m on pepper fields. Excluding
the abandoned fields, the range of mean salinity values for different land uses went from
90 dS/m on fallow fields with irrigation inlet structures to 56 dS/m on fodder fields to 38
dS/m on rice fields and then to 20 dS/m on the pepper fields. These mean values are
significantly different at the 5% level (Hendrickx et al., 1992) and demonstrate that
irrigation management influences soil salinity to a much greater extent than irrigation
10
water quality. Thus, on irrigated lands no unique relationship exists between the water
quality in the rivers that supply the irrigation canals and soil salinity.
Relevance for Tier 2. Tier 2 is based on the assumption that soil salinity in artificially
and naturally irrigated lands in ephemeral drainages is entirely determined by pre-
existing background water quality. However, the three typical scenarios for causing soil
salinity in semi-arid lands described above do not support this assumption. On the
contrary, pre-existing background water quality appears to be a minor factor or none at
all. Major causes for soil salinity are soil characteristics, ground water table depth,
climate, presence of saline seepages, and irrigation management (Hillel, 1998; Hoffman
and Durnford, 1999; Hogan et al., 2007; Rose, 2004). No evidence has been found in the
peer-reviewed literature in support of the assumption on which Tier 2 is based. We
welcome to be informed of any scientific evidence in support of this assumption.
The Tier 2 assumption is scientifically flawed for several reasons: (i) effluent water
quality that is better than the pre-existing background water quality could still cause
severe soil salinity (Hillel, 1998), (ii) effluent water quality that is worse than the pre-
existing background water quality may be used beneficially on artificially irrigated lands
(Rhoades, 1999; Tanji, 1997), and (iii) soil salinity varies with time and can even change
suddenly when riparian areas flood or when farmers irrigate fallow or abandoned lands.
Therefore, a Tier 2 analysis will not result in a scientifically defensible assessment of
water quality (EC and SAR) that can be released in an ephemeral drainage without
irrigation management.
11
4. REVIEW OF TESTIMONY AND SUBMITTALS TO THE COUNCIL
The testimony and submittals to the Council have been an important source of
information on the history of Section 20 of the AUPP as well as the issues faced by
industry and landowners to deal with CBM water. In this section we will highlight and
comment on relevant testimony for the formulation of our expert scientific opinion on the
Tier 2 methodology as set forth in Appendix H section c(vi)(B). Our review and
discussion is organized under three headings: Assumption for Tier 2 Methodology, Soil
Testing Procedure for Unbiased Determination of Soil EC and SAR, and Managed and
Unmanaged Irrigation with CBM Waters.
Assumption for Tier 2 Methodology. Tier 2 is based on the assumption that soil salinity
in artificially and naturally irrigated lands in ephemeral drainages is entirely determined
by pre-existing background water quality. Several testimonies consider this assumption
flawed. Dr Paige testifies: “we cannot determine background water quality for measuring
soil EC and SAR” and “my real problem is with trying to back out background water
quality from soil EC and salinity within the soil”. Later in the hearing Chairman Boal
asks Dr. Munn “I think you’re are telling me that it is not a good idea to use soil samples
to come up with those [background water quality] numbers” and his answer is “That is
my professional assessment”.
On the other hand Mr. Harvey’s testimony is in support of the Tier 2 methodology. He
states “The relationships amongst salinity, sodicity, water, plants, and especially the soil
are dynamic. They are very complex and dynamic systems, and we need flexibility in a
rule ... to deal with this” and “the proposed rule, ... I believe is conservative and
protective. I’m ... here to support it.” He explains “There is no Tier 2 comparison
between managed irrigation with coal-bed natural gas water and WYPDES discharge
scenarios. ... Managed irrigation scenarios ... do not fall under the Tier 2 process ... It is a
different environment. We’re applying water in a managed manner evenly over a field
using separate center pivot equipment or other such equipment. Discharge into channel,

12
it’s just a different situation”. He continues “The Tier 2 process ... is meant to derive
conservative limits for unmanaged irrigation after discharge to the channel”.
Since 2005 Mr. Harvey has been involved in “most of the Section 20 reports and analyses
that are used to derive EC and SAR effluent limits”. His method for deriving pre-existing
background water quality from current soil salinity is based on the assumption “that the
1.5 concentration factor from water to soil EC is appropriate and conservative in the rule,
and I am supporting DEQ’s use of it”. He adds “the 1.5 concentration factor was agreed
to by all parties the first day of drafting this policy, that now is a proposed rule ... It’s
been the basis of all of the Tier 2-based WYPDES permits to date”. Mr. Harvey’s
testimony did not provide scientific support for the number 1.5 to be used as the
concentration factor for artificially and naturally irrigated lands in Wyoming’s ephemeral
drainages. However, Dr. Munn stated “the idea [of Tier 2] is ... we can use relationships
from managed irrigation fields ... to back-calculate background water [quality] and the
number chosen is 1.5” and “1.5 is an arbitrary number based on an assumption of an
arbitrary leaching fraction ... in irrigated fields in southern California as a conversion
between the applied water salinity and what you will see [i.e. soil salinity] in the root
zone”.
Experts’ Opinion. In Chapter 3 scientific evidence has been presented that pre-existing
water quality in a drainage cannot be derived from current soil salinity. The testimony to
the Council has been mixed with Paige and Munn recognizing that no link exists between
back-ground water quality in an ephemeral drainage and soil salinity while Harvey makes
the case that such a relationship does exist and can be used for prediction of back-ground
water quality. However, no scientific evidence was found to support the latter position.
In 1976, Ayers and Westcott published the first edition of a FAO (Food and Agriculture
Organizations of the United Nations) Irrigation and Drainage Paper (Ayers and Westcot,
1994)6 as a field guide for evaluating the suitability of water for irrigation. Two of their
recommendations have
6 http://www.fao.org/docrep/003/T0234E/T0234E00.HTM on May 16, 2009.

13
Leaching Fraction (LF) Applied Water Needed (Percent of ET) Concentration Factor 2 (X)
0.05 105.3 3.2
0.10 111.1 2.1
0.15 117.6 1.6
0.20 125.0 1.3
0.25 133.3 1.2
0.30 142.9 1.0
0.40 166.7 0.9
0.50 200.0 0.8
0.60 250.0 0.7
0.70 333.3 0.6
0.80 500.0 0.6
Table 1. Concentration factors for predicting root zone soil water salinity from irrigation water salinity and the
leaching fraction from Ayers and Westcott (1994) (Ayers and Westcot, 1994).
been used for the development of Tier 2: (i) the concentration factors for predicting root
zone soil salinity from irrigation water salinity and the leaching factor (Table 3 of Ayers
and Westcott) and (ii) the relative rate of water infiltration as affected by salinity (EC)
and sodium adsorption ratio (SAR) (Figure 21 of Ayers and Westcott ( 1994) as adapted
from Rhoades (1977) (J.D., 1977) and Oster and Schroer (1979) (Oster and Schroer,
1979)). Table 1 presents Table 3 of Ayers and Westcott; it presents concentration factors
as a function of leaching factors.
The concentration factors (X) have been developed by Ayers and Westcott to calculate
average root zone soil salinity (ECsoil) from irrigation water salinity (ECw):
𝐸𝐶𝑠𝑜𝑖𝑙 = 𝐸𝐶𝑤 × 𝑋 [1]
In Tier 2 Eq. [1] has been inversed as
𝐸𝐶𝑤 =𝐸𝐶𝑠𝑜𝑖𝑙𝑋
[2]
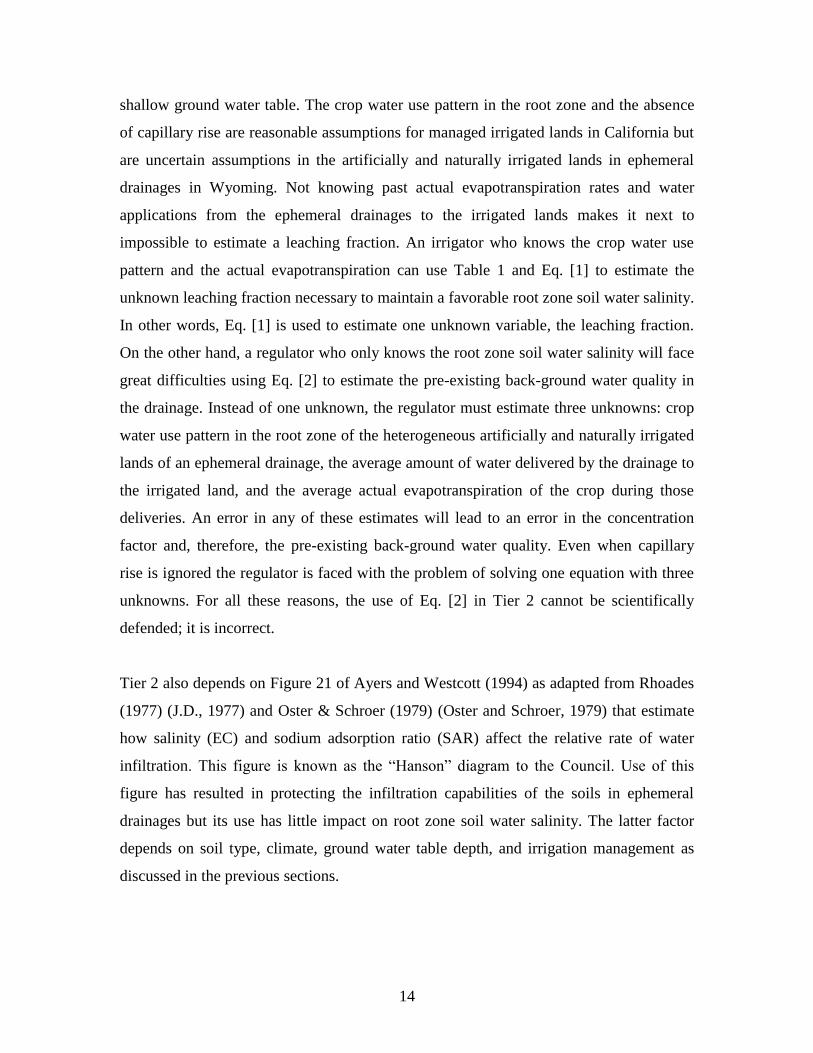
Eq. [1] is based on several assumptions: (i) the crop water use pattern is such that 40
percent of the water is taken up from the upper quarter of the root zone, 30 percent from
the next quarter, 20 percent from the next, and 10 percent from the lower quarter, (ii)
actual crop evapotranspiration is known so that the water manager can determine the
irrigation application for a desired leaching fraction, and (iii) no capillary rise from a
14
shallow ground water table. The crop water use pattern in the root zone and the absence
of capillary rise are reasonable assumptions for managed irrigated lands in California but
are uncertain assumptions in the artificially and naturally irrigated lands in ephemeral
drainages in Wyoming. Not knowing past actual evapotranspiration rates and water
applications from the ephemeral drainages to the irrigated lands makes it next to
impossible to estimate a leaching fraction. An irrigator who knows the crop water use
pattern and the actual evapotranspiration can use Table 1 and Eq. [1] to estimate the
unknown leaching fraction necessary to maintain a favorable root zone soil water salinity.
In other words, Eq. [1] is used to estimate one unknown variable, the leaching fraction.
On the other hand, a regulator who only knows the root zone soil water salinity will face
great difficulties using Eq. [2] to estimate the pre-existing back-ground water quality in
the drainage. Instead of one unknown, the regulator must estimate three unknowns: crop
water use pattern in the root zone of the heterogeneous artificially and naturally irrigated
lands of an ephemeral drainage, the average amount of water delivered by the drainage to
the irrigated land, and the average actual evapotranspiration of the crop during those
deliveries. An error in any of these estimates will lead to an error in the concentration
factor and, therefore, the pre-existing back-ground water quality. Even when capillary
rise is ignored the regulator is faced with the problem of solving one equation with three
unknowns. For all these reasons, the use of Eq. [2] in Tier 2 cannot be scientifically
defended; it is incorrect.
Tier 2 also depends on Figure 21 of Ayers and Westcott (1994) as adapted from Rhoades
(1977) (J.D., 1977) and Oster & Schroer (1979) (Oster and Schroer, 1979) that estimate
how salinity (EC) and sodium adsorption ratio (SAR) affect the relative rate of water
infiltration. This figure is known as the “Hanson” diagram to the Council. Use of this
figure has resulted in protecting the infiltration capabilities of the soils in ephemeral
drainages but its use has little impact on root zone soil water salinity. The latter factor
depends on soil type, climate, ground water table depth, and irrigation management as
discussed in the previous sections.
15
Dr. Vance has expressed concern about using Figure 21 of Ayers and Westcott (1994) to
assess how the relative infiltration rate of soils with smectitic clays is affected. Since
these clays have low infiltration rates under the best conditions, a relative decrease will
have much more impact on soil salinization than a relative decrease in soils with higher
infiltration rates. The validity of Figure 21 for soils containing smectitic clays should be
further explored.
Soil Testing Procedure for Unbiased Determination of Soil EC and SAR
Different testimonies referred to different procedures of soil sampling in the ephemeral
drainages. The experts did not agree on one most optimal method for salinity surveys in
the drainages. None referred to the new salinity monitoring approach that is increasingly
used all over the world: this approach is based on a continuous survey of the entire area
using electromagnetic induction followed by soil coring at selected validation sites.
Experts’ Opinion. In the previous section we explained that the prediction of pre-existing
back-ground water quality in the drainage using soil salinity samples is scientifically not
correct. Yet, for the management of CBM waters on artificially and naturally irrigated
lands it will be necessary to conduct salinity surveys that result in reliable soil salinity
maps.
The proposed procedure in Appendix H section c(vi)(B) for determining EC and SAR is
ambiguous since samples are taken at semi-random sites meaning that within specific
terrain zones soils will be randomly sampled. The term terrain zone is not defined in any
way and could be interpreted to mean a number of different landscape characteristics.
The examples given range from units identified by landscape characteristics (channel
bottom, first terrace, etc) and land use characteristics (sub and non-sub irrigated reaches).
Another issue is the proposed number of required soil sample sites (from 3 to 7
depending on acreage) that would make it very difficult to characterize the soil landscape
or to evaluate the natural variation of soil properties. Use of the proposed procedure by
different capable soil scientists would yield different salinity maps and cause a challenge
for the regulatory agencies. Therefore, we recommend the use of a continuous high-
16
density survey method based on electromagnetic induction that will leave no ambiguity in
the final soil salinity map and is transparent for all stakeholders.
Currently, three basic procedures are available for the measurement of soil salinity: (i)
soil extraction for measurement of the soil salinity as grams of salt over grams of dry soil,
(ii) soil water extraction for measurement of the soil water salinity as grams of salt over
grams of water, and (iii) indirect measurement of the soil water salinity by measuring the
apparent electrical conductivity of the soil. Since soil extraction and soil water extraction
methods are time consuming and expensive, faster indirect methods for measurement of
soil salinity have been developed. These methods measure the apparent soil electrical
conductivity and need a calibration function for determination of the salinity of soil water
(Hendrickx and Kachanoski, 2002).
Electrical conductivity methods have been used for several decades (Rhoades and
Halvorson, 1977; Rhoades and Oster, 1986; Rhoades et al., 1976) but advances in
equipment, computers, and Global Positioning Systems have all come together now into a
system that allows the measurement of soil apparent electrical conductivity at a
reasonable cost (Hendrickx and Kachanoski, 2002). Of special interest is the
electromagnetic induction method since it doesn’t require contact with the soil (McNeill,
1980) and allows for quick and reliable measurements either on foot in difficult terrain
(Hendrickx et al., 1997; Hendrickx et al., 1992; Sheets and Hendrickx, 1995) or on a
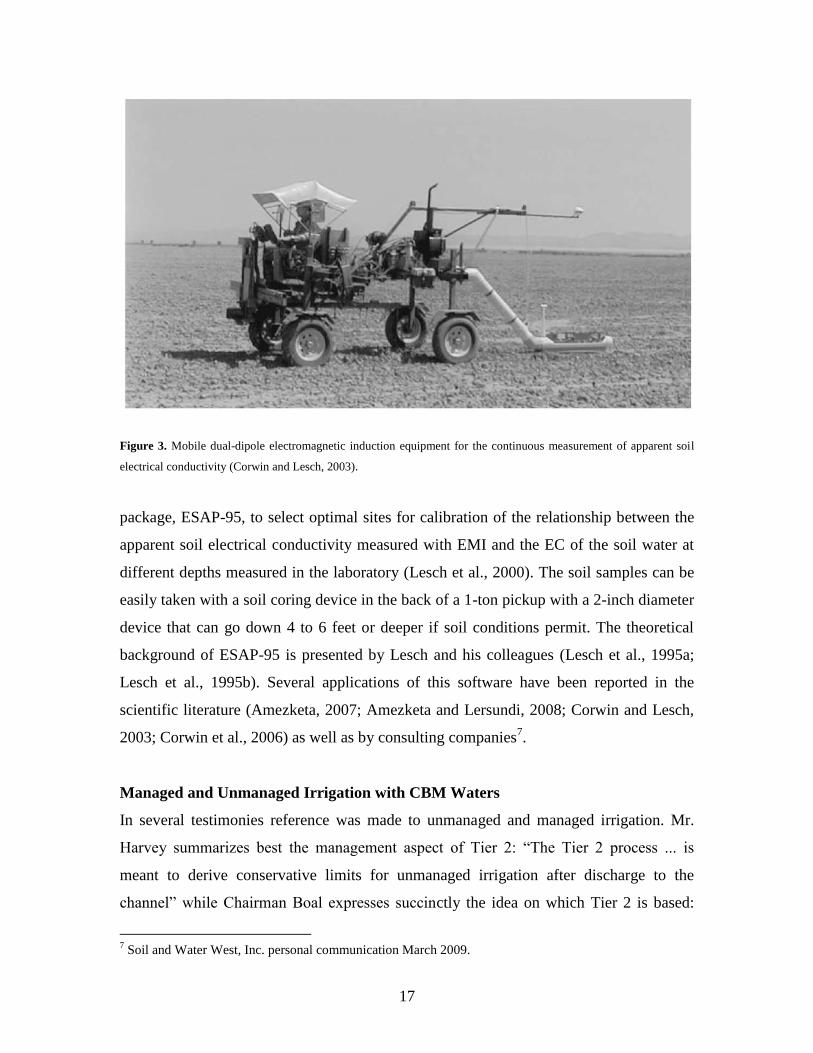
vehicle in flat agricultural lands (Corwin and Lesch, 2003) (Figure 3). The method has
been successfully used for the detection of produced oil-and-gas waters in the arid vadose
zones of New Mexico (Hendrickx, 2003; Hendrickx et al., 1994; Hendrickx et al.,
2005b). Often the electromagnetic induction (EMI) measurements alone are sufficient to
prepare maps of soil salinity. Taking measurements at different heights above the soil
surface and using inverse methods, it is even possible to determine the depth profile of
apparent soil electrical conductivity (Borchers et al., 1997; Hendrickx et al., 2002).
However, for regulatory purposes or for the management of lands irrigated with
challenging water qualities it is necessary to relate the EMI measurements to EC and/or
SAR. Therefore, the U.S. Salinity Laboratory in Riverside CA has developed a software
17
Figure 3. Mobile dual-dipole electromagnetic induction equipment for the continuous measurement of apparent soil
electrical conductivity (Corwin and Lesch, 2003).
package, ESAP-95, to select optimal sites for calibration of the relationship between the
apparent soil electrical conductivity measured with EMI and the EC of the soil water at
different depths measured in the laboratory (Lesch et al., 2000). The soil samples can be
easily taken with a soil coring device in the back of a 1-ton pickup with a 2-inch diameter
device that can go down 4 to 6 feet or deeper if soil conditions permit. The theoretical
background of ESAP-95 is presented by Lesch and his colleagues (Lesch et al., 1995a;
Lesch et al., 1995b). Several applications of this software have been reported in the
scientific literature (Amezketa, 2007; Amezketa and Lersundi, 2008; Corwin and Lesch,
2003; Corwin et al., 2006) as well as by consulting companies7.
Managed and Unmanaged Irrigation with CBM Waters
In several testimonies reference was made to unmanaged and managed irrigation. Mr.
Harvey summarizes best the management aspect of Tier 2: “The Tier 2 process ... is
meant to derive conservative limits for unmanaged irrigation after discharge to the
channel” while Chairman Boal expresses succinctly the idea on which Tier 2 is based:
7 Soil and Water West, Inc. personal communication March 2009.

18
“Tier 2 is the option that if we know the water quality, the background water quality, then
the discharge can be no worse than the known”.
The testimony of landowners typically refers to water quantity rather than water quality.
Ms. West states: “We have as much water as we want, and way more water than we want.
... We have had a great deal of flooding. We have lost 80 acres of prime hay meadow. ...
Please do not implement this Tier 2”. Ms. Barlow states: “In 2003 a large reservoir above
my property contained CBM water, upper flowed and flooded the bottomland of my
property for three months. ... The carpet of native grass was replaced for the first three
years by bare soils, and now there is a few unpalatable weeds”. Mr. Swartz quantifies:
“June 2008 they dumped water at 102 to 136 cubic feet per second. ... DEQ likes to say ...
We are not concerned with quantity. We’re only concerned with quality. State engineer
says we aren’t concerned with quality, we’re only concerned with quantity. And I’m
getting the runaround and I don’t like it”. These statements confirm Dr. Munn’s
observation “In many cases, you’re are going from ephemeral to a perennial flowing
system”.
Landowners who don’t have to deal with damage by flooding are quite positive. Mr. Brug
states: “I’d like to see the regulations surely not get any stiffer, because if it was, some of
these instances I wouldn’t be able to use more water”. Mr. Litton observes: “We’ve got
eight miles of bottomlands, which we hayed at one time. We don’t anymore. But it has
some methane water running the length of it, and spreads out for some places a quarter of
a mile wide. And yet over this past seven years that we’ve been letting water on there, we
still see no signs of salt showing up. Just a point of the quality of water that we have”.
Ms. Faye Mackey testifies: “I’m here to speak not only for my ranch, but the 581,250
acres, landowners represented here on the map in blue. ... These ranches use our water
beneficially for our livestock, wildlife habitat, irrigation, and even some domestic water.
... There is no waste of water here. ... This water, and my ability to direct its use on my
ranch, is essential to my current agriculture operation. ... There’s no one-size-fits-all
solution. We, as ranchers, know our soil types. We look at whether we can irrigate on a
mister or pivot system, and industry has been very helpful in this, testing the soils and ...
19
taking water samples at different intervals ... There have been studies by industry in these
areas of irrigation that the native grass is approximately five times thicker with CBM
produced water than without the application of this water. Mr. Eitel’s opinion: “If you set
up real stringent rules, that one-size-fits-all, it just doesn’t work in our area”. Mr.
Shepperson states: “I am in favor, as a landowner, of your Tier 2 regs. ... There’s so much
variability in the sites, ...So the variabilities of sites, you’ve got to have the flexibility to
deal with these things site by site. And keep that in the regs, please. ... keep the
negotiations between the landowner and industry open. Allow for that. Let us negotiate
with industry on our ranches, but, boy, keep your oversight, too, on your rules”.
Experts’ Opinion. Several landowners clearly have suffered flood damage by unmanaged
releases of CBM water and not recognizing the duration and volume of CBM waters to
be received. Although these issues are serious, they can be resolved by proper
engineering of CBM water release infrastructure and by developing management plans
for the use of CBM water on artificially and naturally irrigated lands. As a matter of fact,
the landowners who are enthusiastic about receiving CBM waters express a common
concern against stiffer regulations that would prevent them to manage their CBM water
in a flexible manner adapting to the natural variability of their ranches.
The amount of CBM water in Wyoming and other states is very large. For example, the
Bureau of Land Management forecasts 51,000 wells in the Powder River Basin operating
and producing gas and water by 2010. These 51,000 wells are expected to produce nearly
700 million gallons of CBM water per day8. These water supplies are sufficient to irrigate
about 75,000 acres. However, to realize the potential benefits of CBM water it is
necessary to manage both water quality and water quantity on the artificially and
naturally irrigated lands receiving this water. There is general agreement that beneficial
use of marginal waters for irrigation is possible if principles and strategies of salinity
management are considered at on-farm and project-levels (Ayers and Westcot, 1994;
Rhoades, 1999; Tanji, 1997). Mr. Harvey has presented some nice examples how
marginal water can be made productive in Wyoming on managed irrigated lands.
8 Petition 05-3102 before Wyoming Environmental Quality Council by the Wyoming Outdoor Council.
20
The most beneficial use of CBM waters can only be realized by managed irrigation
taking into account both the quality and quantity of the produced waters. Managed
irrigation needs to balance the supply from the CBM wells with the crop water
requirements during the year taking into account quality and quantity of the produced
waters. This will be a great challenge for engineers in the petroleum industry,
landowners, soil and water resource consultants, researchers at the University of
Wyoming, and regulators at DEQ. However, the hearings have shown that a large pool of
dedicated professionals is ready to face this challenge. Given the broad range of
experiences with existing use of produced waters in Wyoming, progress with irrigation
management plans and regulations shouldn’t take too long.
21
5. EXPERT SCIENTIFIC OPINIONS
In Chapter 2 expert scientific opinions are requested on two questions A and B. In this
chapter we will respond to these questions and formulate a short opinion on the way
forward that we consider relevant for the policy contained in Chapter 1, Section 20 of the
AUPP.
Question A. Whether the Tier 2 methodology as set forth in Appendix H section
c(vi)(B) is reasonable and scientifically valid for determining the EC and SAR of
water that can be discharged into an ephemeral drainage in Wyoming so that
degradation of the receiving water will not be of such an extent to cause a
measurable decrease in crop production.
Scientific Expert Opinion A. The Tier 2 methodology as set forth in Appendix H section
c(vi)(B) is not reasonable nor scientifically valid for determining the EC and
SAR of water that can be discharged into an ephemeral drainage in
Wyoming so that degradation of the receiving water will not be of such an extent
to cause a measurable decrease in crop production.
Clarification A. Tier 2 is based on the option that if the background water quality in an
ephemeral drainage is known, the quality of the discharge of CBM produced
water can be no worse. Tier 2 is based on the erroneous belief that a measurable
decrease in crop production only will occur if the quality of the discharge of CBM
produced water is worse than the background water quality. In Chapter 3, we
have explained that root zone soil salinity does not depend directly on the quality
of the irrigation water; it depends on soil characteristics, climate, depth of ground
water table, and more importantly irrigation management. The scientific literature
provides examples where marginal irrigation water is successfully used for crop
production.
Question B. Whether the method set forth in Appendix H section c(vi)(B) for
determining EC and SAR for permitting the discharge of produced water is
reasonable, sufficiently defined and scientifically defensible for the conditions in

22
Wyoming, and provides a uniform testing procedure that is reasonably accurate
and unbiased for the determination of soil EC from which you can reasonably
infer the quality of the water EC and SAR that historically flowed within the
drainage that will support the establishment of effluent limits for discharge
permits in a given drainage that will not cause a measurable decrease in crop
production.
Scientific Expert Opinion B. The method set forth in Appendix H section c(vi)(B) for
determining EC and SAR for permitting the discharge of produced water is
not reasonable nor sufficiently defined nor scientifically defensible for the
conditions in Wyoming. It does not provide a uniform testing procedure that is
reasonably accurate and unbiased for the determination of soil EC from which
you can reasonably infer the quality of the water EC and SAR that historically
flowed within the drainage that will support the establishment of effluent limits
for discharge permits in a given drainage that will not cause a measurable
decrease in crop production.
Clarification B. See first Clarification A. As explained in Chapter 4 the proposed soil
testing procedure would result in ambiguous soil maps. We refer to the recent
science literature how an accurate soil salinity map can be made without spending
too much.
Scientific Expert Opinion on Way Forward. Since it is not scientifically defensible to use
Tier 2, the question is how to move forward. The use of Tier 1 can be continued
since it is conservative and has been accepted by the community. Of course, as
explained in Chapter 3 using Tier 1 CBM water can still result in increased soil
salinity and reduced crop yields if not managed well. The latter aspect is of
special importance when the quantity of available water is substantial. Current
research in Wyoming and surrounding states may result in a relaxation of the crop
threshold values that are currently based on California conditions. Mr. Harvey’s
testimony suggests that these threshold values may be too strict for Wyoming
conditions.

23
If the water quality requirements of Tier 1 cannot be met, the Irrigation Waiver
seems the preferred alternative since it requires an irrigation management plan
that provides reasonable assurance that the lower quality water will be confined to
the targeted lands. In this manner, the Irrigation Waiver will deal with the issue of
water quantity. Given the large scale on which CBM water is produced it seems
justifiable to implement an aggressive applied and basic research program to
develop guidelines on how to use CBM water in a beneficial manner.

24
6. REFERENCES
Amezketa, E. 2007. Soil salinity assessment using directed soil sampling from a
geophysical survey with electromagnetic technology: a case study Spanish
Journal of Agricultural Research 5:91-101.
Amezketa, E., and J.D.V.d. Lersundi. 2008. Soil classification and salinity mapping for
determining restoration potential of cropped riparian areas. Land Degradation &
Development 19:153 - 164.
Ayers, R.S., and D.W. Westcot. 1994. Water quality for agriculture, Rome, Italy.
Borchers, B., T. Uram, and J.M.H. Hendrickx. 1997. Tikhonov regularization for
determination of depth profiles of electrical conductivity using non-invasive
lectromagnetic induction measurements. Soil Science Society of America Journal
61:1004-1009.
Bresler, E., B.L. McNeal, and D.L. Carter. 1982. Saline and sodic soils. Principles-
dynamics-modeling. Springer-Verlag, New York.
Caplan, T.R., B.D. Musslewhite, B.A. Buchanan, and J.M.H. Hendrickx. 2001.
Reclaiming sodic soils following saltcedar removal on the Pueblo of Santa Ana,
New Mexico. Land Reclamation - A Different Approach. American Society for
Surface Mining and Reclamation, Albuquerque, New Mexico.
Carter, D.L., and C.W. Robbins. 1978. Salt Outflows from New and Old Irrigated Lands.
Soil Sci Soc Am J 42:627-632.
Corwin, D.L., and S.M. Lesch. 2003. Application of soil electrical conductivity to
precision agriculture: theory, principles, and guidelines. Agron. J. 95:455-471.
Corwin, D.L., S.M. Lesch, J.D. Oster, and S.R. Kaffka. 2006. Monitoring management-
induced spatio-temporal changes in soil quality through soil sampling directed by
apparent electrical conductivity. Geoderma 131:369-387.
Darwish, T., T. Atallah, M.E. Moujabber, and N. Khatib. 2005. Salinity evolution and
crop response to secondary soil salinity in two agro-climatic zones in Lebanon.
Agric. Water Managem. 78:152-164.
Eppes, M.C., and J.B.J. Harrison. 2003. Water flow through a basalt flow in southern
New Mexico, p. 174-177, In I. Simmers, ed. Understanding water in a dry
environment. Hydrological processes in arid and semi-arid zones, Vol. 23. A.A.
Balkema Publishers, Lisse, The Netherlands.
Ganjegunte, G.K., G.F. Vance, and L.A. King. 2005. Soil chemical changes resulting
from irrigation with water co-produced with coalbed natural gas J. Environ. Qual.
34:2217-2227.
Gonçalves, R.A.B., M.V. Folegatti, T.V. Gloaguen, P.L. Libardi, C.R. Montes, Y. Lucas,
C.T.S. Dias, and A.J. Melfi. 2007. Hydraulic conductivity of a soil irrigated with
treated sewage effluent. Geoderma 139:241-248.
Hanson, B., S.R. Grattan, and A. Fulton. 2006. Agricultural salinity and drainage
Cooperative Extension, Department of Land, Air and Water Resources,
University of California, Davis, Davis, CA.
Heilweil, V.M., and D.K. Solomon. 2004. Millimeter- to kilometer scale variations in
vadose-zone bedrock solutes: implications for estimating recharge in arid settings,

25
p. 49-68, In J. F. Hogan, et al., eds. Groundwater recharge in a desert
environment. The Southwestern United States, Vol. Water Science and
Application 9. American Geophysical Union, Washington, DC.
Hendrickx, J.M.H. 2003. Electromagnetic induction for delineation of brine affected soil
volumes. Rice Operating Company, Hobbs, New Mexico.
Hendrickx, J.M.H., and G. Walker. 1997. Chapter 2 Recharge from precipitation, p. 19-
114, In I. Simmers, ed. Recharge of phreatic aquifers in (semi)-arid areas.
Balkema, Rotterdam, The Netherlands.
Hendrickx, J.M.H., and R.G. Kachanoski. 2002. Nonintrusive electromagnetic induction,
p. 1301-1310, In J. Dane and C. Topp, eds. Methods of soil analysis. Part 1. Soil
Science Society of America Madison, Wisconsin.
Hendrickx, J.M.H., F.M. Phillips, and J.B.J. Harrison. 2003. Chapter 5. Water flow
processes in arid and semi-arid vadose zones, p. 151-210, In I. Simmers, ed.
Understanding water in a dry environment. Hydrological processes in arid and
semi-arid zones, Vol. 23. A.A. Balkema Publishers, Lisse, The Netherlands.
Hendrickx, J.M.H., C.D. Grande, B.A. Buchanan, and R.E. Bretz. 1994. Electromagnetic
induction for restoration of saline environments in New Mexico. Chapter 13. , p.
247-265, In R. K. Bhada, et al., eds. Waste-management: From Risk to
Remediation, Vol. 1. ECM Press, Albuquerque, New Mexico.
Hendrickx, J.M.H., J. Beekman, R. Koch, and G. Rodriguez-Marin. 1997. Salinity survey
for revegetation potential along the Rio Grande in the Paso Del Norte region. El
Paso Field Division of U.S. Bureau of Reclamation, El Paso.
Hendrickx, J.M.H., G. Rodríguez-Marín, R.T. Hicks, and J. Simunek. 2005a. Modeling
study of produced water release scenarios. API Publication Number 4734.
American Petroleum Institute Publishing Services, Washington D.C.
Hendrickx, J.M.H., B. Baerends, Z.I. Raza, M. Sadiq, and M.A. Chaudhry. 1992. Soil
salinity assessment by electromagnetic induction on irrigated land. Soil Sci. Soc.
Am. J. 56:1933-1941.
Hendrickx, J.M.H., B. Borchers, D.L. Corwin, S.M. Lesch, A.C. Hilgendorf, and J.
Schlue. 2002. Inversion of soil conductivity profiles from electromagnetic
induction measurements: theory and experimental verification. Soil Science
Society of America Journal 66:673-685.
Hendrickx, J.M.H., B. Borchers, S.-h. Hong, J.B.J. Harrison, L.M. Hall, R.S. Bowman,
and R.L. Van Dam. 2005b. Electromagnetic induction for environmental
restoration and hydrological characterization. Fast Times 10:35.
Hillel, D. 1998. Environmental soil physics Academic Press, San Diego, CA.
Hoffman, G.J., and D.S. Durnford. 1999. Drainage design for salinity control., p. 579-
614, In R. W. Skaggs and J. V. Schilfgaarde, eds. Agronomy Series 38.
Agricultural Drainage.
Hogan, J.F., F.M. Phillips, S.K. Mills, J.M.H. Hendrickx, J. Ruiz, J.T. Chesley, and Y.
Asmerom. 2007. Geologic origins of salinization in a semi-arid river: the role of
sedimentary basin brines. Geology 35:1063-1066 doi: 10.1130/G23976A.1.
Hong, S. 2002. Soil salinity in arid non-flooded riparian areas. M.S. Thesis, New Mexico
Tech, Socorro NM.
J.D., R. 1977. Potential for using saline agricultural drainage waters for irrigation. , pp.
85-116 Water Management for Irrigation and Drainage. ASCE, Reno, Nevada.
26
Johnston, C.D. 1987. Preferred water flow and localised recharge in a variable regolith. .
J. Hydrol. Engrg. 94:129-142.
Jolly, I.D., G.R. Walker, and P.J. Thorburn. 1993. Salt accumulation in semi-arid
floodplain soils with implications for forest health. Journal of Hydrol. 150:589-
614.
Keren, R. 2000. Salinity, p. G3-G25, In M. E. Sumner, ed. Handbook of soil science.
CRC Press, Boca Raton.
Lesch, S.M., D.J. Strauss, and J.D. Rhoades. 1995a. Spatial prediction of soil salinity
using electromagnetic induction techniques: 1. Statistical prediction models: A
comparison of multiple linear regression and cokriging. WATER RESOURCES
RESEARCH 31:373-386.
Lesch, S.M., D.J. Strauss, and J.D. Rhoades. 1995b. Spatial prediction of soil salinity
using electromagnetic induction techniques: 2. An efficient spatial sampling
algorithm suitable for multiple linear regression model identification and
estimation. WATER RESOURCES RESEARCH 31:3387-398.
Lesch, S.M., J.D. Rhoades, and D.L. Corwin. 2000. The ESAP-95 version 2.01R user
manual and tutorial guide. Research Report No. 146. , . USDA-ARS, George E.
Brown, Jr., Salinity Laboratory, Riverside, California.
McNeill, J.D. 1980. Electromagnetic terrain conductivity measurement at low induction
numbers. Tech. Note TN-6 Geonics Ltd., Ontario, Canada.
Mills, S. 2003. Quantifying salinization of the Rio Grande using environmental tracers,
New Mexico Tech, Socorro, NM.
Moayyad, B., S.A. Bawazir, J.P. King, S. Hong, and J.M.H. Hendrickx. 2003.
Groundwater depth and arid zone riparian evapotranspiration, p. 188-195, In I.
Simmers, ed. Understanding water in a dry environment. Hydrological processes
in arid and semi-arid zones, Vol. 23. A.A. Balkema Publishers, Lisse, The
Netherlands.
Oster, J.D., and F.W. Schroer. 1979. Infiltration as influenced by irrigation water quality.
Soil Sci. Soc. Amer. J. 43:444-447.
Phillips, F.M., J. Hogan, S. Mills, and J.M.M. Hendrickx. 2003. Environmental tracers
applied to quantifying causes of salinity in arid-region rivers: Preliminary results
from the Rio Grande, southwestern USA, p. 327-334, In A. S. Alsharhan and W.
W. Wood, eds. Water Resource Perspectives: Evaluation, Management, and
Policy. Elsevier Science, Amsterdam.
Rhoades, J.D. 1999. Use of saline drainage water for irrigation, p. 615-657, In R. W.
Skaggs and J. V. Schilfgaarde, eds. Agronomy Series 38. Agricultural Drainage.
Rhoades, J.D., and A.D. Halvorson. 1977. Electrical conductivity methods for detecting
and delineating saline seeps and measuring salinity in Northern Great Plains soils.
ARS W-42. USDA-ARS Western Region, Berkeley, CA.
Rhoades, J.D., and J.D. Oster. 1986. Solute content. , p. 985-1006, In A. Klute, ed.
Methods of soil analysis. Part 1. 2nd ed. SSSA and ASA, Madison, WI.
Rhoades, J.D., P.A.C. Raats, and R.J. Prather. 1976. Effects of liquid-phase electrical
conductivity, water content and surface conductivity on bulk soil electrical
conductivity. Soil Sci. Soc. Am. J. 40:651-655.
Rhoades, J.D., R.D. Ingvalson, J.M. Tucker, and M. Clark. 1973. Salts in Irrigation
Drainage Waters: I. Effects of Irrigation Water Composition, Leaching Fraction,
27
and Time of Year on the Salt Compositions of Irrigation Drainage Waters. Soil
Sci Soc Am J 37:770-774.
Rhoades, J.D., J.D. Oster, R.D. Ingvalson, J.M. Tucker, and M. Clark. 1974. Minimizing
the Salt Burdens of Irrigation Drainage Waters. J Environ Qual 3:311-316.
Rose, C. 2004. An introduction to the environmental physics of soil, water and
watersheds Cambridge University Press, Cambridge, U.K.
Scanlon, B.R. 1991. Evaluation of moisture flux from chloride data in desert soils. J. of
Hydrology 128:137-156.
Scanlon, B.R. 1992. Moisture and solute flux along preferred pathways characterized by
fissured sediments in desert soils. J. Contam. Hydrol. 10:19-46.
Sheets, K.R., and J.M.H. Hendrickx. 1995. Non-invasive soil water content measurement
using electromagnetic induction. WATER RESOURCES RESEARCH 31:2401-
2409.
Sheets, K.R., J.P. Taylor, and J.M.H. Hendrickx. 1994. Rapid salinity mapping by
electromagnetic induction for determining riparian restoration potential.
Restoration Ecology 2:242-246.
Šimůnek, J., M. Šejna, H. Saito, M. Sakai, and M.T.v. Genuchten. 2008. The HYDRUS-
1D Software Package for Simulating the Movement of Water, Heat, and Multiple
Solutes in Variably Saturated Media, Version 4.0, HYDRUS Software Series 3
Department of Environmental Sciences, University of California Riverside
Riverside, California, USA.
Soil Science Glossary Terms Committee. 2008. Glossary of soil science terms 2008 Soil
Science Society of America, Madison, WI.
Stephanie J. Moore, R.L.B.B.L.C.P.W.D.D. 2008. Geochemical Tracers to Evaluate
Hydrogeologic Controls on River Salinization. Ground Water 46:489-501.
Stephens, D.B. 1995. Vadose zone hydrology CRC Press, Boca Raton, FL.
Tanji, K.K. 1997. Irrigation with Marginal Quality Waters: Issues. Journal of Irrigation
and Drainage Engineering 123:165-169.
Van Hylckama, T.E. 1974. Water use by Salt Cedar as measured by the water budget
method., Washington DC.
Walker, G.R., I.D. Jolly, and P.G. Cook. 1991. A new chloride leaching approach to the
estimation of diffuse recharge following a change in land use. J. of Hydrology
128:49-67.
Weeks, E.P., H.L. Weaver, G.S. Campbell, and B.D. Tanner. 1987. Water use by Salt
Cedar and by replacement vegetation in Pecos River floodplain between Acme
and Artesia, New Mexico. USGS Paper 491-G:G1-33.