expertise vs. bias in evaluation: evidence from the nih
TRANSCRIPT

Expertise vs. Bias in Evaluation: Evidence from the NIH Danielle Li
Working Paper 16-053

Working Paper 16-053
Copyright © 2015 by Danielle Li
Working papers are in draft form. This working paper is distributed for purposes of comment and discussion only. It may not be reproduced without permission of the copyright holder. Copies of working papers are available from the author.
Expertise vs. Bias in Evaluation: Evidence from the NIH
Danielle Li Harvard Business School

.
Expertise vs. Bias in Evaluation: Evidence from the NIH ∗
Danielle Li
Harvard University†
This version: September 25, 2015
Abstract
Evaluators with expertise in a particular field may have an informational advantage in sep-
arating good projects from bad. At the same time, they may also have personal preferences
that impact their objectivity. This paper develops a framework for separately identifying the
effects of expertise and bias on decision making and applies it in the context of peer review
at the US National Institutes of Health (NIH). I find evidence that evaluators are biased in
favor of projects in their own area, but that they also have better information about the quality
of those projects. On net, the benefits of expertise tend to dominate the costs of bias. As a
result, policies designed to limit reviewer biases may also reduce the quality of funding decisions.
∗I am very grateful to Pierre Azoulay, Michael Greenstone, and especially David Autor for detailed feedback onthis project. I also thank Jason Abaluck, Leila Agha, Josh Angrist, Manuel Bagues, David Berger, David Chan,Esther Duflo, Brigham Frandsen, Alex Frankel, Richard Freeman, Bob Gibbons, Nathan Hendren, Ben Jones, BillKerr, Jiro Kondo, Josh Lerner, Niko Matouschek, Xiao Yu May Wang, Ziad Obermeyer, Marco Ottaviani, DimitrisPapanikolaou, Amanda Pallais, Chris Palmer, Michael Powell, Amit Seru, Heidi Williams, and numerous seminarparticipants for helpful comments and suggestions. I am grateful to George Chacko, Raviv Murciano-Goroff, JoshuaReyes, and James Vines for assistance with data. All errors are my own.†[email protected]

1 Introduction
A key debate in the economics of innovation focuses on what mechanisms are most effective
for encouraging the development of new ideas and products: while patents may distort access to
new knowledge ex post, a concern with research grants and other R&D subsidies is that the public
sector may make poor decisions about which projects to fund ex ante.
In the United States, the vast majority of public funding for biomedical research is allocated
by the National Institutes of Health (NIH), through a system of peer review in which applications
are evaluated by committees of scientists working on similar issues. The collective opinion of these
scientists is responsible for consolidating thousands of investigator–initiated submissions into a
publicly–funded research agenda.
But how much should we trust their advice? While reviewers may have valuable information
about the potential of projects in their research areas, advice in this setting may also be distorted
precisely because reviewers have made so many investments in acquiring their domain expertise.
For example, in a guide aimed at scientists describing the NIH grant review process, one reviewer
highlights his preference for work related to his own: “If I’m sitting in an NIH study section,
and I believe the real area of current interest in the field is neurotoxicology [the reviewer’s own
speciality], I’m thinking if you’re not doing neurotoxicology, you’re not doing interesting science.”1
Alternatively, reviewers may be biased against applicants in their own area if they perceive them
to be competitors.
This paper examines the impact of intellectual proximity between reviewers and applicants
(hereafter “proximity” or “relatedness”) on the quality of funding decisions. In particular, I develop
a framework for separately identifying the effects of expertise and bias on decision making and
provide an empirical estimate of the efficiency trade-off between the two. To accomplish this,
I assemble a new, comprehensive dataset linking almost 100,000 NIH grant applications to the
committees in which they were evaluated.
My analysis requires two key ingredients: 1) a source of exogenous variation in the intellectual
proximity between grant applicants and the more influential members of their review committees
and 2) a measure of quality for grant applications, including that of unfunded applications. Given
these, the intuition underlying my empirical work is as follows: if intellectual proximity improves
information about the quality of grant applicants, then the effect of working in the same area as
1See http://www.clemson.edu/caah/research/images/What Do Grant Reviewers Really Want Anyway.pdf.
1

a more influential reviewer should differ for high– and low–quality applicants. Strong applicants
should benefit from being evaluated by influential reviewers who can more accurately assess their
quality, but weak applicants should be hurt for the same reason. I should then observe a stronger
correlation between an application’s quality and its funding outcome, among more proximate can-
didates. If proximity promotes bias, then related applicants should be more (or less) likely to be
funded regardless of their quality. This would translate into a level difference in funding likelihood.2
I now provide more detail about my proximity and quality measures in turn.
I begin with a baseline measure of the intellectual proximity of individual applicants and
reviewers: whether a reviewer has cited an applicant’s work in the five years prior to the committee
meeting. This captures whether the applicant’s work has been of use to the reviewer, but is likely
to be correlated with quality because better applicants are more likely to be cited. To identify
exogenous variation proximity between candidates and review committees, I take advantage of the
distinction between “permanent” and “temporary” members in NIH review committees.3 I show
that while permanent and temporary reviewers have similar qualifications as scientists, permanent
members have more influence within the committee. I therefore define intellectual proximity to
the review committee as the number of permanent reviewers that have cited an applicant’s work—
controlling for the total number of such reviewers. This identifies the effect of being related to
a more influential set of reviewers, under the assumption that the quality of an applicant is not
correlated with the composition of reviewers who cite her.4
Using this measure of proximity allows me to identify the causal impact of being evaluated by
a more influential set of proximate reviewers. To further separate the role of bias and expertise, I
require information on application quality. The primarily challenge in measuring application quality
is doing so for unfunded applications; it is natural, after all, to think that the research described in
unfunded applications does not get produced and thus cannot be evaluated. At the NIH, however,
this is not the case. Rather, standards for preliminary results for large research grants are so high
that researchers often submit applications based on nearly completed research. As a result, it is
common to publish the work proposed in an application even if the application itself goes unfunded.
2This empirical strategy allows me to separately identify the role of bias and expertise without attempting todirectly measure or proxy for either. I further show in Appendices B and C that this approach is micro-founded in aformal model of decision-making with a biased expert.
3“Permanent” members are not actually permanent; they serve four-year terms. See Sections 2 and 4.1 for adiscussion of permanent versus temporary reviewers.
4I also show that my results do not rely on the distinction between permanent and temporary reviewers by usingapplicant fixed effects to compare outcomes for the same applicant across meetings in which she is cited by differentnumbers of reviewers. This alternative specification identifies the effect of being related to an additional reviewerunder the assumption that the time-variant unobserved quality of an application is not correlated with proximity.
2

To find these related publications, I use a text-matching approach that links grant application titles
with the titles and abstracts of semantically related publications by the same applicant. I further
restrict my analysis of application quality to articles published soon enough after grant review to
not be directly affected by any grant funds. For consistency, I use this same approach to measure
the quality of funded applications as well.
I present three key findings. First, proximity leads to bias: applicants related to more influ-
ential committee members are systematically more likely to be funded, regardless of their quality.
Being proximate to an additional permanent reviewer increases an application’s chances of being
funded by 3.2 percent. While this may seem like a small effect, it is substantial when viewed rel-
ative to reviewers’ sensitivity to application quality: being evaluated by an additional permanent
member in one’s own area increases an application’s chances of being funded by as much as would
be predicted by a one standard deviation increase in the quality of the application itself. This
extremely large effect suggests that when quality is difficult to assess, reviewer preferences play a
comparably large role in funding decisions. Further, the fact that I find a positive bias demon-
strates that even in a competitive setting such as life sciences research, reviewers are more likely
to perceive research in their area as complements to their own, rather than as substitutes.
Second, I show that proximity improves information. There is a stronger relationship between
application quality and funding likelihood for candidates who are related to influential committee
members: committees are almost twice as responsive to improvements in the quality of applications
from intellectually proximate applicants.
Finally, I show that the gains associated reviewer expertise dominate the losses associated
with bias. Enacting a policy that restricts close intellectual ties would reduce the quality of the
NIH-supported research portfolio, as measured by future citations and publications. This result
holds for quality as measured by publications, citations, and hit publications.
These results have implications for how organizations treat conflicts of interest. In many
settings, personal preferences develop alongside expertise, as a result of individuals self-selecting and
making investments into a particular domain. These biases are particularly challenging to address:
in contrast with race or gender discrimination, eliminating bias stemming from intellectual ties can
directly degrade the quality of information that decision makers have access to. For instance, the
NIH currently prohibits collaborators, mentors, and those from the same institution from serving as
an applicant’s reviewer; the results in this paper show that these policies necessarily entail efficiency
trade-offs.
3

The question of how organizations should use information from potentially conflicted experts
has been of long-standing theoretical interest (Crawford and Sobel 1982; Li, Rosen, and Suen, 2001;
Garfagnini, Ottaviano, and Sorenson, 2014), but has remained relatively understudied empirically.
Emerging work shows that these issues are relevant in many empirical settings ranging from finan-
cial regulation to judicial discretion to academic promotion and publication.5 In these and other
settings, it is often challenging to attribute differences in the treatment of connected individuals
to either better information or bias because it is difficult to observe the counterfactual quality of
decisions that are not made. This paper contributes by studying these issues in the context of
public investments in R&D, a setting that is both independently important, and in which various
empirical challenges can be more readily overcome.
Finally, there is currently little empirical evidence on how—and how successfully—governments
make research investments, and existing studies in this area find mixed results.6 This paper con-
tributes directly to this literature by showing that the value of expert advice in this setting outweighs
the costs of bias.
2 Context
2.1 Grant Funding at the NIH
The NIH plays an outsized role in supporting biomedical research. Over 80% of basic life
science laboratories in the US receive NIH funding and half of all FDA approved drugs, and over two-
thirds of FDA priority review drugs, explicitly cite NIH-funded research (Sampat and Lichtenberg,
2011). The decision of what grants to support is made by thousands of scientists who act as peer
reviewers for the NIH. Each year, they collectively read approximately 20,000 grant applications
and allocate over 20 billion dollars in federal grant funding. During this process, more than 80
percent of applicants are rejected even though, for the vast majority of biomedical researchers,
winning and renewing NIH grants is crucial for becoming an independent investigator, maintaining
a lab, earning tenure, and paying salaries (Stephan, 2012; Jones, 2010).
The largest and most established of these grant mechanisms is the R01, a project-based, re-
5See, for instance, Kondo (2006), Fisman, Paravisini, and Vig (2012), Bagues and Zinovyeva (2015), Blanes iVidal, Draca, and Fons-Rosen (2012), Brogaard, Engleberg, and Parsons (2012) and Laband and Piette (1994).
6See Acemoglu, 2008; Kremer and Williams, 2010; Grilliches, 1992; and Cockburn and Henderson, 2000 forsurveys. Li and Agha (2015) document a positive correlation between scores and outcomes, but Boudreau, et. al(2012) and Azoulay, Graff-Zivin, and Manso (2011) raise concerns about the ability to support recognize and fosternovel research.
4

newable research grant that constitutes half of all NIH grant spending and is the primary funding
source for most academic biomedical labs in the United States. There are currently 27,000 out-
standing awards, with 4,000 new projects approved each year. The average size of each award is
1.7 million dollars spread over three to five years.
Because R01s entail such large investments, the NIH favors projects that have already demon-
strated a substantial likelihood of success. As evidence of how high this bar is, the NIH provides a
separate grant mechanism, the R21, for establishing the preliminary results needed for a successful
R01 application. The fact that R01 applications are typically based on research that is already
very advanced makes it possible to measure the quality of unfunded grants, which is a key part of
my empirical strategy.7 See Section 5.1 for a detailed discussion.
To apply for an R01, the primary investigator submits an application, which is then assigned
to a review committee (called a “study section”) for scoring and to an Institute or Center (IC)
for funding. The bulk of these applications are reviewed in one of about 180 “chartered” study
sections, which are standing review committees organized around a particular theme, for instance
“Cellular Signaling and Regulatory Systems” or “Clinical Neuroplasticity and Neurotransmitters.”8
These committees meet three times a year in accordance with NIH’s funding cycles and, during
each meeting, review between 40 to 80 applications. My analysis focuses on these committees.
Study sections are typically composed of 15 to 30 “permanent” members who serve four-year
terms and 10 to 20 “temporary” reviewers who are called in as needed. Within a study section,
an application is typically assigned up to three reviewers who provide an initial assessment of its
merit. Permanent members are responsible for performing initial assessments on 8 to 10 applications
per meeting, compared to only 1 to 3 for temporary members. The division of committees into
permanent and temporary members plays an important role in my identification strategy: I need
to demonstrate that permanent reviewers have more influence over the scores that applications are
assigned, but that they are otherwise similar to temporary members in terms of their scientific
credentials. In Section 4.1, I discuss why this might be the case and provide empirical evidence.
The process of assigning applications to study sections and reviewers is nonrandom. In prac-
tice, applicants are usually aware of the identities of most permanent study-section members,
7This emphasis on preliminary results was one point of critique that the NIH peer review reform of 2006 wasdesigned to address; under the new system, the preliminary results section has been eliminated to discourage thispractice. My data come from before the reform but, anecdotally, it is still the norm to apply for R01s. For a satiricaltake from 2011, see http://www.phdcomics.com/comics/archive.php?comicid=1431.
8The NIH restructured chartered study sections during my sample period and my data include observations from250 distinct chartered study sections. These changes do not affect my estimation because I use within-meetingvariation only.
5

suggest a preferred study section, and usually get their first choice (subject to the constraint that,
for most applicants, there are only one or two study sections that are scientifically appropriate).
Study-section officers, meanwhile, assign applications to initial reviewers on the basis of intellec-
tual fit. I will discuss the implications of this nonrandom selection on my identification strategy in
Section 4.1.
Once an application has been assigned to a study section, it is assigned to three initial re-
viewers who read and score the application on the basis of five review criteria: Significance (does
the proposed research address an important problem and would it constitute an advance over cur-
rent knowledge?), Innovation (are either the concepts, aims, or methods novel?), Approach (is the
research feasible and well thought out?), Investigator (is the applicant well-qualified?), and En-
vironment (can the applicant’s institution support the proposed work?). Based on these scores,
weak applications (about one-third to one-half) are “triaged” or “unscored,” meaning that they
are rejected without further discussion. The remaining applications are then discussed in the full
study-section meeting. During these deliberations, an application’s initial reviewers first present
their opinions, and then all reviewers discuss the application according to the same five review
criteria. Following these discussions, all study-section members anonymously vote on the applica-
tion, assigning it a “priority score,” which, during my sample period, ranged from 1.0 for the best
application to 5.0 for the worst, in increments of 0.1. The final score is the average of all member
scores. This priority score is then converted into a percentile from 1 to 99.9 In my data, I observe
an application’s final score (records of scores by individual reviewers and initial scores are destroyed
after the meeting).
Once a study section has scored an application, the Institute to which it was assigned de-
termines funding. Given the score, this determination is largely mechanical: an IC lines up all
applications it is assigned and funds them in order of score until its budget has been exhausted.
When doing this, the IC only considers the score: NIH will choose to fund one large grant instead of
two or three smaller grants as long as the larger grant has a better score, even if it is only marginally
better. The worst percentile score that is funded is known as that IC’s payline for the year. In
very few cases (less than four percent), applications are not funded in order of score; this typically
happens if new results emerge to strengthen the application. Scores are never made public.10
9At the NIH, a grant’s percentile score represents the percentage of applications from the same study section andreviewed in the same year that received a better priority score. According to this system, a lower score is better, but,for ease of exposition and intuition, this paper reports inverted percentiles (100 minus the official NIH percentile,e.g., the percent of applications that are worse), so that higher percentiles are better.
10For more details on the NIH review process, see Gerin (2006).
6

Funded applications may be renewed every three to five years, in which case they go through
the same process described above. Unfunded applications may be resubmitted, during the period
of my data, up to two more times. My analysis includes all applications that are reviewed in each
of my observed study-section meetings, including first-time applications, resubmitted applications,
and renewal applications.
2.2 Expertise and Bias Among Reviewers
How likely is it that reviewers have better information about the quality of applications in
their own area? The majority of scientists I interviewed have more confidence in their assessments
of related proposals; for many, this translates into speaking with greater authority during deliber-
ations. Reviewers are also more likely to be assigned as initial reviewers for applications in their
area, forcing them to evaluate the proposal in more detail. Even when they are not assigned as
initial reviewers, many reviewers said they were more likely to carefully read applications in their
own area. These mechanisms suggest that reviewers may have greater “expertise” about related
applications, either because they know more to begin with or because they pay more attention.
How likely is it that reviewers in my setting are biased? NIH reviewers have little to no financial
stake in the funding decisions they preside over, and conflict of interest rules bar an applicant’s
coauthors, advisers or advisees, or colleagues from participating in the evaluation process.11
Yet, there is often significant scope for reviewers to have preferences based on their intellectual
connections with applicants. Because NIH support is crucial to maintaining a lab, reviewers are
well aware that funding a project in one research area necessarily means halting progress in others.
Many of the reviewers I spoke with reported being more enthusiastic about proposals in their
own area; several went further to say that one of the main benefits of serving as a reviewer is
having the opportunity to advocate for more resources for one’s area of research. These preferences
are consistent with the idea that reviewers have a taste for research that is similar to theirs, or
that they perceive this research to be complementary to their own. On the other hand, some
study section members also mentioned that other reviewers—not they—were strategic in terms of
evaluating proposals from competing labs.12 This concern is also supported by research indicating
that labs regularly compete over scarce resources such as journal space, funding, and scientific
11For this reason, I cannot study the impact of these more social connections on funding outcomes.12I conducted 16 informal interviewers with current and past members of NIH study sections. These interviews
were off the record but subjects agreed that interested readers could contact the author for more details of theseconversations as well as for a full list of the interviewees.
7

priority (Pearson 2003).
3 Data
The goal of this paper is to 1) identify how intellectual proximity to influential reviewers
affects an applicant’s chances of being funded and 2) to separately identify the role of expertise
and bias in funding decisions.
In order to accomplish this, I construct a new dataset describing grant applications, review-
committee members, and their relationships for almost 100,000 applications evaluated in more than
2,000 meetings of 250 chartered study sections. My analytic file combines data from three sources:
NIH administrative data for the universe of R01 grant applications, attendance rosters for NIH
peer-review meetings, and publication databases for life-sciences research. Figure 1 summarizes
how these data sources fit together and how my variables are constructed from them.
I begin with two primary sources: the NIH IMPAC II database, which contains administrative
data on grant applications, and a series of study section attendance rosters obtained from NIH’s
main peer-review body, the Center for Scientific Review. The application file contains information
on an applicant’s full name and degrees, the title of the grant project, the study-section meeting to
which it was assigned for evaluation, the score given by the study section, and the funding status
of the application. The attendance roster lists the full names of all reviewers who were present at
a study-section meeting and whether a reviewer served as a temporary member or a permanent
member. These two files can be linked using meeting-level identifiers available for each grant
application. Thus, for my sample grant applicants, I observe the identity of the grant applicant,
the identity of all committee members, and the action undertaken by the committee.
My final sample consists of 93,558 R01 applications from 36,785 distinct investigators over the
period 1992-2005. This sample is derived from the set of grant applications that I can successfully
match to meetings of study sections for which I have attendance records, which is about half of all
R01 grants reviewed in chartered study sections. Of these applications, approximately 25 percent
are funded and 20 percent are from new investigators, those who have not received an R01 in the
past. Seventy percent of applications are for new projects, and the remainder are applications to
renewal existing projects. All of these types of applications are typically evaluated in the same
study section meeting. Table 1 shows that my sample appears to be comparable to the universe of
R01 applications that are evaluated in chartered study sections.
8

There are three components to these data: 1) a measure of intellectual proximity between
applicants and review committees; 2) a measure of application quality; 3) various measures of other
applicant characteristics. Sections , 3.2, and 3.3 first describe how I measure proximity, application
quality, and applicant characteristics, respectively. I describe how my empirical strategy uses these
measures later in the text, in Sections 4 and 5
3.1 Measuring proximity
I measure the intellectual proximity between an applicant and his or her review committee as
the number of permanent reviewers who have cited an applicant’s work in the five years prior to the
meeting, conditional on the total number of such reviewers. This is a measure of how intellectually
connected applicants are to the more influential members of their review committees.
I construct proximity in this way for two reasons. First, using citations to measure proximity
has several benefits. Citations capture a form of proximity that, as demonstrated by the quote in
the introduction, may strongly influence a reviewer’s personal preferences: reviewers may prefer
work that they find useful for their own research. Citations also capture this form of intellectual
connection more finely than other measures, such as departmental affiliation, allowing for more
informative variation in proximity. Further, using data on whether the reviewer cites the applicant
(as opposed to the applicant citing the reviewer) reduces concerns that my measures of proximity
can be strategically manipulated by applicants. Finally, one may also consider more-social measures
of proximity, such as coauthorship or being affiliated with the same institution. These ties, however,
are often subject to NIH’s conflict-of-interest rules; reviewers who are coauthors, advisors, advisees,
or colleagues, etc. are prohibited from participating in either deliberations or voting. Intellectual
proximity is a connection that likely matters for grant review but which is not governed by conflict-
of-interest rules.
Second, I focus on being cited by permanent reviewers in order to generate variation in prox-
imity that I will argue is unrelated to an applicant’s quality. This is because the total number of
reviewers who cite an applicant is likely to be correlated with quality: better applicants may be
more likely to be cited and may, independently, submit higher-quality proposals. By controlling
for the total number of reviewers who cite an applicant, I compare applicants that differ in their
proximity to more influential reviewers, but not in the quality of their work. I discuss this strategy
and provide evidence for its validity in Section 4.1.
Table 2 describes the characteristics of the sample study sections. In total, I observe 18,916
9

unique reviewers. On average, each meeting is attended by 30 reviewers, 17 of whom are permanent
and 13 temporary. The average applicant has been cited by two reviewers, one temporary and one
permanent. The average permanent and average temporary reviewer both cite four applicants.
3.2 Measuring Quality
I measure application quality using the number of publications and citations that the research
it proposes produces in the future. The key challenge to constructing this measure is finding a way
to use ex post publication data to assess the ex ante quality of applications. For example, how does
one measure the quality of applications that are unfunded if publications do not acknowledge grants
that do not exist? Similarly, suppose that two scientists submit proposals that are of the same ex
ante quality. One scientist is related to a reviewer and is funded because of bias. The funding,
however, allows her to publish more articles, meaning that an econometrician that examines ex
post outcomes may mistakenly conclude that her proposal was better than the other scientist’s to
begin with.
To address these concerns, I develop a way to identify publications associated with research
described in the preliminary results section of an application. As discussed in Section 2, this is
possible because it is extremely common for scientists to submit grant proposals based on nearly
completed research, especially for the large R01 grants that I study. To find these publications, I
first identify all research articles published by a grant’s primary investigator. I then use a text-
matching technique to identify articles on the same topic as the grant application. This is done by
comparing each publication’s title and abstract with the title of the applicant’s grant proposal. For
instance, if I see a grant application titled “Traumatic Brain Injury and Marrow Stromal Cells”
reviewed in 2001 and an article by the same investigator entitled “Treatment of Traumatic Brain
Injury in Female Rats with Intravenous Administration of Bone Marrow Stromal Cells,” I label
these publications as related. In my baseline specifications, I require that publications share at
least 4 substantive (e.g. with articles and other common words excluded) overlapping words with
the grant project title. Because grant project titles have on average 10 substantive words, this is a
restrictive threshold. I describe the text-matching process I use in more detail in Appendix A, and
show robustness to alternative matching thresholds.
Text matching limits the set of publications I use to infer application quality to those on
the same topic as the grant. This reduces the possibility that my measure of application quality
is contaminated by unrelated research. Funding itself, however, may also increase the number of
10

publications on the same topic as the grant. To address this concern, I also restrict my quality
calculations to articles published within one year of grant review. These articles are likely to be
based on research that was already completed or underway at the time the application was written,
and are thus unlikely to be directly supported by the grant.13
This procedure is designed to isolate the set of publications based on the ideas outlined within
a grant application. I then use citation information to assess the quality of these ideas. Specifically,
for each application, I count the the total number of publications, the total number of citations
these publications receive through 2012, and the number of “hit” publications, where a hit is
defined as being in the 90th, 95th, and 99th percentiles the citation distribution relative to all
other publications in its cohort (same field, same year). Because my sample begins in 1992 and
my citation data go through 2008, I can capture a fairly long run view of quality for almost all
publications associated with my sample grants (citations for life-sciences articles typically peak one
to two years after publication). This allows me to observe whether a project becomes important in
the long run, even if it is not initially highly cited.
Figure 2 shows that my matching approach is able to identify research associated with un-
funded applications. In fact, using the measure of quality described above, I find that unfunded
grants propose research that goes on to generate just as many citations and publications in the
near term. Table 1 shows that the mean grant application in my analytic sample is associated with
0.3 publications on the same topic, within the first year, and 10 citations to these publications. In
Section 5.1, I provide additional details about my quality measure and show how it can be used to
distinguish reviewer bias from expertise.
3.3 Measuring applicant characteristics
Finally, I construct detailed measures of applicant demographics, grant history, and prior pub-
lications. Using an applicant’s first and last name, I construct probabilistic measures of gender and
ethnicity (Hispanic, East Asian, or South Asian).14 I also search my database of grant applications
to build a record of an applicant’s grant history as measured by the number of new and renewal
13To compute the appropriate window, I consider funding, publication, and research lags. A grant application istypically reviewed four months after it is formally submitted, and, on average, another four to six months elapsebefore it is officially funded. See http://grants.nih.gov/grants/grants process.htm. In addition to this funding lag,publication lags in the life sciences typically range from three months to over a year. It is thus highly unlikely thatarticles published up to one year after grant review would have been directly supported by that grant. My resultsare robust to other windows.
14For more details on this approach, see Kerr (2008). Because Black or African American names are typically moredifficult to distinguish, I do not include a separate control for this group.
11

grants an applicant has applied for in the past and the number he has received. This includes
data on all NIH grant mechanisms, including non-R01 grants, such as post-doctoral fellowships
and career training grants. To obtain measures of an applicant’s publication history, I use data
from Thomson-Reuters Web of Science (WoS) and the National Library of Medicine’s PubMed
database. From these, I construct information on the number of research articles an applicant has
published in the five years prior to submitting her application, her role in those publications (in
the life sciences, this is discernible from the author position), and the impact of those publications
as measured by citations. In addition to observing total citations, I can also identify a publication
as “high impact” by comparing the number of citations it receives with the number of citations
received by other life-science articles published in the same year. Sample descriptives for these
variables are also provided in Table 1.
4 Identifying the casual impact of proximity
The first part of my empirical analysis estimates the effect of intellectual proximity to more
influential committee members:
Decisionicmt = a0 + a1Proximity to Permanenticmt + a2Total Proximityicmt (1)
+µXicmt + δcmt + eicmt.
Decisionicmt is a variable describing the committee’s decision (either the funding status, score,
or whether an application was scored at all) related to applicant i whose proposal is evaluated
by committee c in meeting m of year t. Proximity to Permanenticmt is the number of permanent
reviewers who have cited an applicant’s work in the 5 years prior to the committee meeting, and
Total Proximityicmt is the total number of such reviewers. The covariates Xicmt include indicators
for sex; whether an applicant’s name is Hispanic, East Asian, or South Asian; quartics in an
applicant’s total number of citations and publications over the past five years; indicators for whether
an applicant has an M.D. and/or a Ph.D.; and indicators for the number of past R01 and other
NIH grants an applicant has won, as well as indicators for the number to which she has applied.
The δcmt are fixed effects for each committee meeting so that my analysis compares outcomes for
grants that are reviewed by the same reviewers in the same meeting. Standard errors are clustered
at the committee-fiscal-year level.
12

My coefficient of interest is a1. a1 compares the funding outcomes of scientists whose applica-
tions are reviewed in the same meeting, who have similar past performance, and who, while close
to the same total number of reviewers, differ in their proximity to permanent reviewers. I interpret
this as the causal impact of proximity to influential members.
4.1 Impact of Proximity: Identifying Conditions
In order for a1 to identify the causal effect of proximity to influential reviewers, I need to show
that 1) proximity to permanent reviewers is not correlated with an applicant’s quality, conditional
on proximity to all reviewers and 2) that permanent reviewers are more influential within a study
section. I now provide more evidence for these claims.
One may be concerned that being cited by permanent reviewers signals higher quality than
being cited by temporary reviewers. To refute this, I begin by showing that permanent and tem-
porary members are similar in terms of their quality as scientists. Figure 3 and Table 3 show that
permanent and temporary reviewers have similar publication records. Figure 3, in particular, shows
that the distribution of their scientific merit, as measured by previous publications and citations,
is essentially identical. The bottom panel of Table 3 suggests why this may not be surprising:
permanent and temporary reviewers are often the same people; 35 percent of permanent reviewers
in a given meeting will be temporary reviewers in a future meeting and 40 percent of temporary
reviewers in a given meeting will be permanent reviewers in the future.
Even if permanent and temporary members are identical as scientists, there may still be
concerns arising from the fact that reviewers are not randomly assigned to applications. This
selection is nonrandom in two ways. First, rosters listing the permanent (but not temporary)
reviewers associated with a study section are publicly available, meaning that applicants know who
some of their potential reviewers may be at the time they submit their application. The scope for
strategic submissions in the life sciences, however, is small: for most grant applicants, there are
only one or two intellectually appropriate study sections and, because winning grants is crucial for
maintaining one’s lab and salary, applicants do not have the luxury of waiting for a more receptive
set of reviewers. Another way in which assignment is nonrandom is that study-section administrator
assigns it to initial reviewers on the basis of 1) intellectual match and 2) reviewer availability. If,
for instance, not enough permanent reviewers are qualified to evaluate a grant application, then
the study section administrator may call in a temporary reviewer. Temporary reviewers may also
be called if the permanent members qualified to review the application have already been assigned
13

too many other applications to review.
This process may raise concerns for my identification. For example, suppose that two ap-
plicants, one better known and higher quality, submit their applications to a study section that
initially consists of one permanent reviewer. The permanent reviewer is more likely to be aware
of the work of the better-known applicant and thus there would be no need to call on a related
temporary member. To find reviewers for the lesser-known applicant, however, the administrator
calls on a temporary reviewer. Both applicants would then be related to one reviewer in total but,
in this example, the fact that one applicant works in the same area as a temporary member is
actually correlated with potentially unobserved aspects of quality.
I deal with this and other similar concerns in two ways. First, I provide direct evidence that
the characteristics of applicants and the quality of their applications do not appear to related to
the types of reviewers who cite an applicant. Table 4 describes the demographic characteristics
and publication records of applicants separately by the number and types of reviewers they have
been cited by. It shows that applicants who have been cited by more reviewers in total tend to be
more established: they have stronger publication records and are less likely to be new investigators.
Conditional on total proximity, however, there appear to be few differences among applicants:
applicants cited by one permanent reviewer are virtually identical to those cited by one temporary
reviewer. Among applicants cited two reviewers, there do not appear to be differences among
applicants cited by two permanent reviewers or one of each. Those cited by two temporary reviewers
appear to have slightly fewer past publications, consistent with the concern raised above, but this
difference is less than five percent of a standard deviation. Approximately 75 percent of my sample
fall into the categories reported in Table 4, but this pattern holds for applicants cited by three or
more reviewers.
Figure 4 provides further evidence that type of reviewers who cite applicants is not correlated
with quality by examining the quality of the submitted application itself. The upper-left-hand
panel shows the distribution application quality (as defined in the previous section) for applicants
cited by exactly one reviewer. The solid line shows the distribution of quality among applicants
cited by one permanent reviewer and the dotted line does so for those cited by one temporary
reviewer. These distributions are essentially identical. Similarly, the upper-right-hand panel shows
the same, but with quality measured using the number of publications associated with a grant.
The bottom two panels of Figure 4 repeat this exercise for applicants who have been cited by a
total of two reviewers. In this case, there are now three possibilities: the applicant has been cited
14

by two temporary reviewers, two permanent, or one of each. In all of these cases, the distribution
of applicant quality is again essentially identical.
Having provided evidence that ties to permanent members is not indicative of quality, con-
trolling for total proximity, I now discuss how permanent members nonetheless have more influence
over funding decisions. There are many reasons why this is the case. Most basically, these reviewers
do more work. As discussed in Section 2, reviewers are responsible for providing initial assessments
of a grant application before that application is discussed by the full committee. These initial
assessments are extremely important for determining a grant application’s final score because they
1) determine whether a grant application even merits discussion by the full group and 2) serve as
the starting point for discussion. Study sections also evaluate 40 to 80 applications per meeting,
meaning that it is unlikely that reviewers have had a chance to carefully read proposals to which
they have not been officially assigned. In many study sections, moreover, there is also a rule that
no one can vote for scores outside of the boundaries set by the initial scores without providing a
reason.
While I do not have data on who serves as one of an application’s three initial reviewers,
permanent reviewers are much more likely to serve as an initial reviewer; they are typically assigned
eight to ten applications, compared with only one or two for temporary reviewers. In addition,
permanent members are required to be in attendance for discussions of all applications; in contrast,
temporary members are only expected to be present when their assigned grants are discussed,
meaning that they often miss voting on other applications. Finally, permanent members work
together in many meetings over the course of their four-year terms; they may thus be more likely to
trust, or at least clearly assess, one another’s advice, relative to the advice of temporary reviewers
with whom they are less familiar.
To test whether permanent members seem to have more influence, I use the fact that I observe
almost 5,000 unique reviewers in meetings in which they are permanent and in meetings in which
they are temporary. For each of these reviewers, I find the set of applicants they have cited and
show that a larger proportion of those applicants are funded when the reviewer is permanent rather
than temporary. These regressions include controls for applicant characteristics and reviewer fixed
effects, meaning that similarly qualified applicants cited by the same reviewer are more likely to be
funded when that reviewer is permanent than when the reviewer is temporary. These results are
presented in Table 5.
15
4.2 Impact of Proximity: Results
Table 6 considers the effect of intellectual proximity on funding and scores. The first col-
umn reports the raw within-meeting association between proximity to permanent reviewers and
an applicant’s likelihood of being funded. Without controls, each additional permanent reviewer
who has cited an applicant is associated with a 3.3 percentage point increase in the probability of
funding, from an overall average of 21.4 percent. This translates into a 15.4 percent increase. Most
of this correlation, however, reflects differences in quality; better applicants are more likely to be
cited by reviewers, as was seen in Table 4. Column 2 adds controls for applicant characteristics
such as past publication and grant history. This reduces the effect of proximity to an additional
permanent reviewer to 1.8 percentage points, or 8.4 percent. Even with these controls, the num-
ber of permanent members an applicant is cited by may still be correlated with some unobserved
aspect of application quality. To address this concern, I use proximity to all reviewers to control
for remaining differences in the quality of applicants that may be correlated with their proxim-
ity to permanent reviewers. Once I do this, my identifying variation comes from changes to the
composition of the reviewers who have cited an applicant—effectively the impact of switching the
reviewers an application is related to from temporary to permanent. In Column 3, I am compare
two scientists with similar observables, who are both cited by the same total number of reviewers
but by different numbers of permanent reviewers. I find that switching a related reviewer from
temporary to permanent increases an applicant’s chances of being funded by 0.7 percentage points,
or 3.3 percent. This is my preferred specification because it isolates variation in proximity that is
independent of an application’s quality.
Columns 6 and 9 report estimates of the impact of proximity to permanent reviewers on the
score that an application receives and whether an application is scored at all. I find a statistically
significant but economically small effect of proximity in scores: switching to a proximate permanent
reviewer increases—holding total proximity constant—an applicant’s score by 0.27 points or about
1 percent of a standard deviation. I also find a small impact for whether an applicant is scored
at all; the same experiment increases the probability that an applicant is scored by 0.5 percentage
points or just under 1 percent. This suggests reviewers are more likely to advocate when it matters
most, and not when applicants are far from the funding threshold. The next section discusses the
potential mechanisms for this effect, and considers the economic significance of its magnitude.
16

5 Expertise vs. Bias
So far, I have shown that applicants who work in the same area as more influential commit-
tee members are more likely to be funded. Is this a problem for peer review? Not necessarily.
Reviewers may advocate for candidates in their area simply because they are more confident in
their assessments; receiving more precise signals about related applicants allows reviewers to form
higher posterior expectations about their quality. This will lead to a greater proportion of related
applicants falling above the funding bar even in the absence of bias. Because this type of behavior
improves the quality of peer review, while biases do not, it is important to distinguish between the
two explanations.
To do so, I examine the relationship between funding and quality for different types of ap-
plicants. If reviewers are biased toward proximate candidates, then these candidates should be
more likely (or less, in the event of a negative bias) to be funded regardless of the quality their
application. This would lead to a level difference in funding likelihood between candidates who
work in the same areas as more influential reviewers, and those who do not. If reviewers have
better information about candidates in their area, then we would expect to see that their funding
decisions should be more sensitive to quality for these candidates; high quality candidates should
benefit from being evaluated by reviewers in their area while low quality candidates should be hurt.
This would lead to a steeper slope between quality and funding for related candidates.
In Appendix B, I formalize this intuition with a model of misaligned incentives with strategic
communication derived from Crawford and Sobel (1982). In this model, a reviewer has better
information about the quality of applications in his own area but also derives a personal payoff
(either positive or negative) from funding that application, independent of its quality. I show
that, in equilibrium, bias increases (or decreases) the level probability that intellectually proximate
candidates are funded, and expertise increases the slope of the relationship between quality and
funding for candidates in the same area.
I implement this test empirically as follows:
Dicmt = a0 + a1Proximity to Permanenticmt + a2Proximate to Permanenticmt ×Qualityicmt
+a3Qualityicmt + a4Total Proximityicmt + a5Total Proximityicmt ×Qualityicmt (2)
+µXicmt + δcmt + εicmt.
17

I am interested in the coefficients a1 and a2. Proximity to Permanenticmt is defined as the
number of permanent reviewers that cite an applicant’s prior work. a1 captures the effect of prox-
imity on funding that is attributable to bias: does being cited by permanent reviewers, conditional
on total proximity, affect an applicant’s likelihood of being funded for reasons unrelated to quality?
Bias is identified as the change in the level probability that a proximate applicant is funded. Mean-
while, Proximate to Permanenticmt×Qualityicmt is the interaction of an application’s quality with
an indicator for whether an applicant has been cited by a permanent reviewer. The coefficient a2
captures the role of expertise: it asks whether there is a steeper slope in the relationship between
quality and funding for applicants with intellectual ties to more influential reviewers. Appendix C
shows how Equation (2) can be derived from my underlying theoretical model and provides formal
conditions under which the coefficients a1 and a2 identify reviewer bias and expertise, respectively.
The remaining variables in Equation (2) control for potentially contaminating variation. I
control for the level of effect of application quality, total proximity to all reviewers, as well as the
interaction between these two terms. Controlling for these terms means that the coefficient of
interest a1 and a2 are estimated from applicants who have been cited by the same total number of
reviewers, but who differ in their ties to permanent reviewers. I also control for a variety of past
publication and demographic characteristics, Xicmt, described in Section 4.
Finally, the model in Appendix B that motivates Equation (2) also requires that I include
controls for the degree of selectivity in a committee. When committees a very small percentage of
applicants, the correlation between funding and quality will be low even in the absence of bias or
differential information because the marginal unfunded application is already very high-quality. In
my empirical implementation, I proxy for selectivity using the percentile pay line of the committee
and include a level control for pay line (this is absorbed in the meeting fixed effect). I also control
for the interaction of proximity and the payline. This ensures that proximity is not credited for
changing the correlation between funding and quality simply by lowering the threshold at which
grants are funded. My results are not affected by either the inclusion or exclusion of these variables.
In estimating Equation (2), it is important to have a measure of quality for unfunded appli-
cations. Without this information, I would not be able to include unfunded applications in this
regression, making it impossible to examine the impact of proximity on the extensive margin of
whether an application is funded. Even on the intensive margin—the score which an application
receives—observing quality for funded candidates only would likely bias my estimates. Figure 5
illustrates a stylized example of this problem for the case in which reviewers are biased in favor of
18

proximate applicants but not any better informed. The dotted lines identify the true relationship
between scores and quality, while the solid lines illustrate the relationship I would estimate on the
truncated subsample of funded applicants. In this case, at any given level of true quality, we are
more likely to observe related applicants in the funded sample, compared with unrelated appli-
cants. Because of this, I would underestimate the true extent of bias: at any given quality, I would
compare scores for related and unrelated candidates, observing only the unrelated candidates who
received high enough scores to be funded. Similarly, the estimated slope between scores and quality
would likely be steeper for the set of related applicants, relative to the same slope for unrelated
applicants, because the latter excludes more low scores for low quality candidates.
5.1 Expertise vs. Bias: Identifying Conditions
In Section 4.1, I discussed the identifying conditions for estimating the causal effect of intel-
lectual proximity. In this section, I discuss the conditions needed to further disentangle the effect
of proximity on funding that operates through bias from the effect that operates through better
information. These assumptions are derived from a formal theoretical and statistical model, which
is presented in Appendices B and C. Here, I state these conditions intuitively.
1. Conditional on covariates, quality is uncorrelated with proximity to permanent reviewers.
2. Conditional on covariates, measurement error in quality is mean zero.
3. Conditional on covariates, measurement error in quality is uncorrelated with proximity to
permanent reviewers.
Condition 1 states that proximity to permanent reviewers must be unrelated to quality, con-
ditional on proximity to all reviewers and other covariates. To see why Condition 1 is necessary,
suppose that I could observe an application’s true quality without error. In this case, I would not
need exogenous variation in proximity because I could still identify bias by controlling for quality
perfectly. In practice, however, there will always be measurement error in my estimates of quality,
meaning that the coefficient a3 in Equation (2) is likely to be attenuated. If quality and proximity
were correlated, this may have spillover effects on my estimate of bias, as captured by the coeffi-
cient a1. Condition 1 ensures that this is not a concern. Condition 1 is the same condition needed
to identify the causal impact of proximity in Section 4.1. As such, please see that section for a
discussion of evidence supporting this condition.
19

Condition 2 allows my quality measure to be noisy, but states that it cannot systematically
differ from the committee’s objective. Were this not the case, I may mistakenly conclude that
committees are biased when they are in fact prioritizing something completely different. While
there is no way to test this assumption because I cannot observe the committee’s objective function,
I address this concern in several ways. First, as described in Section 3.2, I construct a variety of
measures of application quality. These measures are based on many years, often even a decade, of
forward citations. Thus, if reviewers are using their expertise to maximize a welfare function based
on long-run impact or the number of hit publications, my quality measure would capture this.
Second, I include detailed controls for many applicant or application characteristics—probabilistic
gender and ethnicity, education, and past publication characteristics. This allows my framework to
identify bias even if, for instance, committees take diversity preferences into account when assessing
quality. Finally, even if Condition 2 were violated, my estimates will still consistently identify bias
with respect to maximizing the number of citations and hit publications produced by the NIH (see
Section 7). This in itself is a metric of decision making quality that is relevant for policy.
Condition 3 requires that my measure of quality be consistently measured for candidates who
are cited by more permanent members versus candidates who are cited by more temporary members.
This may be violated if proximity to permanent reviewers increases an applicant’s chances of being
funded (as documented in Section 4), and funding in turn impacts my measure of quality. For
example, suppose that two scientists apply submit proposals that are of the same quality, but that
the related scientist is funded because of bias. The funding, however, allows her to publish more
articles, meaning that my measure of quality—future citations—may mistakenly conclude that her
proposal was better than the other scientist’s to begin with. Mismeasurement of ex ante grant
quality makes it less likely that I would find an effect of bias.
In order to satisfy Condition 3, I must show that quality is consistently measured for funded
and unfunded applications, and that it is not affected by grant funding itself. I provide direct
evidence for this claim using variation in whether grants with the same score are funded. At the
NIH, grant applications given the same score in by the same review committee in the same meeting
can nonetheless have different funding outcomes. This occurs for two main reasons. First, grants
evaluated by the same committee meeting can be assigned to different NIH funding bodies with
different budgets. A cancer grant application may get funded even when a diabetes application
with the same score is not if the National Cancer Institute has a larger budget. Second, even
if both the funding bodies have the same budget, grants with the same score can face different
20

funding outcomes depending on how other grant applications are ranked. For example, a cancer
application may be funded if it is ranked relatively higher among all applications received by the
National Cancer Institute than a diabetes application with the same score but which is relatively
weaker than other diabetes applications that year. If funding has a direct impact on my measure of
quality, then I should mistakenly attribute higher quality to funded applications than to unfunded
ones with the same score. Figure 6 shows this is not the case. Each dot represents the mean number
of citations associated with funded applications that receive a particular score, regression-adjusted
to account for differences across meetings; the crosses represent the same for unfunded applications.
The dots do not lie systematically above the crosses, meaning that measured quality for funded
grants does not appear to be systematically higher than for unfunded grants with the same score.
The accompanying statistical test is reported in Table 7. I compare measured quality for
funded and unfunded grant applications with similar scores from the same meeting. Funding
status can vary because pay lines at different ICs differ within the same year. Column 1 shows
that, in general, funded grants have higher measures of quality than unfunded grants. Controlling
for a quartic in scores, however, eliminates this effect. Column 3 includes further controls for NIH
Institute (e.g. funding body) by year fixed effects. IC by year fixed effects controls for differences
in overall budgets so that the remaining variation in whether two applications with the same score
are funded comes from differences in how they rank relative to other grants. Again, we see that a
grant’s actual funding status does not impact my measure of its quality. Together with Figure 6,
this finding mitigates concerns that my measure of quality is directly affected by funding.
5.2 Expertise vs. Bias: Results
Table 8 reports my estimates of Equation (2), decomposing the effects of bias and exper-
tise. Columns 1, 3, and 5 reproduce the estimates of the level effect of proximity on funding and
scores from Table 6. Column 2 reports estimates of the coefficients from Equation (2) for funding
status. The positive and significant coefficients on the level effect of proximity (0.0068) indicates
that reviewers are biased in favor of applicants and the positive and significant coefficients on the
interaction of proximity with quality (0.076) indicate that reviewers also have more expertise about
related applications.
The magnitudes I find are sizable. To assess the extent of bias, compare the coefficient 0.0068
on proximity to the coefficient, 0.0136, on grant quality itself. The effect of being cited by an
additional permanent reviewer (holding quality constant) is half the size of the effect of submitting
21

an application that eventually generates 100 more citations. This means that bias helps an applicant
get funded by as much as would be expected from a 50 citation (or 1 standard deviation) increase
in quality. These figures suggest that review committees have a hard time discerning the quality of
applications, meaning that reviewer preferences end up playing a comparably large role in funding
decisions.
Reviewers, however, also do a better job of discerning quality of related applicants. Consider
a 1 standard deviation (51 citations) increase in the quality of a grant application: for an applicant
cited by a single permanent reviewer, my estimates imply that this change would increase her
chances of funding by (0.0136+0.0176−0.0005)∗0.51∗100 = 1.6 percentage points or 1.6/21.4=7.5
percent. If, instead, this applicant has been cited by a single temporary reviewer, the same increase
in quality would only increase her chances of funding by (0.0136 − 0.0005) ∗ 0.51 ∗ 100 = 0.7
percentage points or 3.3 percent. Committees are twice as responsive to changes in the quality of
applications in the subject area of permanent members.
Figure 7 demonstrates this point non-parametrically. Each point represents the mean number
of citations associated with applications that receive a particular score: the dots represent appli-
cations by scientists related to permanent reviewers and the crosses represent applications from
scientists who are not. The scores and quality measures I plot are regression-adjusted for commit-
tee meeting by number of total proximate reviewer fixed effects. These fixed effects take out any
systematic differences in scores or quality that can be attributed to differences in total proximity
or in the timing or subject matter of the proposal. What is plotted, then, is the relationship be-
tween scores and quality for applicants evaluated by the same committee meeting, who have been
cited by the same total number of reviewers. The steeper slope for applicants cited by permanent
members means that scores are more indicative of quality when reviewers are familiar with an ap-
plicant’s work. A good scientist, for instance, has a better chance of being funded when evaluated
by reviewers in her area—not only because of bias—but because the reviewers are more likely to
recognize the quality of her work. This increased sensitivity to quality, however, cuts both ways:
Figure 7 also shows that, for sufficiently low-quality applications, committees give lower scores to
proximate applicants. This means that expertise can partially undo the average impact of bias: a
bad scientist simply has a harder time hiding the quality of her application from reviewers in her
area.
One additional finding to note (row 5, across all columns) is that the coefficient on the in-
teraction between total proximity and application quality is negative: among applicants cited by
22

more reviewers, there is a lower correlation between scores and quality on average. While this may
seem puzzling at first, it makes sense when one remembers that the total number of reviewers who
cite an applicant is likely to be correlated with unobserved aspects of her quality. In this case,
the negative coefficient says that scores are less indicative of quality when an applicant is already
higher quality.
These results alleviate the potential concern that I may label reviewers as biased if they are
maximizing some unobserved aspect of application quality that is systematically different from my
citation-based measure.15 If, for example, reviewers are better at identifying “undervalued” research
in their own area, then they may be more likely to fund low-citation related research over higher-
citation unrelated research—not because of bias, but because of better information about the true
quality of related projects. This behavior, however, would tend to decrease the correlation between
citations and funding likelihood for related applicants, relative to unrelated applicants. The fact
that reviewers appear to be more sensitive to citation-based counts of quality for applicants in their
own area provides some evidence that citation counts convey useful information about the kind of
quality that reviewers care about.
These findings are also unlikely to be driven by the Matthew Effect, a sociological phenomenon
wherein credit and citations accrue to established investigators simply because they are established
(see Merton, 1986 and Azoulay, Stuart, and Wang, 2011). Were this the case, more established
applicants would be more likely to be funded and, separately, also more likely to receive citations
regardless of the true quality of their work: bias in the scientific community at large would obscure
my ability to detect bias in the review committee. However, my specifications control for many ap-
plicant characteristics that may be potentially correlated with prominence: publication and grant
history. If obtaining NIH grants improves grantsmanship or increases prestige, this should not affect
my estimates because I compare applicants with comparable CVs. Further, I also control for scien-
tific esteem as measured by proximity to all reviewers: there is no reason to believe that applicants
cited by permanent members are more prominent than those cited by temporary members.
Tables 6 and 8 also consider the impact of proximity on an application’s percentile score and
its likelihood of being scored at all (e.g., rejected early in the process due to low initial evaluations),
respectively. In both cases, I find a similar pattern, though an economically smaller effect. Being
related to a more influential set of reviewers increases an applicant’s score by a quarter of a percentile
and her likelihood of being scored by just over half a percent. The magnitudes of these estimates
15This would violate Condition 2, that measurement error in quality is conditionally mean zero.
23

suggest that reviewers both pay more attention to quality for applications at the margin of being
funded and are more likely to exercise their bias when this bias might be pivotal for funding.
Finally, the results in Tables 6 and 8 report the linear effect of proximity and quality on funding
decisions. In Appendix D, I show that these findings are robust to non-parametric and non-linear
specifications as well.
6 Alternate Identification Strategy
In my main specification, I identify the effect of proximity to more influential reviewers (per-
manent vs. temporary). This approach relies on the assumption that controlling that the total
number of reviewers who cite an applicant is an adequate control for unobserved differences in
quality that may be correlated with whether an applicant is cited by a permanent reviewer. A dif-
ferent approach would be to use applicant fixed effects to control for quality, compare the funding
outcomes of applications from the same applicant across meetings in which the applicant is cited
by different total numbers of reviewers.16 The downside of this approach is that applicant fixed
effects only control for time-invariant unobserved quality. If there are aspects of the quality of an
applicant’s proposal that are not controlled for with information on past publications and grant
histories, then this may bias my results.
This second approach also captures a slightly different causal effect: the effect of being related
to an additional reviewer, as opposed to being related to a more influential reviewer. The relative
magnitudes of these effects are theoretically ambiguous: if only permanent reviewers have influence,
then the effect of being related to a permanent reviewer (conditional on total proximity) will be
larger than the effect of being related to an additional member (because that additional member
may be temporary and thus, in this example, inconsequential). If, on the other hand, temporary
members have as much influence as permanent ones, then the composition of related reviewers
would not matter, but the number would. Table 9 reports estimates from this alternative identifi-
cation strategy. My results are similar: due to bias, an additional proximity reviewer increases an
applicant’s chances of being funded by 0.68 percentage points or 3.3 percent, identical to the main
estimate. I also find a stronger relationship between quality and funding among applicants with
16In my alternative specification using applicant fixed effects, the analogous regression equation is given by:
Dicmt = a0 + a1Total Proximityicmt + a2Qualityicmt × Total Proximityicmt
+ a3Qualityicmt + µXicmt + δi + εicmt.
24

greater intellectually proximity; a 1 standard deviation (51 citation) increase in quality has essen-
tially no effect on an applicant’s likelihood of being funded (conditional on applicant FEs), when
that applicant has not been cited by any member of the review committee. When one reviewer
has cited the applicant, this same change in quality translates into a 2.6 percentage point or a 12
percent increase in funding likelihood.
7 Additional Robustness Checks
The Appendix discusses a variety of robustness and specification checks, which I outline here.
Appendix Tables A through E examine the robustness of my results to alternative measures
of grant quality: restricting to authors with very rare names to improve the quality of publication
matches; varying my text-matching process; changing the time window I use to measure publications
associated with a grant; and restricting only to publications in which the PI has played a primary
role.
For example, not receiving a grant may slow down a scientist’s research by requiring her to
spend additional time applying for funding. If this is the case, then a grant can directly impact the
research quality of funded vs. non-funded applicants even before any funding dollars are disbursed.
To address this concern, I estimate an alternative specification focusing on publications on the same
topic that were published one year prior to the grant-funding decision; these articles are likely to
inform the grant proposal, but their quality cannot be affected by the actual funding decision. This
is described in Appendix Table C.
My next set of results describe broader tests of the logic of my empirical strategy. Appendix
Table F, for instance, reports a different test of the validity of my quality measure. If my results were
driven by changes in measured grant quality near the payline, I would find no effect of proximity for
applications that share the same funding status. To test for this, I examine the impact of proximity
on application scores for the subset of applications that are either all funded or all unfunded. In
both of these subsamples, I find evidence that being proximate to a permanent member increases
scores and increases the correlation between scores and quality. Because proximity cannot affect
actual funding status in these subsamples, the effect I find cannot be driven by differences in how
well quality is measured.
Another potential concern with my quality measure is that text-matching may eliminate
publications on topics different from that described in the grant application but which review
25
committees care about. It is common for grant funding to subsidize research on future projects
that may not be closely related to the original grant proposal; even though reviewers are instructed
to restrict their judgements to the merits of the research proposed in the grant application, it is
possible that they may attempt to infer the quality of an applicant’s future research pipeline and
that related reviewers might have more information about this. To test whether my results are
robust to this possibility, I use data on grant acknowledgements to match grants to all subsequent
publications, not just to the research that is on the same topic or which is published within a year
of grant review. Because grant acknowledgment data exist only for funded grants, this specification
can only examine whether proximity impacts the scores that funded applicants receive. In Appendix
Table G, I show that results using data on grant acknowledgments are largely similar.
Finally, Appendix Tables H and I show that my results are robust to allowing for nonpara-
metric and nonlinear effects of proximity and quality on funding decisions.
8 How Does Proximity Affect the Efficiency of Grant Provision?
My main results show that 1) applicants who are related to study-section members are more
likely to be funded, independent of quality, as measured by the number of citations that their
research eventually produces; and 2) the correlation between eventual citations and funding likeli-
hood is higher for related applicants, meaning that study-section members are better at discerning
the quality of applicants in their own area.
Next, I embed my analysis of the effect of relationships on decisions into a broader analysis
of their effect on overall efficiency. Assessing the efficiency consequences of related experts requires
taking a stand on the social welfare function that the NIH cares about; without one, it would be
impossible to assess whether distortions arising from the presence of related experts brings the the
grant review process closer to or further from the social optimum.
In this section, I assume that policymakers care about maximizing either the number or impact
of publications and citations associated with NIH-funded research. An important disclaimer to note
is that an efficiency calculation based on this measure of welfare may not always be appropriate.
If, for instance, the NIH cares about promoting investigators from disadvantaged demographic or
institutional backgrounds, then a policy that increases total citations may actually move the NIH
further from the goal of encouraging diversity. It may also be that part of the value that intellec-
tually close reviewers bring is that they are able to identify good research that may not be highly
26
cited; an efficiency calculation based on citation counts would naturally miss this contribution.17
Yet, while citations need not be the only welfare measure that the NIH cares about, there are
compelling reasons why policy-makers should take citation-based measures of quality in account
when assessing the efficacy of grant review. In addition to being a standard measure of quality used
by both economists when studying science and by scientists themselves, citations can also be used to
construct, as discussed in Section 3, flexible metrics that capture both high-quality normal science
and high-impact work. My citation data, moreover, extend beyond my sample period, allowing me
to observe the quality of a publication as judged in the long run. This alleviates concerns that
citations may underestimate the importance of groundbreaking projects that may not be well cited
in the short run.
Finally, an efficiency calculation should also take into account the marginal utility of funding
to an applicant’s research. Applicants who may receive funding elsewhere would benefit less from
NIH funding. Because I do not have information about their outside options, this is difficult to
assess. That said, the vast majority of life science academics in the US rely almost exclusively on
NIH funding to support their research programs.
Given these caveats, I begin by comparing the actual funding decision for an application to
the counterfactual funding decision that would have been obtained in the absence of relationships.
Specifically, I define
DecisionBenchmarkicmt = Decisionicmt (actual funding)
DecisionNo Relationshipicmt = Decisionicmt − a1Total Relatedicmt
− a2Qualityicmt × Related to permanenticmt,
where a1 and a2 are estimated from Equation (2) of Section 4.18 The counterfactual funding
decision represents what the committee would have chosen had applicants related to permanent
members been treated as if they were unrelated.
I summarize the effect of relationships by comparing the quality of the proposals that would
have been funded had relationships not been taken into account with the quality of those that
actually are funded. Specifically, I consider all applications that are funded and sum up the number
17Though if this were the case, we might expect a lower correlation between citations and funding outcomes amongapplicants working in the same areas as reviewer; as shown in Table 8, this is not the case.
18Even though DecisionNo Relationshipicmt is constructed using estimates from Equation (2), it does not rely on the
model to interpret those coefficients.
27

of publications and citations that accrue to this portfolio. This is my benchmark measure of
the quality of NIH peer review. I then simulate what applications would have been funded had
relationships not been taken into account. To do this, I fix the total number of proposals that
are funded in each committee meeting but reorder applications by their counterfactual funding
probabilities. I sum up the number of publications and citations that accrue to this new portfolio
of funded grants. The difference in the quality of the benchmark and counterfactual portfolio
provides a concrete, summary measure of the effect of relationships on the quality of research that
the NIH supports.
8.1 Results
Table 9 estimates the effect of relationships on the quality of research that the NIH supports.
In effect, I ask what the NIH portfolio of funded grants would have been had committees treated
applicants who are related to permanent members as if they were not, holding all else fixed. In my
sample, I observe 93,558 applications, 24,404 of which are funded. Using this strategy, I find that
2,500, or 2.7 percent, of these applications change funding status under the counterfactual.
On average, working in the same area as influential reviewers helps an applicant obtain funding;
ignoring this intellectual connection would decrease the number of proximate applicants who are
funded by 3.0 percent. The quality of applications funded when intellectual proximity is taken
into account, however, is higher. The overall portfolio of funded grants under the counterfactual
produces two to three percent fewer citations, publications, and high-impact publications. To take
account of the fact that some grants are funded and others are not, I use my standard funding-
purged measure of grant application quality—text-matched publications within one year of grant
review, and citations to those publications—as the measure of grant output used for this analysis.
This has the benefit of allowing me to compare the benchmark NIH portfolio with counterfactual
results, holding constant the effect of actual funding status. However, a downside of this approach
is that the stringent matching requirement will undercount the total number of publications (and
therefore citations) associated with these grants. This exercise should thus be used to compare the
percentage difference between the benchmark and counterfactual no-proximity cases, rather than
to discern the level of NIH output.
28

9 Conclusion
This paper develops a conceptual and statistical framework for understanding and separately
identifying the effects of bias and expertise in grant evaluation. My results show that, as a result of
bias, being related to a more influential member of a review committee increases an application’s
chances of being funded by 3.3 percent. This shows that even though scientists compete for scarce
resources such as funding and scientific priority, they nonetheless favor applications in their own
area, suggesting that they view the research of others as compliments to their own. Viewed in terms
of how committees respond to increases in application quality, this bias increases the chances that
an application will be funded by the same amount as would be predicted by a 2 standard deviation
change in quality. This very large figure suggests that committees have a hard time predicting
quality, and, by comparison, reviewer bias has a large effect on outcomes.
The expertise that reviewers have about research in their own area, however, also improves
the quality of review: working in the same area as a permanent committee member doubles the
responsiveness of review committees to application quality. On net, ignoring relationships reduces
the quality of the NIH-funded portfolio as measured by numbers of citations and publications by
two to three percent.
My results suggest that there may be scope for improving the quality of peer review. For
example, current NIH policy prohibits reviewers from evaluating proposals from their own institu-
tion. In the past, the National Bureau of Economic Research was considered a single institution,
meaning that economists often recused themselves from evaluating the work of other economists.19
The findings in this paper demonstrate why relaxing such policies may lead to improved evaluation.
19Current conflict of interest policies apply to members of the same NBER program.
29

References
[1] Acemoglu, Daron. (2008) Introduction to Modern Economic Growth, Princeton UniversityPress.
[2] Aghion, Philippe and Jean Tirole. (1994) “The Management of Innovation.” Quarterly Journalof Economics, 109(4), 1185-1209.
[3] Agarwal, Sumit, David Lucca, Amit Seru, and Francesco Trebbi. (2014) “Inconsistent Regu-lators: Evidence from Banking.” Quarterly Journal of Economics, 129 (2): 889-938.
[4] Arrow, Kenneth. (1962). “Economic welfare and the allocation of resources for invention.” inRichard Nelson, ed., The Rate and Direction of Inventive Activity, Princeton University Press.
[5] Azoulay, Pierre, Toby Stuart, and Yanbo Wang. (2011) “Matthew: Fact or Fable?” Workingpaper. Available online: http://pazoulay.scripts.mit.edu/docs/shmatus.pdf
[6] Bagues, Manuel and Natalia Zinovyeva. (2015) “The Role of Connections in Academic Pro-motions.” American Economic Journals: Applied Economics
[7] Blanes i Vidal, Jordi, Mirko Draca, and Christian Fons-Rosen. (2012) “Revolving Door Lob-byists.” American Economic Review, 102(7): 3731-48.
[8] Boudreau, Kevin, Eva Guinan, Karim Lakhani, and Christoph Riedl. (2012) “The NoveltyParadox & Bias for Normal Science: Evidence from Randomized Medical Grant ProposalEvaluations.” Harvard Business School Working Paper, No. 13-053.
[9] Brogaard, Jonathan, Joseph Engelberg and Christopher Parsons. (2012) “Network Positionand Productivity: Evidence from Journal Editor Rotations.” mimeo.
[10] Bertrand, Marianne and Antoinette Schoar. (2002) “Managing With Style: The Effect OfManagers On Firm Policies.” The Quarterly Journal of Economics 118(4), 1169-1208.
[11] Cockburn, Iain, and Rebecca Henderson. (2000) “Publicly Funded Science and the Productiv-ity of the Pharmaceutical Industry.” Innovation Policy and the Economy, 1: 1-34.
[12] Congressional Budget Office. (2006) “Research and Development in the Pharmaceuticals In-dustry.” Available online at: http://www.cbo.gov/ftpdocs/76xx/doc7615/10-02-DrugR-D.pdf
[13] Crawford, Vincent and Joel Sobel. (1982) “Strategic Information Transmission.” Econometrica,50(6):1431-1451.
[14] David, Paul, Mowery David, and W.E. Steinmueller. (1992) “Assessing the Economic Payofffrom Basic Research.” Economics of Innovation and New Technology 73-90.
[15] Garfagnini, Umberto, Marco Ottaviani, and Peter Norman Sorensen. (2014) “Accept or Reject?An Organizational Perspective,” International Journal of Industrial Organization, 34: 66-74.
[16] Gerin, William. (2006) Writing the NIH grant proposal: a step-by-step guide. Thousand Oaks,CA: Sage Publications.
30

[17] Ginther, Donna, Walter Schaffer, Joshua Schnell, Beth Masimore, Faye Liu, Laurel Haak, andRaynard Kington. (2011) “Race, Ethnicity, and NIH Research Awards.” Science, 333(6045):1015-1019.
[18] Griliches, Zvi. (1992) “The search for R&D spillovers.” Scandinavian Journal of Economics,94 (supplement), S29-S47.
Paper #4240
[19] Hansen, Stephen, Michael McMahon, and Carlos Velasco Rivera. (2012) “How Experts Decide:Preferences or Private Assessments on a Monetary Policy Committee?” mimeo.
[20] Hegde, Deepak. (2009) “Political Influence behind the Veil of Peer Review: An Analysis ofPublic Biomedical Research Funding in the United States” Journal of Law and Economics,52(4): 665-690.
[21] Jacob, Brian and Lars Lefgren. (2011) “The Impact of Research Grant Funding on ScientificProductivity.” Journal of Public Economics 95(9-10): 1168-1177.
[22] Jones, Benjamin. (2010) “Age and Great Invention.” Review of Economics and Statistics 92(1):1-14.
[23] Kane, Thomas, Jonah Rockoff, and Doug Staiger. (2007) “What Does Certification Tell UsAbout Teacher Effectiveness? Evidence from New York City.” Economics of Education Review27(6), 615-631.
[24] Kerr, William. (2008) “Ethnic Scientific Communities and International Technology Diffusion.”The Review of Economics and Statistics, 90(3): 518-537.
[25] Kondo, Jiro. (2006) “Self-Regulation and Enforcement: Evidence From Investor-Broker Dis-putes at the NASD” mimeo.
[26] Kremer, Michael and Heidi Williams. (2010) “Incentivizing innovation: Adding to the toolkit,”in Josh Lerner and Scott Stern, eds., Innovation Policy and the Economy, Vol. 10. Chicago,IL: University of Chicago Press.
[27] Laband, David and Piette, Michael. (1994) “Favoritism versus Search for Good Papers: Em-pirical Evidence Regarding the Behavior of Journal Editors,” Journal of Political Economy,102(1), 94-203.
[28] Li, Hao, Sherwin Rosen, and Wing Suen. (2001) “Conflicts and Common Interests in Com-mittees.” American Economic Review, 91(5): 1478-1497.
[29] Lucca, David, Amit Seru, and Francesco Trebbi. (2014) “The Revolving Door and WorkerFlows in Banking Regulation.” Journal of Monetary Economics.
[30] Merton, Robert. (1968) “The Matthew Effect in Science” Science 159(3810): 5663.
[31] Pearson, Helen. (2003) “Competition in biology: It’s a scoop!.” Nature, 426, 222-223.
[32] Sampat, Bhaven and Frank Lichtenberg. (2011) “What are the Respective Roles of the Publicand Private Sectors in Pharmaceutical Innovation?” Health Affairs, 30(2): 332-339.
[33] Stephan, Paula. (2012) How Economics Shapes Science. Cambridge, MA: Harvard UniversityPress.
31
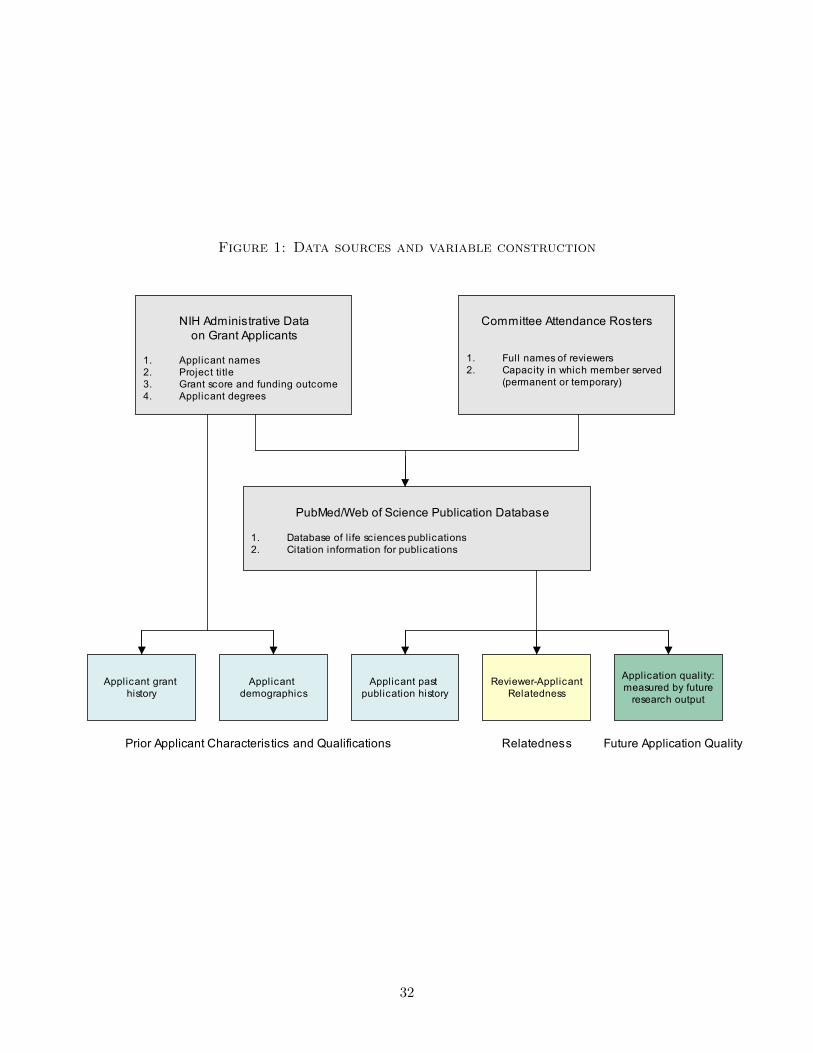
Figure 1: Data sources and variable construction
NIH Administrative Data
on Grant Applicants
1. Applicant names
2. Project title
3. Grant score and funding outcome
4. Applicant degrees
PubMed/Web of Science Publication Database
1. Database of l ife sciences publications
2. Citation information for publications
Reviewer-Applicant
Relatedness
Applicant past
publication history
Applicant
demographics
Applicant grant
history
Application quality:
measured by future
research output
Committee Attendance Rosters
1. Full names of reviewers
2. Capacity in which member served
(permanent or temporary)
Prior Applicant Characteristics and Qualifications Relatedness Future Application Quality
32

Figure 2: Distribution of application quality: funded and unfunded grants0
.1.2
.3D
ensi
ty
0 1 2 3 4 5Funding−Purged Quality Measure
(# Text−matched Publications in 0−1 yr Window)
FundedUnfunded
Distribution of Publications for Funded and Unfunded Applications
0.0
5.1
.15
Den
sity
0 5 10 15 20 25Funding−Purged Quality Measure
(# Text−matched Citations in 0−1 yr Window)
FundedUnfunded
Distribution of Citations for Funded and Unfunded Applications
®
Note: This is the density of the quality of funded and unfunded applications. Application qualityis constructed as described in the text. See Section 3.2 for details.
33

Figure 3: Distribution of past citations: permanent and temporary reviewers
0.0
05.0
1.0
15.0
2D
ensi
ty
0 50 100 150 200# of Publications
PermanentTemporary
Distribution of Past Publications for Permanent and Temporary Reviewers0
.000
2.0
004
.000
6.0
008
Den
sity
0 1000 2000 3000 4000 5000# of Citations
PermanentTemporary
Distribution of Past Citations for Permanent and Temporary Reviewers
®
Note: This plots the density of past publications and citations for temporary and permanentreviewers based on research published in the five years prior to the grant review meeting in whichthe reviewer is observed.
34

Figure 4: Application quality conditional on total related reviewers
0.1
.2.3
.4.5
Dens
ity
0 5 10 15 20 25Residual Funding−Purged Quality Measure
(# Text−matched Citations in 0−1 yr Window)
1 Permanent Reviewer1 Temporary Reviewer
Distribution of Citation−based QualityApplicants Cited by 1 Reviewer
0.5
11.
52
2.5
Dens
ity
0 1 2 3 4Residual Funding−Purged Quality Measure
(# Text−matched Citations in 0−1 yr Window)
1 Permanent Reviewer1 Temporary Reviewer
Distribution of Publication−based QualityApplicants Cited by 1 Reviewer
0.1
.2.3
.4De
nsity
0 5 10 15 20 25Residual Funding−Purged Quality Measure
(# Text−matched Citations in 0−1 yr Window)
2 Permanent Reviewers1 Permanent and 1 Temporary Reviewer2 Temporary Reviewers
Distribution of Citation−based QualityApplicants Cited by 2 Reviewers
0.5
11.
52
2.5
Dens
ity
0 1 2 3 4Residual Funding−Purged Quality Measure
(# Text−matched Citations in 0−1 yr Window)
2 Permanent Reviewers1 Permanent and 1 Temporary Reviewer2 Temporary Reviewers
Distribution of Publication−based QualityApplicants Cited by 2 Reviewers
®
Note: This is the density of past publications and citations for applicants related to the same totalnumber of reviewers but to different numbers of temporary and permanent reviewers. Quality ismeasured as described in Section 3.2. The top panels graph quality measures for applicants relatedto one total reviewer; the bottom panel repeat this exercise for applications related to two totalreviewers.
35

Figure 5: Example of truncation bias with unfunded applicants
Score
Quality
Funded Above Payline
True Bias
Estimated Bias
Proximate Applicants
Not Proximate Applicants
Unfunded Below Payline
Note: This figure plots an applicant’s study section score against the quality of his or her applica-tion. The blue dots represent applicants who are cited by more permanent reviewers, conditionalon total proximity. The red dots represent applicants who are cited by fewer permanent reviewers,conditional on total reviewers. The black horizontal line is the payline: grants with scores abovethis line are funded, while those that are below are not. In this stylized example, reviewers arebiased—for the same quality application, proximate applicants receive higher scores—but reviewersare not better informed—the slope of the relationship between quality and scores is the same forboth types of applicants. If I were only able to observe quality for funded applicants, all the dotsbelow the payline (the faded dots) would not be in my sample. A regression line through thesedata, would identify the solid regression lines. In this case, my estimate of bias would be smallerthan true bias. Similarly, in this example, being unable to observe the quality of all applicantswould lead me to under estimate the relationship between scores and quality, especially for themore truncate sample of unrelated applicants.
36

Figure 6: Mean application quality by score: funded and unfunded grants
−.1
−.05
0.0
5.1
.15
Resid
ual F
undi
ng−P
urge
d Q
uality
Mea
sure
(# T
ext−
mat
ched
Cita
tions
in 0−1
yr W
indo
w)
−40 −20 0 20 40Residual Score
Funded Unfunded
Measuring Quality for Funded and Unfunded Grants
−.1
−.05
0.0
5.1
.15
Resid
ual F
undi
ng−P
urge
d Q
uality
Mea
sure
(# T
ext−
mat
ched
Cita
tions
in 0−1
yr W
indo
w)
−60 −40 −20 0 20 40 60Residual Score
Funded Unfunded
Including Unscored ApplicationsMeasuring Quality for Funded and Unfunded Grants
®
Note: The x-axis represents the score an application receives, net of meeting fixed effects; the y-axisrepresents application quality, also net of meeting effects. Each dot represents average quality forapplications with a given score, rounded to the ones digit. See Section 5.1 for more details.
37
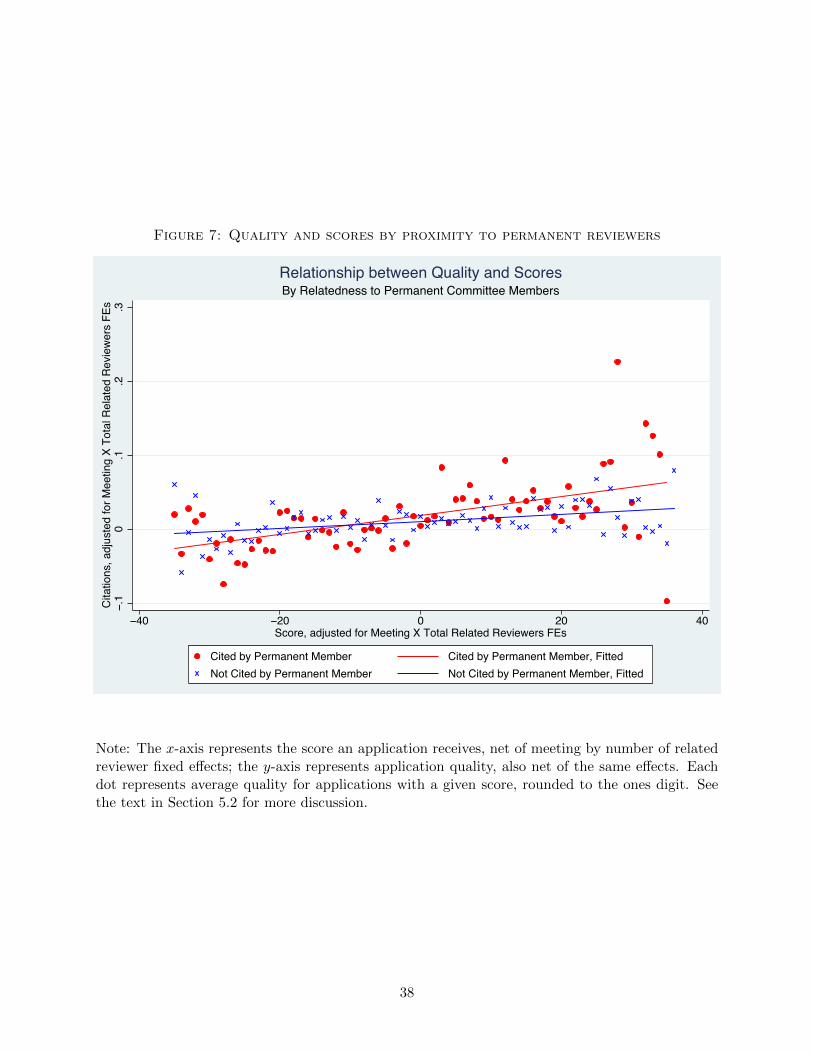
Figure 7: Quality and scores by proximity to permanent reviewers
−.1
0.1
.2.3
Cita
tions
, adj
uste
d fo
r Mee
ting
X To
tal R
elat
ed R
evie
wer
s FE
s
−40 −20 0 20 40Score, adjusted for Meeting X Total Related Reviewers FEs
Cited by Permanent Member Cited by Permanent Member, FittedNot Cited by Permanent Member Not Cited by Permanent Member, Fitted
By Relatedness to Permanent Committee MembersRelationship between Quality and Scores
−.1
0.1
.2C
itatio
ns, a
djus
ted
for M
eetin
g X
Tota
l Pro
xim
ity to
Rev
iew
ers
FEs
−40 −20 0 20 40Score, adjusted for Meeting X Total Proximity to Reviewers FEs
Cited by Permanent Member Cited by Permanent Member, FittedNot Cited by Permanent Member Not Cited by Permanent Member, Fitted
By Proximity to Permanent Committee Members, Unscored Applicants IncludedRelationship between Quality and Scores
®
Note: The x-axis represents the score an application receives, net of meeting by number of relatedreviewer fixed effects; the y-axis represents application quality, also net of the same effects. Eachdot represents average quality for applications with a given score, rounded to the ones digit. Seethe text in Section 5.2 for more discussion.
38

Table 1: Grant application descriptives
Sample Coverage Std. Dev. Std. Dev.
# Grants 93,558 156,686
# Applicants 36,785 46,546
Years 1992-2005 1992-2005
# Study Sections 250 380
# Study Section Meetings 2,083 4,722
% Awarded 26.08 30.48
% Scored 61.58 64.04
% New 70.31 71.21
Percentile Score 70.05 18.42 71.18 18.75
# Publications (text-matched, in first year after grant review)
0.3 0.8 0.3 0.8
# Citations (up to 2008, to text-matched publications in first year after grant review)
10 51 11 55
Applicant (PI) Characteristics
% Female 23.21 22.58
% Asian 13.96 13.27
% Hispanic 5.94 5.79
% M.D. 28.72 29.26
% Ph.D. 80.46 79.69
% New investigators 19.70 20.02
# Publications, past 5 years 15 60 15 55
# Citations, past 5 years 416 1,431 423 1,474
Roster-Matched Sample
Notes: The analytic sample includes new or competing R01 grants evaluated in charterd study sections from 1992 to 2005, for which I have study section attendance data, with social science study sections dropped. The quality of grant applications is measured as follows: # Publications refers to the number of research articles that the grant winner publishes in the year following the grant which share at least one salient word overlap between the grant project title and the publication title. # Citations refers to the total number of citations that accrue to this restricted set of publications, from the time of publication, to the end of my citation data in 2008. Applicant characteristics are measured as follows: female, Asian, and Hispanic are all defined probabilistically based on full name. A new investigator is one who has never previously been a PI on an NIH grant. Past publications include any first, second, and last authored articles published in the five years prior to applying for the grant. # Citations include all citations to those publications, to 2008. Investigators with common names are dropped as are any for which the covariates are missing.
Table 1: Applicant Characteristics
Full Sample
Grant Application Characteristics
39

Table 2: Committee descriptives
Std. Dev.
# Reviewers 18,916
# Applications 53.73 17.31
Composition
# Permanent reviewers per meeting 17.23 4.52
# Temporary reviewers per meeting 12.35 7.44
# Meetings per permanent reviewer 3.69 3.03
# Meetings per temporary reviewer 1.78 1.30
Relatedness
# Reviewers who cite applicant 1.94 2.81
# Permanent reviewers who cite applicant 1.11 1.73
# Permanent reviewers cited by applicants 4.12 5.32
# Temporary reviewers cited by applicants 4.12 5.09
Roster Matched Sample
Table 3: Committee Descriptives
Notes: The analytic sample includes new or competing R01 grants evaluated in charterd study sections from 1992 to 2005, for which I have study section attendance data. Future publications refers to the number of research articles that the grant winner publishes in the year following the grant which share at least one salient word overlap between the grant project title and the publication title. Past publications include any first, second, and last authored articles published in the five years prior to applying for the grant. Investigators with common names are dropped as are any for which the covariates are missing. Social science study sections are dropped.
40
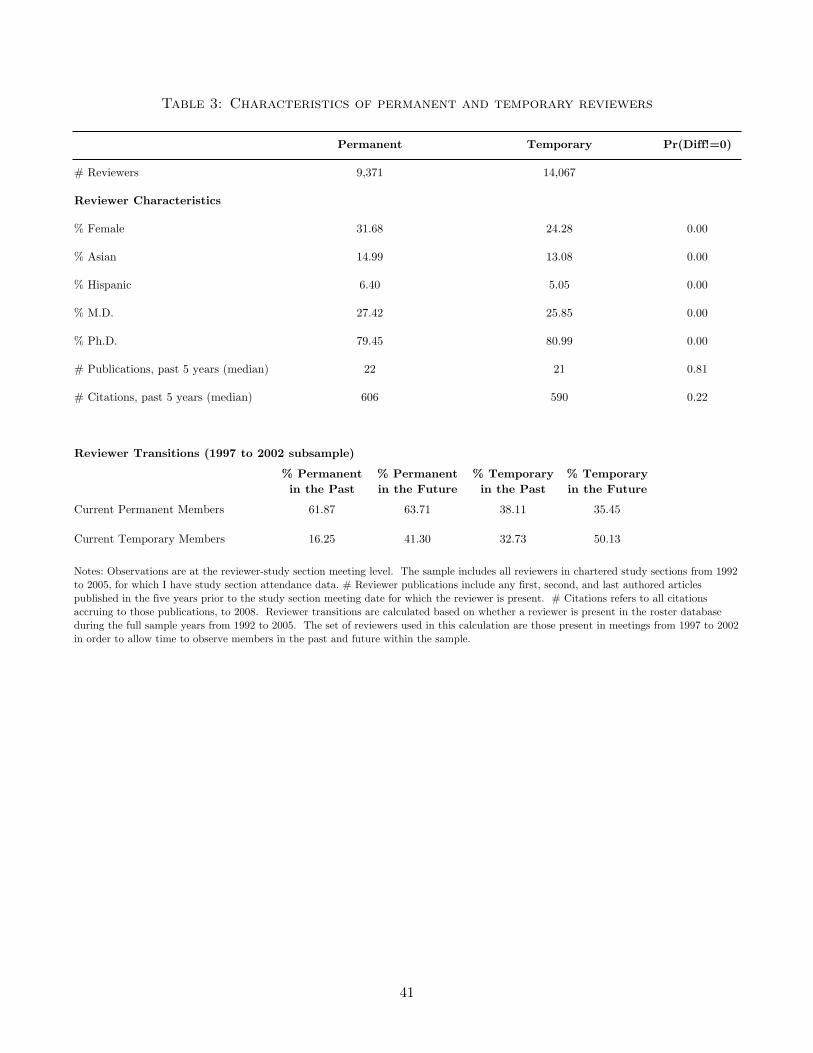
Table 3: Characteristics of permanent and temporary reviewers
Pr(Diff!=0)
# Reviewers
Reviewer Characteristics
% Female 0.00
% Asian 0.00
% Hispanic 0.00
% M.D. 0.00
% Ph.D. 0.00
# Publications, past 5 years (median) 0.81
# Citations, past 5 years (median) 0.22
Reviewer Transitions (1997 to 2002 subsample)
% Permanent in the Past
% Permanent in the Future
% Temporary in the Past
% Temporary in the Future
Current Permanent Members 61.87 63.71 38.11 35.45
Current Temporary Members 16.25 41.30 32.73 50.13
Notes: Observations are at the reviewer-study section meeting level. The sample includes all reviewers in chartered study sections from 1992 to 2005, for which I have study section attendance data. # Reviewer publications include any first, second, and last authored articles published in the five years prior to the study section meeting date for which the reviewer is present. # Citations refers to all citations accruing to those publications, to 2008. Reviewer transitions are calculated based on whether a reviewer is present in the roster database during the full sample years from 1992 to 2005. The set of reviewers used in this calculation are those present in meetings from 1997 to 2002 in order to allow time to observe members in the past and future within the sample.
Table 4: Characteristics of permanent and temporary Reviewers
590
79.45
22
606
14,067
24.28
13.08
5.05
Permanent Temporary
9,371
25.85
80.99
21
31.68
14.99
6.40
27.42
41

Table 4: Applicant characteristics, by # and composition of related reviewers
Cited by 0 Reviewers
% Female
% Asian
% Hispanic
% M.D.
% Ph.D.
% New investigators
# Publications, past 5 years (median)
# Citations, past 5 years (median)
N
Cited by 1 Reviewer Total
% Female
% Asian
% Hispanic
% M.D.
% Ph.D.
% New investigators
# Publications, past 5 years (median)
# Citations, past 5 years (median)
N
Cited by 2 Reviewers Total
% Female
% Asian
% Hispanic
% M.D.
% Ph.D.
% New investigators
# Publications, past 5 years (median)
# Citations, past 5 years (median)
N
Table 5: Applicant characteristics, by number and composition of Proximate reviewers
172(713)
6.88
25.40
37,757
27.22
9(31)
82.73
27.50
15.35
17
510
4,841 5,094 2,403
15.88 16.25 17.06
1818
2 Temporary
22.93
13.69
5.82
28.53
81.04
(45)
(1336) (1233) (1050)563 556
(31) (50)
12.54 13.17
81.63
28.64 29.28
79.88 80.02
19.7619.34
(49)
1 Permanent 1 Temporary
2 Permanent 1 Each
20.26 20.89
15 15
442 443
(52)
15.09
5.79 5.57
27.11 26.71
82.24
Notes: See notes to Table 1 for details of the sample. Applicant characteristics are measured as follows: female, Asian, and Hispanic are all defined probabilistically based on full name. A new investigator is one who has never previously been a PI on an NIH grant. Past publications include any first, second, and last authored articles published in the five years prior to applying for the grant. # Citations include all citations to those publications, to 2008.
22.24 23.97
5.14 5.02
10,980 7,049
(1102) (1080)
13.51
42

Table 5: Do permanent reviewers have more influence?
Proportion of Proximate Applicants who are Funded
Average Score of Proximate Applicants
(1) (2)
Proximate Applicant is Permanent 0.003*** 0.336**
(0.001) (0.144)
Observations 15871 15870
R-squared 0.954 0.571
Reviewer FE X X
Past Performance, Past Grants, and Demographics
X X
Appendix Table A: Do permanent reviewers have more influence?
Notes: This examines how outcomes for applicants cited by reviewers vary by whether the citing reviewer is serving in a permanent or temporary capacity. The sample is restricted to 4909 reviewers who are observed both in temporary and permanent positions. An applicant is said to be proximate if a reviewer has cited that applicant in the 5 years prior to the study section meeting in which the reviewer and applicant are matched. "Past Performance, Past Grants, and Demographics" include indicators for sex and whether an applicant's name is Hispanic, East Asian, or South Asian, indicator variables for deciles of an applicant's total number of citations and publications over the past 5 years, indicators for whether an applicant has an M.D. and/or a Ph.D., and indicators for the number of past R01 and other NIH grants an applicant has won, as well as indicators for how many she has applied to.
43

Table6:W
hatis
theeffectofbeing
related
to
arevieweronfunding
outcomes?
(1)
(2)
(3)
(4)
(5)
(6)
(7)
(8)
(9)
Pro
xim
ity
to P
erm
anen
t R
evie
wer
s0.
0328
***
0.01
75**
*0.
0072
***
1.10
67**
*0.
6107
***
0.27
36**
*0.
0500
***
0.02
63**
*0.
0047
**(0.001)
(0.001)
(0.002)
(0.054)
(0.054)
(0.094)
(0.002)
(0.001)
(0.002)
Tot
al P
roxi
mity
0.00
76**
*0.
2512
***
0.01
60**
*(0.001)
(0.061)
(0.001)
Obs
erva
tion
s93
,558
93,5
5893
,558
57,6
1357
,613
57,6
1393
,558
93,5
5893
,558
R-s
quar
ed0.
0630
0.09
300.
0935
0.11
860.
1423
0.14
260.
0775
0.12
970.
1312
Mee
ting
FE
sX
XX
XX
XX
XX
Pas
t P
erfo
rman
ce, P
ast
Gra
nts,
and
Dem
ogra
phic
sX
XX
XX
X
Not
es: S
ee n
otes
to
Tab
le 1
for
det
ails
abo
ut t
he s
ampl
e. C
oeffi
cien
ts a
re r
epor
ted
from
a r
egre
ssio
n of
com
mitte
e de
cisi
ons
(abo
ve p
aylin
e, s
core
, or
scor
ed a
t al
l) o
n th
e nu
mbe
r of
per
man
ent
mem
bers
rel
ated
to
an a
pplic
ant, c
ontr
ollin
g fo
r m
eeting
leve
l fix
ed e
ffect
s. P
roxi
mity
to p
erm
anen
t re
view
ers
is d
efin
ed a
s th
e nu
mbe
r of
per
man
ent
revi
ewer
s w
ho h
ave
cite
d an
y of
the
app
lican
t's r
esea
rch
in t
he 5
yea
rs p
rior
to
gran
t re
view
. "P
ast
Per
form
ance
, Pas
t G
rant
s, a
nd D
emog
raph
ics"
incl
ude
indi
cato
rs for
sex
an
d w
heth
er a
n ap
plic
ant's
nam
e is
His
pani
c, E
ast
Asi
an, o
r So
uth
Asi
an, i
ndic
ator
var
iabl
es for
dec
iles
of a
n ap
plic
ant's
tot
al n
umbe
r of
citat
ions
and
pub
licat
ions
ove
r th
e pa
st 5
yea
rs, i
ndic
ator
s fo
r w
heth
er a
n ap
plic
ant
has
an M
.D. a
nd/o
r a
Ph.
D.,
and
indi
cato
rs for
the
num
ber
of p
ast
R01
and
oth
er N
IH g
rant
s an
app
lican
t ha
s w
on, a
s w
ell a
s in
dica
tors
for
how
man
y sh
e ha
s ap
plie
d to
.
Tab
le 6
: W
hat
is t
he e
ffec
t of
Inte
llec
tual
Pro
ximit
y?
1(Sco
red a
t al
l)
Mea
n =
0.6
40, S
D =
0.4
80M
ean
= 0
.214
, SD
= 0
.410
Mea
n =
71.
18, S
D =
18.
75
1(Sco
re is
abov
e th
e pay
line)
Sco
re

Table 7: Does being funded affect my measure of application quality?
(1) (2) (3)
1(Grant is funded) 0.0457*** 0.0096 0.0091(0.005) (0.009) (0.009)
Observations 57,613 57,613 57,613
R-squared 0.0570 0.0575 0.0608
Meeting FEs X X X
Quartics of Score X X
Institute X Year FEs X
Subsample of Scored Applications
Grant Application Quality(# of citations to text-matched publications within 1 year of grant review)
Table 2: Does being funded directly affect my measure of quality?
Notes: Coefficients are reported from a regression of grant quality on an indicator for whether the grant was funded and meeting fixed effects. Columns 2 and 3 include controls for quartics in the applicant score: these effectively compare grant applications with the same score, evaluated in the same meeting, but which differ in funding status. Scores are available only for applications that were not triaged.
45

Table 8: What is the role of expertise vs. bias?
(1) (2) (3) (4) (5) (6)
Proximity to Permanent Reviewers 0.0072*** 0.0068*** 0.2736*** 0.2590*** 0.0047** 0.0043**(0.002) (0.002) (0.094) (0.095) (0.002) (0.002)
Proximate to Permanent Reviewers × Grant Application Quality 0.0176** 0.2739 0.0162*
(0.008) (0.325) (0.009)
Grant Application Quality 0.0136** 0.5568** 0.0305***(0.006) (0.261) (0.008)
Total Proximity 0.0076*** 0.0078*** 0.2512*** 0.2565*** 0.0160*** 0.0165***(0.001) (0.001) (0.061) (0.061) (0.001) (0.001)
Total Proximity X Grant Application Quality -0.0005 -0.0043 -0.0036***
(0.001) (0.049) (0.001)
Observations 93,558 93,558 57,613 57,613 93,558 93,558
R-squared 0.0935 0.0949 0.1426 0.1431 0.1312 0.1322
Meeting FEs X X X X X X
Past Performance, Past Grants, and Demographics
X X X X X X
1(Scored at all)
Mean = 0.640, SD = 0.480
Notes: See notes to Table 1 for details about the sample. Coefficients are reported from a regression of committee decisions (above payline, score, or scored at all) on relatedness and quality measures, controlling for meeting level fixed effects. Proximity to permanent reviewers is defined as the number of permanent reviewers who have cited the applicant's research in the 5 years prior to grant review. ''Grant Application Quality" is defined as the number of citations up to 2008, for all publications that are text-matched to the grant application within 1 year of grant review, in the 100s unit. "Past Performance, Past Grants, and Demographics" include indicators for sex and whether an applicant's name is Hispanic, East Asian, or South Asian, indicator variables for deciles of an applicant's total number of citations and publications over the past 5 years, indicators for whether an applicant has an M.D. and/or a Ph.D., and indicators for the number of past R01 and other NIH grants an applicant has won, as well as indicators for how many she has applied to.
Table 7: What is the contribution of expertise vs. bias?
1(Score is above the payline)
Score
Mean = 0.214, SD = 0.410 Mean = 71.18, SD = 18.75
46

Table 9: What is the role of expertise vs. bias? Applicant Fixed Effects
49
(1) (2) (3) (4) (5) (6)
Total Proximity 0.0061*** 0.0068*** 0.2678*** 0.2639*** 0.0111*** 0.0110***(0.001) (0.001) (0.058) (0.058) (0.001) (0.001)
Total Proximity × Grant Application Quality 0.0260** 0.2895 0.0187**
(0.012) (0.469) (0.009)
Grant Application Quality -0.0136 -0.0829 -0.0069(0.011) (0.468) (0.009)
Observations 93,558 93,558 57,613 57,613 93,558 93,558
R-squared 0.4525 0.4646 0.5451 0.5451 0.5635 0.5636
Applicant FEs X X X X X X
Past Performance and Past Grants
X X X X X X
Notes: See notes to Table 1 for details about the sample. Coefficients are reported from a regression of committee decisions (above payline, score, or scored at all) on relatedness and quality measures, controlling for individual applicant fixed effects. Total Proximity is defined as the number of reviewers who have cited the applicant's research in the 5 years prior to grant review. ''Grant Application Quality" is defined as the number of citations up to 2008, for all publications that are text-matched to the grant application within 1 year of grant review, in the 100s unit. "Past Performance and Past Grants" include indicator variables for deciles of an applicant's total number of citations and publications over the past 5 years and indicators for the number of past R01 and other NIH grants an applicant has won, as well as indicators for how many she has applied to. Demographic variables are absorbed in the applicant FE.
Table 8: What is the contribution of expertise vs. bias? Applicant fixed effects
1(Score is above the payline)
Score 1(Scored at all)
Mean = 0.214, SD = 0.410 Mean = 71.18, SD = 18.75 Mean = .640, SD = .480
47

Table 9: What is the effect of proximity on the quality of the NIH portfolio?
Benchmark No Proximity
Number of Funded Grants 24,404 24,404
Number of Grants that Change Funding Status 2,500 2,500
Total # Citations 584,124 566,284(% change relative to benchmark) (3.05)
Total # Publications 11,149 10,851(% change relative to benchmark) (2.67)
Total # in Top 99% of Citations 590 572(% change relative to benchmark) (3.05)
Total # in Top 90% of Citations 10,239 9,925(% change relative to benchmark) (3.07)
Total # Related Applicants Funded 18,666 18,113(% change relative to benchmark) (2.96)
Table 9: What is the effect of relatedness on the aggregate quality of NIH funded grants?
Notes: Benchmark refers to characteristics of grants ordered according to their predicted probability of funding, using the main regression of funding status on proximity and grant application quality. "Benchmark" figures are the grant quality measures for a grants that would be funded if we used the predicted ordering from the regression of funding likelihood on relatedness and quality estimated in Column 2 of Table 8. "No relationships" refers to the predicted ordering of grants under the same regression, but under the assumption that relatedness to permanent members and relatedness to permanent members interacted with quality do not matter (their coefficients are set to zero). To take account of the fact that some grants are funded and others are not, we use our standard funding-purged measure of grant application quality: text-matched publications within one year of grant review, and citations to those publications. The number of projects that are funded is kept constant within meeting. See text for details.
48

APPENDIX MATERIALS
A Measuring Grant Application Quality
This paper uses data from three sources: NIH administrative data for the universe of R01
grant applications, attendance rosters for NIH peer-review meetings, and publication databases for
life-sciences research. Figure 1 and Section 3 summarizes how these data sources fit together and
provide details on how applicant characteristics are measured, and how proximity is measured. In
this section, I provide additional details on the more complicated process of defining the quality of
grant applications.
A.1 Match Process
For each grant application, I have information on the name of the applicant, the title of
the grant project and, in some cases, location identifiers for the applicant. I also have data from
Thomson Reuters ISI Web of Science (ISI), containing information on publication titles, abstracts,
and author names. To match these, I restrict to life science journal articles (e.g. excluding reviews,
comments, etc.) in ISI with the same author name, published within 1 year of the study section
meeting date. I have full name information in the NIH grant data, but publications are listed by
last name and first and middle initial only. This results in some cases in which several authors can
have the same initials (e.g. Smith, TA). In my baseline specifications, I exclude PIs with common
names, defined as those last name, first initial, middle initial combinations shared by more than
two individuals in PubMed. This amounts to about 7% of the sample being removed.
After removing common names and proceeding with an initial name and publication year
match, I am left with a set of 16,134,500 possible grant-publication matches for 158,099 project titles
and 3,274,225 possible publications. From this set, I compare the content of the grant project title
with that of the publication title and publication abstract. I first remove a list of common stop words
using the standard MySQL full test stop words list (available at http://dev.mysql.com/doc/refman/5.5/en/fulltext-
stopwords.html). After doing so, the average grant project title has 4.87 semantic words (SD 1.10).
The average publication title has 8.90 words (SD 3.38); the average abstract has 52.1 words (SD
36.9). 11.58% of potential pairs have at least one overlapping word between the grant and publica-
tion titles. 18.08% of potential pairs share a common semantic word. These comparisons are made
from raw words only so that “mice” and ”mouse” or “males” and “male” would not match.
49

In our main specifications, we say that a publication and grant application are text-matched
to each other if they share at least 4 semantic words in either the publication title or abstract.
Consider the following example from my data.
In 1999, the National Institute of Allergy and Infectious Disease funded grant number 1R01AI045057-
01 from the applicant John C Boothroyd at Stanford University. The grant project title was titled
“Genetics of Invasion and Egress in Toxoplasma.” This grant shows up in my raw data as follows:
Grant ID GrantYear
Grant Title PI Name
1R01AI045057-01 1999 Genetics of Invasion and
Egress in Toxoplasma
Boothroyd, JC
Next, I search for life science publications by authors with the initials JC Boothroyd published
in the first year after grant review (1999 and 2000). This yields 10 publications, of which I am
excerpting the following five for illustrative purposes
The first publication clearly seems related to the subject of the grant. It has 2 overlapping
words in the title and 4 overlapping words in the abstract (the 4th word, “invasion,” shows up
later and is not reproduced here). My text matching algorithm will link this publication as related.
The second publication does not seem like it has much overlap with the subject of the grant. My
algorithm will not link this publication. The following three publications are more ambiguous.
All of them are about “toxoplasma,” which is a key word in the grant project title. The third
publication only has one overlapping word (“toxoplasma”) while the second has two overlapping
words (“toxoplasma” and “invasion”), and the final has one overlapping word(“toxoplasma”) and
a close second (“invasion” vs. “invade”).
If we examine the list of publications actually acknowledged by the grant (this is available for
funded applications only), this list includes 3 publications: the first, the third, and the fourth; the
fifth publication, which looks similar in terms of word overlap, is not acknowledged. In the interest
of being conservative, my main approach will match only the first publication.
50

Pub. ID Pub.Year
Pub. Title Pub. Abstract
000168366100029 2000 Ionophore-resistant mutants of
Toxoplasma gondii reveal host cell
permeabilization as an early event
in egress
Toxoplasma gondii is an obligate
intracellular pathogen within the
phylum Apicomplexa. Invasion
and egress by this protozoan
parasite....
000165702100018 2000 Trans-spliced L30 ribosomal
protein mRNA of Trypanosoma brucei
is not subject to autogenous
feedback control at the messenger
RNA level
The regulation of gene
expression in trypansomes
is poorly understood but it
is clear that much of this
regulation, particularly of
developmentally controlled genes,
is post-transcriptional....
000089249600007 2000 Lytic cycle of Toxoplasma gondii Toxoplasma gondii is an obligate
intracellular pathogen within
the phylum Apicomplexa. This
protozoan parasite is one of the
most widespread, with a broad host
range including many birds and
mammals and a geographic range
that is nearly worldwide....
0000167020000075 2000 Toxoplasma gondii homologue of
plasmodium apical membrane antigen
1 is involved in invasion of host
cells
Proteins with constitutive or
transient localization on the
surface of Apicomplexa parasites
are of particular interest for
their potential role in the
invasion of host cells....
000079956900015 2000 A Toxoplasma lectin-like
activity specific for sulfated
polysaccharides is involved in
host cell infection
Toxoplasma gondii is one of the
most widespread parasites of
humans and animals. The parasite
has a remarkable ability to invade
a broad range of cells....
A.2 Robustness to alternative processes
Given the ambiguity involved in the matching process, I explore the following forms of ro-
bustness to my primary text-matching process:
1. Appendix Table A: Varying criteria for uniqueness of names
2. Appendix Table B: Varying the threshold for word overlap used to associate publications with
grants
3. Appendix Tables C and D: Varying the time window for publications to be associated with
grants
51

4. Appendix Table E: Varying the prominence of the author’s contribution to a publication.
Appendix Table A explores the robustness of my results to different restrictions on the types
of applicant names that I include in my analysis. In my main specifications, I exclude all names
with more than two individuals in PubMed who share the same last name, first and middle initial
combination. The results in Appendix Table A show that my results do not change when I include
all these names or when I am more restrictive, allowing only for unique last name and first and
middle initial combinations.
Appendix Table B considers 8 different ways of changing threshold for how I choose whether
a grant is matched to a publication. In my main specifications, I require that at least 4 semantic
words be matched in either the publication title or abstract. As was discussed earlier, this may lead
to cases in which publications on the same topic are missed (e.g., the third and fourth publications
in the example table above.) Appendix Table B considers whether my results change when I
apply different standards, both more and less stringent. Columns 1 through 4 detail results where
text matching requires that X number of words overlap between both the grant project title and
publication titles and the grant project title and abstract, where X = 1, 2, 3, or 4. Because there
are on average only 4.87 semantic words (SD 1.10) in the grant project title, I examine up 4 words
maximum. Columns 5 through 8 repeat this exercise, with match defined as whether a grant
project title shares X words with the publication title or the publication abstract (the main result
is replicated in Column 5). The results show that, regardless of the exact threshold I use, my
resulting estimates are similar: I still find that intellectual proximity leads to both bias in grant
review, as well as a higher correlation between funding and outcomes for intellectually proximate
applications.
Appendix Tables C and D vary the time windows used to match grants to publications.
Appendix Table C addresses concerns that funding may directly influence the number of citations
produced by a grant by, for example, freeing up an investigator from future grant writing so that
he can concentrate on research. Instead of including articles published after the grant is reviewed,
Appendix Table C restricts my analysis to articles published one year before a grant is reviewed.
These publications are highly likely to be based off research that existed before the grant was
reviewed, but cannot have been influenced by the grant funds. Using this metric, I find nearly
identical measures of bias and information. Appendix Table D addresses the opposite concern,
that a one-year window after review may be insufficient to assess the quality of grant applications.
Instead, I use a five year window following review and find that my results are both qualitatively
52
and quantitatively similar.
Finally, the next set of results explores the validity of my quality measures more broadly.
The goal of my quality measures is to capture the quality of the research written into the grant
application at the time of grant review. One possible concern with examining all publications by an
author is that some of these publications may be ones for which the author made few substantive
intellectual contributions, and which might not reflect his or her research program. Life science
articles often have many authors and collaborators on a project may receive authorial credit for
minor contributions such as sharing equipment or making figures. To address this, Appendix Table
E restricts my match process to publications for which the grant applicant was the first, second, or
last author. In the life sciences, contributions can be inferred from authorship position with earlier
authors deserving more credit, and the last author being the primary investigator. This does not
materially affect my findings and, if anything, the magnitude of both my bias and information
measures is larger.
B Theoretical Model
This section presents a formal model of expertise and bias in decision-making, as well as a
statistical framework for identifying expertise and bias in my data. The purpose of the formal
model is to 1) define expertise and bias and 2) show how these unobserved parameters and signals
impact the equilibrium relationship between observable funding decisions, proximity to applicants,
and realized grant quality. In Appendix C, I present a statistical framework is to show how I can
consistently identify the presence and effect of expertise and bias in the data I gather.
A grant application has some true quality Q∗ and, if approved, the committee receives a
payoff of Q∗. If the application is rejected, the committee receives its outside option U , where
U > E(Q∗). Applications either work in the same area as the reviewer (“proximate,” given by
P = 1) or not (P = 0). This model makes the simplifying assumption that committees can observe
whether an application is related to a reviewer. I allow the application’s proximity to be unknown
to the committee and show that all the same qualitative features of this model continue to hold.
See the end of this section for a proof. Neither the committee nor the reviewer observes Q∗, but
the reviewer observes a signal QP about Q∗. I assume that a related reviewer has greater expertise,
meaning that Q1 gives a more precise signal than Q0.20
20For simplicity, I assume that the signals QP are real numbers with continuous unconditional distributions suchthat E(Q∗|QP ) is increasing in QP .
53

After observing the signal, the reviewer sends a message to the committee about the applica-
tion’s quality and the committee then decides whether to approve the grant. When determining
what message to send, a reviewer considers his payoffs: for an unrelated application, this is identical
to that of the committee, but for a related application, the reviewer now receives Q∗ + B if the
application is funded and U otherwise. The term B represents his bias. The timing is as follows:
1. An application with true quality Q∗ is assigned to a reviewer.
2. The application’s type (P = 1 or P = 0) is determined and is publicly observed.
3. The reviewer observes the signal QP .
4. The reviewer sends a costless and unverifiable messageM to the committee from some message
space M.
5. The committee, observing M , makes a decision D ∈ {0, 1} of whether to fund the grant.
6. True quality is revealed and the reviewer and committee both receive their payoffs.
Proposition 1 describes the perfect Bayesian equilibria of this game.21
Proposition 1 The equilibria of the game is summarized by the following two cases:
Case 1: P = 0. There exists a unique informative equilibrium in which
1. The reviewer reports a message Y if E(Q∗|Q0) > U and N otherwise.22
2. The committee funds the grant if and only if the message is Y .
Case 2: P = 1. There exists a level of bias B∗ > 0 such that for bias B ≤ B∗ there is a unique
informative equilibrium such that
1. The reviewer reports a message Y if E(Q∗|Q1) > U −B and N otherwise.
2. The committee funds the grant if and only if the message is Y .
When B > B∗, only uninformative equilibria exist and the grant is never funded.
Proof See the end of this Section, B.1, for proofs.
21There are always uninformative equilibria in which messages are meaningless and the grant is never funded. Thisproposition therefore focuses on informative equilibria, i.e. those in which the committee’s decision depends on thereviewer’s message. An informative equilibrium is unique if all other informative equilibria are payoff-equivalent forthe parties.
22I assume there are at least two elements in the message space M which, without loss, I call Y and N .
54

Proposition 1 says that when bias is sufficiently small, review committees are willing to take
the advice of the reviewer because they value her expertise, in spite of the her bias. The committee’s
decision rule in the informative equilibria of this model is given by
D = I(E(Q∗|Q0) > U)︸ ︷︷ ︸baseline for unrelated
+ [I(U > E(Q∗|Q1) > U −B)]︸ ︷︷ ︸bias for proximate (+)
P (3)
+ [I(E(Q∗|Q1) > U)− I(E(Q∗|Q0) > U)]︸ ︷︷ ︸additional information for proximate (+/-)
P.
The first term of Equation (3) indicates that committees listen to advice about unrelated
applications. The middle term represents the impact of bias on funding decisions. In particular,
lower quality applications (those with U > E(Q∗|Q1) > U − B) will be funded if the applicant
is related. The final term represents the impact of information. I(E(Q∗|Q1) > U) is the decision
that an unbiased reviewer would make, given the lower variance signal of the proximate reviewer.
I(E(Q∗|Q0) > U) is the decision she actually makes; the difference represents the change in funding
outcomes that is due only to better information. Bias decreases the expected quality of funded
applications while expertise increases it. The net effect of proximity on the quality of decisions is
thus ambiguous.
Equation (3) demonstrates why differences in funding likelihood among applicants with the
same quality need not be due to bias. In particular, the difference in the expected likelihood of
funding between related and unrelated applications of the same quality is given by
E[D|Q∗, P = 1]− E[D|Q∗, P = 0] = Pr(U > E(Q∗|Q1) > U −B)
+ Pr(E(Q∗|Q1) > U)− Pr(E(Q∗|Q0) > U).
This expression will be non will be nonzero even if reviewers are unbiased (B = 0). This is because
reviewers can more confidently attest to the quality of intellectually related applications, mean-
ing that committees update more following a favorable review. Distinguishing between bias and
information driven explanations is important because they have different implications for whether
proximity enhances the quality of peer review.
55
B.1 Proof of Proposition 1
A perfect Bayesian equilibrium for this game is characterized by a message strategy for the
reviewer, a set of beliefs about Q∗ by the committee for each message, and a decision strategy for
the committee. Having defined the equilibrium concept, I proceed with the proof of Proposition 1.
Case 1. Suppose that the reviewer reports her exact posterior and the committee to believes it. In
this case, the committee maximizes its utility by funding the proposal if and only if Q0 > U . The
reviewer has no incentive to deviate from this strategy because she is receiving her highest payoff
as well.
Suppose, now, that there were another informative equilibrium. Each message M ∈M induces
a probability of funding D(M). Let the messages be ordered such that D(M1) ≤ · · · ≤ D(MK)
where Mi are the set of messages Mi that induce the same probability of funding D(Mi). For
reviewers of type E(Q∗|Q0) > U , the reviewer strictly prefers that the grant be funded. She thus
finds it optimal to send the message MK that maximizes the probability that the grant is funded.
Call this set Y . For E(Q∗|Q∗ + ε0) < U the reviewer strictly prefer E(Q∗|Q0) = U . Because the
distribution of QP is assumed to be continuous on R and such that E(Q∗|QP ) is increasing in QP ,
this occurs with probability zero. Thus, with probability one, the space of possible messages is
equivalent to M = {Y,N}. For this equilibrium to be informative, it must be that D(N) < D(Y ).
Given this, the committee’s optimal reaction is to fund when M = Y and to reject otherwise.
If the we allow uninformative equilibria, D(M1) = · · · = D(MK) and any reviewer message
is permissible. It must be that D(Mi) = 0 for all Mi because the outside option U is assumed to
be greater than the committee’s prior on quality.
Case 2. Now consider the case of a reviewer evaluating a related application. As in Case 1, the set
of messages is equivalent, with probability one, to M = {Y,N}. In this case, however, reviewers of
type E(Q∗|Q1) > U −B send M = Y and reviewers of type E(Q∗|Q1) < U −B send M = N . The
only reviewer who sends any other message is one for which E(Q∗|Q1) = U −B.
Given this messaging strategy, a committee’s expectation ofQ∗ givenM = N is E(Q∗|E(Q∗|Q1) <
U − B). Since this is less than U , the grant goes unfunded. The committee’s expectation of
Q∗ given M = Y is E(Q∗|E(Q∗|Q1) < U − B). When this is larger than U , the commit-
tee listens to the reviewer’s recommendation and we can verify that D(Y ) > D(N). When
56

E(Q∗|E(Q∗|Q∗ + ε1) < U − B) < U , the grant is never funded: D(Y ) = D(N) = 0. In this
case, only babbling equilibria exist.
If the we allow uninformative equilibria, D(M1) = · · · = D(MK) and any reviewer message
is permissible. It must be that D(Mi) = 0 for all Mi because the outside option U is assumed to
be greater than the committee’s prior on quality.
Unobserved proximity: Next, I consider a modification of Proposition 1 where the committee
cannot observe whether the application is related to the reviewer.
Proposition A.2 Assume that p is the probability that an application is related to a reviewer.
Then, for every p, there exists a level of bias, B∗, such that for B < B∗ there is a unique informative
equilibrium:
The reviewer reports a message Y if his posterior, E(Q∗|Q1), is greater than U−B and N otherwise.
1. An unrelated reviewer reports a message Y if his posterior, E(Q∗|Q0), is greater than U and
N otherwise.
2. A related reviewer reports a message Y if his posterior, E(Q∗|Q1), is greater than U −B and
N otherwise.
3. The committee funds the grant if and only if the message is Y .
For B ≥ B∗, only uninformative equilibria exist and the grant is never funded.23
Proof In this case, the reviewer’s messaging strategy remains the same as in Proposition 1: be-
cause reviewers themselves know whether they are proximate, they form, with probability one,
strict preferences about whether an application should be funded. Proximate reviewers for which
E(Q∗|Q1) > U − B send M = Y and those for which E(Q∗|Q1) < U − B send M = N . Sim-
ilarly, unrelated reviewers of type E(Q∗|Q0) > U send M = Y and unrelated reviewers of type
E(Q∗|Q0) < U send M = N .
The committee, however, does not observe the proximity and, as such, forms the following
expectation of quality conditional on observing M = Y :
K [E(Q∗|E(Q∗|Q0) > U)] + (1−K) [E(Q∗|E(Q∗|Q1) > U −B)]
23Again, in all cases where an informative equilibrium exists, there also exist uninformative equilibria where thegrant is never funded.
57

The first term E(Q∗|E(Q∗|Q0) > U) is the committee’s expectation of quality if it knows that
the M = Y message is sent by an unrelated reviewer. Similarly, the second term E(Q∗|E(Q∗|Q1) >
U − B) is the committee’s expectation of quality if it knows that the message is sent by a related
reviewer. The term K is the probability that the committee believes a Y message comes from an
unrelated reviewer, that is, K = E(P = 0|M = Y ). By Bayes’ Rule, this is given by K = E(P =
0|M = Y ) = E(P=0,M=Y )E(M=Y ) . The overall probability of a Y message is thus given by
E(M = Y ) = (1− p)(E(Q∗|Q0) > U) + p(E(Q∗|Q1) > U −B)
Similarly, the probability that the message is Y and the reviewer is unrelated is given by
(1− p)(E(Q∗|Q0) > U). As such, we have
K =(1− p)(E(Q∗|Q0) > U)
(1− p)(E(Q∗|Q0) > U) + p(E(Q∗|Q1) > U −B).
and for
K [E(Q∗|E(Q∗|Q∗ + ε0) > U)] + (1−K) [E(Q∗|E(Q∗|Q∗ + ε1) > U −B)] > U
the committee funds the application. Again, we can verify that D(Y ) > D(N). For any fixed p,
the threshold B∗ can be defined to set this expression equality. There also exist uninformative
equilibria where all grants are rejected. This term is less than U , then the grant is never funded:
D(Y ) = D(N) = 0. In this case, only babbling equilibria exist.
58

C Statistical framework
The decision rule described by Equation (3) in the theoretical model can be thought of as a
data generating process for the funding decisions I observe. To make this more tractable, I make
the following simplifying assumptions: for P = 0, 1, the reviewer’s signal QP can be written as
QP = Q∗ + εP where εP ∼ U [−aP , aP ] and E(Q∗|QP ) can be approximated by λQP for some
constant λR. Given this, an application’s conditional likelihood of funding can be expressed as24
E[D|Q∗, P ] = Pr(λ0(Q∗ + ε0) > U) + Pr(U > λ1(Q
∗ + ε1) > U −B)P
+ [Pr(λ1(Q∗ + ε1) > U)− Pr(λ0(Q
∗ + ε0) > U)]P
=a0 − U/λ0 +Q∗
2a0+
B
2a1λ1P +
[a1 − U/λ1 +Q∗
2a1− a0 − U/λ0 +Q∗
2a0
]P
=1
2+
1
2a0︸︷︷︸Quality corr.
Q∗ +B
2a1λ1︸ ︷︷ ︸Bias term
P +
[1
2a1− 1
2a0
]︸ ︷︷ ︸
Add. corr. for proximate
PQ∗
− U
2a0λ0+
[1
2a0λ0− 1
2a1λ1
]PU. (4)
This expression shows how I separately identify the role of bias and expertise. In particular,
consider the regression analogue of Equation (4):
D = α0 + α1Q∗ + α2P + α3PQ
∗ + α4U + α5PU +Xβ + ε, (5)
where X includes other observable I can condition on.
Here, α2, the coefficient on proximity P , tests for bias: it is nonzero if and only if B 6= 0,
where B is the bias parameter from the model. Second, the coefficient on PQ∗ tests for expertise.
To see this, notice that α1 captures, for unrelated applicants, how responsive funding decisions are
to increases in quality. In the model, this is determined by the precision of the reviewer’s signal
of quality for unrelated applications. The coefficient on PQ∗, meanwhile, captures the additional
correlation between quality and funding for related applicants. A high coefficient on PQ means
that a committee is more sensitive to increases in the quality of related applicants than to increases
in the quality of unrelated applicants. In the model, this is determined by the difference in the
24The limited support of the error distribution means that if an application is extremely high (low) quality, thecommittee will choose to approve (reject) it regardless of what the reviewer says. As such, Equation (4) is valid forcandidates with quality such that Q∗ + εP cannot be greater than U or less than U for all possible εP .
59

precision of signals for related and unrelated applications.
The intuition for separately identifying bias and expertise is the following: if I find that related
applications are more (or less) likely to be funded regardless of their quality, then this is a level
effect of proximity that I attribute to bias in the NIH funding process. If I find that quality is
more predictive of funding among related rather than unrelated applicants, then I conclude that
study sections have better information about proposals from related applicants. I do not make any
assumptions about the presence, extent, or direction of any potential biases nor do I assume that
reviewers necessarily have better information about related applications. Rather, this statistical
framework is designed to estimate this.25
Finally, the terms U and PU control for funding selectivity; for high cutoffs U , the correlation
between funding and quality will be low even in the absence of bias or differential information
because the marginal unfunded application is already very high-quality. The RU term, meanwhile,
ensures that relationships are not credited for changing the correlation between funding and quality
simply by lowering the threshold at which grants are funded.
Equation (4) says that, as long as Q∗ is perfectly observed, exogenous variation in proximity
is not needed to identify the presence of bias. This is because exogenous variation in proximity is
necessarily only when aspects of an application’s quality are potentially omitted; if quality were
observed, one could directly control for any correlation between proximity and quality.
In practice, however, I do not observe an application’s true quality Q∗. Instead, I observe a
noisy signal Q = Q∗ + v. Thus, instead of estimating Equation (5), I estimate
D = a0 + a1Q+ a2R+ a3RQ+ a4U + a5RU +Xb+ e. (6)
Measurement error in quality can potentially pose problems for identification. Proposition 2 de-
scribes the conditions that must be met in order to consistently estimate bias from observed data.
Proposition 2 Given observed quality Q = Q∗ + v, the bias parameter α2 in Equation (5) is
consistently estimated by a2 in Equation (6) when the following conditions are met:
1. Cov(P,Q∗|U,PU,X) = 0 and Cov(P 2, Q∗|U,PU,X) = 0,
2. E(v|U,PU,X) = 0,
25These predictions hold when reviewers and committees are in an informative equilibrium. If the equilibrium werenot informative, then advice from related reviewers would not be taken; I would find no effect of bias and a lowercorrelation between funding and quality for related applications. My results are not consistent with a non-informativeequilibrium.
60

3. Cov(v, P |U,PU,X) = 0.
Proof : See Appendix C.1.
Condition 1 requires that my measure of proximity, P , be uncorrelated, conditional on ob-
servables, with true application quality. If this were not the case, any mismeasurement in true
quality Q∗ would bias estimates of α2 through the correlation between Q∗ and P . Thus, in my
study, exogenous variation in proximity is required only to deal with measurement error.
Condition 2 requires that measurement error be conditionally mean zero. This means that,
after controlling for observable traits of the application or applicant, my quality measure cannot
be systematically different from what committees themselves are trying to maximize. Otherwise, I
may mistakenly conclude that committees are biased when they are actually prioritizing something
I do not observe but which is not mean zero different from my quality measure.
Finally, Condition 3 requires that the extent of measurement error not depend, conditional on
observables, on whether an applicant is related to a reviewer. This may not be satisfied if related
applicants are more likely to be funded and funding itself affects my measure of quality.
C.1 Proof of Proposition 2
Measurement error in Q∗ can potentially affect the estimation of α2 in Equation (5). The
presence of U , PU , and X, however, will not affect consistency; for simplicity, I rewrite both the
regression suggested by the model and the actual estimating equation with these variables partialed
out. The remaining variables should then be thought of as conditional on U , PU , and X
D = α0 + α1Q∗ + α2P + α3PQ
∗ + ε
D = a0 + a1Q+ a2P + a3PQ+ e
= a0 +W + a2P + e,W = a1Q+ a3PQ
The coefficient a2 is given by:
a2 =Var(W )Cov(D,P )− Cov(W,P )Cov(D,W )
Var(W )Var(P )− Cov(W,P )2
61

Consider Cov(W,P ):
Cov(W,P ) = Cov(a1(Q∗ + v) + a3P (Q∗ + v), P )
= a1Cov(Q∗, P ) + a1Cov(v, P ) + a3Cov(PQ∗, P ) + a3Cov(Pv, P )
Under the assumption that P and Q∗ are conditionally independent, this yields:
Cov(W,P ) = a3Cov(PQ∗, P ) + a3Cov(Pv, P )
= a3[E(P 2Q∗)− E(PQ∗)E(P )
]+ a3
[E(P 2v)− E(Pv)E(P )
]= a3
[E(P 2)E(Q∗)− E(P )2E(Q∗)
]+ a3
[E(P 2)E(v)− E(P )2E(v)
]= a3
[E(P 2)0− E(P )20
]+ a3
[E(P 2)0− E(P )20
]= 0
With this simplification, the expression for the estimated coefficient on a2 becomes:
a2 =Var(W )Cov(D,P )− Cov(W,P )Cov(D,W )
Var(W )Var(P )− Cov(W,P )2
=Var(W )Cov(D,P )
Var(W )Var(P )
=Cov(D,P )
Var(P )
=Cov(α0 + α1Q
∗ + α2P + α3PQ∗ + ε, P )
Var(P )
=α2Var(P ) + α3Cov(PQ∗, P )
Var(P )
=α2Var(P ) + α3
[E(P 2)E(Q∗)− E(P )2E(Q∗)
]Var(P )
= α2
D Additional robustness checks
This section provides broader tests of my empirical specifications.
A key identifying assumption is that my measure of quality is not affected by whether individ-
uals are actually funded. Figure 6 provides my primary evidence that this is the case. Another test
of my assumption that citations are not directly affected by funding is to ask whether I find bias
in the review of inframarginal grants, that is grants that are well above or well below the funding
62

margin. All grants in either group have the same funding status so any bias estimate cannot be
attributed to differences in funding. Because I hold funding status constant, I can only assess the
impact that related permanent members have on an applicant’s score not on an applicant’s funding
status. Appendix Table F reports these results. Columns 1 and 2 reproduce my main estimates
from the scoring regression. In Columns 3–4 and 5–6, I report estimates of the effect of bias and
information in the sample of funded and unfunded grants, respectively. In both cases, I still find ev-
idence that bias exists. The magnitudes are somewhat smaller than in my main regression; because
these are subsamples, there is no reason to expect that the magnitude of the effect of relationships
should be the same for high- and low-quality grants as it is for the entire sample.
Another potential concern is that committees may defy instructions and evaluate grant ap-
plications not on the basis of the specific research in the proposal, but on the quality of projects
that reviewers suspect the grant funding may cross subsidize. In this case, by using text-matching
to restrict my main quality measure to be based on articles that are closely related to the grant
proposal topic, I am potentially missing other research that reviewers might be anticipating when
they evaluate a grant proposal. To test whether this is the case, I use grant acknowledgement data
recorded in the National Library of Medicine’s PubMed database to match funded grants to all the
articles that it produces, regardless of topic or date of publication. Because this process requires
that a grant application actually be funded, I am only able to examine the impact of proximity on
scores, rather than on funding likelihood or the likelihood of being scored. For the set of funded
grants, Appendix Table G reruns my core regressions using citations to publications that explicitly
acknowledge a grant as my measure of quality, and scores as my outcome measure. I find results
that are consistent with my primary findings, though of a slightly smaller magnitude.26
Finally, Appendix Tables H and I show that my results in Tables 6 and 8 are robust relaxing
linearity assumptions. Appendix Table H estimates Equation (1), but replacing the linear coeffi-
cients for the number of permanent reviewers and the total number of reviewers with a full set of
indicator variables for the composition of reviewers that an applicant is related to (e.g. separate
indicators for being related to (m permanent, n temporary) reviewers). Since there are at most 38
related permanent and 26 related temporary reviewers, we include 38x26=988 possible indicators.
26This analysis differs slightly from my main results using citations because general citations cannot be computedfor publications in PubMed. A limited set of citations can, however, be computed using publications in PubMedCentral (PMC). PMC contains a subset of life sciences publications made available for free. While this is not ascomprehensive a universe as that of Web of Science, it contains, for recent years, all publications supported by NIHdollars. Undercounting of publications would, further, not bias my result as long as it does not vary systematicallyby whether an applicant is related to a permanent or to a temporary member.
63

Because there are so many indicators, I report only coefficients related to being related to one re-
viewer (one permanent or one temporary) and being related to two reviewers (two permanent, one
of each, or two temporary). The first row reports the coefficient on the dummy for being related
1 permanent and 0 temporary and the coefficient on the dummy for 0 permanent and 1 tempo-
rary from a regression of being above the payline on all 988 proximity indicators, meeting fixed
effects, and full demographic controls. The omitted category is the indicator for being unrelated
to any reviewers, so that a significant coefficient means that that reviewer is treated differently
from unrelated applicants. I report the F-test for whether these two indicators are identical: e.g.
whether treatment differs based on the composition of reviewers an applicant is related to, not the
total number. Similarly, the first row of the section on being related to two reviewers reports the
coefficients on 2 permanant and 0 temporary, 1 permanent and 1 temporary, and 0 permanent and
2 temporary from the same regression that the row 1 coefficients are estimated from. This table
shows that, in the majority of cases, applicants related to reviewers are more likely to be funded
that those who are not; and, conditional on the number of related reviewers, applicants related to
more permanent reviewers receive higher scores and are more likely to be funded.
Appendix Table I adds nonlinearity to Equation (2) in order to show that my results are
robust to the assumption in my statistical framework (see Appendix C) that QR = Q∗ + εR for εR
uniform and E(Q∗|QR) ≈ λRQR. Without these assumptions, the association between proximity
and quality would, in general, be nonlinear. To show that this does not make a material difference
for my results, I allow for the effects of quality and proximity to vary flexibly by including controls
for cubics in Q, as well as cubics of Q interacted with whether an applicant is related to a permanent
member. I find similar results, both qualitatively and quantitatively.
64
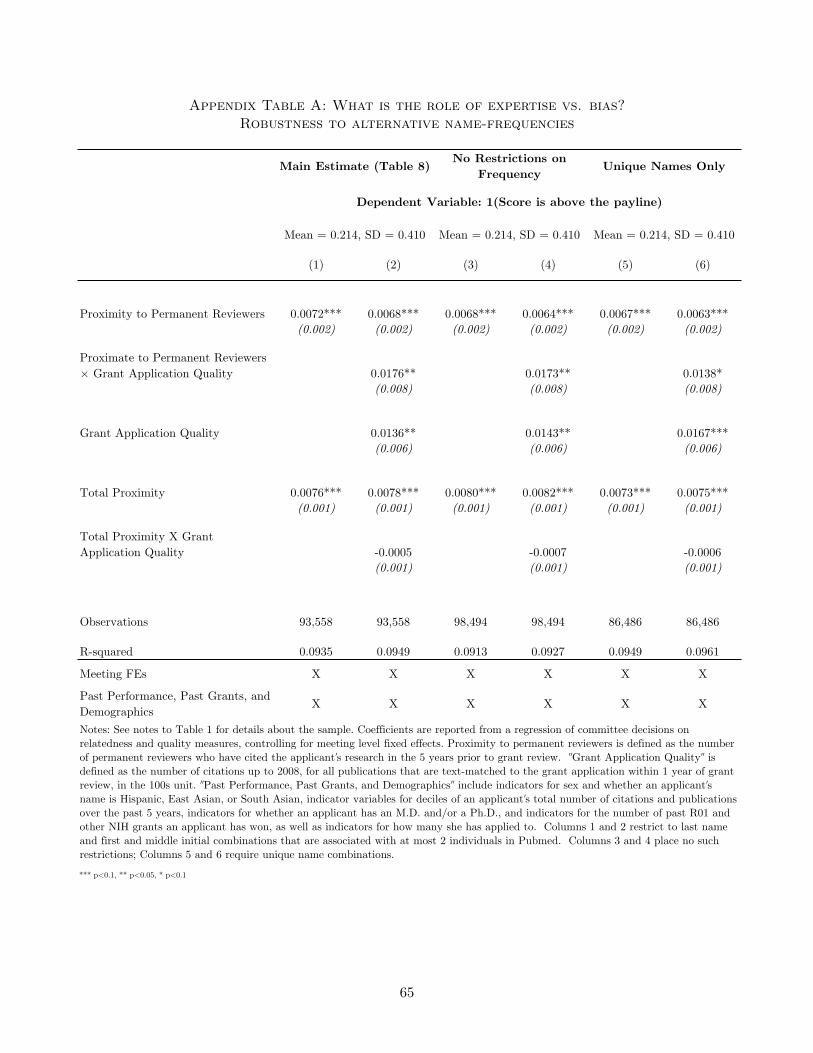
Appendix Table A: What is the role of expertise vs. bias?Robustness to alternative name-frequencies
(1) (2) (3) (4) (5) (6)
Proximity to Permanent Reviewers 0.0072*** 0.0068*** 0.0068*** 0.0064*** 0.0067*** 0.0063***(0.002) (0.002) (0.002) (0.002) (0.002) (0.002)
Proximate to Permanent Reviewers × Grant Application Quality 0.0176** 0.0173** 0.0138*
(0.008) (0.008) (0.008)
Grant Application Quality 0.0136** 0.0143** 0.0167***(0.006) (0.006) (0.006)
Total Proximity 0.0076*** 0.0078*** 0.0080*** 0.0082*** 0.0073*** 0.0075***(0.001) (0.001) (0.001) (0.001) (0.001) (0.001)
Total Proximity X Grant Application Quality -0.0005 -0.0007 -0.0006
(0.001) (0.001) (0.001)
Observations 93,558 93,558 98,494 98,494 86,486 86,486
R-squared 0.0935 0.0949 0.0913 0.0927 0.0949 0.0961
Meeting FEs X X X X X X
Past Performance, Past Grants, and Demographics
X X X X X X
*** p<0.1, ** p<0.05, * p<0.1
Notes: See notes to Table 1 for details about the sample. Coefficients are reported from a regression of committee decisions on relatedness and quality measures, controlling for meeting level fixed effects. Proximity to permanent reviewers is defined as the number of permanent reviewers who have cited the applicant's research in the 5 years prior to grant review. ''Grant Application Quality" is defined as the number of citations up to 2008, for all publications that are text-matched to the grant application within 1 year of grant review, in the 100s unit. "Past Performance, Past Grants, and Demographics" include indicators for sex and whether an applicant's name is Hispanic, East Asian, or South Asian, indicator variables for deciles of an applicant's total number of citations and publications over the past 5 years, indicators for whether an applicant has an M.D. and/or a Ph.D., and indicators for the number of past R01 and other NIH grants an applicant has won, as well as indicators for how many she has applied to. Columns 1 and 2 restrict to last name and first and middle initial combinations that are associated with at most 2 individuals in Pubmed. Columns 3 and 4 place no such restrictions; Columns 5 and 6 require unique name combinations.
Dependent Variable: 1(Score is above the payline)
What is the contribution of expertise vs. bias? Name Frequencies
Main Estimate (Table 8)No Restrictions on
FrequencyUnique Names Only
Mean = 0.214, SD = 0.410 Mean = 0.214, SD = 0.410 Mean = 0.214, SD = 0.410
65

Appendix Table B: What is the role of expertise vs. bias?Robustness to alternative text-matching word thresholds
4 Words 3 Words 2 Words 1 Word 4 Words 3 Words 2 Words 1 Word
(1) (2) (3) (4) (5) (6) (7) (8)
0.0073*** 0.0072*** 0.0066*** 0.0055** 0.0068*** 0.0064*** 0.0055*** 0.0050**(0.002) (0.002) (0.002) (0.002) (0.002) (0.002) (0.002) (0.002)
0.0230 0.0208** 0.0139*** 0.0100*** 0.0176** 0.0103*** 0.0090*** 0.0058***(0.026) (0.010) (0.005) (0.002) (0.008) (0.004) (0.002) (0.001)
0.0152 0.0105 0.0149*** 0.0102*** 0.0136** 0.0143*** 0.0111*** 0.0086***(0.019) (0.008) (0.004) (0.002) (0.006) (0.003) (0.003) (0.002)
0.0077*** 0.0079*** 0.0082*** 0.0085*** 0.0078*** 0.0081*** 0.0083*** 0.0088***(0.001) (0.001) (0.001) (0.001) (0.001) (0.001) (0.001) (0.001)
-0.0015 -0.0029** -0.0015** -0.0007** -0.0005 -0.0009 -0.0006 -0.0005**(0.004) (0.001) (0.001) (0.000) (0.001) (0.001) (0.000) (0.000)
Observations 93,558 93,558 93,558 93,558 93,558 93,558 93,558 93,558
R-squared 0.0940 0.0941 0.0953 0.0967 0.0949 0.0959 0.0974 0.0976
Meeting FEs X X X X X X X X
Past Performance, Past Grants, and Demographics
X X X X X X X X
*** p<0.1, ** p<0.05, * p<0.1
Notes: See notes to Table 1 for details about the sample. Coefficients are reported from a regression of committee decisions on relatedness and quality measures, controlling for meeting level fixed effects. Proximity to permanent reviewers is defined as the number of permanent reviewers who have cited the applicant's research in the 5 years prior to grant review. ''Grant Application Quality" is defined as the number of citations up to 2008, for all publications that are text-matched to the grant application within 1 year of grant review, in the 100s unit. "Past Performance, Past Grants, and Demographics" include indicators for sex and whether an applicant's name is Hispanic, East Asian, or South Asian, indicator variables for deciles of an applicant's total number of citations and publications over the past 5 years, indicators for whether an applicant has an M.D. and/or a Ph.D., and indicators for the number of past R01 and other NIH grants an applicant has won, as well as indicators for how many she has applied to.
Dependent Variable: 1(Score is above the payline) Mean = 0.214, SD = 0.410
What is the contribution of expertise vs. bias? Text-Matching Variations
> X Overlapping Words in Title AND Abstract > X Overlapping Words in Title OR Abstract
Proximate to Permanent Reviewers × Grant Application Quality
Proximity to Permanent Reviewers
Grant Application Quality
Total Proximity
Total Proximity X Grant Application Quality
66

Appendix Table C: What is the role of expertise vs. bias?Grant quality measured from articles published 1 year before grant review
(1) (2) (3) (4) (5) (6)
Proximity to Permanent Reviewers 0.0072*** 0.0069*** 0.2736*** 0.2560*** 0.0047** 0.0044**
(0.002) (0.002) (0.094) (0.094) (0.002) (0.002)
0.0203* 0.4167 0.0172(0.012) (0.486) (0.014)
0.0198** 0.9258** 0.0331***(0.009) (0.375) (0.009)
Total Proximity 0.0076*** 0.0078*** 0.2512*** 0.2584*** 0.0160*** 0.0164***(0.001) (0.001) (0.061) (0.061) (0.001) (0.001)
-0.0002 -0.0115 -0.0036*(0.002) (0.060) (0.002)
Observations 93,558 93,558 57,613 57,613 93,558 93,558
R-squared 0.0935 0.0949 0.1426 0.1433 0.1312 0.1319
Meeting FEs X X X X X X
Past Performance, Past Grants, and Demographics
X X X X X X
Appendix Table B: What is the contribution of expertise vs. bias? Grant quality measured from articles published 1 year before grant review
1(Score is above the payline)
Score
Mean = 0.214, SD = 0.410 Mean = 71.18, SD = 18.75
Proximate to Permanent Reviewers × Grant Application Quality (based on articles 1 year before review)
Grant Application Quality (based on articles 1 year before review)
Total Proximity X Grant Application Quality (based on articles 1 year before review)
Mean = .640, SD = .480
1(Scored at all)
Notes: See notes to Table 1 for details about the sample. Coefficients are reported from a regression of committee decisions (above payline, score, or scored at all) on relatedness and quality measures, controlling for meeting level fixed effects. Proximity to permanent reviewers is defined as the number of permanent reviewers who have cited the applicant's research in the 5 years prior to grant review. ''Grant Application Quality" is defined as the number of citations up to 2008, for all publications that are text-matched to the grant application the 1 year before grant review, in the 100s unit. "Past Performance, Past Grants, and Demographics" include indicators for sex and whether an applicant's name is Hispanic, East Asian, or South Asian, indicator variables for deciles of an applicant's total number of citations and publications over the past 5 years, indicators for whether an applicant has an M.D. and/or a Ph.D., and indicators for the number of past R01 and other NIH grants an applicant has won, as well as indicators for how many she has applied to.
67

Appendix Table D: What is the role of expertise vs. bias?Grant quality measured from articles published 0-5 years after grant review
(1) (2) (3) (4) (5) (6)
Proximity to Permanent Reviewers 0.0072*** 0.0066*** 0.2736*** 0.2567*** 0.0047** 0.0043**(0.002) (0.002) (0.094) (0.094) (0.002) (0.002)
0.0107*** 0.1551 0.0078*(0.004) (0.158) (0.004)
0.0121*** 0.4525*** 0.0217***(0.003) (0.125) (0.004)
Total Proximity 0.0076*** 0.0079*** 0.2512*** 0.2567*** 0.0160*** 0.0165***(0.001) (0.001) (0.061) (0.061) (0.001) (0.001)
-0.0001 0.0018 -0.0018***(0.001) (0.021) (0.000)
Observations 93,558 93,558 57,613 57,613 93,558 93,558
R-squared 0.0935 0.0958 0.1426 0.1436 0.1312 0.1328
Meeting FEs X X X X X X
Past Performance, Past Grants, and Demographics
X X X X X X
*** p<0.1, ** p<0.05, * p<0.1
Mean = .640, SD = .480
Proximate to Permanent Reviewers × Grant Application Quality (based on articles within 5 years of review)
Grant Application Quality (based on articles within 5 years of review)
Total Proximity X Grant Application Quality (based on articles within 5 years of review)
Notes: See notes to Table 1 for details about the sample. Coefficients are reported from a regression of committee decisions (above payline, score, or scored at all) on relatedness and quality measures, controlling for meeting level fixed effects. Proximity to permanent reviewers is defined as the number of permanent reviewers who have cited the applicant's research in the 5 years prior to grant review. ''Grant Application Quality" is defined as the number of citations up to 2008, for all publications that are text-matched to the grant application within 5 years of grant review, in the 100s unit. "Past Performance, Past Grants, and Demographics" include indicators for sex and whether an applicant's name is Hispanic, East Asian, or South Asian, indicator variables for deciles of an applicant's total number of citations and publications over the past 5 years, indicators for whether an applicant has an M.D. and/or a Ph.D., and indicators for the number of past R01 and other NIH grants an applicant has won, as well as indicators for how many she has applied to.
Appendix Table C: What is the contribution of expertise vs. bias?Grant quality measured from articles published 0-5 years after grant review
1(Score is above the payline)
Score 1(Scored at all)
Mean = 0.214, SD = 0.410 Mean = 71.18, SD = 18.75
68

Appendix Table E: What is the role of expertise vs. bias?Grant quality measured from first, second, and last authorship position articles
(1) (2) (3) (4) (5) (6)
Proximity to Permanent Reviewers 0.0104*** 0.1571*** 0.3403** 3.6126*** 0.0071*** 0.0149(0.003) (0.018) (0.133) (0.774) (0.003) (0.016)
0.0212*** 0.4142 0.0175**(0.008) (0.337) (0.007)
0.0196*** 0.6012*** 0.0344***(0.005) (0.220) (0.007)
Total Proximity 0.0139*** 0.0153*** 0.4807*** 0.5167*** 0.0253*** 0.0263***(0.002) (0.002) (0.093) (0.094) (0.002) (0.002)
-0.0037* -0.0549 -0.0076***(0.002) (0.081) (0.002)
Observations 93,558 93,558 57,613 57,613 93,558 93,558
R-squared 0.0987 0.0966 0.1478 0.1488 0.1360 0.1375
Meeting FEs X X X X X X
Past Performance, Past Grants, and Demographics
X X X X X X
*** p<0.1, ** p<0.05, * p<0.1
Notes: See notes to Table 1 for details about the sample. Coefficients are reported from a regression of committee decisions (above payline, score, or scored at all) on relatedness and quality measures, controlling for meeting level fixed effects. Proximity to permanent reviewers is defined as the number of permanent reviewers who have cited the applicant's research in the 5 years prior to grant review. ''Grant Application Quality" is defined as the number of citations up to 2008, for all publications that are text-matched to the grant application within 1 year of grant review, in the 100s unit, and for which the PI is the first, second, or last author. "Past Performance, Past Grants, and Demographics" include indicators for sex and whether an applicant's name is Hispanic, East Asian, or South Asian, indicator variables for deciles of an applicant's total number of citations and publications over the past 5 years, indicators for whether an applicant has an M.D. and/or a Ph.D., and indicators for the number of past R01 and other NIH grants an applicant has won, as well as indicators for how many she has applied to.
Proximate to Permanent Reviewers × Grant Application Quality (1st, 2nd, Last Positions)
Total Proximity X Grant Application Quality (1st, 2nd, Last Positions)
Grant Application Quality (1st, 2nd, Last Positions)
What is the contribution of expertise vs. bias? Quality based on primary authored papers only (1st, 2nd, and last)
1(Score is above the payline)
Score 1(Scored at all)
Mean = 0.214, SD = 0.410 Mean = 71.18, SD = 18.75 Mean = 0.640, SD = 0.480
69

Appendix Table F: What is the role of expertise vs. bias?Inframarginal grant applications
(1) (2) (3) (4) (5) (6)
Proximity to Permanent Reviewers 0.2736*** 0.2590*** 0.1522** 0.1421* 0.1776** 0.1719*
(0.094) (0.095) (0.074) (0.074) (0.090) (0.090)
Proximate to Permanent Reviewers × Grant Application 0.2739 0.3663 0.0879
(0.325) (0.247) (0.376)
Grant Application Quality 0.5568** -0.0398 0.1459(0.261) (0.187) (0.284)
Total Proximity 0.2512*** 0.2565*** 0.0230 0.0313 0.1518*** 0.1475**(0.061) (0.061) (0.046) (0.046) (0.058) (0.058)
Total Proximity X Grant Application Quality -0.0043 -0.0358 0.0123
(0.049) (0.028) (0.060)
Observations 57,613 57,613 24,395 24,395 33,218 33,218
R-squared 0.1426 0.1431 0.1743 0.1745 0.1875 0.1876
Meeting FEs X X X X X X
Past Performance, Past Grants, and Demographics
X X X X X X
Appendix Table E: What is the contribution of expertise vs. bias? Inframarginal grant applications
Notes: See notes to Table 1 for details about the sample. Coefficients are reported from a regression of committee score on relatedness and quality measures, controlling for meeting level fixed effects. Proximity to permanent reviewers is defined as the number of permanent reviewers who have cited the applicant's research in the 5 years prior to grant review. ''Grant Application Quality" is defined as the number of citations up to 2008, for all publications that are text-matched to the grant application within 1 year of grant review, in the 100s unit. "Past Performance, Past Grants, and Demographics" include indicators for sex and whether an applicant's name is Hispanic, East Asian, or South Asian, indicator variables for deciles of an applicant's total number of citations and publications over the past 5 years, indicators for whether an applicant has an M.D. and/or a Ph.D., and indicators for the number of past R01 and other NIH grants an applicant has won, as well as indicators for how many she has applied to. Columns 1 and 2 reproduce Columns 3 and 4 from Table 8. Columns 3 and 4 restricted to fundd applications only. Columns 5 and 6 restrict to unfunded applications. All regressions exclude applications that are not scored.
All Applications Funded Applications Unfunded Applications
Score: Mean = 71.18, SD = 18.75
70
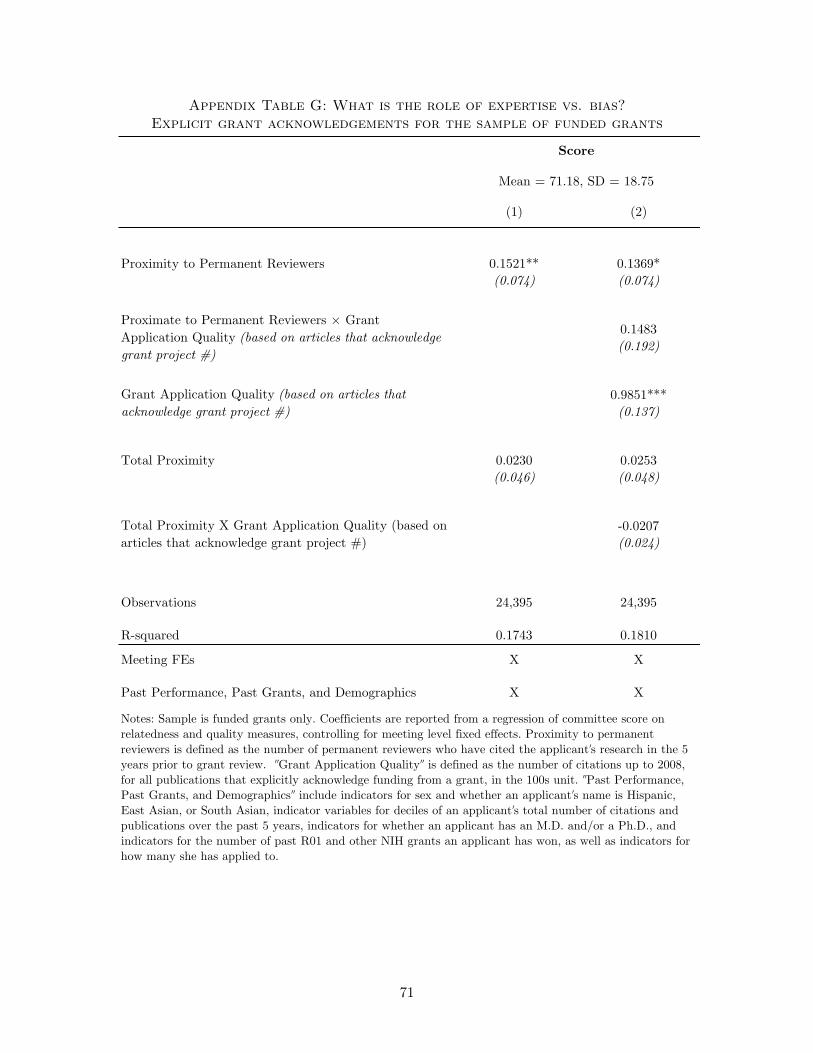
Appendix Table G: What is the role of expertise vs. bias?Explicit grant acknowledgements for the sample of funded grants
(1) (2)
Proximity to Permanent Reviewers 0.1521** 0.1369*(0.074) (0.074)
0.1483(0.192)
0.9851***(0.137)
Total Proximity 0.0230 0.0253(0.046) (0.048)
-0.0207(0.024)
Observations 24,395 24,395
R-squared 0.1743 0.1810
Meeting FEs X X
Past Performance, Past Grants, and Demographics X X
Score
Notes: Sample is funded grants only. Coefficients are reported from a regression of committee score on relatedness and quality measures, controlling for meeting level fixed effects. Proximity to permanent reviewers is defined as the number of permanent reviewers who have cited the applicant's research in the 5 years prior to grant review. ''Grant Application Quality" is defined as the number of citations up to 2008, for all publications that explicitly acknowledge funding from a grant, in the 100s unit. "Past Performance, Past Grants, and Demographics" include indicators for sex and whether an applicant's name is Hispanic, East Asian, or South Asian, indicator variables for deciles of an applicant's total number of citations and publications over the past 5 years, indicators for whether an applicant has an M.D. and/or a Ph.D., and indicators for the number of past R01 and other NIH grants an applicant has won, as well as indicators for how many she has applied to.
Appendix Table D: What is the contribution of bias and information? Explicit grant acknowledgements for the sample of funded grants
Proximate to Permanent Reviewers × Grant Application Quality (based on articles that acknowledge grant project #)
Grant Application Quality (based on articles that acknowledge grant project #)
Total Proximity X Grant Application Quality (based on articles that acknowledge grant project #)
Mean = 71.18, SD = 18.75
71
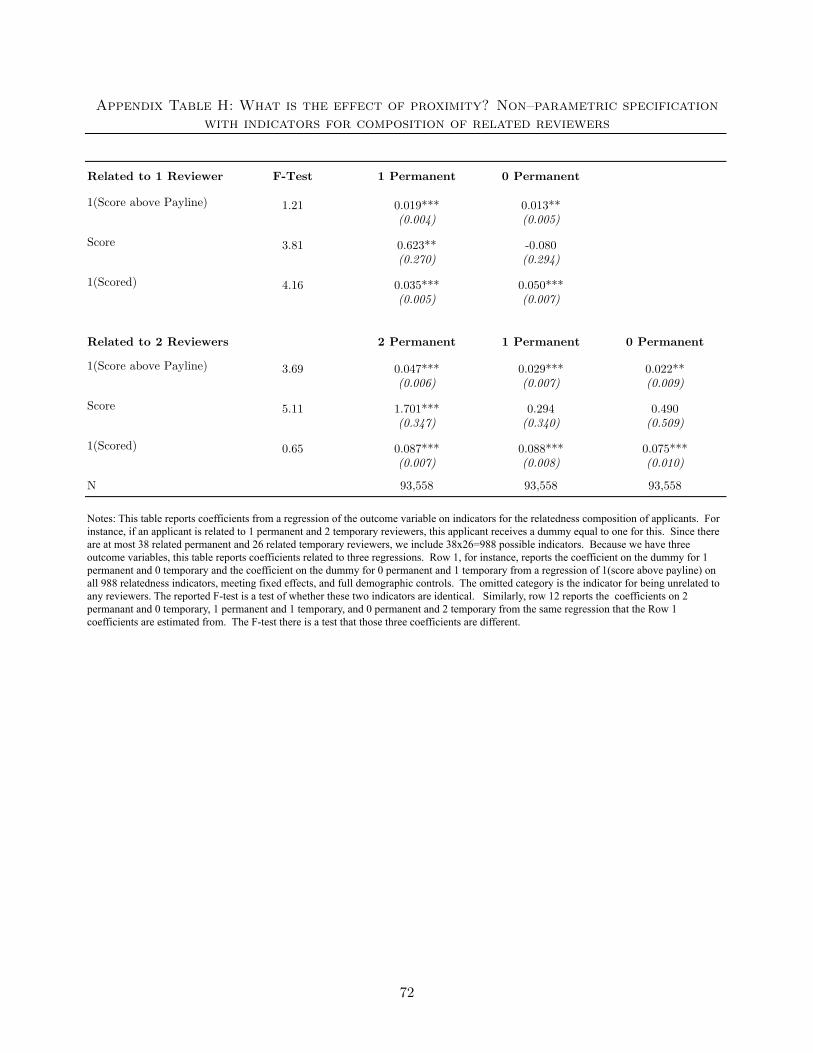
Appendix Table H: What is the effect of proximity? Non–parametric specificationwith indicators for composition of related reviewers
Related to 1 Reviewer F-Test 1 Permanent 0 Permanent
1(Score above Payline) 1.21 0.019*** 0.013**(0.004) (0.005)
Score 3.81 0.623** -0.080(0.270) (0.294)
1(Scored) 4.16 0.035*** 0.050***(0.005) (0.007)
Related to 2 Reviewers 2 Permanent 1 Permanent 0 Permanent
1(Score above Payline) 3.69 0.047*** 0.029*** 0.022**(0.006) (0.007) (0.009)
Score 5.11 1.701*** 0.294 0.490(0.347) (0.340) (0.509)
1(Scored) 0.65 0.087*** 0.088*** 0.075***(0.007) (0.008) (0.010)
N 93,558 93,558 93,558
Appendix Table F: What is the effect of relatedness? Non-parametric specification using indicators for composition of related reviewers
Notes: This table reports coefficients from a regression of the outcome variable on indicators for the relatedness composition of applicants. For instance, if an applicant is related to 1 permanent and 2 temporary reviewers, this applicant receives a dummy equal to one for this. Since there are at most 38 related permanent and 26 related temporary reviewers, we include 38x26=988 possible indicators. Because we have three outcome variables, this table reports coefficients related to three regressions. Row 1, for instance, reports the coefficient on the dummy for 1 permanent and 0 temporary and the coefficient on the dummy for 0 permanent and 1 temporary from a regression of 1(score above payline) on all 988 relatedness indicators, meeting fixed effects, and full demographic controls. The omitted category is the indicator for being unrelated to any reviewers. The reported F-test is a test of whether these two indicators are identical. Similarly, row 12 reports the coefficients on 2 permanant and 0 temporary, 1 permanent and 1 temporary, and 0 permanent and 2 temporary from the same regression that the Row 1 coefficients are estimated from. The F-test there is a test that those three coefficients are different.
72

Appendix Table I: What is the role of expertise vs. bias?Nonlinear controls for quality and proximity
1(Score is above the payline)
Score 1(Scored at all)
(1) (2) (3)
Proximity to Permanent Reviewers 0.0064*** 0.2413** 0.0041*(0.002) (0.095) (0.002)
Proximate to Permanent Reviewers × Grant Application Quality 0.0462*** 1.6683** 0.0202
(0.013) (0.783) (0.014)
Proximate to Permanent Reviewers ×
Grant Application Quality2 (100s) -0.0063* -0.3394 0.0009(0.003) (0.289) (0.003)
Proximate to Permanent Reviewers ×
Grant Application Quality3 (100s) 0.0002 0.0135 -0.0000(0.000) (0.022) (0.000)
Grant Application Quality (100s) 0.0089 0.4378 0.0678***(0.010) (0.677) (0.011)
Grant Application Quality2 (100s) 0.0027 0.0565 -0.0081***(0.003) (0.273) (0.002)
Grant Application Quality3 (100s) -0.0001 -0.0040 0.0002**(0.000) (0.021) (0.000)
Total Proximity 0.0078*** 0.2541*** 0.0164***(0.001) (0.061) (0.001)
Total Proximity X Grant Application Qualitys (100s) 0.0000 0.0145 -0.0026***
(0.001) (0.047) (0.001)
Observations 93,558 57,613 93,558
R-squared 0.0953 0.1434 0.1330
Meeting FEs X X X
Past Performance, Past Grants, and Demographics
X X X
Appendix Table G: What is the contribution of bias and information? Nonlinear controls for quality and relatedness
Notes: See notes to Table 1 for details about the sample. Coefficients are reported from a regression of committee decisions (above payline, score, or scored at all) on relatedness and quality measures, controlling for meeting level fixed effects. Proximity to permanent reviewers is defined as the number of permanent reviewers who have cited the applicant's research in the 5 years prior to grant review. ''Grant Application Quality" is defined as the number of citations up to 2008, for all publications that are text-matched to the grant application within 1 year of grant review, in the 100s unit. "Past Performance, Past Grants, and Demographics" include indicators for sex and whether an applicant's name is Hispanic, East Asian, or South Asian, indicator variables for deciles of an applicant's total number of citations and publications over the past 5 years, indicators for whether an applicant has an M.D. and/or a Ph.D., and indicators for the number of past R01 and other NIH grants an applicant has won, as well as indicators for how many she has applied to.
73