explaining fdi performance of maghreb countries...further integration with regional, european and...
TRANSCRIPT

Explaining FDI Performance of Maghreb
Countries
The cases of Morocco, Tunisia and Algeria –
Trade patterns and investment policies
Copenhagen Business School Phillip Siegle
MSc in Business Administration and Modern Languages CPR No.:
Line: Business and Development Studies
CEMS Master in International Management Spring Semester 2008
Supervisor: Michael W. Hansen Taps: 139,233

2
Table of Content
1. Introduction……………………………………………………………………………………………...61.1 Purpose of the paper…………………………...……………………………………………71.2 Structure...……………………………………………………………………………………..8
2. Methodology…………………………………………………………………………………………….82.1 Research Strategy …………………………………………………………………………...82.2 Data Collection………………………………………………………………………………..92.3 Reliability and Validity……………………………………………………………………..102.4 Delimitations…………………………………………………………………………………122.5 Definitions and Explanations…………………………………………………..…………14
3. Underlying Theoretical Discussion………………………………………………………………..153.1 The Theory of FDI and its application…………………………………………………..153.2 Theoretical Explanations for FDI…………………………………………………………15
3.2.1 Transaction Cost Theory……………………………………………….153.2.2 Resource Based Theory………………………………………………..183.2.3 Relational View…………………………………………………………..193.2.4 Network Perspective……………………………………………………203.2.5 Summary………………………………………………………………….20
4. Construction a Framework………………………………………………………………………….214.1 Theoretical Framework………...…………………………………………………………..24
5. Analysis…………………………………………………………………………………………………275.1 Case Presentation…………………………………………………………………………..28
5.1.1 Algeria’s policies…………………………………………………………………295.1.2 Morocco’s case…………………………………………………………………..315.1.3 Tunisia’s situation……………………………………………………………….33
5.2 Discussing the Net Outward Position (NOP) ………………………………………….366. EU and EMFTA Initiatives……………………………………………………………………………41
6.1. Shifting from EMP to ENP………………………………………………………………...426.1.1 Euro-Mediterranean Partnership………………………………………………426.1.2 European Neighbourhood Policy……………………………………………..436.1.3 The ENP Applied…………………………………………………………………44
6.2 Trade and Integration………………………………………………………………………456.2.1 Association Agreements……………………………………………………….466.2.2 The Euro-Mediterranean Free Trade Agreement…………………………..486.2.3 The Role of (Free-) Trade………………………………………………………49
6.2.3.1 Exports………………………………………………………………….506.2.3.2 Imports………………………………………………………………….52
6.3. Policy Reform and Regulation through Tariffs……………………………………….537. Conclusion……………………………………………………………………………………………..55References………………………………………………………………………………………………...57Annex……………………………………………………………………………………………………... 61
List of Tables
Table 1: Summary of Theoretical Perspectives.........................................................................21Table 2: The Five Stages of the IDP Classification...................................................................23Table 3: EU FDI Stocks in MPCs.................................................................................................40Table 4: FDI Stock of MPCs in EU and USA...............................................................................41Table 5: Imports of selected MPC...............................................................................................51Table 6: Exports of selected MPC...............................................................................................52

3
List of Figures
Figure 1: Thesis Structure.............................................................................................................5Figure 2: Theoretical Considerations.........................................................................................15Figure 3: Net Outward Positions of Countries in Different Development Stages..................24Figure 4: Theoretical Foundation For Framework.....................................................................25Figure 5: Framework for Analysis ..............................................................................................27Figure 6: FDI Flows Algeria.........................................................................................................30Figure 7: FDI Stock Algeria..........................................................................................................30Figure 8: Inward FDI Flows as a percentage of Gross Fixed Capital Formation....................30Figure 9: FDI Flows Morocco......................................................................................................32Figure 10: FDI Stock Morocco.....................................................................................................32Figure 11: Inward FDI Flows as a percentage of Gross Fixed Capital Formation 2...............33Figure 12: FDI Flows Tunisia.......................................................................................................35Figure 13: FDI Stock Tunisia.......................................................................................................35Figure 14: Inward FDI Flows as a percentage of Gross Fixed Capital Formation 3...............36Figure 15: NOP of Maghreb Countries compared to other countries......................................38Figure 16: NOP of Maghreb Countries in relation to Poland, Mexico and India.....................39Figure 17: NOP of Maghreb Countries.......................................................................................39

4
List of Abbreviations and Acronyms
AA Association Agreements
CSP Country Strategy Papers
EU European Union
EMFTA Euro-Mediterranean Free-Trade Area
EMP Euro-Mediterranean Partnership
ENP European Neighbourhood Policy
ENPI European Neighbourhood and Partnership Instrument
FDI Foreign Direct Investments
GFCF Gross fixed capital formation
IDP Investment Development Path
MENA Middle Eastern and North African Countries
MNC Multi National Company
MFN Most-Favoured Nation
MPC Mediterranean Partner Countries
NP Network Perspective
OLI OLI Framework – Ownership, Location and Internalisation
RBT Resource Based Theory
RTA Regional Trade Agreement
TCT Transaction Cost Theory
TNC Trans National Corporation
UN United Nations
UNCTAD United Nations Conference on Trade and Development
WB World Bank
WTO World Trade Organisation

5
Figure 1: Thesis Structure
Introduction Research Question
MethodologyResearch Design
Data CollectionReliability and Validity
Analysis of Data
Case of TunisiaCase of Morocco
Analysis
Conclusion
Theory Discussion
OLI&
Investment Development Path
Case of Algeria

6
1. Introduction
Even though world Foreign Direct Investment (FDI) flows have been growing rapidly, FDI is still
decisive - especially for developing economies. As indicated by UNCTAD (2004) international
production is now accomplished by over 900,000 foreign affiliates of at least 61,000 Transnational
Corporations (TNCs) worldwide and more and more players are integrating in the worlds
economies. These foreign affiliates make up about one-third of the world exports and one-tenth of
world GDP. Recently, outward FDI from developing countries is becoming significant as FDI
outflows from developing countries have grown faster than those from developed ones. Outward
FDI now accounts to more than 10% of world total stock. Moreover, south to south (i.e.
developing countries to developing countries) FDI flows have grown faster than those from south
to north (i.e. developing countries to developed countries)1.
But compared to other developing regions, Foreign Direct Investments (FDI) is lacking behind in
the Maghreb region. Investment flows reach other regions but almost neglect Maghreb. Since the
Barcelona Process Declaration in 1995 and the proclaimed advancement to reach a Euro-
Mediterranean Free Trade Area (EMFTA) in 2010, progress has been slow and not as
anticipated. In other words, the economic performance of Maghreb countries falls short in terms of
amount and diversification of trade and FDI In- and Outflows. This thesis is a contribution to this
on-going debate in the Maghreb among key decision makers and business representatives. An
important element of such debate is a clear understanding of the implications and benefits of
further integration with regional, European and global markets and resulting FDI inflows and
outflows.
The Middle Eastern and North African (MENA) region in general, but also Maghreb countries as
such (namely Algeria, Morocco and Tunisia) , includes various countries with different economic
structures and resources, however these countries have some general common characteristics
such as heavy reliance on gas and oil, a weak economic base, high population growth and
unemployment rates. Also a dominance of the state in the economic sector, low level of
integration with the world, underdeveloped financial and capital markets, underdeveloped
institutions, and low rates of returns on human and physical capital are frequently mentioned
(Hassan and Bashir, 2002; Makdisi, Fattah and Liman, 2002). Most importantly, MENA countries
share similar features as long as FDI related figures are concerned. Therefore, the Investment
Development Path (IDP) framework brought in by Dunning (1981) can be a useful tool for
investigating the net FDI position of the MENA region in relation to its development, particularly
focusing on Maghreb countries.
1 UNCTAD, 2004

7
Historically, and particularly throughout the 1980s, many MENA countries have shifted their import
substitution policy to export led growth which is regarded as a more open and conducive
environment for FDI. According to Soliman, there were two major reasons for this policy change.
The debt crisis of many developing countries and the success of export led growth experience in
the South East Asian economies (Soliman, 2003). MENA countries have realised many
liberalization reforms in order to encourage FDI inflows. Almost all MENA countries have a
special FDI regime that refers to a law or decree dealing specifically with FDI2. These reforms
include tax and custom duty breaks, relaxed foreign ownership restrictions, and implemented
privatization and capital market reform programs (Eid and Paua, 2003; UNCTAD, 2004). This
makes Maghreb countries an interesting case for testing the IDP approach. Besides comparing
Maghreb countries with respect to their IDP stages, this study also investigates those countries in
relation to other parts of the world and incorporates political investment and trade policies
between the Maghreb countries and the EU.
1.1 Purpose of the paper
Based on these recent developments in trade and investment policies, the purpose of this paper
is to investigate whether the performance of Maghreb countries in terms of FDI changed
throughout recent years. Closely related to these criteria is the regional aspect and developments
in macro economic fields. As research topic, the Mediterranean area is currently a “hot spot” for
investigation. This is, however, mainly due to tensions emergent, immigration flows due to a
divergence in income, clashes of culture, energy disputes, war and terrorist deeds. Hereby, socio-
political discussions prevail while financial and economic factors are often marginally displayed or
neglected.
North Africa is a vast and underdeveloped region. This particular area and developing countries
as such typically lack transparency and data to produce scientific research. Thus, this topic is of
particular interest to me as I can contribute to enriching the ground for debate of developing
countries and FDI as a potential for economic development. Hence, the paper seeks to answer
the question whether the Maghreb countries, through the establishment of the EMFTA, benefit
from an increase in FDI inflows/outflows and thus possibly enhance performance and
competitiveness in the long-run. This question is explored using the North African cases.
The objective can be formulated in the following research questions:
How have the new EU-Maghreb trade and investment policies affected FDI patterns?
2 Algeria 1993, Bahrain 1984, Egypt 1997, Jordan 1995, Kuwait 1965, Libyan Arab Jamahiriya 1996, Morocco1983-1995, Saudi Arabia 1979, Tunisia 1993, Turkey 1954-1995, Israel 1990 (UNCTAD WIR,1998).

8
Therefore the aim is to find out main effects which shaped the relation of EU Maghreb policies
and subsequently influenced FDI in- and outflows. Those so called FDI patterns shall be
elaborated upon during country analyses.
1.2 Structure
The paper starts out with a methodological section where the research strategy, the data
collection process, issues of validity and reliability and delimitations are presented. In the next
section, the literature review follows, where most relevant theories and authors are analyzed and
discussed. Based on those theories the next section presents a theoretical framework to be used
in scrutinizing FDI flows. Subsequently, an analysis starts out with a comparative country
assessment of Morocco, Tunisia and Algeria based on the theoretical considerations put forward
with the aim of answering my research question. The outcomes are then examined in detail in the
following section and provide an answer to the research question. Finally, the paper analyses and
discusses the findings in light of the theoretical framework and the propositions put forward as
well as verify whether the propositions were relevant.
2. Methodology
The methodology section describes the methods and the research strategy applied in this paper
as well as the data collection process and outlines the sources and literature consulted. The aim
is to explain the motivations and suitability of the chosen methods to the reader. The section
closes with a critique of the applied methods and outlines delimitations.
2.1 Research Strategy
The thesis is built on a country-based methodology and follows a macro-level approach analyzing
FDI flows to answer the research questions. A more general comparative study is applied, while
an in-depth data analysis gives subsequently insight into country specific performance and
explanations of those.
A case study is an intensive examination of a single entity, and according to Yin, is suitable in
fields with a lack of theory and experience. As the Maghreb countries are a relatively unexplored
part of the world, a country by country methodology is a helpful method in gaining deeper insight
and increasing knowledge.
Yin defines the case study as “an empirical inquiry that investigates a contemporary phenomenon
within its real-life context, especially when the boundaries between phenomenon and context are
not clearly evident” (Yin, 2003, p. 13). Hence, developing a case is the most relevant strategy to

9
answer the research questions as it offers a greater opportunity than other available methods to
obtain a holistic view of a specific research project. (Gummersson, 2000, p. 86) Furthermore, the
study requires no control of behavioral events and it focuses on contemporary events, which are
the criteria defined by Yin (2003 p.5).
In the methodological literature two directions of reasoning are distinguished: the inductive and
the deductive research approach. According to Saunders (Saunders, 2003) the deductive
approach develops a theory and/or a hypothesis and designs a research strategy to test this
hypothesis, whereas in the inductive approach data is collected and theory developed as a result
of the data analysis. While gathering data on Maghreb countries, the “progression” of the EMFTA
leading to a bonding of the EU and Maghreb countries called for further exhibition in terms of FDI
patterns. Thus, this paper originates out of a set of data and follows an inductive approach which
maps out relationships between theoretical concepts and then moves towards concrete empirical
evidence to confirm or refute theory.
Another distinction is made between exploratory, descriptive and explanatory studies
(Gummesson, 2000, p. 85). Sekaran (Sekaran, 2003) defines exploratory studies as a way of
better comprehending the nature of the problem since very few information is available in that
area. A descriptive study enables to explore new issues and to describe the characteristics of the
variables of interest in a situation. (Ibid. p. 121) To understand motivations behind FDI decisions
and explaining engagements in other business environments, a mix of exploratory and descriptive
views is best suited and thus applied.
In line with the exploratory and descriptive research design, mostly quantitative vs. qualitative
data is used in this study. As Creswell affirms, “a qualitative study is defined as an inquiry process
of understanding a social or human problem, based on building a complex, holistic picture, formed
with words, reporting detailed views of informants, and conducted in a natural setting”3.
Quantitative data was collected through research and the extensive use of high quality journal
articles, reliable sources (such as UNCTAD, EUROSTATS, WB, IMF, etc.) and country specific
consultations, which thus put the emphasis on the context in which the phenomenon takes place.
2.2 Data Collection
The study cannot rely on only one source due to its richness and exploratory characteristics. Data
collection started as a desk-based research, gathering both primary and secondary data to
answer a number of strategic questions. Subsequently, empirical data was collected through
independent research.
3 Creswell, 1994: 1, 2

10
Primary data is new data gathered to help solve the problem at hand, whereas secondary data
has been collected previously by others. Primary data was used in the empirical part of this study
through talking and discussing with fellow researcher and my supervisor. Initially, data on
Maghreb countries their trade patterns and policies was collected mainly from the multi-lateral
organisation such as Eurostats, IMF, OECD, UNCTAD, WorldBank, EU, etc. through press
releases, journal articles, presentations as well as newspaper articles.
Secondary data is also the main source of information for the theoretical part of this study and for
data on the country profiles. I used both the internet and the library to review relevant articles and
books. Numbers on FDI in- and outflows presented were previously compiled by professionals
such as industry organizations, well-established international organizations acting as an
information service for governments and industry, national banks and non-governmental bodies.
2.3 Reliability and Validity
In order for the research strategy to be valid and reliable, it needs to link the data collected to the
initial questions of the study, i.e. methodology and theory need to provide a balance. According to
Yin (2003 p.19) this is fulfilled when the paper covers the conditions of reliability, constructed
validity, as well as external validity. Reliability is defined as: “The extent to which results are
consistent over time and an accurate representation of the total population under study is referred
to as reliability and if the results of a study can be reproduced under a similar methodology, then
the research instrument is considered to be reliable.” (Golafshani, 2003, p. 598) In other words,
reliability is about the “replicability” of the results. This applies as the results are based on facts
and thus another researcher following the same research strategy would arrive at the same
results. As for validity, “Validity determines whether the research truly measures that which it was
intended to measure or how truthful the research results are.” (Ibid. p.599) To guarantee validity
and reliability, data is collected from divergent sources of information, including primary and
secondary data as well as academic material. According to Neuman (Neuman, 2000, p. 368), this
increases internal and external consistency. Together with the use of multiple theoretical
perspectives early in the research process this has enabled a triangulation of the results which
enhances research validity. Regarding reliability of secondary data, authors and articles consulted
are from trustworthy sources such as academic journals and reports, well-known and often cited.
Moreover, I decided to use numbers and historical facts by UNCTAD as they prove to be the most
accurate ones and as they have the most comprehensive historical data collection and also
forecasts available.

11
The findings of the paper are not based on prior assumptions but on appropriate research
methods which allow for an objective interpretation of the results of the data analysis. The paper
links existing theoretical and methodological reflections with empirical evidence. In order to
retrieve valid and reliable information I conduct a quantitative research process and compile
empirical data independently. I am aware of the subjective nature of information made available
by exemplification and that data can be manipulated for various reasons in itself. Also the
influence of my own expectations and interest on the topic must be balanced through my external
standpoint and by consulting different sources. Through this external and differentiating approach
I increase reliability and validity of the paper. I critically analyze the huge amount of data received,
structure it and filter out the most relevant and reliable information. Moreover, data collected
presents facts about country FDI In- and Outflows, which are relatively free of interpretations
through personal feelings and perceptions. Finally, I triangulate the data by looking into
information provided by different specialized, independent associations and compare it with
qualitative data which is less subjective -compared to quantitative material - and adds to reliability
and validity of the study. Indeed, also in qualitative research “triangulation strengthens a study by
combining methods. This can mean using several kinds of methods or data, including both
quantitative and qualitative approaches.” (Golafshani, 2003, p.603) Moreover, Golafshani (2003,
p.604) underlines that reliability and validity are conceptualized as trustworthiness, precision and
quality in qualitative contexts. Is the study trustworthy, rigorous and therefore generalizable?
Case studies are often criticized for not leading to any general conclusion. Therefore a detailed
comparative case study is employed to strengthen the argumentation. Algeria, Morocco and
Tunisia are contrasted against each other in terms of e.g. FDI in and outflows, Export and
Imports, trade and investment policies and tariffs. To get a broader picture those countries are set
into context with other developing nations. This will essentially permit to portrait similarities,
differences and explanations for why certain features can or can not be linked to macro economic
phenomena.
Strengths of a single case study would have been the ability to produce various sources of
evidence and hence to build multiple viewpoints and perspectives on the chosen country.
However, limitations of the study are the narrow focus on only one entity, its subjectivity and the
influence of personal examinations and perceptions on the study. Although it may present deep
insight, a qualitative single case research might encounter difficulties in providing generalizations.
Therefore I argue that the comparative analysis results of my research can to a certain degree be
generalized to the global Foreign Direct Investment debate and open the door for further IDP
discussions.

12
2.4 Delimitations
I am aware that limitations restrict a study. Restriction, however, were necessary due to time
constraints and the pre-defined scope of the paper. Limiting the research was necessary which
dismissed different related and appealing topics that could have added value.
The scope of this study requires critical reflection in terms of issues to include and evade
respectively. Since the length of the paper is a given, the depth is automatically limited unless
acknowledging that a delimitation is required. Moreover, in addition to the necessary yet voluntary
delimitation, this study operates within a framework which in itself contains certain limitations. In
this section, I account for both.
The thesis examines Foreign Direct Investments, business environments suitable for attracting
those sources of investment and potential facilitator and encumber when it comes to attracting
FDI. Here the unique characteristics of the three case countries Algeria, Tunisia and Morocco
offer explanations which might to a limited extend be used as comparison due to its individual
historical and development economic progress. At this stage I solely focus on FDI and do not look
at alternative sources of investments. Furthermore, the thesis does not examine or compare
different national support schemes, quota systems or direct fixed tariffs and taxes. I put the focus
on European FDI into Maghreb and vice versa. Hereby I restrict the geographical landscape and
the amount of data. I will however relate data to world wide FDI flows and compare those to other
developing countries to establish deeper understanding of the Maghreb cases.
Micro economic features are not analyzed in depth due to the limitations of this paper. The paper
does not explain single company investment types and engagements in detail and does not
differentiate in particular between long-term and short-term investments which may lead to
success-stories or failure. FDI is generally defined as long-term commitment and regarded as a
holistic phenomenon.
2.5 Definitions and Explanations
Foreign direct investment (FDI) is the category of international investment in which an enterprise
resident in one country (the direct investor) acquires an interest of at least 10% in an enterprise
resident in another country (the direct investment enterprise). Subsequent transactions between
affiliated enterprises are also direct investment transactions. (EU Yearbook, 2005)
As it gives the investor an effective voice in the management of the enterprise and a substantial
interest in its business, FDI implies a long-term relationship between the direct investor and the
direct investment enterprise. Investment may take place through the establishment of an entirely

13
new firm, so-called ‘greenfield’ investment, or through the complete or partial purchase of an
existing firm via a merger or an acquisition.
As FDI is discussed in a rather holistic way, and does take little account of their impact on a
particular country, region or firm, FDI is perceived beneficial even though much of the desired
outcome depends on motivations behind placing an investment and all stakeholders involved.
When touching upon Net Outward Position (NOP) – the same as Net Investment Position (NIP) or
Net FDI Position – I aim at establishing a country’s position along the investment-development
path (IDP). In merging FDI inflow and outflow data, the net FDI indicates the country’s position
(see Dunning and Narula, 1996 and Bellak, 2001). Countries in the process of development take-
off usually receive more FDI inflow than the amount they invest abroad (outflow). At an advanced
stage, countries become net FDI exporters, or their investment position fluctuates around neutral.
Almost all FDI data is taken from the UNCTAD FDI databases or the UNCTAD World Investment
Reports.
It should be noted though that the relative size of the FDI inflow is influenced by the size of the
country and its development level. To facilitate international comparison it is appropriate to use
the relative size of FDI. Thus the most wide-spread indicators FDI per capita and FDI per gross
fixed capital formation are used in a comparative analysis4.
The literature generally gives two main reasons for why investors engage in foreign direct
investment. Bluntly put vertical and horizontal FDI. A mixture of both is possible and is often the
case. Vertical FDI signifies that a company ‘slices’ its production chain by allocating different
parts to those countries in which production costs are lower. Progress achieved in recent years in
telecommunications and data management has enabled firms to allocate their production
processes more easily through so-called supply chain management. On the contrary, horizontal
FDI means that a company ‘duplicates’ its production chain in order to place its production closer
to foreign markets. The investment decision may result from a trade-off between fixed costs (the
new plant) and variable costs (e.g. high tariffs and transport costs associated with exporting to
that country). Large markets tend to be more competitive, making imports less attractive, and it is
there that major investors tend to carry out this type of investment. Acting as a substitute to trade,
horizontal FDI gives investors strategic market access and reduces delivery time. A third possible
explanation for FDI are multinational Mergers & Acquisitions (M&A) which take place between
companies in unrelated activities seeking to diversify risk and to deepen economies of scope.
4 Hunya, G. (2006)

14
In relation to wording, off-shoring is used interchangeably with intra-firm or “captive” investment,
Foreign Direct Investments (FDI) and investments abroad. Those concepts imply the same idea
as already mentioned above. Taking the centre of investigation to Maghreb countries, investment
inflows signify FDI investments originating outside of Maghreb countries. Likewise, outflows mean
flows of investments pouring out of Morocco, Tunisia and Algeria.
3. Underlying Theoretical Discussion
The literature review is the foundation on which this research project is based. This literature
survey, where I review and discuss the theory and authors relevant to answer the research
questions, is the basis for the development of my theoretical framework. It is a merger between
theories on the firm, OLI, IDP and FDI theory plus related thinking that explain reasons behind
investments abroad. This stipulates that Multinational Companies (MNCs) realise that options for
value-adding operations can be found in other countries than their home country. Since this
phenomenon is of micro-economic dimension, a better understanding of the firm and its decision
making is required (see OLI Framework in the next chapter). Dunning & Narula (1996) argue that
while FDI is primarily a micro-economic or firm-specific activity, economic development is a
macro-economic or country-specific phenomenon (in Gray 1982). Taking this into consideration
the point of departure is the firm which then leads to an accumulation of investments in countries
by decisions of the firm to invest. Those macro-economic flows are the outcome and the main
interest for this study.
The section commences by defining the concept of Transaction Cost Theory (TCT) and Resource
Based Theory (RBT) as essential elements for the development of a framework and its
implications for FDI. Even though these two classic theories are at the heart of this thesis, a short
introduction and comparison with the Relational View (RV) and the Network Perspective (NT)
expand the theory discussion and put theories into perspective.
Further on nature and motivation behind investments will become clear through the appliance of
the OLI Framework (Dunning, 1981). Essentially the (L) advantage will beg for further
investigation and subsequently introduce the Investment Development Path, which is used to
illustrate what countries and MNCs require to let FDI happen. Based on different definitions, my
own perspective is presented. This is followed by an outline of advantages and disadvantages of
investing abroad and a review of the most relevant theories behind motivations for off-shoring.
Finally, different models are examined before the next section presents the application of the
theory to the study in my own framework which offers guidance when investigating what FDI in-
and outflows to and from Maghreb countries explain. This section applies the theory to the
empirical part while taking the shortcomings and criticisms of the theory into account.

15
3.1 The Theory of FDI and its application
The paper examines a historical set of data of FDI in- and outflows. The underlying framework of
the Investment Development Path is the reasoning for why FDI takes place. To understand
motivations and determinants for FDI, a thorough appreciation of the underlying theories
complements this discussion. Transaction Cost Theory and Resource Based Theory are deemed
essential to reason FDI in-and outflows. Based on this conventional thinking, the OLI framework is
a useful tool to further lead us to view the economic development stages of Maghreb countries
while examining the Investment Development Path in its application (Figure 2). The direction of
arrows follows deliberately the logical progression of the paper, but could be seen as dynamic set
of theories and frameworks, which interact with each other.
Figure 2: Theoretical Considerations
3.2 Theoretical Explanations for FDI
Different theoretical explanations for FDI exist and have emerged over the years. In the following I
review the Transaction Cost Theory (TCT), the Resource-Based Theory (RBT), the Relational
View (RV) and the Network Perspective (NP) as I identified them as the most relevant underlying
theories to answer the research questions.
3.2.1 Transaction Cost Theory
One approach to determine a firm’s boundaries based on transaction related characteristics is
offered by Williamson’s TCT. Williamson combines business economics with organization theory
and determines under which conditions a firm should manage a particular economic exchange
Transaction CostTheory
Resource-BasedTheory
OLI FrameworkEclectic Paradigm
InvestmentDevelopmentPath
Analysis

16
within its boundaries and when it should be outsourced (Barney, 1999, p. 137). His theory has
been inspired by Coase’s seminal article “The nature of the firm” where transaction costs are seen
as the explanation why firms exist (Coase, 1937, Skjøtt-Larsen, 2007). Transaction costs occur
through economic exchange and are determined by frequency, specificity, uncertainty, bounded
rationality, and opportunistic behavior. (Williamson, 2002)
Williamson argues that firms manage their economic exchanges through different forms of
governance: market (arm’s lengths relationships), intermediate (complex contracts or strategic
alliances) or hierarchical governance (vertical integration). The form of governance determines
the firm’s boundaries, i.e. market and intermediate governance place exchanges outside the firm’s
boundaries, while hierarchy manages exchanges within a firm’s boundaries. (Barney, 1999,p.138)
The governance structure however is influenced by bounded rationality and opportunism of
individuals. Bounded rationality arises due to incomplete information and information asymmetry
about the outcome of a specific action. (Skjøtt-Larsen, 2007, p. 88) Williamson defines
opportunism as “self-interest seeking with guile” and as an attribute of human nature. It exists
when one party to an exchange takes unfair advantage of other parties involved and is seen as
the ultimate cause of failure of markets and for the existence of organizations. (Goshal & Moran,
1996, p.17) Williamson argues that the higher the asset specificity in an exchange, the more likely
parties will behave opportunistically. (Williamson, 1979,p. 234) An investment with high asset
specificity is something that has significantly more value in this exchange than in any alternative
use. (Barney, 1999,p.139) To protect oneself against opportunistic behaviour, Williamson
suggests the introduction of safeguards such as contracts, control mechanisms and penalties
(Williamson, 2002). Furthermore, Williamson reasons that a complex interaction between the
environment, the individuals and the firm determines the most efficient governance structure.
Thus, hierarchy is the most effective form of governance when faced with high uncertainty, high
transaction frequency and high asset specificity. In case of medium asset specificity and high
transaction frequency Williamson suggests intermediate governance and market governance as
the most efficient structure for non-specific assets (Barney, 1999,p.139). Backward integration
with suppliers will, according to the TCT, be chosen whenever markets for intermediate inputs
and/or raw material bear high transaction costs. Those high costs arise under small-number
conditions, i.e. the number of parties in the exchange is small, which is the case in many
industries in developing countries or under conditions of information asymmetry, i.e. when the
organization cannot distinguish ex ante between good and bad quality. According to Hennart
(Hennart, 1991, p. 90), “consistent quality is better assured by vertical integration because it
reduces the incentive to cheat at each stage.” Thus, backward integration off-shore instead of
outsourcing could be a potential solution to certain quality guarantee - given a supplier originates
from Maghreb.

17
The TCT has been criticized by many authors. Noorderhaven criticized it for being a static theory
where only the most efficient governance forms survive. According to him, the theory neglects
how transition takes place from one form to another and thus set up a dynamic model where shifts
between governance forms are explained, as indeed, business relationships often develop only
over a long period of time (Skjøtt-Larsen, 2007, p.89).
Goshal and Moran have criticized Williamson’s TCT as bad for practice as his assumption of
opportunism can turn into a self-fulfilling prophecy. They argue that opportunistic behaviour will
increase with sanctions and incentives imposed to curtail it which would in turn create an even
stronger need for more elaborate sanctions and incentives. Setting up safeguards against
opportunism has, according to Goshal and Moran, the opposite effect as outlined by Williamson.
(Goshal & Moran, 1996, p. 14) Furthermore, the authors argue that TCT only holds in stable
business environments and in stagnant industries. Long-term efficiency is only possible when
partners develop trust-based relationships and are willing to share knowledge and experience.
Following Williamson’s argument of opportunism, this collective learning is not possible. This goes
in line with the criticism brought forward by Olsen who argues that TCT only focuses on
minimizing transaction costs to reach efficiency5. The theory fails to take the joint value in account
that can be created by cooperating parties in long-term relationships. Hence, they argue that
efficiency should be measured based on maximizing the joint transaction value instead of solely
minimizing transaction costs. (Dyer, 1977, p. 538; Skjøtt-Larsen, 2007, p. 91). Furthermore,
Williamson’s argument that with increasing asset specificity more complex safeguards and
contracts are required to protect against opportunistic behaviour, thus transaction costs increase,
is confuted by Dyer in his study of automotive transaction relationships in the USA and Japan. He
shows that transactions can achieve the twin benefits of high asset specificity and low transaction
costs. He outlines that this is due to the fact that various safeguards to control opportunism have
different set-up costs and result in varying transaction costs over different time spans (Dyer, 1977,
p. 535).
Finally, Barney criticized TCT for the missing focus on relative capabilities of the firm or of
potential partners when deciding what to keep within a firm’s boundaries. If a firm does not
possess all the capabilities it needs to be successful, Barney suggests three ways of gaining
access. Firstly, a firm can cooperate with firms that already possess the required capabilities
through the market or intermediate governance. Secondly, a firm can try to develop the
capabilities on its own, i.e. use hierarchy to gain access. Thirdly, a firm has the possibility of
acquiring another firm that possesses the capabilities through hierarchy. According to TCT the
5 Olsen (1997)

18
choice of governance should depend on the degree of asset specificity. However, Barney argues
that there are situations where it might be either too costly or impossible for a firm to develop or
acquire the needed capabilities. Reasons are the dependence on historical conditions, path
dependence, social complexity or that actions which need to be taken are not fully known or
would take too long. (Barney, 1999, p.140) Barney thus reasons that when costs of hierarchical
governance are high, a firm might choose non-hierarchical governance forms to gain access to
the capabilities, even if transaction costs are high and hence threats of opportunism exist.
According to Barney, opportunism is simply a part of the cost of gaining access to special
capabilities controlled by other firms which cannot be developed internally or acquired. (Idib.
p.143)
3.2.2 Resource Based Theory
Firm’s capabilities are also the focus of the RBT which has developed as an important perspective
in explaining motivations behind off-shoring and outsourcing. It was first Penrose (1959)6 who
brought forward the idea of looking at a firm as a bundle of heterogeneous resources and
capabilities. Elements can also be found in Coase’s (1937), Stigler’s (1961)7, Chandler’s (1962,
1977)8 and Williamson’s (1975)9 work who all emphasize the importance of resources with
respect to firm performance. Other authors such as Wernerfeldt, Grant, Barney and Eisenhardt
have further contributed to the RBT. According to Grant (Grant, 1991), a firm’s resources and
capabilities provide the basis for a firm’s strategy and are the primary source of profit. As opposed
to Porter’s theory of competitive advantage, where he defines the environment and the industry a
firm is surrounded by as the major source of competitive advantages10, Grant states that a firm’s
internal capabilities and resources are a more stable basis to define its identity and strategy.
Resources are the basic unit of analysis and constitute inputs into the production process such as
capital equipment, skills of individual employees, patents, brand names, finance, etc. Capabilities
are seen as the capacity to deploy resources to reach the desired goal. Thus, resources are the
source of a firm’s capabilities, while capabilities are the main source of competitive advantage.
Resources and capabilities include all financial, physical, human, technological and organizational
assets as well as reputation. They are owned or controlled by the company and deliver products
or services to its customers and can create a sustainable competitive advantage to the company if
they fulfil the VRIN criteria: they have to be Valuable in order to enable the firm to follow a value-
creating strategy, Rare, difficult to Imitate and Non-substitutable. Those are the firm’s “crown
jewels” and need to be protected. (Idib. p.129)
6 Penrose, E.T., (1959), The Theory of the Growth of the Firm, New York: Wiley.7 Stigler, G.K., (1961), The Economics of Information, Journal of Political Economy, pp.213-225.8 Chandler, A.D. Jr. (1962), Strategy and Structure; Cambridge: The MIT Press and Chandler, A.D. Jr. (1977), The Visible Hand; Harvard University Press.9 Williamson, O.E., (1975), Markets and hierarchy: Analysis and antitrust implications, New York: Free Press.10 Porter’s diamond
19
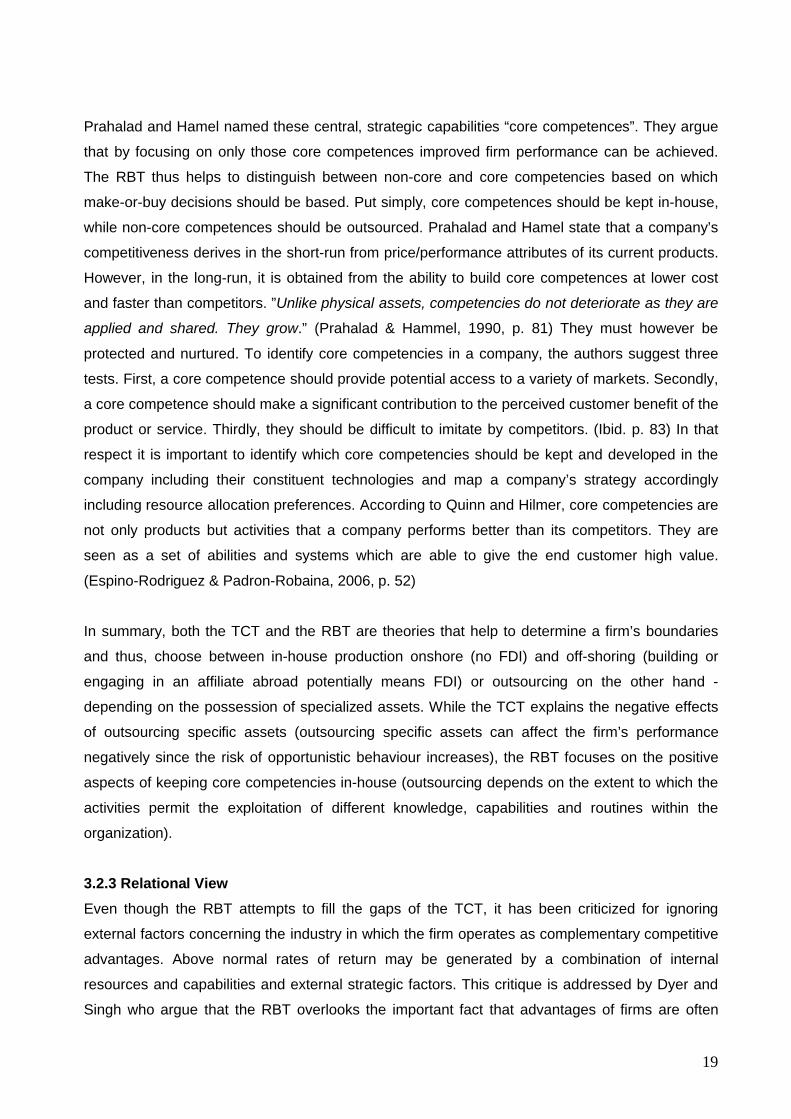
Prahalad and Hamel named these central, strategic capabilities “core competences”. They argue
that by focusing on only those core competences improved firm performance can be achieved.
The RBT thus helps to distinguish between non-core and core competencies based on which
make-or-buy decisions should be based. Put simply, core competences should be kept in-house,
while non-core competences should be outsourced. Prahalad and Hamel state that a company’s
competitiveness derives in the short-run from price/performance attributes of its current products.
However, in the long-run, it is obtained from the ability to build core competences at lower cost
and faster than competitors. ”Unlike physical assets, competencies do not deteriorate as they are
applied and shared. They grow.” (Prahalad & Hammel, 1990, p. 81) They must however be
protected and nurtured. To identify core competencies in a company, the authors suggest three
tests. First, a core competence should provide potential access to a variety of markets. Secondly,
a core competence should make a significant contribution to the perceived customer benefit of the
product or service. Thirdly, they should be difficult to imitate by competitors. (Ibid. p. 83) In that
respect it is important to identify which core competencies should be kept and developed in the
company including their constituent technologies and map a company’s strategy accordingly
including resource allocation preferences. According to Quinn and Hilmer, core competencies are
not only products but activities that a company performs better than its competitors. They are
seen as a set of abilities and systems which are able to give the end customer high value.
(Espino-Rodriguez & Padron-Robaina, 2006, p. 52)
In summary, both the TCT and the RBT are theories that help to determine a firm’s boundaries
and thus, choose between in-house production onshore (no FDI) and off-shoring (building or
engaging in an affiliate abroad potentially means FDI) or outsourcing on the other hand -
depending on the possession of specialized assets. While the TCT explains the negative effects
of outsourcing specific assets (outsourcing specific assets can affect the firm’s performance
negatively since the risk of opportunistic behaviour increases), the RBT focuses on the positive
aspects of keeping core competencies in-house (outsourcing depends on the extent to which the
activities permit the exploitation of different knowledge, capabilities and routines within the
organization).
3.2.3 Relational View
Even though the RBT attempts to fill the gaps of the TCT, it has been criticized for ignoring
external factors concerning the industry in which the firm operates as complementary competitive
advantages. Above normal rates of return may be generated by a combination of internal
resources and capabilities and external strategic factors. This critique is addressed by Dyer and
Singh who argue that the RBT overlooks the important fact that advantages of firms are often

20
linked to advantages of the network of relationships in which the firm is embedded. Thus, a firm’s
critical resources may span its boundaries. (Dyer & Singh, 1998, p. 660) They introduce the RV
which is complementary to the RBT, however considers the network as unit of analysis and
different sources of competitive advantages. While according to the RBT core competencies are
generated within the company itself, the RV identifies relation-specific assets, knowledge-sharing
routines, complementary resources and capabilities and effective governance as the determinants
of competitive advantages. The authors state that “relational rents are possible when alliance
partners combine, exchange, or invest in idiosyncratic assets, knowledge, and
resources/capabilities, and/or they employ effective governance mechanisms that lower
transaction costs or permit the realization of rents through the synergistic combination of assets,
knowledge, or capabilities.” (Ibid. p.662) In summary, according to the RBT firms should protect,
rather than share, valuable resources to prevent knowledge spillovers. Opposed to that, the RV
argues that rents are jointly created through the systematic sharing of knowledge and know-how.
(Ibid. p.675)
3.2.4 Network Perspective
Another theory that looks beyond a firm’s boundaries is the NP. It takes a socio-economic
perspective on industrial networks, and focuses on the value of business relationships. The
underlying assumption is that the individual firm depends on resources controlled by other firms to
which it can gain access through interaction. The three components activities, resources and
actors and their mutual relationships define the dyad. The actors are defined by the resources
they control and by the activities they perform. Relations between firms in the NP are developed
through exchange and adaptation processes. The former include exchange of information, goods
and services, social processes, etc. The latter include mutual modifications of products,
administrative systems and production processes. The value of resources is determined by
combinations with other resources. This is why a firm’s continuous interaction with other players is
a crucial factor in developing new resources. Thus, a firm’s relations with other firms are often
seen as the most valuable resource. A firm is thereby able to influence not only the direct players
but also the indirect players in the network. (Skjøtt-Larsen, 2007, p. 93)
3.2.5 Summary
The table below summarizes the main characteristics of the four theories outlined above which
must be seen as complementary. It is not possible to rely on only one theory when one seeks to
explain motivations behind off-shoring.

21
Table 1: Summary of Theoretical Perspectives
Characteristics TCT RBT RV NP
Assumption Bounded rationality, Opportunism
Bounded rationality, Trust, Firm as bundle of resources
Resources span firm boundaries
Bounded rationality, Trust,Dependence on resources controlled by other firms
Unit of analysis Firm Firm Pair/network of firms
Network/dyad of firms
Focal point of analysis
Transaction attributes
Resource attributes
Relational rents Inter-firm relations
Problem orientation
Efficient governance structure, Why do firms exist?
Internal competence development, Why do firms differ?
Inter-firm long-term collaboration
Dynamic relationships, How to interact with other firms?
Time dimension Static Static/dynamic Dynamic DynamicNature ofrelationship
Market failures Access to complementary resources
Access to jointly created resources
Access to heterogeneous resources
Domain of interest
Exchange and the transaction
Firm resources and capabilities
Related networks Exchange and adaptation processes
4. Constructing a Framework
OLI
The IDP theory was introduced by Dunning (1981) as an extension of Eclectic Paradigm - or OLI
framework - to explain the net outward investment position of countries in relation to their
development stages. The Eclectic Paradigm suggests that the direct investment stock of countries
is determined by three factors: ownership, location and internalization (OLI) advantages.
Ownership advantages (O) describe the net competitive advantages of a domestic firm relative to
the firms of other countries such as patents and trademarks, managerial know-how, scale or
preferential access to raw materials and/or to markets. These are terms often related to the RBT.
However, in terms of the TCT a firm that possesses (O) would be exposed to low transaction cost.
Those could denote e.g. infrequent transactions, low asset specificity, certainty in the market and
no opportunistic behavior of the players.
Dunning (1995a) argues that FDI may be explained by locational factors such as the extent and
nature of the location (L) bound endowments and markets offered by countries to firms to create
or add further value to their competitive advantages. The extent to which the market for these
advantages is best internalised by the firm itself (I), rather than marketed directly to foreign firms

22
define the internal composition of the firm’s strategy. In other words Internalization advantages of
a firm define the perception of the firm as more profitable to exploit the ownership advantages in
the international markets instead of selling them to other firms. Consequently, FDI takes place.
As stated by the “internalisation paradigm” there are advantages of internalising the market in
order to appropriate the full economic rent created by core assets. (Dunning, 1995 a, p.81). This
could be explained via the TCT through control of the parent company. Control could minimise
opportunistic behaviour while at the same time giving confidence to operations. RBT would regard
resources and knowledge as key element which would be kept in-house – hence avoiding rent
seeking behaviour of other players in the market. Thus, location advantages identify the host
country’s attractiveness relative to others such as physical distance, labour composition,
wages, infrastructure, economic and political system, etc.
Especially the (L) advantage leads to the proposition of the Investment Development Path (IDP)
theory, which suggests that the country passes through five main development stages determined
by the changes in the OLI parameters of domestic firms and the country (Dunning and Narula
1996). These changes affect the international investment position of the country with respect to its
development. Dunning and Narula demonstrate the change in investment position of a country
with changes in its net outward investment (NOI: outward FDI minus inward FDI) and the
development with country’s gross domestic product (GDP) level.
IDP
In the first stage of IDP, outward FDI of the country is at a negligible level or zero because of
insufficient ownership advantages of domestic firms. The inward FDI level of the country also
remains at a low level as a result of limited market demand related to low income level, insufficient
government policies in promoting FDI, inadequate labour force and infrastructure (Dunning and
Narula 1996). In the second stage of IDP, outward direct investments remain still at a negligible
level but inward FDI begins to rise as the location advantages of the country improves, particularly
with the help of government policies. As the ownership advantages of the firms improve, firms
become more competitive and internalization of international markets becomes more attractive.
Eventually, the rate of outward FDI begins to increase in the third stage of IDP. At this stage,
along with the decrease in the growth rate of FDI inflows, the net outward investment (NOI) level
(outward FDI minus inward FDI) of the country rises. In the fourth stage, outward FDI of the
country becomes equal to or greater than its inward FDI. During this period, location advantages
of the country are assumed to depend mostly on the location-bounded created assets that are not
independent of natural resources. As the ownership advantages of the domestic firms become
similar to the firms in other fourth stage countries, inter-industry trade and inter-industry FDI

23
increases between these countries. Finally, the NOI level of a country fluctuates at the zero level
in the fifth stage of IDP while the growth rate of both inward and outward FDI continues to rise
Dunning (1981) and Dunning and Narula (1996) have analyzed the IDP stages of a group of
countries using cross-section data, and have used gross domestic product (GDP) as a
representative of the countries’ development level.
Table 2: The Five Stages of the IDP and Classifications
In a nutshell:
The Net Outward Position (NOP) of a country (outward investment – inward investment) follows
five stages of development which are closely related to the economic development of the country.
• Stage 1: Least developed countries attract and undertake negligible amounts of FDI.
• Stage 2: Developing countries attract increasingly FDI as a result of cheap inputs; as a
result of FDI, domestic investors enhance their own ownership advantages through
spillovers; local advantages are also upgraded.
• Stage 3: The developing country becomes gradually an outward exporter itself; expansion
is in neighbouring, culturally similar countries conform with the Uppsala School (Johanson
and Vahlne, 1977; 1990). Investment in developed countries occurs as well.
• Stage 4: The country becomes a net outward investor, revealing the level of economic
development as well as the dynamism of local firms.
• Stage 5: This stage describes developed economies i.e. the USA, the UK, Germany with
high volumes of inward and outward FDI.

24
Based on the above mentioned pattern of FDI In- and Outflows – converted into the NOP – a
progressive increase in NOP is apparent. Visualised, a typical development from stage 1 to 5
would - in theory - be portrayed as in the graph underneath.
Figure 3: Net Outward Positions of Countries in different Development Stages
(Graph adopted from presentation Filippaios and Tzioumis, 2008, LSE)
4.1 Theoretical Framework
In the following section I develop the important linkage between theory and practice. I link the
theories presented above with the empirical part of the thesis by applying and combining the
relevant theories in a framework that is suitable to answer the research questions put forward. As
the existing theories and models are not sufficient to explore the reasons for the poor Maghreb
FDI performance, different theories and models are merged and applied to the unique
characteristics of countries and its current issues. Through combining and applying different
models to a new context, I am filling in gaps and provide answers and explanations that the
current theory does not provide.
In order to be able to assess both the motivations and essential key components for proper FDI
investment climates, I suggest a multi-dimensional approach. This approach can be used as a
tool which helps identify the respective explanation for FDI environments and reason behind such
settings. Underneath, the theoretical foundation - which is the guideline used throughout the
literature review and continues to be the underlying assumption for the analytical part – is
portrayed. It dedicates room for the firm as a basis to start from. FDI emerges from a decision to

25
invest abroad. Here the OLI with its multi-layer consideration paves the way for a better
understanding of what considerations and elements must be met before a firm invests.
Figure 4: Theoretical Foundation For Framework
Theoretical Foundation
IO
FDI Performance
Investment Development Path
Resource Based Theory
Transaction Cost Based
Theory
Fir
m L
eve
lC
oun
try
Lev
el
L
Research on the determinants of FDI indicates that a plethora of factors could influence FDI
location decision. Possibly, such reasons are to extract raw materials, to expand markets, to
seek cheaper sources of labour to produce goods and services for exports to home markets and
elsewhere, for taking advantage of tax systems, and to obtain other free and/or subsidized
benefits fro the hose country have been put forward. Zaman (2004) argues that non-economic
factors have been neglected when discussing motives of FDI. In his view decision-making
structures in host countries, continuity of political and economic powers, established procedures
for dealing with foreign MNC and levels of transparency and accountability deserve a more
thorough discussion.
Coming back to the more obvious motives of FDI, Market-size is reported to be one of the most
significant determinants of FDI flows. Bandera and White’s (1968) study of US manufacturing FDI
in different European countries found a strong correlation between the level of FDI and the level of
national income in the host country. Using aggregate data on a large number of developing
countries, Root and Ahmed (1979) found per capita GNP to be a dominant variable in determining
FDI in developing countries.

26
Dunning (1988) on the other hand found availability, cost and access to raw materials and labour
supply as having a strong effect on the location of FDI. Literature indicates that the lower the cost
of labour, the more attractive the country is to FDI. Tsai (1994) found that while lower labour cost
attracts more FDI, higher labor cost discourages inward FDI.
Another crucial factor and often mentioned is political (in) stability, which was found to have an
impact on inflow of FDI. Schneider and Frey (1985d) and Bollen et al. (1982) noted that political
instability significantly reduces the inflow of FDI. Another researcher found that investors report
political instability as the most important factors influencing their FDI decision. Welfens (1993)
argued that in transition economies such as Eastern and Central European countries, political
stability is needed to attract FDI. In principle, research indicates that political stability is a
pre-requisite for FDI to occur but is not a strong motive for inward FDI11.
Economic stability is also conveyed to be a key determinant of FDI (Goodnow and Hansz 1972,
UNCTAD 1998). In addition economic stability must be accompanied by political stability in order
to affect positively inward FDI. Put differently, foreign investors will be deterred by political
and economic instabilities but will not be motivated to invest because the country is
economically and politically stable – they are necessary condition for FDI to occur but are
not enough on their own. The two factors matter when accompanied by other motives
(UNCTAD, 1998).
Amid other key determinants of FDI that have received interest in the empirical literature, are
economic growth (Root and Ahmed (1979), infrastructure (Wheeler and Mody (1992),
geographical proximity and transportation costs (e.g. Goodnow and Hansz 1972) tax incentives
(Root and Ahmed, 1979), investment policy of host countries, and the level of industry competition
in the host market12.
The significance of host country factors may differ depending upon the country in which the firm
originated. Pauly and Reich’s (1997) study on the practices of US, Japanese and German
multinationals provided rich evidence that, despite globalization, considerable nationally-based
differences between multinationals persist. For instance, German and Japanese firms obtain most
of their financing through banks, while US firms rely primarily on capital markets. By implication,
nationally-based differences may influence firms’ decisions on FDI location. A study by UNCTAD
(1998) noted that foreign investors may respond differently to different types of motives depending
on their strategies, which are subsequently influenced by their country of origin (Stopford and
11 UNCTAD, 199812 e.g. Goodnow 1985, Porter

27
Wells, 1972). One reason for country of origin variations, which is of relevance to this article, is
geographical and cultural proximity between a firm’s home country and the target FDI location. By
extension, even though on could argue pro geographical proximity and historically and culturally
affiliated relation between the EU and Maghreb countries, I assume that factors such as cost of
labour, natural resources, high purchasing power, and the political and economic stability are of
interest to companies from EU countries. Conversely, American and/or Asian companies might
base their location decision on other factors.
The industrial sector could also affect incentives favoured by foreign firms. Already in the early
1970s, Dunning (1973) considered the possibility that FDI motives vary between industries.
Manufacturing, for instance, may differ substantially from service operations and/or agriculture.
Manufacturing investments generally require much larger investments in fixed assets, such as
land and equipment, than do service companies. As a result, incentives related to the acquisition
of assets or availability of natural resources should be of less interest to service firms. While some
empirical studies found that FDI determinants did not differ significantly between sectors (e.g.
Miller 1993) other studies implied different conclusions. With respect to socio-political risk,
different authors (e.g. Kobrin 1978) suggested that different types of socio-political events have
diverging effects on different industries thus, by implication a firm’s response to socio political
instability differs by sector.
A number of empirical studies suggested or implied that FDI motives may differ between sectors.
Based on an investigation of 118 foreign plants constructed or purchased by US firms, Bass et al.
(1977) found that different industries emphasise different factors in FDI. For instance, while labour
intensive electrical firms were more concerned with wage rates, capital intensive chemicals firms
put more emphasis on shared ownership. In a study of the effect of socio-political instability on the
flow of US investment, Fatehi and Safizadeh (1994) found that socio-political events affected
different sectors in different ways. By examining three forms of FDI – manufacturing, mining and
petroleum, the authors found a diverging effect of political instability on the flow of these three
forms of FDI. Taken together, the theoretical explanations for off-shoring offered by the TCT,
RBT, RV and NP suggest the following: According to the TCT, the decision whether to use the
market, hierarchy or intermediate governance forms to off-shore is to a large degree influenced by
the level of transaction costs involved as well as bounded rationality and opportunism which rise
with the degree of asset specificity.
To conclude: political and economic stability are predetermined factors that are the basis to attract
FDI. Other than that sectors and industries perform differently when deciding to invest abroad and

28
thus respond only to certain industrial policies. Naturally, locational factors are a detrimental
factor for attracting FDI, also in term of creating certain sectors and industries.
Figure 5: Framework for Analysis
5. Analysis
The following section applies the propositions put forward in my own framework to the case
countries. In order to understand the dynamics and current challenges of the Maghreb countries,
a macro perspective is discussed. Thus, this section starts with a presentation of the current
political agenda surrounding and influencing Maghreb countries. Subsequently, motivations for
trade and potential integration are examined while trends of nation-wide policy formulations are
compared. Later on, a narrow investigation of factor endowments and trade patterns of important
industries of Maghreb depict locational settings while keeping key investors in mind. Concluding,
those factors will be tested against my suggestions in a comparative analysis, before a detailed
positioning of Maghreb counties, as regarded via the Investment Development Path, takes place.
This will eventually answer the research question about delicate Maghreb FDI patterns.
5.1 Case Presentation
In this section, the three Maghreb countries are portrayed in terms of political systems and recent
trade and investment policies to eventually exhibit similarities and differences in their FDI flows,
stock and gross fixed capital formation (GFCF). As outflows in particular are minimal, a

29
percentage of GFCF is not included. Algeria, Morocco and Tunisia are compared to other parts of
the world and in contrast to the developing countries and developed countries to complementarily
position them.
5.1.1 Algeria’s policies
According to UN estimates, “The People's Democratic Republic of Algeria” has a population of
33.9 million (UN, 2007). President Abdelaziz Bouteflika secured a landslide election victory in
April 2004 and is still governing. He promised to seek "true national reconciliation" during his now
second term (BBC).
Among the areas open to foreign investors in Algeria are the huge reserves of natural gas and
other hydrocarbons. The country is the largest supplier of natural gas to the European Union
(EU). It projects to increase oil and gas revenue over the coming decade and so the government
is eager to attract substantial foreign investment to the sector. The Government of Algeria
announced in 2002 that it would privatize, either fully or partially, 100 state-owned firms. However,
in 2005, Algeria altered its strategy towards investment in the oil and gas sector to increase the
share of Sonatrach, the state-owned oil and gas company, in all exploration and production
contracts awarded to foreign investors.
Algeria is a member of the Arab Maghreb Union, New Partnership for Africa's Development and
the African Union. In 2001, the country signed the Trade and Investment Framework Agreement
(TIFA) with the United States, effectively establishing the common principles on which the
economic relationship is founded. Algeria also initialed an accord as part of the European Union’s
drive to build stronger relations with neighbors in the southern and eastern Mediterranean. Central
to the agreement is a dismantling of trade barriers over 12 years. It is expected that these will lead
the country to implement more reforms, especially in the banking and finance industries and
ultimately boost FDI inflows into Algeria13.
13 UNCTAD, WID, Country Profile: Algeria
30
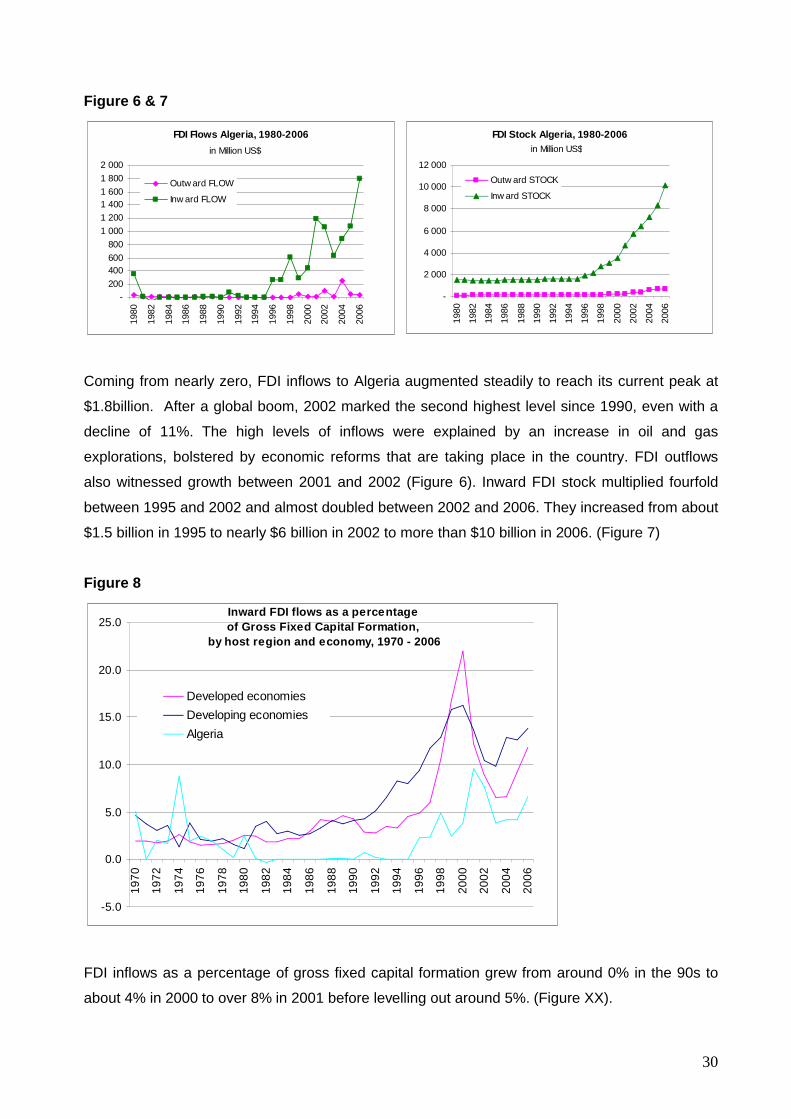
Figure 6 & 7
Coming from nearly zero, FDI inflows to Algeria augmented steadily to reach its current peak at
$1.8billion. After a global boom, 2002 marked the second highest level since 1990, even with a
decline of 11%. The high levels of inflows were explained by an increase in oil and gas
explorations, bolstered by economic reforms that are taking place in the country. FDI outflows
also witnessed growth between 2001 and 2002 (Figure 6). Inward FDI stock multiplied fourfold
between 1995 and 2002 and almost doubled between 2002 and 2006. They increased from about
$1.5 billion in 1995 to nearly $6 billion in 2002 to more than $10 billion in 2006. (Figure 7)
Figure 8
-5.0
0.0
5.0
10.0
15.0
20.0
25.0
19
70
19
72
19
74
19
76
19
78
19
80
19
82
19
84
19
86
19
88
19
90
19
92
19
94
19
96
19
98
20
00
20
02
20
04
20
06
Developed economies
Developing economies
Algeria
Inward FDI flows as a percentageof Gross Fixed Capital Formation,
by host region and economy, 1970 - 2006
FDI inflows as a percentage of gross fixed capital formation grew from around 0% in the 90s to
about 4% in 2000 to over 8% in 2001 before levelling out around 5%. (Figure XX).
FDI Flows Algeria, 1980-2006
-
200
400 600
800
1 000
1 200
1 400 1 600
1 800
2 000
1980
1982
1984
1986
1988
1990
1992
1994
1996
1998
2000
2002
2004
2006
Outw ard FLOW
Inw ard FLOW
in Million US$
FDI Stock Algeria, 1980-2006
-
2 000
4 000
6 000
8 000
10 000
12 000
1980
1982
1984
1986
1988
1990
1992
1994
1996
1998
2000
2002
2004
2006
Outw ard STOCK
Inw ard STOCK
in Million US$

31
5.1.2 Morocco’s case
Although the fourth largest country in the region, Morocco has a rather small but open economy,
its degree of openness is now close to 70% of GDP. Morocco has recently experienced an
improvement of its average GDP growth to some 5.5% (from 3.2% in 2002). The country recorded
another current account surplus in 2003, with stronger investment activity and sustained private
consumption14.
With a population close to 30 million, Morocco’s “constitutional, democratic and social monarchy”,
lead by King Mohammed VI, controls and economy amounting to $37,263 million (GDP 2002)15. It
is highly dependant on agricultural production, which accounts for roughly 14% of GDP but
involves more than 50% of the labour force. The dependency on agricultural output and erratic
meteorological conditions has traditionally led to a high volatility in the growth rate. The slow
growth rates in the 1990’s translated into a stagnant per capita income level of €3.690 (PPP) in
2002. The economy has not been able to alleviate pressures stemming from the rapidly
increasing labour force (population growth, although declining, is still 1.7 %). Unemployment
levels remain high (over 20% in urban areas).
Following an economic crisis in 1983, the government substantially reduced trade protection, cut
the fiscal deficit, and rescheduled its external debt. While the 1990s have been characterised by a
high degree of macroeconomic stability, a slippage in fiscal discipline has been noted recently.
With regard to economic growth Morocco’s performance has been disappointing over the last
decade, declining to an average 2.3% per year compared to an average of 4% in the 1980s.
Lower growth rates were mainly due to external developments (six droughts in ten years, slow
European growth) as well as stagnating overall structural reforms. Progress in recent years
includes, among others, the modernisation of the customs administration, the privatisation of
public enterprises, telecommunications reform, and trade liberalisation in accordance with the
Association Agreement with the EU. Since 2001, the growth rate has improved, rising to 5.5% in
2003. This improvement reflected the 20.6% increase of agricultural output16.
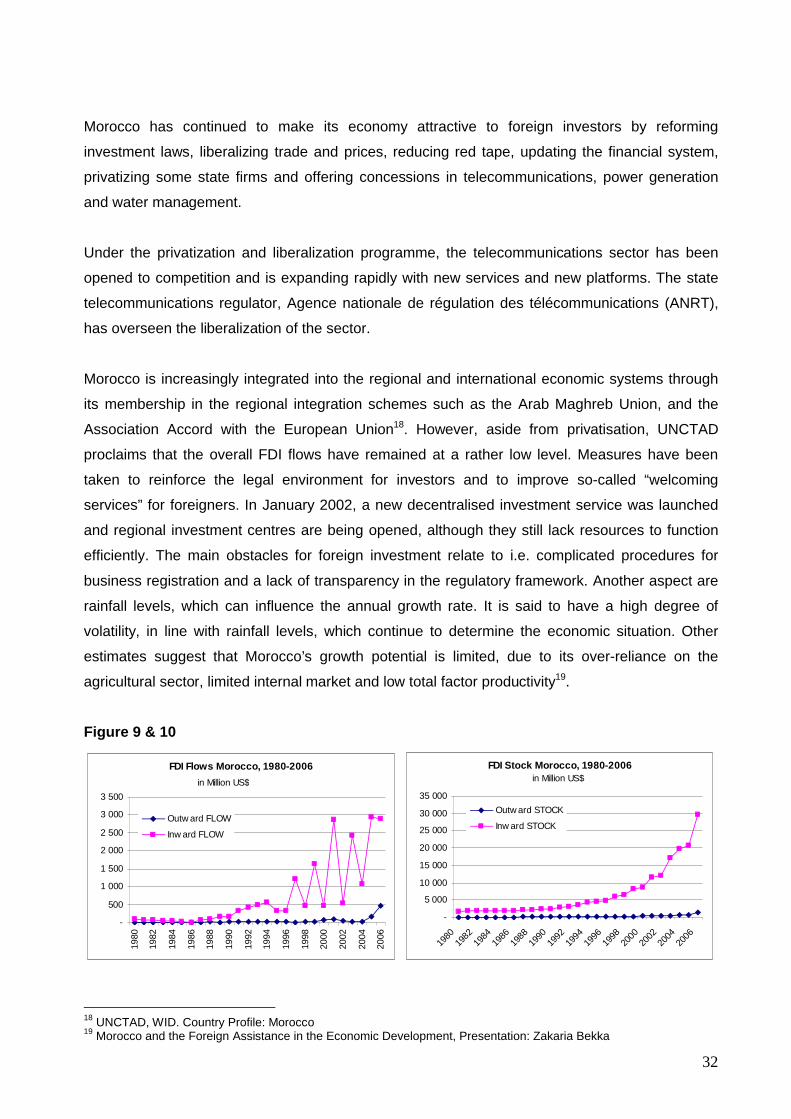
Morocco has a wide scope for FDI because of its abundant natural resources. It is the world’s
largest exporter of phosphates - both raw phosphates and processed products, including
phosphoric acid and fertilizers17. Other minerals including silver, zinc, copper and Cobalt are also
extracted. Manufacturing is dominated by the clothing and textiles industry while there are small
but growing electrical and mechanical industries.
14 European Neighbourhood Policy: Country Report Morocco, The Commission of the European Communities, 200415 Morocco and the Foreign Assistance in the Economic Development, Presentation: Zakaria Bekka16 ibid17 UNCTAD, WID. Country Profile: Morocco
32
Morocco has continued to make its economy attractive to foreign investors by reforming
investment laws, liberalizing trade and prices, reducing red tape, updating the financial system,
privatizing some state firms and offering concessions in telecommunications, power generation
and water management.
Under the privatization and liberalization programme, the telecommunications sector has been
opened to competition and is expanding rapidly with new services and new platforms. The state
telecommunications regulator, Agence nationale de régulation des télécommunications (ANRT),
has overseen the liberalization of the sector.
Morocco is increasingly integrated into the regional and international economic systems through
its membership in the regional integration schemes such as the Arab Maghreb Union, and the
Association Accord with the European Union18. However, aside from privatisation, UNCTAD
proclaims that the overall FDI flows have remained at a rather low level. Measures have been
taken to reinforce the legal environment for investors and to improve so-called “welcoming
services” for foreigners. In January 2002, a new decentralised investment service was launched
and regional investment centres are being opened, although they still lack resources to function
efficiently. The main obstacles for foreign investment relate to i.e. complicated procedures for
business registration and a lack of transparency in the regulatory framework. Another aspect are
rainfall levels, which can influence the annual growth rate. It is said to have a high degree of
volatility, in line with rainfall levels, which continue to determine the economic situation. Other
estimates suggest that Morocco’s growth potential is limited, due to its over-reliance on the
agricultural sector, limited internal market and low total factor productivity19.
Figure 9 & 10
18 UNCTAD, WID. Country Profile: Morocco19 Morocco and the Foreign Assistance in the Economic Development, Presentation: Zakaria Bekka
FDI Stock Morocco, 1980-2006
-
5 000
10 000
15 000
20 000
25 000
30 000
35 000
1980
1982
1984
1986
1988
1990
1992
1994
1996
1998
2000
2002
2004
2006
Outw ard STOCK
Inw ard STOCK
in Million US$FDI Flows Morocco, 1980-2006
-
500
1 000
1 500
2 000
2 500
3 000
3 500
1980
1982
1984
1986
1988
1990
1992
1994
1996
1998
2000
2002
2004
2006
Outw ard FLOW
Inw ard FLOW
in Million US$

33
Growth in FDI inflows to Morocco has widely fluctuated since 1996, and in 2002 it took a nose
dive, from $2.9 billion in 2001 to $533 million in 2002. The downturn in 2002 was a return to the
normal level after an exceptionally large acquisition that took place in the telecommunications
sector in 2001. However, the graph portraits the bouncing back and recent ups and down with a
current levelling out at around $3 billion. FDI outflows followed a similar pattern, declining from
$97 million in 2001 to $29 million in 2002 before climbing up to $500 in 2006 (Figure 9).
Inward FDI stock surged from less than $1 billion in 1990 to almost $10 billion in 2002. Outward
FDI stock reached its highest point, at a little above $0.8 billion in 2002 (Figure 10).
Figure 11
-5.0
0.0
5.0
10.0
15.0
20.0
25.0
30.0
35.0
40.0
45.0
1970
1972
1974
1976
1978
1980
1982
1984
1986
1988
1990
1992
1994
1996
1998
2000
2002
2004
2006
Developed economies
Developing economies
Morocco
Inward FDI flows as a percentageof Gross Fixed Capital Formation,
by host region and economy, 1970 - 2006
FDI inflows as a percentage of gross fixed capital formation (GFCF) declined from 38% in 2001 to
6% in 2002. Since 1996 this yearly up and down is visible, where jumps from around 7% to
around 20% are common. In 2005 and 2006, however, a rather high level of above 20% was
reached.
5.1.3 Tunisia’s situation
With about 10 million inhabitants, Tunisia followed a period of high growth rates (5.2% on average
for the period 1997-2001). However a combination of negative domestic and external shocks led
to a modest GDP expansion of 1.7% in 2002. An export-led recovery followed in 2003, driven also
by increased agricultural production. GDP grew 5.6% in 2003. Export revenues increased by
34
around 12% in the first eight months. The Iraq crisis and the Casablanca terrorist attack had an
impact on the tourism industry in early 2003, although relatively moderate (tourism fell by 9%)20.
Thanks to prudent macroeconomic management, Tunisia is experiencing a relatively high degree
of price stability with inflation levels well below 5% since the second half of the 1990’s. Tunisia is
a constitutional presidential republic. The President of the Republic is the Head of the Executive.
He is elected by universal suffrage. The current President, Zine El Abidine Ben Ali, has been in
power since 1987 and in the last elections in 1999 received 99.4% of the votes.21 The
Government has been particularly keen to encourage foreign investors to invest in manufacturing
plants in Tunisia to serve the European market by offering attractive investment incentives to
export-oriented investments. For example, exporting companies can import all necessary capital
goods and production inputs custom duty free. They are also fully exempt from income tax for the
first ten years of activity followed by a 50% reduction in income tax thereafter. Foreign investors
can hold up to 100% of the project capital without prior authorization, except for exporting service
industries which are subject to authorization if the foreign participation exceeds 50% of the capital.
From 1995, privatization was sped up and by 2005 the government had disposed of large
businesses. About 160 public enterprises had been fully or partially privatized or been shut down
and their assets sold off. Foreign investors also benefit from the off-shore status of wholly
exporting companies: whether in the form of off-shore factories which can be set up anywhere in
Tunisia, or within a free zone. Two free trade zones are set up in Tunisia, one in Bizerta and the
other in Zarzis. The incentives offered by these free trade zones strengthen the interest already
shown by foreign investors in Tunisia.
Oil has played a large role in attracting FDI to Tunisia and exploration remains buoyant. The law
concerning exploration activities was revised in early 2000 to give the government greater
flexibility in fixing terms with operators, taking into account exploration costs, field size and
changing world oil and gas prices. This cleared the way for an expansion of petroleum activities.
Approximately 43 exploration permits were in operation in 2002. The British Gas investment in the
Miskar gasfield in the early 1990s is still Tunisia's largest single foreign investment.
Non-energy foreign investment did not rise much until 1998, despite many initiatives to encourage
it. However, since 1998, the main focus of FDI has been on manufacturing. After the cement
sector, the textiles industry has attracted the most foreign investment, followed by shoes and
leather, vehicle parts, electronics, pharmaceuticals, food, and computer software. The tourism
20 European Neighbourhood Policy: Country Report Tunisia, The Commission of the European Communities, 200421 Ibid

35
sector is also growing in importance. The main investors are from European companies – mainly
France, the United Kingdom, Germany and Italy, and the United States.
Tunisia has good infrastructure, a reasonably well-trained and adaptable workforce, enjoys
proximity to Europe and is improving its integration into the world economy. The country is
provided free access for industrial goods to European markets through its Association Agreement
with the European Union (EU), and reduced customs duties for exports to the United States,
Canada, Switzerland, Australia and Japan. It is the first country of the southern shore of the
Mediterranean to have signed an association agreement with the EU. This agreement, signed on
17 July 1995, extends cooperation to culture, education, economy, scientific research and political
and social dialogue. It provides for the gradual establishment, over a period of 12 years, of a free-
trade zone for industrial products (EMFTA). Another agreement on agricultural trade with the EU
came into force on 1 January 2001. The agreement raised Tunisia’s annual quota for duty-free
exports to the EU and fixed other quotas for other agricultural items. In return, Tunisia agreed to
remove import duties on European wheat and vegetable oil imports over five years22.
Tunisia also signed free-trade agreements with Egypt, Morocco, Jordan and Libyan Arab
Jamahiriya. In 2001, Tunisia signed a declaration with Egypt, Morocco and Jordan calling for a
free-trade zone among the Arab states of the Mediterranean, which is to become a precursor to
the proposed Arab free-trade area. At the end of 2005, Tunisia belonged to major integration
schemes such as the Arab Maghreb Union, African Union, New Partnership for Africa's
Development and World Trade Organization. Tunisia also supports the “Eizenstat plan” to develop
trade links between the United States and Tunisia, Morocco, Algeria and Egypt. Out of all pending
initiatives however, only the EU partnership has so far become a reality23.
Figure 12 & 13
22 UNCTAD WID Country Profile: Tunisia23 European Neighbourhood Policy: Country Report Tunisia, The Commission of the European Communities, 2004
FDI Stock Tunisia, 1980-2006
-
5 000
10 000
15 000
20 000
25 000
1980
1982
1984
1986
1988
1990
1992
1994
1996
1998
2000
2002
2004
2006
Outw ard STOCK
Inw ard STOCK
in Million US$FDI Flow Tunisia, 1980-2006
-
500
1 000
1 500
2 000
2 500
3 000
3 500
1980
1982
1984
1986
1988
1990
1992
1994
1996
1998
2000
2002
2004
2006
Outw ard FLOW
Inw ard FLOW
in Million US$

36
FDI flows to Tunisia, in 2002, reach a height since 1990 and almost double the total inflows
recorded in 2001. The FDI inflows to Tunisia in 2002 were determined by investment in oil
exploration activities and manufacturing sectors. The peak was reached by a fourfold increase
from 2005 to 2006 (totalling $3.3billion). FDI outflows, on other hand, were small throughout the
last decades touching the maximum of $33 million in 2006 (Figure 12). Inward FDI stock grew
from $11.7 billion in 2001 to $14 billion in 2002. Outward stock also increased from $33 million in
2001 to $37 million in 2002 gradually rising over the past years (Figure 13). Yet, outward stock
and flows are a visibly tiny fraction of inflows and its corresponding stock.
Figure 14
-5.0
5.0
15.0
25.0
35.0
45.0
55.0
19
70
19
72
19
74
19
76
19
78
19
80
19
82
19
84
19
86
19
88
19
90
19
92
19
94
19
96
19
98
20
00
20
02
20
04
20
06
Developed economies
Developing economies
Tunisia
Inward FDI flows as a percentageof Gross Fixed Capital Formation,
by host region and economy, 1970 - 2006
As a percentage of the gross fixed capital formation, FDI inflows has grown in importance from
9.3% in 2001 to a little over 13 % in 2002 hitting the rather extreme level of 46.6% in 2006. For
outflows, it was insignificant and indicated levels of between 0.0% and 0.5% of GFCF in 2006
(Figure 14)
5.2 Discussing the Net Outward Position (NOP)
In order to determine the IDP stages of each country, changes of NOP (alternatively Net Outward
Investments NOI) position with respect to GDP level for each country are analysed. In the
explanations beforehand it was mentioned that at the first stage of IDP a negative NOI is
accompanied with a low GDP level. As the inward FDI increases, the NOI level of the country
tends to decrease and the GDP level to rise relative to the first stage.

37
A country shifts to the third stage of IDP when its outward FDI begins to increase while its inward
FDI growth rate decreases and the NOI level of the country tends to rise with respect to the
change in its GDP level. At the fourth stage of the IDP, a country’s outward and inward FDI levels
become equal initially and later the outward FDI exceeds the inward FDI. Therefore, the NOI level
of the country increases to positive values. The fifth stage is characterised with rising levels of
both inward and outward investment and the NOI level fluctuates around zero. Appendix V shows
the NOI position of selected MENA countries’ with respect to their GDP levels.
Referring to a study done by Divarcy et al.24 Algeria, Morocco, and Tunisia are at the second
stage of IDP due to their increasing inward and low outward FDI - thus a decreasing NOI level.
However, the NOI and GDP scatters (Appendix V) do not allow one to make a prediction about
their IDP stages. For example, Libya has negative inward FDI over the period, i.e., the foreign
investors have disinvested in the country after the UN sanctions. Also, the political environment of
Iran might have prevented FDI inflows since NOI position of the country is close to zero. In
Kuwait, inward FDI is very low compared to outward FDI stock of the country therefore the NOI
position of the country demonstrates positive values for the period considered.
Although the scatter diagrams suggest that Algeria, Morocco and Tunisia are at the second stage
of IDP, the empirical results do not support this observation for Algeria. Qatar, which has mostly
eliminated FDI restrictions and strengthened legal protections, has location advantages
depending on its natural resources. Tunisia is a little different from Qatar; they have attracted
increasing FDI inflows to industries such as tourism, automobiles, electronics and infrastructure
(UNCTAD, 2004). They have recently begun to attract efficiency-seeking FDI in such industries as
textiles and apparel. This change can be interpreted as a sign of moving to the third stage of IDP
particularly in some industries. Qatar poses a good portrait with its political stability, relatively well
developed infrastructure and an efficient stock market as far as location advantages go.
24 Foreign Direct Investment and Development in MENA Countries, Divarcy et. al

38
Figure 15: NOP of Maghreb Countries compared to other countries
- 300 000
- 200 000
- 100 000
-
100 000
200 000
300 000
400 000
1980
1982
1984
1986
1988
1990
1992
1994
1996
1998
2000
2002
2004
2006
Developed economies
Developing economies
Poland
Algeria
Morocco
Tunisia
Mexico
China
India
in Millions $
Net Outward Position
Trying to depict many countries and their NOP, one can reckon the vast differences between the
two groups developed and developing countries. Not surprisingly, only developed countries
display a largely positive NOP. All other mentioned countires such as Poland, Mexico, China,
India as well as Maghreb countries are negative. China, as an enormous net receiver of FDI, is
visible whereas the others are barely noticeable with this scale.
The graph on the next side (Figure 16) shows that Mexico, India and to a lesser extend Poland
have moved downwards quite rapidly since the early 90s. Less movement is visible in the case of
Tunisia, Algeria and Morocco. This could indicate that those countires are at an earlier stage in
their respective development. Even though the other countries are developing nations (except
Poland, which UNCTAD included in “developed” Europe) a quite drastic difference in the amount
of Inflows vs. Outflows is evident.

39
Figure 16: NOP of Maghreb Countries in relation to Poland, Mexico and India
- 25 000
- 20 000
- 15 000
- 10 000
- 5 000
-
1980
1982
1984
1986
1988
1990
1992
1994
1996
1998
2000
2002
2004
2006
Poland
Algeria
Morocco
Tunisia
Mexico
India
in Millions $
Net Outward Position
Figure 17: NOP of Maghreb Countries
- 3 500
- 3 000
- 2 500
- 2 000
- 1 500
- 1 000
- 500
-
500
1980
1982
1984
1986
1988
1990
1992
1994
1996
1998
2000
2002
2004
2006
Algeria
Morocco
Tunisia
in Millions $
Net Outward Position

40
Even between Maghreb countries, immense differences persist. More variation can be seen from
1996 onwards as Maghreb countries received more inflows of FDI while keeping outflows at a
constant low level. Regarding the whole region, but clearly visible in the case of Morocco, FDI
flows to the Maghreb countries vary greatly from year to year, depending on the country or region
(Figure 17; Table 3). They are influenced by investment opportunities which, in many countries,
are linked to privatisation plans.
The European Union's FDI positions in the MPC more than trebled between 1996 and 2000. In
the latter year, Turkey, Egypt and Morocco alone accounted for nearly 60% of European FDI in
the MPC countries25. In absolute terms, the FDI positions in the Maghreb and Mashrek26 countries
were almost identical in 2000. But when the size of each country's economy is taken into account
(as a percentage of GDP), the presence of European firms is much more noticeable in Maghreb
countries, especially Morocco, than in the Mashrek Countries and (Table 3). Among the Member
States, the Netherlands, France and Germany were the main providers of FDI in the region.
French firms tended to invest in the Maghreb countries, while Dutch and British firms were more
likely to invest in the Mashrek countries (Table 3).
TABLE 327
EU FDI stocks in MPCs in 2000 (EUR mio)Extra-EU CC-13 MPC-12 Maghreb Mashrek Morocco
EU-15 1517186 75326 22936 6420 5353 3285Germany 249647 24095 3138 437 364 212France 232815 7607 3626 1711 654 1252
Italy 67958 4923 2609 903 264 281Netherlands 161993 10353 3731 310 1671 81
Portugal 12064 247 1259 754 504 316UK 442860 3967 - 260 1476 74
Switzerland 127289 - - 222 485 193USA 737771 - 10734 2574 2622 39
adopted from Quefelec, S. (2003)
At around EUR 23 billion, the European Union accounted for more than twice as much FDI in the
MPC countries as the United States in 2000. As in the case of the EU, American FDI positions
have risen sharply since 1994 but they are still low when compared with other parts of the world,
especially South America or Asia. The main destinations for American FDI in the MPC countries
were rather Mashrek countries, especially Egypt (Table 3) The EU has traditionally run a large
25 Quefelec, S. (2003)26 Egypt, Lebanon, Jordan, Syria and Palestine Authority27 CC- candidate countries in 2000: Bulgaria, Cyprus, Czech Republic, Estonia, Hungary, Latvia, Lithuania, Malta, Poland, Romania, Slovakia, Slovenia and Turkey. Mashrek: Egypt, Lebanon, Jordan, Syria and Palestine AuthorityMPC-12: the 12 Mediterranean Partner Countries

41
FDI surplus with regard to the MPC countries. Direct investment by the MPC countries in Europe
in 2000 amounted to EUR 7 237 million (Table 4).
Table 4
FDI stocks of MPCs in EU and USA in 2000 (EUR mio)EU-15 D F I NL UK USA
MPC-12 7237 1090 1040 441 838 942 -Maghreb 1051 - 547 59 2 - -25Mashrek 784 12 272 193 12 128 -5Morocco 539 0 256 38 - - -25
adopted from Quefelec, S. (2003)
Throughout recent year, France was a key player in terms of FDI flows to Maghreb (Appendix VI).
Out of all EU countries, France had the most stable investment flows whereas Morocco was the
main beneficiary. Apart from France, investments above $10 million p.a. were realized by Spain,
the Netherlands, the UK, Italy and Germany.
6. EU and EMFTA Initiatives
In 1995, the Barcelona Process marked a decisive date building on enhancing relations between
15 EU member states and 12 Mediterranean Partner Countries (MPC)28. Through this process,
better collaboration in terms of economic sustainability and the creation of “security and shared
prosperity” is anticipated. By agreeing on setting up a free trade area in 2010, entitled the Euro-
Mediterranean Free-Trade Area (EMFTA), facilitation on interaction and trade is intended
between the EU and MPC. In retrospect, academics seemingly agree that the Barcelona
Process29 falls short of delivering its promises. Hence, to date it remains to be seen what and if
anticipated economic results can be accomplished and if Mediterranean Partner Countries will
benefit eventually. This question is especially of interest and apparent in light of a shift from a sole
focus on MPC via the Euro-Mediterranean Partnership (EMP) and the newly set up European
Neighbourhood Policy (ENP), including all countries bordering the now enlarged EU.
Firstly, this paper shall elaborate upon recent events that shaped the EU-Mediterranean relations
and MPC performance in striving for sustainable economic development, centering its
investigation on North African economic features and possible outcomes in light of the ratification
of the EMFTA. Subsequently, attention is paid to an assessment of financial and economic factors
of the Maghreb countries. Hereby, FDI and import/export performance will be substantial.
28 The EU comprised 15 countries at that time, whereas the Non-European Mediterranean Partner Countries (MPC) included Algeria, Egypt, Israel, Jordan, Lebanon, Morocco, Palestinian Authority, Syria, Tunisia , Turkey, Malta and Cyprus (the latter two are EU members since the EU enlargement on 1.5.2004). Libya has observer status since 199929 The Barcelona Declaration was adopted at the Euro-Mediterranean Conference, 27-28/11/1995. The widest-ranging part of the Work Programme relates to Economic and Financial partnership containing thirteen chapters; the Social, Cultural and Human Affairs section contains eight chapters, while the Political and Security Partnership was the weakest with only three chapters.

42
Concluding, remarks and recommendations for further cooperation in this indispensable area are
systematised.
6.1 Shifting From EMP to ENP
Throughout the now 12 years of continuous efforts between the EU and MPC to foster
collaboration and integration, political and economic events altered the relationship of the EMP.
External as well as internal events changed the determinants of the partnership and thus had to
be included in the adjustment of policy formulations. Before elaborating upon the change from
EMP to ENP, however, it is worthwhile to dig into the concepts lying underneath the EMP,
consequently understanding its impacts for the ENP, lunched in 2003.
6.1.1 Euro-Mediterranean Partnership
The Euro-Mediterranean Partnership (EMP) was the outcome of the Barcelona Declaration held in
1995, constituting a framework of political, economic and social relations. It manifested intentions
to deal with several challenges apparent during these times. Hereby, various determinants lead to
focus attention on the Mediterranean Countries. Firstly, close-knit relations had already been
established (particularly in trade, e.g. for many MPC the major trading partner is the EU)30,
secondly close physical distance with South-European Countries and thirdly a discussion about
the North/South divide with its deepening “prosperity gap” advanced political discussion. Further
factors were political instability, religious extremism and increasing threats of terrorism. Also
population growth with a slacking economy in many MPC furthered young people in the Middle
East and North African Region (MENA) to consider emigrating. Consequently the EU experienced
mounting immigration pressure. (Gavin, 2005)
Other external forces, such as globalisation and the World Trade Organisation (WTO) pressed
towards a further South integration in trade and paved the way to advance Euro-Med relations.
The EMP was perceived as an upgrading of policy to treat the abovementioned challenges and as
a concept of development which would allow for North-South-South integration. It was intended
not only to integrate MPC through the Euro-Mediterranean Free-Trade Agreement (EMFTA), but
also to stimulate South-South integration amongst Mediterranean Partner Countries. This move
signified a shift from bilateralism towards a more multilateral form of commitment with and within
the MPC. The new region-to-region tactic was established on the idea that a simultaneous two
way process of integration would occur. (Gavin, 2005) However, now, after 12 years of
“enhanced” relations, it can be stipulated that the EU has pulled the strings and employed a “top-
down approach”. The multiregional approach was well intended but positive outcomes are scarce.
30 over 70% of Tunisia’s trade is going to and originating from the EU

43
Plainly, it can be said that the Barcelona Process did not live up to its expectations in terms of
socio-economic progress.
Several aspects can be cited as burden on the process. As Gavin puts forth, facing a highly
integrated EU in the North versus fragmentation and internal rivalries in the South, horizontal
integration among MPC aimed too high. Additionally, capabilities were scare were experience was
needed. “No historical experience of transregional integration [existed] and intra-regional trade
was amongst the lowest in the world. Neither was there any institutional framework for regional
integration”. (Gavin, 2005) The EMP was essentially a project negotiated and designed within the
European Union proposed to the MPC on a basis of “take it or leave it”. (Martin, 2000)
Throughout the years, resistance to democratise augmented from the autocratic elites and
religious extremists, which also led to an augmented level of uncertainty and political sensitivity
throughout MENA. Certainly, Brussels persistence on political and economic reforms in
accordance with liberal-democratic ideals is often translated as interference in the handling of
internal affairs and as an attack on the principle of national sovereignty by the Arab governments.
(Pollacco, 2006) In 1998 already, Minasi (Minasi, 1998) predicted that the EMP will further bring
South-South fragmentation because of its “bi-multilateral” nature.
After shortcomings in MPC development and alterations in determinants contributing to the
political agenda, a new policy, including bordering countries of the EU, appeared in 2003. Del
Sarto and Schumacher reason that the EMP underwent “reform pressure”, due to external events
such as 9/11, the downfall of the peace process in the Middle East and the U.S. invasion in Iraq.
Fundamentally, however, was the 2004 EU enlargement, which affected the Southern boundaries,
putting forward amendments of the policy towards the EU’s exterior. Concluding, they propose
that it was the internal “self-centred” focus that led to a “voluntary” switch from the EMP towards
the European Neighbourhood Partnership (ENP).31
6.1.2 European Neighbourhood Partnership
“Wider Europe” was mainly motivated by the EU’s internal dynamics, and
not external factors. More specifically, the ENP is a result of the EU’s
changed composition and geostrategic outlook in view of the last round
of enlargement”. 32
31 ENP Strategy Paper, Communication from the Commission, 2004. (Com 2004) 373. In Del Sarto and Schumacher (2005).32 Ibid.

44
Hailed as new approach to “wider Europe”, Romano Prodi declared the European Neighbourhood
Partnership (ENP) as tool to maintain and create a “ring of friends”.33 According to the European
Commission, the declared aim of the ENP is to “share the benefits of the EU’s enlargement with
neighbouring countries in strengthening stability, security and well-being”.34 But, due to the
enlargement in 2004, not only did the EU turn into a bigger and more powerful entity, its boarder
and with it, its focus changed. Considering the regional focus of the EMP, a new policy including
all countries bordering the extended EU embraced not only MPC but also e.g. the Balkan states,
Belarus and Ukraine. So, what is in for the new and old neighbours? Since no membership in the
club of EU members is on offer, other means must be valuable benefits to incorporate the ENP
and giving way to reforms. The European Commission put it this way:
Apart from the “traditional” trade preferences and financial assistance, ENP offers:
gradual participation in agencies and programmes in fields such as education, training and
youth, research, environment, culture, audio-visual policy etc.
the European Neighbourhood and Partnership Instrument (ENPI) – more funding and
efficient procedures to support partner countries’ reforms
new forms of technical assistance
improved cross-border cooperation along the EU’s land and maritime borders
a long-term goal of a Neighbourhood economic community for partners who are interested
and carry out the necessary reforms, with help of EU 35
Successively, the questions of what such modification - in firstly policy formulation and secondly
putting MPC on a par with other bordering countries - could imply for MPC becomes apparent.
This will be dealt with in the following section, focusing on benefits and shortcomings of the ENP
addressing MPC.
6.1.3 The ENP Applied
Having observed good intentions and shortages of the Barcelona Process, nothing else remains
to be done besides evaluating the ENP effect on MENA. Considering the Middle East and North
African region it can be argued that the ENP rectifies some shortages of the EMP. Hence, the
EU's policy towards the Mediterranean evokes prospective enhancements, at least in theory.
Three issues of considerable meaning are identified.36
33 Romano Prodi (2002): “I want to see a "ring of friends" surrounding the Union and its closest European neighbours, from Morocco to Russia and the Black Sea.” (http://ec.europa.eu)34 ENP Strategy Paper, Communication from the Commission, 2004. (Com 2004) 373. In Del Sarto and Schumacher (2005).35 http://ec.europa.eu/world/enp/faq_en.htm36 based on Del Sarto et. al 2005

45
1) a bilateral and distinguished approach
2) the principle of “joint ownership”
3) a “carrot and stick sensibility”
Concerning a bilateral and distinguished approach, handling matters on a bilateral and country-to-
country specific approach grants “a far greater opportunity of exerting its political and economic
influence in the neighbourhood”, for the EU. (Del Sarto et. al, 2005)
On the other hand, as for the southern partners, the ENP's bilateral and differentiated focus
increases the opportunity of voicing their particular concerns, as it appeared to be a preferential
way of negotiating with the EU. Many countries, as e.g. Morocco, Israel and Egypt, “never really
appreciated being put into the group of “southern Mediterranean states”, together with real or
potential rivals or foes.” (Del Sarto et. al, 2005) In this line, South-South economic integration
becomes a remote possibility, if not an impossible one. (Pollacco, 2006)
It may also further dialogue in the Middle Eastern peace-process, uncoupling its success or failure
from the future of “regional negotiations” carried throughout the EMP. As Del Sarto et. al stipulate,
it needs to be seen how the EU is about to interact with the peacemaking efforts and Israel’s
specials standing concerning foreign policy.
Secondly, the principle of “joint ownership” poses a positive development. It seeks to grant
ownership of processes to MPC and the EU respectively. This theoretically grants rights and
responsibilities to MPC in conjunction with EU member states. Repeatedly, MPC had criticized the
lack of adequate consultation and involvement in the formulation of the country-specific priorities
of MEDA funding in the framework of the EMP (as argued earlier, the EMP was rather a “top-
down pact”). Thus, it specifies the intensive involvement of the partner states in the path to take
and in the country-specific definition of priorities, termed “Action Plan”.
Lastly, the “carrot and stick sensibility” approach, or positive conditionality, can further place an
improvement to EU-Med relations. The basic idea behind this concept is that reform willing
countries (e.g. Morocco) can fast-track through individual relations with the EU. On the contrary,
reform-reluctant MPC will not benefit from increased aid or trade concessions.
But taken these three potential positive developments into account, explicit incentives still seem
indispensable. So, which incentives is the EU willing - and able - to offer in order to make a
difference in the southern Mediterranean? Indeed, the alleged “carrots” that the EU proposes in

46
order to contribute to socio-economic development and stability in the Mediterranean deserves a
more thorough discussion.
Thus, the next section will discuss the “stalemate” that MPC face through on one hand internal but
on the other hand regional and EU Association Agreements. To overcome these struggles, the
“wider Europe-Neighbourhood” policy thus needs to strengthen the financial dimension of the
ENP. One possible move away from financial measures determining the agenda for reforms could
signify a further step towards “softer” factors, such as cultural dialogue, education and training,
which are urgently needed to foster sustainable economic development in MPC and could grant a
more stable base in society. Though, how are agreements currently enacted between the EU and
MPC?
6.2. Trade and Integration
6.2.1. Association Agreements
A vital component of the implementation of the MPC has been the implementation of Euro-
Mediterranean Association Agreements (AA) between the European Union and nine of its
Mediterranean Partners to replace the 1970s Cooperation Agreements. With the conclusion of
negotiations with Syria (October 2004), the framework of AA with MPC has been completed. AA
are in force between the EU and Tunisia (since 1998), Israel (2000), Morocco (2000), Jordan
(2002), Egypt (2004) and on an interim basis with the Palestinian Authority (1997). Agreements
were signed with Algeria in December 2001, and with Lebanon in January 2002.37
Provisions of the AA governing bilateral relations differ from one MPC to the other; as time has
gone on more areas of cooperation have been included. Yet several characteristics are
communal38:
Political dialogue
Respect for human rights and democracy
Establishment of WTO-compatible free trade over a transitional period of up to 12 years
Provisions relating to intellectual property, services, public procurement, competition rules,
state aids and monopolies
Economic cooperation in a wide range of sectors
Cooperation relating to social affairs and migration (including re-admission of illegal
immigrants)
Cultural cooperation
37 http://ec.europa.eu/external_relations/euromed/med_ass_agreemnts.htm38 Ibid

47
Throughout the years the AA and bilateral negotiations led to the creation of a network of North-
South trade agreements, but leaving out institutional enablers for South-South integration. Those
institutions were also missing when facilitating investment in the region. Gavin (Gavin, 2005)
proclaims that “no institutional provisions for increasing intra-regional trade or attracting foreign
direct investments by creating a large regional market have emerged.”39
The process to decide on projects and financial assistance was carried out through Country
Strategy Papers (CSP). Those, established for the period 2002-2006 were almost solely
processed by the EU Commission. “The EU has not involved civil society in the process on the
grounds that it was more important to support civil society through technical assistance to make it
stronger before it could be accepted as an actor in the negotiating process. The unilateral nature
of decision-making on financial and technical assistance makes this a donor dominated rather
than a mutually agreed development instrument.”40
Nowadays, those CSP are substituted by Action Plans, identified on a country specific level inside
the ENP framework. Those Action Plans “ensure that both the EU and its partners take full
advantage of the trade provisions in existing bilateral agreements by ensuring their full
implementation and taking account of regional initiatives.”41
The European Commission perceives potential in the market opening in line with WTO principles,
deeper liberalisation and regional integration. A removal of non-tariff barriers to trade through
convergence of legislative and regulatory frameworks in crucial sectors such as intellectual
property rights is emphasised. Furthermore, by establishing transparency, predictability, and
simplification of ENP countries’ rules the investment climate could be enhanced.42 Summing up:
good advice and a long way to go. But, what directions are taken?
40 http://ec.europa.eu/external_relations/euromed/med_ass_agreemnts.htm41 “Strengthening the ENP” Communication. Finches on Sectors. 200242 Ibid

48
6.2.2. The Euro-Mediterranean Free Trade Agreement
As the European Mediterranean Free-Trade Area (EMFTA) is about to be enacted in the near
future43, one might emphasise its impact on the EU, its neighbouring countries, partners, and it
affecting various aspects such as politics, economics, environmental, social and cultural
determinants.
This final chapter will argue that the EMFTA in its current configuration is not sustainable. It is
essential to find a critical and progressive approach to establish Europe’s legitimacy and believe
in its success, as a project taking into consideration its contextual particularity. This is chiefly valid
when reviewing those fundamental changes that firstly lead to the EMP and secondly altered the
approach to set up the ENP. Seconding that, Attinà and Rossi (2004) declare that “a step-by-step
or progressive approach towards EU neighbouring countries is required in order to introduce a
gradual engagement for each state depending on its willingness to progress with economic and
political reform.” Employing a top-down approach and controlling progress does not lead to a
natural upgrading conform to contextual settings.
To establish a remark, financial data will be used to examine the economic factors influencing and
driving MPC as well as to ascertain their role in the EMFTA. Firstly, export and import
performance of MPC will be analysed while ultimately scrutinizing FDI in and outflows.
The EMFTA as such has to be put into context where Euro-Mediterranean Association
Agreements are the integral legal framework negotiated between the European Union and 9 of
the 12 Mediterranean Partners, together with Free Trade Agreements between the Mediterranean
Partners themselves. For Turkey, Cyprus and Malta, relations were governed by pre-existing
Association Agreements providing inter alia for the progressive establishment of customs unions.
Nowadays, Malta and Cyprus have joined the EU and even became member of the Euro.
Grasping the European Economic Area, the Central and Eastern European Countries and the
EMFTA Partners, this free trade zone could eventually include some 40 States and 600-800
million consumers rendering it one of the world’s most important trade entities. (European
Commission, 2003). But, before this date approaches many battles still need to be fought. As
demonstrated in section 2 several events lead to the creation of a common policy for the MPC.
Thus, single future agreements depend on internal and external factors, sometimes even far-
reaching single events such as 9/11, are leading to partially unforeseen constellations. Those,
consequently, give way to fresh thoughts and adaptations in external policy formulation. For
instance, the recent EU-Africa summit in Portugal (Dec. 2007) showed how deep gaps between
43 The Barcelona Declaration puts forth 2010 as date, but recent appraisals of economic, social and political factors in MPC beg for a re-evaluation and probable postponement.

49
EU and some African states are. Furthermore, France’s newly elected president Sarkozy, in his
solo attempt to solve the “Bulgarian nurses affair” and later on selling nuclear power to Libya’s
leader Gaddafi, is a clear indication of the non-existing common EU foreign policy. On the other
hand, he is advocating the creation of a Mediterranean Bloc quite energetically which could lead
to a new wave of engagement with and in the region.44 Another interesting internal development
is, at last, the EU treaty (the Treaty of Lisbon), which was agreed upon throughout the Portuguese
EU presidency45. This could imply more coherence in the EU’s action towards the outer world.
6.2.3. The Role of (Free-) Trade
Free-Trade and particularly Foreign Direct Investments are deemed paramount to MPC. The EMP
included relatively minor considerations in regards to FDI, whereas through the later process and
AA, MPC realized that FDI is an option to foster economic performance and to counterbalance
initial displacement costs and budget constraints.
According to trade literature a country performs in relation with the products it produces. Hereby,
more variety in the product portfolio signifies broader chances to trade and benefit from
agreements with other nations. As the World Bank (2006) puts it, “a likely success (or failure) of
regional trade agreements is partly contingent on the range of products that prospective members
have the capacity to export. If the members export a wide range of diversified goods, this is a
positive factor.”
If, by contrast, exports are highly concentrated, regional trade may be burdened. The underlying
assumption is that the higher the level of export diversification, the better the prospects for a
successful regional trade agreement. The more diversified a country’s exports the greater the
range of potential products that can be traded with regional partners. If only a limited number of
such goods exist, prospective members of a Regional Trade Agreement (RTA) may have to rely
heavily on third countries for a higher share of its key imports and as a destination for their key
exports, and this would be likely to reduce their commitment to the RTA. (Yeats, 1998)
Another factor of export concentration is the question of stability. Some studies show that
countries with highly concentrated exports may experience a relatively high degree of export
earnings instability – a factor that makes economic planning difficult. Such unsteadiness could
encumber a country’s ability to consistently preserve financial commitments required by a regional
arrangement.
44 http://www.iht.com/articles/2007/05/10/africa/france.php45 http://www.eu2007.pt/UE/vEN/

50
Examining Maghreb countries, the World Bank (WorldBank, 2006) denotes that Maghreb
countries export a low range of products compared with other regional groupings, although they
have increased product variety over time. Maghreb exports seem to be confined to a few products
that is, a small number of products seem to accumulate a significant share of export revenues.
Maghreb’s average range of products exported in 2004 was 100, half the range of products
exported by other regional trading blocs. NAFTA and EU15 exported over 220 items in 2004.
Eastern European Counrtries and ASEAN countries also doubled the Maghreb countries in the
range of products exported in 2004. (WorldBank, 2006)
The regional average masks differences among Maghreb countries. Looking at more
disaggregated country data over recent years, the picture is slightly more encouraging. Tunisia
and Morocco increased average product variety from about 100 to over 150 over the period 1980-
2004.
Tunisia and Morocco’s exports are still dominated by textiles and apparel. Most exporters
specialize in subcontracting and process imported inputs. For Algeria, fuels are by far the largest
product group in its export bundle. High market and product concentration are clearly a source of
vulnerability for Maghreb exports and play against future prospects for regional merchandise trade
integration. Despite this, especially since the 1990s, Morocco and Tunisia have shown some
signs of diversification. Tunisia and Morocco managed to bring the product concentration index to
a level percent and 20 percent lower, respectively, in 2004 that the one that existed in 1980.
In regards to assessing possible gains of losses derived from the EMFTA, it is essential to
examine key variables impacting on the success or failure. Tovias (Tovias, 1997) elaborates on
the degree of openness of MENA countries, the level of tariffs (most-favoured nation), fiscal
revenues drawn from international trade taxes and the actual contents of the agreements. As the
AA have been dealt with already, imports and exports are used to exhibit the degree of openness
while furthermore tariffs and fiscal revenues will give insight into economical performance of the
MPC, to finally appraise the likely impact of the EMFTA on MPC.
6.2.3.1. Exports
Considering data from 1993, it appears that MPC are highly engaged with EU countries (except in
the case of Jordan), exporting more than a third of their shipments to the EU and reaching two-
thirds or more in the case of Algeria, Morocco and Tunisia. One the other hand, the share of other
MPC exporting to other MPC is almost negligible in some cases. Figures range from 18.0 percent
in Syria down to 0.9 in Israel. Since Syria, Egypt and Jordan are the only countries with two digit
percentages, this leads to conclude that not much interregional export trade is taking place. Also

51
the relatively small share in interregional trade of more developed countries like Israel (0.9%),
Morocco (6.2%), Tunisia (9.6%) and Turkey (7.3%) fits this picture.
Table 5 Exports of Selected MPC (1993 and 2004)46 in % of total ExportsAlg Egy Isr Jor Mor Syr Tur Tun
93 04 93 04 93 04 93 04 93 04 93 04 93 04 93 04
To EU
67.6 54.0 45.9 34.8 29.6 27.8 6.6 3.2 69.7 74.4 58.3 53.9 44.2 55.3 79.9 83.3
To other MPC
1.7 6.9 5.5 13.6 0.9 2.6 8.6 11.2 6.2 2.5 18.0 16.6 7.3 6.4 9.6 3.2
Table I indicates data of the MENA region, its export patterns with the EU and among its region.
When focusing on the development of exports throughout the yeas from 1993-2004, a decrease in
exports from the EU becomes apparent (except Morocco, Tunisia and Turkey). At the same time,
all countries engage in more intra-regional trade with the other MEDA countries (except again
Morocco, Tunisia and Turkey). In the case of Morocco and Tunisia, a quite strong dependency in
trade patters can be displayed. Having reached 74.4% and 83.3% (in 2004) respectively, signifies
strong ties with the EU and dependency.
Highlighting Maghreb countries, the World Bank (World Bank, 2006) describes a high degree of
market concentration with the European Union as the most important trading partner. The
geographic destination of trade for the Maghreb region is driven significantly by proximity. The EU
is the main source of exports and import destination for the Maghreb countries, constituting over
65 percent of total trade by 2004 while the share of exports going to the EU is 70 percent. The
high market concentration points to the vulnerability of the Maghreb region to changes in
European market access conditions. Maghreb exports to other MENA countries as a share of total
exports from the Maghreb increased from 2 percent in the 1980s to 3 percent in 2004 while the
import share expanded from 5 percent in the 1980s to 6 percent by 2004.
Another way to look at it is regarding different product breakdowns. Certainly, if exports are higher
than imports, the balance of payments of this respective country will most likely benefit. So does
selling more goods and services overseas – a rise in exports – boosts national income and should
have a positive multiplier effect on output, national income and employment. This however is not
the case for the majority of MPC.47 Additionally, the sort of export which is delivered to other
parties can alter an economy drastically. By and large, it is argued that bundled exports in just a
few goods and industries (e.g. oil, gas and resources) are not as sustainable as a wider export 46 Ibid and data for 2004 from Euro-Mediterranean Statistics, 2006 edition. Lebanon and West Bank and Gaza strip are excluded due to lack of data. This fact slightly affects trade with other MPC 2004 data, but rather marginally since imports and export rates are among the lowest.47 Especially Algeria pose a variation, which will be discussed in short

52
portfolio including various types of goods. Countries that have abundant supply of one resource
could even get locked into an “export dependency”.
Considering the product breakdown (Appendix I), six main categories of products are listed.
These range from food to machinery and all have a distinctive industry behind them. One
realisation is that the total value of products to North Africa is about 60% of the total exports from
Africa. From these 60%, close to everything originates from Morocco, Algeria, Egypt, Tunisia and
Libya. However, within these five states, huge differences exist. To summarize, Libya and Algeria
export the bulk of products (about 65%) to the EU. Interestingly, these consist mainly (in the case
of Libya solely) of energy resources. machinery, manufacturing goods and chemicals are on the
“shopping list” of MPC. Yet, Libya is lacking behind in purchasing power. Other exports such as
machinery, food and raw materials are basically non-existent. One the other hand, Morocco,
Tunisia and to lesser extend Egypt, portrait a more balanced export portfolio, where machinery,
manufacturing goods and also food (in the case of Morocco) add up to their economic
performance. Generally speaking, however, exports of the region are small, non-dynamic, and
poorly diversified. (Müller-Jensch, 2005).
Now, having displayed some particularities of MPC regarding exports, one has to consider the
other side of the coin and review imports and specifically what sort of imports are demanded by
MPC.
6.2.3.2. Imports
Considering data from 1993 again, it appears that the MPC are highly import dependent on the
EU, with more than a third of their imports coming from there and reaching two-thirds or more in
the case of Algeria and Tunisia. One the other hand, the share of other MPC importing from other
MPC is almost negligible in some cases. From 11.0 percent in Jordan down to 0.5 in Israel leads
to conclude that not much interregional trade is taking place. Also the small share of Turkey
(2.8%) and Egypt (1.9%) add to this picture.
Table 6 Imports of Selected MPC (1993 and 2004) in % of total Imports
When focusing on the development of imports throughout the yeas from 1993-2004, a decrease in
imports from the EU becomes apparent (except in the case of Turkey). At the same time, just a
Alg Egy Isr Jor Mor Syr Tur Tun
93 04 93 04 93 04 93 04 93 04 93 04 93 04 93 04
From EU
65.7 54.8 39.0 26.6 49.2 41.0 34.8 23.6 58.8 56.1 38.2 16.1 45.2 46.6 72.7 69.8
From other MPC
4.3 5.8 1.9 7.4 0.5 3.0 11.0 11.5 4.5 4.1 9.3 10.6 2.8 3.0 4.4 4.3

53
few countries engage in more intra-regional trade with the other MEDA countries. (Egypt and
Israel increased its trade, but 7.4% or 3% respectively is still very low). Thus it can be concluded
that the EU stake in imports to the MEDA has decreased, which can be interpreted as beneficial,
since imports from various “parties” can spread risk and diversify investments. Bluntly put, MEDA
is decreasing its dependency from the EU. This is, however, simplistic and a narrow look has to
be taken on what sort of imports and exports are sought after by MEDA countries.
Taking into account the product breakdown (Appendix II), the six main categories of products are
listed again. One realisation is that the total value of products to North Africa is about 45% of the
total imports from Africa. From these 45%, close to everything goes to Morocco, Algeria, Egypt,
Tunisia and Libya. However, within these five states, drastic differences persist. Above all
machinery, manufacturing goods and chemicals are on the “shopping list” of MPC. Yet, Libya is
lacking behind in purchasing power, concerning EU trade. That these imports and exports are a
vital source of income or consumption for a countries citizen is granted. If problematic trade terms
exist for certain industries, countries can engage in protectionist behavior and establish or
heighten tariffs or quotas. These are also a vital source of income for the state, but shall be
progressively abandoned through the ratification of the EMFTA. In the next chapter tariffs and
fiscal revenues of MPC are scrutinized to ascertain their momentum.
6.3 Policy Reform and Regulation through Tariffs
Bearing in mind the development of free trade in the Mediterranean Area through EMFTA
directives, tariff and non-tariff barriers to trade in manufactured products will be progressively
eliminated in accordance with timetables to be negotiated between the EU and MPC. Taking as a
starting point traditional trade flows, and as far as the various agricultural policies allow and with
due respect to the results achieved within the WTO negotiations, trade in agricultural products will
be progressively liberalised through reciprocal preferential access among the parties. Trade in
services including right of establishment will also be progressively liberalised having due regard to
the GATS agreement. Dismantling customs duties requires substantial reforms of fiscal, economic
and industrial sectors. In this context, the MEDA was, and the ENPI will be a programme
providing support to economic reforms in the public and private sector, keeping sustainable
development in mind. (European Commission, 2003)
But, as can be seen in Appendix III, trade barriers still exist, as do tariffs. More generally, taking
average tariffs to exemplify current trade procedures, some points can be established:
Considering the recent findings of the World Banks’ (WB) Economic Development Prospects48, it
can be noted that “relative to the world, tariff reform by MENA since 2000 ranks on average in the
48 WorldBank. Economic Developments & Prospects Job Creation in an Era of High Growth. Economic Development Prospects. 2007. Report
54
top [...], higher than any other region but Europe and Central Asia.” Herein, the region’s resource-
poor countries, e.g. Egypt (9.1%), Jordan (11.8%), and Lebanon (5.4%) performed “best” on
average. (World Bank, 2007) (Appendix III)
On the other hand, even though tariff reforms are underway and progress is perceptible, the
region as such lacks behind in the creation of “an environment conducive for trade remains far
from complete.” Putting the level of tariffs into a broader picture, thus benchmarking the tariff
protection with other regions, an average of 13.1 percent signifies a figure, higher than all other
regions but South Asia and Sub-Saharan Africa, and far higher than the world average of 9.8
percent (Appendix III). In both Tunisia and Morocco, the current simple average tariff is above 26
percent, and the heavy tariff protection of the domestic market has changed only slightly in the
course of the past 10 years. Other nations, such as Algeria and Libya endorse high tariffs 18.7
percent and 17 percent correspondingly. (World Bank, 2007) Even though progressive changes
have been enacted through reforms, governments in this region seem to be somewhat reluctant
to opening up their boarders to free trade completely. Furthermore, due to specific duties or taxes
based on volume, instead of import value, as well as extra import clearance procedures, trade in
imports is cumbersome.
According to a study of the World Bank (World Bank, 2006), Maghreb countries made progress in
tariff reform over the past few years. So did Morocco reduced MFN tariffs to a maximum of 10
percent for goods freely traded with the EU in 2004. The reform progress made by the Maghreb
compares the average tariffs worldwide in 2004 with those in 2000. From this study, the World
Bank denotes clarity that Maghreb countries have managed to reduce trade tariffs since 2000.
However, despite further tariff reductions, the Maghreb countries are still highly protected. Despite
the trade liberalization efforts and the recent signs of dynamism of Tunisian and Moroccan
exports, their penetration into external markets has merely kept pace with the world’s increase in
exports. This recent export performance masks export vulnerabilities that result from still-high
trade protectionism, as evidenced by the high level of the region’s simple average of most-
favoured nation (MFN) tariffs. This protective blanket has converted the Maghreb countries into
one of the ten most highly protected regional markets in the world. This high level of
protection, the World Bank reasons, is a legacy of the import-substitution strategy pursued
following independence in Maghreb states which reduces firms’ incentive to trade, since their
profits often are higher in sheltered markets. In other words, high transaction costs occur.
In Morocco, the high level and dispersion of multilateral tariffs is still a concern. Morocco grants at
least MFN treatment to all its trade partners. Since the end of the Uruguay Round of multilateral
trade negotiations in 1995, Morocco has bound all its duties to rates ranging from 0 to 380

55
percent. According to a study, the simple average external tariff amounted to 30 percent (50.6
percent for agricultural products and 26 percent for manufactures) in 2004. Morocco’s tariff
structure is in general escalatory, such that import duties on raw materials are lower than those on
semi-processed products, which in turn are lower than the tariffs on finished goods (World Bank,
2005). Many of Morocco’s tariffs are regarded as very restrictive, so that little trade in the
respective tariff lines occurs. Thus, the trade-weighted average of MFN import duties is at 23.5
percent, considerably lower than the simple average.
In Tunisia, the simple average tariff was 32 percent in 2004 (with the average duty on agricultural
products being 69 percent; and 23 percent for non-agricultural products). The trade-weighted rate
is still at almost 23 percent for all goods (20 percent for industrial products and 42 percent for
agricultural products). Overall, the tariff structure in Tunisia is characterized by mixed escalation,
with raw materials protected by average rates much higher than those for other categories of
products.
In Algeria, the simple average external tariff is lower than in Morocco and Tunisia amounting to
18.7 percent in 2004 (with the average duty on percent for agriculture products being 23 percent
and 18.1 percent for non-agricultural products)49.
7 Conclusions
Due to recent changes in trade and investment policies between the EU and Maghreb, an
investigation of FDI was deemed essential to shed light on the rather poor performance of MENA
countires and North Africa in particular. Throughout this study, several aspects of Maghreb
countries were portrait while particular focus was placed on the interlinkage between macro
economic policies and FDI.
As research topic, the Mediterranean area is a hot spot where socio-political tensions exist and
limited knowledge about governance, investment policies and related trade regimes is available.
To analyse the chosen region, the thesis is built on a country-based methodology and follows a
macro-level approach analyzing FDI flows to answer the research questions.
In many ways have investment policies and trade patterns affected FDI. Those initial agreements
in Barcelona in 1995, sparked little by little reforms in Maghreb countries. Even though Maghreb
countries may still be regarded as highly protected, more trade and FDI flows are obvious.
Comparing the three countries, Algeria appears to be the least diversified in terms of trade and
49 WorldBank. 2007

56
FDI. Morocco and Tunisia trade with a broader base of EU members and offer more variations for
investments. However, a high dependency on Europe’s progression (France in particular)
illustrate that this can only be the beginning of a deeper global integration. To climb up the stages
of the IDP (from 2 to 3), a stronger business economic base has to be established so that more
stable outflows and inflows emerge.

57
References
Books and Articles:Attiná, F. Rossi, R. The European Union Neighbourhood Policy, Jean Monnet Project, Catania,
2004A.T. Kearney, Foreign Direct Confidence Index. 2005Bandera, V.N. and J.T. White (1968). “U.S. direct investments and domestic markets in Europe”,
Economia Internazionale, 21, pp. 117-133.Barney, J. B. (1999). How a Firm's Capabilities Affect Boundary Decisions. Sloan Management
Review(Spring 1999), 137-145.Bashir, A. and Hassan, M. (2002) Financial Development and Economic Growth in the Middle
East, University of New Orleans Working Paper.Bass, B. M., McGregor, D. W. and Walters, J. L. 1977. “Selecting Foreign Plant Sites: Economic,
Social and Political Considerations”. Academy of Management Journal, 20, 535-551Bellak, 2001Bollen, Kenneth A. and Scott T. Jones. 1982 . “ Political Instability and Foreign Direct Investment:
The Motor Vehicle Industry, 1948-65”. Social Forces.60, 1070-1088.Brown, D., & Wilson, S. (2005). The Black Book of Outsourcing. How to Manage the Changes,
Challenges, and Opportunities. Hoboken, New Jersey: Wiley & Sons.Chandler, A.D. Jr. (1962), Strategy and Structure; Cambridge: The MIT Press and Chandler, A.D.
Jr. (1977), The Visible Hand; Harvard University Press.Coase, R. H. (1937). The Nature of the Firm. Economica, New Series, 4(16), 386-405.Eid, F. and F. Paua (2003) Foreign Direct Investment in the Arab World: The Changing
Investment Landscape, World Economic Forum, Arab Competitiveness Report 2002-2003:108-119.
Divarcy, A. Hisarcyklylar, M., Kayalica, O., & Kayam, S. () Foreign Direct Investment and Development in MENA Countries
Dicken, P. (2003). Global Shift - Reshaping the global economic map in the 21st century (Four ed.). London: Sage
Del Sarto, R.A. Schumacher, T. From EMP to ENP: “What’s at stake with the European Neighbourhood Policy towards the Southern Mediterranean?”. European Foreign Affairs Review 10. 2005.
Dubois, A., & Pedersen, A.-C. (2002). Why Relationships Do Not Fit into Purchasing Portfolio Models - A Comparison Between The Portfolio And The Industrial Network Approach. European Journal of Purchasing & Supply Management, 8, 35-42.
Dunning, J. H. 1973 . “ The Determinants of International Production. Oxford Economic Paper. No 25, 289-336.
Dunning, J.H. (1981) Explaining the International Direct Investment Position of Countries: Towards a Dynamic or Developmental Approach, Weltwirtschaftliches Archiv, 117: 30-64.
Dunning, J.H. (1988) Explaining International Production, London: Unwin Hyman.Dunning, J.H. (1992). “The competitive advantage of countries and the activities of transnational
corporations”, Transnational CorporationsDunning, J.H. (1993) Multinational Enterprises and the Global Economy, Reading: Addison
Wesley.Dunning J.H. 1995. "Reappraising the Eclectic Paradigm in an Age of Alliance Capitalism,"
Journal of International Business Studies, Vol. 26, No. 3, pp. 461-491.Dunning, J.H. (2000) The eclectic paradigm as an envelope for economic and business theories
of MNE activity, International Business Review, 9(1): 163-90.Dunning, J.H. and Narula, R. (1996) The investment development path revisited: some emerging
issues, in J.H. Dunning and R. Narula (eds.) Foreign Direct Investment and Governments, London: Routledge.
Driffield, N. and A.H.M. Noor (1999). “Foreign direct investment and local input linkages in Malaysia”, Transnational Corporations
Dyer, J. H. (1997). Effective Interfirm Collaboration: How Firms Minimize Transaction Costs and Maximize Transaction Value. Strategic Management Journal, 18(7), 535-556.

58
Dyer, J. H., & Singh, H. (1998). The Relational View: Cooperative Strategy and Sources of Interorganizational Advantage. Academy of Management Review, 23(4), 660-679.
Espino-Rodriguez, T. F., & Padron-Robaina, V. (2006). A review of outsourcing from the resource-based view of the firm. International Journal of Management Reviews, 8(1), 49-70.
European Commission. Terms of Reference. Sustainability Impact Assessment of the Euro-Mediterranean Free-Trade Area. 2003.
European Neighbourhood Policy (2004) Country Report Morocco; The Commission of the European Communities
European Union Foreign Direct Investment Yearbook, Data from 1998-2003. 2005 EditionEuroStat. External and Intra-European Trade. Monthly Statistics, 7/2007.Fatehi, K. and Safizadeh, M. H. 1994 . “ The Effect of Sociopolitical Instability on the Flow of
Different Types of Foreign Direct Investment”. Journal of Business Research, 31, 65-73.Filippaios & Tzioumis (2008). LSE. PresentationGavin, B., The Euro-Mediterranean Partnership. An Experiment in North-South-South Integration.
In Intereconomics. 2005Gillespie, R. The Euro Mediterranean Partnership. 2005Golafshani, N. (2003). Understanding Reliability and Validity in Qualitative Research. The
Qualitative Report, 8(4), 597-606.Goodnow, J. D. and Hansz, J. E. 1972 . “ Environmental Determinants of Overseas Market Entry
Strategies”. Journal of International Business Studies, 3, 33-50.Goshal, S., & Moran, P. (1996). Bad for Practice: A Critique of the Transaction Cost Theory.
Academy of Management Review, 21(1), 13-47.Grant, R. M. (1991). The Resource-Based Theory of Competitive Advantage: Implications for
Strategy Formulation. California Management Review, Spring 1991, 114-135.Gray (1982)Gummesson, E. (2000). Qualitative methods in management research. Thousand Oaks, London,
New Delhi: Sage Publications.Handfield, R. B., & Nichols, E. L. (2002). Supply Chain Redesign. Transforming Supply Chains
into Integrated Value Systems. London: Financial Times Prentice Hall.Hassan and Bashir, 2002; Hennart, J.-F. (1991). The Transaction Cost Theory of the Multinational Enterprise. In P. Sudgen
(Ed.), The Nature of the Transnational Firm (pp. 81-115): Routledge.Hunya, G. (2006) How to assess the impact of FDI on an economy? Wiiw, September 2006, 1st
draftJohanson and Vahlne, 1977; 1990Kobrin, S. J. 1978 . “ When Does Political Instability Result in Increased Investment Risk?” The
Columbia Journal of World Business, 13, 113-122.Kraljic, P. (1983). Purchasing Must Become Supply Management. Harvard Business Review
(September-October 1983), 109-117.Makdisi, S., Z. Fattah and I. Liman (2002) Determination of Growth in the MENA Countries, Arab
Planning Institute Working Paper.Martin, I. (2000) The Euro-Mediterranean Partnership and Inward FDI in Maghreb Countries.Miller, K. D. (1993). “Industry and Country Effects on Managers’ Perceptions of Environmental
Uncertainties”. Journal of International Business Studies, 24, 693-714.Minasi, N. The Euro-Mediterranean Free-Trade Area and its impact on the Economics Involved.
1998Neuman, L. W. (2000). Social Research Methods. Qualitative and Quantitative Approaches (4
ed.): Allyn & Bacon.Olsen, R. F., & Ellram, L. M. (1997). A Portfolio Approach to Supplier Relationships. Industrial
Marketing Management, 26, 101-113.Penrose, E.T., (1959), The Theory of the Growth of the Firm, New York: Wiley.Pauly, Louis, W, and Reich, Simon. 1997 . “ National Structures and Multinational Corporate
Behavior, Enduring Differences in The Age of Globalization”, International Organization, 51, 1-30.

59
Pollacco, C. Whiter the Euro-Mediterranean Partnership. In The Mediterranean: The EuropeanUnion’s “Near Abroad”. 2006.
Quefelec, S. (2003) European direct investment in the Mediterranean countries, Statistics in Focus, Theme 2 – 13/2003
Penrose, E.T., (1959), The Theory of the Growth of the Firm, New York: Wiley.Porter, M. E. (1986). Competing in Global Industries Cambridge: Harvard Business School.Prodi, R. Speech by Romano Prodi, President of the European Commission "Peace, Security And
Stability International Dialogue and the Role of the EU" Sixth ECSA-World Conference. Jean Monnet Project, Brussels, 5-6 December 2002 (http://ec.europa.eu/external_relations/news/prodi/sp02_619.htm)
Prahalad, C. K., & Hamel, G. (1990). The Core Competence. Harvard Business Review (May-June).
Root, F. R. and Ahmed, A. A. 1979 . “ Empirical Determinants of Manufacturing Direct Foreign Investment in Developing Countries”. Economic Development and Cultural Change, 27751-767.
Sarkis, J., & Talluri, S. (2002). A Model for Strategic Supplier Selection. The Journal of Supply Chain Management, Winter 2002, 18-28.
Saunders, M. (2003). Research Methods for Business students. London: Pearson Higher Education.
Schneider, F. and Frey, B. 1985 . “ Economic and Political Determinants of Foreign Direct Investment”, World Development, 13.
Sekaran, U. (2003). Research Methods for Business. A Skill Building Approach (4 ed.). Hoboken, NJ, USA: John Wiley & Sons, Inc.
Skjøtt-Larsen, T. (2007). Design and management of supply chain relationships – a theoretical framework. In W. T. K. Delfman (Ed.), Strategic Supply Chain Design. Theory, Concepts and Applications (pp. 83-108). Köln: Kölner Wissenschaftsverlag.
Skjøtt-Larsen, T., Schary, P. B., Mikkola, J. H., & Kotzab, H. (2007). Managing the Global Supply Chain (3 ed.). Copenhagen: Copenhagen Business School Press.
Soliman, M. Foreign Direct Investment and LDCs Exports: Evidence from the MENA Region http://www.mafhoum.com/press6/173E14.pdf.
Stigler, G.K., (1961), The Economics of Information, Journal of Political Economy, pp.213-225.Stopford, J.M. and Wells, L.T. 1972. Managing the Multinational Enterprise: Organization of the
Firm and Ownership of the Subsidiaries, New York: Basic Books.Strengthening the ENP. Communication. Finches on Sectors. 2002The Commission of the European Communities, European Neighbourhood Policy: Country Report
Morocco, 2004Tovias, A. The Economic Impact of the Euro-Mediterranean Free Trade Area on Mediterranean
Non-Member Countries. In Gillespie, R. The Euro-Mediterranean Partnership. 1997.Tsai, P. (1994). “Determinants of foreign direct investment and its impact on economic growth”,
Journal of Economic Development, 19, pp. 137-163.UNCTAD, Foreign Direct Investment Database, www.stats.unctad.org.UNCTAD. Handbook of Statistics. 2006UNCTAD, Handbook of Statistics Online Database, www.stats.unctad.org.UNCTAD (1998) World Investment Report, Trends and Determinants, Geneva: United Nations.UNCTAD (2003) World Investment Report, FDI Policies for Development: National and
International Perspectives, Geneva: United Nations.UNCTAD (2004) World Investment Report, The Shift Towards Services, Geneva: United Nations. UNCTAD (2006) World Investment Report, FDI From Developing and Transition Economies:
Implications for Development, Geneva: United Nations. UNCTAD World Investment Directory; Country Profile: Algeria, 2002UNCTAD World Investment Directory; Country Profile: Morocco , 2002UNCTAD World Investment Directory; Country Profile: Tunisia, 2002Welfens, Paul, J. J. 1993 . “ The growth of the private sector: Privatization and foreign direct
investment in Eastern Europe”, pp. 119-166, in Overcoming The Transformation Crisis.Williamson, O.E., (1975), Markets and hierarchy: Analysis and antitrust implications, New York:
Free Press.

60
Williamson, O. E. (1979). Transaction-Cost Economics: The Governance of Contractual Relations. Journal of Law and Economics, 22(2), 233-261.
Williamson, O. E. (2002). The Theory of the Firm as Governance Structure: From Choice to Contract. The Journal of Economic Perspectives, 16(3), 171-195.
Wheeler, D and Mody, A. 1992 . “ International investment location decisions: the case of US firms”. Journal of International Economics, 33, 57-76.
World Bank. Middle East and North Africa Region Strategy Paper, Washington DC 2004. Yeats, Alexander J. 1998. What can be expected from African regional trade agreements? Some empirical evidence. Washington, D.C. : The World Bank. Policy Research Working Paper no. WPS2004.
Yeats, A.J. (1998), ‘What Can Be Expected from African Regional Trade Arrangements? SomeEmpirical Evidence’, World Bank Working Paper No. 2004.
Yin, R. K. (2003). Case study research - Design and methods. Thousand Oaks: Sage Zaman, R. Flow of Foreign Investment: An Examination of Economic and Non-Economic Factors
The International Journal of Finance • VoL 16, No. 1, 2004
Internet
Central Bank of Algeriawww.bank-of-algeria.dz
Central Bank of Moroccohttp://www.bkam.ma
Central Bank of Tunisiawww.bct.gov.tn
BBChttp://www.bbbc.uk
EU http://ec.europa.eu/external_relations/euromed/med_ass_agreemnts.htm
http://ec.europa.eu/world/enp/faq_en.htm
http://www.eu2007.pt/UE/vEN/
http://www.iht.com/articles/2007/05/10/africa/france.php

61
Annex
Appendix I: Product Breakdown of EU25 Trade by main Partner Country – Exports of MPC
2006
Value (Million Euro) and variations (%)
Source: EuroStat. External and intra-European Trade. Monthly Statistics, 7/2007.
Total
Food
beverages
and tobacco
Raw
MaterialsEnergy
Chemical
Products
Machinery
and
transport
equipment
Miscellaneous
Manufacturing
Goods
Value 06/05 Value 06/05 Value 06/05 Value 06/05 Value 06/05 Value 06/05 Value 06/05
Africa 123,961 13,5 10,575 -0.9 7,162 17.7 64,433 21.2 2,454 20.8 7,596 -26.6 23,027 10.4
NorthAfrica
72,084 16.7 2,262 1.5 1,690 42.2 45,500 21.8 1,575 31.2 3,466 -40.8 9,072 8.8
Mor 7,206 -20.5 1,569 0.6 643 25.1 292 14.5 300 3.8 1,232 -63.7 3,110 4.5
Alg 23,970 14.8 47 -8.8 157 91.2 16,980 10.6 211 10.4 55 -89.1 139 99.0
Egy 7,504 45.4 405 12.1 224 18.1 4,208 76.7 454 86.2 267 -35.4 1,849 21.0
Tun 7,598 11.8 226 -2.4 630 65.1 812 0.4 242 0.4 1,880 25.0 3,781 4.3
Lib 25,763 30.0 1 . 35 72.1 23,208 25.0 367 56.5 13 -47.8 188 34.3

Appendix II : Product Breakdown of EU25 Trade by main Partner Country – Imports of MPC
2006
Value (Million. Euro) and variations (%)
Source: EuroStat. External and intra-European Trade. Monthly Statistics, 7/2007.
Total
Food
beverages
and
tobacco
Raw
MaterialsEnergy
Chemical
Products
Machinery
and
transport
equipment
Miscellaneous
Manufacturing
Goods
Value 06/05 Value 06/05 Value 06/05 Value 06/05 Value 06/05 Value 06/05 Value 06/05
Africa 91,614 5.9 7,683 11.5 2,587 20.8 6,463 32.8 10,938 7.8 40,704 -2.4 21,842 11.9
NorthAfrica
42,137 -1.5 3,256 3.6 1,834 21.6 3,193 17.9 5,076 6.2 16,304 -16.3 12,097 11.8
Mor 10,252 -12.9 506 -9.4 445 20.9 1,007 38.9 1,081 13.2 3,711 -36.8 3,400 6.0
Alg 9,824 -5.7 1,223 3.1 291 23.2 203 14.8 1,323 -0.7 4,259 -23.8 2,447 34.7
Egy 8,807 6.3 584 2.3 729 34.0 261 28.1 1,514 7.2 3,781 1.0 1,819 5.8
Tun 8,616 8.9 298 32,7 229 1.2 922 3.4 813 8.0 2,882 8.5 3,413 9.6
Lib 3,656 2.9 389 10.0 107 1.6 635 3.6 257 3.8 1,458 1.0 800 5.0

63
Appendix III
Source: WorldBank. Economic Developments & Prospects. Job Creation in an Era of High Growth.
Economic Development Prospects. 2007. Report. Page 100.

Appendix IV
FDI Outward and Inward Stocks & Flows according to region, from 1980-2006Region/economy 1980 1981 1982 1983 1984 1985 1986 1987 1988 1989 1990 1991 1992 1993 1994 1995
Outward STOCK Algeria 98 113 124 139 153 156 150 165 170 178 183 183 183 183 183 183
Inward STOCK Algeria 1 525 1 538 1 485 1 485 1 486 1 486 1 492 1 495 1 508 1 521 1 521 1 601 1 631 1 631 1 631 1 631
Outward FLOW Algeria 34 15 11 15 15 2 - 5 15 5 8 5 0 0 0 0 0
Inward FLOW Algeria 349 13 - 54 0 1 0 5 4 13 12 0 80 30 0 0 0
Outward STOCK Morocco 116 116 116 116 116 117 118 126 140 142 155 178 210 233 257 269
Inward STOCK Morocco 1 780 1 839 1 918 1 965 2 012 2 032 2 032 2 092 2 176 2 343 2 508 2 825 3 249 3 740 4 291 4 623
Outward FLOW Morocco .. .. .. .. .. 1 1 8 14 2 13 23 32 23 24 12
Inward FLOW Morocco 89 59 80 46 47 20 1 60 85 167 165 317 424 491 551 332
Outward STOCK Tunisia 6 7 8 7 6 6 7 10 8 13 15 20 23 23 31 30
Inward STOCK Tunisia 3 341 3 346 3 604 3 691 3 589 4 917 4 909 6 218 5 947 5 888 7 615 8 067 8 448 8 725 9 918 10 967
Outward FLOW Tunisia .. 1 4 0 1 1 2 3 0 5 0 4 5 2 8 3
Inward FLOW Tunisia 246 327 371 209 141 139 86 103 76 92 89 173 584 656 566 378
1996 1997 1998 1999 2000 2001 2002 2003 2004 2005 2006
183 183 184 231 249 258 358 372 630 687 721
1 901 2 161 2 768 3 059 3 497 4 693 5 758 6 392 7 274 8 355 10 151
0 0 1 47 18 9 100 14 258 57 35
270 260 607 292 438 1 196 1 065 634 882 1 081 1 795
297 306 330 352 412 512 453 560 676 709 1 343
4 945 6 153 6 613 8 252 8 722 11 597 12 131 17 106 19 885 20 752 29 795
28 9 25 22 60 100 54 20 32 174 468
322 1 207 460 1 639 471 2 875 534 2 429 1 070 2 946 2 898
29 32 34 33 33 32 37 43 47 53 88
11 181 10 629 12 237 11 432 11 545 11 520 13 861 16 239 17 780 16 924 21 779
2 9 2 3 0 6 7 5 4 13 33
351 365 668 368 779 486 821 584 639 782 3 312
Source: UNCTAD FDI database

Appendix V
Scattered Diagrams of the three Maghreb countries (NOP) positioning
(Source: Foreign Direct Investment and Development in MENA Countries, Anil Divarcy, Mehtap
Hisarcyklylar, Ozgur Kayalica, and Saime Kayam)
Appendix VI
VI A: FDI flows in host economy, by geographical origin, 1998-2001
(Millions of dollars)
Source: UNCTAD WID Country Profile: ALGERIA

66
VI B: FDI flows in host economy, by geographical origin, 1996-2004
(Millions of dirhams)
Source: UNCTAD WID Country Profile: Morocco
VI C: FDI flows in host economy, by geographical origin, 1990-2003
(Millions of dollars)
Source: UNCTAD WID Country Profile: Tunisia

67
Executive Summary
The purpose of this paper was to exhibit characteristics of Maghreb countries. Since recent
changes in trade and investment policies between the EU and Maghreb occurred (particularly by
setting up the Barcelona Process in 1995), an investigation of FDI was deemed essential to shed
light on the rather poor performance of MENA countries and North Africa in particular. Throughout
this study, several aspects of Maghreb countries were portrait while particular focus was placed on
the interlinkage between macro economic policies and FDI.
While gathering data on Maghreb countries, the “progression” of the EMFTA leading to a bonding
of the EU and Maghreb countries called for further exhibition in terms of FDI patterns. Thus, this
paper originates out of a set of data and follows an inductive approach which maps out
relationships between theoretical concepts and then moves towards concrete empirical evidence to
confirm or refute theory. Secondary data is also the main source of information for the theoretical
part of this study and for data on the country profiles. I used both the internet and the library to
review relevant articles and books. Numbers on FDI in- and outflows presented were previously
compiled by professionals such as industry organizations, well-established international
organizations acting as an information service for governments and industry, national banks and
non-governmental bodies.
After having discussed the Transaction Cost Theory, Resource Based Theory, Relational View and
Network Perspective in depth, the theoretical discussion embarked on relating those “classic“
theories to the OLI and Investment Development Path. After walking the reader through the stages
of the IDP an own framework is constructed to exhibit macro economic policy formulations and the
dynamics of EU-Maghreb relations. Consequently, and to analyse the chosen region, the thesis is
built on a country-based methodology and follows a macro-level approach analyzing FDI flows.
The following section applies the propositions put forward in my own framework to the case
countries. In order to understand the dynamics and current challenges of the Maghreb countries, a
case approach is employed. Thus, this section starts with a presentation of the current political
agenda surrounding and influencing Maghreb countries. Subsequently, motivations for trade and
potential integration are examined while trends of nation-wide policy formulations are compared.
Later on, a narrow investigation of factor endowments and trade patterns of important industries of
Maghreb depict locational settings while keeping key investors in mind. Concluding, those factors
are tested against my suggestions in a comparative analysis, before a detailed positioning of
68
Maghreb counties, as regarded via the Investment Development Path, takes place. This will
eventually answer the research question about delicate Maghreb FDI patterns.
In many ways do investment policies and trade patterns affect FDI. Those initial agreements in
Barcelona in 1995 sparked little by little reforms in Maghreb countries. Even though Maghreb
countries may still be regarded as highly protected, more trade and FDI flows are obvious.
Comparing the three countries, Algeria appears to be the least diversified in terms of trade and
FDI. Morocco and Tunisia trade with a broader base of EU members and offer more variations for
investments. However, a high dependency on Europe’s progression (France in particular) illustrate
that this can only be the beginning of a deeper global integration. To climb up the stages of the IDP
(from 2 to 3), a stronger business economic base has to be established so that more stable
outflows and inflows emerge.