explaining the returns of active currency managers · pdf fileexplaining the returns of active...
TRANSCRIPT
BIS Papers No 58 211
Explaining the returns of active currency managers1
Sam Nasypbek2 and Scheherazade S Rehman3
1. Introduction
Currency markets have soared to have a trading volume of over $4 trillion a day. The $4 trillion is a 20% gain in the global foreign exchange markets from $3.3 trillion in 2007.4 Over the years, the players in currency markets, the world’s largest financial markets,5 have changed. Traditionally, foreign exchange markets were mostly only a network of bank dealers and electronic trading systems used by (a) investors or corporations needing currency conversion to buy and sell financial instruments (i.e. stocks, bonds, etc.), repatriate profits home from abroad, and/or offset currency risks as part of their daily operations; (b) banks converting cash borrowed from foreign investors; (c) mutual-fund managers managing portfolios and using currency derivatives to offset the risk of currency swings; and (d) currency speculators (mostly interbank). Historically, the interbank market has accounted for the lion’s share of daily volume; large banks not only have provided liquidity to multinational firms and global investors, but also have engaged in speculative activities through their proprietary trading desks.
With the rise of globalization and electronic trading, non-bank players such as hedge funds6 have emerged as major players in the currency market with their share of daily volume matching the interbank as of 2007 (Gallardo and Heath, 2009). With hedge funds and other types of investors more active in currency markets, banks’ traditional role as intermediaries in currency markets has diminished in terms of trading volume. Perhaps even more important is that all types of funds, from hedge funds to mutual funds, are increasingly now using currency markets as a distinct asset class (and not just a venue for an investment to be priced in another currency). “Non-interbank” (non-dealer) trading increased by 49% to $1.9 trillion a day, while trading in the interbank market (amongst dealers) grew by only 11% to $1.5 trillion a day (BIS, 2010). See Table 1. A large part of the rise in “non-dealer” trade and accompanied volatility is attributed to algorithms (trading models that are computer-driven).
In this fray, the number of small investors entering foreign exchange markets (i.e. investing in mutual funds whose core strategy is profits on currency fluctuations) has also dramatically
1 The findings, interpretations, and conclusions expressed in this study are entirely those of the authors and
should not be taken to reflect those of the World Bank, its Executive Directors, or the countries they represent. All errors are our own.
2 World Bank. 3 George Washington University and EU Research Centre. 4 Bank for International Settlements, “Triennial Central Bank Survey of Foreign Exchange and Derivatives
Market Activity in April 2010 - Preliminary global results – Turnover”, http://www.bis.org/publ/rpfx10.htm. 5 By comparison, it dwarfs the stock markets, i.e. the U.S. stock trading averaged approximately $134 billion a
day, and the U.S. Treasury markets which average about $456 billion a day (BIS, 2010). 6 Hedge funds are unregulated private investment vehicles who have historically only been open to wealthy
investors and institutions; they are less constrained in the use of trading strategies and instruments (eg, short selling and derivatives). Many hedge funds actively trade currencies, and until recently only a small segment has had an active “currency only” focus.

212 BIS Papers No 58
increased. Moreover, this demand has led exchange-traded mutual funds7 to greatly enhance their products for small investors so as facilitate their participation in currency markets. There are approximately 44 currency exchange-traded funds (ETFs) currently in 2010, up from 16 ETFs in 2007, and 1 ETF in 2004.
A large portion of the increase amongst the non-bank players in currency markets has also come in the form of public institutional investors and sovereign wealth funds.8 While currency markets have historically been deemed too risky for the investment fund managers who are the designated professional money managers administering pooled investments on behalf of local, regional, or central governments, it would seem there has been a shift and they are now more active players in foreign exchange markets. It should be noted that there is a maze of laws governing the agencies and persons (i.e. trustees) and, therefore, fiduciaries, authorized to make investment decisions on behalf of public agencies. They are subject to what are generally known as strict national prudent investor standards. In the United States, for example, the prudent investor standard is founded upon the presumption that a fiduciary will make the same decisions with respect to the use of public funds that a prudent person, seeking to maintain principal and meet the agency’s cash needs, would make if provided with the same information. American courts have strictly interpreted the fact that fiduciaries must act in the same manner as a prudent person who is familiar with public investing. It should be noted that the large increase amongst the non-bank players in currency markets (especially public investors) has helped shift the notion of a “prudent investment” in the United States as (a) there is a surge of small investors in the currency markets and financial foreign exchange products; (b) currency funds are much more common today than 10 years ago; (c) foreign exchange markets are no longer viewed as the domain of large banks’ treasury rooms; and (d) perhaps even more importantly, currency markets are increasingly being viewed as a distinct “asset class” of their own.
Table 1
Daily turnover in the foreign exchange markets
($ trillions)
Currency trading volumes
1998 2004 2007 2010
Total volume All $1.5 $1.9 $3.3 $4.0
By instrument Spot
Outright forwards
Other: swaps, options
$0.6
$0.1
$0.8
$0.6
$0.2
$1.1
$1.0
$0.4
$2.0
$1.5
$0.5
$2.0
By source Banks
Funds, investors
Non-financial customers
$1.0
$0.3
$0.3
$1.0
$0.6
$0.3
$1.4
$1.3
$0.6
$1.5
$1.9
$0.5
Source: BIS Triennial Central Bank Survey of Foreign Exchange and Derivatives Market Activity, http://www.bis.org/publ/rpfx10.pdf.
7 Exchange-traded mutual funds’ shares trade similar to stocks. 8 Worldwide domestic and foreign financial assets of all central banks and public wealth funds were estimated
to be over $12 trillion in 2007.

BIS Papers No 58 213
As various types of hedge funds have increasingly marketed their currency investment products to outside investors (public fund managers, sovereign wealth funds, and private investors), their historical returns and stated philosophy and strategies have become more publicly available. This has begun to shed light on currency trading strategies. Previously, there was very little data available in this area as the primary participants were interbank (dealers) whose strategies or ROR are not publicly disclosed. Thus, perhaps for the first time in the field of currency trading, we are beginning to understand trading strategies and associated rates of return (ROR).
Given the rise in public sector (local and central government investors, and sovereign wealth funds) and small private investors’ participation in the currency markets, we seek to explain and replicate the profits of active currency managers. It is important to clarify that this study does not argue for or against investing in active currency managers. We hope to develop a venue for enhancing our knowledge and evaluating the management and ROR of existing active currency funds using a currency beta composite index. We believe that such an active currency replication tool can be particularly beneficial to many public institutions facing large currency hedging decisions and considering employing external active currency managers to help manage the risk. An active currency replication index could serve as an alternative redundant risk evaluator or performance gauge that enhances informed choices with respect to currency risk management. Despite extensive literature on exchange rates, few academic studies have provided an in-depth analysis of active currency managers.
As such, in this study we see if it is possible to (a) explain returns of active currency managers9 (the active currency managers used in this study include currency overlay managers, asset management units of large banks, and hedge funds) using simple trading strategies in the historical sample, and (b) replicate individual manager returns out-of-sample using an optimal combination of simple trading strategies. In addition, rolling regressions and Kalman filters are used to build an active currency replication index fund; its performance is then compared with the equal-weighted currency beta portfolio and optimized currency beta portfolios using classical Markowitz and Bayesian approaches.
In this study we specifically examine the profitability of active currency managers and apply a further definition to them as being from those asset management firms that offer strictly profit-oriented currency trading investments. The main purpose of this work is to explain the sources of their profits in-sample and replicate their returns out-of-sample using clearly defined currency trading strategies. We use a large database of 200 active currency managers for which monthly returns are available from 1993 to 2008. We contribute to an emerging literature on active currency managers by applying hedge fund replication methodology to active currency managers and extending previous studies with smaller datasets.
Since hedge funds started reporting their data to major databases, researchers have developed methodologies for replicating hedge fund returns using transparent investable trading rules. Given the less regulated and less transparent nature of hedge funds, the researchers have aimed to understand how these funds made money and whether it was possible to reverse-engineer their trading activities using statistical methods. Since the seminal article in 1997 by Fung and Hsieh, many systematic hedge fund trading strategies have been published (Fung and Hsieh, 1997, 2004, 2006; Schneeweis and Spurgin, 1998; Mitchell and Pulvino, 2001; Agarwal and Naik, 2004; Duarte, Longstaff, and Yu, 2006),
9 Although active currency managers (also sometimes called currency speculators) include market-making
banks (interbank traders), investment firms, and individual investors, this study focuses only on investment firms and includes only currency overlay managers, asset management units of large banks, and hedge funds. From this point onwards in this study we will use the term “active currency managers” to refer only to currency overlay managers, asset management units of large banks, and hedge funds.

214 BIS Papers No 58
including active currency strategies (Lequeux and Acar, 1998; Binny, 2005; Middleton, 2005). These simple or beta strategies help explain the historical returns of different hedge fund sectors, including long/short equity and fixed income arbitrage. Several leading hedge fund researchers have suggested that given the success of historical return analysis and the expensive fees charged by hedge funds, a large portion of hedge fund returns could be replicated at less cost and used for multiple purposes, ranging from an investable index product (Hasanhodzic and Lo, 2007; Fung and Hsieh, 2004) to alternative risk redundancy mechanisms for currency risk management or investment. Thus, replication strategies could be used not only for analysis of past returns but also for index-like investment and risk management.
There is a gap between the academic literature and the practice of active currency management. Active currency trading involves making an informed bet on the direction and/or magnitude of future currency movements using historical and forecasted data. To date, economists have found it very difficult to forecast exchange rates out-of-sample and generally view currency speculation as a futile activity. Because of this skepticism, few academic studies have been conducted on active currency managers. Several investment consulting firms have reported that currency managers, on average, provide positive excess returns to their clients.10 Given the lack of consensus on the optimal model of exchange rate determination, active currency managers use a variety of heuristic trading rules to capture the profit opportunities in the FX market. Researchers at investment banks have summarized the most popular trading strategies used by active currency managers as carry, value, momentum, and volatility, and several providers now offer investable indices based on these strategies (Binny, 2005; Middleton, 2005; Hafeez, 2006).11
Following the advances in hedge fund literature, Middleton (2005) conducted a pioneering analysis of historical returns of 40 currency managers which involved using five simple trading strategies. In another major study, Levich and Pojarliev (2007) used four simple strategies to analyze the historical returns of 34 currency managers. We contribute to this emerging literature by examining a large database of 200 active currency managers and investable currency beta strategies defined by Binny (2005) and Middleton (2005) and other researchers for the period from 1993 to 2008. The main focus of this paper is whether we can explain the returns of a large universe of active currency managers using simple beta trading strategies as an extension of previous work on historical return analysis. We also investigate whether we can replicate active currency managers’ performance out-of-sample using a combination of currency beta strategies.
Our analysis shows that more than half of the profits from currency speculation can be explained by managers systematically taking advantage of forward rate bias, mean reversion to equilibrium fundamental value, trending of currency prices, and mean reversion of currency volatilities. This study, using a larger and more recent sample, confirms the findings from previous studies by Middleton (2005) and Levich and Pojarliev (2007).
We make further contributions to the literature on active currency managers by adapting the hedge fund methodology to replicate the manager returns out-of-sample. The results show that it is difficult to fully imitate the dynamic trading and allocation strategies of individual currency managers. The allocation rules proposed could fully replicate the total dollar return
10 Brian Strange, Pensions and Investments, September 1998; Watson Wyatt, Global Pensions, February 2000;
Frank Russell, 2000 Russell Research Commentary; and William Mercer, the Currency Overlay Supplement, Global Pensions, 2001.
11 For example: Financial Times, “Investment banks up the ante for institutional FX allocations”, 2007, retrieved March 10, 2009 from: http://www.ftmandate.com/news/fullstory.php/aid/1438/Investment_banks_up_the_ante_for_institutional_FX_allocations.html.

BIS Papers No 58 215
for only 30% of the 200 managers, while half of the total return could be replicated for up to 60% of the managers. In general, it is much easier to replicate a diversified portfolio or a composite index of currency managers using simple currency betas, as individual alphas tend to cancel out. Hence, investors, who do not have high confidence in their ability to select the best currency managers, may use this as a mechanism to learn, to inform themselves, and, finally, to use as a redundant risk management mechanism that could gauge ROR and strategies or, for that matter, perhaps even obtain roughly the same returns from buying a low-priced currency beta composite index product as they would from investing in much more expensive diversified currency manager fund of funds. Here we would like to restate that the main objective of this study is to develop an alternative redundant risk management tool for public investors.
The main limitations of this study are the choice of data and replication methodology. Hedge fund databases suffer from survivorship and backfill biases as only the best performing funds report their returns. We also assume it is possible to approximate the trading styles of currency managers using rolling regressions and Kalman filters with monthly data, but this methodology may not be appropriate for all managers. For example, managers may be using high frequency algorithmic trading models, or not using models at all and relying on fully discretionary analysis to trade around macroeconomic events. In either case it might be hard to capture the systematic trading style using regressions on monthly data.
In the remainder of this paper we explain in more detail. In Section 2, we review the related literature on exchange rate forecasting and active currency managers’ performance studies. In Section 3, we describe the data and methodology used for the analysis. In Section 4, we present the results of this study, and finally, in Section 5, we present the main conclusions.
2. Literature review
FX market participants can be broadly classified into market-makers, passive hedgers, and active currency return-seeking traders. The large FX dealing banks primarily act as market-makers by providing liquidity to outside customers and by trading with each other to manage inventory. The passive hedging segment includes corporate treasuries and institutional investors that are mainly interested in insuring against FX fluctuations affecting their primary trade and investment activities. In contrast, active currency managers – including overlay firms, commodity trading advisors (CTAs),12 and hedge funds – see FX as a speculative profit-generating opportunity.
Profits are generated in several ways, which change in response to the environment. In addition to bid-ask spread fees, FX desks of market-making banks also profit from proprietary trading activities. Initially, the primary responsibility of proprietary traders was to provide liquidity to their clients, but their mandate has evolved to taking active positions beyond liquidity needs.13 Proprietary traders operated as hedge funds within banks. However, during the last decade many of these traders left the banks to open their own hedge funds, using their bank track records as evidence of past profitability. In addition, a recent proposal by the Obama administration is intended to limit risk-taking and proprietary trading activities of large banks (Weisman, 2010).
12 A Commodity Trading Advisor is an individual or firm which advises others about buying and selling futures
and/or futures options and is licensed by the CFTC. See Spurgin, R., “Some Thoughts on the Sources of Returns to Managed Futures”, CISDM Working Paper Series, 2005.
13 For a brief history, please see http://en.wikipedia.org/wiki/Proprietary_trading.

216 BIS Papers No 58
FX traders outside major banks are usually part of currency overlay firms and hedge funds. Currency overlay managers traditionally serviced passive hedging clients, but eventually started shifting to active currency trading. Many hedge funds, especially in sectors such as global macro and managed futures, often employ active currency strategies. Although many hedge funds use some form of currency strategy in their trading, the focus of this analysis will be on those programs that have a dedicated active currency product. In particular, we focus on active currency managers investing in currency as an asset class (with the primary objective to generate profits from buying and selling currencies, independent of any other activity such as hedging, market-making, or trading equity and bond securities). In the next section we introduce the literature on exchange rate forecasting and provide background for the study.
2.1 Exchange rate forecasting: theory and practice
There is extensive academic literature on currency exchange rates, one of the central variables of open economy macroeconomics and international finance.14 The main theoretical approaches to exchange rate determination are the macroeconomic and microstructure (micro) approaches. The empirical success of academic forecasting models remains limited. Although much of academic literature uses sophisticated forecasting methods to predict the level of the exchange rate, in practice most currency trading involves using simpler rules to forecast the direction of the move combined with strict risk management (Neely, Weller, and Ulrich, 2007).
The macroeconomic approach models the exchange rate as a function of differentials in money, interest rates, inflation, growth, productivity, fiscal balances, and balance of payments variables (Cheung, Chinn, and Pascual, 2005). The microstructure approach focuses on the currency market trading mechanisms and how the joint behavior of heterogeneous agents affects exchange rates (Lyons, 2001). The micro approach also attempts to explain technical patterns such as autocorrelation and mean reversion of currency prices and volatility (Osler, 2003).
The empirical success of exchange rate forecasting using macroeconomic models is poor, especially in the short run (Meese and Rogoff, 1983; and Cheung et al., 2005). Andersen et al. (2003) examined the US dollar spot rates around macroeconomic announcements and concluded that at high frequency exchange rate behavior is linked to fundamentals. However, researchers have had less success forecasting exchange rates using macroeconomic models at lower frequencies (daily, monthly, quarterly). In their seminal paper, Meese and Rogoff (1983) evaluated the out-of-sample fit of classical macroeconomic models of exchange rates, including the monetary and portfolio balance models of the 1970s. They found that none of the models could outperform the random walk;15 therefore, they concluded that fundamental variables do not help predict future changes in exchange rates. Although a large number of studies have subsequently claimed to find success for various versions of fundamentals-based models using improved econometric methodology, their success has not proven to be robust across currencies and sample time periods (Sarno and Taylor, 2002) Cheung et al., 2005). There is evidence that forecasting performance improves for macroeconomic (macro) models incorporating non-linearities and using longer horizons (Mark, 1995; Killian and Taylor, 2003). Mark (1995) found that the fundamentals-based model outperforms the random walk when the forecast horizon is increased from 1 to
14 Recent comprehensive surveys include Sarno and Taylor (2002) and McDonald (2007). 15 The best forecast for the next period’s exchange rate is “no change” if it is a random walk. Exchange rates
tend to exhibit daily and monthly serial correlations from time to time, allowing some predictability, but these dynamics are typically not related to fundamentals in the short run.

BIS Papers No 58 217
16 quarters. Killian and Taylor (2003) proposed a non-linear threshold autoregressive model: when exchange rates are near equilibrium they behave like random walks, but large deviations from fundamentals activate mean reversion tendencies.
One of the most persistent and important anomalies in exchange rate theory is the violation of the uncovered interest rate parity (UIP) principle. Also known as forward rate bias, UIP states that the forward exchange rate is an unbiased estimator of future spot rates. The validity of UIP would suggest that currency markets are efficient and that the long-term FX return is zero. There is now an accumulated body of evidence to claim that the forward exchange rate is a biased and inefficient predictor of the future spot rate (Bilson, 1981; Fama, 1984; Bekaert and Hodrick, 1993). In other words, the currency market is not efficient, possibly due to the existence of a risk premium or the failure of rational expectations (Sarno and Taylor, 2002). As a result, market participants might use forward premium information to predict the direction of exchange rates and earn carry profits during low volatility periods (Burnside et al., 2006; Jorda and Taylor, 2009).
In contrast to macro models focused on longer horizon forecasting, FX microstructure research has made progress in forecasting short-run exchange rate movements (Lyons, 2001). The microstructure approach focuses on heterogeneity of currency market participants and how information asymmetries influence exchange rates (Evans and Lyons, 2004). The FX market is large and highly liquid, but it is not as transparent as other financial markets; FX dealers can exclusively observe the order flows of both informed and less informed customers. Evans and Lyons (2005) examined forecasting over horizons from 1 day to 1 month and found that the microstructure-based order-flow model consistently outperformed both the random walk and the macro model. Overall, in the short run (less than 1 year), noise and microstructure effects are more prevalent, while in the longer run the fundamental factors become more important (Knott, 2002).
In practice, these theories are implemented using essentially four types of trading techniques or models: fundamental, carry, technical, and mixed. The fundamental model focuses on large deviations of the currency rates from macroeconomic fair value (Binny, 2005). The carry model takes advantage of the forward rate bias by collecting the interest rate differential between two currencies when exchange rate volatility is relatively low (Burnside et al., 2006, 2009). The technical model relies on the assumption that market data, such as charts of price, volume, and flow, can help predict future market trends (Le Baron, 1992, 2000; Lyons, 2001; Okunev and White, 2003; Irwin and Park, 2007). For carry and technical models the theoretical value of exchange rates is not considered. The mixed model, used most frequently by the marketplace, combines the other techniques.
Both macroeconomists and currency trading practitioners generally agree that the long-run fair value of the exchange rate should be based on economic fundamentals; however, since practitioners have capital at risk they cannot rely on fair value estimation alone. As the literature on limits to arbitrage suggests, asset prices can deviate from fair value longer than arbitrageurs can remain solvent (Shleifer and Vishny, 1995). Hence, currency traders often use carry, market sentiment and flow-based strategies in the shorter term. Allen and Taylor (1990, 1992) studied the London foreign exchange market and found that at short time horizons (up to 3 months) 90% of surveyed currency traders reported using the technical model, while at longer horizons (more than 6 months) 85% assumed fundamentals to be more important than charts. Researchers at investment banks have summarized the most popular trading strategies used by active currency managers as carry, value, momentum, and volatility, and the banks now offer investable indices based on these strategies (Binny, 2005; Middleton, 2005; Hafeez, 2006, etc.).
Because exchange rates are hard to forecast and currency risk can be substantial, currency management has historically focused on risk minimization or passive hedging. With the rise of alternative investments such as hedge funds, investors increasingly have come to view

218 BIS Papers No 58
currency trading as a return-generating activity. The next section will introduce the emerging literature on active currency managers.
2.2 Active currency managers: performance analysis and replication
Over the past decade, starting with a pioneering study by Fung and Hsieh (1997), much research has been dedicated to defining and replicating16 various hedge fund strategies and styles (Fung and Hsieh, 1997, 2004, 2006; Schneeweis and Spurgin, 1998; Mitchell and Pulvino, 2001; Agarwal and Naik, 2004; Duarte, Longstaff, and Yu, 2006, etc.). Extending the classic Sharpe (1992) style analysis of long-only mutual funds, successful replication of hedge funds involves defining a set of asset exposures or trading strategies capturing the systematic risk premium of the hedge fund. Schneeweis and Spurgin (1998) described the properties of managed futures hedge funds, Mitchell and Pulvino (2001) defined the trading strategy to replicate merge arbitrage. Agarwal and Naik (2004) covered equity hedge fund strategies, while Duarte, Longstaff, and Yu (2005) focused on explaining the returns of fixed income hedge funds. Fung and Hsieh (2004) introduced a seven-factor model for replicating diversified portfolios of hedge funds that incorporates the alternative betas from equity, fixed income, and managed futures hedge fund sectors. Using a 24-month rolling regression window, Fung and Hsieh (2004) replicated as much as 85% of the return variation of the average hedge fund, up to 64% of the global macro return, and 60% of the funds-of-funds hedge fund index returns.
For this study, we applied the approach used by Fung and Hsieh (2004) to the active currency sector, building on previous studies by Lequeux (2001), Middleton (2005) and Levich and Pojarliev (2007). Lequeux (2001) had analyzed 32 leveraged currency funds using an index of simple technical moving average trading rules (AFX) for the time period from October 1991 to September 1996 and demonstrated how to distinguish between trend following, systematic, and discretionary CTAs in the sample based on their rolling correlation to the AFX index. Middleton (2005) defined five naïve trading strategies (carry, forward curve, inflation differentials, momentum, and value) for developed currencies and analyzed the returns of 24 currency CTAs and 14 overlay managers (1996-2004) using principal component analysis and linear regressions. The author concluded that the CTA returns were primarily attributed to momentum strategies, while overlay managers were more likely to have diversified strategy sets including value, interest rate differentials, and momentum. The five factors defined by Middleton (2005) explained up to 75% of the returns of overlay managers and 44% of the CTAs. Levich and Pojarliev (2007) examined the returns of 34 individual currency managers from the Barclays Currency Trader Index (2001-2006) using four factors for studying developed currencies: carry, value, trend, and volatility. Similar to Middleton (2005), the authors found that the trend approach dominated the sample, followed by the carry approach. In addition, Levich and Pojarliev (2007) estimated the alpha to the benchmark of the naïve strategies (the intercept of the regression) and found that few managers in the sample generated statistically significant alphas. The authors also found significant factor timing ability by regressing the returns on squared factors.
In this study, we examine the historical returns of active currency managers using a larger sample over a longer time frame to determine how active currency managers make money: what trading strategies they typically use, how skilled they are at market timing, and whether they beat simple trading beta strategies on average. We use the currency beta indices by Binny (2005).
16 Hedge fund replication refers to observing the returns of a hedge fund and defining a set of simple investable
trading strategies that allows the performance of given hedge fund to be imitated (replicated).

BIS Papers No 58 219
While several currency manager studies have focused on retrospective performance analysis, no attempt has been made to create an out-of-sample replicating portfolio using currency beta indices. With the rising demand from institutional investors, investment banks have constructed investable naïve trading strategies which track the main drivers of active currency returns (e.g. carry, value, momentum). This raises the possibility of creating passive replicating portfolios or “clones" using liquid investable instruments that provide similar risk exposures at lower cost and with greater transparency than that achievable through investing with the external managers. We examine how much of the active currency manager returns can be replicated using simple currency beta trading strategies developed by investment banks. Thus, if the simple currency beta index can achieve comparable returns to active currency managers, investors can create cost-efficient active currency portfolios consisting of less expensive currency betas.
We apply the hedge fund replication methodology (Fung and Hsieh, 1997, 2004; Hasanhodzic and Lo, 2007) to replicate active currency manager performance using pre-defined currency trading strategies. To build a replication we use rolling regressions (Fung and Hsieh, 2004; Hasanhodzic and Lo, 2007) and the Kalman filter (Roncalli and Teiletche, 2008). We also compare the replication’s performance with the equal-weighted currency beta portfolio and optimized currency beta portfolio using the classical Markowitz mean-variance approach (Markowitz, 1952) and the Bayesian Black-Litterman approach (Black and Litterman, 1992). In other words, we assess whether an outsider can reproduce the active currency manager’s process for generating returns based on simple building blocks using rules of thumb and Bayesian updating. This is the first study to apply the out-of-sample hedge fund replication methodology to active currency managers. It should be noted that the out-of-sample tests are performed using historical samples, and there is no guarantee that the past performance of active currency managers will be similar in the future. The following Section 3 describes the empirical analysis.
3. Empirical analysis
3.1 Data
We use three types of active currency returns data in this analysis: composite manager indices, the individual manager database, and currency beta strategies.
The manager indices published on Bloomberg17 include Barclay, Stark, CISDM, and FXSelect. The Barclay, Stark, and CISDM indices have a long track record going back to the 1980s, while FXSelect has emerged in the last 10 years.
The main study dataset is the proprietary database that includes self-reported returns from 200 individual currency managers for the period of 1993-2008 (for a detailed description, see Ladekarl and Nasypbek, 2009). The dataset for this study does not contain any manager names, only style classifications and monthly returns; all returns are scaled to 10% annualized volatility. The sample used for this study is for the period from January 1993 to June 2008, with individual manager track records from 1.5 to 15 years. Since the database includes managers that stopped reporting, the number of active managers varied from 15 in 1993 to a high of 176 in 2005, and fell back to 120 in 2008. Two-thirds of the managers in the database follow mainly the technical price-driven approach, while 23% use the fundamental
17 The choice of manager indices for this study does not indicate a judgment about the merits of individual index
providers; the data are used strictly for research purposes. The Bloomberg codes are as follows: for Barclays and Stark Indices <FXTP>, for CISDM <CISDMACY Index> and for FXSelect <FXSTUNIU Index>.

220 BIS Papers No 58
macro and 9% employ a mixed approach. In terms of the investment process, over two-thirds of the managers in the database are model-driven or use a quantitative approach, while the other third use a discretionary/judgmental approach. Manager returns data used for this study are net of fees and net of Libor. For the entire period under review, 200 managers on average made 7.2% over 1M Libor per annum with a Sharpe ratio of 0.72. Figure 1 presents a distribution of the annualized Sharpe ratios, or risk-adjusted returns, of individual managers’ live track records between January 1993 and June 2008.
Figure 1
Distribution of Sharpe ratios of individual managers
Source: Ladekarl and Nasypbek (2009).
Various investment banks have produced investable currency beta indices based on either stand-alone naïve trading strategies or a combination of the most successful substrategies. This study does not intend to compare the merits of individual currency beta providers, but rather focuses on the overall explanatory power of simple strategies grouped using Binny (2005) style definitions. Binny (2005) first formulated the now widely recognized carry, value, trend, and volatility currency trading styles.

BIS Papers No 58 221
Table 2
List of currency betas used in this study
Strategy Rationale Typical formulation
Carry High-yielding currencies tend to outperform lower-yielding currencies in the short to medium term.
Long positions in high-yielding currencies and short positions in low-yielders; some of these strategies employ filters to close positions in high volatility periods.
Trend Currency markets have exhibited a tendency to trend over time.
Moving average crossovers (MA), some with volatility filters. Buy if shorter MA outpaces long MA, sell otherwise.
Value A currency with strong relative fundamental factors (PPP, high growth, BoP surplus, etc.) tends to outperform over long horizons. Buy the most undervalued currencies and sell the most overvalued currencies
Volatility tends to mean-revert. Sell in-the-money put and call options when volatility is high based on the expectation that volatility will mean-revert.
Volatility Currency markets have exhibited a tendency to trend over time.
Moving average crossovers (MA), some with volatility filters. Buy if shorter MA outpaces long MA; sell otherwise.
Source: Binny (2005).
Table 3
List of currency beta indices
Provider FX trading strategies Data period Source
Bank of America Carry, forward curve, inflation differentials, momentum and PPP
01/01/85-06/30/08 Middleton (2005,2006)
Barclays Carry, trend, value 01/30/00-06/30/08 Bloomberg <BFXIVTUS>
Bloomberg Forward rate bias/carry 02/28/89-06/30/08 Bloomberg <FXFB>
Citibank Carry, value, trend 01/01/97-06/30/08 CitiFX, Bloomberg <CACMUUSD Index>
Deutsche Bank Carry, value, momentum 10/15/97-06/30/08 Hafeez (2006), Bloomberg <DBCRPLU Index>
RBS Carry, value, trend, vol 12/31/74-06/30/08 Binny (2005), Bloomberg <FXTP>
For this analysis each individual beta is designated by its strategy type and the number of providers used (e.g. Carry1 to Carry4). As Table 4 shows, the currency beta indices achieved Sharpe ratios from 0.32 to 1.1 during the list’s published history, but most indices came out only recently and are most likely back-tested (synthetically estimated) with only a few years of live trading history. However, these beta strategies are simple and transparent.
222 BIS Papers No 58
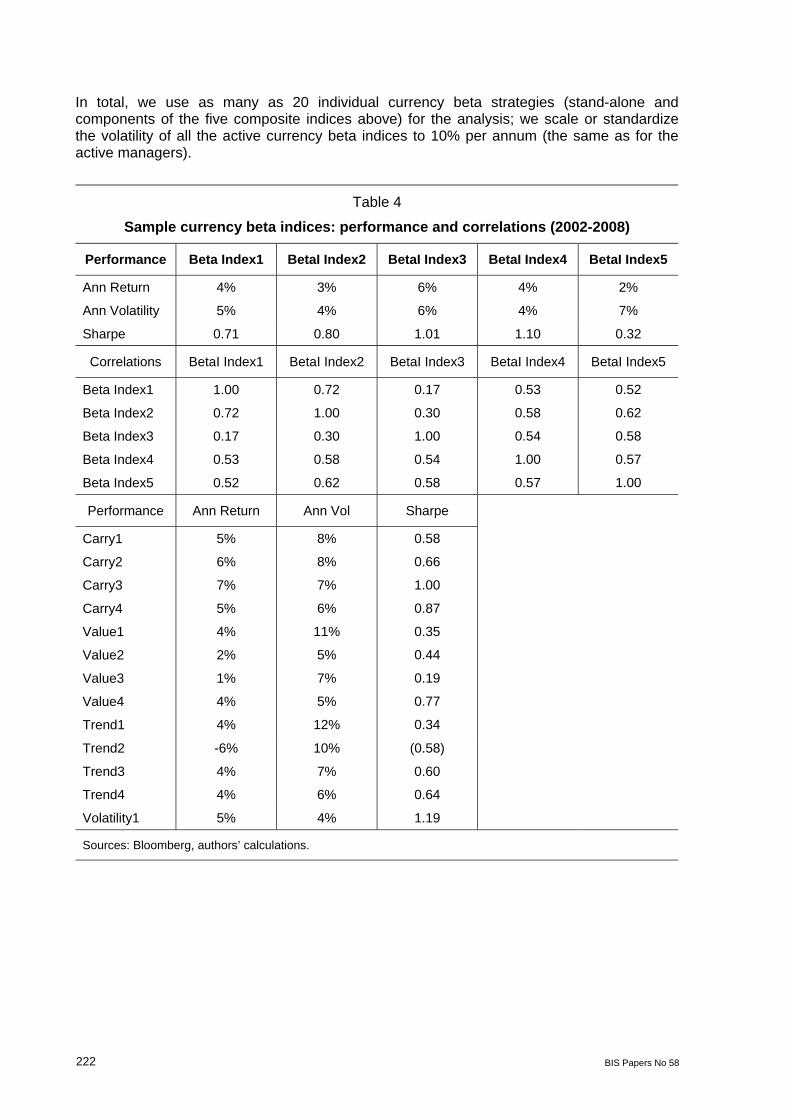
In total, we use as many as 20 individual currency beta strategies (stand-alone and components of the five composite indices above) for the analysis; we scale or standardize the volatility of all the active currency beta indices to 10% per annum (the same as for the active managers).
Table 4
Sample currency beta indices: performance and correlations (2002-2008)
Performance Beta Index1 BetaI Index2 BetaI Index3 BetaI Index4 BetaI Index5
Ann Return
Ann Volatility
4%
5%
3%
4%
6%
6%
4%
4%
2%
7%
Sharpe 0.71 0.80 1.01 1.10 0.32
Correlations BetaI Index1 BetaI Index2 BetaI Index3 BetaI Index4 BetaI Index5
Beta Index1
Beta Index2
Beta Index3
Beta Index4
Beta Index5
1.00
0.72
0.17
0.53
0.52
0.72
1.00
0.30
0.58
0.62
0.17
0.30
1.00
0.54
0.58
0.53
0.58
0.54
1.00
0.57
0.52
0.62
0.58
0.57
1.00
Performance Ann Return Ann Vol Sharpe
Carry1
Carry2
Carry3
Carry4
Value1
Value2
Value3
Value4
Trend1
5%
6%
7%
5%
4%
2%
1%
4%
4%
8%
8%
7%
6%
11%
5%
7%
5%
12%
0.58
0.66
1.00
0.87
0.35
0.44
0.19
0.77
0.34
Trend2
Trend3
Trend4
-6%
4%
4%
10%
7%
6%
(0.58)
0.60
0.64
Volatility1 5% 4% 1.19
Sources: Bloomberg, authors’ calculations.

BIS Papers No 58 223
3.2 Methodology
The objective of the replication exercise is to reverse-engineer the target investment fund’s returns, first by explaining its returns in-sample using various risk factors, and, second, by specifying a rule to produce similar returns out-of-sample using investable indices. In this study we focus on replicating the returns of active currency funds.
Traditionally, the relationship between risk factors and investment returns is described in classic multi-factor models such as the capital asset pricing model (CAPM) and the arbitrage pricing theory (APT) approach (Treynor, 1961; Sharpe, 1964; Lintner, 1965; Ross, 1976). The main concept is that every systematic risk should be rewarded with a risk premium. For an investment fund, performance attribution and replication of the systematic part of the fund’s return can be achieved if one can link returns of a fund to returns of rule-based trading strategies. For mutual funds, performance attribution turns out to be a comparatively straight-forward exercise. A typical mutual fund employs relatively static, long-only, strategies, and seldom uses leverage. Thus, the indices of standard asset class returns are suitable benchmarks for mutual funds, as shown by Sharpe (1992); however, these benchmarks can be inadequate for hedge funds. For hedge funds the replication process is more difficult since they take both long and short positions that create non-linear return series (Fung and Hsieh, 1997, 2007; Glosten and Jagannathan, 1994). Fung and Hsieh (1997) were the first to suggest replicating hedge funds with linear combinations of rule-based trading strategies; these trading strategies, in turn, could be non-linear positions in underlying instruments (Fung and Hsieh, 2007).
In this study we apply the Fung and Hsieh (1997) concept to currency funds. Hence, for a given active currency fund:
Return = Alpha + Beta* Currency Beta Factors (1)
The beta is based on exposures to systematic risk factors (currency beta trading strategies), and the alpha represents the fund manager’s skill in dynamic allocation and selection of individual strategies. Fung and Hsieh (2007) highlight the advantages of replication using low cost and liquid trading strategies: for investors seeking active returns it allows us to evaluate the performance of their hedge fund investment relative to costs, while for passive investors it offers a way to measure their factor exposure.
This study’s research question is whether active currency funds’ returns can be replicated using simple currency beta strategies. We use a two-part strategy to respond to this question. First, we will attribute the profits of active currency funds to a set of simple currency trading strategies in a historical sample. Second, we will replicate the active currency fund returns out-of-sample using pre-defined currency trading strategies.
Hypothesis 1 Historical profits of active currency funds can be attributed to the following trading strategies: carry, value, trend, and volatility. In particular, the profits are generated through:
a) direct exposure to these risk factors, and
b) market timing these risk factors.
We test this hypothesis using principal component analysis (PCA) as well as factor analysis (using pre-defined currency trading strategies). First, we use the first five principal components from the total variance of 200 currency funds and link them to the known currency beta strategies. We then follow Lequeux (2001), Middleton (2005) and Levich and Pojarliev (2007) and estimate the historical currency beta exposures in a full sample regression. This exercise evaluates how active currency managers historically have used currency trading strategies and determines the explanatory power of beta strategies in the total return of active managers.
To determine the explanatory power of common trading strategies for active currency managers, we perform a time-series regression for each of the 200 active currency

224 BIS Papers No 58
managers in the sample by regressing the managers’ monthly returns on the currency beta factors. The return of the active currency manager i at date t is denoted by the term Rit, in which Rit satisfies the following linear relationship:
Rit =αi + βi1 * F1t + βi2 * F2t +... + βik * Fkt + εit (2)
where the Fs represent the returns of k currency beta strategies, and the βs represent the sensitivities of active manager Ri with respect to the different beta strategies.
The hedge fund approach differs in a few ways from classic factor models. First, as Hasanhodzic and Lo (2007) specify, the relationship in (2) is mainly statistical, unconstrained by any particular economic theory. In addition, the hedge fund risk factors, as opposed to academic risk factors, have to satisfy three criteria. They must be clearly defined and measurable, common and statistically significant to a set of hedge funds, and tradable using liquid instruments (Hasanhodzic and Lo, 2007).
We also use the methodology by Levich and Pojarliev (2007) to determine if the manager’s alpha can be explained in terms of market timing ability. This methodology includes
regressing the manager indices on currency betas with the intercept term to measure alpha in equation (2); the objective is to identify significant beta exposures and whether the alpha term αi is negative or positive and statistically significant.
repeating the regressions but including the squared beta terms F2 to measure market timing ability (manager’s skill to forecast the sign of the factor), and noting whether the new intercept term Ai remains positive and significant.
Rit = Ai + βi1 * F1t + β2t * F2t +... + βik * Fkt + (3)
+ βi1 * F2
1t + β2t * F2
2t +... + βik * F2
kt + εit
If the squared beta terms β are positive and significant and new alpha Ai is reduced or becomes insignificant, it might suggest that the manager excess return over currency beta strategies can be partially explained by the market timing ability of the manager.
Hasanhodzic and Lo (2007) suggest using R2, or the estimated fraction of the total variance attributable to the beta factors, as a measure of explanatory power. This is expressed as:
R2= Var[∑(βik *Fkt)] / Var[Rit] (4)
For the majority of hedge funds in the TASS database, Hasanhodzic and Lo (2007) found that R2s range from 25% to 75% for a three-factor risk model. They also demonstrated that where a hedge fund falls in this range depends on several characteristics: the hedge fund’s investment style, the set of risk factors, and the time period. The seven-factor model developed by Fung and Hsieh (2004) achieves R2 up to 85%.
We perform this analysis for the published active currency manager indices and 200 individual managers in the manager database. After the in-sample analysis is completed, we conduct the out-of-sample replication analysis.
The second objective in this study is to replicate active currency manager returns out-of-sample using a combination of currency beta strategies as a more cost effective (than formal hedge funds) alternative risk management redundancy mechanism for currency risk management or investment, or as an alternative less expensive investable index product. It should be noted that the former objective of developing an alternative redundant risk management tool is the primary focus and goal of our study. This objective will be tackled in two ways: (a) by optimally tracking the target manager’s performance using beta strategies, and (b) by using an independent currency beta portfolio. The strategies for achieving the second objective lead to the second and third hypotheses.
Hypothesis 2 It is possible to replicate the performance of active currency funds, out-of-sample, by tracking their historical exposures to investable currency trading strategy indices.

BIS Papers No 58 225
To build the tracking portfolio, we use 24-month rolling regressions (Fung and Hsieh, 2004; Hasanhodzic and Lo, 2007) and the Kalman filter (Roncalli and Teiletche, 2008, Roncalli and Weisang, 2009).
For the replication exercise we use the managers with track records of at least 36 months (173 managers). Denoted by the symbol Rrt, the return of a replication portfolio consists of the currency beta indices corresponding to the K risk factors in (2). To replicate the target active currency manager i, we regress the target manager returns on the currency betas without intercepts and with weights summing to one:
Rit =βi1 * F1t + βi2 * F2t +... + βik * Fkt + εit (5)
subject to: βi1 + β2t +... + βik = 1.
To finalize the replication, we scale the volatility (or leverage in trading terms) of the estimated factor portfolio from (5) to match the target manager volatility:
Rrt+1 = ∑ βik Fkt+1 * Var(Rit )/ Var(∑ βik Fkt ) (6)
The ability of the factor model to map the market is not constant over time. A number of techniques can be employed to capture the dynamic portfolio adjustments, including time-varying-parameter regressions such as rolling regressions (Fung and Hsieh, 2004; Hasanhodzic and Lo, 2007). These techniques also include the Kalman filter and Bayesian dynamic models, which were recently applied to hedge fund replication by Roncalli and Teiletche (2008) and Roncalli and Weisang (2009).
For this study we use 24-month rolling-window regressions on currency betas (as in most hedge fund replication models, e.g. Fung and Hsieh, 2004; Hasanhodzic and Lo, 2007). The truncated regression approach has obvious limitations: A limited dataset is employed which does not use all available data, and the smaller samples of 24 monthly observations are relatively easily influenced by outliers (Fisher and Kamin, 1985).
We utilize the Kalman filter estimation to account for the dynamic nature of beta exposures, following the process developed by Roncalli and Teiletche (2008). To replicate the hedge fund exposures, Roncalli and Teiletche (2008) assumed smooth changes in weights using the following state-space model formulation:
Rt =Ft βt + εt (7)
βt= βt-1+ ήt where
εt~Ν(0,Ht) and ήkt~Ν(0,Qt) are uncorrelated processes, and Qt=diag(σ1,... σm).
The initial distribution of the state vector is p(β0) = ɸ (β0,b0,P0), where ɸ (β,b,P) is the Gaussian pdf with argument β, mean b and covariance matrix P.
Following Roncalli and Weisang (2009), the Bayes filter is then described by the following recursive equations: p(βt|R1:t-1)=ɸ (βt-1,bt|t-1,Pt|t-1) and p(βt|R1:t)=ɸ (βt,bt|t,Pt|t ), estimated using a Kalman filter algorithm.
There is an important limitation of a look-ahead bias in using a full-sample Kalman filter for replication (Roncalli and Teiletche, 2008; Hasanhodzic and Lo, 2007). While the smoothed series using the full sample provide a useful benchmark, the clean out-of-sample replication would involve only using data available prior to the allocation decision at time t. We present results both for the forecasted βt|t-1 as well as for the full-sample smoothed βt|t.
The first evaluation is calculated using the manager’s cumulative return, the rolling window and Kalman filter clones. These calculations produce simple clones that can be constructed using dynamic regression tools.
In addition to imitating active currency management, we also create a number of independent benchmarks using simple and optimized combinations of currency betas. The
226 BIS Papers No 58
goal is to achieve the same performance as the active currency manager by creating an independent allocation strategy using simple currency betas.
Hypothesis 3 It is possible to replicate the performance of active currency funds, out-of-sample, using independent combinations of investable currency trading strategy indices including:
a) equally weighted currency betas,
b) mean-variance optimized currency betas, and
c) a Bayesian Black-Litterman portfolio of currency betas.
To create an independent beta portfolio we use a naïve equally weighted beta portfolio, a mean-variance optimized 24-month rolling currency beta portfolio, and a Bayesian blend of market-weighted and views-informed portfolios based on the Black-Litterman model (1992).
The equally-weighted beta portfolio return is estimated using the formula:
Ravet= average (F1t …. Fmt) assuming m active currency beta factors and scaling the volatility
to get the naïve clone:
Reqrt+1 = Rave
t+1 * Var(Rit)/ Var(Ravet) (8)
The mean-variance optimized portfolio (Markowitz, 1952) is constructed as follows:
Argmaxw (wT µt- (0.5*γ) wT Σt wT st. ∑w=1,
µ is the vector of expected factor returns, and Σ equals the covariance of expected returns. Inputs µt and Σt are estimated using historical 24-month rolling window data. Volatility is scaled to find the mean-variance beta clone using the formula
Rmvrt+1 = wt
mv T Ft+1 * Var(Rit)/ Var(wtmv T Ft) (9)
The Black-Litterman optimized portfolio is constructed using the market equilibrium implied return as the ex-ante and subjective (forecasted) views (Black and Litterman, 1992). The Black-Litterman model uses a Bayesian approach to combine the subjective views of an investor with the market equilibrium vector of expected returns (the prior distribution) to form a new, mixed estimate of expected returns (Black and Litterman, 1992; He and Litterman, 1999; Walters, 2009). The resulting new vector of returns (based on the posterior distribution) can be used to develop intuitive portfolios with sensible portfolio weights.
In a slight departure from the Black-Litterman model, we assume the fixed-weight market equilibrium for active currency beta indices18 and derive the implied return using µe
t=γΣtwe. In
this formula, γ is the risk-aversion parameter, we is the equilibrium portfolio weights, and Σt is the sample covariance matrix of factor returns. It is possible to stipulate that, µ= µe + έe, έe ~ Ν (0, τΣt), where έe is the deviation of µ from µe that is normally distributed with zero mean and covariance matrix τΣt and τ is a scalar indicating the degree of belief in how close µ is to the equilibrium value (in line with previous studies we use τ= 0.05; see Walters, 2009).
In the absence of any investor views on future stock returns, and in the special case of τ = 0, the investors’ portfolio weights must equal we. However, an active portfolio manager is likely to have views on µ that are different from we in a substantial way. Black and Litterman (1992) illustrate that views on the relative performance of the stocks can be represented
18 As the currency beta market develops it might be possible to obtain actual market value weights, but for this
exercise we use fixed weights of 30% for each established factor (carry, value, and trend) and 10% for the lesser used volatility strategy. We understand that this does not fall under the exact Black-Litterman formulation, which derives the weights from established equity and bond indices with easily accessible capitalization weights.

BIS Papers No 58 227
mathematically by a single vector equation: Pµ= µv + έv, έv~ Ν (0, Ωt), where we set P=Im and µv is an m-vector summarizing the prior means of the view portfolios, and έv is the residual vector. The covariance matrix of the residuals, Ωt, measures the degree of confidence the investor has in his or her views. For the views matrix, we use the weights from mean-variance optimization based on 24-month rolling window. Following He and Litterman (1999), we set Ωt = [P (τΣt) P
T].
Applying the Bayesian rule to the equilibrium relationship and to the view equation, Black and Litterman (1992) show that Bayesian updated expected returns and risks may be expressed as
µBL= [(τΣt)-1 + PT Ωt
-1P ]-1 [(τΣt)-1 µe + PT Ωt
-1 µ
v] (10)
ΣBL= Σt + [(τΣt)-1 + PT Ωt
-1P ]-1
The Black-Litterman model tilts the investor’s optimal portfolio away from the market portfolio according to the strength of her views. Because the market portfolio does not include any extreme positions, any suitably controlled tilt should also yield a portfolio without any extreme positions.
We then input the adjusted µBL and ΣBL into mean-variance optimization and scale the volatility obtaining the Black-Litterman beta clone:
RBLrt+1 = wt
BL T Ft+1 * Var(Rit)/ Var(wtBL T Ft) (11)
Hence, we create three new beta portfolios: naïve equally weighted, sample mean-variance optimized, and Black-Litterman optimized. We compare these new beta indices with the active manager and with the rolling window and Kalman filter clones from the first section using various performance measures including the cumulative return, Sharpe ratio, percentage of positive months, and maximum monthly loss. We also evaluate the statistical measures of forecasting success such as the mean absolute deviation (MAD) and the root mean-squared error (RMSE).
4. Study results
4.1 Explaining historical returns of currency manager indices
We examine the relationship between the currency beta indices developed by investment banks and actual currency manager index returns. Please note that this study does not compare the merits of individual currency managers and currency beta providers, but rather looks at the overall explanatory power of simple strategies grouped using Binny (2005) style definitions. The results show that the cumulative performance of the active currency manager indices can be mirrored quite well using the currency beta indices from multiple providers. In short, simple beta indices can achieve long-run returns which are similar to those generated by the target active manager indices. Table 5 shows that all manager indices have at least one currency beta index that is closely correlated.

228 BIS Papers No 58
Table 5
Correlations of currency manager and currency beta indices
(2000-2008)
Correlations Barclays Stark CISDM FXSelect
Barclay 1.00 0.75 0.61 0.80
Stark 0.75 1.00 0.73 0.61
CISDM 0.61 0.73 1.00 0.47
FXSelect 0.80 0.61 0.47 1.00
Correlations Barclays Stark CISDM FXSelect
BetaIndex1 0.53 0.35 0.25 0.63
BetaIndex2 0.38 0.24 0.20 0.50
BetaIndex3 0.20 0.27 0.46 0.14
BetaIndex4 0.40 0.44 0.48 0.38
BetaIndex5 0.63 0.61 0.67 0.47
Sources: Bloomberg; authors calculations.
Table 6
Style regression results: currency CTA indices on currency betas
(1993-2008)
Barclays Stark CISDM
Adj R-squared 37% 47% 39%
Alpha 0.10% 0.09% 0.29%
t-stat 0.56 0.60 1.79
Carry 0.03 0.10 (0.04)
t-stat 0.51 1.80 (0.71)
Value (0.03) 0.03 (0.08)
t-stat (0.44) 0.56 (1.28)
Trend 0.60 0.61 0.55
t-stat 9.51 11.92 9.37
Volatility (0.21) (0.15) (0.27)
t-stat (3.44) (2.91) (4.62)
Sources: Bloomberg; authors’ calculations.
We next conduct a factor analysis of FX manager indices to determine the predominant trading approach of the managers represented in each index. For the 1990-2008 data from the CTA indices (including Barclays, CISDM, and Stark) we use the currency beta factors and run a full sample regression as described in the methodology section under equation (2). The regression analysis results are presented in Table 6. In line with the previously

BIS Papers No 58 229
discussed literature (Middleton, 2005), we find that the CTA indices primarily utilize trend following and long volatility trading strategies; this is evidenced by their statistically significant positive exposure to the trend factor and negative exposure to the volatility mean reversion factor. All of the beta factors explain from 37% to 47% of the variation in the overall history of CTA index returns from 1990 to 2008.
We also perform a similar factor analysis of the FXSelect index, which has a history beginning in 2000. This analysis shows that FXSelect is best explained by carry, value, and trend betas. As noted in the following table, the R-squared is 0.41 (Table 7).
Table 7
Style regression results: FXSelect index on currency betas
(2000-2008)
Coefficient t-statistics
Adj R-squared 41%
Alpha 0.22% 2.51
Carry 1.09 3.72
Value 0.89 3.04
Trend 1.72 5.85
Sources: Bloomberg; authors’ calculations.
Next we check for market timing ability and find that it is significant for all three strategies, with the adjusted R-squared improving to 0.52 and the alpha turning negative (Table 8).
Table 8
Style regression results: FXSelect with market timing
(2000-2008)
Coefficient t-statistics
Adj R-squared 52%
Alpha (0.11%) (1.03)
Carry 0.70 2.49
Value 0.45 1.60
Trend 1.12 3.62
Carry_Sq 126 1.82
Value_Sq 104 2.06
Trend_Sq 216 2.58
Sources: Bloomberg; authors’ calculations.

230 BIS Papers No 58
For the active currency indices above consisting of a large number of managers, the idiosyncratic approaches cancel each other out, and a large beta component can be identified as suggested in the hedge fund replication literature (e.g. Hasanhodzic and Lo, 2007).
The next step is to perform a style analysis of individual FX managers to determine their predominant trading approaches. Given the highly dynamic nature of active currency trading, we expect it might be harder to replicate the performance of an individual manager vs. the composite manager index. In this case, the alphas (excess returns) over simple currency beta strategies would be higher for the individual managers than for the aggregated index.
4.2 Explaining historical returns of individual managers
Following Fung and Hsieh (1997) and Middleton (2005), we use PCA to span the active currency manager returns space as represented in the manager database, and find that 52% of the variation in the returns can be explained by the first five principal components (Table 9). This is a relatively well-explained sample similar to the Fung and Hsieh (1997) finding that 45% of variance was due to the first five principal components in a total hedge fund sample.
Table 9
Percentage of total variance of 200 individual managers explained by first 5 principal components
% of total variance explained
10-year data 5-year data
PCA1 22 25
PCA2 12 8
PCA3 8 6
PCA4 6 6
PCA5 5 4
Sum of 5 52 49
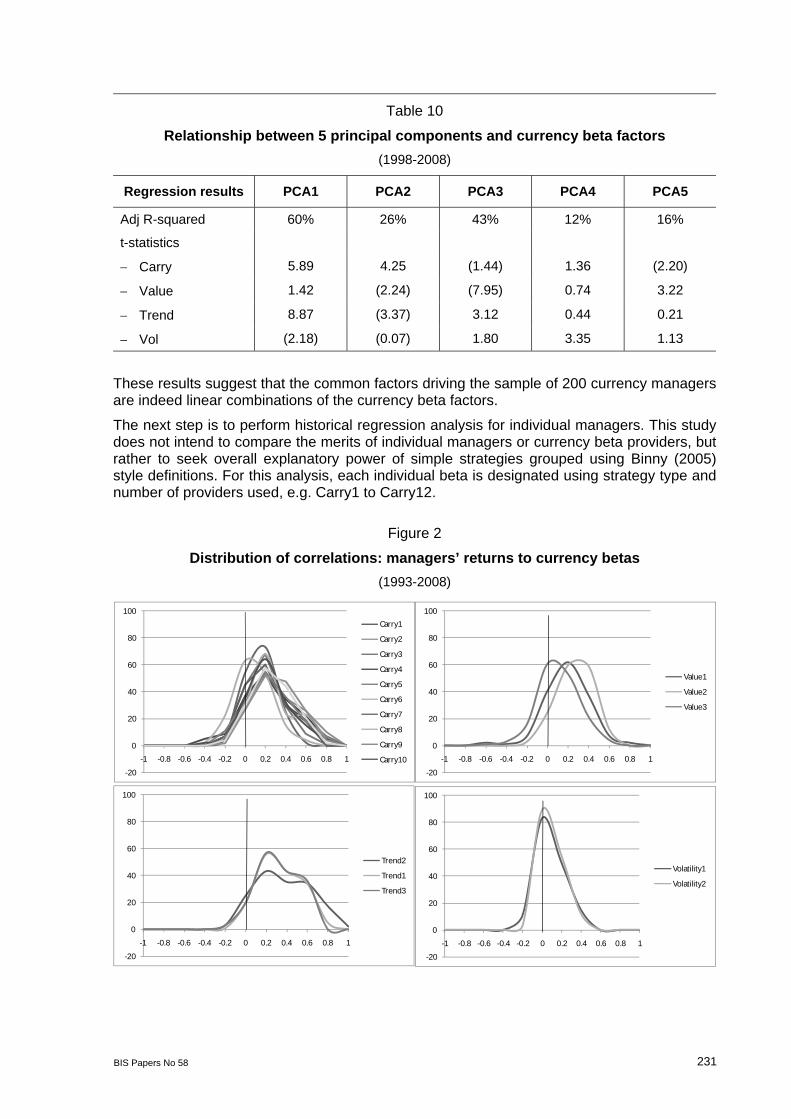
To gauge whether these principal components are related to currency beta factors, we conduct a regression analysis for each component. The results, as shown in Table 10, indicate that as much as 60% of the principal components can be explained by currency beta factor exposures, e.g. the first component consists of carry, trend, and volatility exposure, while the third component primarily consists of value and trend.
BIS Papers No 58 231
-20
0
20
40
60
80
100
-1 -0.8 -0.6 -0.4 -0.2 0 0.2 0.4 0.6 0.8 1
Carry1
Carry2
Carry3
Carry4
Carry5
Carry6
Carry7
Carry8
Carry9
Carry10
-20
0
20
40
60
80
100
-1 -0.8 -0.6 -0.4 -0.2 0 0.2 0.4 0.6 0.8 1
Value1
Value2
Value3
-20
0
20
40
60
80
100
-1 -0.8 -0.6 -0.4 -0.2 0 0.2 0.4 0.6 0.8 1
Trend2
Trend1
Trend3
-20
0
20
40
60
80
100
-1 -0.8 -0.6 -0.4 -0.2 0 0.2 0.4 0.6 0.8 1
Volatility1
Volatility2
Table 10
Relationship between 5 principal components and currency beta factors
(1998-2008)
Regression results PCA1 PCA2 PCA3 PCA4 PCA5
Adj R-squared 60% 26% 43% 12% 16%
t-statistics
Carry 5.89 4.25 (1.44) 1.36 (2.20)
Value 1.42 (2.24) (7.95) 0.74 3.22
Trend 8.87 (3.37) 3.12 0.44 0.21
Vol (2.18) (0.07) 1.80 3.35 1.13
These results suggest that the common factors driving the sample of 200 currency managers are indeed linear combinations of the currency beta factors.
The next step is to perform historical regression analysis for individual managers. This study does not intend to compare the merits of individual managers or currency beta providers, but rather to seek overall explanatory power of simple strategies grouped using Binny (2005) style definitions. For this analysis, each individual beta is designated using strategy type and number of providers used, e.g. Carry1 to Carry12.
Figure 2
Distribution of correlations: managers’ returns to currency betas
(1993-2008)

232 BIS Papers No 58
Figure 2 presents the correlation analysis for all betas by strategy type (i.e. carry, value, trend, and volatility). Various individual beta strategies within their style groups are broadly similar in the distribution of correlations to currency managers.
Figure 3 presents the distribution of currency managers’ correlations to the composite currency beta indices. With the possible exception of BetaIndex3, all beta composites have similar correlation distributions to the manager universe.
Figure 3
Distribution of correlations: managers’ returns to currency beta indices
(1993-2008)
-20
0
20
40
60
80
100
-1 -0.8 -0.6 -0.4 -0.2 0 0.2 0.4 0.6 0.8 1
BetaIndex1
BetaIndex2
BetaIndex3
BetaIndex4
BetaIndex5
To conclude, the currency beta providers have broadly homogeneous categories of beta strategies that fall within the definitions established by Binny (2005). Hence, for the purpose of this study we could use any of currency beta bundles to address the research objective of judging the relationship between currency manager returns and naïve beta strategies. Without giving preference to any beta providers based on their individual merits, this study focuses on beta strategies formulated by Binny (2005).
The next step is to perform an analysis using the Binny (2005) currency beta strategies to see if they are correlated to individual manager returns. Figure 4 presents the distribution of the correlations. The majority of the managers have positive correlations to individual currency betas, and 90% of the managers have positive correlations to the equally weighted beta index.

BIS Papers No 58 233
Figure 4
Distribution of correlations: managers’ returns to Binny (2005) currency betas
-20
0
20
40
60
80
100
-1 -0.8 -0.6 -0.4 -0.2 0 0.2 0.4 0.6 0.8 1
R.Carry
R.Value
R.trend
R.volatility
EqualWeight
For a more detailed analysis, we run full sample regressions and find that about half of the managers in the sample have statistically significant alphas over naïve trading strategies, as presented in Figure 5. All four strategies are used by managers; carry and trend are the most popular, followed by value and volatility.
Figure 5
Percentage of total managers with significant (at 95%) exposure to currency betas
0%
10%
20%
30%
40%
50%
60%
Alpha Carry Value trend Vol
On average, simple currency betas explain only 23% of the individual managers’ return for this sample, with R-squared ranging from 1% to 83%. On average, the more profitable managers in the sample (information ratio or IR>0.5) tend to have significant alphas and significant exposures to all betas, while less profitable managers (IR<0.5) have no significant alphas and tend to be predominantly trend followers, as shown in Table 11.

234 BIS Papers No 58
Table 11
Summary of historical style analysis for currency managers using Binny (2005) beta factors
Average IR>0.5 IR<0.5 Max Min StDev
Adj R-Squared 23% 22% 25% 83% 1% 18%
Alpha 0.51% 0.73% (0.03) 3.15% -1.81% 0.66%
t-stat 1.87 2.60 0.01 6.53 (4.55) 1.83
Carry 0.16 0.19 0.09 1.05 (2.15) 0.36
t-stat 1.85 2.21 0.96 17.47 (4.28) 2.74
Value 0.06 0.07 0.06 2.51 (3.55) 0.55
t-stat 0.82 0.82 0.80 16.81 (6.58) 2.43
Trend 0.20 0.17 0.26 0.66 (0.42) 0.22
t-stat 2.69 2.37 3.55 10.42 (2.39) 2.72
Volatility 0.00 0.01 (0.01) 0.37 (0.63) 0.15
t-stat (0.01) 0.02 (0.07) 3.91 (4.42) 1.33
Sources: Bloomberg; Binny (2005); authors’ calculations.
Figure 6 illustrates how idiosyncratic components (unexplained by currency betas) of manager returns dissipate as we combine individual managers into indices or portfolios. We simulate the portfolios of managers using combinations of 1 to 40 and observe the average R-squared and excess return (alpha) for each combination: as the number of managers increases, the percentage explained by currency betas rises from 23% to over 50%, while monthly excess return for portfolios in the top quartile drops from 0.65% to 0.35%.

BIS Papers No 58 235
Figure 6
Percentage explained by currency beta strategies vs. number of managers
0%
10%
20%
30%
40%
50%
60%
1 3 5 7 9 11 13 15 17 19 21 23 25 27 29 31 33 35 37 39 41
R-squared of regression on currency betas with market timing
R-squared
0.0%
0.1%
0.2%
0.3%
0.4%
0.5%
0.6%
0.7%
1 3 5 7 9 11 13 15 17 19 21 23 25 27 29 31 33 35 37 39 41
% m
onth
ly r
etur
n
Top-Quartile Portfolios' Excess Return (Alpha) over Currency Betas
Alpha
Number of managers in the portfolio
We next determine whether the currency managers in the sample possess market timing skills. A summary of the data is presented in Table 12 and Figure 7.

236 BIS Papers No 58
Table 12
Market timing skills analysis for sample currency managers
Average IR>0.5 IR<0.5 Max Min StDev
Adj R-Squared 29% 28% 33% 86% 1% 18%
Alpha 0.21% 0.47% -(0.43) 4.25% -3.07% 0.91%
t-stat 0.42 1.08 1.23 4.15 (3.64) 1.59
Carry 0.15 0.19 0.06 1.11 (5.00) 0.63
t-stat 1.80 2.17 0.94 17.53 (3.90) 2.74
Value 0.01 0.05 (0.08) 1.99 (12.25) 1.28
t-stat 0.51 0.62 0.26 16.43 (5.65) 2.30
Trend 0.16 0.14 0.21 0.84 (0.71) 0.24
t-stat 1.99 1.77 2.62 7.99 (2.74) 2.27
Volatility 0.03 0.03 0.02 2.01 (0.54) 0.22
t-stat 0.24 0.27 0.18 4.08 (3.59) 1.31
Carry-timing 2.33 2.19 2.76 109.84 (62.51) 14.89
t-stat 0.79 0.72 0.98 4.40 (3.13) 1.43
Value-timing (1.02) (0.55) (2.22) 67.01 (566.6) 49.10
t-stat 0.39 0.29 0.65 4.25 (3.22) 1.27
Trend-timing 0.50 0.09 1.54 27.89 (23.86) 4.82
t-stat 0.26 0.07 0.77 3.60 (3.27) 1.23
Volatility-timing 0.99 1.15 0.63 91.19 (24.27) 7.30
t-stat 0.54 0.62 0.36 3.65 (2.19) 1.18
Sources: Bloomberg; Binny (2005); authors’ calculations.
The percentage of managers with statistically significant alphas is halved if we consider skills in market timing.

BIS Papers No 58 237
Figure 7
Percentage of total managers with significant (at 95%) exposure to currency beta factors and market timing
0%
10%
20%
30%
40%
50%
60%
No Mkt Timing
With Mkt Timing
About a quarter of the managers in the carry category have statistically significant market timing skills. The figure is 15% for the value and volatility category and 10% for the trend-following category.
Figure 8 shows the results of the simulation of portfolios (as in Figure 6) for various combinations of managers (from 1 to 40) incorporating market timing skills. First, the percentage explained by currency betas increases and excess return (alpha) for top quartile portfolios decreases if we include market timing. Second, we can conclude that as the number of managers in the portfolio increases, the percentage explained by currency betas rises (from 30% to 60%), while monthly excess return for the top quartile portfolios drops (from 0.43% to 0.14%).
Hence, we can reconcile the findings from the analysis of currency manager indices (e.g. FXSelect) and individual managers. As we increase the number of managers in the portfolio, we find less alpha and a higher percentage of returns can be attributed to currency beta strategies, i.e. the portfolio starts looking like a manager index. Hence, historical in-sample analysis shows that simple currency betas can explain about half of the currency manager index/portfolio returns.

238 BIS Papers No 58
Figure 8
Percentage explained by currency beta strategies vs. number of managers:
impact of market timing skills
0%
10%
20%
30%
40%
50%
60%
70%
1 3 5 7 9 11 13 15 17 19 21 23 25 27 29 31 33 35 37 39 41
R-squared of regression on currency betas with market timing
R-Sq W Mkt Timing
R-Sq No Mkt Timing
0.0%
0.1%
0.2%
0.3%
0.4%
0.5%
0.6%
0.7%
1 3 5 7 9 11 13 15 17 19 21 23 25 27 29 31 33 35 37 39 41
% m
onth
ly r
etur
n
Top-Quartile Portfolios' Excess Return (Alpha) over Currency Betas
No Mkt Timing
With Mkt Timing
Number of managers in the portfolio
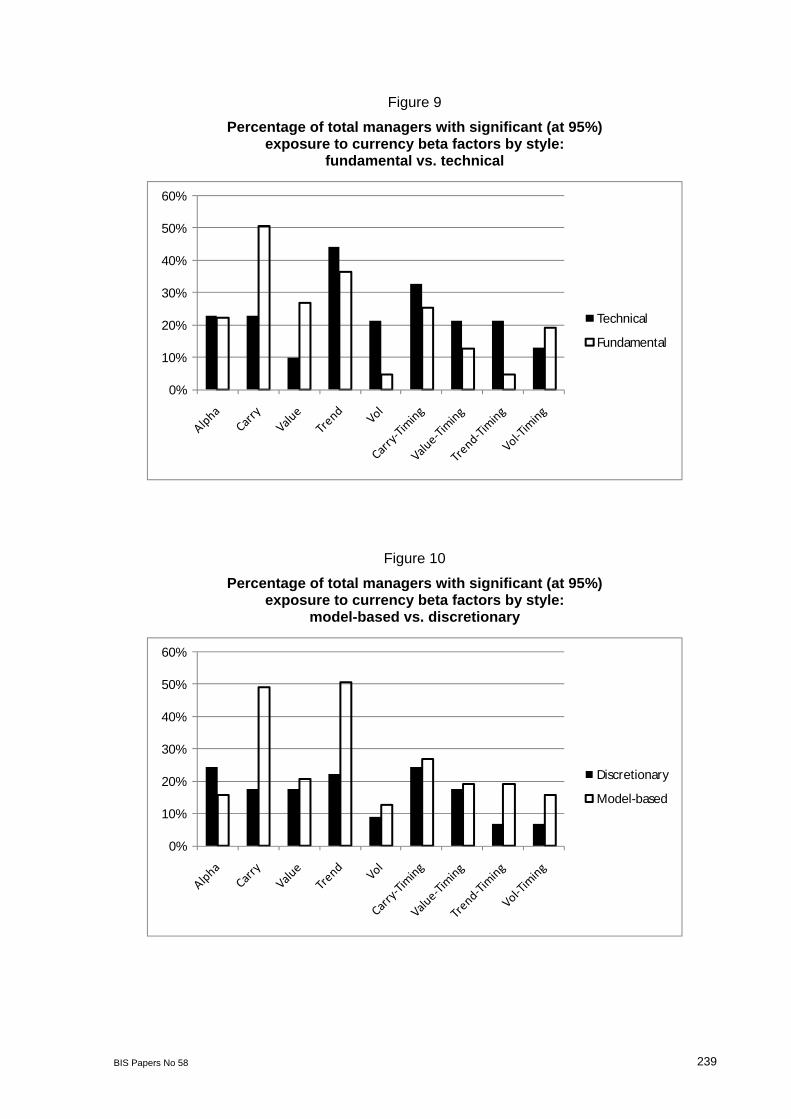
We also examine whether the managers’ beta exposures vary by self-reported trading style: fundamental vs. technical and model-based vs. discretionary. Fundamental managers use macroeconomic factors, while technical managers rely on currency prices for trading. Figure 9 illustrates the differences in exposures between technical and fundamental style managers: fundamental managers have a higher number of statistically significant exposures to carry and value beta strategies, while technical managers use trend and volatility strategies more often and are generally better at market timing. Model-based vs. discretionary style differences are based on whether the manager uses a systematic approach to trading. Figure 10 summarizes the differences in exposures for the model-based and discretionary styles. Model-based managers are much more likely to use carry and trend strategies; discretionary managers have more alpha and less beta exposures. The results are intuitive, as discretionary managers by definition should have more idiosyncrasies.
BIS Papers No 58 239
Figure 9
Percentage of total managers with significant (at 95%) exposure to currency beta factors by style:
fundamental vs. technical
0%
10%
20%
30%
40%
50%
60%
Technical
Fundamental
Figure 10
Percentage of total managers with significant (at 95%) exposure to currency beta factors by style:
model-based vs. discretionary
0%
10%
20%
30%
40%
50%
60%
Discretionary
Model-based

240 BIS Papers No 58
The general findings from the historical style analysis based on the full sample regression can be summarized as follows:
It is possible to explain up to 83% of the variation of currency manager returns using simple currency betas; the average R-squared for the sample is 23%.
About half of the currency managers in the sample have statistically significant alphas over simple currency betas (with 95% confidence).
Currency managers with higher profitability (IR>0.5) have statistically significant alpha to currency beta factors, while less profitable managers (IR<0.5) do not.
As we increase the number of managers in the portfolio, alpha starts to decrease and a higher percentage of returns (50-60%) can be attributed to currency beta strategies, i.e. the portfolio starts looking like a manager index.
Half of the statistically significant alphas can be attributed to market timing skills.
The percentage explained by currency betas increases and excess return (alpha) for top quartile portfolios decreases if we include market timing.
More than one-third of currency managers have statistically significant exposures to carry, trend, and value currency beta factors.
Fundamental managers have a higher number of statistically significant exposures to carry and value beta strategies, while technical managers use trend and volatility strategies more often and are generally better at market timing.
Model-based managers are much more likely to use carry and trend strategies, while discretionary managers have more alpha and fewer beta exposures.
Although a static full-sample analysis shows that half of the managers’ return variation is not attributed to currency beta factors, some evidence indicates that a portion of the alpha can be explained by the dynamic nature of exposures (market timing). Of course, the static full sample regression is only an approximation and might not adequately represent the actual dynamic allocations by individual managers over time.
4.3 Out-of-sample replication of currency manager indices
We turn to forward-looking out-of-sample replication to measure how much of a manager’s dollar return can be captured in practice by using simple currency beta trading strategies. Tracking replication portfolios are estimated for each manager using rolling regressions and Kalman filters. The equal-weighted, mean-variance optimized, and Black-Litterman currency beta portfolios are calculated independently and serve as benchmarks for all managers. The ultimate objective is to achieve a similar total dollar return to the target manager.
The first step is replicating the FXSelect index that has the best risk-adjusted performance among published active currency managers. We use the three most common currency betas—carry, value, and trend—that were statistically significant in the in-sample regression analysis with an R-squared of 0.41. We apply the weights from a 24-month rolling regression and the Kalman filter for the sample at time t to the portfolio at time t+1, and compare the cumulative return of $1.00 invested in the following alternatives:
1. FXSelect Manager Index
2. 24-month rolling window Regression Replic_rollreg
3. Kalman Filter Beta Replic_kf
4. Equal-weighted Beta Replic_eq
5. Mean-Variance Optimized Beta Replic_mv
6. Black-Litterman Optimized Beta Replic_BL

BIS Papers No 58 241
The results, which are presented in Figure 11 and Table 13, demonstrate that the FXSelect manager index delivers excess performance over dynamic tracking clones and the equal-weighted beta index. However, independently optimized portfolios of beta factors achieve comparable returns to the FXSelect manager index. Therefore, we conclude that the diversified active currency manager index returns can be roughly approximated using a mean-variance optimized portfolio of simple currency betas.
Figure 11
Out-of-sample replication of FXSelect index using currency beta factors
$0.90
$0.95
$1.00
$1.05
$1.10
$1.15
$1.20
$1.25
7/1/
2002
12/1
/200
2
5/1/
2003
10/1
/200
3
3/1/
2004
8/1/
2004
1/1/
2005
6/1/
2005
11/1
/200
5
4/1/
2006
9/1/
2006
2/1/
2007
7/1/
2007
12/1
/200
7
5/1/
2008
Cum
ulat
ive
Retu
rn
Cumulative Return: FXSelect vs. Tracking Replications
FXSelect
Replic_rollreg
Replic_kf
$0.90
$0.95
$1.00
$1.05
$1.10
$1.15
$1.20
$1.25
7/1/
2002
12/1
/200
2
5/1/
2003
10/1
/200
3
3/1/
2004
8/1/
2004
1/1/
2005
6/1/
2005
11/1
/200
5
4/1/
2006
9/1/
2006
2/1/
2007
7/1/
2007
12/1
/200
7
5/1/
2008
Cum
ulat
ive
Retu
rn
Cumulative Return: FXSelect vs. Independent Replications
FXSelect
Replic_mv
Replic_BL
Replic_Eq

242 BIS Papers No 58
As Table 13 shows, the statistical forecasting accuracy measures do not necessarily correspond to the risk-adjusted performance measures; for example, the naïve equal-weighted portfolio has the lowest mean absolute deviation (MAD) and mean-squared error (MSE), but has a relatively lower Sharpe ratio and percentage of positive months.
Table 13
Performance comparison: FXSelect manager index vs. currency beta replications, 2000-2008
Average Replic_ RollReg
Replic_ KalmanF
Replic_ MeanVar
Replic_ BlackLitt
Replic_ EqWeight
Ann Ret 2.2% 1.5% 1.4% 2.0% 2.2% 1.1%
Ann Vol 2.7% 3.0% 2.5% 2.4% 2.6% 2.0%
Sharpe 0.81 0.49 0.56 0.82 0.88 0.54
Cumulative Return 13% 9% 8% 12% 13% 7%
%, positive 56% 47% 44% 54% 58% 44%
Skewness 1.2 1.4 1.4 1.2 0.9 1.3
Kurtosis 2.3 2.3 1.9 3.0 1.9 1.6
MaxLoss -1% -1% -1% -1% -1% -1%
Correlation 1.00 0.69 0.70 0.50 0.50 0.68
MAD 0.5% 0.4% 0.6% 0.6% 0.4%
MSE 0.004% 0.003% 0.005% 0.006% 0.003%
Sources: Bloomberg; authors’ calculations.
In terms of portfolio weights, the rolling window replication requires frequent rebalancing of portfolio weights as Figure 12 shows, while the Kalman filter weights are slow-changing over time. Among independent replications, mean-variance optimized weights are prone to sudden and extreme changes, while the Black-Litterman portfolio is more stable. With estimation errors in mind, the FXSelect index seems to be diversified across three main styles. The relative exposures are stable over time, with larger allocations to carry and trend and smaller allocations of value strategies.
Based on these data, we can report that the FXSelect active currency manager index can be replicated out-of-sample using three currency beta strategies: carry, trend, and value. As Table 13 shows, out of cumulative excess return of 13% for the target index, the Black-Litterman beta portfolio replicated 13%, the mean-variance beta portfolio 12% and the rolling regression 9%.
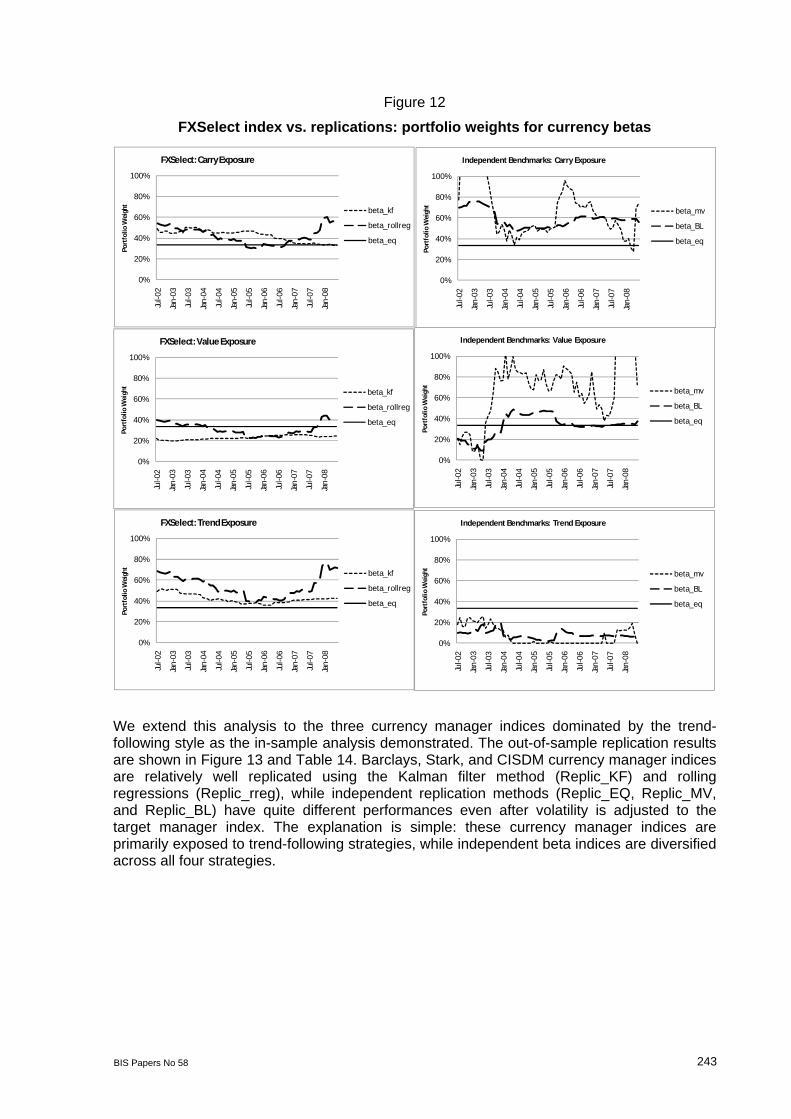
BIS Papers No 58 243
0%
20%
40%
60%
80%
100%
Jul-0
2
Jan-
03
Jul-0
3
Jan-
04
Jul-0
4
Jan-
05
Jul-0
5
Jan-
06
Jul-0
6
Jan-
07
Jul-0
7
Jan-
08
Port
folio
Wei
ght
FXSelect: Carry Exposure
beta_kf
beta_rollreg
beta_eq
0%
20%
40%
60%
80%
100%
Jul-0
2
Jan-
03
Jul-0
3
Jan-
04
Jul-0
4
Jan-
05
Jul-0
5
Jan-
06
Jul-0
6
Jan-
07
Jul-0
7
Jan-
08
Port
folio
Wei
ght
Independent Benchmarks: Carry Exposure
beta_mv
beta_BL
beta_eq
0%
20%
40%
60%
80%
100%
Jul-0
2
Jan-
03
Jul-0
3
Jan-
04
Jul-0
4
Jan-
05
Jul-0
5
Jan-
06
Jul-0
6
Jan-
07
Jul-0
7
Jan-
08
Port
folio
Wei
ght
FXSelect: Value Exposure
beta_kf
beta_rollreg
beta_eq
0%
20%
40%
60%
80%
100%
Jul-0
2
Jan-
03
Jul-0
3
Jan-
04
Jul-0
4
Jan-
05
Jul-0
5
Jan-
06
Jul-0
6
Jan-
07
Jul-0
7
Jan-
08
Port
folio
Wei
ght
Independent Benchmarks: Value Exposure
beta_mv
beta_BL
beta_eq
0%
20%
40%
60%
80%
100%
Jul-0
2
Jan-
03
Jul-0
3
Jan-
04
Jul-0
4
Jan-
05
Jul-0
5
Jan-
06
Jul-0
6
Jan-
07
Jul-0
7
Jan-
08
Port
folio
Wei
ght
Independent Benchmarks: Trend Exposure
beta_mv
beta_BL
beta_eq
0%
20%
40%
60%
80%
100%
Jul-0
2
Jan-
03
Jul-0
3
Jan-
04
Jul-0
4
Jan-
05
Jul-0
5
Jan-
06
Jul-0
6
Jan-
07
Jul-0
7
Jan-
08
Port
folio
Wei
ght
FXSelect: Trend Exposure
beta_kf
beta_rollreg
beta_eq
Figure 12
FXSelect index vs. replications: portfolio weights for currency betas
We extend this analysis to the three currency manager indices dominated by the trend-following style as the in-sample analysis demonstrated. The out-of-sample replication results are shown in Figure 13 and Table 14. Barclays, Stark, and CISDM currency manager indices are relatively well replicated using the Kalman filter method (Replic_KF) and rolling regressions (Replic_rreg), while independent replication methods (Replic_EQ, Replic_MV, and Replic_BL) have quite different performances even after volatility is adjusted to the target manager index. The explanation is simple: these currency manager indices are primarily exposed to trend-following strategies, while independent beta indices are diversified across all four strategies.

244 BIS Papers No 58
0.8
0.9
1
1.1
1.2
1.3
1.4
1.5
1.6
1/1/
1995
1/1/
1996
1/1/
1997
1/1/
1998
1/1/
1999
1/1/
2000
1/1/
2001
1/1/
2002
1/1/
2003
1/1/
2004
1/1/
2005
1/1/
2006
1/1/
2007
1/1/
2008
Cum
ulat
ive
Exce
ss R
etur
n
Cumulative Excess Return: Currency Manager Index vs. Replications
CISDM
Replic_KF
Replic_rreg
0.8
0.9
1
1.1
1.2
1.3
1.4
1.5
1/1/
1995
1/1/
1996
1/1/
1997
1/1/
1998
1/1/
1999
1/1/
2000
1/1/
2001
1/1/
2002
1/1/
2003
1/1/
2004
1/1/
2005
1/1/
2006
1/1/
2007
1/1/
2008
Cum
ulat
ive
Exce
ss R
etur
n
Cumulative Excess Return: Currency Manager Index vs. Replications
Barclay
Replic_KF
Replic_rreg
0.8
0.9
1
1.1
1.2
1.3
1.4
1.5
1/1/
1995
1/1/
1996
1/1/
1997
1/1/
1998
1/1/
1999
1/1/
2000
1/1/
2001
1/1/
2002
1/1/
2003
1/1/
2004
1/1/
2005
1/1/
2006
1/1/
2007
1/1/
2008
Cum
ulat
ive
Exce
ss R
etur
n
Cumulative Excess Return: Currency Manager Index vs. Replications
Stark
Replic_KF
Replic_rreg
0.8
1.3
1.8
2.3
2.8
3.3
1/1/
1995
1/1/
1996
1/1/
1997
1/1/
1998
1/1/
1999
1/1/
2000
1/1/
2001
1/1/
2002
1/1/
2003
1/1/
2004
1/1/
2005
1/1/
2006
1/1/
2007
1/1/
2008
Cum
ulat
ive
Exce
ss R
etur
n
Cumulative Excess Return: Manager Indices vs. Indep Replications
MVWeights
EqWeight
BLWeights
Stark
Barclay
CISDM
Figure 13
Out-of-sample replications of currency CTA manager indices
Table 14
Performance comparison: currency manager indices vs. replications
Index name Manager
index In-Sample K-
Filter Replica_K-
Filter Replica_ rollreg
RMSE - 0% 2% 2%
MAD - 0% 2% 1%
Total return 8% 24% 7% 30%
Barclays
Sharpe 0.09 0.31 0.06 0.35
RMSE - 0% 2% 2%
MAD - 0% 2% 1%
Total return 20% 28% 16% 32%
Stark
Sharpe 0.22 0.50 0.14 0.29
RMSE - 1% 3% 2%
MAD - 1% 2% 2%
Total return 26% 26% -4% 36%
CISDM
Sharpe 0.29 0.39 (0.04) 0.33
Sources: Bloomberg; authors’ calculations.

BIS Papers No 58 245
-40%
-20%
0%
20%
40%
60%
80%
100%
Jun-
95
Jul-9
6
Aug
-97
Sep-
98
Oct
-99
Nov
-00
Jan-
02
Feb-
03
Mar
-04
Apr
-05
May
-06
Jun-
07
Port
folio
Wei
ght
Barclay Index: Carry Exposure
carry_rreg
carry_KF
eq weight
-40%
-20%
0%
20%
40%
60%
80%
100%
Jun-
95
Jul-9
6
Aug
-97
Sep-
98
Oct
-99
Nov
-00
Jan-
02
Feb-
03
Mar
-04
Apr
-05
May
-06
Jun-
07
Port
folio
Wei
ght
Barclay Index: Trend Exposure
trend_rreg
trend_KF
eq weight
-40%
-20%
0%
20%
40%
60%
80%
100%
Jun-
95
Jul-9
6
Aug
-97
Sep-
98
Oct
-99
Nov
-00
Jan-
02
Feb-
03
Mar
-04
Apr
-05
May
-06
Jun-
07
Port
folio
Wei
ght
Stark Index: Carry Exposure
carry_rreg
carry_KF
eq weight
-40%
-20%
0%
20%
40%
60%
80%
100%
Jun-
95
Jul-9
6
Aug
-97
Sep-
98
Oct
-99
Nov
-00
Jan-
02
Feb-
03
Mar
-04
Apr
-05
May
-06
Jun-
07
Port
folio
Wei
ght
Stark Index: Trend Exposure
trend_rreg
trend_KF
eq weight
-100%-80%-60%-40%-20%
0%20%40%60%80%
100%120%
Jun-
95
Jul-9
6
Aug
-97
Sep-
98
Oct
-99
Nov
-00
Jan-
02
Feb-
03
Mar
-04
Apr
-05
May
-06
Jun-
07
Port
folio
Wei
ght
CISDM Index: Carry Exposure
carry_rreg
carry_KF
eq weight
-100%-80%-60%-40%-20%
0%20%40%60%80%
100%120%
Jun-
95
Jul-9
6
Aug
-97
Sep-
98
Oct
-99
Nov
-00
Jan-
02
Feb-
03
Mar
-04
Apr
-05
May
-06
Jun-
07
Port
folio
Wei
ght
CISDM Index: Trend Exposure
trend_rreg
trend_KF
eq weight
-100%-80%-60%-40%-20%
0%20%40%60%80%
100%120%
Jun-
95
Jul-9
6
Aug
-97
Sep-
98
Oct
-99
Nov
-00
Jan-
02
Feb-
03
Mar
-04
Apr
-05
May
-06
Jun-
07
Port
folio
Wei
ght
Indep Replications: Carry Exposure
carry_MV
carry_BL
eq weight
-100%-80%-60%-40%-20%
0%20%40%60%80%
100%120%
Jun-
95
Jul-9
6
Aug
-97
Sep-
98
Oct
-99
Nov
-00
Jan-
02
Feb-
03
Mar
-04
Apr
-05
May
-06
Jun-
07
Port
folio
Wei
ght
Indep Replications: Trend Exposure
trend_MV
trend_BL
eq weight
The exposures of replication indices to the currency betas are shown in Figure 14. As Figure 14 demonstrates, these indices have historically been dominated by the trend strategy, while independent replications have allocated little weight to this strategy. This finding is in line with those of Middleton (2005). Since the year 2000, trend exposures have been declining and carry allocations increasing, probably reflecting relative profitability.
Based on these results, we can conclude that, similarly to managers represented in FXSelect index, constituents of the Barclays, CISDM, and Stark currency manager indices have adjusted their aggregate allocations to currency beta strategies over time to adapt to the market environment.
Figure 14
CTA indices vs. out-of-sample replications: portfolio weights for currency betas

246 BIS Papers No 58
4.4 Out-of-sample replication of individual currency managers
This section presents the results of the individual manager replications using the tracking methodology (i.e. rolling regressions and Kalman filters) as well the independent benchmarks. Two versions of the Kalman filter replication are presented. The following abbreviations are used in the figures below: equal-weighted (EW), mean-variance optimized (MV) and Black-Litterman (BL) beta indices. The abbreviations for the Kalman filter replications are: smoothed full sample beta index with look-ahead bias (kalmanSMO) and out-of-sample forecasted beta index (kalmanFOR). All of the beta indices (RollReg, kalmanFOR, EW, MV, BL) except kalmanSMO represent out-of-sample replications as described in the methodology chapter.
Figures 15-19 compare the performance characteristics of sample currency managers vs. their beta replicated return indices.19 The figures provide data regarding average total return, Sharpe ratio, maximum monthly loss, skewness and kurtosis, and the forecasting errors in terms of MAD and MSE, as well as the correlations to the target manager.
In terms of total returns, the equal-weighted beta index achieves the highest return, followed by the BL and MV indices (Figure 15); the tracking beta indices such as kalmanFOR and RollReg achieve lower total return than independent indices. The relative underperformance of the tracking beta indices could be due to estimation errors.
Figure 15
Average total return: managers vs. beta replication indices
0%
5%
10%
15%
20%
25%
30%
35%
40%
45%
50%
Mgrs kalmanSMO kalmanFOR RollReg EW MV BL
Figure 16 presents the cumulative distribution of sample managers and replication success (in terms of percent of total target return) of various beta indices. Based on these data, we can report that the rolling regression method succeeds at fully replicating total target manager return for only 30% of the sample managers and the Kalman filter only has a success rate of 15%, although the in-sample version (kalmanSMO) has a better success rate of 40%. The rolling regression succeeds in replicating at least half of the total target return for
19 Please note that individual managers have differing lengths of reporting history and replication indices are
estimated for each manager separately using currency betas for that time period.

BIS Papers No 58 247
60% of sample managers, and the Kalman filter succeeds for 50% of the managers, although the rate is 80% for the in-sample kalmanSMO.
Figure 16
Tracking replication: CDF function vs. % of total target return
0%
10%
20%
30%
40%
50%
60%
70%
80%
90%
100%
<0 20% 40% 60% 80% 100% 120% 140% 160% 180% >200%
Cum
ulat
ive
Man
ager
Dis
trib
utio
n Fu
ncti
on
% of Total Target Manager Return Replicated
kalmanFOR
rollreg
kalmanSMO
All three independent currency beta combinations – equal-weighted, mean-variance, and Black-Litterman – can replicate the full total target return for 30% of managers (Figure 17). In terms of replicating at least half of the total target return, the mean-variance beta index succeeds for 60% of managers, while the equal-weighted and Black-Litterman beta indices do so for 50% of managers.
Figure 17
Independent replications: CDF function vs. % of total target return replicated
0%
10%
20%
30%
40%
50%
60%
70%
80%
90%
100%
<0 20% 40% 60% 80% 100% 120% 140% 160% 180% >200%
Cum
ulat
ive
Man
ager
Dis
trib
utio
n Fu
ncti
on
% of Total Target Manager Return Replicated
EW
MV
BL
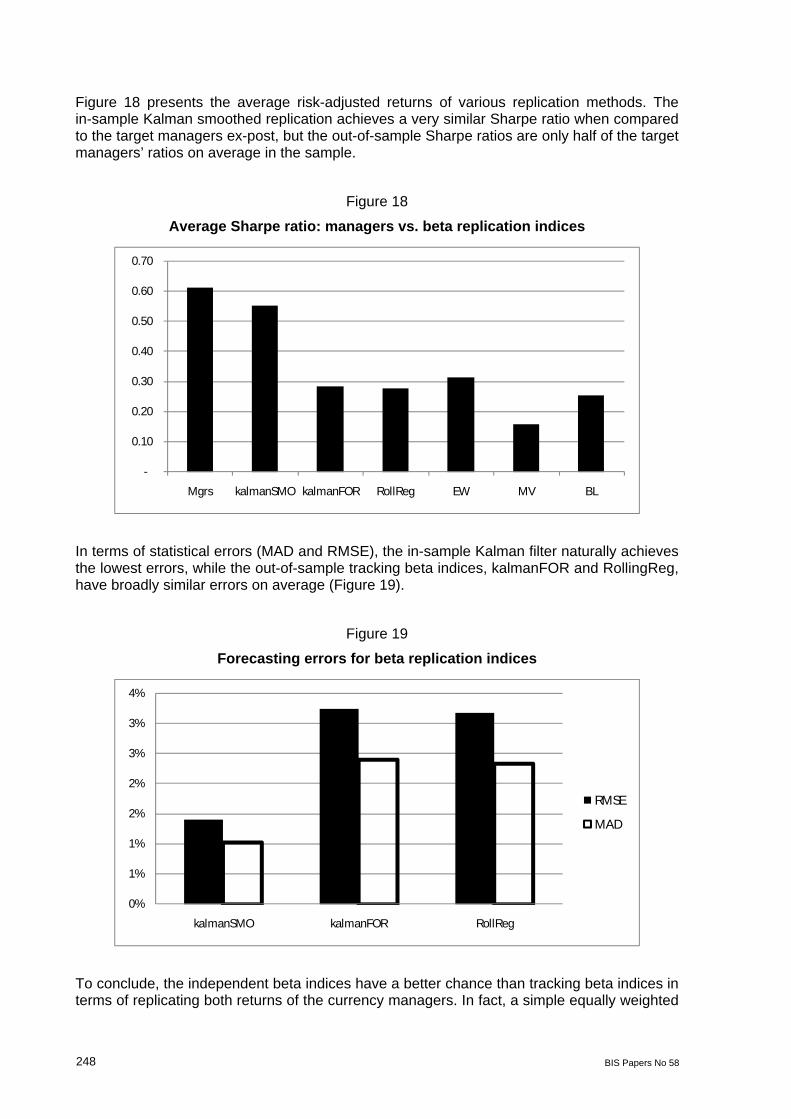
248 BIS Papers No 58
Figure 18 presents the average risk-adjusted returns of various replication methods. The in-sample Kalman smoothed replication achieves a very similar Sharpe ratio when compared to the target managers ex-post, but the out-of-sample Sharpe ratios are only half of the target managers’ ratios on average in the sample.
Figure 18
Average Sharpe ratio: managers vs. beta replication indices
-
0.10
0.20
0.30
0.40
0.50
0.60
0.70
Mgrs kalmanSMO kalmanFOR RollReg EW MV BL
In terms of statistical errors (MAD and RMSE), the in-sample Kalman filter naturally achieves the lowest errors, while the out-of-sample tracking beta indices, kalmanFOR and RollingReg, have broadly similar errors on average (Figure 19).
Figure 19
Forecasting errors for beta replication indices
0%
1%
1%
2%
2%
3%
3%
4%
kalmanSMO kalmanFOR RollReg
RMSE
MAD
To conclude, the independent beta indices have a better chance than tracking beta indices in terms of replicating both returns of the currency managers. In fact, a simple equally weighted
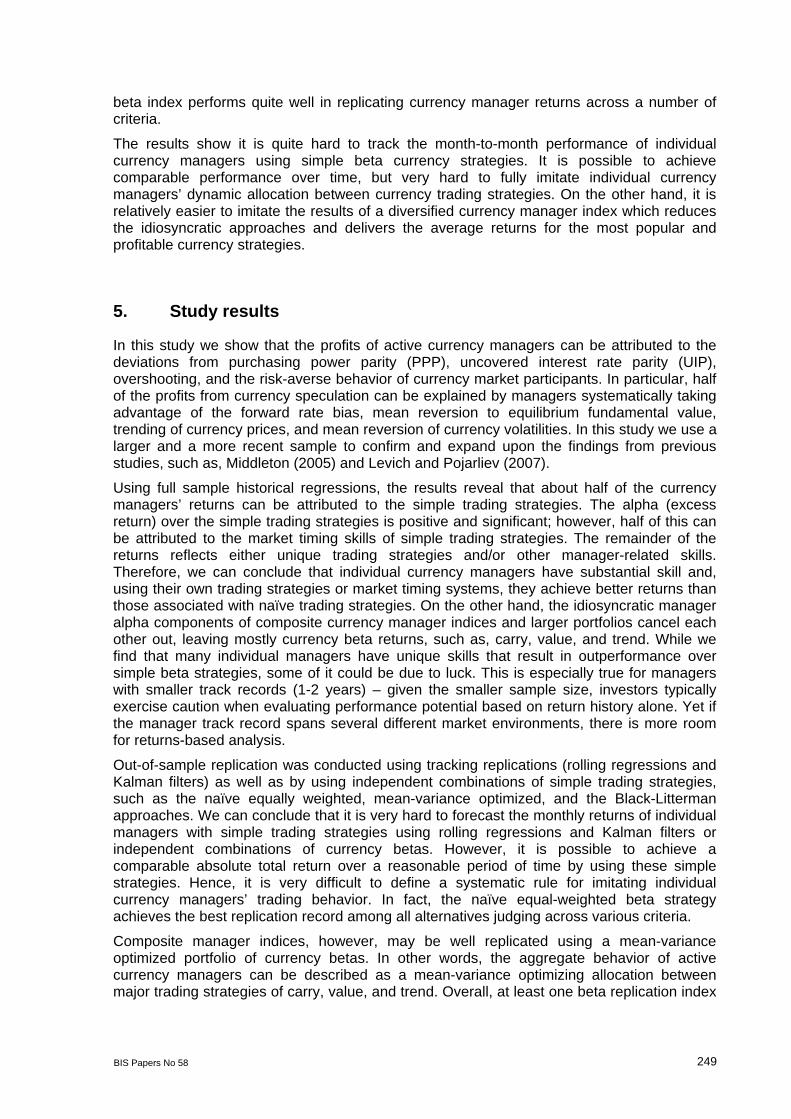
BIS Papers No 58 249
beta index performs quite well in replicating currency manager returns across a number of criteria.
The results show it is quite hard to track the month-to-month performance of individual currency managers using simple beta currency strategies. It is possible to achieve comparable performance over time, but very hard to fully imitate individual currency managers’ dynamic allocation between currency trading strategies. On the other hand, it is relatively easier to imitate the results of a diversified currency manager index which reduces the idiosyncratic approaches and delivers the average returns for the most popular and profitable currency strategies.
5. Study results
In this study we show that the profits of active currency managers can be attributed to the deviations from purchasing power parity (PPP), uncovered interest rate parity (UIP), overshooting, and the risk-averse behavior of currency market participants. In particular, half of the profits from currency speculation can be explained by managers systematically taking advantage of the forward rate bias, mean reversion to equilibrium fundamental value, trending of currency prices, and mean reversion of currency volatilities. In this study we use a larger and a more recent sample to confirm and expand upon the findings from previous studies, such as, Middleton (2005) and Levich and Pojarliev (2007).
Using full sample historical regressions, the results reveal that about half of the currency managers’ returns can be attributed to the simple trading strategies. The alpha (excess return) over the simple trading strategies is positive and significant; however, half of this can be attributed to the market timing skills of simple trading strategies. The remainder of the returns reflects either unique trading strategies and/or other manager-related skills. Therefore, we can conclude that individual currency managers have substantial skill and, using their own trading strategies or market timing systems, they achieve better returns than those associated with naïve trading strategies. On the other hand, the idiosyncratic manager alpha components of composite currency manager indices and larger portfolios cancel each other out, leaving mostly currency beta returns, such as, carry, value, and trend. While we find that many individual managers have unique skills that result in outperformance over simple beta strategies, some of it could be due to luck. This is especially true for managers with smaller track records (1-2 years) – given the smaller sample size, investors typically exercise caution when evaluating performance potential based on return history alone. Yet if the manager track record spans several different market environments, there is more room for returns-based analysis.
Out-of-sample replication was conducted using tracking replications (rolling regressions and Kalman filters) as well as by using independent combinations of simple trading strategies, such as the naïve equally weighted, mean-variance optimized, and the Black-Litterman approaches. We can conclude that it is very hard to forecast the monthly returns of individual managers with simple trading strategies using rolling regressions and Kalman filters or independent combinations of currency betas. However, it is possible to achieve a comparable absolute total return over a reasonable period of time by using these simple strategies. Hence, it is very difficult to define a systematic rule for imitating individual currency managers’ trading behavior. In fact, the naïve equal-weighted beta strategy achieves the best replication record among all alternatives judging across various criteria.
Composite manager indices, however, may be well replicated using a mean-variance optimized portfolio of currency betas. In other words, the aggregate behavior of active currency managers can be described as a mean-variance optimizing allocation between major trading strategies of carry, value, and trend. Overall, at least one beta replication index

250 BIS Papers No 58
matches over 100% of total return for FXSelect, Barclays, Stark and CISDM composite currency manager indices.
The key contributions to the academic literature resulting from this study are that we can explain about half of the returns from currency speculation by capturing the forward rate bias (the carry factor), timing the deviations from PPP (the value factor), currency trending behavior (overshooting, interventions, etc.) and risk-aversion (volatility).
How then do we reconcile the random walk nature of exchange rates and the profitability of the active currency managers? In our results we find that about half of the active currency managers have statistically significant exposures to carry beta strategy. Forward rate bias is a UIP violation, the failure of future spot rates to offset the forward implied interest rate differential between two currencies. Although spot rates resemble the random walk at shorter horizons, the interest rate differentials embedded in the forward rates are rather slow-moving and allow some predictability (Burnside et al., 2006). The empirical properties of carry profits resemble insurance premiums; they tend to be erased during market crises and typically have a negative skew. A skilled currency manager captures the carry profits during periods of low volatility and avoids the strategy during volatile times.
Although the short-term spot exchange rate behavior is very close to a random walk, over longer horizons the exchange rates tend to revert to the fundamental equilibrium values (PPP, etc.). As highlighted in Killan and Taylor (2003), the likelihood of reversion to the mean is higher for significant deviations from the equilibrium, and currency managers are able to capture this tendency using customized trading rules. Value strategy typically has a positive skew. This strategy is less profitable because few currencies are substantially over- or undervalued at a given point in time, thus limiting the scope for profits. The study’s results show that about one-third of the managers have statistically significant exposure to the value strategy.
The results also demonstrate that almost half of the currency managers maintain statistically significant exposures to the trend-following strategy. Trend-following is driven by the autocorrelation of currency prices over various horizons. Autocorrelation can be purely spurious or a result of central bank intervention, currency overshooting, continuous economic expansion, or a sell-off during a market crisis (Meese et al., 2002; Neely et al., 2007; Xin, 2003). In the very short term, the autocorrelation can be the result of investor positioning (for example, using stop-loss limits). Currency trend-following is based on moving average crossovers and filters. It does not reflect the underlying economic rationale; rather, it focuses on the empirical properties of short-term currency movements. Although it does not require extensive macroeconomic research, strict risk management is a must for getting out of losing trades—it is not a surprise that trend-following strategy returns typically exhibit a positive skew. Trend-following was the most profitable currency trading strategy before the year 2000, but it did not perform well again until the 2008 market crisis. There is some evidence of trend-following being profitable in high frequency (intra-day) trading and in emerging market currencies.
Finally, about one-fifth of the currency managers use the volatility strategy, taking advantage of the mean reversion of currency price volatilities. During sell-offs, market participants tend to favor certain currencies such as the Japanese yen, Swiss franc or U.S. dollar despite their macroeconomic fundamentals. Volatility also tends to spike around macroeconomic announcements or political events and then tends to return to normal. Currency managers can take advantage of the mean reversion properties of volatilities.
We make a further contribution to the academic literature about active currency managers by adapting the hedge fund methodology to replicate the manager returns out-of-sample. The findings show that while the total dollar return of composite manager indices and diversified manager portfolios can be replicated over time, it is not as easy to imitate the dynamic trading and allocation strategies of individual currency managers. The proposed allocation
BIS Papers No 58 251
rules could fully replicate the total dollar return for only 30% of the managers, while half of the total return could be replicated for up to 60% of managers.
These results have several implications for both public and private investment practitioners. First, the results provide further evidence that the main trading strategies defined in the literature, such as carry, value, trend, and volatility, can explain the substantial portion of aggregate profits from active currency management. Second, the findings demonstrate that it is not easy to replicate the trading approach of any individual manager, although achieving a similar absolute dollar return over time is quite possible. Third, the results show that it is much easier to replicate a diversified portfolio or a composite index of currency managers using simple currency betas, as individual alphas tend to cancel out. Hence, private and, in particular, public investors can use the active currency replication index as an alternative mechanism or, more importantly, as a redundancy risk evaluator for currency risk management or investment. Although this vehicle also provides an alternative for investors as a less expensive currency beta composite index (as opposed to a more expensive diversified currency manager fund), we note a need for a very high degree of caution in that application. Instead, we encourage the use of a less expensive currency beta composite index as a venue for enhancing our knowledge and evaluating the management and ROR of existing active currency funds. This currency beta composite index may have multiple applications, ranging from education and tracking market strategies to ROR, either before investing public or private funds or in parallel to track and gauge the management of funds already invested with large currency fund managers. It would provide public investors with an additional redundant mechanism that serves as a companion risk evaluator or performance gauge to make more informed choices with respect to currency risk management. We believe this contributes to the best practices in the arena of public fund investments.
The caveat is, of course, that things change rapidly, especially in currency markets. Andrew Lo states in his adaptive markets hypothesis that simple trading strategies will become less profitable over time and will have to be modified to achieve competitive return (Lo, 2004). Therefore, it may be reasonable to conclude that individual managers will be more adaptive to market conditions and will revise their active currency trading models and strategies to remain profitable, while simple strategy formulations become obsolete over time.
Future research in this area could focus on identifying other trading strategies commonly used by active currency managers that could shed further light on how profits are generated from currency trading. In particular, defining the trading rules that capture the non-linear properties of currency manager returns, such as market timing, could help better replicate the currency manager returns out-of-sample. Alternatively, future research could also focus on better statistical methodologies to replicate the profits using existing simple strategies.
References
Acar, E. and Pojarliev, M. (2009). Currency management indices: what do they tell us? In A.Middleton, Foreign Exchange: A Practitioner’s Approach to the Market. London: RiskBooks.
Adler, M., & Dumas, B. (1983). International portfolio choice and corporate finance: A synthesis. The Journal of Finance 38, 925–984.
Agarwal, L., and Naik, N. (2000). Generalised Style Analysis of Hedge Funds. Journal of Asset Management, 1, 93–109.
Agarwal, V., & Naik, N. (2004). Risk and Portfolio Decisions Involving Hedge Funds. Review of Financial Studies, 17, 63–98.
Alexius, A. (2001). Uncovered Interest Parity Revisited. Review of International Economics, 9 (3), 505–517.
252 BIS Papers No 58
Allen, H., & Taylor, M. (1990). Charts, noise, and fundamentals in the foreign exchange market. Economic Journal, 29, 49–59.
Allen, H., & Taylor, M. (1992). The use of technical analysis in the foreign exchange market. Journal of International Money and Finance, 11, 3, p.304–314.
Andersen, T., Bollerslev, T., Diebold, F., & Vega, C. 2003. Micro Effects of Macro Announcements: Real-Time Price Discovery in Foreign Exchange. American Economic Review, American Economic Association, vol. 93(1), pages 38-62, March.
Backus, D., Foresi, S., & Telmer, C. (2001). Affine term structure models and the forward premium anomaly. Journal of Finance 56, 279–304.
Backus, D., Gregory, A., & Telmer, C. (1993). Accounting for forward rates in markets for foreign currency. Journal of Finance 48, 1887–1908.
Bank for International Settlements. (2007). Triennial Central Bank Survey of Foreign Exchange and Derivatives Market Activity. Basle.
Bank for International Settlements. (2010). Triennial Central Bank Survey of Foreign Exchange and Derivatives Market Activity in April 2010 - Preliminary global results – Turnover. Basle.
Bekaert, G., & Hodrick, R. J. (1993). On biases in the measurement of foreign exchange risk premiums. Journal of International Money and Finance, Elsevier, vol. 12(2), pages 115-138, April.
Bilson, J. (1981). The speculative efficiency hypothesis. Journal of Business, 54, 435–451.
Binny, J. (2005). Currency management style through the ages. The Journal of Alternative Investments, Winter 2005, Vol. 8, No. 3: pp. 52-59.
Black, F., and Litterman, R. (1992). Global Portfolio Optimization. Financial Analysts Journal.
Burnside, C., Eichenbaum, M., Kleschelski, I., & Rebelo, S. (2006). The returns to currency speculation. NBER working paper (12916).
Burnside, C., Eichenbaum, M., Kleschelski, I., & Rebelo, S. (2008). Do peso problems explain the returns to the carry trade?," NBER Working Papers 14054, National Bureau of Economic Research, Inc.
Cheung, Y. & Chinn, M. & Pascual, A. (2005). Empirical exchange rate models of the nineties: Are any fit to survive? Journal of International Money and Finance, Elsevier, vol. 24(7), pages 1150-1175, November.
Duarte, J., Longstaff, F. and Yu, F. (2006). Risk and Return in Fixed Income Arbitrage: Nickels in front of a Steamroller? Available at SSRN: http://ssrn.com/abstract=872004.
Evans, M. (2002). FX trading and exchange rate dynamics. Journal of Finance 57, 2405–2448.
Evans, M., and Lyons, R. (2004). Exchange-rate fundamentals and order flow. Mimeo, Georgetown University.
Evans, M., & Lyons, R. (2005). Meese–Rogoff redux: micro-based exchange-rate forecasting. NBER Working Paper (11042).
Fama, E. F. (1984). Forward and spot exchange rates. Journal of Monetary Economics 14, 319– 338.
Fisher,L., & Kamin, J.H. (1985). Forecasting systematic risk: Estimates of 'raw' beta that take account of the tendency of beta to change and the heteroskedasticity of residual returns. Journal of Financial and Quantitative Analysis, 20, 127–149.

BIS Papers No 58 253
Fung, W., & Hsieh, D. (1997). Empirical characteristics of dynamic trading strategies: The case of hedge funds. Review of Financial Studies, 10, 275–302.
Fung, W., & Hsieh, D. (2000). Performance characteristics of hedge funds and commodity funds: Natural vs. spurious biases. Journal of Financial and Quantitative Analysis, 35, 291–307.
Fung, W., & Hsieh, D. (2001). The Risk in hedge fund strategies: Theory and evidence from trend followers. Review of Financial Studies, 14, 313–341.
Fung, W., & Hsieh, D. (2002). The Risk in fixed-income hedge fund styles. Journal of Fixed Income, 12, 6-27.
Fung, W., & Hsieh, D. (2004). Hedge fund benchmarks: A risk-based approach. Financial Analysts Journal, 60, 65–80.
Fung, W., & Hsieh, D. (2006). Hedge Funds: An Industry in Its Adolescence. Federal Reserve Bank of Atlanta Economic Review, Fourth Quarter, 91, 1-33.
Fung, W., & Hsieh, D. (2007). Hedge fund replication strategies: implications for investors and regulators. Banque de France Financial Stability Review – Special issue on hedge funds, No. 10.
Fung, W., Hsieh, D., Ramadorai, T. and Naik, N., Hedge Funds: Performance, Risk and Capital Formation (2006). AFA 2007 Chicago Meetings Paper. Available at SSRN: http://ssrn.com/abstract=778124.
Galati, G., and Melvin, M. (2004, December). Why has FX trading surged? BIS Quarterly Review.
Gallardo, P., and Heath, A. (2009, March). Execution methods in foreign exchange markets. BIS Quarterly Review.
Glosten, L. and Jagannathan, R. (1994). A Contingent Claim Approach to Performance Evaluation.” Journal of Empirical Finance, 1, 133-160.
Hafeez, B. (2006) “Currencies: Pension Saviour?” Deutsche Bank Global Markets Research.
Hansen, L. P., & Hodrick, R. (1980). Forward exchange rates as optimal predictors of future spot rates: An econometric analysis. Journal of Political Economy, 88(5), 829–853.
Hasanhodzic, J., & Lo, A. (2007). Can hedge-fund returns be replicated?: The linear case. Journal of Investment Management 5, 5–45.
He, G., and Litterman, R. (1999). The Intuition Behind Black-Litterman Model Portfolios. Goldman Sachs Asset Management Working paper.
Hersey, B., and Minnick, J. (2000, February). Active Managers Generating Positive Excess Returns over Benchmarks. Global Pensions .
Irwin, S. and Park, C. (2007). What Do We Know About the Profitability of Technical Analysis? Journal of Economic Surveys, Vol. 21, No. 4, pp. 786-826, September 2007. Available at SSRN: http://ssrn.com/abstract=1006275 or doi:10.1111/j.1467-6419.2007.00519.x.
Jorda, O. and Taylor, A. (2009). The Carry Trade and Fundamentals: Nothing to Fear But FEER Itself. Working Paper.
Kilian, L. (1997, December). Exchange Rates and Monetary Fundamentals: What Do We Learn from Long-Horizon Regressions? Working paper, University of Michigan.
Kilian, L., & Taylor, M. P. (2003). Why is it so difficult to beat the random walk forecast of exchange rates. Journal of International Economics, 60, 85–107.

254 BIS Papers No 58
Knott, D. (2002). A Guide to Currency Overlay Management. Deutsche Bank Global Markets Research.
Ladekarl, J., and Nasypbek, S. (2009). Active Currency: Worth the Risk?. In A.Middleton, Foreign Exchange: A Practitioner’s Approach to the Market (p. 16). London: RiskBooks.
LeBaron, B. (1992). Do moving average trading rule results imply nonlinearities in foreign exchange markets. University of Wisconsin Social Science Research Working Paper (9222).
LeBaron, B. (2000). Technical Trading Profitability in Foreign Exchange Markets in the 1990’s. Brandeis University Working Paper.
Lequeux, P. (2001). Trading style analysis of leveraged currency funds. Journal of Asset Management, 2(1), 56–74.
Lequeux, P., & Acar, E. (1998). A dynamic index for managed currencies funds using CME currency contracts. European Journal of Finance, 4(4), 311–330.
Levich, R. and Pojarliev, M. (2007). Do professional currency managers beat the benchmark? NBER Working Paper (13714).
Levich, R. and Pojarliev, M. (2010) Detecting Crowded Trades in Currency Funds. NYU Working Paper No. FIN-09-037. Available at SSRN: http://ssrn.com/abstract=1548820.
Levich, R., & Thomas, L. (1993). The significance of technical trading-rule profits in the foreign exchange market: A bootstrap approach. Journal of International Money and Finance, 12,, 451–474.
Lintner, J. (1965). The valuation of risk assets and the selection of risky investments in stock portfolios and capital budgets. Review of Economics and Statistics, 47 (1), 13-37.
Litterman, R. (2005). Beyond Active Alpha. Goldman Sachs Asset Management.
Lo, A. (2001). Risk management for hedge funds: Introduction and overview. Financial Analysts Journal, 57, 16–33.
Lo, A. (2004). The Adaptive Market Hypothesis: Market Efficiency from an Evolutionary Perspective. Journal of Portfolio Management 30, 15–29.
Lyons, R. K. (2001). The Microstructure Approach to Exchange Rates. Cambridge, MA: MIT Press.
MacDonald, R. (2007). Exchange Rate Economics: Theory and Evidence. Routledge.
Mark, N. (1995). Exchange rates and fundamentals: Evidence on long-horizon predictability. American Economic Review, 85, 201–218.
Markowitz, H. (1952). Portfolio selection. The Journal of Finance 7 (1): 77–91.
Meese, R. A., & Rogoff, K. (1983). Empirical exchange rate models of the seventies: Do they fit out of sample? Journal of International Economics, 14, 3–24.
Meese, R. A., and Rogoff, K. (1983). The Out-of-Sample Failure of Empirical Exchange Rate Models: Sampling Error or Misspecification? In J. Frankel (Ed.), Exchange Rates and International Macroeconomics. Chicago: NBER and University of Chicago Press.
Meese, R et al. (2002). Currency Management Handbook. Barclay Global Investors.
Middleton, A. (2005, Summer). Trading Style Analysis: A Quantitative Assessment of the Currency Industry. The Journal of Alternative Investment, 14-28.
Middleton, A. (2006). Active Currency Benchmarks: Shedding Light on Performance. Bank of America Global Foreign Exchange, Monograph Series: Number 239.
Mitchell, M., and Pulvino. T. (2001). Characteristics of risk in risk arbitrage. Journal of Finance, 56, no. 6:2135–75.
BIS Papers No 58 255
Neely, C., Weller, P., and Ulrich, J. M. (2007). The Adaptive Markets Hypothesis: Evidence from the Foreign Exchange Market. Federal Reserve Bank of St. Louis Working Paper (2006-046B).
Okunev, J., & White, D. (2003). Do momentum-based strategies still work in foreign currency markets? Journal of Financial and Quantitative Analysis,38, 425–47.
Osler, C. L. (2003). Currency orders and exchange rate dynamics: an explanation for the predictive success of technical analysis. Journal of Finance, 58, 1791–1819.
Pojarliev, M., and Levich, R. M. (2007). Do professional currency managers beat the benchmark? NBER Working Paper (13714).
Pukthuanthong-Le, K., Levich, R. M., and Thomas III, L. R. (2006, November). Do Foreign Exchange Markets Still Trend? Working paper.
Quintana, J.M. (1992). Optimal portfolios of forward currency contracts. Bayesian Statistics 4, ( J.O. Berger, J.M. Bernardo, A.P. Dawid and A.F.M. Smith, eds), Oxford University Press.
Putnam, B. and Quintana, J. (1994). New Bayesian statistical approaches to estimating and evaluating models of exchange rates determination. Proceedings of the ASA Section on Bayesian Statistical Science, 1994 Joint Statistical Meetings, American Statistical Association.
Rogoff, J., & Meese, A. (1983). Can macro models forecast? Journal of International Economics, 65-78.
Roncalli, T., & Teiletche, J. (2008). An alternative approach to alternative beta. Journal of Financial Transformation, Cass-Capco Institute Paper Series on Risk.
Roncalli, T., & Weisang, J. (2009). Tracking Problems, Hedge Fund Replication and Alternative Beta. Working paper. Available at SSRN: http://ssrn.com/abstract=1325190.
Rosenberg, M. (2003). Exchange rate determination: models and strategies for exchange rate forecasting. McGraw-Hill.
Ross, S. (1976). The arbitrage theory of capital asset pricing. Journal of Economic Theory 13 (3): 341–360.
Sarno, L., and Taylor, M. P. (2002). The Economics of Exchange Rates. Cambridge University Press.
Sarno, L., Valente, G., & Leon, H. (2006). Nonlinearity in Deviations from Uncovered Interest Parity: An Explanation of the Forward Bias Puzzle. Review of Finance, 10((3), 443–482.
Schneeweis, T., and Spurgin,R. (1998). Multifactor analysis of hedge fund, managed futures, and mutual fund return and risk characteristics. Journal of Alternative Investments 1, no. 2:1–24.
Sharpe, W. (1964). Capital asset prices: A theory of market equilibrium under conditions of risk. Journal of Finance, 19 (3), 425-442.
Sharpe, W. F. (1992). Asset allocation: management style and performance measurement. Journal of Portfolio Management, 18 (2), 719.
Shleifer, A. and Vishny, R. (1995). The Limits of Arbitrage. NBER Working Paper No. W5167. Available at SSRN: http://ssrn.com/abstract=225230.
Strange, B. (1998). Currency Overlay Managers Show Consistency. Pensions and Investments (15).
Taylor, M., Peel, D. & Sarno, L. (2001). Nonlinear Mean-Reversion in Real Exchange Rates: Toward a Solution to the Purchasing Power Parity Puzzles. International Economic Review, Department of Economics, University of Pennsylvania and Osaka University Institute of Social and Economic Research Association, vol. 42(4), pages 1015-42, November.

256 BIS Papers No 58
Treynor, J. (1961). Market Value, Time, and Risk. Unpublished manuscript.
Walters, J. (2009). The Black-Litterman Model in Detail. Working Paper. Available at SSRN: http://ssrn.com/abstract=1314585.
Weisman, J. (2010). New Bank Rules Sink Stocks: Obama Proposal Would Restrict Risk-Taking by Biggest Firms as Battle Looms. Wall Street Journal. Retrieved on Feb 13, 2010 from: http://online.wsj.com/article/SB10001424052748703699204575016983630045768.html.
West, M. and Harrison, J. (1999). Bayesian Forecasting and Dynamic models, 2nd edition, New York, Springer.
Xin, H. (2003). Currency Overlay: A Practical Guide. Risk Books.