exploration targeting from prospectivity modelling of...
TRANSCRIPT

1
Exploration Targeting from Prospectivity Modelling of Multiple Deposit Types in the Lachlan Fold Belt,
NSW
A.V.M. Miller1, G.A. Partington
1, S.H.H. Nielsen
1, K.J. Peters
1 and E. Puccioni
1
1 Kenex Ltd, P.O. Box 41136, Eastbourne, Wellington, [email protected]
Abstract
Prospectivity modelling has been completed over the Lachlan Fold Belt, New South Wales, Australia, using the
GIS based weights of evidence modelling technique to target porphyry Cu-Au, associated skarn Cu-Au, orogenic
Au and VMS Au mineralisation. The Lachlan Fold Belt is a 700 km wide belt of Paleozoic accretionary terrains,
stretching from Queensland to Tasmania. Porphyry and skarn mineralisation was associated with Ordovician
shoshonitic magmatism, which was followed by Silurian regional metamorphism and deposition of orogenic
gold deposits. Contemporaneous VMS-style mineralisation resulted in deposits in intra-arc rift basins of the
Macquarie Arc.
In preparation for the prospectivity modelling, lithological and structural data, extensive geophysical surveys and
stream, drill-hole and rock chip geochemistry were used to create predictive maps that represent various parts of
the mineral systems being modelled. Included in the models are maps that identify possible sources of heat and
mineralised fluids, structures used for fluid migration, mineral trap zones, and outflow zones that may indicate a
subsurface deposit. Prospectivity maps have been created for each mineralisation style and new areas of each
deposit type located. The models have also independently identified areas of proven mineralisation, including
Cadia, Northparkes, Woodlawn and other large producing mines.
The prospectivity maps were reclassified to generate targets by delineating highly prospective areas from each
model. Targets were compared and overlap examined among the four models, before further analysis of high
priority targets. Single targets or clusters of targets were individually assessed by incorporating information such
as tenure, geology, geochemistry and geophysical signature. Economic and risk factors were assessed and the
targets ranked and mapped according to high and low exploration risk. Following this analysis, targets of interest
can be highlighted as potential projects for acquisition, or used to prioritise new exploration data collection.
Keywords: mineral prospectivity modelling, exploration targeting, mineral systems approach, skarn deposits,
orogenic gold, porphyry copper-gold, VMS, Lachlan Fold Belt.
Introduction
Mineral prospectivity modelling with GIS (Bonham-Carter, 1994) is increasingly being used
by geoscientists in industry, government and academia to assess exploration areas and
produce effective exploration targeting methodologies. A number of prospectivity modelling
techniques have been developed, including weights of evidence, fuzzy logic and artificial
neural networks, which have been applied to a wide range of mineral deposit types, from
prospect to nationwide scales and in data-rich and data-poor study areas. More recently,
prospectivity modelling has expanded into the 3D domain. The outputs of these models are
mineral potential maps, which although useful can be improved for use in exploration
targeting by incorporating economic or social data. It is important to realise that these maps
are a starting point for further investigations, and that additional targeting techniques need to
be applied including determining post probability cut-offs for targets and reclassification.
In this paper we present an example of how GIS-based prospectivity models may be used as
input for further exploration targeting. By comparing prospectivity modelling of four mineral

2
deposit types, porphyry copper-gold, skarn, orogenic gold and volcanogenic massive sulphide
(VMS) gold, over the Lachlan Fold Belt in New South Wales, Australia. The models use the
mineral systems approach (McCuaig et al., 2010) to determine key predictive variables that
define each mineralisation style. The mineral potential maps from each model have then been
used to delineate the most prospective areas and define high priority targets. The targets either
represent existing prospects or mines or areas where new mineralisation could be discovered
with further exploration and development.
Regional geology
The model area contains the Macquarie Arc within the Lower Paleozoic Lachlan Fold Belt
(LFB) of New South Wales (NSW) (Figure 1). The Macquarie Arc is one of several ancient
intra-oceanic island arcs that accreted onto the Australian tectonic plate, accompanied by
mineralising magmatism and orogenic gold deposition. The LFB hosts some of Australia’s
highest productivity mines, including Cadia, Woodlawn and Northparkes, with an estimated
total of greater than 80 Moz Au and 13 Mt Cu (Cooke et al., 2007).
The Lower Paleozoic LFB is one of the five orogenic belts in the Tasman Fold Belt System
that makes up the eastern third of the Australian continent (Walshe et al, 1995). The LFB
extends from eastern Tasmania through Victoria and has much of its best exposure in NSW
(Figure 1). The LFB is a complex orogenic belt that developed from the Late Cambrian to
Carboniferous (Crawford et al., 2007). These accretionary processes began with the collision
of the Macquarie Arc with the proto-Pacific margin of Gondwanaland during the sustained
Benambran Orogeny in the Late Ordovician to Early Silurian. The Macquarie Arc was
accreted as a single arc that has since been disrupted and dismembered by E-W extension and
arc-parallel strike-slip faulting (Cooke et al., 2007). Prior to and during collision, the
Macquarie Arc hosted numerous small VMS-style mineralised deposits in intra-arc rift basins.
The rocks constituting the now-dislocated Macquarie Arc now occur in four structural belts in
the Eastern sub-province of the Lachlan Orogen, which have been correlated using
stratigraphic and trace element geochemical methods (Glen et al., 2011). These belts are the
western Junee-Narromine Volcanic Belt, the central Molong Volcanic Belt, the eastern
Rockley-Gulgong Volcanic Belt and the southern Kiandra Volcanic Belt. Four different
phases of magmatism are related to the episodic evolution of the Macquarie Arc over
approximately 50 million years from Early Ordovician to Early Silurian. This is supported by
geochronological, geochemical and stratigraphic evidence (Fergusson, 2009). The earliest
three phases in the Early, Middle and Late Ordovician are characterised by high-K calc-
alkaline and shoshonitic magmatism over several of the four structural belts. The final phase
in the Early Silurian emplaced dominantly shoshonitic intrusions and lavas, and is closely
associated with several key skarn and porphyry copper-gold deposits in the Macquarie Arc.
The Early Silurian saw the end of arc-related magmatism during the Benambran Orogeny.
Deformation continued in the Late Silurian to Early Devonian with the Bindian Orogeny, and
in the Middle Devonian with crustal melting and granitoid emplacement during the
Tabberabberan Orogeny. Within this timeframe, Silurian regional metamorphism and
Devonian remobilisation, together with constant crustal heating, resulted in the deposition of
orogenic-style mineralisation. The spatial focus of these deposits is in the west of the LFB,
away from the west-dipping subduction zone beneath the Gondwana plate. Further tectonic
activity occurred in the Early Carboniferous Kanimblan Orogeny, after which the pre-cratonic
phase was terminated and the area became neocratonic (Suppel and Scheibner, 1990).

3
Figure 1. Lachlan Fold Belt and Macquarie Arc study area with Macquarie Arc volcanic belts, regional
fault zones and training data for porphyry, skarn, orogenic and VMS prospectivity models.

4
Mineral System Models Porphyry-related metal deposits are large-tonnage, generally low-grade, hydrothermal
mineralisation related to igneous intrusions emplaced at high crustal levels. Porphyry metal
deposits are significant repositories of copper, gold, and molybdenum and account for over
one half of the world's copper production. They are characterised by widespread alkaline or
calc-alkaline volcanism that is underlain by extensive intrusions of a similar basaltic to
rhyolitic composition. Porphyry copper-gold deposits were first discovered in the LFB in
1976 with the Endeavour 22 deposit, which was followed by discovery of porphyries at Cadia
(c. 40 Moz Au, 8 Mt Cu) and Northparkes (c. 2.1 Moz Au, 1.5 Mt Cu). Together, these
districts constitute the largest porphyry province in Australia (Cooke et al, 2007).
Skarn deposits are important sources of precious metals as well as base metals, tungsten and
iron. Skarns are coarse-grained metamorphic rocks composed of calcsilicate minerals that
form by high-temperature replacement of carbonate-bearing rocks, in most cases during
contact or regional metamorphism and metasomatism in orogenic tectonic settings. Skarn
genesis is intimately related to that of porphyry systems, with skarns frequently located
proximal to porphyry deposits. Both calc-alkaline and alkaline skarns are present in the LFB,
usually located within metasomatic alteration halos where porphyry intrusions intersect
carbonate-bearing lithologies. Many skarn deposits were discovered as a result of historic
prospecting, with more located in the 1970s following increased focus on porphyry-style
deposits using new exploration methods, including the Doradilla and Red Hill skarns.
Orogenic gold deposits are an integral component of many metamorphic belts (Groves et al.,
2003). These deposits are believed to form from late-stage fluids mobilised by metamorphic
dehydration reactions, specifically across the greenschist-amphibolite facies boundary
(Groves, 2003). Orogenic gold deposits are diverse in terms of their age, geometry, structural
controls, host rocks, temperature and pressure of formation and consequent alteration
assemblages and metal associations. In the LFB, metamorphism of the dislocated Macquarie
Arc resulted in orogenic gold deposition, including the Old Reef/Challenger Line and the
Cowel Project. Orogenic mineral occurrences in the LFB are hosted by a variety of lithologies
but all contain disseminated and sheeted vein complexes within mineralised stockworks.
VMS deposits consist of massive accumulations of sulphide minerals (usually more than
60%) associated with the seafloor as lens-like or tabular bodies parallel to stratigraphy. The
host rock varies widely but is predominantly intermediate to mafic volcanic rocks or fine-
grained clays. VMS host rocks often have very strong hydrothermal alteration to chlorite, clay
minerals and epidote. In the eastern LFB, seafloor hydrothermal activity created strata-bound
kuroko-style VMS deposits hosted within ancient intra-arc rift basins of the Macquarie Arc
prior to and during its accretion onto the Australian Plate. The major VMS deposits in the
LFB include the Captains Flat Mine and the Woodlawn Mine.
Mineral Systems Approach
This study used a mineral systems approach to identify and constrain the predictive variables
for prospectivity analysis (Wyborn et al., 1994). The mineral systems approach includes all
elements and processes that are necessary to generate and preserve mineral-rich deposits.
These are sources of energy to drive the system, as well as fluids, metals and ligands;
transport pathways along which fluids containing ore components can migrate towards trap
zones; trap zones along which fluid flow becomes focused into channels and fluid

5
composition is modified; deposition of ore components from fluids passing through the trap
zones; and last, outflow zones for discharge of residual fluids and melts. Being process-based,
the application of the mineral systems approach is neither restricted to a particular geological
setting nor limited to a specific ore deposit type.
The results of the above processes can be mapped directly, or more commonly, identified
indirectly using geoscience datasets, and are perfectly suited for analysis and display using
GIS. Predictive maps of individual variables serve as proxies for each of the elements of the
mineral system, allowing the critical ore-forming processes to be mapped. Ore deposit
formation is precluded where a mineral system lacks one or more of these essential
components. Therefore where the probability of occurrence of a particular ore-forming
process is zero, it is expected that no mineral deposit will be present.
Predictive maps have been developed that describe possible source, transport, trap and metal
deposition. The review focussed on testing the validity of using porphyry, skarn, orogenic and
VMS mineral system models for modelling the area, and for prioritisation of follow-up
exploration planning. In the LFB, each of the above criteria has been mapped using various
geological, geophysical and geochemical data, sourced mainly from the Geological Survey of
New South Wales. Complete coverage of geological mapping and structural data at a scale of
1:250,000 was published by the Survey in 2003 and used extensively in this study, in
conjunction with geophysical TMI and gravity data, and geochemical data sourced from
Geoscience Australia and the Geological Survey of New South Wales.
Weights of Evidence (WoE) Method
In this study, a study area of the Lachlan Orogen within NSW was created and, following
validation, training data selected for each of four mineral systems from the Kenex mineral
occurrence database (Table 1). The training data were selected from historical or current
mines or mineral occurrences, with priority given to those with recorded production. The
study area was gridded according to the maximum data resolution, and a unit cell size
assigned to each mineral system that represents the average deposit size of each
mineralisation style. This allowed prior probabilities to be calculated, which indicate the
probability of a deposit existing in a predetermined area before applying any knowledge about
geology or geochemistry. All relevant GIS data were also clipped to the study area extent and
imported with the same projection into the GIS.
Table 1. Model parameters for porphyry, skarn, VMS and orogenic mineral systems.
Porphyry Cu-Au Skarn Au VMS Au Orogenic Au
Study area grid 50 m 50 m 50 m 50 m
Training points 13 7 13 15
Unit cell 2 km2 2 km
2 1 km
2 1 km
2
Prior probability 1.31 x 10⁻⁴
7 x 10⁻⁵
6.5 x 10⁻⁶
7.5 x 10⁻⁵
Spatial analysis was carried out prior to the development of the prospectivity models, using
the weights of evidence technique developed by Bonham-Carter of the Canadian Geological
Survey, using the Spatial Data Modeller extension developed for ESRI’s ArcGIS software.
The details of this method are described fully by Bonham-Carter (1994). To summarise, Deng
(2009) explains the WoE modelling method as the creation of numerous binary predictive
maps of geological variables and their spatial comparison with known mineral deposits, also
known as training data. Selected predictive maps are combined into one final prospectivity

6
map of estimated posterior probabilities of the occurrence of known or unknown ore deposits
of the mineral system being analysed.
The maps used in the final prospectivity models were chosen mainly due to their high contrast
(C) weighting coefficient, indicating a close spatial relationship between the variable and the
training data. The studentised contrast value (StudC) is another important value, calculating
the ratio of the standard deviation of the contrast to the contrast value itself, and gives an
informal test of the uncertainty. If the ratio is relatively large then the contrast is more likely
to be real. Other factors were considered, including good regional data coverage and minimal
duplication of predictive map patterns. A key advantage of the WoE approach is that it is
data-driven, although particular predictive maps can introduce an element of bias to the
analysis because of conditional dependence issues.
Prospectivity Modelling
Source Evidence for appropriate sources of metal ligands, fluid and energy to drive a mineral system
mainly comes from geological mapping and geophysics. Among other properties, the mapped
geology is attributed with age information, allowing analysis of temporal relationship between
rock units. Skarn and porphyry deposits have a close relationship with felsic to intermediate,
porphyritic intrusive rocks (Table 2), which provide the main source of heat, fluids and metals
in these systems. Calcareous units are key to skarn formation, providing additional reactive
components to the ore fluid. Orogenic deposits are more closely associated with greenschist
facies metasediments, whereas VMS mineralisation is linked to intermediate to mafic volcanic
lithologies or fine-grained clay-rich sediments. Mapped bedrock geology has been used to
interpret the location of those lithological units relevant to each mineralisation style. Where
rocks are buried under cover, magnetic geophysical data is useful for identifying source rocks. Table 2. Predictive maps used in the porphyry (green), orogenic (red), VMS (orange) and skarn (blue)
prospectivity models. A contrast value > 1 is considered significant, as is a StudC value > 1.5.
Min. Sys. Porphyry Map Description C Stud
C
Orogenic Map Description C Stud
C
Source
energy &
fluids
Proximity to Sil-Ord felsic and
intermediate igneous intrusives
/ extrusives
1.6 /
0.8
2.9 /
1.1
Ord-Sil clastic sediments 1.5 2.7
Transport High / medium fault density 3.3 /
1.6
5.7 /
2.1
N-S and NW-SE faults 1.9 3.5
N-S and NW-SE non-thrust
faults 2.5 3.7 Third order faults (< 10 km
length) 1.9 3.5
Proximity to low order faults
near known Au deposits 2.2 4.2
Traps Lithological competency
contrast 1.8 3.2 Proximity to right-oriented
fault splays 2.0 3.8
Fault intersections on non-
thrust faults 2.4 4.1
Deposition Anomalous stream Au 3.0 2.8 Proximity to areas of low TMI 1.2 2.3
Drill hole/rock Cu > 200 ppm 3.8 4.6 High gradient TMI slope 2.2 4.1
Porphyry mineral occurrences
with gold 1.2 1.6 Orogenic mineral occurrences
with gold 3.7 6.4
High gradient TMI slope 2.6 4.5

7
Min. Sys. VMS Map Description C Stud
C
Skarn Map Description C Stud
C
Source
energy &
fluids
Silurian rhyolites and basalts 4.0 6.9 Proximity to limestones 2.5 4.3
Anomalous VMS mineral
occurrences with gold 6.2 5.9 Proximity to limestone/
intrusive igneous contacts 3.8 6.4
Proximity to Sil-Ord intrusives
/ extrusives 1.0 /
2.1
2.0 /
3.4
Transport N-S and NE-SW faults 2.4 4.3 E-W non-thrust faults 2.0 3.4
High fault density 2.7 3.5
Proximity to fault jogs 2.6 4.6
Faults associated with low TMI 2.8 4.6
Traps Pre-Carboniferous
rhyolite/clastics contacts 3.4 5.9 Dilational jogs on non-thrust
faults 2.6 4.3
Syn-volcanic lithologies with
sediments and extrusives 3.2 4.9
Extrusive lithologies associated
with high TMI slope 2.9 4.4
Deposition Proximity to low TMI 2.3 3.8 High lithological reactivity 2.0 3.4
Drill hole/rock Bi > 1 ppm 2.6 3.6 Drill hole/rock Ag > 1 ppm 2.1 1.8
Drill hole/rock As > 122 ppm 3.9 4.7 Drill hole/rock Cu > 200 ppm 2.4 3.0
Stream Pb > 60 ppm 3.7 3.3 Stream Zn > 105 ppm 1.6 2.0
Stream Cu > 95 ppm 4.4 3.9 Skarn Au mineral occurrences 1.2 1.6
Stream Zn > 105 ppm 3.5 3.1 High gradient TMI slope 3.1 5.2
Transport The source fluids and metals within a mineral system must be able to migrate in a focused
way to a deposition site to allow formation of an economic ore body. The evidence for fluid
migration comes from regional-scale geological mapping using evidence for structural control
and presence of hydrothermal fluid. Faults of different orientations and lengths were
considered as potential pathways for the mineralisation styles in the LFB. Other indicators of
fluid pathways including brecciation, vein stockworks, and mapped alteration would also
ideally be considered. VMS deposits are often located close to brecciated and therefore
permeable units (Table 2), and orogenic mineralisation is frequently associated with regional
scale deformation structures. Many porphyry and skarn deposits occur in extensional tectonic
environments dominated by normal faulting.
Trap
The formation and type of trap is one of the most important variables in any mineral system as
the trap will determine the size and continuity of any resulting ore body. The type of trap
present in a mineral system can be assessed using geological data to look for lithological or
structural controls on mineralisation (Table 2). The distribution of alteration zones may also
provide information on the scale of the mineral system. Dilation zones mapped from fault data
may occur at fault jogs, intersections, and bends may provide structural controls for
deposition of metals from rising hydrothermal fluids. Potential trap sites can also be modelled
using vein density and type where these variables record hydrothermal fluid trapping.
Lithological trap controls occur where contrasts in rock competency or reactivity result in

8
metal deposition. Regional scale geological mapping can be used to distinguish these brittle-
ductile rock unit contacts, as well as the location of reactive lithologies such as limestone.
Deposition
The efficiency of the processes controlling metal deposition in a mineral system is critical to
the grade and continuity of economic mineralisation in any ore deposit. Many of the controls
on metal grade are also directly and indirectly related to the lithological and structural traps
present as well as fluid chemistry and physics. The best evidence for the efficiency of metal
distribution comes from geochemical anomalism for gold, silver, copper, arsenic,
molybdenum, lead, zinc and other trace metals (Table 2). Geochemical anomaly maps were
developed for each mineral system by deriving anomalous threshold values for all relevant
elements by examining percentile breaks and probability plots of log-normalised data. Stream
sediment and combined drill hole-rock chip samples provide good geochemical coverage in
the Lachlan Fold Belt. Soil geochemistry data has poor regional coverage so was not used in
the modelling, but is an important dataset for consideration during exploration targeting.
Evidence for the presence of alteration, and therefore ore deposition, can be indirectly gained
from the available high resolution aeromagnetic data collected over the LFB. These data can
be used to identify magnetic highs or lows that may represent magnetite or phyrrotite
alteration zones. Magnetic highs may also represent magnetic rock types such as buried
igneous intrusions, which are relevant to skarn and porphyry mineral system models. A map
of high gradients in magnetic intensity was created to map lithology contacts, structures,
alteration zones and contrasting competencies that help focus fluids and deposit metals.
Results
Figure 2. Prospectivity maps for a part of the LFB comparing porphyry, skarn, orogenic and VMS
mineral systems. Blue is prospective (above prior probability), red is highly prospective.
9
Among the four prospectivity models over 200 binary and multiclass predictive maps of
geological variables in total were tested for their spatial associations with the relevant training
data from the four prospectivity models. The selected predictive maps for each mineral system
(Table 2) were combined into a prospectivity map using the model parameters listed in Table
1. The result of the prospectivity models for a small section of the LFB is shown in Figure 2.
Some high prospectivity areas (in red) from different mineral systems coincide, whereas other
areas may be highly prospective for one deposit type but not prospective for another. This is a
result of using different training data to test the spatial correlation with geological variables.
Target Analysis
The initial outcome of the prospectivity models reduces the potential target area to between
7.7% (skarn model) and 10.2% (porphyry model) of the study area. However, further
constraint and analysis of the prospectivity model is necessary to define targets on prospect
scale (Partington, 2010).
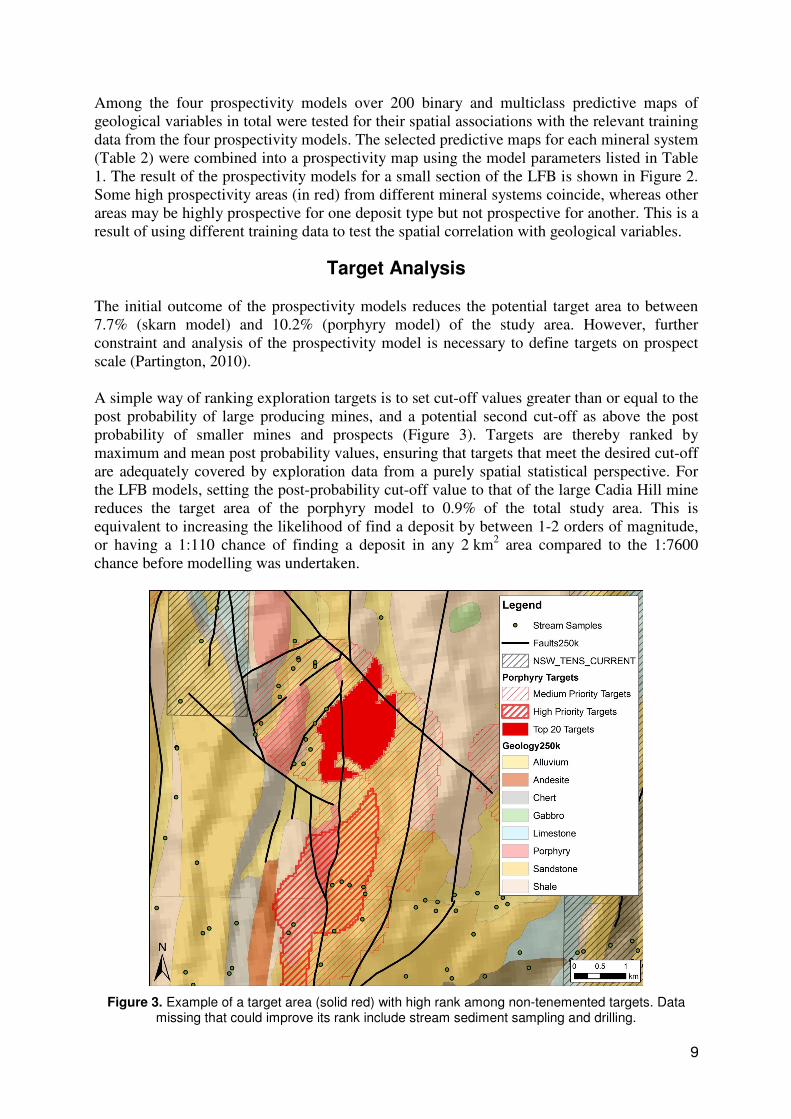
A simple way of ranking exploration targets is to set cut-off values greater than or equal to the
post probability of large producing mines, and a potential second cut-off as above the post
probability of smaller mines and prospects (Figure 3). Targets are thereby ranked by
maximum and mean post probability values, ensuring that targets that meet the desired cut-off
are adequately covered by exploration data from a purely spatial statistical perspective. For
the LFB models, setting the post-probability cut-off value to that of the large Cadia Hill mine
reduces the target area of the porphyry model to 0.9% of the total study area. This is
equivalent to increasing the likelihood of find a deposit by between 1-2 orders of magnitude,
or having a 1:110 chance of finding a deposit in any 2 km2 area compared to the 1:7600
chance before modelling was undertaken.
Figure 3. Example of a target area (solid red) with high rank among non-tenemented targets. Data missing that could improve its rank include stream sediment sampling and drilling.

10
A more detailed target ranking system includes the current status and nature of the target area.
Tenement and ownership data can be extracted from public databases and overlain onto the
target maps, showing whether the area is already claimed for mineral extraction purposes, as
well as who owns the land for access purposes. More detailed geological and geophysical
mapping can be sought out, and existing mineral occurrences can be explored in detail.
Geochemical data including precious metal anomalies can also add to the final target ranking.
Using the Cadia Hill Mine area as an example, the associated prospectivity model target is
completely covered by tenements. Comparing existing mines to the target maps can then
assist further exploration, potentially increasing life of mine expectancy. If the goal is to pick
up new ground, tenemented targets can be excluded before the target analysis is undertaken.
In well studied regions, the targets with the highest post probability will likely be currently
active or historical mines, as these are areas with most dense data coverage. An important
outcome of the prospectivity modelling is to determine what data are missing from lower
ranked targets, especially those that are freely available or previously undiscovered, which
would improve their prospectivity. Typically, such targets may have geophysical and
structural data available from regional mapping and remote sensing studies, but may lack
detailed drilling, structural analysis or geochemical sampling. To complete a detailed analysis
of each target or target cluster, a unique conditions grid has been created in association with
each prospectivity model. This grid is a response map containing the intersection of all of the
input variables as a single integer, effectively combining the predictive maps while
maintaining a record of the spatial distribution of each variable. The unique conditions grid
allows targets to be easily identified and grouped according to what data is missing that could
be collected to upgrade the target, and prioritised accordingly. This is a critical part of the
post-modelling analysis carried out using GIS, yet is often not realised to its full potential.
Conclusions Mineral prospectivity modelling has been used to define exploration targets for several
mineral systems in the Lachlan Orogen. Four prospectivity maps have been produced using
weights of evidence techniques over the LFB in NSW that assess the probability of finding
porphyry Cu-Au, skarn Au, orogenic Au or VMS Au deposits based on input predictive maps
that represent all stages of the mineral system model defined for each deposit type. The
prospectivity maps have been reclassified to define areas above the prior probability that are
prospective or highly prospective for gold and copper mineralisation. For each model, over
three quarters of the training data are found within the prospective or highly prospective areas,
indicating that all four models have correctly predicted areas with a high probability of
intersecting mineralisation.
The WoE methodology is not without limitations. The main area of potential error is
introducing conditional dependence of the input predictive maps for the prospectivity model
due to overlapping map patterns. This can be analysed using the Agterberg-Cheng test.
Although conditional independence can be a significant problem, it is not unusual when using
geological datasets as the processes acting in a mineral system are rarely independent of each
other. Therefore, the results should be viewed as a relative measure of favourability for the
factors controlling mineralisation rather than an accurate calculation of the probability of
mineralisation. The probability values, however, provide an objective way of ranking an
area’s prospectivity and highlight those areas where mineralisation may be present. These
areas require field checking and more detailed data collected to allow drill targeting.
11
The LFB models have been reclassified to generate target areas with posterior probabilities
above a certain threshold identified by spatial statistics. The strength of the approach is not
only in reducing potentially prospective ground by up to two orders of magnitude, but can
also be seen in the approach to the final targeting. Economic and risk factors have been
assessed and the targets sorted and mapped according to positive and negative exploration
risk. Single targets or clusters of targets can be individually assessed using information such
as tenure, geology, geochemistry and magnetic signature. By applying post prospectivity cut-
offs as well as ownership and data quality criteria, the final target ranking can be tailored to
the needs of the client: a prospecting program may benefit from knowledge about where
additional sampling and drilling can upgrade existing targets, while existing mining
operations can use targets over their tenement areas to intelligently plan future exploration
and extend mine life expectancy.
Acknowledgements
The authors would like to thank Oliver Kreuzer from Macquarie University, Sydney, and colleagues at Kenex
Ltd, for helpful discussion and review of this paper.
References
Bonham-Carter, G.F. 1994. Geographic information systems for geoscientists: Modelling with GIS. Pergamon,
Oxford, 398 p.
Cooke, D.R., Wilson, A.J., House, M.J., Wolfe, R.C., Walshe, J.L., Lickfold, V. and Crawford, A.J. 2007.
Alkalic porphyry Au-Cu and associated mineral deposits of the Ordovician to Early Silurian Macquarie Arc,
New South Wales. Australian Journal of Earth Sciences 54: 445-463.
Crawford, A.J., Glen, R.A., Cooke, D.R. and Percival, I.G. 2007. Geological evolution and metallogenesis of the
Ordovician Macquarie Arc, Lachlan Orogen, New South Wales. Australian Journal of Earth Sciences 54:
137–141.
Deng, M. 2009. A conditional dependence adjusted weights of evidence model. Natural Resources Research 18:
249-258.
Fergusson, C.L. 2009. Tectonic evolution of the Ordovician Macquarie Arc, central New South Wales:
Arguments for subduction polarity and anticlockwise rotation. Australian Journal of Earth Sciences 56: 179-
193.
Glen, R.A., Saeed, A., Quinn, C.D. and Griffin, W.L. 2011. U-Pb and Hf isotope data from zircons in the
Macquarie Arc, Lachlan Orogen: Implications for arc evolution and Ordovician palaeogeography along part
of the east Gondwana margin. Gondwana Research 19: 670-685.
Groves, D. I., Goldfarb, R. J., and Robert, F. 2003. Gold deposit in metamorphic belts: Overview of current
understanding, outstanding problems, future research, and exploration significance. Economic Geology 98: 1-
29.
McCuaig, T.C., Beresford, S. and Hronsky, J.M.A. 2010. Translating the mineral systems approach into an
effective exploration targeting system. Ore Geology Reviews 38: 128-138.
Partington, G.A. 2010. Developing models using GIS to assess geological and economic risk: An example from
VMS copper gold mineral exploration in Oman. Ore Geology Reviews 38: 197-207.
Suppel, D.W. and Scheibner, W. 1990. Lachlan Fold Belt in New South Wales – Regional geology and mineral
deposits. In: Geology of the mineral deposits of Australia and Papua New Guinea. Hughes, F.E., eds,
pp1321-1327, The Australian Institute of Mining and Metallurgy Monograph 14.
Walshe, J.L., Heithersay, P.S. and Morrison, G.W. 1995. Toward an understanding of the metallogeny of the
Tasman Fold Belt System. Economic Geology 90: 1382-1401.
Wyborn, L.A.I., Heinrich, C.A. and Jaques, A.L. 1994. Australian Proterozoic mineral systems: Essential
ingredients and mappable criteria. Australasian Institute of Mining and Metallurgy Publication Series 5: 109-
115.