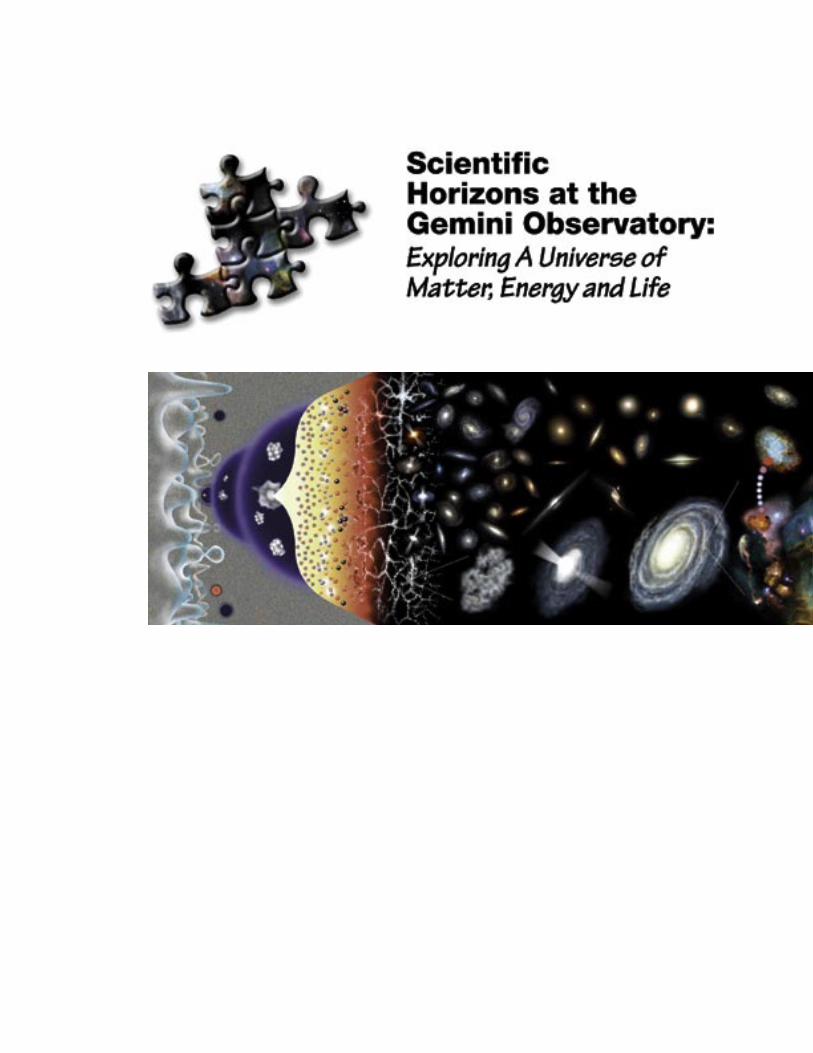
exploring a universe of matter, energy and life - gemini observatory
TRANSCRIPT
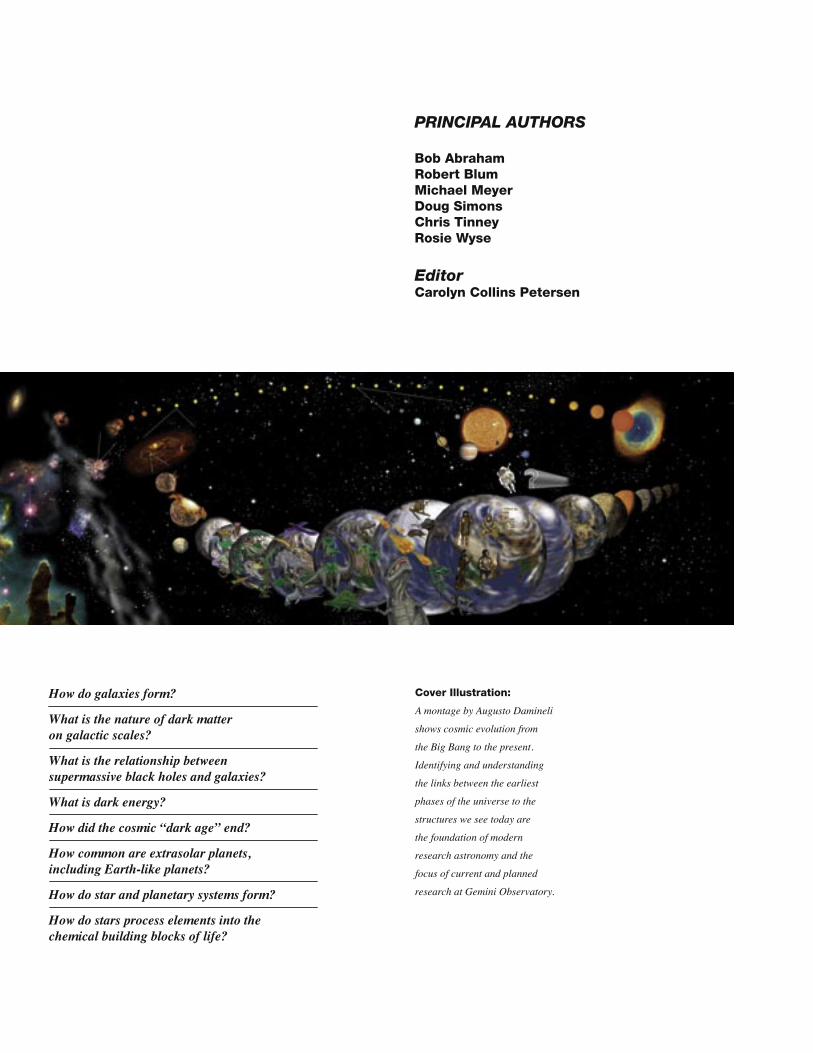
Cover Illustration:
A montage by Augusto Damineli
shows cosmic evolution from
the Big Bang to the present.
Identifying and understanding
the links between the earliest
phases of the universe to the
structures we see today are
the foundation of modern
research astronomy and the
focus of current and planned
research at Gemini Observatory.
PRINCIPAL AUTHORS
Bob AbrahamRobert BlumMichael MeyerDoug SimonsChris TinneyRosie Wyse
EditorCarolyn Collins Petersen
How do galaxies form?
What is the nature of dark matter on galactic scales?
What is the relationship between supermassive black holes and galaxies?
What is dark energy?
How did the cosmic “dark age” end?
How common are extrasolar planets, including Earth-like planets?
How do star and planetary systems form?
How do stars process elements into the chemical building blocks of life?
A Vision of Discovery i
The Gemini Observatory is an
international partnership managed by
the Association of Universities for
Research in Astronomy under a
cooperative agreement with the
National Science Foundation.
A Vision of Discovery iii
Table of Contents
Preface V
Part I 1
Chapter 1: A Universe of Discovery 3
Chapter 2: The Universe of Matter 13
Chapter 3: The Universe of Energy 35
Chapter 4: The Universe of Life 47
Part 2 59
Chapter 5: The Universe of Matter Investigations 61
Chapter 6: The Universe of Energy Investigations 69
Chapter 7: The Universe of Life Investigations 75
Appendix I: References 89
Appendix II: Image Credits 95
Appendix III: Participants 97
Sections Page

A Vision of Discovery v
Preface
A Look Ahead: June 2053
It is a new golden age of research and exploration. NASA̓ s much-touted nuclear propelled spacecraft has reached a major milestone on its maiden interstellar voyager, sending telemetry from a distance far greater than the 20th-century Voyager and Pioneer planetary missions achieved. On Mars, the flags of several nations fly proudly over the first human science settlement on the planet. Closer to Earth, the first orbiting colony is home to thousands of space dwellers and several manufacturing centers. Low-Earth-orbit observatories and telescopes on remote mountaintops provide continuous temporal coverage of the entire sky, at resolutions and sensitivities that were inconceivable a few decades earlier. All the data from humanityʼs ongoing explorations flows into a vast storehouse of knowledge about the cosmos—a compilation of centuries of ground-based and space-borne observations. This treasure trove of information is a priceless legacy of knowledge and exploration, available through all the schools and universities of the world. Students and researchers use the databases to acquire a comprehensive understanding of the formation and evolution of the universe, the seeds of life, and the fundamental nature of matter and energy.
A Pale Blue Dot
This image obtained by the Mars
Exploration Rover Spirit in 2004
shows the planet Earth rising in the
twilight glow of the planet Mars.
Such a view is what might greet the
first humans to look skyward from
our neighboring planet.
Earth is the small dot at center, near
the top of the oblong twilight glow.

Scientific Horizons at the Gemini Observatoryvi
Planting the Seeds of Tomorrow’s Science: June 2003
A team of the worldʼs foremost astronomers meets high in the Rocky Mountains to plot a course of future exploration for what is rapidly becoming one of the astronomy commu-nityʼs most productive research institutions—the Gemini Observatory. The researchers, explorers, and textbooks of the future are very much on the minds of these astronomers as they discuss technology needed for Geminiʼs future growth. The path of scientific inquiry they lay out and the new capabilities they request will have profound implications for the success of tomorrowʼs scientists. Infusing their work is an intense curiosity about our genesis in the cosmos and the fundamental questions astronomy poses about our planet, the Sun, stars, galaxies, and the origin and evolution of the universe. These inquiries are as basic as they are timeless, and many will be answered by the next generation of as-tronomers. Getting to the answers will take concerted fundamental research conducted in many places, including underground high-energy physics labs, robotic facilities in outer space, and observatories around the world.
Todayʼs astronomy and space explorations were once the stuff of science fiction dreams. Now we are within decades of seeing humanity take its first permanent steps off-planet, moving to Mars colonies, orbiting stations, or maybe even on trips to the stars. Yet, such dreams do not become real without research. For astronomy and space science, the foun-dations of the future are being laid at places like the Gemini Observatory.
The participants of the 2003 Aspen Workshop met to define the observatoryʼs role in un-derstanding the universe we seek to explore. They represent hundreds of others who will use the observatory in the years ahead to conduct fundamental research on the nature of the universe. Understanding the fundamental nature of matter and energy, and how they ultimately lead to life are core aspects of Gemini s̓ future science mission. The scientific vision expressed by the astronomers who gathered in Aspen represents a guiding light within modern astronomy. The Gemini Partnership will use this light to explore an enor-mous and dark universe brimming with discoveries waiting to be made. This is astrono-myʼs equivalent of the 20th-century Moon missions. If the proposed new capabilities for Gemini help answer just one of the questions identified throughout this book, it will make a profound contribution to humanityʼs perception of a universe that is filled with matter, energy—and almost certainly—life.
The Aspen Workshop
Some of the 93 participants of
the June 2003 Aspen Workshop
collectively provided the ideas,
discussions and insights reflected in
this publication. See Appendix III
for a full participants list.
A Vision of Discovery vii
How will the research conducted at Gemini solve perplexing issues in astronomy? Will it be a cornerstone of future astronomers ̓understanding of the cosmos? How can the Gemi-ni partnership position itself today to leave a valuable scientific legacy for tomorrow?
This book distills a collection of Gemini Observatoryʼs research ambitions into a series of fundamental questions. Then it explains how astronomers will attempt to answer these questions, using advanced new instrumentation proposed for Gemini. It describes the observatoryʼs current position and bearing on the landscape of astronomical research, and then articulates directions leading to the most scientifically intriguing and important destinations on the research horizon.
When the history of early 21st-century astronomy research is written some decades from now, it is our hope that contributions from the Gemini Observatory will provide a valu-able science legacy to the explorers who spread their vision and the human presence out to the stars.
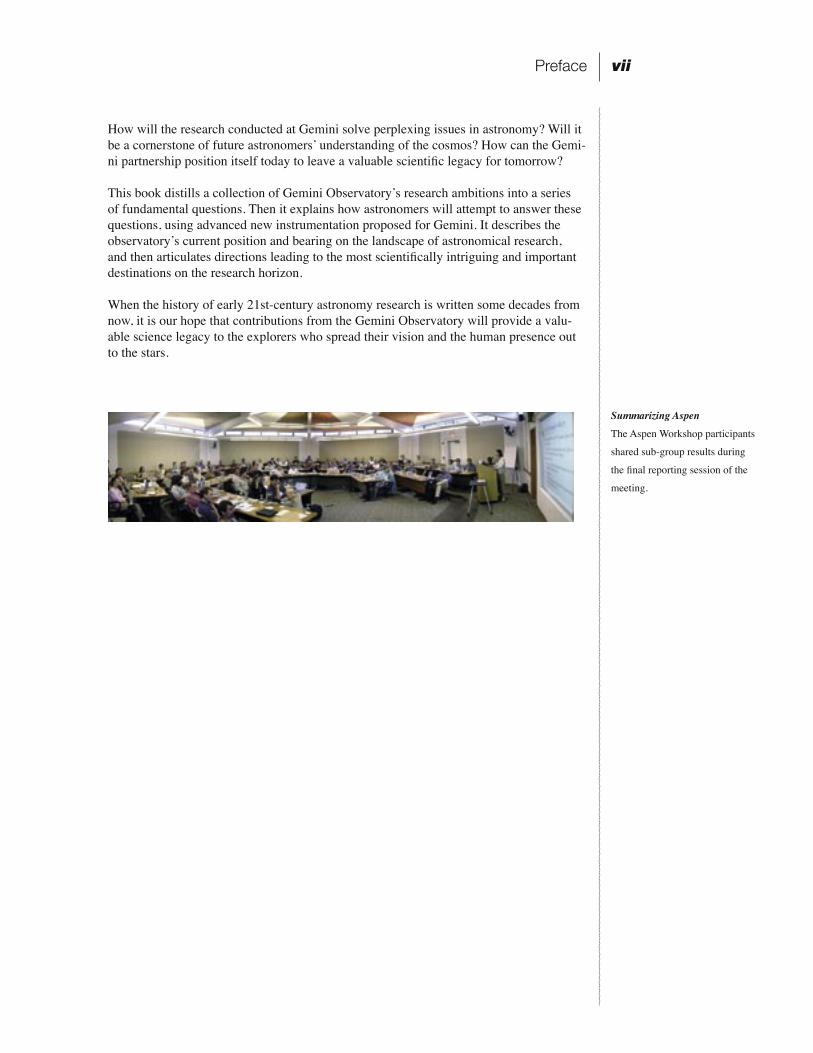
Summarizing Aspen
The Aspen Workshop participants
shared sub-group results during
the final reporting session of the
meeting.
Preface
A Vision of Discovery 1
Part I
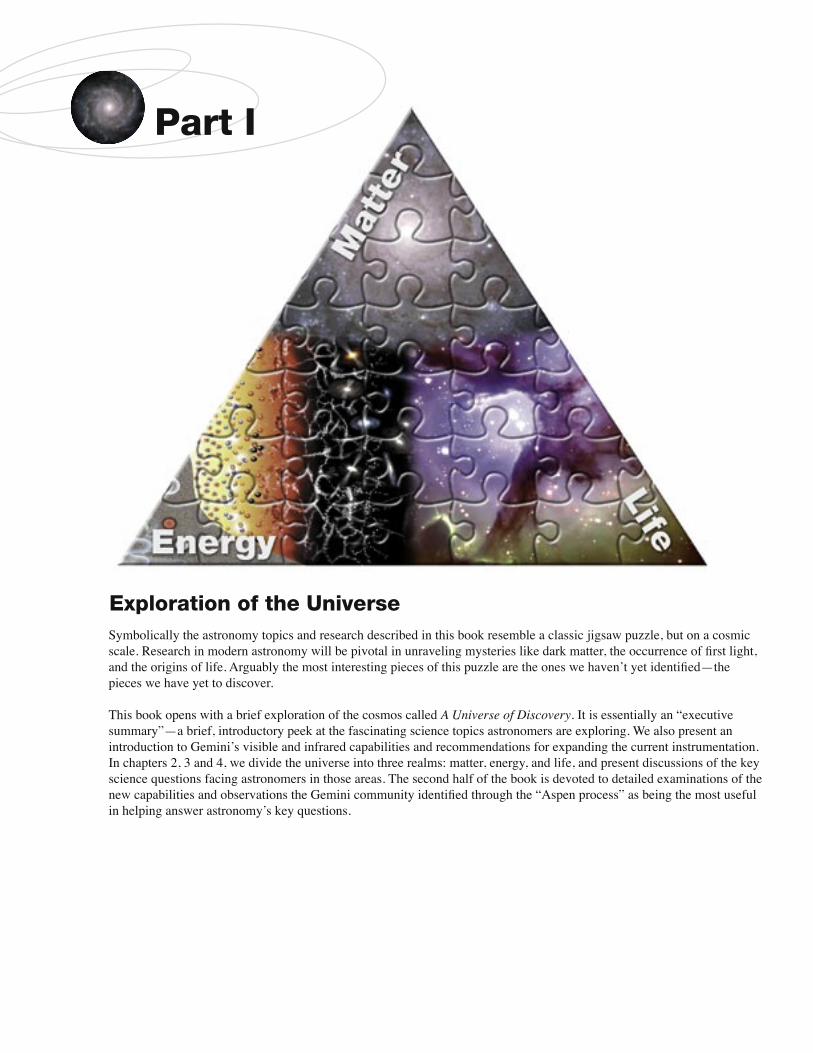
Symbolically the astronomy topics and research described in this book resemble a classic jigsaw puzzle, but on a cosmic scale. Research in modern astronomy will be pivotal in unraveling mysteries like dark matter, the occurrence of first light, and the origins of life. Arguably the most interesting pieces of this puzzle are the ones we havenʼt yet identified—the pieces we have yet to discover.
This book opens with a brief exploration of the cosmos called A Universe of Discovery. It is essentially an “executive summary”—a brief, introductory peek at the fascinating science topics astronomers are exploring. We also present an introduction to Geminiʼs visible and infrared capabilities and recommendations for expanding the current instrumentation. In chapters 2, 3 and 4, we divide the universe into three realms: matter, energy, and life, and present discussions of the key science questions facing astronomers in those areas. The second half of the book is devoted to detailed examinations of the new capabilities and observations the Gemini community identified through the “Aspen process” as being the most useful in helping answer astronomyʼs key questions.
Exploration of the Universe
A Vision of Discovery 3
We live in a remarkable time, with scientists participating in explorations ranging across many fields of research. As our understanding of the universe crystallizes, we are begin-ning to see more overlap and synergy between formerly disparate fields of research. As-tronomy, in particular, boasts some of the most remarkable discoveries of recent decades, utilizing contributions from many disciplines.
The job of explaining what astronomers see in the universe falls to astrophysics, a science that applies the theories and methods of physics to explain the structures of stars, stel-lar evolution, the origin of the solar system, and many aspects of cosmology (the origin and evolution of the universe). Through astrophysics, we test the fundamental laws of physics on scales and in realms too extreme to be created in the laboratory. Ultimately, it is through astronomy and astrophysics that humans seek to understand the birth of life within the larger tapestry of planets, stars, molecular clouds, and galaxies. The goal is to link all these building blocks into a single coherent understanding of the universe.
As a state-of-the-art facility, the Gemini Observatory is poised for leadership in the sci-entific exploration of the cosmos. Through its research, Geminiʼs worldwide community of astronomers seeks answers to many of the key questions that have long perplexed the astronomy community:
• How do galaxies form?• What is the nature of dark matter on galactic scales?• What is the relationship between supermassive black holes and galaxies?• What is dark energy?• How did the cosmic “dark age” end?• How common are extrasolar planets, including Earth-like planets?• How do star and planetary systems form?• How do stars process elements into the chemical building blocks of life?
These key questions in astronomy divide the cosmos into three universes: matter, energy, and life, and in the next three chapters we delve more deeply into the complex science issues surrounding each subject.
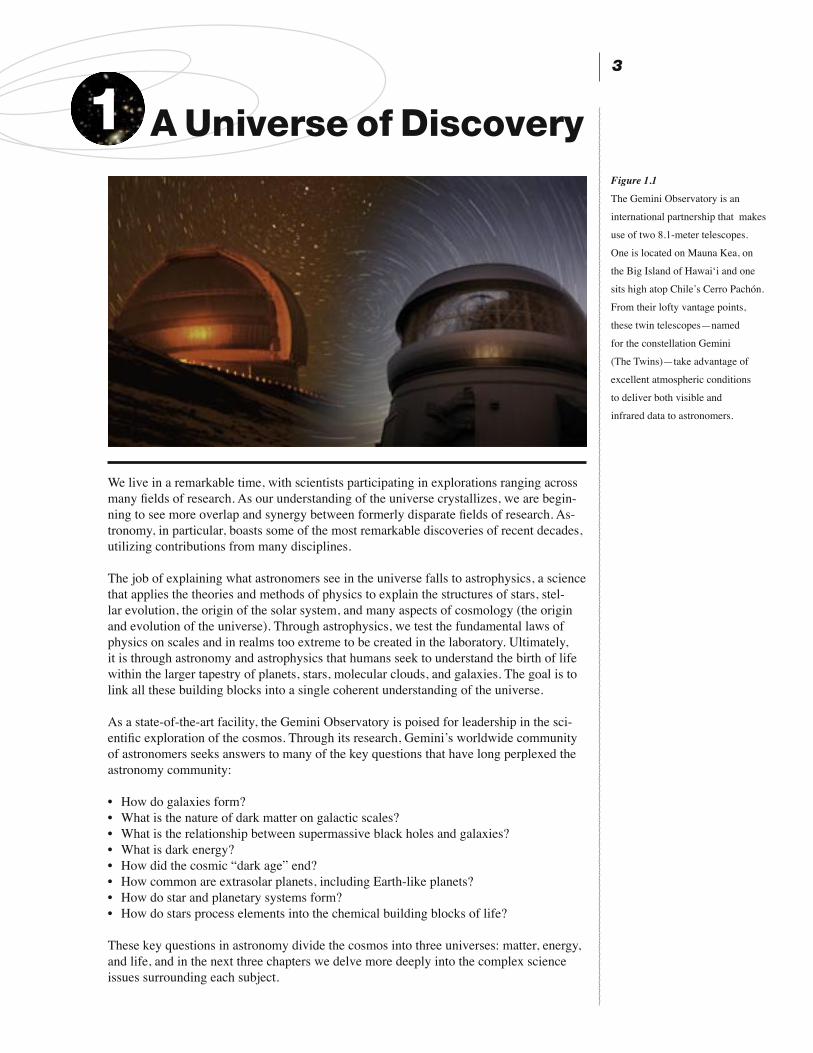
Figure 1.1
The Gemini Observatory is an
international partnership that makes
use of two 8.1-meter telescopes.
One is located on Mauna Kea, on
the Big Island of Hawaiʻi and one
sits high atop Chileʼs Cerro Pachón.
From their lofty vantage points,
these twin telescopes—named
for the constellation Gemini
(The Twins)—take advantage of
excellent atmospheric conditions
to deliver both visible and
infrared data to astronomers.
A Universe of Discovery1A Universe of Discovery
Scientific Horizons at the Gemini Observatory4
In the “Universe of Matter” chapter we look at the largest material structures observed—the galaxies and superclusters of galaxies. They contain all the things that can be de-tected: the so-called baryonic matter that makes up the stars, nebulae, planets—and, if our world is any indication—life. Galaxies and all their constituent parts are ensembles of baryonic matter—hydrogen, helium, carbon, oxygen, and other elements—scattered through space. We have to understand the nature of that matter if we are to determine the role it plays in the formation and evolution of galaxies.
There is another form of matter that appears to dominate the dynamics and evolution of galaxies. It is unseen and little understood. Astronomers call it “dark matter.” We know that dark matter is ubiquitous in the universe, but we do not know what this unseen mate-rial is. The reasonable question to ask is if it cannot be directly observed, how can we find out more about this mysterious stuff that has such a powerful influence on structures as large as galaxies? The answer lies in deducing its properties and distribution from the effect dark matter has on galaxies. Observations of the motions of stars within galaxies, for example, will give us a much better understanding of the gravitational interaction between baryonic matter and dark matter, and how such interactions affect the formation of galaxies.
Some of the most bizarre structures known—black holes—also play an important role in the evolution of galaxies, perhaps even in their creation. Yet, we do not have a detailed understanding of how the interaction between massive black holes and galaxies works.
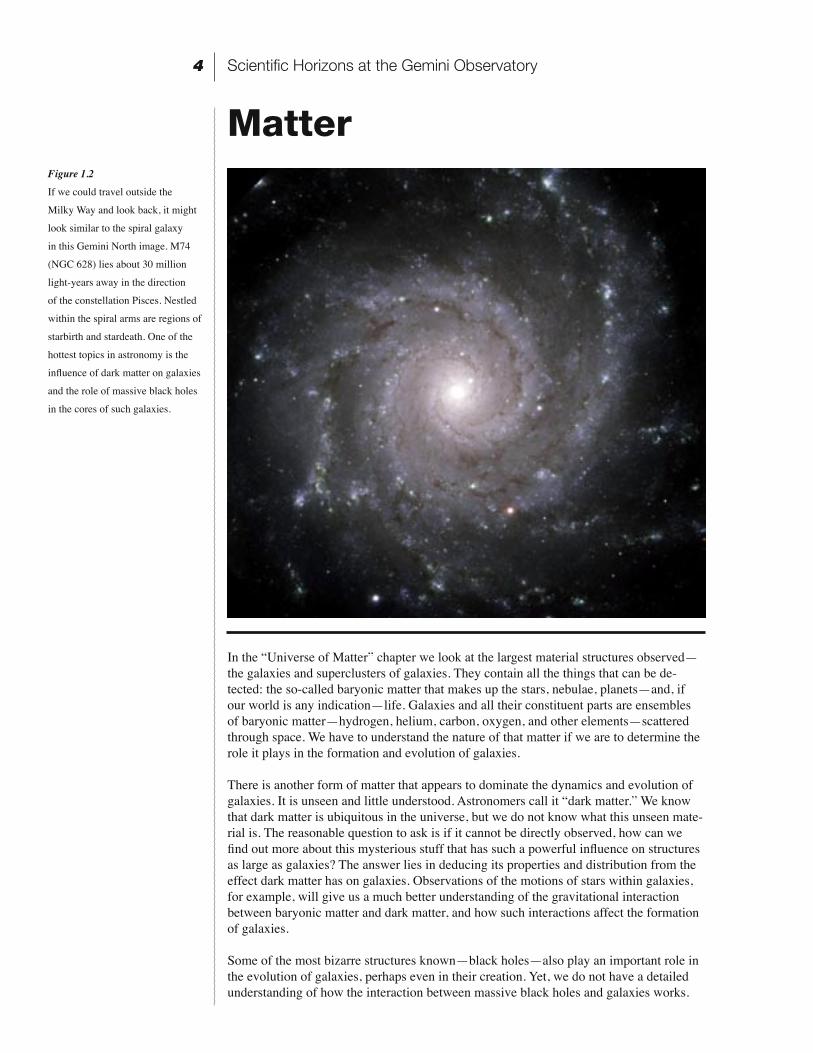
Figure 1.2
If we could travel outside the
Milky Way and look back, it might
look similar to the spiral galaxy
in this Gemini North image. M74
(NGC 628) lies about 30 million
light-years away in the direction
of the constellation Pisces. Nestled
within the spiral arms are regions of
starbirth and stardeath. One of the
hottest topics in astronomy is the
influence of dark matter on galaxies
and the role of massive black holes
in the cores of such galaxies.
Matter
A Vision of Discovery 5
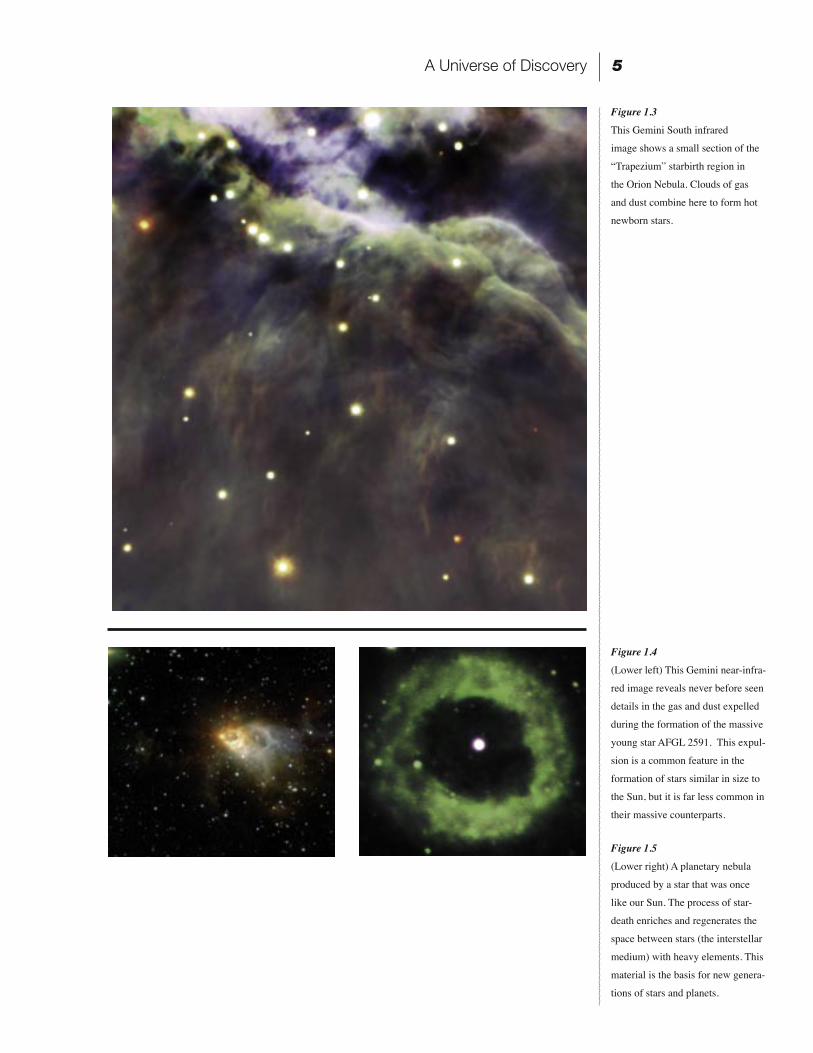
Figure 1.3
This Gemini South infrared
image shows a small section of the
“Trapezium” starbirth region in
the Orion Nebula. Clouds of gas
and dust combine here to form hot
newborn stars.
Figure 1.4
(Lower left) This Gemini near-infra-
red image reveals never before seen
details in the gas and dust expelled
during the formation of the massive
young star AFGL 2591. This expul-
sion is a common feature in the
formation of stars similar in size to
the Sun, but it is far less common in
their massive counterparts.
Figure 1.5
(Lower right) A planetary nebula
produced by a star that was once
like our Sun. The process of star-
death enriches and regenerates the
space between stars (the interstellar
medium) with heavy elements. This
material is the basis for new genera-
tions of stars and planets.
A Universe of Discovery

Scientific Horizons at the Gemini Observatory6
We are still trying to define the relationship between black holes and such galactic pro-cesses as the birth, evolution, and death of stars, and studying the implications for the regeneration and enrichment of elements heavier than hydrogen and helium. Ultimately, we are interested in how all of these processes lead to planet formation and the seeds of life. Past observations have left us with a myriad of possible physical connections and correlations between all these processes. What we require is a clear understanding of feedback mechanisms and how the “snapshots” that we have of distinct objects can give us a full picture of how the components of the universe interact over time.
Figure 1.6
Active galaxies are likely to have
supermassive black holes at their
cores, providing an “engine” that
generates strong radiation in X-ray,
gamma ray, and radio wavelengths.
Gemini South observed one of these
so-called Seyfert galaxies in the
infrared, revealing its bright and
active nucleus.
A Vision of Discovery 7
EnergyIn the “Universe of Energy” chapter astronomers explore a little-understood component of the cosmos called “dark energy.” Simply put, dark energy provides a push that coun-teracts the pull of gravity (which works to bind together planets, stars, and galaxies). Gravity works across the gulfs between galaxies (what astronomers call cosmological distances) to slow down the expansion of the universe just as brakes slow down a speed-ing automobile. However, observations of distant supernovae show that the universal rate of expansion appears to be increasing, apparently driven by dark energy.
The bulk of the energy in the universe exists in this unknown form. What is the nature of dark energy? Does it change with time? What is its role in the formation and evolution of galaxies? Since this energy is only discernible across cosmological distances, astronomy will undoubtedly have an important research role to fill in answering those questions, relying in part on research in the high-energy physics community.
Other key questions revolve around how the universe changed from one full of radiation to one in which matter dominated early in its history, and how it has transitioned again more recently to a universe controlled by dark energy. Understanding the history of ener-gy and matter in the universe takes astronomers back to a period called “first light,” when the earliest self-luminous structures (predecessors to galaxies) erupted into existence and filled the early voids of the universe with radiation. What role did this first-light process have in triggering the eventual collapse of those primordial structures into the galaxies that surround us today? The answers to all these questions are important because they will help us pinpoint the changing role of dark energy over the evolution of the universe.
A Universe of Discovery

Scientific Horizons at the Gemini Observatory8
Life
Research on the “universe of life” focuses our attention on the symbiotic relationship of stars, gas and dust in the galaxy, their formation processes, and the planets and debris disks surrounding young stars. Life stands at the end of the evolutionary processes that create planets, and therefore the seeds of life are contained in the endless cycling of star-birth and stardeath.
At the ends of their lives, stars spread heavy elements across space through supernova ex-plosions and the formation of planetary nebulae. Ultimately this “seed material” collapses into more stars, protoplanetary disks, and ultimately, planets. This life cycle of material processing, which we can trace back to the first stars in the early universe, is an extraordi-narily important research field because it represents the mechanism through which normal matter evolves from the primordial elements of hydrogen and helium.
Defining and studying this cycle helps us understand the planetary system surrounding our own Sun. We also stand to capitalize on the growing census of planets in our solar neighborhood, and through advanced future observations using Gemini as a platform, it should be possible to directly image and begin to characterize the planets that are now being discovered through indirect means.
The study of supernovae also leads to a better understanding of the expansion rate of the universe. In addition, the flicker of distant supernovae explosions also provide a probe of the dark energy that is affecting this cosmic expansion.
The “universes” of matter, energy, and life are tied inextricably together, yet their bound-aries and interfaces are only understood in a piecemeal fashion, similar to the early steps in solving a jigsaw puzzle. Only through detailed future observations will we collect enough pieces to understand the most important links, bridges and gaps in the puzzle, and ultimately recognize the picture that represents the actual universe in which we live.
Figure 1.7
Star forming regions often recycle
material from long-dead stars
into new stellar generations. In
such clouds of gas and dust lie the
seeds of planets, asteroids, comets,
and possibly life. This optical image
obtained with the Gemini Multi-
Object Spectrograph on Gemini
North shows the starbirth region
known as the Trifid Nebula.
A Vision of Discovery 9
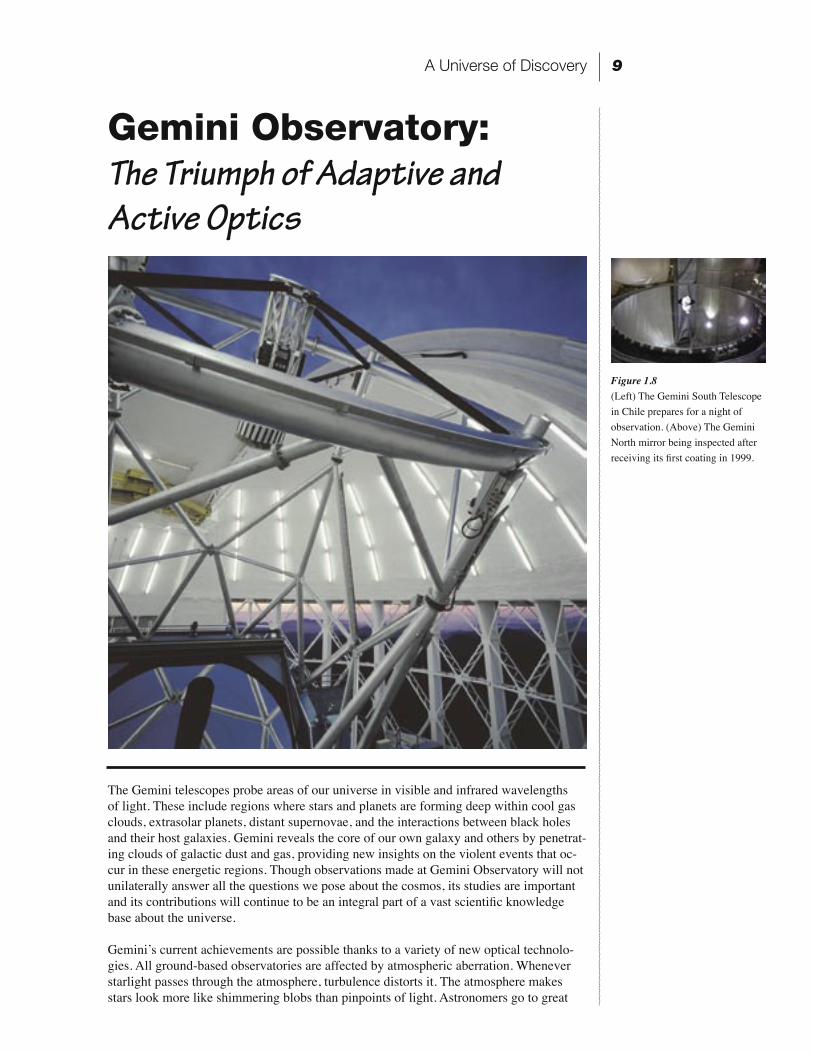
Gemini Observatory: The Triumph of Adaptive and Active Optics
The Gemini telescopes probe areas of our universe in visible and infrared wavelengths of light. These include regions where stars and planets are forming deep within cool gas clouds, extrasolar planets, distant supernovae, and the interactions between black holes and their host galaxies. Gemini reveals the core of our own galaxy and others by penetrat-ing clouds of galactic dust and gas, providing new insights on the violent events that oc-cur in these energetic regions. Though observations made at Gemini Observatory will not unilaterally answer all the questions we pose about the cosmos, its studies are important and its contributions will continue to be an integral part of a vast scientific knowledge base about the universe.
Geminiʼs current achievements are possible thanks to a variety of new optical technolo-gies. All ground-based observatories are affected by atmospheric aberration. Whenever starlight passes through the atmosphere, turbulence distorts it. The atmosphere makes stars look more like shimmering blobs than pinpoints of light. Astronomers go to great
Figure 1.8(Left) The Gemini South Telescope in Chile prepares for a night of observation. (Above) The Gemini North mirror being inspected after receiving its first coating in 1999.
A Universe of Discovery

Scientific Horizons at the Gemini Observatory10
lengths (and heights) to reduce these effects. Space-based observatories like the Hubble Space Telescope can avoid this problem because they are above the atmosphere.
To correct for turbulence, Earth-based observatories like Gemini use adaptive optics systems to correct the light according to the amount of atmospheric induced distortion in the telescopeʼs beam. Before starlight passes into any of the instruments or cameras on the Gemini telescopes, a representative column of starlight is diverted into a “wavefront sensor.” The column is a representative sample of the light collected across the entire primary mirror of the telescope. Any distortions visible to the wavefront sensor corre-spond directly to distortions along the line of sight of the telescope. In order to use this information, the wavefront sensor separates the column of light into many areas or zones, and samples each zone hundreds of times per second to determine how our atmosphere altered the light. The information from the wavefront sensor is fed back to a deformable mirror that can be adjusted to counteract the distortions caused by the atmosphere. Using this system, Gemini produces sharp images of the infrared sky and dramatically improves many other types of observations as well.
Another challenge that Gemini has overcome is the problem of mirror size. For many decades, it was thought impossible to build a telescope as large as Gemini because to maintain its precise shape it would have to be too thick and heavy. The primary mirrors on both telescopes are thin enough to be “morphed” to a perfect shape using active optics technology. Mounted behind each mirror are 120 actuators that constantly nudge the mirror into the correct form for astronomy observations. These adjustments are typically only about 1/10,000 the thickness of a human hair, but this is enough to keep starlight precisely focused so astronomers can study the universe.
Finally, what ultimately makes the Gemini Observatory stand alone in the 8- to 10-meter class is its optimization for infrared astronomy. Both telescopes incorporate such tech-nologies as the ability to produce sputtered, silver multi-layered coatings on the telescope mirrors for extremely low thermal emissivity of the entire optical system. Combined with the telescopeʼs extremely high-resolution imaging capability, Gemini is uniquely poised to help answer the big questions on astronomyʼs horizons.
A Vision of Discovery 11
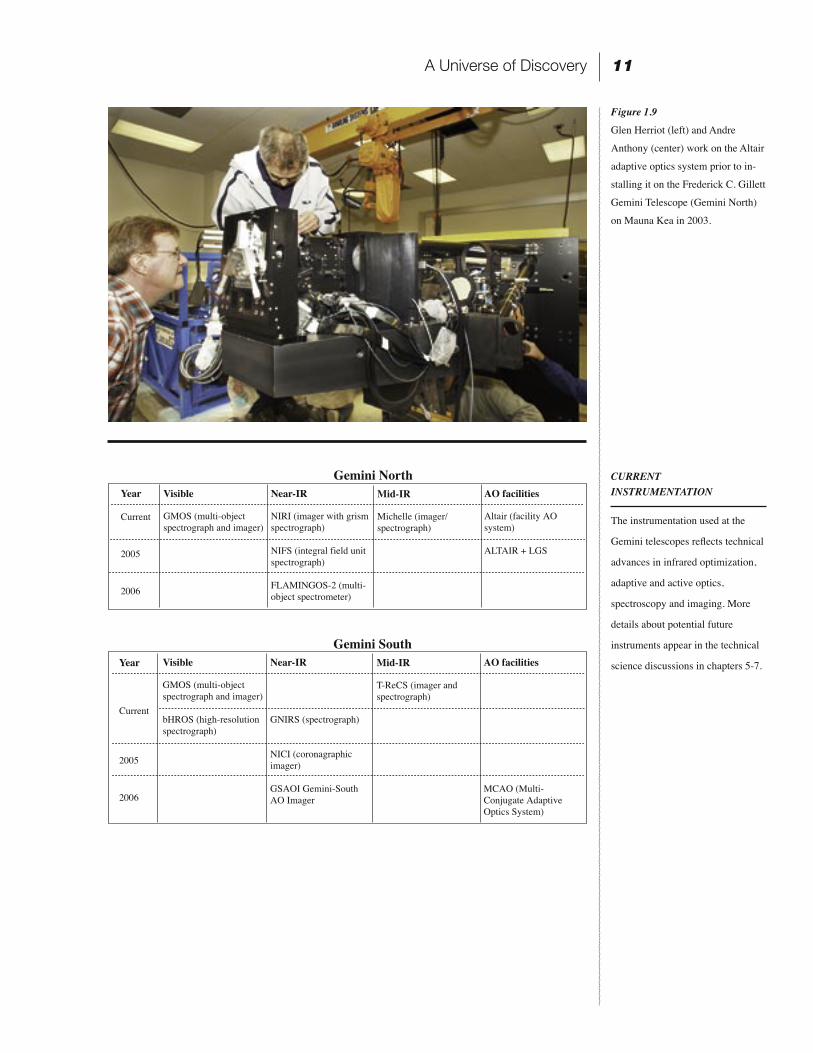
CURRENT INSTRUMENTATION
The instrumentation used at the
Gemini telescopes reflects technical
advances in infrared optimization,
adaptive and active optics,
spectroscopy and imaging. More
details about potential future
instruments appear in the technical
science discussions in chapters 5-7.
Figure 1.9
Glen Herriot (left) and Andre
Anthony (center) work on the Altair
adaptive optics system prior to in-
stalling it on the Frederick C. Gillett
Gemini Telescope (Gemini North)
on Mauna Kea in 2003.
A Universe of Discovery
Scientific Horizons at the Gemini Observatory12
Future Instruments
The scientific details of the three “universes” of exploration we discuss in the rest of this book present significant steps forward in our understanding of the cosmos. They also pose major observing challenges for the astronomical community. Gemini Observatory, as one of the premier ground-based facilities in the world, will play an important role in research for many of the key questions posed by astronomers today. To do so, the obser-vatory is poised to launch a program to develop instruments more advanced, sensitive, and scientifically enabling than anything built to date.
To meet as many of the scientific aspirations of the astronomy community as possible (as expressed through the Aspen Workshop), the Gemini Science Committee and Gemini Board recommends exploring instrumentation development on multiple fronts. Currently this includes beginning the development of an Extreme Adaptive Optics Coronagraph and a High Resolution Near Infrared Spectrometer.
In addition, the Observatory has been directed to launch feasibility studies for a Wide Field Fiber-fed Optical Multi-Object Spectrometer and a Ground Layer Adaptive Optics system. If developed and built, these and other future instruments will extend Gemini s̓ current capability significantly, providing its worldwide astronomical community with cutting-edge research tools as it undertakes the challenge of answering ever deeper ques-tions about the universe.
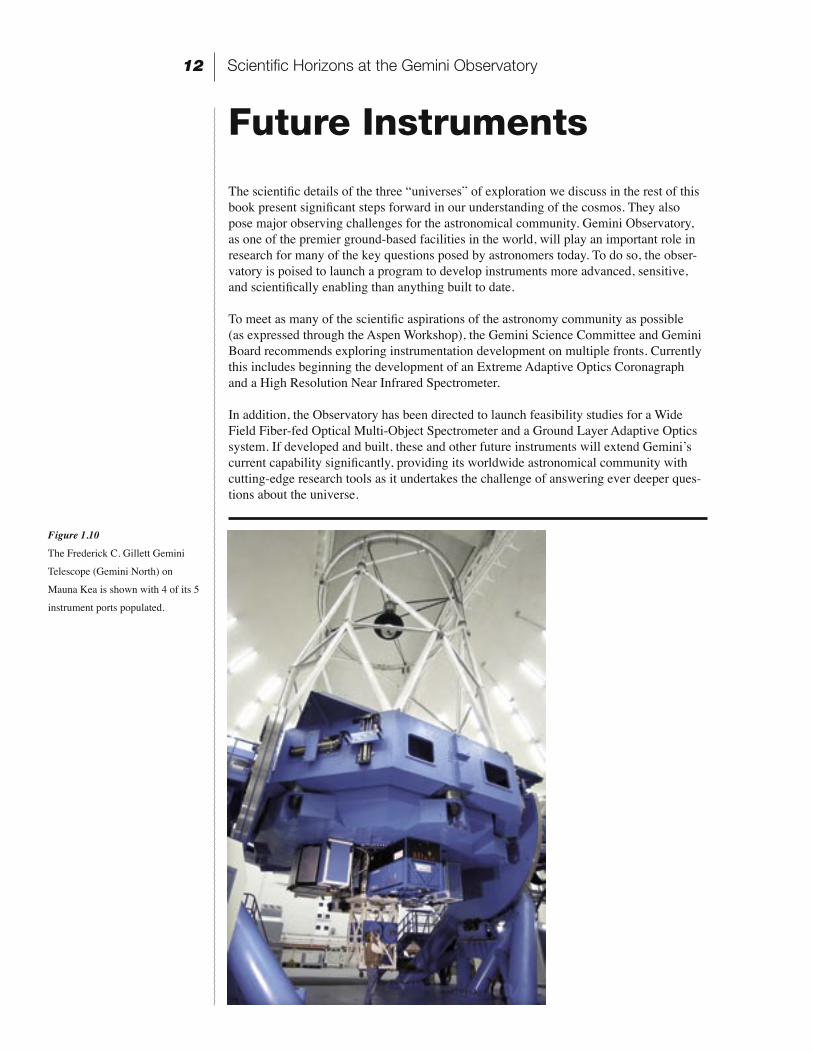
Figure 1.10
The Frederick C. Gillett Gemini
Telescope (Gemini North) on
Mauna Kea is shown with 4 of its 5
instrument ports populated.

A Vision of Discovery 13
MATTER
Fundamental Questions
• How do galaxies form?• What is the nature of dark matter on galactic scales?• What is the relationship between supermassive black holes and galaxies?
A Vision of Discovery 15
The Universe of Matter2
We live in a universe of matter that we detect by the electromagnetic radiation it emits, reflects or absorbs. The galax-ies, their nebulae, stars, and planets are all made up of baryonic matter (objects consisting of protons, neutrons, and elec-trons). Until recent decades, astronomy and astrophysics were aimed largely at observing and understanding the inter-action and evolution of this baryonic matter—which is distributed in large-scale structures such as galaxies and clusters of galaxies. Questions about how galax-ies, stars, and planets form are among the most important we can ask. Astronomers use theories about the formation and evolution of these structures to help them understand the origin and evolution of the cosmos itself.
Astronomy is slowly building up a “big picture” describing the origin of the uni-verse—the event called the Big Bang—in which space and time began, and matter and energy were created. The Big Bang wasnʼt an explosion outward from a single point in space, as is often depicted in artistʼs conceptions, but was rather a stretching of space such that every point in space expands away from every other
point. We canʼt look all the way back to the moment of the Big Bang and capture an image of it. The best we can do is mea-sure light from a time when the universe first became transparent, several hundred thousand years after the Big Bang, and capture this oldest light in the universe. Tiny variations in the density of matter left their imprint on this light in the form of temperature fluctuations across the sky in a bath of radiation called the cosmic microwave background (CMB).
The seeds of galaxies first emerged from these small variations in the density of the “primordial soup” that comprised the early universe in the period following the Big Bang. Larger fluctuations grew more dense, and at some point, their self-grav-ity became so dominant that these density fluctuations—the embryos of future galax-ies—separated from the overall expansion of the universe and started the evolution-ary steps that ultimately led to the galaxies and clusters of galaxies we see today.
Astrophysical processes—internal gravi-tational interactions, the propagation of electromagnetic radiation, the births and deaths of stars, and nuclear fusion in
Introduction
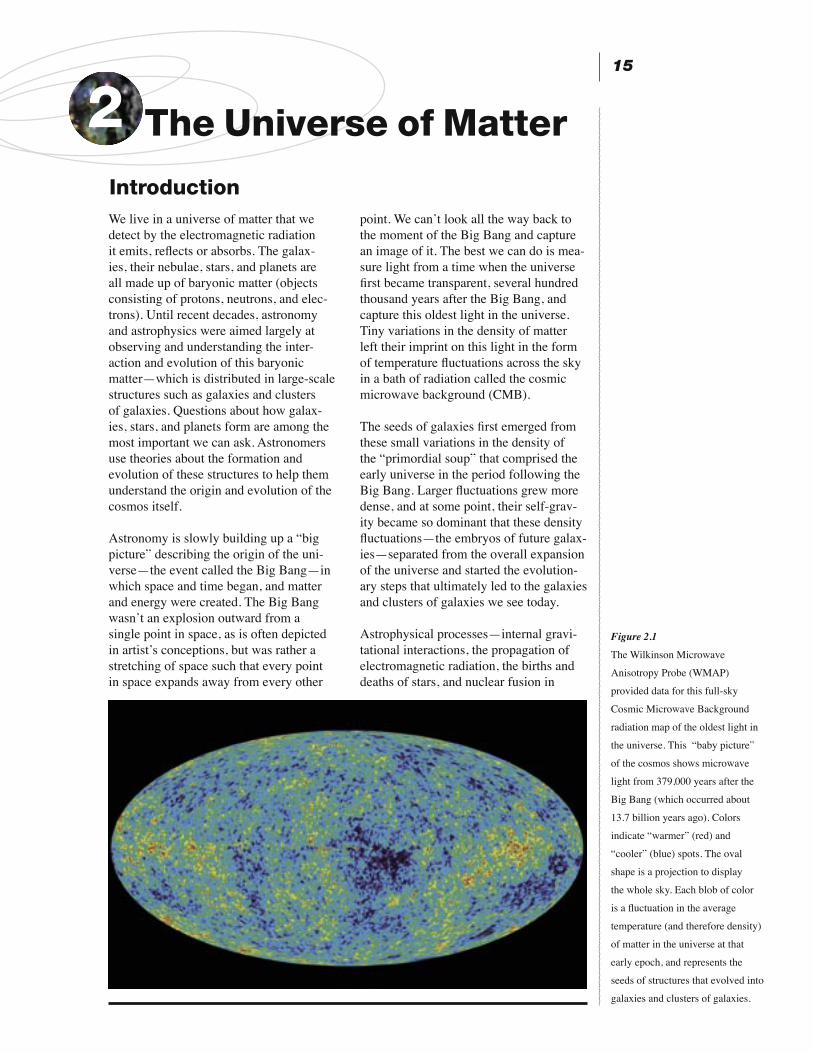
Figure 2.1
The Wilkinson Microwave
Anisotropy Probe (WMAP)
provided data for this full-sky
Cosmic Microwave Background
radiation map of the oldest light in
the universe. This “baby picture”
of the cosmos shows microwave
light from 379,000 years after the
Big Bang (which occurred about
13.7 billion years ago). Colors
indicate “warmer” (red) and
“cooler” (blue) spots. The oval
shape is a projection to display
the whole sky. Each blob of color
is a fluctuation in the average
temperature (and therefore density)
of matter in the universe at that
early epoch, and represents the
seeds of structures that evolved into
galaxies and clusters of galaxies.
The Universe of Matter
Scientific Horizons at the Gemini Observatory16
stars—play an important role in the evolu-tion of galaxies by modifying and shaping these stellar cities. However, there are other major influences—some not as easy to detect or understand.
How do we know what we know about galaxies and the forces that shape them? The visible mass of a galaxy lies in its stars, gas, and dust. Astronomers can “weigh” galaxies and their constituent parts by measuring the motions (or kine-matics) of objects in a galaxy. Galaxies themselves move through space with pe-culiar motions superimposed on the over-all expansion of the universe. All objects have motions that follow simple laws, which astronomers can use to deduce the mass of objects. For example, the velocity of the Earth in its orbit around the Sun, coupled with an application of Newtonʼs laws of gravity, helps us measure the Sunʼs mass. The motions of Sun-like stars around the center of the Milky Way can be used to compute the mass of the galaxy itself. Radio and optical observations of the motions of gas and stars in other galaxies allow astronomers to determine the amount and distribution of material in those distant systems. This gives us a feel for how much matter there is in typical galaxies, and it therefore seems straight-forward to add them all together to figure out the total mass of the universe.
However, astronomers have actually in-ferred a mass for most galaxies (including our own) that is roughly ten times larger than the combined mass of the constituent stars, gas and dust. Such a mass discrep-ancy has been confirmed elsewhere in the universe by observations of gravitational lensing that reveal galaxies (and galaxy clusters) with more mass than we might
assume from simply observing their light. Measurements of galaxy motions in clus-ters further confirm the presence of a large quantity of unobserved matter.
This has led astronomers on a search for something that has been called the “missing mass” of the universe. (Although “missing light” might be a better term since there appears to be more mass out there than there is light streaming from it!) Something else is mixed in with the baryonic matter that we detect, but what is it? Observational evidence suggests the existence of something astronomers call “dark matter.” They have proposed many candidates for this mysterious “stuff” composed of regular baryonic matter: brown dwarfs too dim to be detected, burned-out stars, dim halo stars, and black holes (which can be sinks for tremendous amounts of matter) are several possibili-ties. These candidates have largely been ruled out as the primary sources of dark matter. Beyond baryonic alternatives, particle physicists have proposed several other, more exotic suggestions: weakly interacting elementary particles like low mass, fast-moving neutrinos, or massive, slow-moving cold dark matter particles. Whatever its composition, dark matter is everywhere, and it gravitationally influ-ences the evolution and motions of galax-ies and their components, as well as the expansion of the universe. Understand-ing the nature of dark matter on galactic scales is a huge challenge. As baryonic beings living in a dark-matter-dominated universe, we are faced with the challenge of detecting and explaining matter that is largely non-baryonic in nature.
The galaxies we know today are intri-cate systems of stars, gas, dust, and dark
Figure 2.2
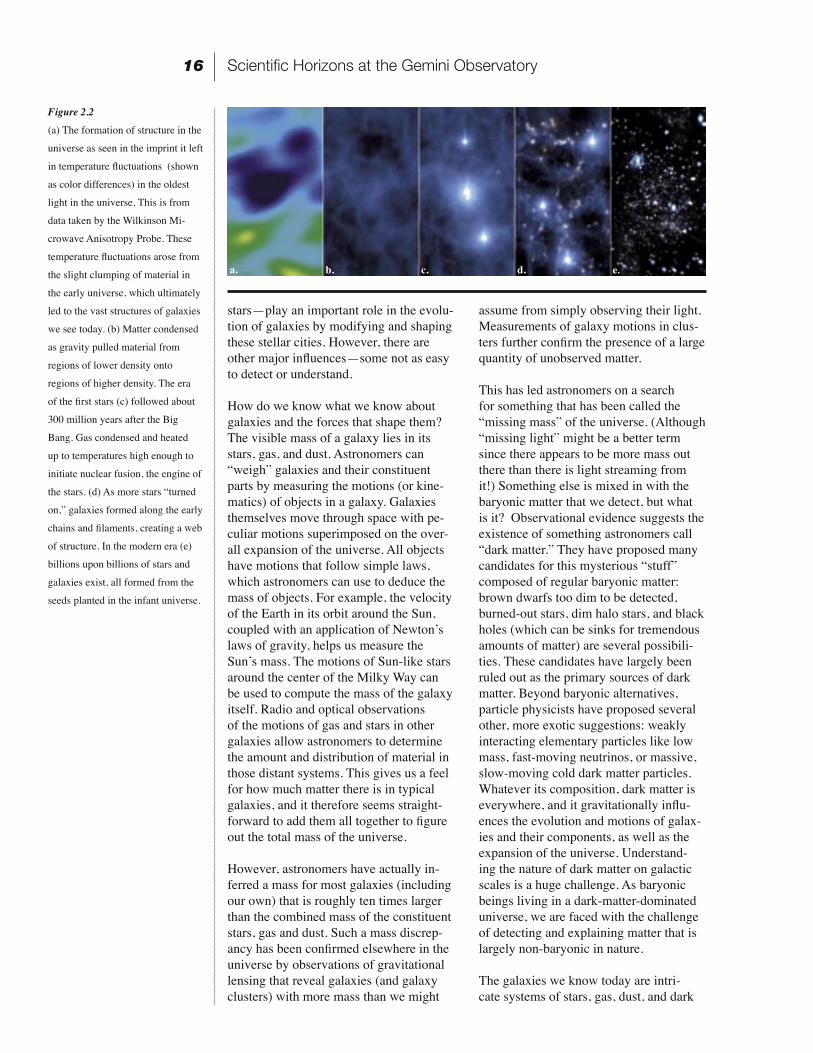
(a) The formation of structure in the
universe as seen in the imprint it left
in temperature fluctuations (shown
as color differences) in the oldest
light in the universe. This is from
data taken by the Wilkinson Mi-
crowave Anisotropy Probe. These
temperature fluctuations arose from
the slight clumping of material in
the early universe, which ultimately
led to the vast structures of galaxies
we see today. (b) Matter condensed
as gravity pulled material from
regions of lower density onto
regions of higher density. The era
of the first stars (c) followed about
300 million years after the Big
Bang. Gas condensed and heated
up to temperatures high enough to
initiate nuclear fusion, the engine of
the stars. (d) As more stars “turned
on,” galaxies formed along the early
chains and filaments, creating a web
of structure. In the modern era (e)
billions upon billions of stars and
galaxies exist, all formed from the
seeds planted in the infant universe.
a. b. c. d. e.
A Vision of Discovery 17
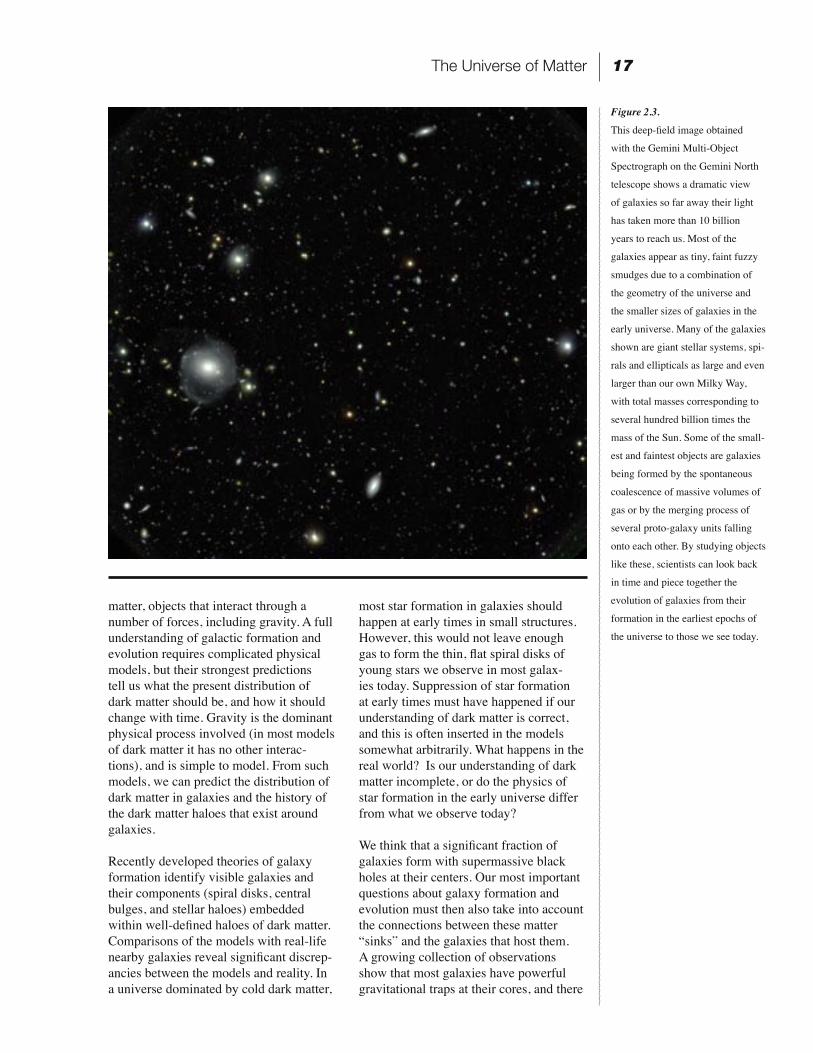
Figure 2.3.
This deep-field image obtained
with the Gemini Multi-Object
Spectrograph on the Gemini North
telescope shows a dramatic view
of galaxies so far away their light
has taken more than 10 billion
years to reach us. Most of the
galaxies appear as tiny, faint fuzzy
smudges due to a combination of
the geometry of the universe and
the smaller sizes of galaxies in the
early universe. Many of the galaxies
shown are giant stellar systems, spi-
rals and ellipticals as large and even
larger than our own Milky Way,
with total masses corresponding to
several hundred billion times the
mass of the Sun. Some of the small-
est and faintest objects are galaxies
being formed by the spontaneous
coalescence of massive volumes of
gas or by the merging process of
several proto-galaxy units falling
onto each other. By studying objects
like these, scientists can look back
in time and piece together the
evolution of galaxies from their
formation in the earliest epochs of
the universe to those we see today.
matter, objects that interact through a number of forces, including gravity. A full understanding of galactic formation and evolution requires complicated physical models, but their strongest predictions tell us what the present distribution of dark matter should be, and how it should change with time. Gravity is the dominant physical process involved (in most models of dark matter it has no other interac-tions), and is simple to model. From such models, we can predict the distribution of dark matter in galaxies and the history of the dark matter haloes that exist around galaxies.
Recently developed theories of galaxy formation identify visible galaxies and their components (spiral disks, central bulges, and stellar haloes) embedded within well-defined haloes of dark matter. Comparisons of the models with real-life nearby galaxies reveal significant discrep-ancies between the models and reality. In a universe dominated by cold dark matter,
most star formation in galaxies should happen at early times in small structures. However, this would not leave enough gas to form the thin, flat spiral disks of young stars we observe in most galax-ies today. Suppression of star formation at early times must have happened if our understanding of dark matter is correct, and this is often inserted in the models somewhat arbitrarily. What happens in the real world? Is our understanding of dark matter incomplete, or do the physics of star formation in the early universe differ from what we observe today?
We think that a significant fraction of galaxies form with supermassive black holes at their centers. Our most important questions about galaxy formation and evolution must then also take into account the connections between these matter “sinks” and the galaxies that host them. A growing collection of observations show that most galaxies have powerful gravitational traps at their cores, and there
The Universe of Matter
Scientific Horizons at the Gemini Observatory18
is a direct relationship between the mass of a central black hole and the mass of the host galaxy. A true understanding of the complex interactions between black holes and their galactic hosts depend on models for everything from the formation of galaxies to the assembly of stars from the rich stew of elements available in the universe. How are supermassive black holes formed in galactic cores? What formed first—the supermassive black hole or the galaxy? What role do galaxy mergers play in supermassive black hole formation? Are the ongoing processes of starbirth and stardeath affected by black holes, or is black hole growth controlled by star formation? These are all questions astronomers hope to answer as advanced instruments come online at the Gemini Observatory.
In the “Universe of Matter,” we turn our attention to areas of study the Gemini
Observatory will pursue to help answer questions about the nature of dark matter, the formation and evolution of galaxies, and the relationship between supermassive black holes and galaxies. The new capa-bilities for Gemini that we envision (and discuss in chapters 5-7 in greater technical detail) will:
• decipher how galaxies—including our own—formed and evolved;
• determine the nature of dark matter by mapping its distribution in galaxies in great detail;
• define the connection between supermassive black holes and star forma-tion.
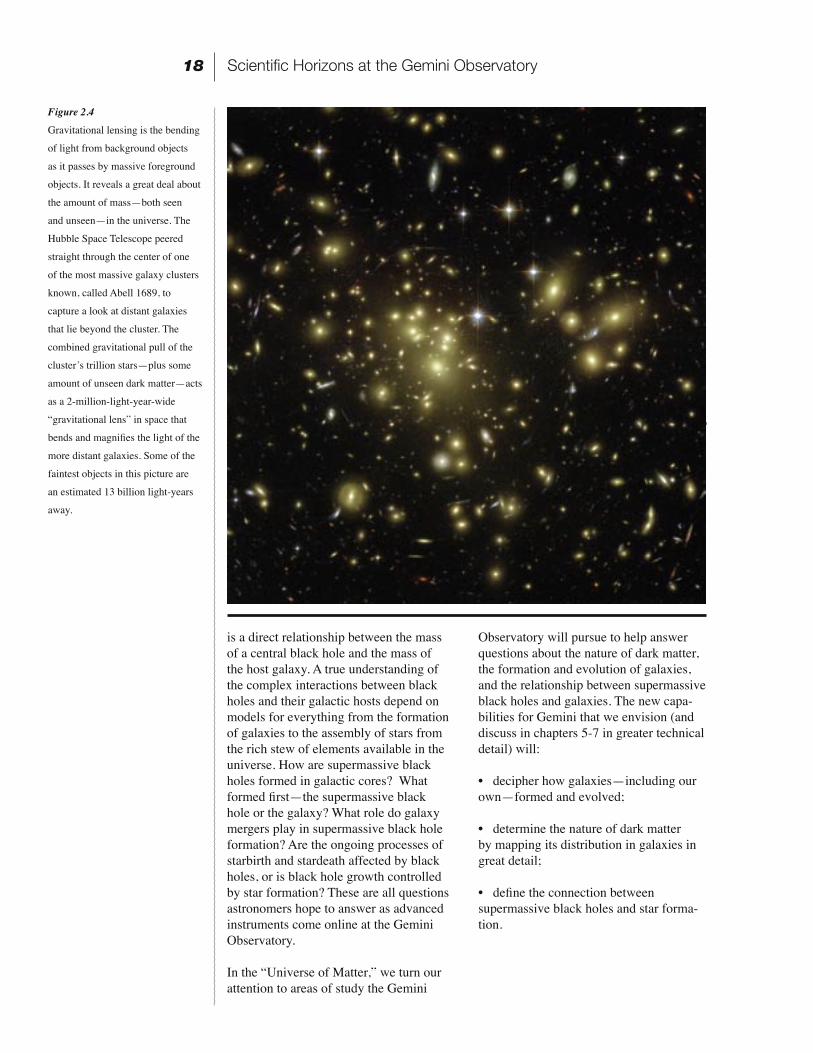
Figure 2.4
Gravitational lensing is the bending
of light from background objects
as it passes by massive foreground
objects. It reveals a great deal about
the amount of mass—both seen
and unseen—in the universe. The
Hubble Space Telescope peered
straight through the center of one
of the most massive galaxy clusters
known, called Abell 1689, to
capture a look at distant galaxies
that lie beyond the cluster. The
combined gravitational pull of the
clusterʼs trillion stars—plus some
amount of unseen dark matter—acts
as a 2-million-light-year-wide
“gravitational lens” in space that
bends and magnifies the light of the
more distant galaxies. Some of the
faintest objects in this picture are
an estimated 13 billion light-years
away.

A Vision of Discovery 19
The Nature of Dark MatterThe nature of dark matter is largely unknown. What we can infer about it comes from observations of galaxy motions across the universe. Dark matter affects the formation and evolution of galaxies and thus, the essentials of galaxy formation and the nature of dark mat-ter are inextricably linked, and must be discussed together.
We know that the seeds of present-day galaxies began as very small fluctuations in the density of the primordial material (a mix of dark matter and ordinary matter) created in the Big Bang. These density fluctuations grew under the influence of self-gravity and eventually became large enough to support star birth. Did small-scale structures, characterized by dwarf galaxies, form first? Or, were large-scale objects (clusters of galaxies) the first to emerge as discrete structures? The an-swers lie in the nature of dark matter and how it acts to shape structures of lumi-nous matter. Is this unseen material made up of unknown particles? If so, what are they? Can we measure the temperature of dark matter, which is a fundamental property that depends on the nature (e.g., the mass) of the constituent particles?
Figure 2.5
The red blob in this image shows
the stellar surface density contours
of the Sagittarius dwarf spheroidal
galaxy superimposed on an optical
image of the central 70º x 50º view
of the center of the Milky Way.
The Sagittarius dwarf is our near-
est neighbor, at only 1.5 times the
distance of the Sun from the galactic
center. It lies on the far side of the
Milky Way and was unknown until
1994. The red outline covers the
known extent as of 1997. Streams
of material removed by galactic
tides from Sagittarius cover the
entire sky. How many more are out
there that may also have contributed
to the population of stars in the
Milky Way?
The question of temperature is important because the thermal character of dark matter determines the sequence in which structure formed in the universe. If dark matter is “hot,” meaning the dark matter particles move at very high speeds, large-size structures would have developed first in the early universe. Hot dark matter does not form small-scale structures because the particles quickly stream away from any small clumps. Consequently, in hot dark matter scenarios of galaxy formation, large-scale structures assemble first and then smaller structures form later through fragmentation. On the other hand, “cold” dark matter particles move slowly, and can clump on small scales. Therefore, cold dark matter leads to formation of luminous structures (like proto-galaxies) on small scales, in the form of “haloes” that host dwarf galaxies. These dwarfs would form first and then combine later into larger galaxies and galaxy clusters.
The merging history of a typical large gal-axy (which traces the rate at which small haloes of dark matter and their embedded dwarf galaxies of stars and gas came to-gether to form the final galaxy) is another basic probe into the nature of dark matter. If dark matter is hot, there would be little
The Universe of Matter
Scientific Horizons at the Gemini Observatory20
evidence for past mergers. If it is cold, the evidence for many past mergers should be plentiful.
How can we measure the sizes of struc-tures in the early universe? The relative amplitudes of the density fluctuations on different mass scales that eventually formed the first objects in the universe (the “proto-galaxies”) can be measured at high redshifts (great distances) by mapping fluctuations in the Cosmic Microwave Background (CMB). This background is a diffuse “bath” of micro-wave radiation at a temperature of 2.7 Kelvin that pervades the universe. It is the highly redshifted relic of the radiation generated soon after the Big Bang, when the universe was much more dense and hot. The fluctuations we see in the CMB radiation are related to the fluctuations in mass density that led to the formation of galaxies.
CMB fluctuations were first measured by the Cosmic Background Explorer (COBE) satellite in 1990. Very recently, much more detailed measurements were achieved with spectacular success by the Wilkinson Microwave Anisotropy Probe (WMAP) (Figure 2.1), and astronomers came to the conclusion that cold dark mat-ter was favored. However, on the finest scale the WMAP satellite only investigat-ed CMB variations on the large scale of galaxy clusters. The nature of dark matter on smaller scales (individual galaxies) is best probed by studying galaxies in the low redshift (nearby) universe, using old
stars as a sort of “fossil record” of their formation histories. The preference of cold dark matter for small scales also makes strong predictions for the density profiles of the dark matter haloes of normal galax-ies (like the Milky Way and the Androm-eda Galaxy): they should have a particular power-law mass distribution, with ever increasing density towards their centers.
The WMAP CMB data is not the only map of the universe astronomers use to trace the distribution of matter in an effort to understand the nature and role of dark matter. Recent optical redshift surveys, such as the Sloan Digital Sky Survey (SDSS) and the 2 Degree Field Survey (2dF) have also charted structure at differ-ent distances (and therefore different ages of the universe). Analysis of their optical maps, in combination with the WMAP microwave data, have provided a reason-ably good characterization of the overall density and distribution of matter, as well as the expansion rate of the universe. The consensus of these different studies is that large-scale structures form from smaller clumps under the influence of cold dark matter, which controls the distribution of luminous matter we observe.
However, the success of cold dark matter cosmological models and a recent asser-tion that we are now in the era of “preci-sion cosmology” (where measurements are accurate to within a factor of 10%) may be premature. Studies of galaxies in the local neighborhood (the zero-redshift universe) have pointed to several potential problems with the predictions of cold dark matter models on the scales of large galax-ies and their satellites. These include:
(1) many more small satellite halos sur-rounding bigger galaxies are predicted by the models than are observed in the local universe;
(2) the predicted density profiles in the central regions of model galaxies are steeper than what we see in real galaxies;
(3) the models apparently predict too much recent merging, which would not leave enough time to form galaxies with old thick stellar disks and bulges; and
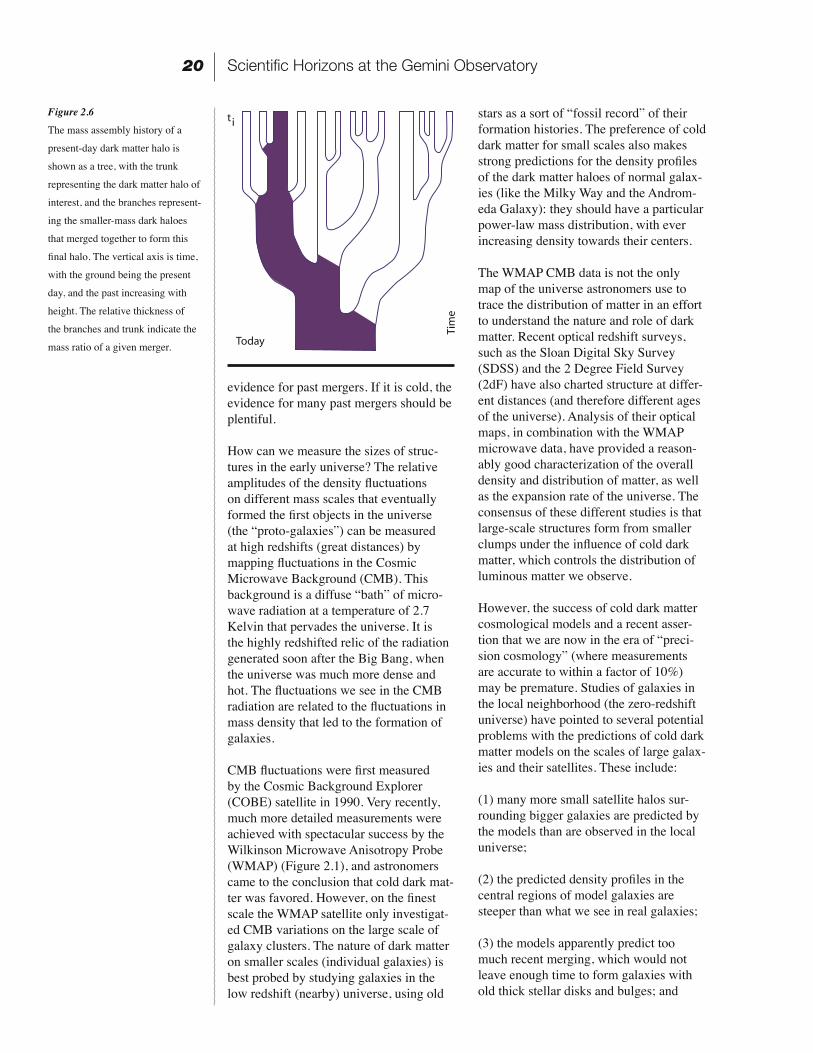
Figure 2.6
The mass assembly history of a
present-day dark matter halo is
shown as a tree, with the trunk
representing the dark matter halo of
interest, and the branches represent-
ing the smaller-mass dark haloes
that merged together to form this
final halo. The vertical axis is time,
with the ground being the present
day, and the past increasing with
height. The relative thickness of
the branches and trunk indicate the
mass ratio of a given merger.
A Vision of Discovery 21
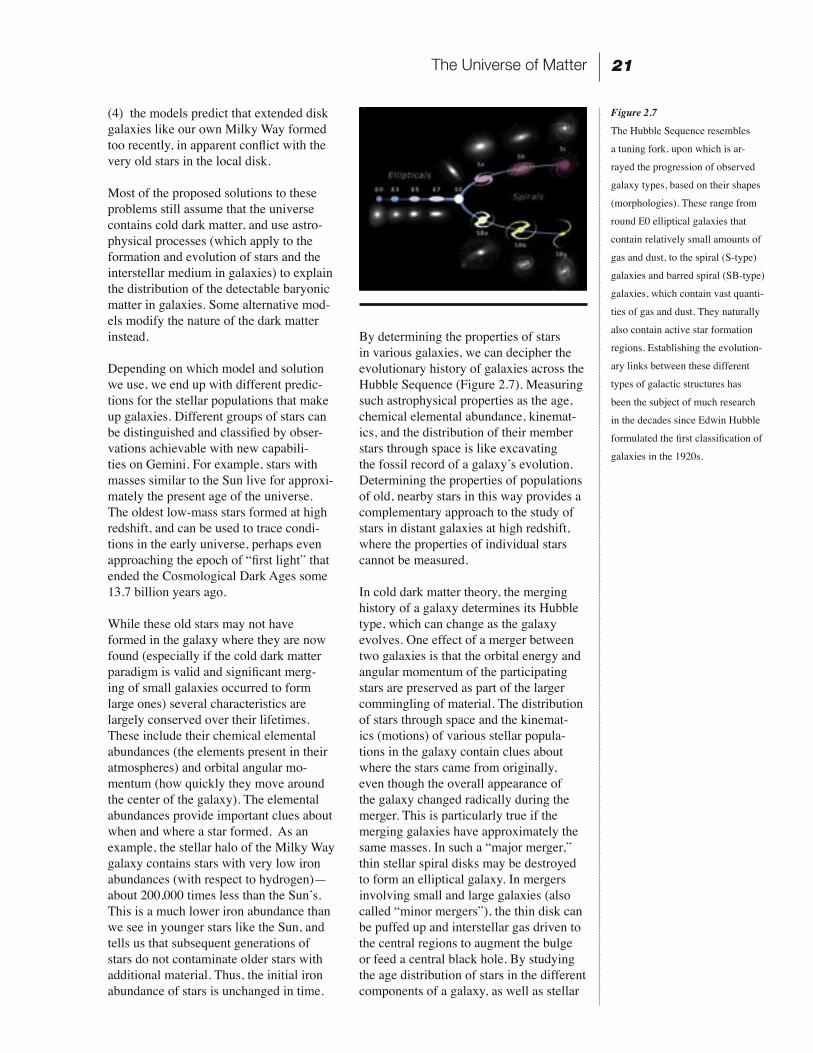
Figure 2.7
The Hubble Sequence resembles
a tuning fork, upon which is ar-
rayed the progression of observed
galaxy types, based on their shapes
(morphologies). These range from
round E0 elliptical galaxies that
contain relatively small amounts of
gas and dust, to the spiral (S-type)
galaxies and barred spiral (SB-type)
galaxies, which contain vast quanti-
ties of gas and dust. They naturally
also contain active star formation
regions. Establishing the evolution-
ary links between these different
types of galactic structures has
been the subject of much research
in the decades since Edwin Hubble
formulated the first classification of
galaxies in the 1920s.
(4) the models predict that extended disk galaxies like our own Milky Way formed too recently, in apparent conflict with the very old stars in the local disk.
Most of the proposed solutions to these problems still assume that the universe contains cold dark matter, and use astro-physical processes (which apply to the formation and evolution of stars and the interstellar medium in galaxies) to explain the distribution of the detectable baryonic matter in galaxies. Some alternative mod-els modify the nature of the dark matter instead.
Depending on which model and solution we use, we end up with different predic-tions for the stellar populations that make up galaxies. Different groups of stars can be distinguished and classified by obser-vations achievable with new capabili-ties on Gemini. For example, stars with masses similar to the Sun live for approxi-mately the present age of the universe. The oldest low-mass stars formed at high redshift, and can be used to trace condi-tions in the early universe, perhaps even approaching the epoch of “first light” that ended the Cosmological Dark Ages some 13.7 billion years ago.
While these old stars may not have formed in the galaxy where they are now found (especially if the cold dark matter paradigm is valid and significant merg-ing of small galaxies occurred to form large ones) several characteristics are largely conserved over their lifetimes. These include their chemical elemental abundances (the elements present in their atmospheres) and orbital angular mo-mentum (how quickly they move around the center of the galaxy). The elemental abundances provide important clues about when and where a star formed. As an example, the stellar halo of the Milky Way galaxy contains stars with very low iron abundances (with respect to hydrogen)—about 200,000 times less than the Sunʼs. This is a much lower iron abundance than we see in younger stars like the Sun, and tells us that subsequent generations of stars do not contaminate older stars with additional material. Thus, the initial iron abundance of stars is unchanged in time.
By determining the properties of stars in various galaxies, we can decipher the evolutionary history of galaxies across the Hubble Sequence (Figure 2.7). Measuring such astrophysical properties as the age, chemical elemental abundance, kinemat-ics, and the distribution of their member stars through space is like excavating the fossil record of a galaxyʼs evolution. Determining the properties of populations of old, nearby stars in this way provides a complementary approach to the study of stars in distant galaxies at high redshift, where the properties of individual stars cannot be measured.
In cold dark matter theory, the merging history of a galaxy determines its Hubble type, which can change as the galaxy evolves. One effect of a merger between two galaxies is that the orbital energy and angular momentum of the participating stars are preserved as part of the larger commingling of material. The distribution of stars through space and the kinemat-ics (motions) of various stellar popula-tions in the galaxy contain clues about where the stars came from originally, even though the overall appearance of the galaxy changed radically during the merger. This is particularly true if the merging galaxies have approximately the same masses. In such a “major merger,” thin stellar spiral disks may be destroyed to form an elliptical galaxy. In mergers involving small and large galaxies (also called “minor mergers”), the thin disk can be puffed up and interstellar gas driven to the central regions to augment the bulge or feed a central black hole. By studying the age distribution of stars in the different components of a galaxy, as well as stellar
The Universe of Matter
Scientific Horizons at the Gemini Observatory22
Mapping Dark Matter In order to understand the total effect dark matter has on galaxies and their forma-tion and evolution, we have to map its distribution through a variety of indirect methods. Determination of the galactic dark matter content comes from studying the kinematics and distributions of tracers in galaxies—such as individual stars or clusters. This requires sampling stellar orbits across a wide range of distances from the galactic center and using those motions to deduce the mass distribution of the galaxy. Ideally, three-dimensional stellar orbits can be derived by measuring the radial velocities, proper motions, and distances of stars. Radial velocity is the speed with which a star (or other object) moves toward or away from us, and is determined by the redshift or blueshift in its spectrum. The proper motion is the ap-parent movement of an object perpendicu-lar to the line of sight, and can only be measured in distant stars using exquisitely accurate stellar positions and over very long periods. Distances are derived using a variety of methods.
Once we know these components of a starʼs motion, we can build up a three-di-mensional map of the positions and kine-matics of stars in a galaxy. Achieving full three-dimensional kinematics from radial velocities, proper motions, and distances would be ideal. The GAIA satellite (which could launch in 2012) and Space Interfer-ometry Mission (scheduled for deploy-ment around 2009) will provide accurate
parallax distances and proper motions of individual stars throughout the Milky Way galaxy, and for statistical samples of stars in other Local Group galaxies. Line-of-sight (radial) velocities can be determined with spectroscopic studies of starlight by ground-based observatories such as Gem-ini. Only by taking thousands of spectra at a time can we hope to build up a database of radial velocities of a significant fraction of the stars in the Milky Way.
Interpreting radial velocities alone without proper motions and distances is more complicated because the stellar orbits and galaxy mass distribution cannot be uniquely determined. Recent studies have shown that we can use models to remove the ambiguity and derive the mass profile if we have many thousands of individual radial velocity measurements that are accurate enough. A velocity accuracy of about 1 kilometer/second in the spectra of Local Group satellite galaxy stars, for example, would be required. We also need sufficient coverage to sample thousands of tracer objects across the face of a target galaxy.
To map dark matter distributions across the universe, galaxies in a variety of envi-ronments and with a range of evolutionary histories (as revealed by their morphologi-cal types) should be observed. Individual stars can be used as the tracers of the overall mass of stars, gas, and dark matter in the Local Group. More luminous trac-
elemental abundances and kinematics, we can reconstruct the merger history and succession of star formation events in a galaxy.
Deriving the astrophysical parameters of stellar age, composition, and motion will be possible with the new spectroscopic capabilities proposed for Gemini. Millions of spectra would provide detailed mea-surements of the properties of individual stars in the Milky Way and in the outer regions of galaxies in the nearby neigh-borhood (where our neighbors such as the Andromeda galaxy and the Magellanic Clouds make up the “Local Group”). The
new spectrograph would also be effective on luminous tracers in more distant galax-ies, such as globular clusters (spherical collections of up to a million stars). The proposed instruments would allow us to reach a much larger sample of the differ-ent types of galaxies in a range of envi-ronments, from low-density regions and groups, to loose clusters such as Virgo, to relaxed rich clusters like the Coma cluster. We envisage the next generation of Gemini instruments providing our community with the tools to reveal the formation history of normal galaxies with unprecedented detail.
A Vision of Discovery 23
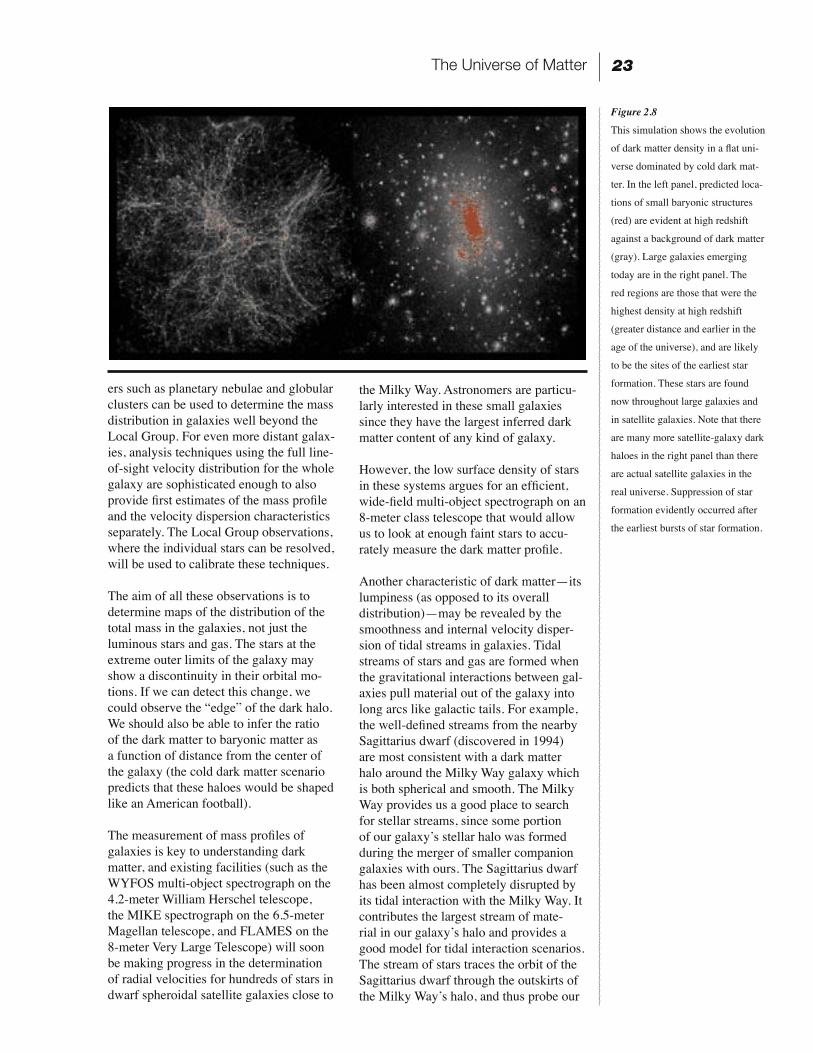
Figure 2.8
This simulation shows the evolution
of dark matter density in a flat uni-
verse dominated by cold dark mat-
ter. In the left panel, predicted loca-
tions of small baryonic structures
(red) are evident at high redshift
against a background of dark matter
(gray). Large galaxies emerging
today are in the right panel. The
red regions are those that were the
highest density at high redshift
(greater distance and earlier in the
age of the universe), and are likely
to be the sites of the earliest star
formation. These stars are found
now throughout large galaxies and
in satellite galaxies. Note that there
are many more satellite-galaxy dark
haloes in the right panel than there
are actual satellite galaxies in the
real universe. Suppression of star
formation evidently occurred after
the earliest bursts of star formation.
ers such as planetary nebulae and globular clusters can be used to determine the mass distribution in galaxies well beyond the Local Group. For even more distant galax-ies, analysis techniques using the full line-of-sight velocity distribution for the whole galaxy are sophisticated enough to also provide first estimates of the mass profile and the velocity dispersion characteristics separately. The Local Group observations, where the individual stars can be resolved, will be used to calibrate these techniques.
The aim of all these observations is to determine maps of the distribution of the total mass in the galaxies, not just the luminous stars and gas. The stars at the extreme outer limits of the galaxy may show a discontinuity in their orbital mo-tions. If we can detect this change, we could observe the “edge” of the dark halo. We should also be able to infer the ratio of the dark matter to baryonic matter as a function of distance from the center of the galaxy (the cold dark matter scenario predicts that these haloes would be shaped like an American football).
The measurement of mass profiles of galaxies is key to understanding dark matter, and existing facilities (such as the WYFOS multi-object spectrograph on the 4.2-meter William Herschel telescope, the MIKE spectrograph on the 6.5-meter Magellan telescope, and FLAMES on the 8-meter Very Large Telescope) will soon be making progress in the determination of radial velocities for hundreds of stars in dwarf spheroidal satellite galaxies close to
the Milky Way. Astronomers are particu-larly interested in these small galaxies since they have the largest inferred dark matter content of any kind of galaxy.
However, the low surface density of stars in these systems argues for an efficient, wide-field multi-object spectrograph on an 8-meter class telescope that would allow us to look at enough faint stars to accu-rately measure the dark matter profile.
Another characteristic of dark matter—its lumpiness (as opposed to its overall distribution)—may be revealed by the smoothness and internal velocity disper-sion of tidal streams in galaxies. Tidal streams of stars and gas are formed when the gravitational interactions between gal-axies pull material out of the galaxy into long arcs like galactic tails. For example, the well-defined streams from the nearby Sagittarius dwarf (discovered in 1994) are most consistent with a dark matter halo around the Milky Way galaxy which is both spherical and smooth. The Milky Way provides us a good place to search for stellar streams, since some portion of our galaxyʼs stellar halo was formed during the merger of smaller companion galaxies with ours. The Sagittarius dwarf has been almost completely disrupted by its tidal interaction with the Milky Way. It contributes the largest stream of mate-rial in our galaxyʼs halo and provides a good model for tidal interaction scenarios. The stream of stars traces the orbit of the Sagittarius dwarf through the outskirts of the Milky Wayʼs halo, and thus probe our
The Universe of Matter
Scientific Horizons at the Gemini Observatory24
galaxyʼs unseen dark-matter halo as well (Figure 2.9).
Constraints on the mass profile of the Milky Way are presently limited by the number of satellites (distant globular clusters and dwarf companion galaxies) for which good three-dimensional orbits are available. The Ground Layer Adaptive Optics (GLAO) infrared imager proposed for Gemini, if used to gather a 10-year
baseline of data, will allow statistical proper motions to be determined for satel-lite galaxies of the Milky Way and galactic globular clusters. It would do this by al-lowing fainter stars, which are much more abundant, to be included in the statistical analysis compared with existing astromet-ric surveys. This allows better determina-tion of the three-dimensional orbits of satellite galaxies at the edge of the Galaxy, and therefore better constrains the mass profile of the Milky Way. Measuring the orbits is also important for understand-ing the tidal (in)stability of the satellite galaxies, and analyzing possible interac-tion-driven star formation in the satellite galaxies by searching for correlations between epochs of active star formation and position in the orbit.
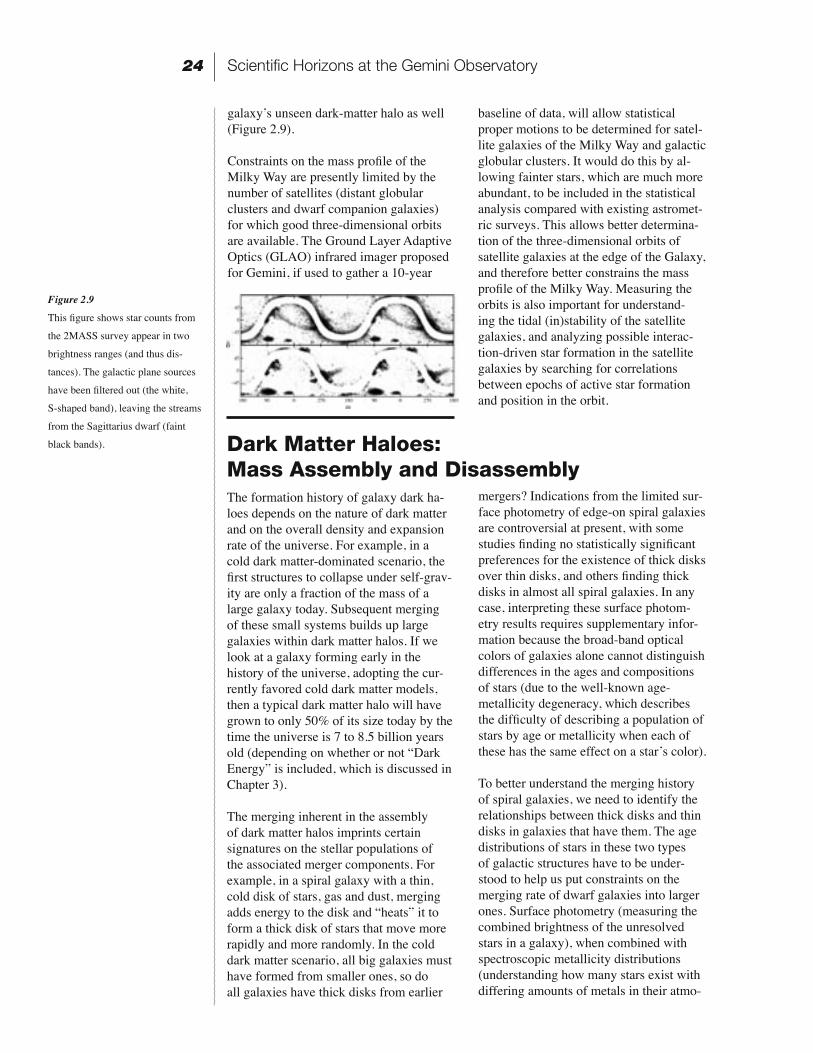
Figure 2.9
This figure shows star counts from
the 2MASS survey appear in two
brightness ranges (and thus dis-
tances). The galactic plane sources
have been filtered out (the white,
S-shaped band), leaving the streams
from the Sagittarius dwarf (faint
black bands). Dark Matter Haloes: Mass Assembly and Disassembly The formation history of galaxy dark ha-loes depends on the nature of dark matter and on the overall density and expansion rate of the universe. For example, in a cold dark matter-dominated scenario, the first structures to collapse under self-grav-ity are only a fraction of the mass of a large galaxy today. Subsequent merging of these small systems builds up large galaxies within dark matter halos. If we look at a galaxy forming early in the history of the universe, adopting the cur-rently favored cold dark matter models, then a typical dark matter halo will have grown to only 50% of its size today by the time the universe is 7 to 8.5 billion years old (depending on whether or not “Dark Energy” is included, which is discussed in Chapter 3).
The merging inherent in the assembly of dark matter halos imprints certain signatures on the stellar populations of the associated merger components. For example, in a spiral galaxy with a thin, cold disk of stars, gas and dust, merging adds energy to the disk and “heats” it to form a thick disk of stars that move more rapidly and more randomly. In the cold dark matter scenario, all big galaxies must have formed from smaller ones, so do all galaxies have thick disks from earlier
mergers? Indications from the limited sur-face photometry of edge-on spiral galaxies are controversial at present, with some studies finding no statistically significant preferences for the existence of thick disks over thin disks, and others finding thick disks in almost all spiral galaxies. In any case, interpreting these surface photom-etry results requires supplementary infor-mation because the broad-band optical colors of galaxies alone cannot distinguish differences in the ages and compositions of stars (due to the well-known age-metallicity degeneracy, which describes the difficulty of describing a population of stars by age or metallicity when each of these has the same effect on a starʼs color). To better understand the merging history of spiral galaxies, we need to identify the relationships between thick disks and thin disks in galaxies that have them. The age distributions of stars in these two types of galactic structures have to be under-stood to help us put constraints on the merging rate of dwarf galaxies into larger ones. Surface photometry (measuring the combined brightness of the unresolved stars in a galaxy), when combined with spectroscopic metallicity distributions (understanding how many stars exist with differing amounts of metals in their atmo-
A Vision of Discovery 25
spheres), will provide this information. To constrain the relative sizes of the galaxies that collided in the merger, we need to measure the kinematics of stars in both thick and thin disks. Spectroscopy of the combined light from stars in distant galax-ies can be used to determine the required kinematics and metallicities for stars for both kinds of disks. To determine if all spiral galaxies form from merging smaller units, we will need a spectroscopic survey of all edge-on disk galaxies out to around 65 million light-years (20 megaparsecs) to determine the statistical properties of the stellar populations of disk galaxies.
The mass assembly of a big galaxy from smaller units is controlled by the angular momentum transport of material due to gravitational torques and dynamical (grav-itational) friction between galaxy com-ponents. The net results are that the outer parts of giant elliptical galaxies, if formed by major mergers, are predicted to contain a significant part of the angular momen-tum (rotation) of the original spiral galax-ies from which they formed. This can be tested by looking to see if the faint outer parts of ellipticals are rotating quickly (or not), using spectroscopic observations of the integrated stellar light and orbiting globular clusters. Again, a relatively large sample of galaxies is needed to know if all ellipticals form from major mergers, requiring spatially resolved, moderate resolution spectroscopy out to the distance of the Coma cluster (where giant ellipti-cals exist in large numbers), more than 300 million light-years away.
Dark matter haloes can also be broken apart (disassembled) by strong interac-tions, and this process can be traced by the baryons in stars and gas. In galaxy clus-ters, where the relative velocities between galaxies are generally much larger than their internal velocities, a merger into one
galaxy is an unlikely result of an encoun-ter between galaxies. Many high-speed encounters (dubbed galaxy “harassment”) that take place in the clusters can cause victim galaxies to lose substantial amounts of mass. This process may ultimately cre-ate the many “dwarf elliptical” galaxies from normal disk galaxies in the clusters, as well as compact dwarf ellipticals from normal dwarf galaxies. Indirect evidence for free-flying stars flung off from galaxies during harassment has been available for many years in the form of diffuse light in clusters. More re-cently, individual stars have been detected between the galaxies of the Virgo cluster using Hubble Space Telescope. Interga-lactic planetary nebulae have also been found, marking locations where stars have recently died. The observed space density of intergalactic planetary nebulae in Virgo is around one planetary nebula per square arcminute, and there are hundreds of thousands of red giant branch stars per planetary nebula. Wide-field multi-ob-ject spectroscopy is therefore required to observe and measure the properties of in-tergalactic planetary nebulae and red giant branch stars. Spatially resolved spectros-copy would pick up the fainter intergalac-tic starlight. The spatial distributions of intra-cluster stars and planetary nebulae appear to be very non-uniform and consis-tent with expectations for a poorly mixed population. This is a powerful diagnostic of the dynamical origin of these interga-lactic tracers. Kinematic and metallicity measurements would allow the connec-tion to be made between these stars and the surviving parent galaxies from which the intergalactic stars originated. Map-ping intergalactic substructure will allow us to trace the disassembly of galaxies in clusters, constrain the relative dark matter distributions and determine the lumpiness of dark matter in clusters.
The Universe of Matter
Scientific Horizons at the Gemini Observatory26
The Genesis of our Galaxy and the Local GroupUncovering the fossil record of galaxy formation and the history of star for-mation by “galactic archaeology” re-quires that we obtain detailed elemental abundances and high precision measure-ments of stellar motions for millions of stars in the galaxy (the Milky Way contains more than 100 billion stars). This will enable “tagging” of stars to identify them as members of common star formation times or regions. Potential origins of distinctive populations of stars include satellite galaxies, open clusters (groups of stars that form together in the galactic disk), and globular clusters. We can derive the required sample size needed to distinguish families of stars by considering the expected mass of a typical distinct star-forming region. If the mass
is characteristic of the first gravitationally bound objects in the universe (the earli-est condensations of matter) in cold dark matter cosmology, then the baryonic mass reflects the Jeans mass (the minimum mass which can collapse from a gravita-tional instability of a certain size for given conditions of temperature and pressure) after recombination. We think the Jeans mass at the time the first protogalaxies formed was about a million solar masses. Hundreds of thousands of such units would have to coalesce to form a galaxy like the Milky Way.
If the typical mass of the individual pieces that formed our galaxy was more similar to open star clusters forming today, it may be somewhat smaller than a million solar masses. On the other hand, it is possible that globular star clusters, which are much older and more massive than open clus-ters, were favored in the early universe. In any case, star formation was likely to be somewhat inefficient (as it is under most circumstances), leading to perhaps hundreds of thousands of stars formed per million solar mass star-forming region, meaning that tens of thousands of these systems would have been needed to popu-late the billion-solar-mass stellar halo of our galaxy alone. Scaling from estimates of the relative masses of the stellar halo, the central bulge, and the thick and thin disks, this leads to the expectation of mil-lions of such star-forming regions being required to form the whole Milky Way.
To sort out the membership of all these star families we need a sample of ap-proximately ten stars from each star-form-ing region, which leads to total required sample sizes in the millions to study each main stellar component of the Milky Way. Good elemental abundances and velocities accurate to a few kilometers per second are required for each star.
Present state-of-the art analysis tools are limited to much smaller sample sizes—only tens of thousands of stars. A quantum leap in sample size is thus required. In addition, for good coverage of the whole
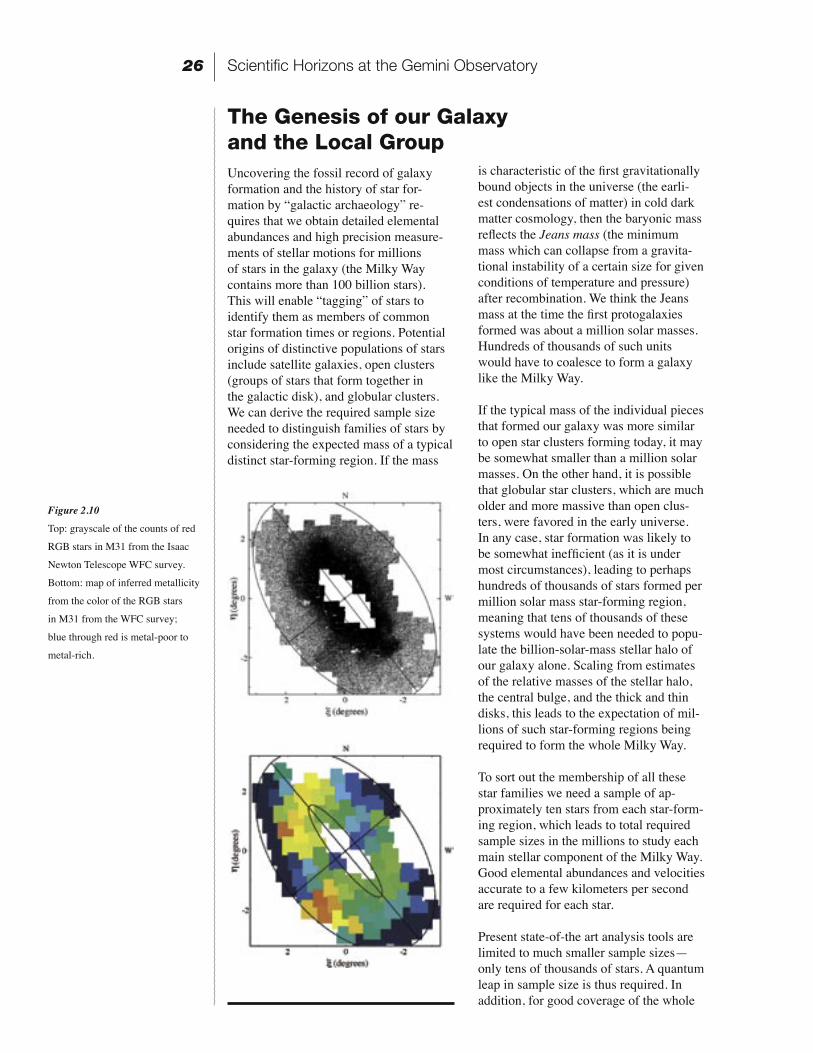
Figure 2.10
Top: grayscale of the counts of red
RGB stars in M31 from the Isaac
Newton Telescope WFC survey.
Bottom: map of inferred metallicity
from the color of the RGB stars
in M31 from the WFC survey;
blue through red is metal-poor to
metal-rich.
A Vision of Discovery 27
Milky Way, we cannot simply rely on stars whose orbits take them close to the Sun, a tactic often used in the past (earlier studies were not sensitive enough to reach stars very far away). We must instead observe faint, distant stars all across the Milky Way.
Even without the highly precise data for millions of stars required to map the de-tailed star formation history in our galaxy, the wide-field multi-object capability on Gemini will open up a new window of understanding on galactic structure, in the Milky Way and in other galaxies. The second approach in our galactic archae-ology is to obtain overall metallicities, rather than elemental abundances, and less precise radial velocities good to tens of km/second. These lower-accuracy mea-surements are easier to obtain, particularly at larger distances, and we can use those characteristics to assign stars to one of the main stellar components of a galaxy (something like identifying the “ethnicity” of a star instead of the exact family from which it comes). This general classifica-tion will allow astronomers to quantify relationships between the different stellar components. Through the determination of the rate of change in stellar properties relative to position within a galaxy, and using correlations between the kinematics of populations and other observable pa-rameters, we can clarify the main physical
processes that shape galaxy formation.
At present, we have this type of data for about 5,000 stars across the Milky Way galaxy. Determination of the distribution of stellar population properties requires sample sizes in excess of 10,000 stars in each line of sight. To analyze the kinemat-ics using radial velocities alone (without proper motions) requires good coverage of our galaxy so that the radial velocities can probe all the components of stellar motions in three dimensions. Roughly 30 lines of sight will be needed to understand all of the bulge, halo, thin disk and thick disk populations of the Milky Way. The total sample size needed for this study is about 300,000 stars. Even this less-ambi-tious project represents a severe challenge for current facilities, but could be done at Gemini with the new wide-field multi-ob-ject spectrometer.
While the Milky Way is believed “typical” for its type, it is only one galaxy. Defini-tive understanding of how galaxies form will require a larger selection of galaxies. The Local Group contains a range of dif-ferent galaxy types, including disk galax-ies (the Milky Way, the Andromeda galaxy M31, and its companion galaxy M33 all have components of different sizes), irregular galaxies (the Large and Small Magellanic Clouds), a compact ellipti-cal galaxy (M32), and dwarf spheroidals
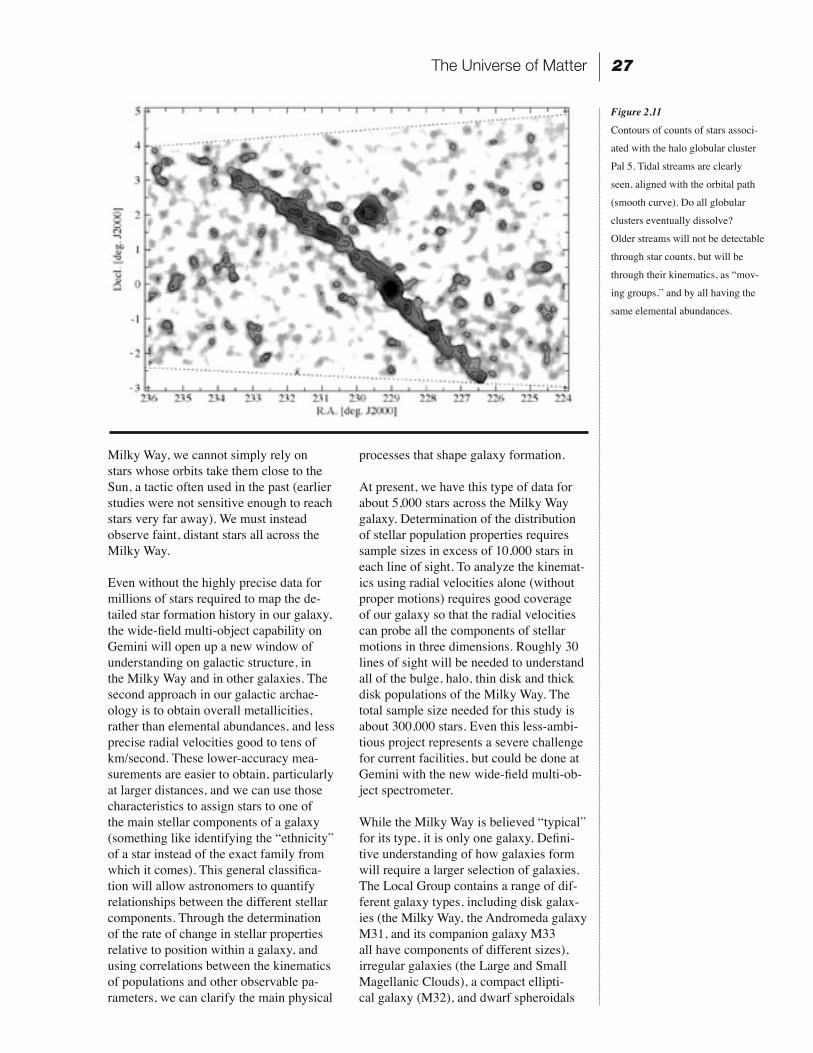
Figure 2.11
Contours of counts of stars associ-
ated with the halo globular cluster
Pal 5. Tidal streams are clearly
seen, aligned with the orbital path
(smooth curve). Do all globular
clusters eventually dissolve?
Older streams will not be detectable
through star counts, but will be
through their kinematics, as “mov-
ing groups,” and by all having the
same elemental abundances.
The Universe of Matter
Scientific Horizons at the Gemini Observatory28
(like the Ursa Minor galaxy). Further, the inferred global mass-to-light ratios (i.e., dark matter fractions) vary by at least a factor of ten from one galaxy to another. It has been known for many years that, despite the fact that the stellar haloes of the Milky Way and M31 are the arche-types for “Population II” (old, metal-poor) stars, a typical M31 halo star is much more metal-rich than is a typical Milky Way halo star. All this evidence tells us that the disk galaxies in the Local Group are clearly diverse and did not all form in the same way. Indeed, the very small (even non-existent) central bulge of M33 presents an immediate challenge to cold dark matter models.
Spectra of evolved Red Giant Branch stars in M31 can be used to obtain kinematics and metallicities that are sufficiently ac-curate to assign each star to a given stellar population. This would allow us to iden-tify extremely metal poor stars for fol-low-up study. Imaging of the low surface brightness outer regions of M31 (using the Wide Field Camera on the 2.5-meter Isaac Newton Telescope) allows study of indi-vidual upper RGB stars and has revealed structure in the halo with unexpected spa-tial variations in the chemical abundances of the stars (see Figure 2.12). Imaging of even fainter stars (using the Advanced Camera for Surveys on the Hubble Space Telescope) sampled the old main sequence stars in one field far from the major axis of M31, and revealed further structure. This was interpreted as evidence that a recent merger with a dwarf companion galaxy left its mark on the halo of M31.
However, the orientation and outer warp of M31ʼs disk makes sorting the different stellar components difficult. Many lines of sight will be needed to obtain a consistent picture of M31ʼs evolutionary history, with kinematic and metallicity measure-ments needed to separate the stars into their stellar populations.
While existing spectroscopic capabilities on 8-meter telescopes can provide the necessary data for small samples of red giant branch stars, they cannot give us a comprehensive map of the kinematics and metallicities across the outer regions of M31 in large enough numbers to define real distributions. We are particularly interested in these outer regions of M31 because that is where dynamical time scales (the time needed for mixing of dif-ferent stellar populations) are the longest. The signatures of substructure should persist the longest in the outer regions of a galaxy. The spectroscopic capabili-ties proposed for Gemini will allow us to create definitive kinematic and metallicity maps of the outer regions of M31 and other Local Group galaxies. The surface densities of target stars are many tens per square arcminute, but suffer from signifi-cant contamination by foreground stars in the Milky Way. Efficient mapping of M31 may be achieved by separating its stars from those in the Milky Way using the ex-cellent image quality of an infrared imager with ground-layer adaptive optics (GLAO) to determine mean proper motions. The intervening stars in the Milky Way may be of interest too.
Stars, Star Formation, and the Role of Dark Matter
function of time and location for a wide range of galaxy sizes, types, and environ-ments.
It is also important to understand the mode of star formation to know how many stars formed, and how quickly. We can answer such questions as: under what circum-stances do “super star clusters” form, and are they young globular clusters? What are the ages, metallicities and masses of star clusters in external galaxies?
Models of galaxy formation predict different star formation histories for a variety of galaxy types in different envi-ronments. For example, hot dark matter scenarios predict that the oldest stars should be found in the largest galaxies in the universe. In cold dark matter models, galaxies in low-density regions formed only recently and should be younger than galaxies in clusters. Ideally, one would test theories about galaxy formation by determining the star formation rate as a
A Vision of Discovery 29
Analysis of the absorption lines in high-resolution spectra of the integrated light of star clusters can be used to distinguish their ages and metallicities. Combined with kinematic information, we can determine the masses and luminosities of the clusters. Thus, we can constrain the stellar initial mass function for star clus-ters, which describes how many stars of each mass and type form in a new stellar population.
The initial mass function of stars not asso-ciated with a cluster is constrained by di-rect imaging of individual stars (given that we know the relationship between mass and luminosity in stars already), and by spectroscopic determination of elemental abundances in the stars enriched by Type II supernovae of stars of different masses produce elements in differing amounts). Very low metallicity stars in the halo of the Milky Way, external satellite galaxies, and M31 can be identified through large spectroscopic surveys and followed up with higher spectral resolution to look for possible signatures of enrichment from the very first generation of “Population III” stars that contained no heavier elements at all.
The fossil record of galaxy formation and evolution is written in the ages, chemical composition, kinematics, and spatial dis-tributions of their respective stars, as well as the stellar initial mass function. These define the characteristics of any stellar population that we want to study. One ma-jor complication that pits theory against observation is our limited current under-standing of the process of star formation. We do not yet have a clear picture of what determines how and when stars form.
The Milky Way galaxy is a “typical” large spiral galaxy, and the one about which the most detailed information is obtainable. It makes a good template for the interpreta-tion of stellar data for galaxies that are more distant. Proposed new capabilities on Gemini should provide unprecedented information and a significant increase in sample size, depth, accuracy and com-plexity on stellar populations in the Milky Way as well as galaxies out to the Coma cluster (a distance of about 300 million
light years) thereby providing a diverse sample of morphological types in a range of environments.
We do not yet have a full characterization of the stellar populations in the various parts of the Milky Way: the main disk, thick disk, bulge, and stellar halo. Even the star formation history of the local solar neighborhood is uncertain. The best mea-surements to date make use of high-preci-sion Hipparcos data, which only addresses the last 3 billion years in the evolution of our galaxy. The ages of the oldest thin disk stars, which either sets the epoch when star formation began in the local disk (if the stars were born in the disk), or gives the age of stars in the accreted satel-lites that contributed to the disk, is not known to better than about 4 billion years. The thick disk may have formed when a pre-existing thin disk was heated by a minor merger. In that case, the thick disk would contain stars of all ages that formed prior to the commingling of stars and gas. The range of stellar ages in the thick disk could be used to pinpoint when the merger took place. The age distribution of stars in the central bulge and in the stellar halo reflects the star formation history of accreted stellar satellites, as well as in-situ star formation within clouds of gas and dust from the earliest times in the galaxyʼs history.
The available age-dating data stems from colors and metallicities gathered using a combination of photometry and spec-troscopy. Stars in the different compo-nents of the Milky Way galaxy provide a remarkably consistent picture that the last significant merger (much more massive than the Sagittarius dwarf) was long ago. However, these data are limited by the numbers of stars sampled and the area of space covered. The proposed capabilities for Gemini will provide an unprecedented leap forward in sample size and complex-ity, and allow conclusions that are more robust.
Merging histories and galactic chemical evolution can also be revealed by measur-ing the chemical elemental abundances of stars. Figure 2.12 shows that the elemental abundances for stars in satellite galaxies
The Universe of Matter

Scientific Horizons at the Gemini Observatory30
of the Milky Way (large colored symbols) are very different from those in stars of the Milky Way (small symbols). These elemental abundance ratios are essentially unchanged over the lifetimes of the stars (many billions of years). This implies that if mergers of subsystems (dwarf galaxies, for example) did form our galaxy, they were different from the dwarf satellites we see around us today. The conclusion from studies of stellar age distributions gives us the same result: the typical star in a satel-lite galaxy is a few billion years old, while the typical star in the stellar halo of our galaxy is closer to 12 billion years old. Thus, if the merging objects destined to form the stellar halo of the Milky Way and the surviving satellite galaxies were the same, with the same potential for forming stars and creating heavier elements, the merging entities must all have combined to form the stellar halo a long time ago. In contrast, cold dark matter models predict that small dwarf galaxies should continue to merge with the halo throughout much of the history of the universe.
Much of a galaxyʼs history is told through the fine structure of its chemical abundances and overall kinematics. The telltale signatures of mergers and disrup-tion of substructure may show up in the angular momentum of stellar popula-tions in galaxies and in their elemental abundances. All elements heavier than helium have been produced by nuclear fusion in the centers of stars (this is the process by which the Sun shines); when stars die, they eject these newly created elements into the surrounding mate-rial, that can later coalesce to form new stars. Measuring the “metallicity”—the abundance of all elements heavier than helium—in a star allows us to assign it to a given stellar component. We could learn much more if we could derive the abundances of all individual chemical
elements in the star. Different elements are produced by stars of different masses, and since stars of different masses live for dif-ferent lengths of time, their elements are returned to the interstellar gas and dust on different time scales. Subsequent stellar generations are born from gas enriched in chemical elements by previous genera-tions. The relative abundances of different elements in the long-lived stars depend on both the stellar initial mass function and the star formation rate.
If alpha elements that are mainly produced in massive stars can be measured, then the time scale of metal enrichment in a stellar population may be estimated. This can provide insight into the numbers of mas-sive stars that lived previously, which en-riched the material from which subsequent low-mass stars formed. The alpha ele-ments are the first metals to be produced from a generation of stars, on time scales of about a million years after the onset of star formation (the lifetime of the most massive stars). The alpha elements include oxygen, silicon, magnesium and oth-ers, and get their name because they are formed by the successive fusion of helium nuclei, or alpha particles. By contrast, iron is mainly produced in Type Ia supernovae, the explosions of white dwarfs that grow too massive to remain stable. They con-tribute iron and other heavy elements to the interstellar medium on time scales that range from about a billion years after the formation of the progenitor star to roughly the age of the universe. The neutron-rich s-process elements (produced in the outer atmospheric envelopes of Asymptotic Giant Branch stars) can be used to infer enrichment of the interstellar medium on time scales of the order of a billion years, and may give interesting insights into the initial mass function of the earliest stars. The r-process elements are produced in all supernovae, but are especially com-mon in some of the most metal-poor stars known. Are these most metal-poor stars the oldest? The abundances of radioac-tive elements that decay over very long periods can serve as “nuclear chronom-eters” (uranium, thorium and neodymium, for example), and may provide important constraints on the ages of the oldest stars in the galaxy. Large sample sizes for good
Figure 2.12
Elemental abundances for stars in
the dwarf spheroidal companion
galaxies to the Milky Way (large
colored symbols), compared to
galactic stars (small black symbols).
The stars in the satellite galaxies
show a very different pattern than
do the Milky Way stars.
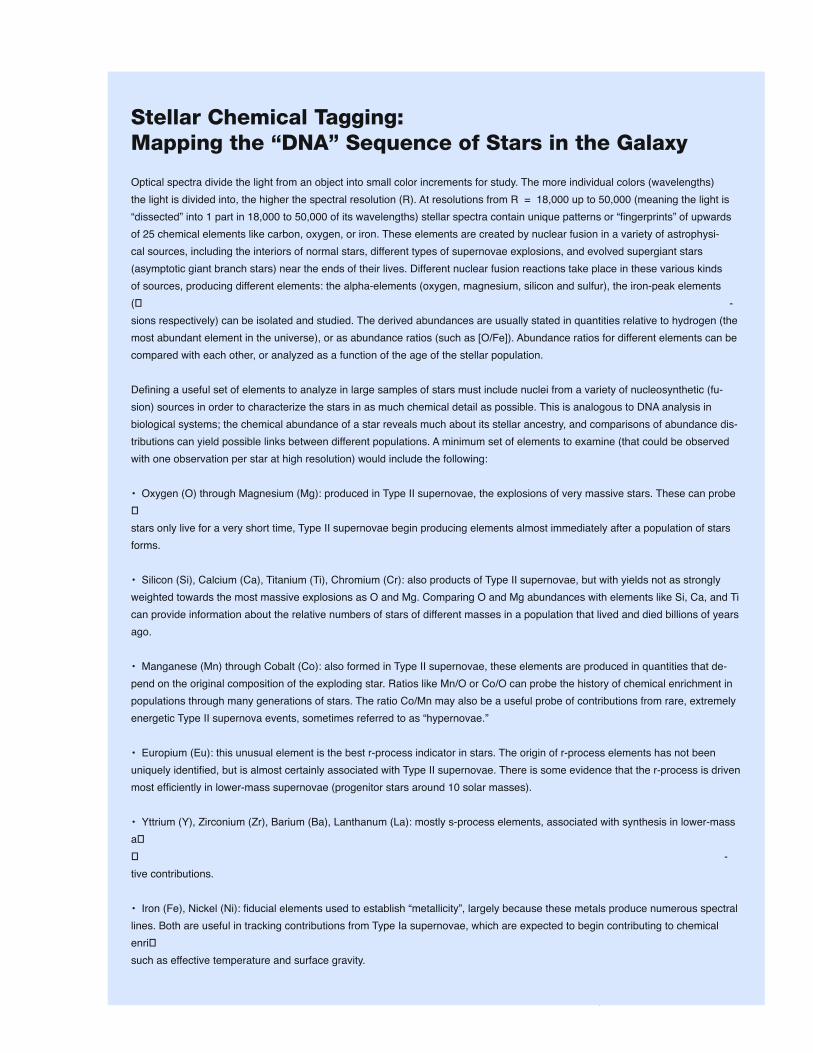
A Vision of Discovery 31
Stellar Chemical Tagging:Mapping the “DNA” Sequence of Stars in the Galaxy
Optical spectra divide the light from an object into small color increments for study. The more individual colors (wavelengths) the light is divided into, the higher the spectral resolution (R). At resolutions from R = 18,000 up to 50,000 (meaning the light is “dissected” into 1 part in 18,000 to 50,000 of its wavelengths) stellar spectra contain unique patterns or “fingerprints” of upwards of 25 chemical elements like carbon, oxygen, or iron. These elements are created by nuclear fusion in a variety of astrophysi-cal sources, including the interiors of normal stars, different types of supernovae explosions, and evolved supergiant stars (asymptotic giant branch stars) near the ends of their lives. Different nuclear fusion reactions take place in these various kinds of sources, producing different elements: the alpha-elements (oxygen, magnesium, silicon and sulfur), the iron-peak elements (� -sions respectively) can be isolated and studied. The derived abundances are usually stated in quantities relative to hydrogen (the most abundant element in the universe), or as abundance ratios (such as [O/Fe]). Abundance ratios for different elements can be compared with each other, or analyzed as a function of the age of the stellar population.
Defining a useful set of elements to analyze in large samples of stars must include nuclei from a variety of nucleosynthetic (fu-sion) sources in order to characterize the stars in as much chemical detail as possible. This is analogous to DNA analysis in biological systems; the chemical abundance of a star reveals much about its stellar ancestry, and comparisons of abundance dis-tributions can yield possible links between different populations. A minimum set of elements to examine (that could be observed with one observation per star at high resolution) would include the following:
• Oxygen (O) through Magnesium (Mg): produced in Type II supernovae, the explosions of very massive stars. These can probe �stars only live for a very short time, Type II supernovae begin producing elements almost immediately after a population of stars forms.
• Silicon (Si), Calcium (Ca), Titanium (Ti), Chromium (Cr): also products of Type II supernovae, but with yields not as strongly weighted towards the most massive explosions as O and Mg. Comparing O and Mg abundances with elements like Si, Ca, and Ti can provide information about the relative numbers of stars of different masses in a population that lived and died billions of years ago.
• Manganese (Mn) through Cobalt (Co): also formed in Type II supernovae, these elements are produced in quantities that de-pend on the original composition of the exploding star. Ratios like Mn/O or Co/O can probe the history of chemical enrichment in populations through many generations of stars. The ratio Co/Mn may also be a useful probe of contributions from rare, extremely energetic Type II supernova events, sometimes referred to as “hypernovae.”
• Europium (Eu): this unusual element is the best r-process indicator in stars. The origin of r-process elements has not been uniquely identified, but is almost certainly associated with Type II supernovae. There is some evidence that the r-process is driven most efficiently in lower-mass supernovae (progenitor stars around 10 solar masses).
• Yttrium (Y), Zirconium (Zr), Barium (Ba), Lanthanum (La): mostly s-process elements, associated with synthesis in lower-mass a�� -tive contributions.
• Iron (Fe), Nickel (Ni): fiducial elements used to establish “metallicity”, largely because these metals produce numerous spectral lines. Both are useful in tracking contributions from Type Ia supernovae, which are expected to begin contributing to chemical enri�such as effective temperature and surface gravity.
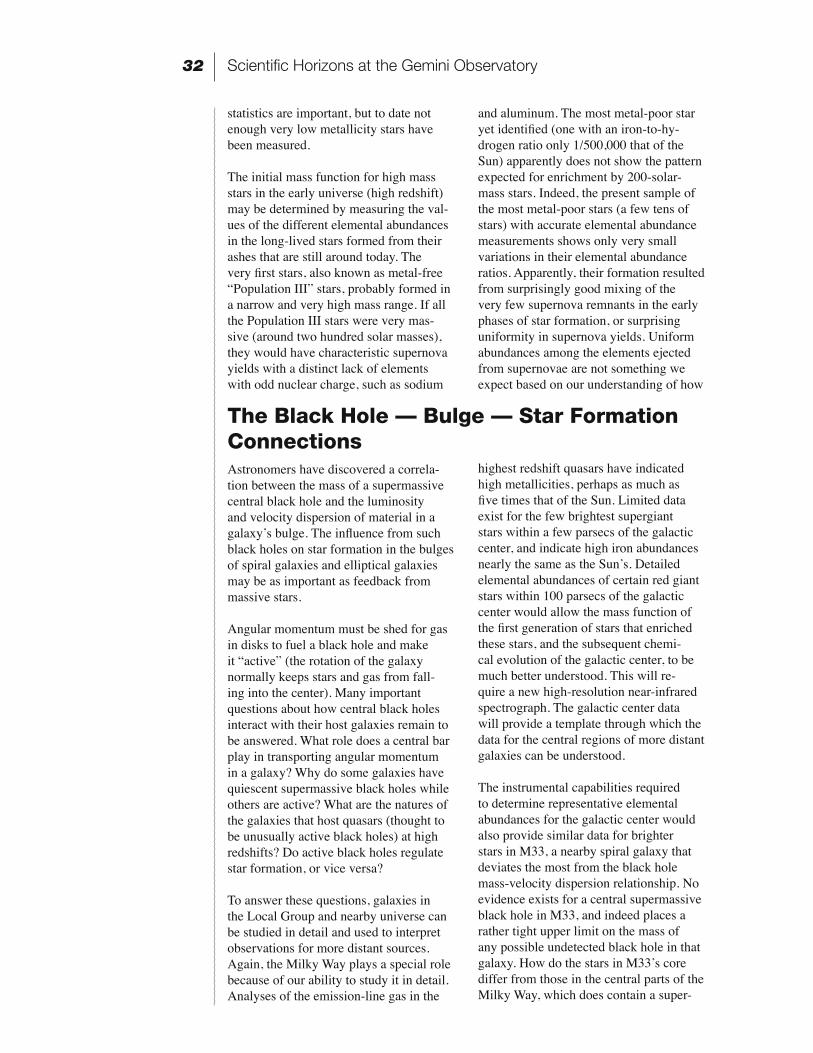
Scientific Horizons at the Gemini Observatory32
The Black Hole — Bulge — Star Formation ConnectionsAstronomers have discovered a correla-tion between the mass of a supermassive central black hole and the luminosity and velocity dispersion of material in a galaxyʼs bulge. The influence from such black holes on star formation in the bulges of spiral galaxies and elliptical galaxies may be as important as feedback from massive stars.
Angular momentum must be shed for gas in disks to fuel a black hole and make it “active” (the rotation of the galaxy normally keeps stars and gas from fall-ing into the center). Many important questions about how central black holes interact with their host galaxies remain to be answered. What role does a central bar play in transporting angular momentum in a galaxy? Why do some galaxies have quiescent supermassive black holes while others are active? What are the natures of the galaxies that host quasars (thought to be unusually active black holes) at high redshifts? Do active black holes regulate star formation, or vice versa? To answer these questions, galaxies in the Local Group and nearby universe can be studied in detail and used to interpret observations for more distant sources. Again, the Milky Way plays a special role because of our ability to study it in detail. Analyses of the emission-line gas in the
highest redshift quasars have indicated high metallicities, perhaps as much as five times that of the Sun. Limited data exist for the few brightest supergiant stars within a few parsecs of the galactic center, and indicate high iron abundances nearly the same as the Sunʼs. Detailed elemental abundances of certain red giant stars within 100 parsecs of the galactic center would allow the mass function of the first generation of stars that enriched these stars, and the subsequent chemi-cal evolution of the galactic center, to be much better understood. This will re-quire a new high-resolution near-infrared spectrograph. The galactic center data will provide a template through which the data for the central regions of more distant galaxies can be understood.
The instrumental capabilities required to determine representative elemental abundances for the galactic center would also provide similar data for brighter stars in M33, a nearby spiral galaxy that deviates the most from the black hole mass-velocity dispersion relationship. No evidence exists for a central supermassive black hole in M33, and indeed places a rather tight upper limit on the mass of any possible undetected black hole in that galaxy. How do the stars in M33ʼs core differ from those in the central parts of the Milky Way, which does contain a super-
statistics are important, but to date not enough very low metallicity stars have been measured.
The initial mass function for high mass stars in the early universe (high redshift) may be determined by measuring the val-ues of the different elemental abundances in the long-lived stars formed from their ashes that are still around today. The very first stars, also known as metal-free “Population III” stars, probably formed in a narrow and very high mass range. If all the Population III stars were very mas-sive (around two hundred solar masses), they would have characteristic supernova yields with a distinct lack of elements with odd nuclear charge, such as sodium
and aluminum. The most metal-poor star yet identified (one with an iron-to-hy-drogen ratio only 1/500,000 that of the Sun) apparently does not show the pattern expected for enrichment by 200-solar-mass stars. Indeed, the present sample of the most metal-poor stars (a few tens of stars) with accurate elemental abundance measurements shows only very small variations in their elemental abundance ratios. Apparently, their formation resulted from surprisingly good mixing of the very few supernova remnants in the early phases of star formation, or surprising uniformity in supernova yields. Uniform abundances among the elements ejected from supernovae are not something we expect based on our understanding of how
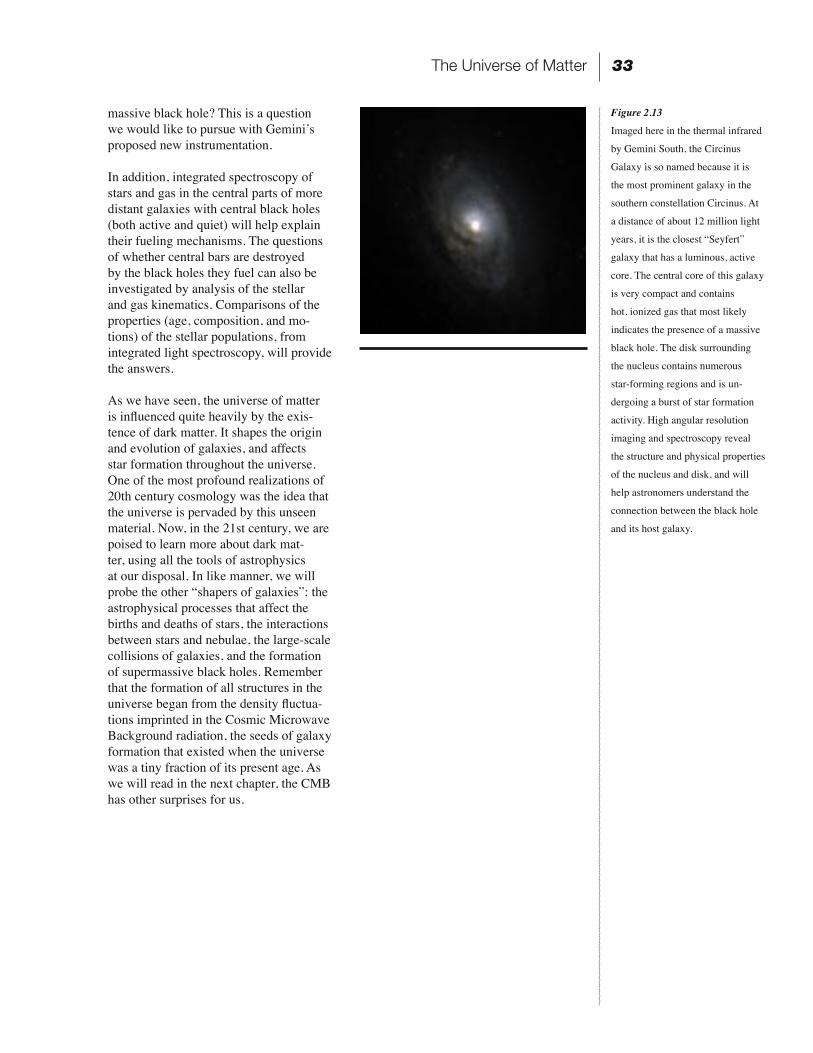
A Vision of Discovery 33
Figure 2.13
Imaged here in the thermal infrared
by Gemini South, the Circinus
Galaxy is so named because it is
the most prominent galaxy in the
southern constellation Circinus. At
a distance of about 12 million light
years, it is the closest “Seyfert”
galaxy that has a luminous, active
core. The central core of this galaxy
is very compact and contains
hot, ionized gas that most likely
indicates the presence of a massive
black hole. The disk surrounding
the nucleus contains numerous
star-forming regions and is un-
dergoing a burst of star formation
activity. High angular resolution
imaging and spectroscopy reveal
the structure and physical properties
of the nucleus and disk, and will
help astronomers understand the
connection between the black hole
and its host galaxy.
massive black hole? This is a question we would like to pursue with Geminiʼs proposed new instrumentation. In addition, integrated spectroscopy of stars and gas in the central parts of more distant galaxies with central black holes (both active and quiet) will help explain their fueling mechanisms. The questions of whether central bars are destroyed by the black holes they fuel can also be investigated by analysis of the stellar and gas kinematics. Comparisons of the properties (age, composition, and mo-tions) of the stellar populations, from integrated light spectroscopy, will provide the answers.
As we have seen, the universe of matter is influenced quite heavily by the exis-tence of dark matter. It shapes the origin and evolution of galaxies, and affects star formation throughout the universe. One of the most profound realizations of 20th century cosmology was the idea that the universe is pervaded by this unseen material. Now, in the 21st century, we are poised to learn more about dark mat-ter, using all the tools of astrophysics at our disposal. In like manner, we will probe the other “shapers of galaxies”: the astrophysical processes that affect the births and deaths of stars, the interactions between stars and nebulae, the large-scale collisions of galaxies, and the formation of supermassive black holes. Remember that the formation of all structures in the universe began from the density fluctua-tions imprinted in the Cosmic Microwave Background radiation, the seeds of galaxy formation that existed when the universe was a tiny fraction of its present age. As we will read in the next chapter, the CMB has other surprises for us.
The Universe of Matter

A Vision of Discovery 35
ENERGY
Fundamental Questions
• What is dark energy?• How did the cosmic dark age end?

A Vision of Discovery 37
The Universe of Energy3
In “The Universe of Matter” we explored the wholly mysterious stuff called “dark matter” and its effect on the luminous baryonic matter we can detect. In this chapter we will explore the even more mysterious unidentified “dark energy” in the universe. In the earliest epochs after the Big Bang, baryonic matter consisted of a hot plasma of free protons and elec-trons. Since free electrons scatter photons very efficiently, light could not propa-gate, and in some ways, the universe was like the interior of a star—glowing hot, but completely opaque to radiation. For 300,000 years, the universe expanded and cooled. Eventually, the temperature cooled enough to allow free protons and electrons to combine and form the first atoms of hydrogen. As the scattering electrons were confined within these first atoms, light could finally disseminate through the ex-panding universe*. The highly redshifted thermal radiation from the “last scattering surface” of the universe (when the protons and electrons combined) is what we detect today as the Cosmic Microwave Back-ground (CMB) radiation—the leftover heat from the Big Bang.
As it turns out, the CMB plays a role in the indirect detection of something called dark energy. Observations of temperature
fluctuations in the cosmic microwave background radiation imply that most of the matter and energy in the universe is not the luminous baryonic material we are familiar with, or even dark matter, and has yet to be discovered. In addition, studies of Type Ia supernovae half way across the observable universe show that the univer-sal expansion is accelerating, suggesting that something (dark energy) is adding pressure to the universe that counteracts gravity. Type Ia supernovae act as “stan-dard candles” we can use to determine cosmic distances. Recent measurements show that some distant supernovae appear farther away than the standard model of the expanding universe without dark en-ergy predicts. This means that instead of slowing down, the rate of expansion of the universe has been increasing for at least the last five billion years. Taken together, the supernova distances and CMB obser-vations can be explained only if there is a smoothly distributed form of energy that dominates the energy density of todayʼs universe. This dominant component is called dark energy because—like the unseen mass of the universe called “dark matter”—its composition has yet to be determined. Its physics and origins are completely mysterious.
Introduction
In the standard model of physics that describes the actions of baryonic particles and the forces that act on them, gravity is the dominant force on the largest scales in clusters and superclusters of galax-ies. Gravity is purely attractive. It pulls matter together. Therefore, in this model, the expansion of the universe should be slowing down because the self-gravity of the matter contained within it acts to pull things together—a sort of cosmic braking force. As it turns out, gravity doesnʼt get the final word when it comes to the expan-sion of the universe.
The distant supernova observations make sense if dark energy is responsible for about 70% of the total energy in the universe as measured using the CMB. Dark energy exerts an increasing pres-sure on the largest-scale structures that is slowly overwhelming the force of gravity and causing the universal expansion to accelerate.
Understanding the nature of dark energy is now the paramount goal of both cosmol-ogy (the study of the origin and evolu-tion of the universe) and particle physics (which deals with subatomic quantum par-
What is Dark Energy?
*The same physics explains why
the surface of the Sun appears as
a sharply defined surface, even
though the hot gas extends much
farther than the visible photosphere.
The photosphere marks the bound-
ary at which the gas in the Sun is
no longer ionized, and free electron
scattering no longer prevents
photons from propagating freely for
us to see.
The Universe of Energy
Scientific Horizons at the Gemini Observatory38
ticles like quarks and neutrons). The study of dark energy is the ultimate collabora-tion of the physics of the very small (the character of physical laws at the Planck scale) and the very large (the geometry and dynamics of the universe at scales out to the light-crossing horizon).
Accurate measurements of the proper-ties of dark energy are important if we are to understand how it is changing the expansion rate of the universe. A number of methods have been investigated, most notably the use of Type Ia supernovae as “standard candles” of fixed luminosity. However, all methods are subject to subtle systematic errors, so the only truly robust
way forward is to measure the effect in a number of different ways, and then find areas of agreement between all the methods.
One promising new probe of dark energy offers a chance for the Gemini Observa-tory to make a major contribution—in this area. Observations of millions of galaxies would measure the spatial pattern at recent times that was imprinted long ago at the time the universe first became transparent. The typical spacing between galaxies can be used as a “standard measuring rod,” which is conceptually akin to using type Ia supernovae as “standard candles” to measure distances.
Vacuum-zero point energy: a dark-energy candidate?
The coming together of cosmology and particle physics represents the only means by which key ideas of particle physics can be �of�Nevertheless, very specific predictions of quantized gravity models can be tested using astronomical observations in straight-forward ways. For example, one candidate for dark energy is called quantum mechanical zero-point vacuum energy. This is the minimum energy of empty space itself allowed by quantum mechanics. As space expands, more and more of this vacuum energy is therefore present in the universe.
Deriving a means of somehow canceling out this zero-point energy is a major goal of quantized gravity theories, since raw esti-mates�as 120 orders of magnitude larger than what is seen!) If dark energy has any relationship to the zero-point vacuum energy—a tempting link to make because both seem to be ways of pulling “something from nothing”—then astronomical observations point to such a cancellation as being incredibly precise, yet somehow it is imperfect at the level of one part in 10120.
Vacuum zero-point energy is only one of many plausible candidates for dark energy, whose characteristics can be distinguished by astronomical observations. One convenient benchmark for characterizing the behavior of these candidates is given by assum-ing that the pressure driving the expansion, P, is related to the energy density, ρ, by a constant of proportionality, w, as follows:
P = wρ
This simple relationship has come to be known as the “cosmic equation of state,” and w is now termed the “equation of state parameter.” (An equation of state attempts to describe the relationship between temperature, pressure, and volume for a given substance or mixture of substances. There are other equations that describe how the universe changes with time that may better des�is vacuum energy, w = —1, and is a constant at all redshifts. If dark energy is the product of something else (such as “quintes-sence,” a new theory that could explain dark energy), the equation of state parameter varies with redshift, z, and must be treated as a more general function w(z). The value of the equation of state parameter as a function of redshift is directly measurable by astronomical observations because the geometry of the universe depends on its dark energy content, so that the relationship be-

A Vision of Discovery 39
tween distance and redshift depends upon the properties of dark energy. The nature of dark energy can therefore be constrained u�to the known properties of that object when it is nearby.
Understanding Fluctuations in the CMB: The Standard Cosmic Ruler
The seeming complexity of maps showing structure in the cosmos disguises a beautiful underlying simplicity. Jean Bap-tiste Joseph Fourier (1768-1830) showed that all well-defined mathematical functions can be broken down into a sum of simple cosine curves. A mathematical operation known as a Fourier transformation can be used to calculate the ampli-tudes and phases of the cosine curves needed to describe any signal as shown in Figure 3.1a.
This is interesting, but it is not yet obvious that we have made life any simpler in the process, since it seems that all we have done is turn a complicated single curve into a complicated sum of simple curves. However, we can indeed make life much simpler by taking advantage of some ad-ditional knowledge of the way the universe works. One of our basic assumptions about the cosmos is that it is homoge-neous and isotropic on large scales (in other words, on aver-age we see similar-looking structures in every direction). This means that one can assume that the distribution of phases in any Fourier transform of a large-scale structure is random, so that all of the basic statistical information is encoded in the relative heights of the waves, and not in their positions relative to each other.
Clearly, each curve on the right in Figure 3.1b is now differ-ent, but it seems its basic statistical character (the distribution of the sizes and shapes of the wiggles about the mean value) is preserved. This means that all that is needed for describ-ing what appear to be very complicated astronomical maps of the sky is a simple rule for assigning the relative heights of a bunch of waves. Such rules can be codified in the form of a power spectrum, P(k), which discribes the power of a signal (the square of the amplitude of the fluctuation), P, per unit volume as a function of physical size, D. The physical size is measured in terms of wave number, k, where k = 2π/D.
Figure 3.1b
This is what happens when we preserve the distribution of
heights in the waves shown above but randomly change their
phases (their left-right positions on the horizontal axis).
Figure 3.1a
The complex signal on the left of the figure decomposes to the sum
of the waves shown on the right.
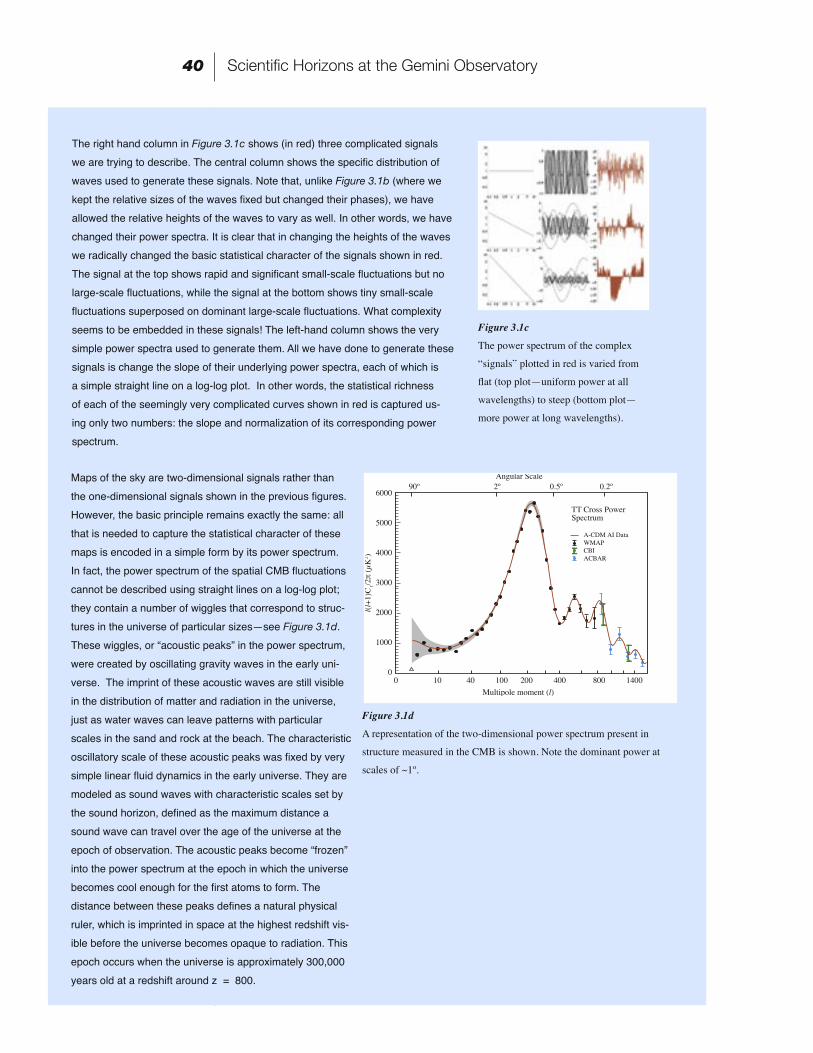
Scientific Horizons at the Gemini Observatory40
Maps of the sky are two-dimensional signals rather than the one-dimensional signals shown in the previous figures. However, the basic principle remains exactly the same: all that is needed to capture the statistical character of these maps is encoded in a simple form by its power spectrum. In fact, the power spectrum of the spatial CMB fluctuations cannot be described using straight lines on a log-log plot; they contain a number of wiggles that correspond to struc-tures in the universe of particular sizes—see Figure 3.1d. These wiggles, or “acoustic peaks” in the power spectrum, were created by oscillating gravity waves in the early uni-verse. The imprint of these acoustic waves are still visible in the distribution of matter and radiation in the universe, just as water waves can leave patterns with particular scales in the sand and rock at the beach. The characteristic oscillatory scale of these acoustic peaks was fixed by very simple linear fluid dynamics in the early universe. They are modeled as sound waves with characteristic scales set by the sound horizon, defined as the maximum distance a sound wave can travel over the age of the universe at the epoch of observation. The acoustic peaks become “frozen” into the power spectrum at the epoch in which the universe becomes cool enough for the first atoms to form. The distance between these peaks defines a natural physical ruler, which is imprinted in space at the highest redshift vis-ible before the universe becomes opaque to radiation. This epoch occurs when the universe is approximately 300,000 years old at a redshift around z = 800.
Figure 3.1c
The power spectrum of the complex
“signals” plotted in red is varied from
flat (top plot—uniform power at all
wavelengths) to steep (bottom plot—
more power at long wavelengths).
The right hand column in Figure 3.1c shows (in red) three complicated signals we are trying to describe. The central column shows the specific distribution of waves used to generate these signals. Note that, unlike Figure 3.1b (where we kept the relative sizes of the waves fixed but changed their phases), we have allowed the relative heights of the waves to vary as well. In other words, we have changed their power spectra. It is clear that in changing the heights of the waves we radically changed the basic statistical character of the signals shown in red. The signal at the top shows rapid and significant small-scale fluctuations but no large-scale fluctuations, while the signal at the bottom shows tiny small-scale fluctuations superposed on dominant large-scale fluctuations. What complexity seems to be embedded in these signals! The left-hand column shows the very simple power spectra used to generate them. All we have done to generate these signals is change the slope of their underlying power spectra, each of which is a simple straight line on a log-log plot. In other words, the statistical richness of each of the seemingly very complicated curves shown in red is captured us-ing only two numbers: the slope and normalization of its corresponding power spectrum.
Figure 3.1d
A representation of the two-dimensional power spectrum present in
structure measured in the CMB is shown. Note the dominant power at
scales of ~1º.
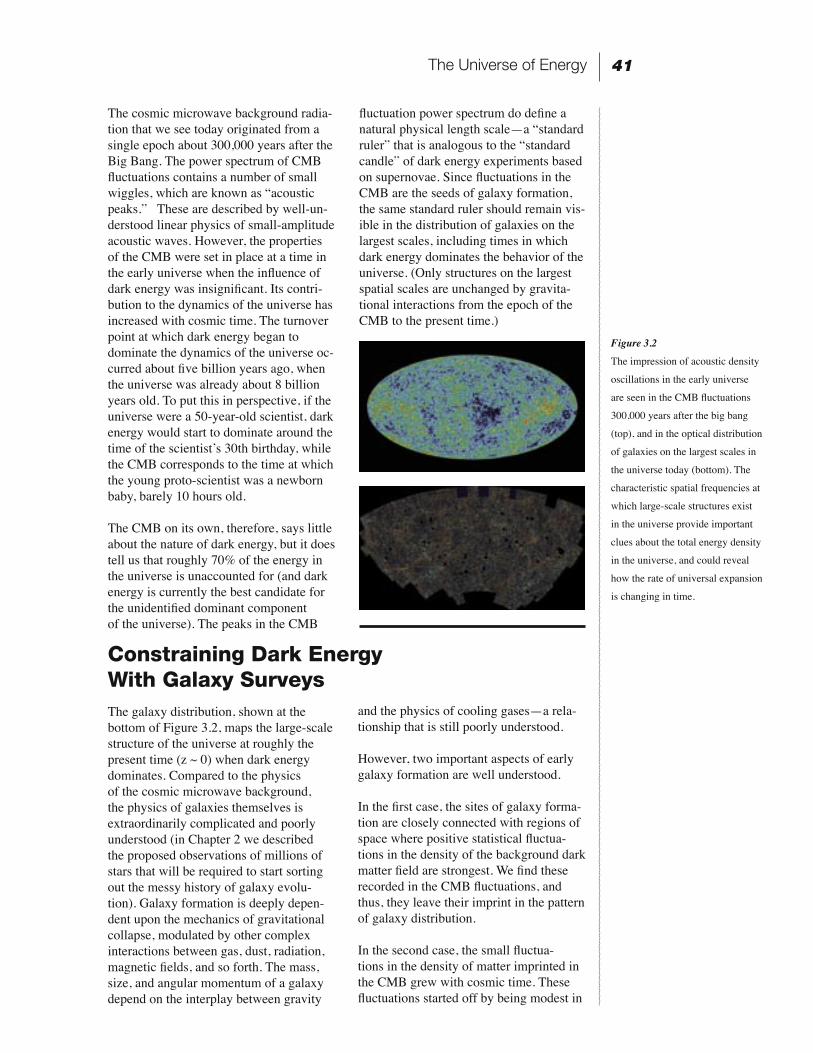
A Vision of Discovery 41
Constraining Dark Energy With Galaxy SurveysThe galaxy distribution, shown at the bottom of Figure 3.2, maps the large-scale structure of the universe at roughly the present time (z ~ 0) when dark energy dominates. Compared to the physics of the cosmic microwave background, the physics of galaxies themselves is extraordinarily complicated and poorly understood (in Chapter 2 we described the proposed observations of millions of stars that will be required to start sorting out the messy history of galaxy evolu-tion). Galaxy formation is deeply depen-dent upon the mechanics of gravitational collapse, modulated by other complex interactions between gas, dust, radiation, magnetic fields, and so forth. The mass, size, and angular momentum of a galaxy depend on the interplay between gravity
and the physics of cooling gases—a rela-tionship that is still poorly understood.
However, two important aspects of early galaxy formation are well understood.
In the first case, the sites of galaxy forma-tion are closely connected with regions of space where positive statistical fluctua-tions in the density of the background dark matter field are strongest. We find these recorded in the CMB fluctuations, and thus, they leave their imprint in the pattern of galaxy distribution.
In the second case, the small fluctua-tions in the density of matter imprinted in the CMB grew with cosmic time. These fluctuations started off by being modest in
Figure 3.2
The impression of acoustic density
oscillations in the early universe
are seen in the CMB fluctuations
300,000 years after the big bang
(top), and in the optical distribution
of galaxies on the largest scales in
the universe today (bottom). The
characteristic spatial frequencies at
which large-scale structures exist
in the universe provide important
clues about the total energy density
in the universe, and could reveal
how the rate of universal expansion
is changing in time.
The cosmic microwave background radia-tion that we see today originated from a single epoch about 300,000 years after the Big Bang. The power spectrum of CMB fluctuations contains a number of small wiggles, which are known as “acoustic peaks.” These are described by well-un-derstood linear physics of small-amplitude acoustic waves. However, the properties of the CMB were set in place at a time in the early universe when the influence of dark energy was insignificant. Its contri-bution to the dynamics of the universe has increased with cosmic time. The turnover point at which dark energy began to dominate the dynamics of the universe oc-curred about five billion years ago, when the universe was already about 8 billion years old. To put this in perspective, if the universe were a 50-year-old scientist, dark energy would start to dominate around the time of the scientistʼs 30th birthday, while the CMB corresponds to the time at which the young proto-scientist was a newborn baby, barely 10 hours old. The CMB on its own, therefore, says little about the nature of dark energy, but it does tell us that roughly 70% of the energy in the universe is unaccounted for (and dark energy is currently the best candidate for the unidentified dominant component of the universe). The peaks in the CMB
fluctuation power spectrum do define a natural physical length scale—a “standard ruler” that is analogous to the “standard candle” of dark energy experiments based on supernovae. Since fluctuations in the CMB are the seeds of galaxy formation, the same standard ruler should remain vis-ible in the distribution of galaxies on the largest scales, including times in which dark energy dominates the behavior of the universe. (Only structures on the largest spatial scales are unchanged by gravita-tional interactions from the epoch of the CMB to the present time.)
The Universe of Energy
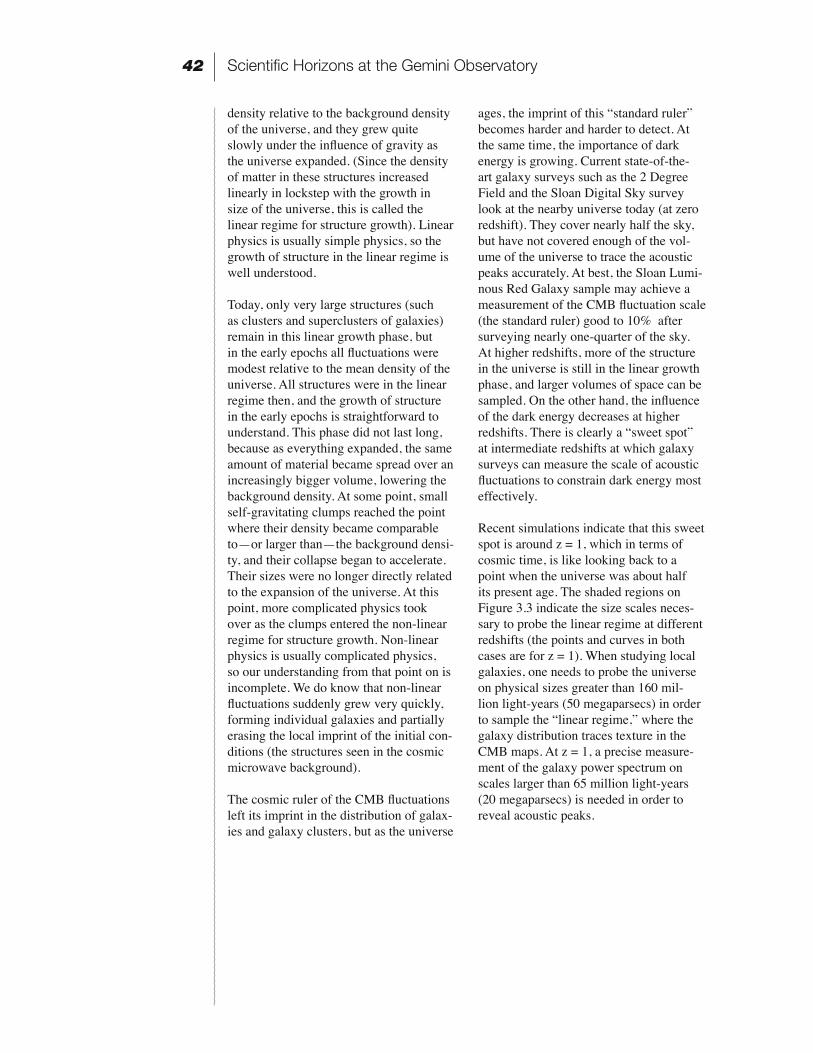
Scientific Horizons at the Gemini Observatory42
density relative to the background density of the universe, and they grew quite slowly under the influence of gravity as the universe expanded. (Since the density of matter in these structures increased linearly in lockstep with the growth in size of the universe, this is called the linear regime for structure growth). Linear physics is usually simple physics, so the growth of structure in the linear regime is well understood.
Today, only very large structures (such as clusters and superclusters of galaxies) remain in this linear growth phase, but in the early epochs all fluctuations were modest relative to the mean density of the universe. All structures were in the linear regime then, and the growth of structure in the early epochs is straightforward to understand. This phase did not last long, because as everything expanded, the same amount of material became spread over an increasingly bigger volume, lowering the background density. At some point, small self-gravitating clumps reached the point where their density became comparable to—or larger than—the background densi-ty, and their collapse began to accelerate. Their sizes were no longer directly related to the expansion of the universe. At this point, more complicated physics took over as the clumps entered the non-linear regime for structure growth. Non-linear physics is usually complicated physics, so our understanding from that point on is incomplete. We do know that non-linear fluctuations suddenly grew very quickly, forming individual galaxies and partially erasing the local imprint of the initial con-ditions (the structures seen in the cosmic microwave background).
The cosmic ruler of the CMB fluctuations left its imprint in the distribution of galax-ies and galaxy clusters, but as the universe
ages, the imprint of this “standard ruler” becomes harder and harder to detect. At the same time, the importance of dark energy is growing. Current state-of-the-art galaxy surveys such as the 2 Degree Field and the Sloan Digital Sky survey look at the nearby universe today (at zero redshift). They cover nearly half the sky, but have not covered enough of the vol-ume of the universe to trace the acoustic peaks accurately. At best, the Sloan Lumi-nous Red Galaxy sample may achieve a measurement of the CMB fluctuation scale (the standard ruler) good to 10% after surveying nearly one-quarter of the sky. At higher redshifts, more of the structure in the universe is still in the linear growth phase, and larger volumes of space can be sampled. On the other hand, the influence of the dark energy decreases at higher redshifts. There is clearly a “sweet spot” at intermediate redshifts at which galaxy surveys can measure the scale of acoustic fluctuations to constrain dark energy most effectively.
Recent simulations indicate that this sweet spot is around z = 1, which in terms of cosmic time, is like looking back to a point when the universe was about half its present age. The shaded regions on Figure 3.3 indicate the size scales neces-sary to probe the linear regime at different redshifts (the points and curves in both cases are for z = 1). When studying local galaxies, one needs to probe the universe on physical sizes greater than 160 mil-lion light-years (50 megaparsecs) in order to sample the “linear regime,” where the galaxy distribution traces texture in the CMB maps. At z = 1, a precise measure-ment of the galaxy power spectrum on scales larger than 65 million light-years (20 megaparsecs) is needed in order to reveal acoustic peaks.
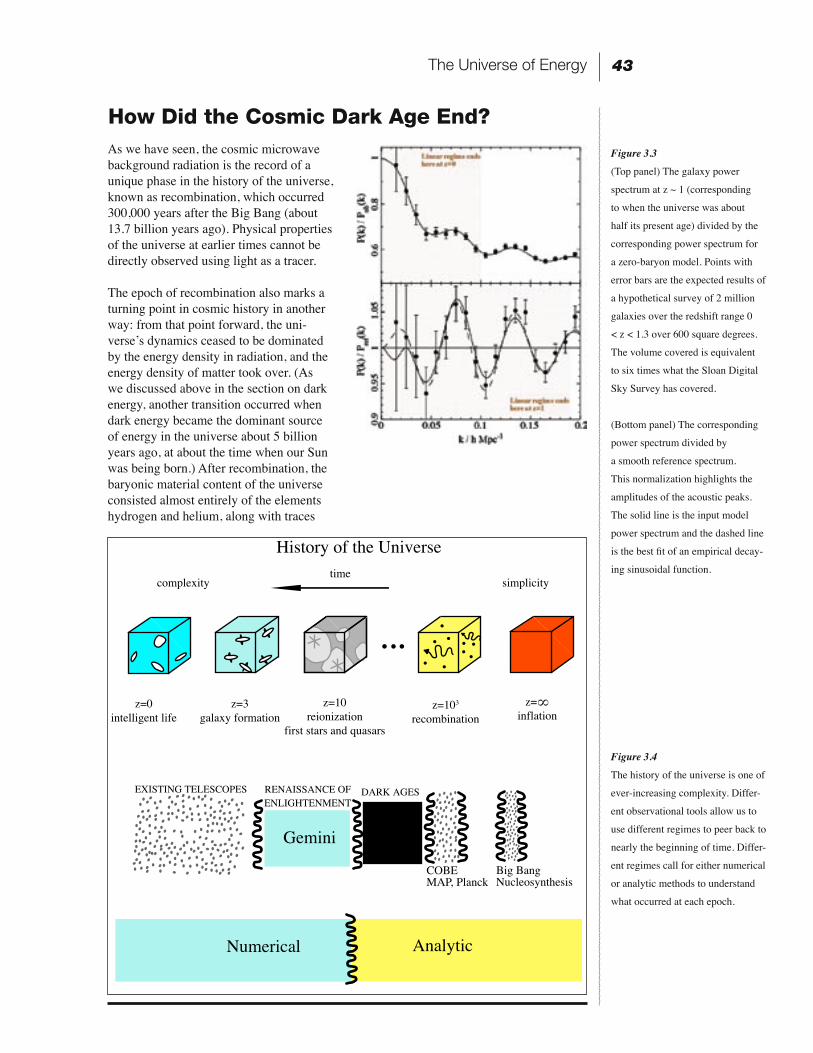
A Vision of Discovery 43
How Did the Cosmic Dark Age End?
Figure 3.3
(Top panel) The galaxy power
spectrum at z ~ 1 (corresponding
to when the universe was about
half its present age) divided by the
corresponding power spectrum for
a zero-baryon model. Points with
error bars are the expected results of
a hypothetical survey of 2 million
galaxies over the redshift range 0
< z < 1.3 over 600 square degrees.
The volume covered is equivalent
to six times what the Sloan Digital
Sky Survey has covered.
(Bottom panel) The corresponding
power spectrum divided by
a smooth reference spectrum.
This normalization highlights the
amplitudes of the acoustic peaks.
The solid line is the input model
power spectrum and the dashed line
is the best fit of an empirical decay-
ing sinusoidal function.
As we have seen, the cosmic microwave background radiation is the record of a unique phase in the history of the universe, known as recombination, which occurred 300,000 years after the Big Bang (about 13.7 billion years ago). Physical properties of the universe at earlier times cannot be directly observed using light as a tracer.
The epoch of recombination also marks a turning point in cosmic history in another way: from that point forward, the uni-verseʼs dynamics ceased to be dominated by the energy density in radiation, and the energy density of matter took over. (As we discussed above in the section on dark energy, another transition occurred when dark energy became the dominant source of energy in the universe about 5 billion years ago, at about the time when our Sun was being born.) After recombination, the baryonic material content of the universe consisted almost entirely of the elements hydrogen and helium, along with traces
Figure 3.4
The history of the universe is one of
ever-increasing complexity. Differ-
ent observational tools allow us to
use different regimes to peer back to
nearly the beginning of time. Differ-
ent regimes call for either numerical
or analytic methods to understand
what occurred at each epoch.
The Universe of Energy
Scientific Horizons at the Gemini Observatory44
of lithium, all in their neutral states. The universe lacked any real complexity be-yond the existence of these elements. More specifically, it had no galaxies or stars, was devoid of significant chemistry, and life did not exist. This period has come to be known as the “cosmic dark age.” It lasted between 150 million and 1 billion years before being abruptly ended by the “epoch of reionization,” which was triggered by “first light”—the ultraviolet radiation from the first luminous self-gravitating objects (the “Population III” stars referred to in Chapter 2). In some ways, this epoch represents the true starting point for the growth of complexity in the cosmos.
The appearance of the first luminous objects triggered the end (or at least the beginning of the end) of the cosmic dark age, and the ultimate rise of complexity in the cosmos. The formation of luminous stars and galaxies in the universe rapidly followed the appearance of the first mas-sive stars. The details of this process are presently very poorly understood. Over the next decade, the Gemini telescopes will prove to be uniquely powerful tools for understanding what truly happened.
Astronomers think the first self-gravitating objects shining in the universe acted as the trigger for complexity because neutral gas, which completely filled the universe prior to reionization, cools much too slowly to form massive galaxies. Ionized gas, on the other hand, can cool quickly and allow galaxies and stars to form. Ultraviolet photons from the first luminous objects ionized the gas and allowed the first galax-ies to form. Ionization set in motion the chain of events leading to life. Without the gravitational potential of galaxies to hold material together, the chemical elements that formed within stars would simply be blown away into space. The cycle of star-birth-death-rebirth that forms the chemical elements, through continuous enrichment of the interstellar medium, could not occur. Obviously, without the chemical elements needed to form complex organic mol-ecules, life as we know it could not exist.
Beyond the basic scenario just given, almost all details of the origin of complex-ity remain a mystery. Our ignorance of
how the dark ages ended stems from our ignorance of the nature of the sources of first light. For example, consider the possi-bility that the sources of first light were the first stars (as described below, this is not the only possibility). In order to form stars from a tenuous gas, the gas must first cool and condense into clouds.
The usual route for a moderately hot gas containing many different elements to lose energy and cool is via emission lines in the spectra of the heavier elements; in this “radiative cooling” process the thermal en-ergy of the gas is carried away by photons. However, for a neutral gas of pure hydro-gen and helium, the required electronic transitions, and their associated spectral lines, do not exist. Molecular hydrogen could have slowly cooled the gas, but it would also have been quickly destroyed (broken apart into neutral atomic hydro-gen) by the ultraviolet radiation if a star did form. Almost as soon as the first stars appeared, it seems they would shut off this route to making more stars, and the process would stall. Nevertheless, a universe full of stars clearly exists! Somehow this so-called “Population III” class of stars must have succeeded in overcoming these limi-tations in the cooling of neutral hydrogen gas. The nature of these stars has intrigued astronomers for five decades, starting with the original suggestions made by Martin Schwarzschild and Lyman Spitzer in 1953, and proceeding to the present day where the subject is the topic of extraordinarily complex numerical computer simulations.
Results from recent simulations of the collapse and fragmentation of primordial gas clouds from molecular hydrogen sug-gest that the first stars were predominantly very massive, with typical masses much greater than 100 times that of the Sun. In the standard cold dark matter models, these stars would form in halos of dark mat-ter with typical sizes around 10,000 solar masses. Despite this progress, the nature of this population remains almost completely mysterious. Despite concerted searches, no zero-metallicity relic star has ever been discovered, and we do not even know if the reionization of the universe was precipi-tated by them.
A Vision of Discovery 45
Another possible source of the first-light radiation that reionized the universe are “mini-quasars,” (material streaming onto primordial black holes that emits high-en-ergy radiation). Since we now believe that a massive black hole lies at the heart of almost every large galaxy, it is natural to speculate that the origins of the first galax-ies might be connected to black holes.
At present we do not know if the true first light sources in the universe were massive stars or radiation from accreting material near black holes. Intriguingly, the combi-nation of the two may be needed to explain the observations. In the dense interiors of gas clouds, the formation rate of molecular hydrogen could be accelerated through the production of free electrons by X-rays from mini-quasars. This effect could coun-teract the processes through which molecu-lar hydrogen is destroyed by ultraviolet radiation from the first stars. Research has shown that if less than 10% of the early ultraviolet background was produced by massive black holes, then the net effect of black holes on molecular hydrogen is creative, rather than destructive, thus cata-lyzing the process that allowed the earliest generations of stars to form by creating molecular hydrogen to cool the neutral gas. On the other hand, we have little evidence to show that mini-quasars could have even existed at all.
It is clear that no one yet knows how first light occurred, though we are at least beginning to zero in on when it occurred. Observations show that reionization, and the end of the cosmic dark age, must have occurred sometime in the redshift interval between z = 20 and z = 6 (between 300 and 800 million years after the Big Bang). The evidence exists in ground-based ob-servations of quasars, which sets the lower limit, and satellite observations of the cos-mic microwave background fluctuations, which sets the upper limit. These broad constraints on the epoch of reionization are exciting. With appropriate new instrumen-tation, the Gemini Observatory is uniquely poised among the worldʼs 8-meter-class telescopes to look back to these epochs of the early universe and make major contributions to the discovery of when first light occurred, and possibly observe the
formation of the first galaxies. Gemini will be able to make these observations years ahead of the James Webb Space Telescope (JWST), which also has the epoch of reion-ization as a primary science goal.
We conclude this chapter with the thought that, if astronomers were a little less pro-saic, and a little more poetic, they might justifiably have chosen to refer to the events we have just described as cosmic renaissance, rather than cosmic reioniza-tion, since in a real sense our universe has indeed been born out of light twice. The first birth occurred at the moment of the Big Bang, when the universe was born in a burst of energy, and light began to domi-nate its motion for the next 300,000 years. The second birth happened when the first luminous condensed objects flooded the universe with ionizing UV light, triggering the formation of galaxies, stars, and the elements of life we see around us in the universe today.
If somehow sentient life could have existed in the early universe, a being living in those times might have concluded that, following the early promise of the Big Bang, the universe had turned into a rather dull place. The whole of creation would be akin to living within a very uniformly glowing and essentially featureless opaque cloud. At the epoch of recombination things would certainly become a little more interesting, as the cloud suddenly evapo-rated and our sentient observer would then see the cosmos as a glowing spherical wall (the last scattering surface) surrounding him in all directions, rushing away at high speed with the expansion of the universe. But aside from this change, our imaginary observer would probably remain disap-pointed, since the universe encompassed within the glowing walls of the last scat-tering surface would only be comprised of the blackness of the cosmic dark age. It is only with the appearance of the “first light” objects (be they supermassive stars or mini-quasars), with their ultraviolet radiation digging holes of ionization in the neutral sea of hydrogen, that the uniformity was broken so that galaxies could form, the chemical elements could come into existence, and the subsequent history of a complex and rich universe begin in earnest.
The Universe of Energy

A Vision of Discovery 47
LIFE
Fundamental Questions
• How common are extrasolar planets, including Earth-like planets?
• How do star and planetary systems form?
• How do stars process elements into the chemical building blocks of life?
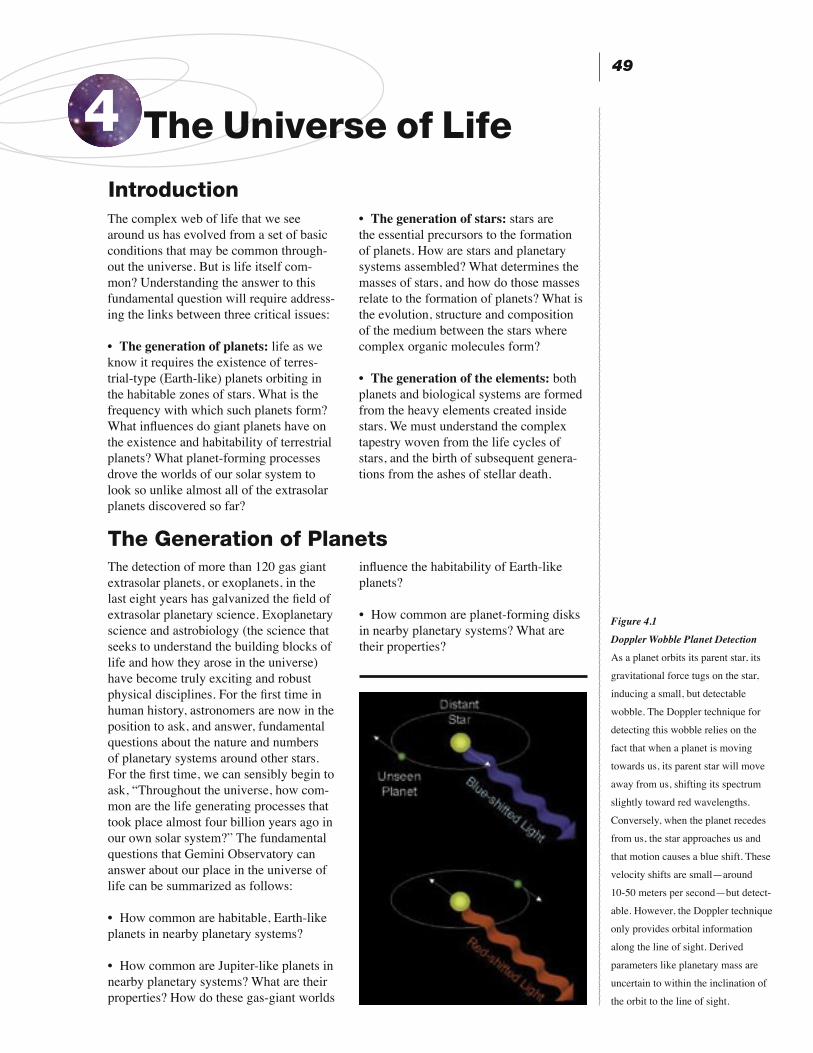
A Vision of Discovery 49
The Universe of Life4
The complex web of life that we see around us has evolved from a set of basic conditions that may be common through-out the universe. But is life itself com-mon? Understanding the answer to this fundamental question will require address-ing the links between three critical issues:
• The generation of planets: life as we know it requires the existence of terres-trial-type (Earth-like) planets orbiting in the habitable zones of stars. What is the frequency with which such planets form? What influences do giant planets have on the existence and habitability of terrestrial planets? What planet-forming processes drove the worlds of our solar system to look so unlike almost all of the extrasolar planets discovered so far?
• The generation of stars: stars are the essential precursors to the formation of planets. How are stars and planetary systems assembled? What determines the masses of stars, and how do those masses relate to the formation of planets? What is the evolution, structure and composition of the medium between the stars where complex organic molecules form?
• The generation of the elements: both planets and biological systems are formed from the heavy elements created inside stars. We must understand the complex tapestry woven from the life cycles of stars, and the birth of subsequent genera-tions from the ashes of stellar death.
Introduction
The Generation of PlanetsThe detection of more than 120 gas giant extrasolar planets, or exoplanets, in the last eight years has galvanized the field of extrasolar planetary science. Exoplanetary science and astrobiology (the science that seeks to understand the building blocks of life and how they arose in the universe) have become truly exciting and robust physical disciplines. For the first time in human history, astronomers are now in the position to ask, and answer, fundamental questions about the nature and numbers of planetary systems around other stars. For the first time, we can sensibly begin to ask, “Throughout the universe, how com-mon are the life generating processes that took place almost four billion years ago in our own solar system?” The fundamental questions that Gemini Observatory can answer about our place in the universe of life can be summarized as follows:
• How common are habitable, Earth-like planets in nearby planetary systems?
• How common are Jupiter-like planets in nearby planetary systems? What are their properties? How do these gas-giant worlds
influence the habitability of Earth-like planets?
• How common are planet-forming disks in nearby planetary systems? What are their properties?
Figure 4.1
Doppler Wobble Planet Detection
As a planet orbits its parent star, its
gravitational force tugs on the star,
inducing a small, but detectable
wobble. The Doppler technique for
detecting this wobble relies on the
fact that when a planet is moving
towards us, its parent star will move
away from us, shifting its spectrum
slightly toward red wavelengths.
Conversely, when the planet recedes
from us, the star approaches us and
that motion causes a blue shift. These
velocity shifts are small—around
10-50 meters per second—but detect-
able. However, the Doppler technique
only provides orbital information
along the line of sight. Derived
parameters like planetary mass are
uncertain to within the inclination of
the orbit to the line of sight.
The Universe of Life

Scientific Horizons at the Gemini Observatory50
Habitable, Terrestrial-Mass PlanetsAll of the hundred-odd planets detected so far around nearby, Sun-like stars have been gas giant planets—massive objects like Jupiter rather than terrestrial (Earth-like), rocky planets. The reason for this is simple: Jupiter-like planets with masses around 800 times that of Earth are simply much easier to detect. The detection of smaller, terrestrial planets, while clearly one of the most critical endeavors in all of the physical and biological sciences, presents major observational and techni-cal challenges. Geminiʼs proposed new instruments will offer an unprecedented opportunity to leapfrog all of these tech-nological challenges in a single bound. Planets can reflect or absorb only a small amount of the light from their parent star. To detect such tiny light signatures, in-struments must be placed in space so they can be free of our atmosphereʼs confusing effects. Even then, there are tremendous technological challenges to be surmount-ed. The small Doppler wobbles (described
in Figure 4.1) produced by small Earth-like planets orbiting Sun-like stars are well below the few-meter-per-second velocity detection threshold. They challenge indi-rect detection methods, including the Dop-pler wobble technique used to measure all of the exoplanets found to date.
However, Geminiʼs proposed new capa-bilities at infrared wavelengths will make the search for Earth-like planets orbiting much lower mass stars possible. In these cool M and L type stars, the velocity signatures of habitable planets are much larger, making them accessible with cur-rent technologies. Because such stars emit most of their flux in the infrared, Gemini, with its enhanced infrared sensitivity, will theoretically be able to discern such plan-ets around hundreds of stars. Moreover, it is poised to start detecting these planets, within the next five years, well ahead of the next generation of 30- to 50-meter telescopes.
Gas Giant PlanetsOne of Gemini Observatoryʼs most chal-lenging and exciting prospects in the years ahead will be to develop the capability to detect light directly from gas giant planets orbiting other stars. On this time scale, current Doppler detection planet searches will have identified many of the gas giant planets larger than about half of Jupiterʼs mass, around all of the Sun-like stars within 180 light-years of the Sun. Unfor-
tunately, such searches will only deter-mine the orbital properties of the detected planets to within an unknown inclination angle to the line of sight.
Current imaging facilities may have also detected a few wide-separation planets orbiting at distances greater than 10 astro-nomical units (one astronomical unit (AU) is the average distance between the Sun and Earth), around nearby young stars. This is twice as far as Jupiter orbits from the Sun. In addition, these planets will be more than five times more massive than Jupiter. So such detections, while interest-ing, will not directly address the issue of just how common systems with gas giant planets like our own really are. To do that will require the capability of detecting a significant fraction (more than 10%) of the Jupiter-mass (or larger) planets orbiting older stars in Jupiter-to-Uranus-like orbits in nearby star systems. Additionally, such systems will permit detailed study of the orbital properties of massive planets orbit-ing inside 5 AU, which will be critical to
Figure 4.2
A simulation showing the detect-
ability of a gas giant planet orbiting
nearby stars. The dot to the right (at
3 oʼclock) is a simulated planet of 8
Jupiter masses orbiting a young star
36 light years away. This simula-
tion shows both the light from the
planet, and the structured back-
ground produced by the process of
atmospheric correction. Simulta-
neous measurement in multiple
band passes provides even further
suppression of this structured
background.

A Vision of Discovery 51
understanding the habitability of the inner regions of neighboring solar systems.Advanced new instruments on Gemini will make direct detections of gas giant planets possible for almost 100 exoplan-etary systems. They will enable critical albedo measurements (how much light the planets reflect) over a range of wave-lengths, permitting a direct comparison of the atmospheres of these exoplanets with the well-studied surfaces of the worlds in our own solar system. Direct planet detec-tion also probes entirely new classes of stars: those too young, too variable, or too hot to be accessible via Doppler detection techniques. Finally, direct detection will enable the measurement of the currently undeterminable inclinations to the line of sight of these systems.
Complementary observations of known Doppler exoplanets will further explore their surfaces and enable astronomers to
probe detailed physical conditions at each planet. A significant fraction (around 1 in 10) of the objects known as “Hot Jupi-ters”* will pass in front of their parent star. Observations obtained during these transits will allow us to detect the absorp-tion of light by atoms and molecules in the photospheres of the transiting planets.
The photosphere of an exoplanet is the layer at its outer surface from which we see light either reflected from its par-ent star, or emitted from the interior. In the case of gas giant planets like Jupiter, Saturn, Uranus and Neptune, the photo-sphere is the layer of gas and/or clouds which gives them their familiar and distinctive appearances. The upper layers of exoplanets may have similar appear-ances, or could be very different. Looking for either similarities or differences will be one of the main aims of Gemini exoplanet research.
Figure 4.3
A simulation of a high-contrast
adaptive optics system capable of
detecting a planet-forming disk is
shown. This simulation depicts a
Neptune-like planet forming and
causing a detectable local void in
the disk structure.
* Hot Jupiters are gas giants orbit-
ing in periods of just a few days,
placing them at distances roughly
the same as Mercuryʼs orbit around
the Sun.
The Universe of Life

Scientific Horizons at the Gemini Observatory52
To date, only one transiting exoplanetary system is known. However, dedicated searches for transiting planets over the next five years should reveal many more in the brightness range suitable for study with Geminiʼs new optical and infrared
instruments. In a similar vein, Geminiʼs studies of light which is polarized during scattering will be an important diagnos-tic of the light reflected back from Hot Jupiters.
Figure 4.4
Star formation in the massive Tra-
pezium Cluster in Orion observed
with the Near Infrared Camera and
Multi-Object Spectrograph (NIC-
MOS) on Hubble Space Telescope.
More than 300 fledgling stars and
brown dwarfs surround the brightest
massive Trapezium stars.
Planetary DisksObservations of the dust emissions from planet-forming disks, both from thick still-forming disks and from thin “remnant” or “debris” disks, left over at the end of planet formation, will be a powerful probe of the frequency with which planets form. Characterization of dynamical structures in the scattered light from currently forming disks can reveal evidence for inner holes, gaps, and warps in the disks, which are indicative of the presence of forming planets.
Older “debris” disks are more than just interesting “leftovers.” Because the pat-terns present in these disks are determined
by internal interactions with the orbits of any gas giants present, observed structures have the power to indicate whether gas gi-ants are present in the “habitable” regions of exoplanetary systems without directly detecting light from the planet itself. Re-gions where planets are actively forming also contain large amounts of gas. Study-ing the spectral lines of the gas should re-veal details about gas giant orbits because their kinematic information is encoded in the detailed shapes of gaseous emission lines. Geminiʼs new infrared facilities will have the potential to find planets indirectly through spectral observations of the dust and gas in their immediate vicinities.
A Vision of Discovery 53
The Generation of StarsOur perception of the universe is domi-nated by what we see. Stars are respon-sible for most of the observable light in the universe. Understanding the formation of galaxies, the origin and evolution of our own Milky Way galaxy, and the solar system requires understanding the phys-ics of star formation and the interchange between forming stellar systems and the surrounding interstellar medium.
In recent years, there has been great prog-ress in explaining the processes that drive the formation of stars and stellar systems, but much still remains to be explained. Gemini Observatory is poised to make unique and fundamental contributions to our understanding of the formation of stars, star clusters and stellar systems. By far, the most well-known aspect of star formation involves the theory and observation of single Sun-like stars. The emphasis of new research in this field is on the formation of stars in clusters like the Orion cluster (Figure 4.4), the forma-tion of massive stars, and the feedback between forming stars, planets and the interstellar medium from which they form. During the next decade, new long-wavelength facilities such as the Atacama Large Millimeter Array (ALMA), James Webb Space Telescope (JWST) and the Spitzer Space Telescope, will revolution-
ize star formation research. All of these facilities will probe deep inside star form-ing regions to examine the very earliest stages of star formation. Geminiʼs role will be to complement these facilities with key shorter wavelength data to address essential questions such as:
• How does the structure and composition of the interstellar medium (ISM) evolve and what role does it play in star forma-tion?
• How are stars and their protoplanetary disks assembled?
• What determines the masses of stars?
These questions are linked in a com-plex way. Star formation happens in the interstellar medium, which has profound effects on its structure and provides the raw material for dusty disks and planetary development from heavy elements. Pro-toplanetary disks drive outflow processes, which release material and energy back into the interstellar medium and provide a “storehouse” of refractory elements (those with high melting points, necessary for the formation of planets) and pre-biotic mate-rials that combine to form amino acids and other building blocks of life.
The Interstellar Medium: Evolution and InterplayThe interstellar medium (ISM) comprises the gas and dust that acts as the “birth-ing grounds” for stars. It sets the initial conditions for star and planet formation. The properties of the ISM—its chemi-cal composition, temperature, density, ionization, and magnetic field strength distributions—are fundamental constraints on the star formation process. These properties frame our efforts to understand the mediumʼs detailed composition in both gas and solid phases.
Understanding the relationship between ISM properties and star formation mecha-nisms (and vice versa) requires that we measure a range of ISM characteristics.
They need to be studied when the ISM is in isolation, as well as when it is in a dynamic environment, such as a star formation region. Gemini will probe the ISM in isolation by observing overall motions, as well as studying a range of atomic and molecular abundances. These include species like carbon monoxide, water, molecular hydrogen, ammonium, methane and a host of other organic and inorganic molecules. Such abundance studies will unlock the processes by which heavy elements are injected into the ISM through mass loss from evolved stars and supernova remnants.
The Universe of Life
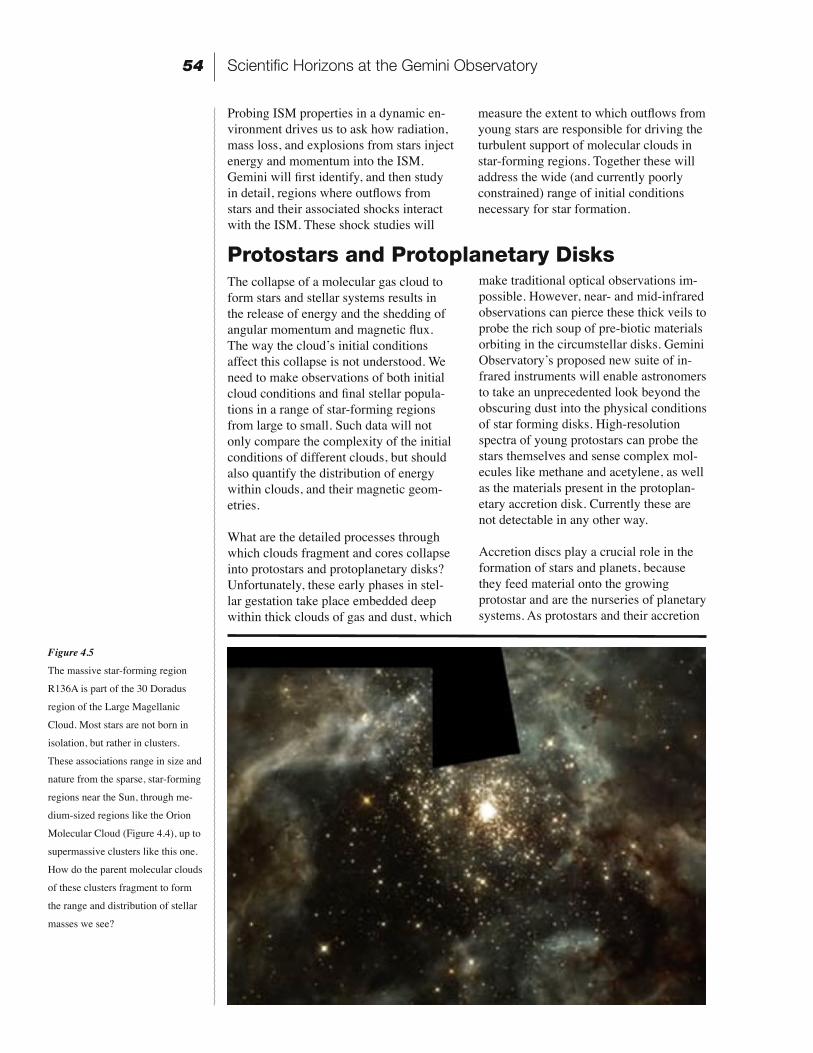
Scientific Horizons at the Gemini Observatory54
Probing ISM properties in a dynamic en-vironment drives us to ask how radiation, mass loss, and explosions from stars inject energy and momentum into the ISM. Gemini will first identify, and then study in detail, regions where outflows from stars and their associated shocks interact with the ISM. These shock studies will
measure the extent to which outflows from young stars are responsible for driving the turbulent support of molecular clouds in star-forming regions. Together these will address the wide (and currently poorly constrained) range of initial conditions necessary for star formation.
Protostars and Protoplanetary DisksThe collapse of a molecular gas cloud to form stars and stellar systems results in the release of energy and the shedding of angular momentum and magnetic flux. The way the cloudʼs initial conditions affect this collapse is not understood. We need to make observations of both initial cloud conditions and final stellar popula-tions in a range of star-forming regions from large to small. Such data will not only compare the complexity of the initial conditions of different clouds, but should also quantify the distribution of energy within clouds, and their magnetic geom-etries.
What are the detailed processes through which clouds fragment and cores collapse into protostars and protoplanetary disks? Unfortunately, these early phases in stel-lar gestation take place embedded deep within thick clouds of gas and dust, which
make traditional optical observations im-possible. However, near- and mid-infrared observations can pierce these thick veils to probe the rich soup of pre-biotic materials orbiting in the circumstellar disks. Gemini Observatoryʼs proposed new suite of in-frared instruments will enable astronomers to take an unprecedented look beyond the obscuring dust into the physical conditions of star forming disks. High-resolution spectra of young protostars can probe the stars themselves and sense complex mol-ecules like methane and acetylene, as well as the materials present in the protoplan-etary accretion disk. Currently these are not detectable in any other way.
Accretion discs play a crucial role in the formation of stars and planets, because they feed material onto the growing protostar and are the nurseries of planetary systems. As protostars and their accretion
Figure 4.5
The massive star-forming region
R136A is part of the 30 Doradus
region of the Large Magellanic
Cloud. Most stars are not born in
isolation, but rather in clusters.
These associations range in size and
nature from the sparse, star-forming
regions near the Sun, through me-
dium-sized regions like the Orion
Molecular Cloud (Figure 4.4), up to
supermassive clusters like this one.
How do the parent molecular clouds
of these clusters fragment to form
the range and distribution of stellar
masses we see?
A Vision of Discovery 55
disks begin to emerge from the young-est phases, they are accessible to study at shorter wavelengths, where multiple members of the same cluster can be exam-ined at the same time. This “multiplexing” advantage, combined with Geminiʼs new instruments, will make stringent statistical studies possible for the first time. These will be done as a function of protostel-lar mass, of the accretion kinematics and protostellar outflows in contemporaneous samples, both for large numbers of objects within a single cluster and across large samples of clusters.
There is a rich chemistry within these
circumstellar disks where melting dust grain mantles and large cometary bodies flood the gaseous medium with mate-rial processed on grains. A wide variety of molecular species can be detected by Geminiʼs proposed new instruments, in-cluding: OH, H2O, CO, H2O, H2, CH3OH, NH3, CH4, C2H2, HCN, OCS, OCN-, NH4
+, 13CO, C18O, silicates, polycyclic aromatic hydrocarbons, nanodiamonds, and aliphatic hydrocarbons. This data will teach us how gases in the disks interact with solid materials, which lead to the for-mation of planetesimals—the small, solid particles that become the building blocks of planets.
Initial Mass Function
The initial mass function (IMF)
gives the number of stars formed as
a function of stellar mass. Observa-
tions of nearby young clusters and
field stars suggest the relationship
is best described as a power law
with differing slopes for very mas-
sive (greater than 10 solar masses)
and lower-mass (less than 10 solar
masses) stars.
Complete knowledge of the form
of the IMF, including potential
variations within star-forming
environments, is key to understand-
ing the starbirth process and the
star formation histories of very
distant galaxies (which must rely
on indirect means to constrain the
IMF). The chemical enrichment
history of a stellar population
can provide clues to the relative
importance of high-mass and low-
mass stars since the relative amount
of heavy elements like iron (Fe)
produced by very massive stars (in
Type II supernovae) is different
compared to low-mass stars (Type I
supernovae).
Recent progress has been made in
characterizing the very low-mass
end of the IMF in nearby regions
like Orion, and for higher mass stars
in a variety of OB star associations
(groups of hot young stars) and
rich clusters throughout the Milky
Way and Large Magellanic clouds.
Crucial studies with current and
planned instruments on the Gemini
telescopes which utilize Geminiʼs
exquisite image quality will provide
the needed observations to deter-
mine the IMF for both high-mass
and low-mass stars in the same
star-forming regions thought to be
the most dominant source of stars in
the universe.
The Masses of StarsWhat determines the masses of stars? Is it the initial cloud conditions, the local environment, or the star formation process itself? To answer this question, we must understand the distribution of masses (called the initial mass function, see ex-planation at right) in a range of “extreme environments” such as those with very high or very low stellar populations, wide ranges of metallicity (stars with a low or high amount of metals in their chemis-try), or in different galactic environments (the inner or outer galactic regions, or in small nearby “dwarf” galaxies). Surveys with Gemini Observatory should make dramatic headway in understanding all of these environments including:
• high-mass, star forming regions in the inner galaxy;
• the center of the Milky Way, where conditions for star formation are unique in the galaxy;
• the outer part of the Milky Way;
• in supermassive clusters, often referred to as “star burst analogs,” in the Magel-lanic Clouds.
The combination of improved image qual-ity and multiplex spectroscopy will enable a quantum leap in our understanding of the distribution of masses in all of these star forming regions that will fundamen-tally impact our understanding of star formation throughout the universe.
Generation of the ElementsIn a universe composed solely of hydrogen and helium, life as we know it could not exist. Not only are stars the fundamen-tal building blocks of the universe—the “luminous atoms” by which galaxies are formed—but also the furnaces in which all of the heavier elements in the universe are created. Stars created the “metals” from which our planet, its atmosphere, and its life forms were made of over billions of years. Understanding the life and death of stars, and the birth of the next stellar generations from ashes of the stars which have gone before, is a fundamental part of our quest to understand the processes
that brought about life in our solar system, and which can lead to life elsewhere in the universe.
Soon after the Big Bang, the universe was composed primarily of the elements hydrogen and helium. Today, however, we see that the distribution of the ele-ments heavier than hydrogen and he-lium throughout the universe is far from uniform. The universeʼs evolution has not been one of a steady growth in metal abun-dance, but a complex process of formation, interaction and destruction. In our own galaxy, we find populations of stars with
The Universe of Life
Scientific Horizons at the Gemini Observatory56
both very rich and very poor metallicity. Understanding the range of high and low metallicity, how it came about, and how metal-rich and metal-poor stars interrelate is important.
Very old stars in the outer regions of our own galaxy with extremely low metallicities offer the opportunity to study the distribution of elements produced by the very first generation of stars in the universe. They also provide an opportunity to determine the nature of the death of the very first generation of stars. Did these first stars form and die as stars do today? Alternatively, did they form as isolated very massive objects, and then die in extreme, rare, massive supernova events? Or were they destroyed in even more massive, very rare, and poorly understood events called hypernovae?
The stars occupying the bulge at the center of our galaxy, on the other hand, may be just as old, but are incredibly enriched in metals. This bulge contains the bulk of our galaxyʼs metal-rich stars, which led astronomers to hypothesize the existence of a burst of star formation early in the galaxyʼs history. The material from which a star has formed, its mass, and its life his-tory determine the relative abundances of all the various metals it contains. We use metals in a manner analogous to a DNA signature—to tell us about a starʼs identity and parentage. Models of this process of evolution will enable Gemini astronomers to test this most important hypothesis about our galaxyʼs early evolution.
When stars about the mass of the Sun reach the final stages of their lives, the products created through internal nuclear reactions are transported to the surface and ejected into the interstellar medium. Stars more massive than the Sun, and certain types of binary stars, undergo more violent deaths in enormous explosions called supernovae. In these cases, the enriched material formed in a starʼs core is made available for the formation of new generations of stars and planets. Prob-ing the details of this enrichment cycle is fundamental to our understanding of the frequency with which habitable conditions can form throughout the universe.
We need more detailed insight into chemi-cal abundances in the surfaces of low-mass stars as they give their enriched material back to space. Such understanding will help us improve theoretical models of convection (the transfer of heat or other atmospheric properties through motion) and mixing within these stars. Populations of stars with common distances in nearby galaxies like the Magellanic Clouds, give us a set of targets with well-known precise relative luminosities and allow a range of critical stellar evolution phases to be addressed. These include observed stages called first, second and third dredge-up, and the “hot bottom burning” phase. These whimsically named processes impact the final abundances of elements that are re-leased into the universe to form new stars and planets. Also critical is an understand-ing of how the final death throes of these stars hurl material back into the interstellar medium. This involves tracing the com-plex interactions that occur when a dying starʼs rotation interacts with its pulsa-tions to form a complex array of bipolar outflows.
The tale of element generation, however, is about more than just the life and death of single stars. Most stars actually spend their lives in gravitationally bound pairs or triples. Stellar multiplicity has its own effect on a starʼs life and death. Type Ia supernovae, for example, are the end product of the evolution of certain sorts of binary stars. But exactly what sort is still unknown. At least four different classes of close binary pairs are possible candidates. The unraveling of this mystery is not just crucial to the generation of the elements. As we have discussed in Chapters 2 and 3, Type Ia supernovae have been, and will continue to be, used for a variety of fundamental cosmological experiments, including recent and proposed experiments to measure the universeʼs dark energy. If more than one class of binary can produce a Type Ia supernovae, it is almost certain that their mean properties will evolve as the universe ages, which potentially biases such dark energy experiments to false results.
Understanding the “family tree” of binary stars, therefore, is crucial. How many and

A Vision of Discovery 57
how long-lived are both the ancestors and descendants of the various types of binaries? Rare “link classes” are particu-larly important as they illuminate still-un-certain stages of binary evolution. Current ground-based, wide-field imaging surveys and space X-ray missions are poised to
detect many more of these link objects. The new instrumentation proposed for the Gemini observatory is well placed to exploit these new detections and explain many of the mysteries surrounding binary stars.
The Universe of Life

A Vision of Discovery 59
Part 2
The next few decades of astronomical research will be interesting and productive ones for the Gemini Observatory com-munity. As we discussed in the preceding chapters, the scientific questions facing current and future generations of astrono-mers are complex. They are difficult, but not impossible to answer. Given an array of advanced instruments designed to tackle many of the key research directions in astronomy and cosmology, we will leave our successors great treasure troves of data from which an ever-deeper understanding of the universe can be built.
Our exploration of the universes of matter, energy, and life now turns to a more instrument-oriented and quantitative ex-amination of the key science questions facing astronomers using the technology Gemini is proposing to implement in the next decade. These final three chapters present instrument information and related science issues from a technical perspec-tive. They are aimed at the user community, but can provide insight to the interested lay reader who wishes to “peek ahead” at the specifications and capabilities of future astronomical instrumentation. Each chapter begins with a summary of the new instrumentation needed to answer the fundamental questions posed in chapters 2-4.
Since the time of the original Aspen Workshop this collection of potential instruments at Gemini has been prioritized, and the first steps taken to develop several of these new instruments. In particular, design studies are underway for an extreme adaptive optics coronagraph and a high-resolution near-infrared spectrometer with limited multi-object spectrometer capability, which is intended to be used in combination with the multi-conjugate adaptive optics system at Gemini South. In addition, feasibility studies are starting for a wide-field fiber-fed optical multi-object spectrometer and a ground-layer adaptive optics system. This collection of instruments is expected to answer the largest cross section of key questions identified during the Aspen conference. It is important to note that development of these instruments is only being started at the feasibility study or conceptual level. What actually gets built will be determined by detailed future cost, risk factors, programmatic issues, and scientific assessments of these potential new instruments at Gemini Observatory.
Exploration of the Universe with Gemini
A Vision of Discovery 61
Key Question• How do galaxies form?
New Capabilities Required:
Wide-Field, Fiber-fed Optical Multi-Object Spectrograph (MOS)• Wavelength range: 0.39 - 1.0 µm• Spatial resolution: ~ 1” fiber sampling• Spectral resolution: 1,000 - 30,000• 1-shot λ Coverage: 0.4 µm (low-resolution)• Field of view: 1.5º• Multiplex: 4,000 - 5,000 objects• Other: Fiber-fed Spectrometer using prime focus telescope feed
Ground Layer Adaptive Optics (GLAO) Near-Infrared Imager*• Wavelength range: 0.6 - 2.5 µm• Spatial resolution: 0.15”• Spectral resolution: > 3,000• 1-shot λ Coverage: R, I, J, H, K (broadband filters)• Field of view: 10 arcminutes• Multiplex: Panoramic Imager• Other: Uses tunable filter to achieve R > 3,000
The Universe of Matter Investigations5
The questions to be answered about matter, and in particular dark matter, require new instrumentation capabilities at Gemini Observatory that would allow as-tronomers to reach out to the most distant galaxies at the earliest observable epochs after the Big Bang. To answer questions about galaxy formation, the cutting-edge science we want to achieve using Gemini Observatory—deciphering the history of normal galaxies and the nature of the dark matter that dominates their gravity—re-quires that we derive positions, motions,
elemental abundances and ages for tracer objects in a wide range of local environ-ments and distances from the Sun. These required capabilities will allow us to reach a fair sample of all the different types of galaxy structures in a range of environ-ments from the general field and groups to loose clusters such as Virgo, and out to relaxed rich clusters like Coma. The same capabilities will enhance our search for black holes, the now seemingly ubiquitous inhabitants of the cores of many galaxies.
Introduction
*Lower priority than the wide-field,
fiber-fed optical MOS
Matter Investigations
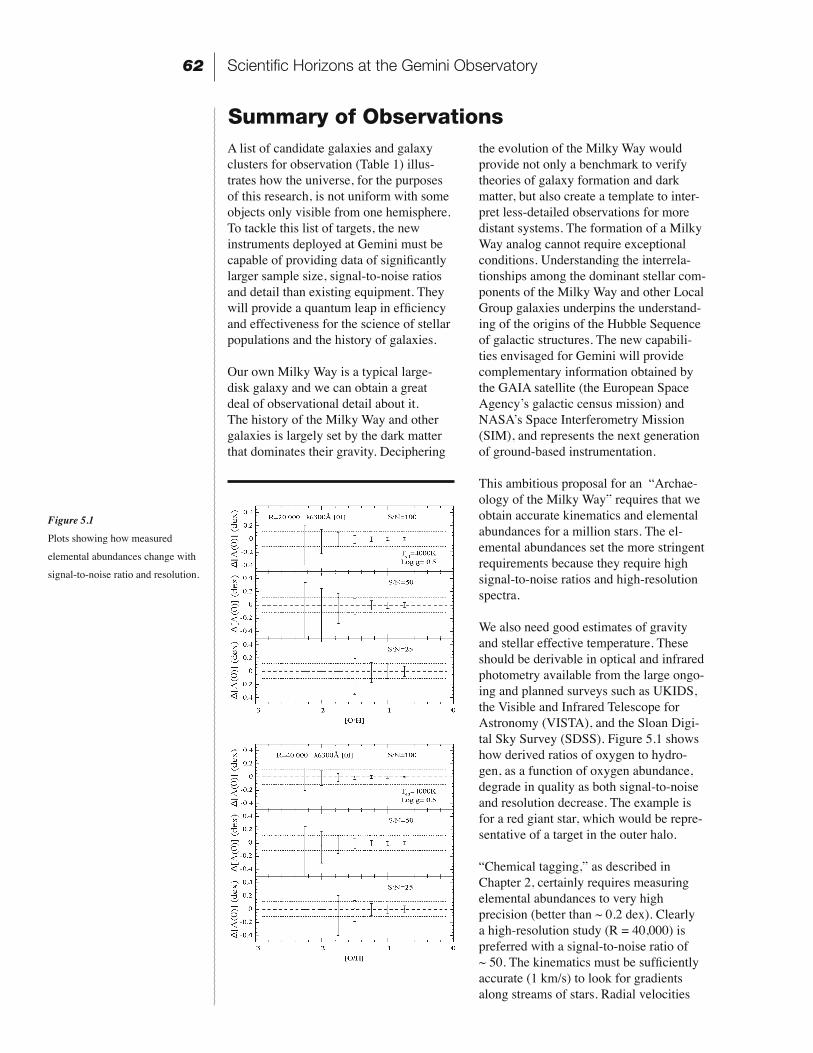
Scientific Horizons at the Gemini Observatory62
A list of candidate galaxies and galaxy clusters for observation (Table 1) illus-trates how the universe, for the purposes of this research, is not uniform with some objects only visible from one hemisphere. To tackle this list of targets, the new instruments deployed at Gemini must be capable of providing data of significantly larger sample size, signal-to-noise ratios and detail than existing equipment. They will provide a quantum leap in efficiency and effectiveness for the science of stellar populations and the history of galaxies.
Our own Milky Way is a typical large-disk galaxy and we can obtain a great deal of observational detail about it. The history of the Milky Way and other galaxies is largely set by the dark matter that dominates their gravity. Deciphering
the evolution of the Milky Way would provide not only a benchmark to verify theories of galaxy formation and dark matter, but also create a template to inter-pret less-detailed observations for more distant systems. The formation of a Milky Way analog cannot require exceptional conditions. Understanding the interrela-tionships among the dominant stellar com-ponents of the Milky Way and other Local Group galaxies underpins the understand-ing of the origins of the Hubble Sequence of galactic structures. The new capabili-ties envisaged for Gemini will provide complementary information obtained by the GAIA satellite (the European Space Agencyʼs galactic census mission) and NASA̓ s Space Interferometry Mission (SIM), and represents the next generation of ground-based instrumentation.
This ambitious proposal for an “Archae-ology of the Milky Way” requires that we obtain accurate kinematics and elemental abundances for a million stars. The el-emental abundances set the more stringent requirements because they require high signal-to-noise ratios and high-resolution spectra.
We also need good estimates of gravity and stellar effective temperature. These should be derivable in optical and infrared photometry available from the large ongo-ing and planned surveys such as UKIDS, the Visible and Infrared Telescope for Astronomy (VISTA), and the Sloan Digi-tal Sky Survey (SDSS). Figure 5.1 shows how derived ratios of oxygen to hydro-gen, as a function of oxygen abundance, degrade in quality as both signal-to-noise and resolution decrease. The example is for a red giant star, which would be repre-sentative of a target in the outer halo.
“Chemical tagging,” as described in Chapter 2, certainly requires measuring elemental abundances to very high precision (better than ~ 0.2 dex). Clearly a high-resolution study (R = 40,000) is preferred with a signal-to-noise ratio of ~ 50. The kinematics must be sufficiently accurate (1 km/s) to look for gradients along streams of stars. Radial velocities
Summary of Observations
Figure 5.1
Plots showing how measured
elemental abundances change with
signal-to-noise ratio and resolution.

A Vision of Discovery 63
can be achieved with an accuracy of 0.1 of a velocity pixel for these signal-to-noise ratios. The required kinematics are also easily achieved at high resolution (R = 40,000) and with a signal-to-noise ratio of about 50.
Different elements convey different information about stellar properties since they are created in stars of different main sequence masses and evolutionary time scales. Various elements have useful tran-sitions in different parts of the spectrum and we require that the spectrograph and detectors be flexible, with good sensitivity below 400 nm to detect Calcium II H and K (393.3 nm and 396.8 nm—these ionized lines of calcium are indicative of a starʼs evolution along the main sequence). This blue sensitivity is also needed for [OII] 372.7 nm for gas diagnostics. With an effi-
cient spectrograph at these resolutions and signal-to-noise ratios matched to an 8-me-ter telescope, we are targeting stars with a visual magnitude under 18 (v < 18) in exposures lasting only a few hours. Thus, with these apparent magnitude limits, we can obtain exquisite chemical abundances and kinematics for main sequence stars and subgiants within a few kiloparsecs in the Milky Way, for red giants in the Milky Way halo and red supergiants out as far as the galaxy M33 (see Table 2).
Determining the interrelationships be-tween the main stellar components of the Milky Way and other Local Group galax-ies takes more modest requirements on the accuracy of metallicities and kinematics and therefore lower spectral resolution. For metallicities accurate to 0.2 dex and kinematics accurate to 10 km/s, a spectral
Table 2
Log distance (parsec) as a function
of apparent (v) and absolute (MV)
magnitude is tabulated. MPG/MRG
= metal poor/rich giant; CG/BHB
= clump giant/blue horizontal
branch. Parenthesis help to delin-
eate the 1—10—100 kiloparsec
transitions.
Table 1
Candidate targets are listed in order
of increasing distance modulus.
Matter Investigations
Scientific Horizons at the Gemini Observatory64
resolution of ~ 5,000 should suffice which would allow us to push fainter and include a larger sample of halo main sequence stars with V ~ 22. The surface density of stars in the galaxy depends on the line of sight (latitude and longitude), the apparent magnitude and the color range selected. For V~18, which is the practical limit for good elemental abundances, based on Gilmoreʼs star count model and the targeting of metal-poor RGB and turnoff stars, there are approximately 800 stars per square degree in a typical intermediate-latitude line of sight. Pushing to fainter stars for overall metallicities (say V ~ 22) means that the stellar surface densities will be higher
than at the brighter limits quoted above, or about 1,500 stars per square degree. Assuming two set-ups a night, a multiplex capability of around 2,000 in a 1.5-degree field of view would be a good match to both aspects of the science case, and will allow the required sample sizes of around one million stars to be achieved in less than a year (possibly in 6 months).
The improvement in image quality from the proposed GLAO near-infrared imager is enough to provide improved proper-mo-tion information for Local Group systems and is invaluable to prioritize target selec-tion for radial velocities.

A Vision of Discovery 65
Key Question• What is the nature of dark matter on galactic scales?
New Capabilities Required:
Wide-Field Fiber-fed Optical MOS*Integral Field Unit (IFU) Optical Spectrometer
• Wavelength range: 0.45 - 0.9 µm• Spatial resolution: 0.2” sampling on sky• Spectral resolution: 3,000 - 5,000• 1-shot λ Coverage: 50 nm• Field of view: 2 arcminute• Multiplex: 1 object• Other: Large IFU feeding 10 identical spectrometers
Adaptive Optics-fed Near-Infrared Spectrometer• Wavelength range: 2.3 µm (CO band head)• Spatial resolution: 0.05”• Spectral resolution: 2,000 - 3,000• 1-shot λ Coverage: 2.2 - 2.4 µm• Field of view: 20 arcseconds• Multiplex: 1 object• Other: IFU spectrometer, possibly uses variable sampling across field
Ground Layer Adaptive Optics Near-Infrared Imager**
Summary of ObservationsWe can detect the presence of as much as 90% of the mass in the universe only by analyzing its gravitational effect on large-scale structures like galaxy clusters. This mass is dark and emits no electro-magnetic radiation. What is it? Candidates include exotic elementary particles whose existence has yet to be established by direct detection. Identification of what the dark matter is (and is not) would be a fundamental achievement in further-ing our understanding of the universe. Furthermore, astrophysical constraints on dark matter complement those from high-energy physics.
The nature of dark matter determines its “temperature,” which is a diagnostic of its streaming motions around galaxies. These motions determine how it is distributed through space, which can be measured by
mapping the kinematics of tracers of the gravitational field. Going from kinemat-ics, which describes motion, to determin-ing the reasons underlying the motion (dynamics) is a core goal of a program to determine the nature of dark matter.
The Local Group of galaxies contains some of the most dark-matter dominated systems known, based on inferences from the line-of-sight motions of samples of tens of member stars. The new capabili-ties we envisage for Gemini will provide complementary information to that from GAIA and SIM, and represents the next generation of ground-based instrumen-tation (compared to other existing or planned facilities). It will provide the definitive data to determine the tempera-ture of dark matter in nearby galaxies. The planned capabilities also allow these
**Lower priority
*As previously defined
Matter Investigations
Scientific Horizons at the Gemini Observatory66
techniques to be extended to more distant galaxies, allowing dark matter to be traced in galaxies across the full range of Hubble types and environments (see the Hubble sequence diagram Figure 2.7 in Chapter 3, page 21).
For Local Group galaxies, the require-ments are to obtain good radial veloci-ties for sufficient numbers of member stars across the face of a given galaxy to remove the degeneracy between mass and orbital anisotropy through models. For the target dwarf spheroidal galaxies, their low surface brightnesses argue for going as far as possible down the luminosity func-tion to measure dimmer stars. At typical distances of 100 kiloparsecs, a magnitude cutoff of about 23 approaches the main sequence turnoff of an old, metal-poor population of stars. The spectrograph described above is ideal for this purpose, and could provide the required data across the degree-scale Local Group dwarfs very efficiently. While this work has already been undertaken with existing facilities, the planned capabilities will make those efforts obsolete.
Over several years, the GLAO imager would provide improved center-of-mass proper motions for the limited number of satellite galaxies and distant globular clusters of the Milky Way. Thus, the imager will create an opportunity to better determine the dark matter profile in our own galaxy.
For more distant galaxies, an integral field unit (IFU) is required to obtain spectra of the integrated starlight of globular cluster systems. This can be in the optical (using GLAO or even natural seeing only) out to the distance of about the Virgo cluster (around 15 megaparsecs) and should be of sufficient resolution in both spatial and spectral domains to provide good enough kinematics and gradient information. The age-metallicity degeneracy will be broken through analysis of spectral line indices, which require a signal-to-noise ratio of ~ 30 at a spatial resolution of ~ 3,000.
Studies of more distant systems (greater than 15 megaparsecs) include a fair sample of giant elliptical galaxies. These require adaptive optics-fed spectrographs for spatial resolution, and thus, necessi-tate an infrared IFU. This is also the case for studying of the dusty regions around supermassive black holes and the embed-ded super-star clusters in merging galax-ies.
A Vision of Discovery 67
Key Question• What is the relationship between supermassive black holes and galaxies?
New Capabilities Required:
Adaptive Optics-Fed Near-Infrared Spectrometer*Multi-Conjugate Adaptive Optics-Fed Near-Infrared MOS• Wavelength range: 1.0 - 5.0 µm• Spatial resolution: 0.05” pixels• Spectral resolution: 30,000• 1-shot λ Coverage: J, H, K, L, or M long slits; TBD multislit• Field of view: 2-arcminute acquisition field• Multiplex: 100 objects• Other: MOS baseline, X-dispersed option
Summary of ObservationsOne of the most exciting recent discov-eries in astrophysics is that the mass of a supermassive black hole correlates with the mass and velocity dispersion of its host galaxy or, more correctly, with its host galaxyʼs bulge. Does star formation regulate black hole growth, or do black holes constrain star-form-ing rates? Suppression of star formation at early epochs of the universe seems to be required in popular cold dark matter cosmologies in order to maintain enough gas to fuel the subsequent star formation that we know occurred in galactic disks. Are supermassive black holes impli-cated? Active galactic nuclei have been detected even at the earliest epochs at which galaxies have been detected, with the host galaxies apparently being very metal enriched, indicating significant star formation.
Again, the Milky Way galaxy plays a critical role in this investigation, since it also hosts a supermassive black hole at its center. The properties of the stars sur-rounding this black hole are still poorly characterized. We envisage capabilities that allow detailed elemental abundances to be derived for typical stars in the region surrounding the galactic center in order to
constrain the stellar initial mass function and chemical evolution. This analysis is to be complemented with kinematic and metallicity data for more distant black holes.
A close relationship between a central, supermassive black hole and its host galaxy was established recently through a combination of surface photometry and spectroscopy. The results showed that the derived mass of the black hole correlates with the velocity dispersion of the stars in the host galaxyʼs bulge, which are many kiloparsecs from the black hole and beyond any possible present influence. We have only very limited information on the properties of the stellar popula-tions and the gradients of those properties that surround supermassive black holes. Exceptions to a rule often can provide insight into the underlying rule and M33 is a local group galaxy that does not follow the established close relationship between a galaxy and its central black hole. New capabilities for Gemini could allow studies of the central stellar popula-tions in galaxies in a variety of environ-ments and a variety of central black hole activities. Kinematics, ages and chemical abundances will allow us to trace the his-
*As previously defined
Matter Investigations
A Vision of Discovery 69
Key Question
• What is dark energy?
New Capabilities Required:
Wide-Field MOS• Wavelength range: 0.34 - 0.9 µm• Spatial resolution: 0.2”• Spectral resolution: 3,000 - 40,000• 1-shot λ Coverage: TBD• Field of View: 45 arcminutes• Multiplex: 1000 objects• Other: Uses f/6 telescope feed
GLAO Near-Infrared Imager*
The Universe of Energy Investigations6
The questions to be answered about dark energy require new instrumentation capa-bilities at Gemini Observatory that would allow astronomers to reach out to epochs when this force first began to dominate the energetics (the flow and transformation of energy) in the universe. We can deduce that dark energy is apparently respon-
sible for about 70% of the universeʼs energy density, but otherwise its nature is completely mysterious. Understand-ing the nature of dark energy would be a major milestone in human knowledge, and would forge a strong and direct link between astronomical observation and the realm of high-energy physics.
Introduction
Instrumentation and ObservationsProposed new instrumentation on Gemini would allow the determination of cos-mological standard rulers to a precision of 1% using galaxy redshift surveys, and would measure the rate of change of the equation of state w(z) with a preci-sion an order of magnitude greater than current experiments allow. (For a review of the equation of state, see Chapter 3). Constraints on w(z) obtained by Gemini
would be comparable to those obtained from the proposed Supernova Accelera-tion Probe (SNAP), but would be based on angular diameter distances rather than luminosity distances. These would be subject to entirely different systematic sources of error.
Figure 3.3 in Chapter 3, page 43 shows the capability of using future large-scale
*As previously defined
Energy Investigations

Scientific Horizons at the Gemini Observatory70
redshift surveys to measure acoustic peaks in the power spectrum of galaxy distribu-tions. It also shows the recovery of the angle-averaged power spectrum from a simulated survey covering 600 square degrees and sampling two million galax-ies with a redshift range between 0.5 and 1.3. This measurement is the equivalent of six Sloan Digital Sky Survey volumes made at a redshift range where the linear regime extends to twice as many wave numbers as the local case. Achieving this depth and volume is highly ambitious, but would be quite achievable with the instru-ment described above. The spectrograph could complete the survey in 100 nights, assuming 45-minute integrations and 8-hour nights.
This measurement would allow extraordi-narily interesting constraints to be placed on the time evolution of the equation of state parameter w. Consider the simplest case of a linear dependence of w on redshift, expressed as:
w = w0 + w1z
Because the goal is the study of time dependence in w, two redshift intervals are needed. If the 600-square-degree
survey from Figure 6.1 is augmented by a 200-square-degree survey of galaxies at a high redshift (say z = 3, selected via the Lyman Break technique), limits on w0 and w1 are quite comparable to those obtained from the SNAP survey (Figure 6.1). The necessity of obtaining a high-redshift sample at z = 3 in addition to an emission-line sample of objects at lower redshifts (z = 1), coupled with the treasure trove of diagnostic absorption features in absorption-line spectra at rest wavelengths between 130 and 200 nm, drives the need for blue sensitivity in the spectrograph.
Can an imaging survey using photometric redshifts measure the acoustic peaks to an accuracy comparable to that achievable with Gemini? To achieve the same number of independent Fourier modes as a spec-troscopic survey, a much greater sky area is needed. For example, if the redshift er-ror is 0.03 (1 + z), the survey area must be increased by a factor of 20, and even then, it would have much weaker constraining power for dark energy models because photometric redshift-based surveys can only constrain transverse oscillations in the fluctuation spectrum.
Figure 6.1
A comparison between the error
contours in (w0, w1) parameter
space obtained from an acoustic
peak survey to those from a combi-
nation of Supernova Acceleration
Probe (SNAP) constraints from the
cosmic microwave background and
the Sloan Digital Sky Survey.
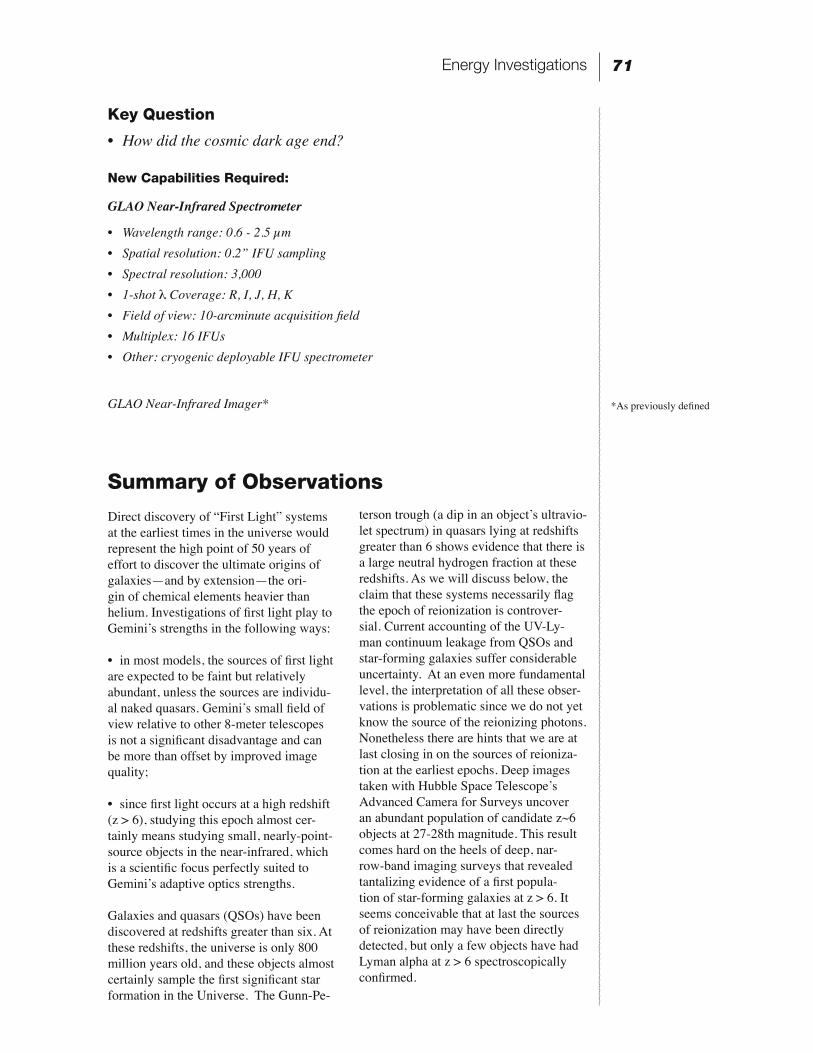
A Vision of Discovery 71
Key Question
• How did the cosmic dark age end?
New Capabilities Required:
GLAO Near-Infrared Spectrometer
• Wavelength range: 0.6 - 2.5 µm• Spatial resolution: 0.2” IFU sampling• Spectral resolution: 3,000• 1-shot λ Coverage: R, I, J, H, K• Field of view: 10-arcminute acquisition field• Multiplex: 16 IFUs• Other: cryogenic deployable IFU spectrometer
GLAO Near-Infrared Imager*
Summary of Observations
Direct discovery of “First Light” systems at the earliest times in the universe would represent the high point of 50 years of effort to discover the ultimate origins of galaxies—and by extension—the ori-gin of chemical elements heavier than helium. Investigations of first light play to Geminiʼs strengths in the following ways:
• in most models, the sources of first light are expected to be faint but relatively abundant, unless the sources are individu-al naked quasars. Geminiʼs small field of view relative to other 8-meter telescopes is not a significant disadvantage and can be more than offset by improved image quality;
• since first light occurs at a high redshift (z > 6), studying this epoch almost cer-tainly means studying small, nearly-point-source objects in the near-infrared, which is a scientific focus perfectly suited to Geminiʼs adaptive optics strengths.
Galaxies and quasars (QSOs) have been discovered at redshifts greater than six. At these redshifts, the universe is only 800 million years old, and these objects almost certainly sample the first significant star formation in the Universe. The Gunn-Pe-
terson trough (a dip in an objectʼs ultravio-let spectrum) in quasars lying at redshifts greater than 6 shows evidence that there is a large neutral hydrogen fraction at these redshifts. As we will discuss below, the claim that these systems necessarily flag the epoch of reionization is controver-sial. Current accounting of the UV-Ly-man continuum leakage from QSOs and star-forming galaxies suffer considerable uncertainty. At an even more fundamental level, the interpretation of all these obser-vations is problematic since we do not yet know the source of the reionizing photons. Nonetheless there are hints that we are at last closing in on the sources of reioniza-tion at the earliest epochs. Deep images taken with Hubble Space Telescopeʼs Advanced Camera for Surveys uncover an abundant population of candidate z~6 objects at 27-28th magnitude. This result comes hard on the heels of deep, nar-row-band imaging surveys that revealed tantalizing evidence of a first popula-tion of star-forming galaxies at z > 6. It seems conceivable that at last the sources of reionization may have been directly detected, but only a few objects have had Lyman alpha at z > 6 spectroscopically confirmed.
*As previously defined
Energy Investigations
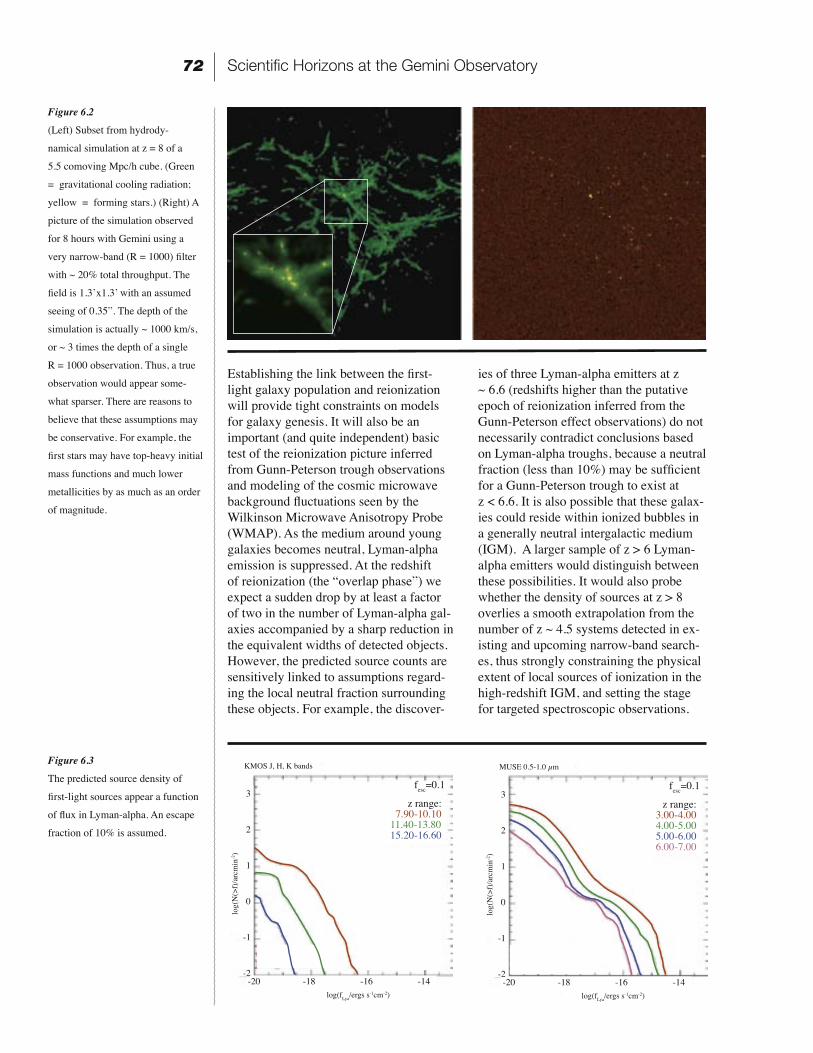
Scientific Horizons at the Gemini Observatory72
Establishing the link between the first-light galaxy population and reionization will provide tight constraints on models for galaxy genesis. It will also be an important (and quite independent) basic test of the reionization picture inferred from Gunn-Peterson trough observations and modeling of the cosmic microwave background fluctuations seen by the Wilkinson Microwave Anisotropy Probe (WMAP). As the medium around young galaxies becomes neutral, Lyman-alpha emission is suppressed. At the redshift of reionization (the “overlap phase”) we expect a sudden drop by at least a factor of two in the number of Lyman-alpha gal-axies accompanied by a sharp reduction in the equivalent widths of detected objects. However, the predicted source counts are sensitively linked to assumptions regard-ing the local neutral fraction surrounding these objects. For example, the discover-
ies of three Lyman-alpha emitters at z ~ 6.6 (redshifts higher than the putative epoch of reionization inferred from the Gunn-Peterson effect observations) do not necessarily contradict conclusions based on Lyman-alpha troughs, because a neutral fraction (less than 10%) may be sufficient for a Gunn-Peterson trough to exist at z < 6.6. It is also possible that these galax-ies could reside within ionized bubbles in a generally neutral intergalactic medium (IGM). A larger sample of z > 6 Lyman-alpha emitters would distinguish between these possibilities. It would also probe whether the density of sources at z > 8 overlies a smooth extrapolation from the number of z ~ 4.5 systems detected in ex-isting and upcoming narrow-band search-es, thus strongly constraining the physical extent of local sources of ionization in the high-redshift IGM, and setting the stage for targeted spectroscopic observations.
Figure 6.2
(Left) Subset from hydrody-
namical simulation at z = 8 of a
5.5 comoving Mpc/h cube. (Green
= gravitational cooling radiation;
yellow = forming stars.) (Right) A
picture of the simulation observed
for 8 hours with Gemini using a
very narrow-band (R = 1000) filter
with ~ 20% total throughput. The
field is 1.3ʼx1.3 ̓with an assumed
seeing of 0.35”. The depth of the
simulation is actually ~ 1000 km/s,
or ~ 3 times the depth of a single
R = 1000 observation. Thus, a true
observation would appear some-
what sparser. There are reasons to
believe that these assumptions may
be conservative. For example, the
first stars may have top-heavy initial
mass functions and much lower
metallicities by as much as an order
of magnitude.
Figure 6.3
The predicted source density of
first-light sources appear a function
of flux in Lyman-alpha. An escape
fraction of 10% is assumed.
A Vision of Discovery 73
The key feature of a mapping instrument designed to detect Lyman alpha in the J band (near-infrared) with Gemini is the ability to image between OH lines, where the sky background is actually quite low. A tunable filter would be ideal, taking advantage of wide atmospheric line gaps at different redshifts. Using an excellent detector with low read noise and dark current (i.e., sky noise limited between the lines in J), an instrument with even moderate total throughput would enhance Geminiʼs sensitivity enough to directly detect first light objects, as shown in Figure 6.2. These mapping observations would in turn set the stage for targeted spectroscopic-mode observations using a deployable IFU. Redshifts higher than 6 are needed not only to test the underly-ing credibility of results inferred from photometric redshifts and narrow-band mapping, but also to provide complemen-tary tests of the basic reionization picture inferred from narrow-band searches. The IFU is desirable for undertaking these ob-servations because at some point scattered Lyman-alpha radiation is expected to form a diffuse halo around targets seen prior to cosmological reionization. However, the appropriate IFU configuration for undertaking these observations is not pres-ently defined. Therefore, an instrument with highly configurable IFU bundles is needed. If halos are very large, then it may be most efficient to target many more compact systems with small IFU bundles or even pseudo slitlets.
A campaign of emission-line redshifts targeting first-light galaxies is both highly exciting and, by building on underlying panoramic mapping surveys, relatively
“safe.” It is interesting to speculate on what might be accomplished with much deeper observations that allow continuum to be detected. This would break com-pletely new ground and allow Gemini to explore the fundamental links between the physics of first-light sources and the initial mass function of the first stars. The equivalent width of a high-redshift Lyman-alpha emission line simply tracks the hardness of the ionizing spectrum, and thus, is a relatively clean probe of the ini-tial mass function. More specifically, the equivalent width distribution of Lyman-al-pha lines is decoupled from complications introduced by cosmological evolution and the neutral fraction in the surrounding intergalactic medium. The detection of continuum in unlensed first-light systems would certainly stretch the capabilities of Gemini. It would only be possible by taking advantage of the exquisite im-age quality possible with adaptive optics coupled with extremely long integration times. Gemini has pioneered in this area with its Nod and Shuffle mode which is a technique that utilizes a complex choreog-raphy of telescope motions (nodding) and electronic shuffling of electrical charges (to avoid buildup of electronic noise). Such observations could be feasible with the new generation of low-noise infrared detectors if the density of targets is suf-ficiently high (Figure 6.3). Alternatively, many individual spectra may be co-added to improve signal-to-noise ratios, or gravi-tational lensing amplification may be used to augment rest-frame flux. By linking such observations to searches for nearby Population III objects Gemini could explore both endpoints in the star forma-tion history of the universe using a single stellar population.
Energy Investigations

A Vision of Discovery 75
Key Question
• How common are extrasolar planets, including earth-like planets?
New Capabilities Required:
Extreme Adaptive Optics Coronagraph• Wavelength range: 0.9 - 2.5 µm• Spatial resolution: 0.02 arcseconds• Spectral resolution: 30 - 300 (IFU mode) or J, H, K (imaging mode)• Field of view: 3 arcseconds• Multiplex: 1 object• Other: 107 contrast ratio in 0.1 - 1.5 arcsecond radius; includes polarimetry
High-Resolution Near-Infrared Spectrometer• Wavelength range: 0.9 - 2.5 µm• Spatial resolution: 0.2” pixels• Spectral resolution: 70,000• 1-shot λ Coverage: 1.0 - 2.5 or 3 - 5 µm• Field of view: 3” slit• Multiplex: 1 object• Other: X-dispersed spectrometer; seeing limited, includes absorption cell
The Universe of Life Investigations7
In Chapter 4 we presented critical issues in determining whether life is common elsewhere in the universe. The genera-tion of stars, the subsequent formation of planets, and the creation of the heavy elements needed for both planets and life, engenders a series of key science ques-tions. Geminiʼs proposed new instruments
will enable astronomers to probe the dusty realms of stellar birth and death, by delivering detailed new observations. Un-derstanding the complete cycles of stellar life, coupled with sensitive probes of the interstellar medium, will bring us closer to understanding the complex interactions that give rise to the conditions for life.
Introduction
Life Investigations
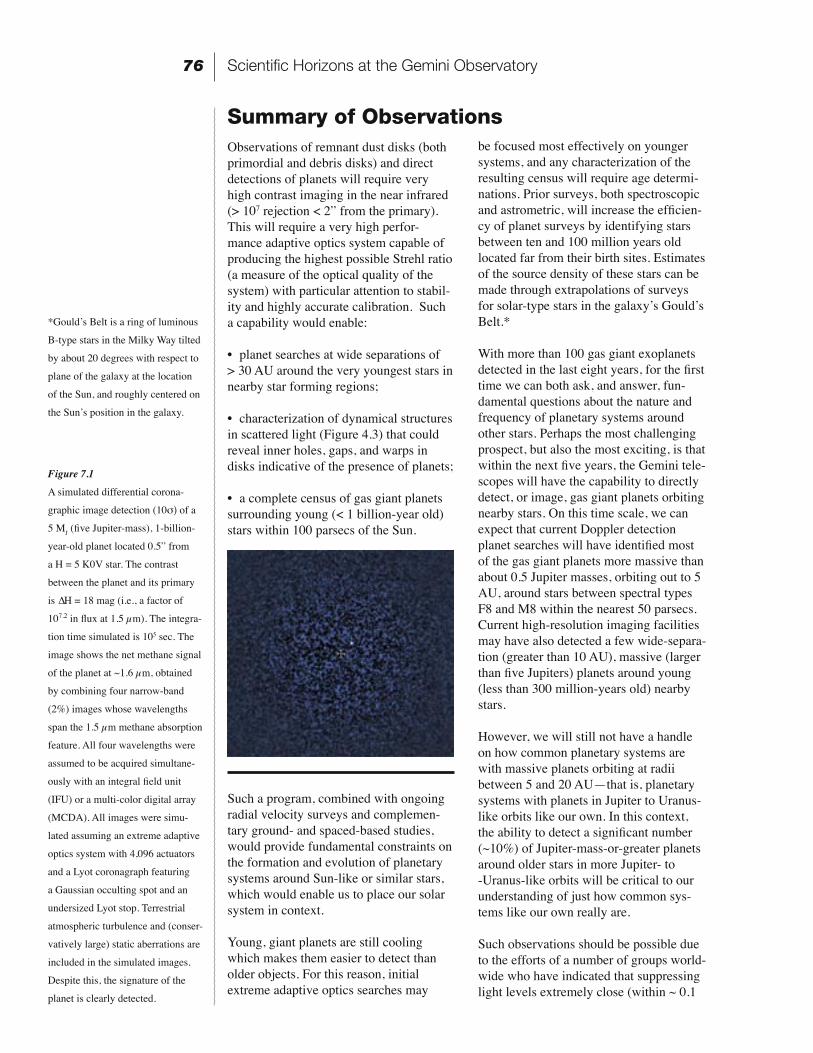
Scientific Horizons at the Gemini Observatory76
Observations of remnant dust disks (both primordial and debris disks) and direct detections of planets will require very high contrast imaging in the near infrared (> 107 rejection < 2” from the primary). This will require a very high perfor-mance adaptive optics system capable of producing the highest possible Strehl ratio (a measure of the optical quality of the system) with particular attention to stabil-ity and highly accurate calibration. Such a capability would enable:
• planet searches at wide separations of> 30 AU around the very youngest stars in nearby star forming regions;
• characterization of dynamical structures in scattered light (Figure 4.3) that could reveal inner holes, gaps, and warps in disks indicative of the presence of planets;
• a complete census of gas giant planets surrounding young (< 1 billion-year old) stars within 100 parsecs of the Sun.
Figure 7.1
A simulated differential corona-
graphic image detection (10σ) of a
5 MJ (five Jupiter-mass), 1-billion-
year-old planet located 0.5” from
a H = 5 K0V star. The contrast
between the planet and its primary
is ∆H = 18 mag (i.e., a factor of
107.2 in flux at 1.5 µm). The integra-
tion time simulated is 105 sec. The
image shows the net methane signal
of the planet at ~1.6 µm, obtained
by combining four narrow-band
(2%) images whose wavelengths
span the 1.5 µm methane absorption
feature. All four wavelengths were
assumed to be acquired simultane-
ously with an integral field unit
(IFU) or a multi-color digital array
(MCDA). All images were simu-
lated assuming an extreme adaptive
optics system with 4,096 actuators
and a Lyot coronagraph featuring
a Gaussian occulting spot and an
undersized Lyot stop. Terrestrial
atmospheric turbulence and (conser-
vatively large) static aberrations are
included in the simulated images.
Despite this, the signature of the
planet is clearly detected.
be focused most effectively on younger systems, and any characterization of the resulting census will require age determi-nations. Prior surveys, both spectroscopic and astrometric, will increase the efficien-cy of planet surveys by identifying stars between ten and 100 million years old located far from their birth sites. Estimates of the source density of these stars can be made through extrapolations of surveys for solar-type stars in the galaxyʼs Gouldʼs Belt.*
With more than 100 gas giant exoplanets detected in the last eight years, for the first time we can both ask, and answer, fun-damental questions about the nature and frequency of planetary systems around other stars. Perhaps the most challenging prospect, but also the most exciting, is that within the next five years, the Gemini tele-scopes will have the capability to directly detect, or image, gas giant planets orbiting nearby stars. On this time scale, we can expect that current Doppler detection planet searches will have identified most of the gas giant planets more massive than about 0.5 Jupiter masses, orbiting out to 5 AU, around stars between spectral types F8 and M8 within the nearest 50 parsecs. Current high-resolution imaging facilities may have also detected a few wide-separa-tion (greater than 10 AU), massive (larger than five Jupiters) planets around young (less than 300 million-years old) nearby stars.
However, we will still not have a handle on how common planetary systems are with massive planets orbiting at radii between 5 and 20 AU—that is, planetary systems with planets in Jupiter to Uranus-like orbits like our own. In this context, the ability to detect a significant number (~10%) of Jupiter-mass-or-greater planets around older stars in more Jupiter- to -Uranus-like orbits will be critical to our understanding of just how common sys-tems like our own really are.
Such observations should be possible due to the efforts of a number of groups world-wide who have indicated that suppressing light levels extremely close (within ~ 0.1
Summary of Observations
Such a program, combined with ongoing radial velocity surveys and complemen-tary ground- and spaced-based studies, would provide fundamental constraints on the formation and evolution of planetary systems around Sun-like or similar stars, which would enable us to place our solar system in context.
Young, giant planets are still cooling which makes them easier to detect than older objects. For this reason, initial extreme adaptive optics searches may
*Gouldʼs Belt is a ring of luminous
B-type stars in the Milky Way tilted
by about 20 degrees with respect to
plane of the galaxy at the location
of the Sun, and roughly centered on
the Sunʼs position in the galaxy.
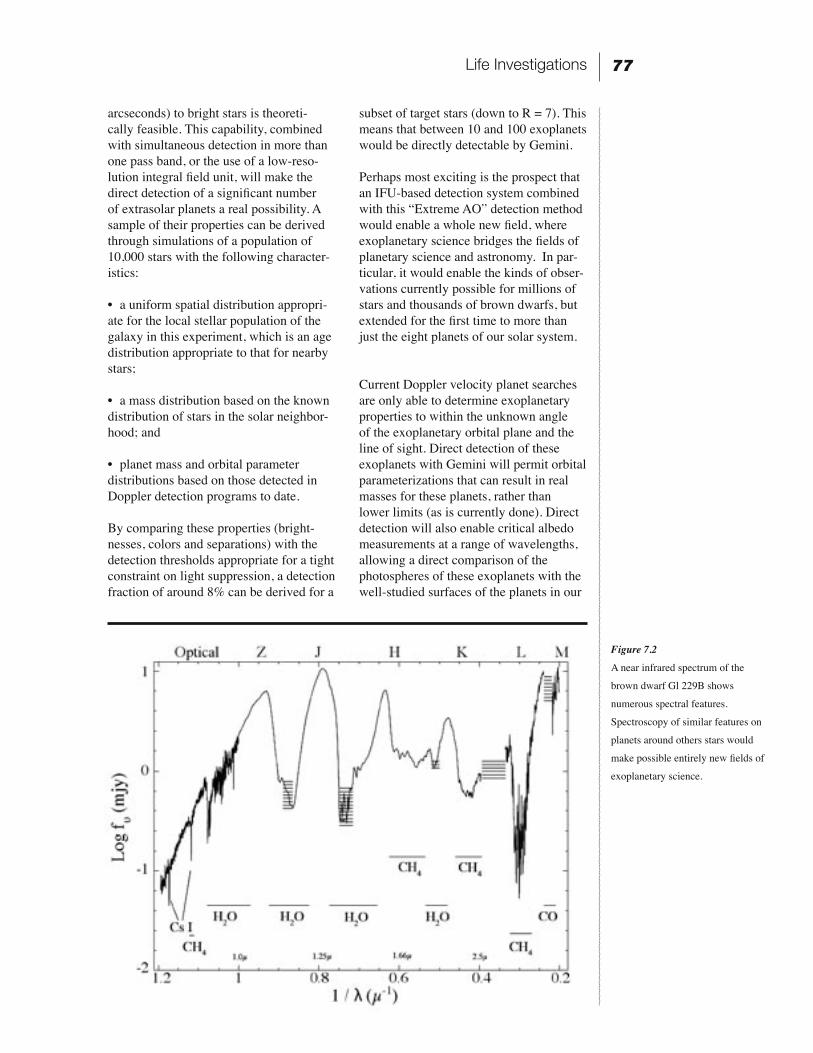
A Vision of Discovery 77
Figure 7.2
A near infrared spectrum of the
brown dwarf Gl 229B shows
numerous spectral features.
Spectroscopy of similar features on
planets around others stars would
make possible entirely new fields of
exoplanetary science.
arcseconds) to bright stars is theoreti-cally feasible. This capability, combined with simultaneous detection in more than one pass band, or the use of a low-reso-lution integral field unit, will make the direct detection of a significant number of extrasolar planets a real possibility. A sample of their properties can be derived through simulations of a population of 10,000 stars with the following character-istics:
• a uniform spatial distribution appropri-ate for the local stellar population of the galaxy in this experiment, which is an age distribution appropriate to that for nearby stars;
• a mass distribution based on the known distribution of stars in the solar neighbor-hood; and
• planet mass and orbital parameter distributions based on those detected in Doppler detection programs to date.
By comparing these properties (bright-nesses, colors and separations) with the detection thresholds appropriate for a tight constraint on light suppression, a detection fraction of around 8% can be derived for a
subset of target stars (down to R = 7). This means that between 10 and 100 exoplanets would be directly detectable by Gemini.
Perhaps most exciting is the prospect that an IFU-based detection system combined with this “Extreme AO” detection method would enable a whole new field, where exoplanetary science bridges the fields of planetary science and astronomy. In par-ticular, it would enable the kinds of obser-vations currently possible for millions of stars and thousands of brown dwarfs, but extended for the first time to more than just the eight planets of our solar system.
Current Doppler velocity planet searches are only able to determine exoplanetary properties to within the unknown angle of the exoplanetary orbital plane and the line of sight. Direct detection of these exoplanets with Gemini will permit orbital parameterizations that can result in real masses for these planets, rather than lower limits (as is currently done). Direct detection will also enable critical albedo measurements at a range of wavelengths, allowing a direct comparison of the photospheres of these exoplanets with the well-studied surfaces of the planets in our
Life Investigations
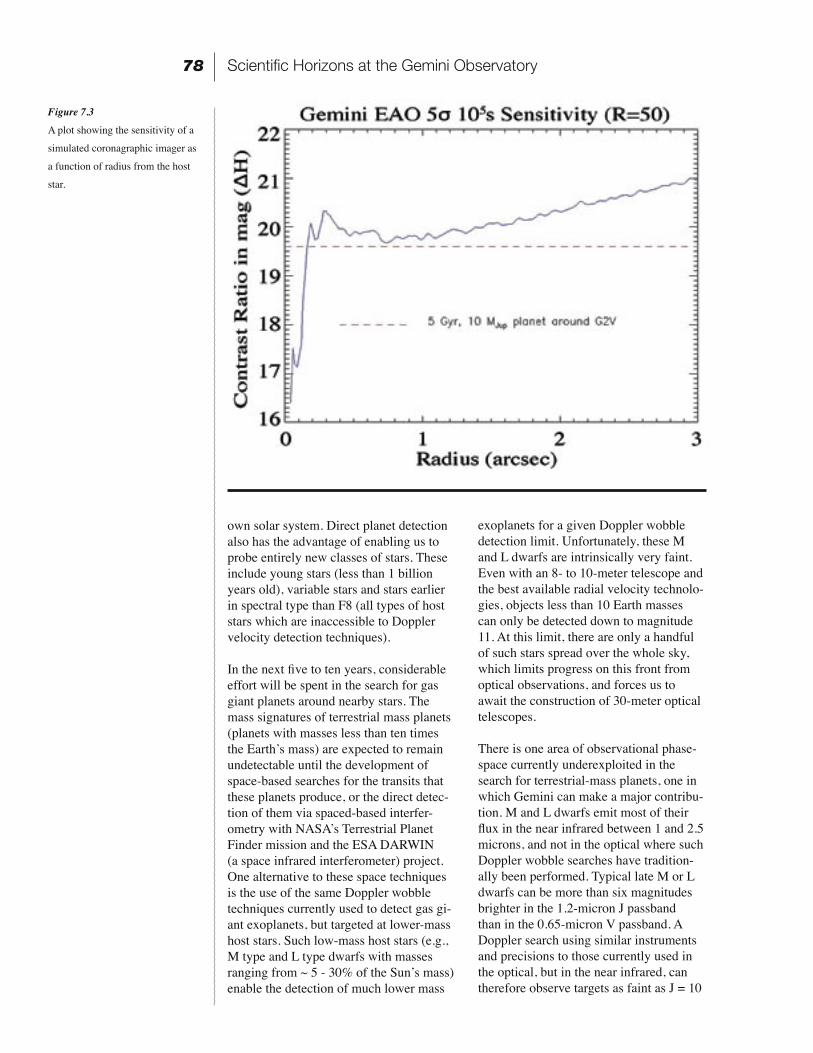
Scientific Horizons at the Gemini Observatory78
Figure 7.3
A plot showing the sensitivity of a
simulated coronagraphic imager as
a function of radius from the host
star.
own solar system. Direct planet detection also has the advantage of enabling us to probe entirely new classes of stars. These include young stars (less than 1 billion years old), variable stars and stars earlier in spectral type than F8 (all types of host stars which are inaccessible to Doppler velocity detection techniques).
In the next five to ten years, considerable effort will be spent in the search for gas giant planets around nearby stars. The mass signatures of terrestrial mass planets (planets with masses less than ten times the Earthʼs mass) are expected to remain undetectable until the development of space-based searches for the transits that these planets produce, or the direct detec-tion of them via spaced-based interfer-ometry with NASA̓ s Terrestrial Planet Finder mission and the ESA DARWIN (a space infrared interferometer) project. One alternative to these space techniques is the use of the same Doppler wobble techniques currently used to detect gas gi-ant exoplanets, but targeted at lower-mass host stars. Such low-mass host stars (e.g., M type and L type dwarfs with masses ranging from ~ 5 - 30% of the Sunʼs mass) enable the detection of much lower mass
exoplanets for a given Doppler wobble detection limit. Unfortunately, these M and L dwarfs are intrinsically very faint. Even with an 8- to 10-meter telescope and the best available radial velocity technolo-gies, objects less than 10 Earth masses can only be detected down to magnitude 11. At this limit, there are only a handful of such stars spread over the whole sky, which limits progress on this front from optical observations, and forces us to await the construction of 30-meter optical telescopes.
There is one area of observational phase-space currently underexploited in the search for terrestrial-mass planets, one in which Gemini can make a major contribu-tion. M and L dwarfs emit most of their flux in the near infrared between 1 and 2.5 microns, and not in the optical where such Doppler wobble searches have tradition-ally been performed. Typical late M or L dwarfs can be more than six magnitudes brighter in the 1.2-micron J passband than in the 0.65-micron V passband. A Doppler search using similar instruments and precisions to those currently used in the optical, but in the near infrared, can therefore observe targets as faint as J = 10
A Vision of Discovery 79
(or equivalently a visual magnitude of 16). At these magnitudes, there are 8,000 times more M and L dwarfs with companions under 10 Earth masses available for obser-vation than there are at 10th magnitude.
The near-infrared, high-resolution spec-
trograph described here would enable Gemini to perform a detailed statistical analysis of the number density of habit-able terrestrial-mass planets almost a de-cade in advance of similar searches, either in the optical with 30-meter telescopes or from space.
Key Question
• How do star and planetary systems form?
New Capabilities Required:
High-Resolution Near-Infrared Spectrometer*
High-Resolution Mid-Infrared Spectrometer• Wavelength range: 8 - 17 µm• Spatial resolution: 0.1” pixels• Spectral resolution: 100,000• 1-shot λ Coverage: 1%• Field of view: 3” slit• Multiplex: 1 object• Other: X-dispersed spectrometer
MCAO-Fed Near-Infrared MOS• Wavelength range: 1.0 - 5.0 µm• Spatial resolution: 0.05” pixels• Spectral resolution: 30,000• 1-shot λ Coverage: J, H, K, L, or M long slits; TBD multislit• Field of view: 2-arcminute acquisition field• Multiplex: 100 objects• Other: MOS baseline, X-dispersed option
Since most, if not all, stars form in clusters rather than in isolation, how do their parent molecular clouds fragment and then form a range of stellar masses? Cloud collapse to form stars and stellar systems requires the release of energy and
Summary of Observationsthe shedding of angular momentum and magnetic flux.
The initial environmental conditions that affect collapse are unknown. A sample of roughly 50 star formation regions at early
*As previously defined
Life Investigations

Scientific Horizons at the Gemini Observatory80
stages, across a range of cloud condi-tions imaged between 10 and 20 microns (where pre-stellar fragments and clumps are bright and can be observed through dense columns of dust), combined with polarimetry would attack this problem. Such observations would qualitatively compare the complexity of the regions and quantify the energy distribution among the sources. They would also re-veal the magnetic geometry of the region in order to relate these same properties to the parent giant molecular cloud. This latter aspect will require complementary James Clerk Maxwell Telescope and Atacama Large Millimeter Array submil-limeter observations. Some progress may be made here with existing Gemini instru-ments like MICHELLE and TReCS.
How do protostars with a wide range of masses collapse from individual cloud cores to form star and disk systems? Near- and mid-infrared spectroscopic studies are required to pierce through veils of extinction of up to 200 visual magni-tudes. Such circumstellar disks contain a rich soup of pre-biotic materials. The gas chemistry varies, however, in disks of dif-ferent ages and at different temperatures. In flared disks (at temperatures of 500 K and densities ~ 106 cm-3), absorption line spectroscopy toward the central star can sample many molecular transitions simultaneously. Absorption spectra of the central stars in Class I and II sources will provide measures of complex molecules such as methane and acetylene, which are not accessible in the millimeter or submil-limeter wave bands. These studies will provide an unprecedented look into the physical conditions of star forming disks. A sample size of many tens of objects in a range of star forming environments is needed with individual sources having ~ 5 Jansky fluxes or brighter. A spectral resolution of R~100,000 and as much coverage in wavelength as possible be-tween 8-17 microns is needed. While not an instrument requirement, dry conditions more typical of Mauna Kea and Gemini North are needed for observations near 17 microns and for portions of the 8- to 14- micron band. Because of the importance of these observations in understanding the physics of star formation, the excellent fit
to the infrared optimized Gemini tele-scopes and the fact that the James Webb Space Telescope will not provide similar capabilities, advanced 8- to 17-micron ca-pabilities on Gemini are essential if we are to make progress in this field. As far as we know, such a mid-infrared, high-resolution facility would be unique among all large telescopes in space and on the ground in the near future.
Accretion disks play a crucial role in the formation of stars and planets. Previous studies of the accretion process have relied on photometry and inference of disk prop-erties from their spectral energy distribu-tions. The CO band head at 2.3 microns is particularly well suited to studying ac-cretion disks around young stellar objects. Some ionized hydrogen lines can also be used to deduce inflow and outflow rates.
The region close to the central star (within 1 AU) is much hotter (more than 1000 K) than that probed by mid-infrared spectra, and cannot be spatially resolved. While optical spectroscopy of H∝ and Na I lines have been used to obtain velocity and density information about inflowing gas, these lines are often opti-cally thick and difficult to interpret due to contributions from many different regimes in these complex systems. Near-infrared spectroscopy provides access to higher recombination levels, such as the hydro-gen Brackett series, that are generally less optically thick and less likely to be contaminated by gas excited from lower levels. High spectral resolution measure-ments of the hydrogen Br γ line, believed to be formed in magnetospheric accretion columns, can be used to measure free-fall velocities and thereby constrain protostel-lar masses.
The ability to carry out high spatial and spectral resolution multi-object near-in-frared spectroscopy would enable Gemini to study the accretion and inflow/outflow properties of an entire young stellar cluster simultaneously in the 1- to 2.5-micron region. This would provide a sample of sources that formed at about the same time and allow us to study them as a function of mass. A range of clusters can be studied to also investigate dependence upon age,
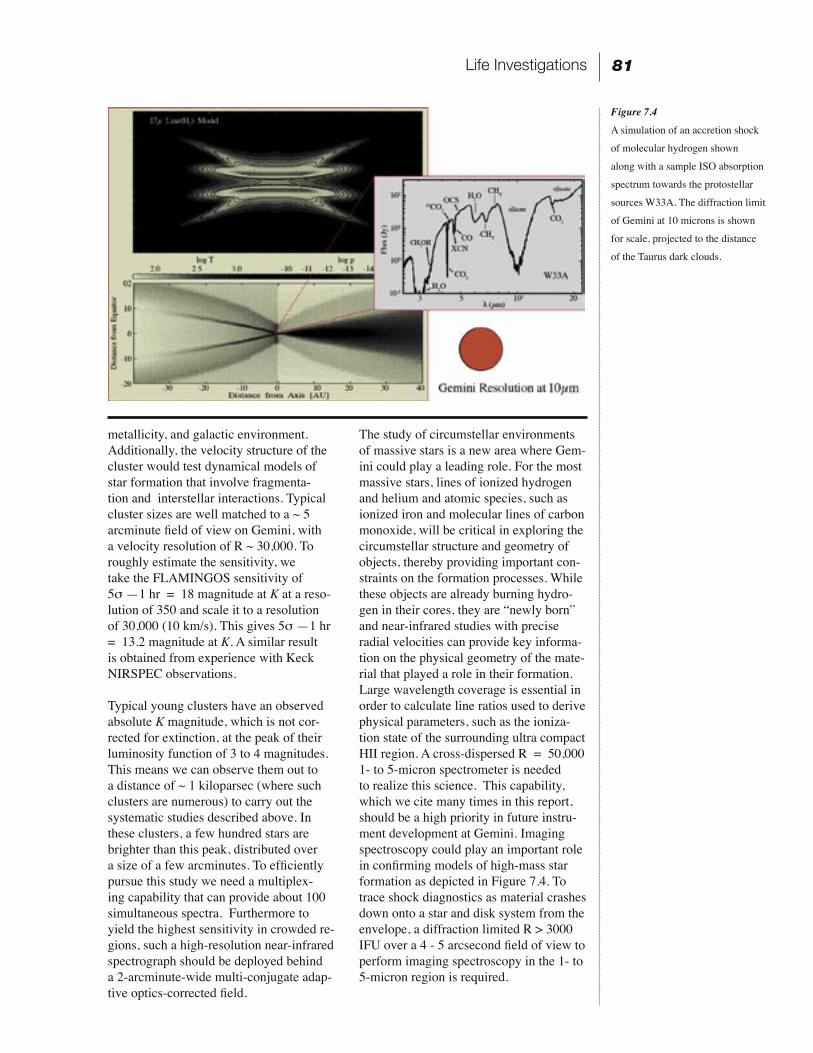
A Vision of Discovery 81
metallicity, and galactic environment. Additionally, the velocity structure of the cluster would test dynamical models of star formation that involve fragmenta-tion and interstellar interactions. Typical cluster sizes are well matched to a ~ 5 arcminute field of view on Gemini, with a velocity resolution of R ~ 30,000. To roughly estimate the sensitivity, we take the FLAMINGOS sensitivity of 5σ —1 hr = 18 magnitude at K at a reso-lution of 350 and scale it to a resolution of 30,000 (10 km/s). This gives 5σ —1 hr = 13.2 magnitude at K. A similar result is obtained from experience with Keck NIRSPEC observations.
Typical young clusters have an observed absolute K magnitude, which is not cor-rected for extinction, at the peak of their luminosity function of 3 to 4 magnitudes. This means we can observe them out to a distance of ~ 1 kiloparsec (where such clusters are numerous) to carry out the systematic studies described above. In these clusters, a few hundred stars are brighter than this peak, distributed over a size of a few arcminutes. To efficiently pursue this study we need a multiplex-ing capability that can provide about 100 simultaneous spectra. Furthermore to yield the highest sensitivity in crowded re-gions, such a high-resolution near-infrared spectrograph should be deployed behind a 2-arcminute-wide multi-conjugate adap-tive optics-corrected field.
Figure 7.4
A simulation of an accretion shock
of molecular hydrogen shown
along with a sample ISO absorption
spectrum towards the protostellar
sources W33A. The diffraction limit
of Gemini at 10 microns is shown
for scale, projected to the distance
of the Taurus dark clouds.
The study of circumstellar environments of massive stars is a new area where Gem-ini could play a leading role. For the most massive stars, lines of ionized hydrogen and helium and atomic species, such as ionized iron and molecular lines of carbon monoxide, will be critical in exploring the circumstellar structure and geometry of objects, thereby providing important con-straints on the formation processes. While these objects are already burning hydro-gen in their cores, they are “newly born” and near-infrared studies with precise radial velocities can provide key informa-tion on the physical geometry of the mate-rial that played a role in their formation. Large wavelength coverage is essential in order to calculate line ratios used to derive physical parameters, such as the ioniza-tion state of the surrounding ultra compact HII region. A cross-dispersed R = 50,000 1- to 5-micron spectrometer is needed to realize this science. This capability, which we cite many times in this report, should be a high priority in future instru-ment development at Gemini. Imaging spectroscopy could play an important role in confirming models of high-mass star formation as depicted in Figure 7.4. To trace shock diagnostics as material crashes down onto a star and disk system from the envelope, a diffraction limited R > 3000 IFU over a 4 - 5 arcsecond field of view to perform imaging spectroscopy in the 1- to 5-micron region is required.
Life Investigations
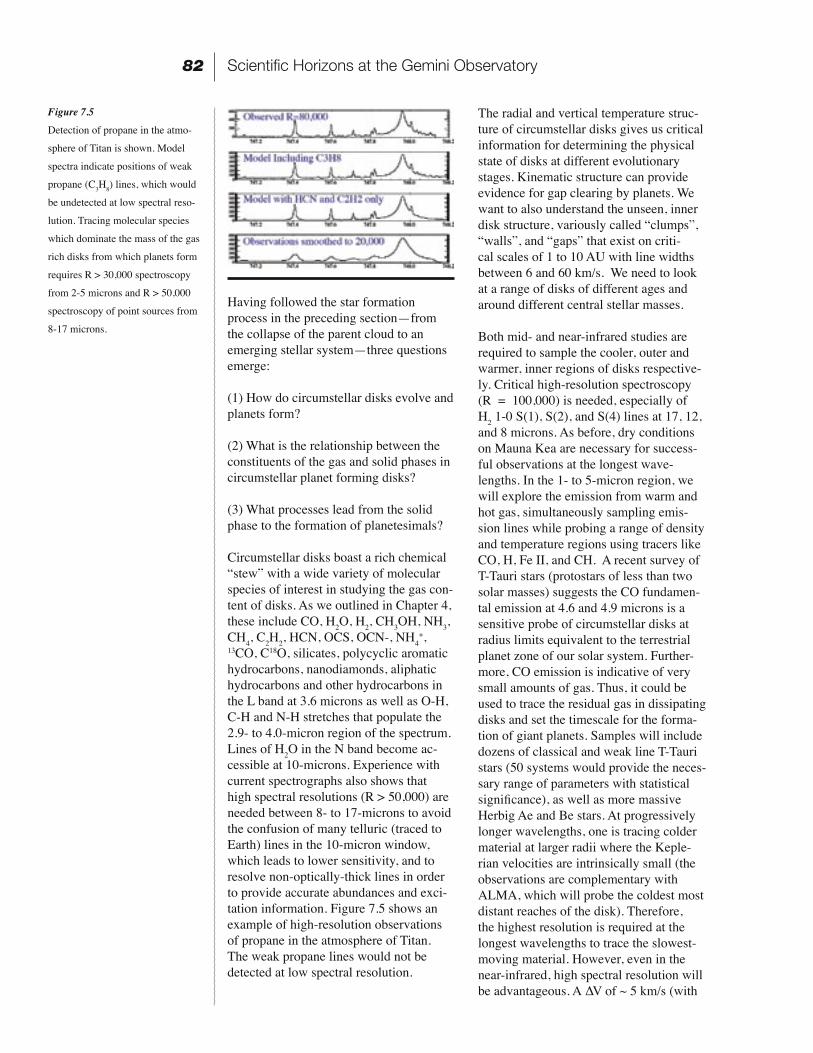
Scientific Horizons at the Gemini Observatory82
Having followed the star formation process in the preceding section—from the collapse of the parent cloud to an emerging stellar system—three questions emerge:
(1) How do circumstellar disks evolve and planets form?
(2) What is the relationship between the constituents of the gas and solid phases in circumstellar planet forming disks?
(3) What processes lead from the solid phase to the formation of planetesimals?
Circumstellar disks boast a rich chemical “stew” with a wide variety of molecular species of interest in studying the gas con-tent of disks. As we outlined in Chapter 4, these include CO, H2O, H2, CH3OH, NH3, CH4, C2H2, HCN, OCS, OCN-, NH4
+, 13CO, C18O, silicates, polycyclic aromatic hydrocarbons, nanodiamonds, aliphatic hydrocarbons and other hydrocarbons in the L band at 3.6 microns as well as O-H, C-H and N-H stretches that populate the 2.9- to 4.0-micron region of the spectrum. Lines of H2O in the N band become ac-cessible at 10-microns. Experience with current spectrographs also shows that high spectral resolutions (R > 50,000) are needed between 8- to 17-microns to avoid the confusion of many telluric (traced to Earth) lines in the 10-micron window, which leads to lower sensitivity, and to resolve non-optically-thick lines in order to provide accurate abundances and exci-tation information. Figure 7.5 shows an example of high-resolution observations of propane in the atmosphere of Titan. The weak propane lines would not be detected at low spectral resolution.
Figure 7.5
Detection of propane in the atmo-
sphere of Titan is shown. Model
spectra indicate positions of weak
propane (C3H8) lines, which would
be undetected at low spectral reso-
lution. Tracing molecular species
which dominate the mass of the gas
rich disks from which planets form
requires R > 30,000 spectroscopy
from 2-5 microns and R > 50,000
spectroscopy of point sources from
8-17 microns.
The radial and vertical temperature struc-ture of circumstellar disks gives us critical information for determining the physical state of disks at different evolutionary stages. Kinematic structure can provide evidence for gap clearing by planets. We want to also understand the unseen, inner disk structure, variously called “clumps”, “walls”, and “gaps” that exist on criti-cal scales of 1 to 10 AU with line widths between 6 and 60 km/s. We need to look at a range of disks of different ages and around different central stellar masses.
Both mid- and near-infrared studies are required to sample the cooler, outer and warmer, inner regions of disks respective-ly. Critical high-resolution spectroscopy (R = 100,000) is needed, especially of H2 1-0 S(1), S(2), and S(4) lines at 17, 12, and 8 microns. As before, dry conditions on Mauna Kea are necessary for success-ful observations at the longest wave-lengths. In the 1- to 5-micron region, we will explore the emission from warm and hot gas, simultaneously sampling emis-sion lines while probing a range of density and temperature regions using tracers like CO, H, Fe II, and CH. A recent survey of T-Tauri stars (protostars of less than two solar masses) suggests the CO fundamen-tal emission at 4.6 and 4.9 microns is a sensitive probe of circumstellar disks at radius limits equivalent to the terrestrial planet zone of our solar system. Further-more, CO emission is indicative of very small amounts of gas. Thus, it could be used to trace the residual gas in dissipating disks and set the timescale for the forma-tion of giant planets. Samples will include dozens of classical and weak line T-Tauri stars (50 systems would provide the neces-sary range of parameters with statistical significance), as well as more massive Herbig Ae and Be stars. At progressively longer wavelengths, one is tracing colder material at larger radii where the Keple-rian velocities are intrinsically small (the observations are complementary with ALMA, which will probe the coldest most distant reaches of the disk). Therefore, the highest resolution is required at the longest wavelengths to trace the slowest-moving material. However, even in the near-infrared, high spectral resolution will be advantageous. A ∆V of ~ 5 km/s (with
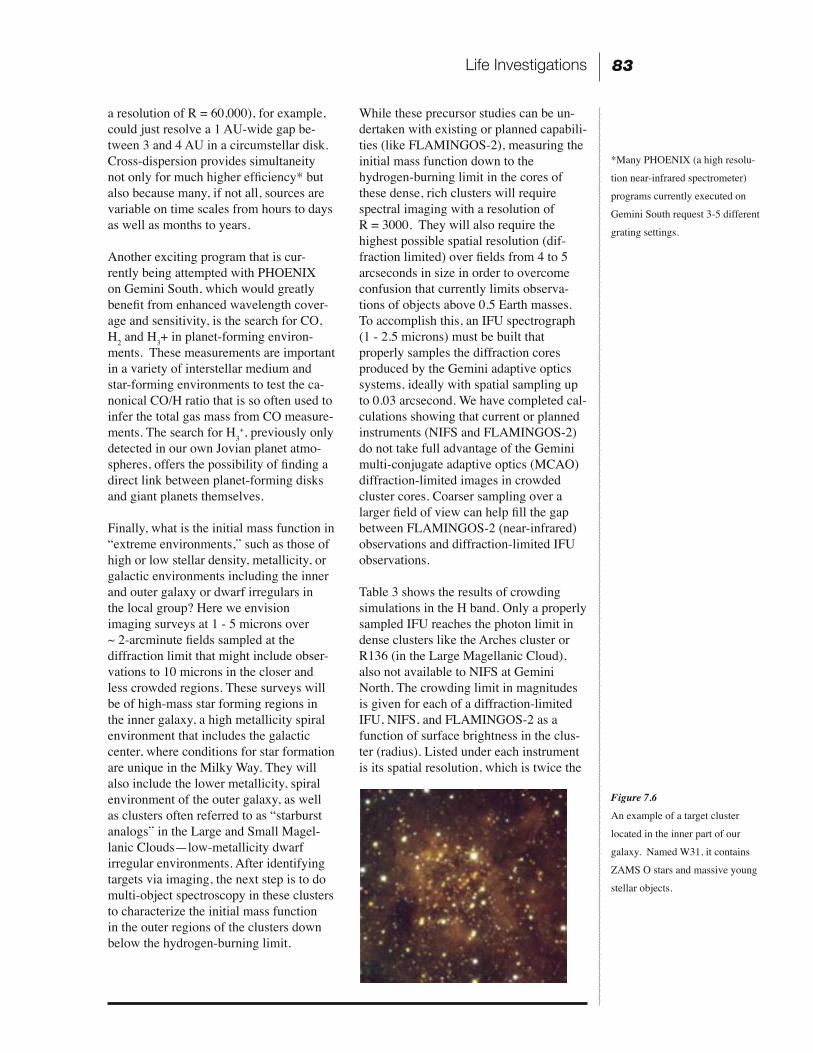
A Vision of Discovery 83
a resolution of R = 60,000), for example, could just resolve a 1 AU-wide gap be-tween 3 and 4 AU in a circumstellar disk. Cross-dispersion provides simultaneity not only for much higher efficiency* but also because many, if not all, sources are variable on time scales from hours to days as well as months to years.
Another exciting program that is cur-rently being attempted with PHOENIX on Gemini South, which would greatly benefit from enhanced wavelength cover-age and sensitivity, is the search for CO, H2 and H3+ in planet-forming environ-ments. These measurements are important in a variety of interstellar medium and star-forming environments to test the ca-nonical CO/H ratio that is so often used to infer the total gas mass from CO measure-ments. The search for H3
+, previously only detected in our own Jovian planet atmo-spheres, offers the possibility of finding a direct link between planet-forming disks and giant planets themselves.
Finally, what is the initial mass function in “extreme environments,” such as those of high or low stellar density, metallicity, or galactic environments including the inner and outer galaxy or dwarf irregulars in the local group? Here we envision imaging surveys at 1 - 5 microns over ~ 2-arcminute fields sampled at the diffraction limit that might include obser-vations to 10 microns in the closer and less crowded regions. These surveys will be of high-mass star forming regions in the inner galaxy, a high metallicity spiral environment that includes the galactic center, where conditions for star formation are unique in the Milky Way. They will also include the lower metallicity, spiral environment of the outer galaxy, as well as clusters often referred to as “starburst analogs” in the Large and Small Magel-lanic Clouds—low-metallicity dwarf irregular environments. After identifying targets via imaging, the next step is to do multi-object spectroscopy in these clusters to characterize the initial mass function in the outer regions of the clusters down below the hydrogen-burning limit.
While these precursor studies can be un-dertaken with existing or planned capabili-ties (like FLAMINGOS-2), measuring the initial mass function down to the hydrogen-burning limit in the cores of these dense, rich clusters will require spectral imaging with a resolution of R = 3000. They will also require the highest possible spatial resolution (dif-fraction limited) over fields from 4 to 5 arcseconds in size in order to overcome confusion that currently limits observa-tions of objects above 0.5 Earth masses. To accomplish this, an IFU spectrograph (1 - 2.5 microns) must be built that properly samples the diffraction cores produced by the Gemini adaptive optics systems, ideally with spatial sampling up to 0.03 arcsecond. We have completed cal-culations showing that current or planned instruments (NIFS and FLAMINGOS-2) do not take full advantage of the Gemini multi-conjugate adaptive optics (MCAO) diffraction-limited images in crowded cluster cores. Coarser sampling over a larger field of view can help fill the gap between FLAMINGOS-2 (near-infrared) observations and diffraction-limited IFU observations.
Table 3 shows the results of crowding simulations in the H band. Only a properly sampled IFU reaches the photon limit in dense clusters like the Arches cluster or R136 (in the Large Magellanic Cloud), also not available to NIFS at Gemini North. The crowding limit in magnitudes is given for each of a diffraction-limited IFU, NIFS, and FLAMINGOS-2 as a function of surface brightness in the clus-ter (radius). Listed under each instrument is its spatial resolution, which is twice the
Figure 7.6
An example of a target cluster
located in the inner part of our
galaxy. Named W31, it contains
ZAMS O stars and massive young
stellar objects.
*Many PHOENIX (a high resolu-
tion near-infrared spectrometer)
programs currently executed on
Gemini South request 3-5 different
grating settings.
Life Investigations

Scientific Horizons at the Gemini Observatory84
angular sampling (arseconds per pixel). These high-angular resolution studies will allow us to explore the detailed process of high-mass star formation in the context of massive stellar clusters for the first time. By observing a large sample of clusters, including the youngest ones (less than one million years old), we will be able to de-termine where stars of a given mass form as a function of position in the cluster. This will provide clues to whether or not processes, such as mergers, are important in the formation of the most massive stars.
A complementary but essential study to the initial mass function investigation outlined above is the determination of the companion mass ratio distribution (CMRD). Little is known across a range of cluster environments about how the cluster members are grouped in terms of multiplicity. What is the distribution of multiple systems in young clusters? What is the distribution of multiple star separations and their mass ratios? Nearby clusters covering several arcminutes on
the sky can be studied at high spectral resolution (R = 30,000) and in multi-ob-ject mode to deduce these distributions. Mass ratios can be determined through observations of radial velocities and high-angular resolution imaging with MCAO can provide separation distributions. The required instrument capabilities are the same as those outlined in more detail in the investigation of accretion disks.
Table 3
Model crowding limits are listed
for a pair of canonical massive star
formation regions under various
sampling assumptions, including
a diffraction-limited IFU and the
sampling offered by NIFS/GNIRS
and FLAMINGOS-2. PL = Photon
Limited.
A Vision of Discovery 85
Key Question
• How do stars process elements into the chemical building blocks of life?
New Capabilities Required:
High-Resolution Near-Infrared Spectrometer*
High-Resolution Mid-Infrared Spectrometer*
MCAO-Fed Near-Infrared MOS*
Adaptive Optics-Fed Near-Infrared Spectrometer*
High-Resolution Optical Spectrometer• Wavelength range: 0.3 - 1.0 µm• Spatial resolution: ~ 1” sampling on sky• Spectral resolution: 50,000• 1-shot λ Coverage: 0.3 - 1.0 µm• Field of view: ~ 1” image slicer• Multiplex: 1 object• Other: X-dispersed spectrometer; UV is priority
We begin our search for answers with the interstellar medium (ISM) and asked two fundamental questions about it. First, what is its current physical state includ-ing temperature, density, ionization, and magnetic field strength? Second, what is the detailed composition of the interstel-lar medium from which stars, planets, and life emerges in both gaseous and solid phases? The goal here is to probe atomic and molecular abundances through electronic transitions in the visible and kinematics of the cold diffuse ISM. In ad-dition, vibrational transitions of important molecules (CO, H2O, H2, CH3OH, etc.) observed along the line-of-sight toward background field stars shining through denser material would provide estimates of the column density of absorbers and constraints on the physical state of the gas phase enabling abundance estimates. These latter observations require high-resolution capabilities at R > 30,000 optimized for the 2- to 5-micron spectral region and R ~ 100,000 optimized for the
Summary of Observations8- to 17-micron region for point source spectroscopy.
How do stars cycle material, momentum, and energy into the interstellar medium? Answering this question requires several capabilities well suited to the excellent image quality delivered by the Gemini telescopes. First, we need a wide-field view (greater than 10 arcminutes across); second, the images must be seeing-lim-ited or preferably, enhanced seeing, such as with a ground layer adaptive optics (GLAO) system; third, emission line im-aging (R = 10,000 from 0.8- to 5-microns) must be possible of regions where stellar outflows from a variety of stellar objects and remnants (young stars, evolved stars, and supernova) are interacting with the surrounding interstellar medium. A wide field of view on an 8-meter telescope will allow astronomers to find numerous fainter targets (Figure 7.7) as well. Ex-tending the spectral coverage to 5 µm will make the diagnostic lines, such as Br∝
*All with the same requirements as
those listed under previous sections
Life Investigations
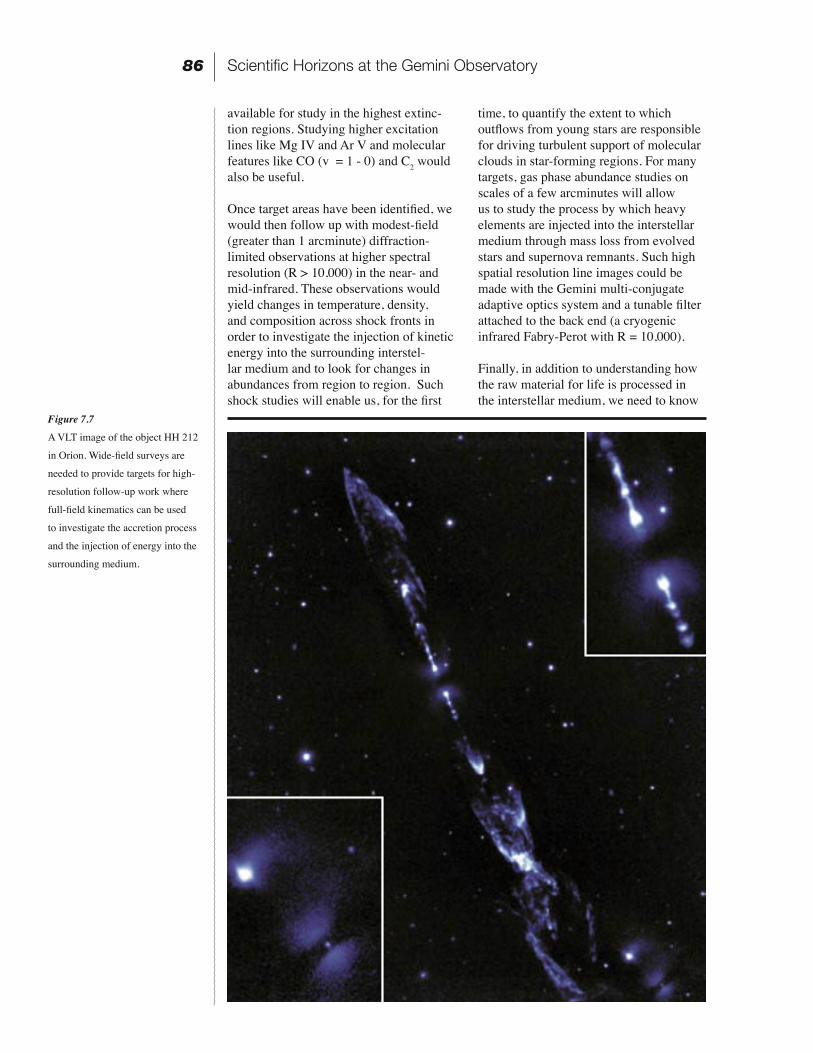
Scientific Horizons at the Gemini Observatory86
available for study in the highest extinc-tion regions. Studying higher excitation lines like Mg IV and Ar V and molecular features like CO (v = 1 - 0) and C2 would also be useful.
Once target areas have been identified, we would then follow up with modest-field (greater than 1 arcminute) diffraction-limited observations at higher spectral resolution (R > 10,000) in the near- and mid-infrared. These observations would yield changes in temperature, density, and composition across shock fronts in order to investigate the injection of kinetic energy into the surrounding interstel-lar medium and to look for changes in abundances from region to region. Such shock studies will enable us, for the first
Figure 7.7
A VLT image of the object HH 212
in Orion. Wide-field surveys are
needed to provide targets for high-
resolution follow-up work where
full-field kinematics can be used
to investigate the accretion process
and the injection of energy into the
surrounding medium.
time, to quantify the extent to which outflows from young stars are responsible for driving turbulent support of molecular clouds in star-forming regions. For many targets, gas phase abundance studies on scales of a few arcminutes will allow us to study the process by which heavy elements are injected into the interstellar medium through mass loss from evolved stars and supernova remnants. Such high spatial resolution line images could be made with the Gemini multi-conjugate adaptive optics system and a tunable filter attached to the back end (a cryogenic infrared Fabry-Perot with R = 10,000).
Finally, in addition to understanding how the raw material for life is processed in the interstellar medium, we need to know
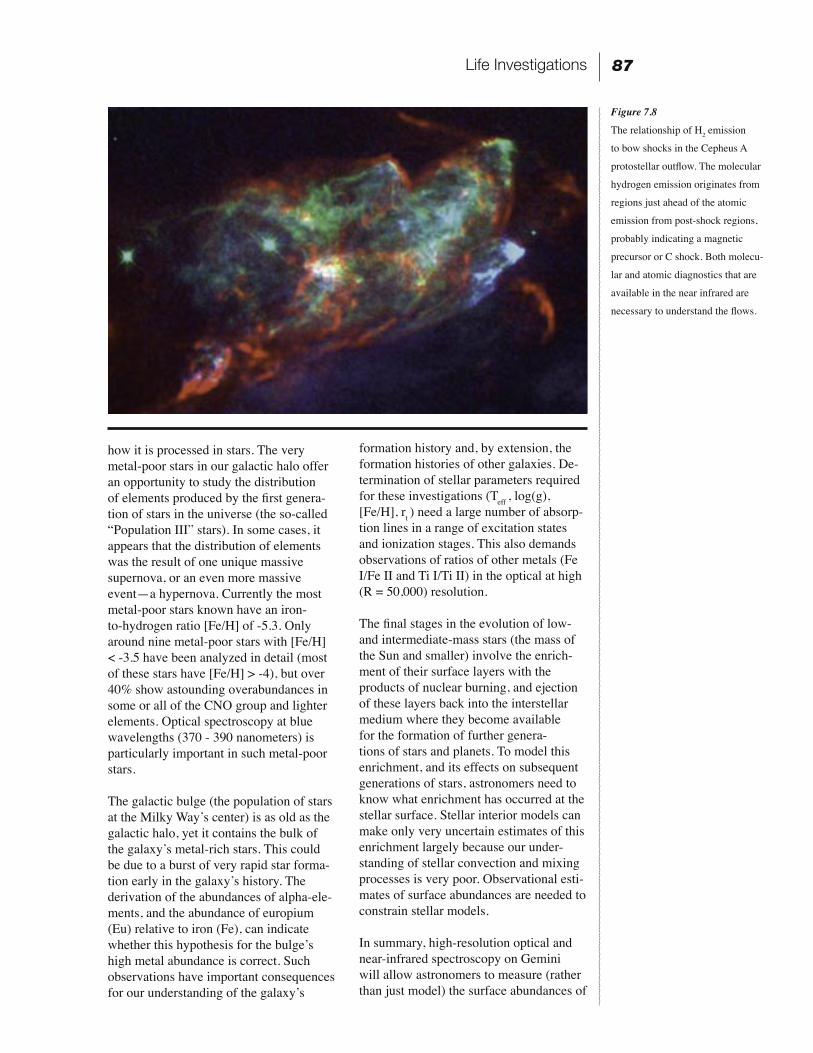
A Vision of Discovery 87
Figure 7.8
The relationship of H2 emission
to bow shocks in the Cepheus A
protostellar outflow. The molecular
hydrogen emission originates from
regions just ahead of the atomic
emission from post-shock regions,
probably indicating a magnetic
precursor or C shock. Both molecu-
lar and atomic diagnostics that are
available in the near infrared are
necessary to understand the flows.
how it is processed in stars. The very metal-poor stars in our galactic halo offer an opportunity to study the distribution of elements produced by the first genera-tion of stars in the universe (the so-called “Population III” stars). In some cases, it appears that the distribution of elements was the result of one unique massive supernova, or an even more massive event—a hypernova. Currently the most metal-poor stars known have an iron-to-hydrogen ratio [Fe/H] of -5.3. Only around nine metal-poor stars with [Fe/H] < -3.5 have been analyzed in detail (most of these stars have [Fe/H] > -4), but over 40% show astounding overabundances in some or all of the CNO group and lighter elements. Optical spectroscopy at blue wavelengths (370 - 390 nanometers) is particularly important in such metal-poor stars.
The galactic bulge (the population of stars at the Milky Wayʼs center) is as old as the galactic halo, yet it contains the bulk of the galaxyʼs metal-rich stars. This could be due to a burst of very rapid star forma-tion early in the galaxyʼs history. The derivation of the abundances of alpha-ele-ments, and the abundance of europium (Eu) relative to iron (Fe), can indicate whether this hypothesis for the bulgeʼs high metal abundance is correct. Such observations have important consequences for our understanding of the galaxyʼs
formation history and, by extension, the formation histories of other galaxies. De-termination of stellar parameters required for these investigations (Teff , log(g), [Fe/H], rt ) need a large number of absorp-tion lines in a range of excitation states and ionization stages. This also demands observations of ratios of other metals (Fe I/Fe II and Ti I/Ti II) in the optical at high (R = 50,000) resolution.
The final stages in the evolution of low- and intermediate-mass stars (the mass of the Sun and smaller) involve the enrich-ment of their surface layers with the products of nuclear burning, and ejection of these layers back into the interstellar medium where they become available for the formation of further genera-tions of stars and planets. To model this enrichment, and its effects on subsequent generations of stars, astronomers need to know what enrichment has occurred at the stellar surface. Stellar interior models can make only very uncertain estimates of this enrichment largely because our under-standing of stellar convection and mixing processes is very poor. Observational esti-mates of surface abundances are needed to constrain stellar models.
In summary, high-resolution optical and near-infrared spectroscopy on Gemini will allow astronomers to measure (rather than just model) the surface abundances of
Life Investigations

Scientific Horizons at the Gemini Observatory88
these evolved stars in both the Milky Way and Local Group galaxies. This would permit the study of groups of stars at a common distance—enormously simpli-fying the analysis and interpretation of results, since measurements of different stars can be compared given their precise-ly known relative luminosities. Similarly, stars with different initial abundances (derived from the known metallicities of their parent galaxies) can also be read-
ily and precisely compared. A range of critical problems in the first, second and third dredge-up phases will be addressed, along with questions of hot bottom burn-ing. All of these processes impact the final elemental and/or isotopic abundance ratios of C, N, O, Li, Na, Mg, Al and s-process elements (particularly the heavier ones) which are returned to the interstellar me-dium, ready for the formation of new stars and planets.
A Vision of Discovery 89
Appendix I
Chapter 2: The Universe of Matter
Abel, T., Bryan, G., & Norman, M., 2000, ApJ, 540, 39
Baade, Ricerche Astronomiche, Vol. 5, Specola Vaticana, Proceedings of a Conference at Vatican Observatory, Castel Gandolfo, May 20-28, 1957, Amsterdam: North-Holland, and New York: Interscience, 1958, edited by D.J.K. OʼConnell., p.3
Bell, E., Baugh, C., Cole, S., Frenk, C. & Lacey, C., 2003, MNRAS, 342, 3676
Benson, A.J., Madau, P., 2003, MNRAS, 344, 835
Bridle S., Lahav, O., Ostriker, J. P. & Steinhardt, P., 2003, Science, 299, 1532
Brown et al., 2003, ApJL, 592, pp. L17-L20
Butcher, H.R., 1987, Nature, 328, 127
Christlieb, N., et al., 2002, Nature, 419, 904
Cole, S., Lacey, C., Baugh, C. & Frenk, C.F., 2000, MNRAS, 319, 168
Conselice, C., Gallagher, J. & Wyse, R., 2002, ApJ, 123, 2246
Dalcanton, J., & Bernstein, R., 2002, AJ, 124, 1328
Drinkwater et al., 2003, Nature, 423, pp. 519-521
Ferguson, A., Irwon, M., Ibata, R., Lewis, G., Tanvir, N., 2002, AJ, 124, 1452
Ferrarase, L. & Merritt, D. 2000, ApJL, 539, L9
Freeman, K.C. & Bland-Hawthorn, J., 2002, ARAA, 40, 478
Fry et al., 1999, AJ, 118, pp. 1209-1219
References
Appendix
Scientific Horizons at the Gemini Observatory90
Gebhart et al. 2003, ApJ, 583, 92
Heger, A. & Woosley, S., 2002, ApJ, 567, 532
Hernandez, X., Valls-Gabaud, D. & Gilmore, G., 2000, MNRAS, 316, 605
Magorrian, J., et al., 1998, AJ, 115, 2285
Majewski, S., Skrutskie, M., Weinberg, M. & Ostheimer, J., 2003, ApJ, 599, 1082
Mengel et al., 2002, A&A, 383, p.137-152
Moore, B. et al. 1999, MNRAS, 310, pp. 1147-1152 Moore, B., 2001, 20th Texas Symposium on relativistic astrophysics, Austin, Texas, 10-15 December 2000, Melville, NY: American Institute of Physics, 2001, xix, 938 p. AIP conference proceedings, Vol. 586. Edited by J. Craig Wheeler and Hugo Martel. ISBN 0735400261, p.73
Mould, J. & Kristian, J., 1986, ApJ, 305, 591
Odenkirchen et al., 2003, AJ, 126, pp. 2385-2407
Ramirez et al., 2000, AJ, 537, pp. 205-220
Reitzel, D. & Guhathakurta, P., 2002, AJ, 124, 234
Sandage, A., Lubin, L. & VandenBerg, D., 2003, PASP, 115, 1187
Schatz, H., et al., 2002, ApJ, 579, 626
Spergel, D.N., et al., 2003, ApJS, 148, 175
Tolstoy, E. et al., 2003, AJ, 125, 707
Unavane, M., Wyse, R.F.G. & Gilmore, G., 1996, MNRAS, 278, 727
Wheeler, J.C., Sneden C. & Truran, J., 1989, ARAA, 27, 279
Wilkinson, M., Kleyna, J., Evans, N., Gilmore, G., 2002, MNRAS 330, 778
Wyse, R.F.G., Gilmore, G. & Franx, M., 1997, ARAA, 35, 637
A Vision of Discovery 91
Chapter 3: The Universe of Energy
Bromm V. & Larson R., 2004, ARAA, 42, pp. 1-38
Abel et al., 2000, ApJ, 540, pp. 39-44
Abel et al. 2002, Science, 295, pp. 93-98
Haiman, Rees, & Loeb, 1996, ApJ, 467, p.522
Haiman, Abel, & Rees, 2000, ApJ, 534, pp. 11-24
Nakamura, F. & Umemura, M. 2001, ApJ, 548, pp. 19-32
Blake, C., & Glazebrook, K., 2003, ApJ, 594, pp. 665-673
Chapter 4: The Universe of Life
Luhman, K. L., & Jayawardhana, R., 2001, AAS, 33, 8141
Macintosh et al., 2003, AAS, DPS meeting #35, 07.07
Mamajek, E., Meyer, M. Macintosh, B., Graham, J., et al., 2003, AAS, DPS, 335, 07.07
Walborn et al., 2002, AJ, 124, pp. 1601-1624
Chapter 5: Universe of Matter Investigations
Gilmore et al., 1989, ARAA, 27, pp. 555-627
Smith, V., from “Future Instrumentation for the Gemini 8 m Telescopes: US Perspectives in 2003”, held 30-31 May 2003, Tempe, AZ., page 19
Chapter 6: Universe of Energy Investigations
Becker, et al., 2001, AJ, 122, pp. 2850-2857
Bouwens, et al., 2003, ApJ, 595, pp. 589-602
Fernandez-Soto, et al., 2003, MNRAS, 342, pp. 1215-1221
Appendix
Scientific Horizons at the Gemini Observatory92
Hu, et al., 2002, ApJ, 568, pp. L75-L79
Kodaira, et al., 2003, Publications of the Astronomical Society of Japan, 55, pp. L17-L21
Loeb, A. and Rybicki,G. B., 1999, ApJ, 524, pp. 527-535
Molhotra, S., and Rhoads, J. E., 2002, ApJL, 565, pp. L71-L74
Rhoads, et al., 2003, AJ, 125, pp. 1006-1013
Steidel, et al., 2001, ApJ, 546, pp. 665-671
Yan, et al., 2003, ApJL, 585, pp. L93-L96
Chapter 7: Universe of Life Investigations
Blum, R.D., Damineli, A., & Conti, P.S., 2001, AJ, 121, 3149
Bonnell et al., 1998, MNRAS, 299, pp. 1013-1018
Brittain & Rettig, 2002, Nature, 418, pp 57-59
Carpenter, J., Snell, R., Schloerb, F., Skrutskie, M., 1993 ApJ, 407, 657
Carr, J. S., 1989, ApJL, 345, 522
Carr, J.S., Tokunaga, A.T., Najita, J., Shu, F.H., & Glassgold, A.E., 1993, ApJ, 411, L37
Chandler, C.J., Carlstrom, J.E., & Scoville, N.Z., 1995, ApJ, 446, 793
Gibb, E. L., et al., 2000, ApJ, 536, 347
Gilmore, G., Wyse, R., Kuijken, K., 1989, ARAA, 27, pp 555-627
Hartigan, P., Morse, J., & Bally, J., 2000, AJ, 120, 1436
Hinkle et al., 2003, from “Future Instrumentation for the Gemini 8 m Telescopes: US Perspectives in 2003”, held 30-31 May 2003, Tempe, AZ
Hodapp, K., 1994, ApJS, 94, 615
Hubbard, et al., 2002, ARAA, 40, pp 103 -136

A Vision of Discovery 93
Kroupa, et al., 1991, MNRAS, 251, pp 293—302
Lada et al., 1991, ApJ, 374, 533
Lada et al., 1993, ApJ, 408, 471
Mamajek, et al., 2002, AJ, 124, pp. 1670-1694
Marcy, G. and Butler, P., 2000, PASP, 112, pp. 137-140
Muzerolle et al., 1998, AJ, 116, pp 445-468
Najita, J., Carr, J.S., & Mathieu, R.D., 2003, ApJ, 589, 931
Najita, J., Carr, J.S., Glassgold, A.E., Shu, F.H., & Tokunaga, A.T., 1996, ApJ, 462, 919
Najita, J., Carr, J.S., & Tokunaga, A.T., 1996, ApJ, 456, 292
Olsen, K. A.G., Blum, R. D., & Rigaut, F., 2003, AJ, 126, 452
Oppenheimer, B. R.; Kulkarni, S. R.; Matthews, K.; van Kerkwijk, M. H., 1998, ApJ, 502, 932
Roe, H. G., Greathouse, T. K., Richter, M. J., and Lacy, J. H., 2003, ApJL, 597, L65-L68
Wichmann, et al., 2003, A&A, 399, p.983-994
Yorke, H.W. & Bodenheimer, P., 1999, ApJ, 525, 330
Zinnecker et al., 1997, Low Mass Star Formation—from Infall to Outflow, Poster proceedings of IAU Symposium No. 182 on Herbig-Haro Objects and the Birth of Low Mass Stars. 20-24 January 1997, Chamonix, France, Edited by F. Malbet and A. Castets, p. 198
Appendix
A Vision of Discovery 95
Appendix II
Preface
Earth from Mars: NASA/JPLAspen Meeting group photo and meeting photo: Gemini Observatory
Chapter 1
1.1-1.10: Gemini Observatory
Chapter 2
2.1-.2.2: Wilkinson Microwave Anisotropy Probe, NASA/WMAP Imaging Team2.3: Gemini Observatory2.4: NASA, N. Benitez (JHU), T. Broadhurst (The Hebrew University), H. Ford (JHU), M. Clampin (STScI), G. Hartig (STScI), G. Illingworth (UCO/Lick Observatory), the ACS Science Team, ESA2.5: Adapted from Wyse, Gilmore and Franx, 1997, ARAA *2.6: R. Wyse2.7: Space Telescope Science Institute (STScI) 2.8: B. Moore, et al., 2001. *2.9: Majewski, et al., 2003 *2.10: Ferguson, et al., 2002 *2.11: Odenkirchen, et al., 2003 *2.12: Tolstoy, et al., 2003 *2.13: Gemini Observatory
Chapter 3
3.1: a-d courtesy of Roberto Abraham3.2: (top) NASA/WMAP Imaging Team, (bottom) W. Sutherland, Oxford University3.3: Blake and Glazebrook, 2003 *3.4: Barkana, R., Loeb, A.
Chapter 4
4.1: Particle Physics and Astronomy Research Council [PPARC]4.2: courtesy R. Abraham4.3: Macintosh, et al., (2003)* 4.4: STScI/NASA4.5: STScI/NASA
Image Credits
Appendix
Scientific Horizons at the Gemini Observatory96
Chapter 5
5.1: Smith, V.
Chapter 6
6.1: courtesy R. Abraham6.2: Gillespie, E.B., Dave, R., Smith, J-D., Papovich, C., Katz., Weinberg, D.6.3: Lacey, C., Morris, S.
Chapter 7
7.1,7.3: Doyon, R7.2: Oppenheimer, et al.. (1998)*7.4: Gibbs, et al., (2000); Yorke and Bodenheimer (1999)*7.5: Roe, et al., (2003)* 7.6: STScI/NASA7.7: Very Large Telescope/ESO7.8: Hartigan, et al., (2000)*
* see references

A Vision of Discovery 97
Appendix III
Bob Abraham (CA); [email protected] Alfonso Aragon (UK); [email protected] Armandroff (US); [email protected] Aspin (Gemini); [email protected] Bally (US); [email protected] Barbuy (BR); [email protected] Barger (US); [email protected] Beck (Gemini); [email protected] Tim Bedding (AU); [email protected] Beletic (Keck); [email protected]ʻi.eduMatthew Bershady (US); [email protected] Blum (US); [email protected] Boyle (AU); [email protected] Jean Brodie (US); [email protected] Bunker (UK); [email protected] Campusano (Chile); [email protected] Carney (US); [email protected] Rodrigo Carrasco (Gemini); [email protected] Chapman (US); [email protected] Clark (UK); [email protected] Laird Close (US); [email protected] Couch (Australia); [email protected] Dennis Crabtree (CA); [email protected] Crampton (CA); [email protected] de Grijs (UK); [email protected] Rene Doyon (CA); [email protected] Driscoll (Gemini); [email protected] Fisher; [email protected] Fitzsimmons (UK); [email protected] Eileen Friel (NSF); [email protected] Tom Geballe (Gemini); [email protected] Gebhardt (US); [email protected] Gibson (AU); [email protected] Gillespie (US); [email protected] Karl Glazebrook (US); [email protected] Graham (US); [email protected] Gray (Gemini); [email protected] Hawley (US); [email protected] Hayward (Gemini); [email protected] Heckman (US); [email protected]
Participants
Appendix
Scientific Horizons at the Gemini Observatory98
Terry Herter (US); [email protected] Hook (UK); [email protected] Ivison (UK); ); [email protected] Jaffe (US); [email protected] Jensen (Gemini); [email protected] Johnstone (CA); [email protected]. J. Kavelaars (CA); [email protected] Marc Kuchner (US); [email protected] Tom Marsh (UK); [email protected] Mather (US); [email protected] McCarthy (US); [email protected] Meyer (US); [email protected] Peter Michaud; [email protected] Miller (Gemini); [email protected] Morris (UK); [email protected] Mould (US); [email protected] Matt Mountain (Gemini); [email protected] Oppenheimer (US); [email protected] Paterson (UK); [email protected] Puxley (Gemini); [email protected] Richer (CA); [email protected] Rigaut (Gemini); [email protected] Roche (UK); [email protected] Rodgers (Gemini); [email protected] Roth (Gemini); [email protected] Roy (Gemini); [email protected] Russell (UK); [email protected] Ryder (AU); [email protected] Schmidt (AU); [email protected] Sellgren (US); [email protected] Ray Sharples (UK); [email protected] Simon (US); [email protected] Doug Simons (Gemini); [email protected] Smith (US); [email protected] Smith (AURA); [email protected] Laerte Sodre (Br); [email protected] Stauffer (US); [email protected]‡ [email protected] Steidel (US); [email protected] Strauss (US); [email protected] Strom (US); [email protected] Taylor (US); [email protected] Telesco (US); [email protected] Tinney (AU); [email protected] Valenti (US); [email protected] Vincent (UK); [email protected] van Citters (NSF); [email protected] Ward-Thompson (UK); [email protected] Welch (CA); [email protected] Woodward (US); [email protected] Rosie Wyse (US); [email protected]

This book opens with a brief exploration of
the cosmos called A Universe of Discovery.
It is a sort of “executive summary”–a brief,
introductory peek at the fascinating science
topics astronomers are exploring. We also
present an introduction to Geminiʼs
advanced visible and infrared
capabilities and recommendations for
expanding the current instrumentation.
In Part I we divide the universe into three
realms: matter, energy, and life, and present
more detailed science discussions of the key
questions facing astronomers in those areas.
Part II of the book is devoted to detailed
discussions of the new capabilities and
observations the Gemini community
identified through the “Aspen process”
as being the most useful in helping
answer astronomyʼs key questions.
The Gemini Observatory is an
international partnership managed by
the Association of Universities for
Research in Astronomy under a
cooperative agreement with the
National Science Foundation.