exploring commodity trading activity: an …economicanalysis/documents/file/...exploring commodity...
TRANSCRIPT
1
Exploring Commodity Trading Activity: An Integrated Analysis of Swaps and Futures
Scott Mixon, Esen Onur, and Lynn Riggs1
November 2016 This paper presents an analysis of new, regulatory data on commodity swaps, focused on West Texas Intermediate (WTI) crude oil. We find that commercial end‐users have a much larger footprint in the WTI swaps space than financial end‐users do. Commercials have a much larger exposure in swaps than in futures and are net short in both markets. Financial end‐users are smaller in swaps than in futures and are net long in both markets. Swap Dealers perform a substantial amount of intermediation among WTI longs, WTI shorts, and index investors; consequently, net dealer exposure to hedge in futures markets is far less than the gross swap exposure. Key words: swaps market, futures market, WTI crude derivatives JEL Codes: G13, L71, Q41
1Office of the Chief Economist, Commodity Futures Trading Commission, 1155 21st Street, N.W., Washington, D.C. 20581. Scott Mixon: [email protected], (202) 418‐5771; Esen Onur: [email protected], (202) 418‐6146, Lynn Riggs: [email protected], (202) 418‐5938. We thank seminar participants at the CFTC and at the 2016 NCCC‐134 Conference on Applied Commodity Price Analysis, Forecasting, and Market Risk Management for helpful comments. We also thank two anonymous referees for suggestions that substantially improved the paper. The research presented in this paper was authored by Scott Mixon, Esen Onur, and Lynn Riggs, CFTC employees who wrote this paper in their official capacities with the CFTC. The Office of the Chief Economist and CFTC economists produce original research on a broad range of topics relevant to the CFTC’s mandate to regulate commodity future markets, commodity options markets, and the expanded mandate to regulate the swaps markets pursuant to the Dodd‐Frank Wall Street Reform and Consumer Protection Act. These papers are often presented at conferences and many of these papers are later published by peer‐review and other scholarly outlets. The analyses and conclusions expressed in this paper are those of the author and do not reflect the views of other members of the Office of Chief Economist, other CFTC staff, or the CFTC itself.

2
1. Introduction
This paper presents the first public analysis of a new commodity swap data set collected by the Commodity Futures Trading Commission (CFTC). Aside from anecdotal or piecemeal evidence, little is known about the size or structure of over‐the‐counter (OTC) commodity swap markets, and quantitative evidence detailing the connections between trading activity in commodity swap and futures markets is scant.2 A key problem is that the OTC swap market was opaque until 2013, when public reporting began for swaps transactions under the jurisdiction of the CFTC. This new regulatory data set is comprised of daily observations, reported by swap dealers, on both commodity index and commodity‐specific swap transactions, providing unprecedented visibility into swap market activities. 3
Researchers have been hindered by the lack of direct evidence on swap activity. For example, many studies have attempted to measure the impact that index investment might have on commodity markets (see, e.g., the discussion in Cheng and Xiong (2014)), but a significant amount of the investment flow into commodity markets is transacted via swaps. In the absence of relevant swap data, researchers resorted to various workarounds. We briefly summarize the various methods used in order to highlight the gap filled by these new data.
Trader‐level futures and options positions underlying the CFTC’s traditional Commitments of Traders (COT) report have been used in several ways to infer index and swaps activity. For example, the CFTC’s weekly Commodity Index Trader (CIT) report aggregates agricultural futures positions held by entities designated as CITs. Cheng, Kirilenko, and Xiong (2015) use CIT data to examine the impact of financial investment in agricultural commodities. The CFTC’s Disaggregated COT (DCOT) report provides aggregated positions of swap dealers, and these data have similarly been used to relate trading activity to prices (e.g., Büyükşahin and Harris (2011)). Because a swap dealer would net the swap positions on its trading book (including hedger positions as well as index positions) before hedging the net exposure in the futures market, the netted futures position for such a firm is a noisy proxy for index or swap activity.
This “netting problem” is particularly acute in non‐agricultural products, such as energy, which has a substantial weight in popular commodity indexes. Therefore, the CFTC limited the CIT report to agricultural commodities. Nonetheless, researchers have used CIT data to examine the impact of index investment on non‐agricultural commodities. For example, Singleton (2014)
2 Commodity swaps are primarily traded bilaterally OTC as opposed to futures contracts, which are exchange traded. 3 Part 20 of the CFTC’s regulations codify large trader reporting rules for physical commodity swaps. The rules require daily reports from clearing members and swap dealers related to their activity in certain swaps (see Section 3 for details). Clearing members began full daily reporting on July 2, 2012, and swap dealers began their daily reporting on March 1, 2013. Clearing members and swap dealers report the paired swap positions of their own principal accounts, as well as those of their direct legal counterparties, when such positions become reportable, (even for inter‐affiliate transactions, if the affiliates are separate legal entities from the reporting entity). Paired swap positions must be reported as futures‐equivalent positions (i.e., in terms of the futures contract to which the swap is considered paired).

3
uses CIT data on agricultural positions to impute unobserved index positions in crude oil. However, imputation may provide a poor proxy for these unobserved positions: Sanders and Irwin (2013) discuss large estimation errors that can result from this practice. The CFTC also provided an Index Investment Data (IID) report that directly aggregated all index investment via swap or futures and did not suffer from the netting problem. Irwin and Sanders (2012) find that these data are the most accurate measure of commodity index investment among the publicly available CFTC data sets. However, this report was discontinued in October 2015.
Hamilton and Wu (2015) build a circumstantial case regarding the impact of commodity index investing on crude oil prices by relying on futures price data and an asset pricing model. Acharya, Lochstoer, and Ramadorai (2013) use quarterly report data from crude oil and natural gas producers to examine how financial market frictions impact commodity prices. The authors use CFTC COT futures data to proxy for hedging pressure, even though many of the firms they examine use swaps to hedge. Validation of these findings, based on direct evidence from swaps data, is a useful avenue of further research, given the indirect nature of the analyses.
Our paper is also related to the emerging empirical literature on swap markets, but the dominant focus has been on activity in swaps related to financial instruments. Duffie, Scheicher, and Vuillemey (2014), Getmansky, Girardi, and Lewis (2016), Loon and Zhong (2014, 2016), Schachar (2012), and Siriwardane (2015) study credit default swaps data. Benos, Payne, and Vasios (2016) examine interest rate swaps. Mixon and Onur (2015, 2017) compare activity in swap and futures markets for equity volatility products and equity index dividends, respectively. Peterson (2014) is the exception to the financial focus and gauges the size of agricultural swap markets.
The research presented in this paper is differentiated from the studies noted above, because we analyze direct evidence on commodity swap positions. Our data include both commodity‐specific swap positions and positions implicit in index swaps. The scope of these data is broader than previous data and includes positions (broken out separately) held by commercial end‐users, financial end‐users, and swap dealers. This is important because, as Working (1960) noted, gauging the relevance of positions carried by a trader type requires a comparison to (offsetting) positions carried by other trader types. With respect to the financialization literature described above, the discussion can be improved by knowing the positions of commercial hedgers, as well as the positions of index investors. Given the previous interest in the literature, we focus on West Texas Intermediate (WTI) crude oil exposure in the analysis.
We present a number of new findings. First, our results indicate that Commercial End‐Users have a much larger footprint in the WTI swaps space than Financial End‐Users do. We find that the net short position of Commercial End‐Users in swaps always exceeded the net long position of Financial End‐Users. Financials do not swamp commercials during our sample; in fact, it appears that Financial End‐User swap positions are not large enough to provide the liquidity demanded by commercials. Second, Commercial End‐Users have a much larger net exposure in swaps than in futures, whereas Financial End‐Users are smaller in swaps than in futures. This characterization further highlights the size of Commercial End‐User net positions in the previously opaque swaps space. Third, we note that Swap Dealers appear to have a very modest

4
net position in swaps (compared to their much larger gross position), which is negatively correlated with their futures exposure. This is suggestive of active management to neutralize exposures to WTI price changes.
The remainder of the paper is organized as follows. Section 2 provides background on commodity swap transactions and relates swaps to listed futures. Section 3 focuses on the size of commodity swaps markets, including a detailed description of the swaps data used in the analysis. Section 4 presents a detailed analysis of the WTI derivatives markets, covering the swap market as well as the related futures market. Section 5 presents discussion of the results.
2. What is a Commodity Swap?
Like most other swaps, a commodity swap is a legally binding agreement where two counterparties agree to ‘swap’ cash flows, for example, at regular intervals over a specified period (e.g., for one year). One of the cash flows (also known as legs) is based on a floating price that is tied to the price of a commodity, and the other cash flow, or leg, is usually based on an agreed upon fixed price. The floating price is determined using a specific price series. For example, many commodity swaps use the price of the main physical‐delivery futures contract as published by the exchange, but they can also use spot prices as published by a reporting agency (e.g., Platts). These cash flows are generally also based on a fixed amount of the commodity (e.g., 1 million barrels of oil) which is known as the notional. The specified period for the swap is generally known as the tenor of the swap.
The fact that a fixed price for a fixed amount of the commodity is exchanged for a fluctuating market price makes swaps an ideal instrument for hedging. For example, a producer who does not want to be exposed to fluctuating prices in the spot market can enter into a swap agreement where he receives the difference between the fixed price and the floating market price at pre‐specified intervals. In this sense, swaps can be seen as a sequence, or strip, of futures (Heckinger and Mengle (2013)).
One key difference between swaps and futures, however, is that futures are highly standardized contracts, while swaps can be customized to better hedge the price risk of the commodity for the counterparty. The standardized nature of futures contracts make them more amenable to being traded on an exchange; whereas, most commodity swaps are traded OTC. An end‐user wanting to use a swap to hedge will generally contact an intermediary, i.e. a swap dealer, to be a counterparty to the transaction. While the swap allows the end‐user to hedge price risk, that risk does not disappear but is transferred to the swap dealer. This kind of risk transfer can be crucial for the end‐user but also leaves the swap dealer with exposure to the price changes in the underlying commodity. To offset this risk, the swap dealer will generally look for a market that is liquid enough and correlated enough with the price of the underlying. For a commodity such as WTI light sweet crude oil, the most obvious market for swap dealers to offload risk is the NYMEX Light Sweet Crude Oil (WTI) futures market. Generally, while end‐users transfer price risk to the swap dealer using OTC swap contracts, swap dealers seek to offset

5
exposures using offsetting order flow (e.g., offset short exposure from a commodity producer with long exposure from a commodity user or a financial end‐user) or with listed futures.
There are more variations to commodity swaps than the ones described above. In some cases, commodity swaps can be settled using the price of more than one commodity (e.g., a swap with one floating leg that is long NYMEX WTI and one floating leg that is short Henry Hub Natural Gas). These are typically known as inter‐commodity swaps and settle against the difference, or spread, in these prices. Other swaps settle using the difference in price of the same commodity at different locations (e.g., the price of natural gas at Henry Hub versus the price of natural gas at Chicago Citygate). These are typically known as locational basis swaps. Other commodity swaps can also settle against an index of commodity prices (e.g., the S&P GSCI Commodity Index). The data used in this paper also include observations on these types of swaps. Moreover, we use the term “swap” in a way that is consistent with the regulatory terminology which includes derivative contracts with optionality (e.g., puts, calls, barrier options, etc.) that are traded OTC in addition to traditional swap contracts. This does not include options on futures that have been traditionally traded on futures exchanges.
There is widespread use of various commodity derivatives, including swaps, by commercial firms for hedging, with many firms taking advantage of the bespoke, customized nature of OTC swaps. This is confirmed by Acharya, et al. (2013), who examines quarterly reports from oil and gas producers and find that nearly 90% of the firms examined use derivatives to hedge. While nearly half of the firms in the sample use futures or forwards to hedge, over 80% of the firms use swaps and options, including collars, to hedge.
Specific examples of derivatives usage can be gleaned from public sources, such as annual reports. A representative description of one firm’s hedging activity in 2014 is the following: “The Company generally uses financial hedge instruments including fixed price swaps, purchased call options, and commonly used combinations using put and call options including collars (a sold put option combined with a purchased call option), three‐ways (a collar with a higher strike sold call option) and four‐way collars (a collar with a higher strike sold call option and a lower strike purchased put option). These hedge instruments are generally based on aircraft fuel or closely related commodities including diesel fuel and crude oil.”4 Another firm (a large commercial end‐user) reported in its 2014 annual report that the firm hedged fuel prices by entering into calendar strips of zero cost collars on Brent crude oil. The firm broke out the amount of crude hedged (in barrels) for future fiscal years and noted that “Fuel derivatives mature evenly over each month within the … fiscal periods”, suggesting that the derivatives structure incorporates Asian options.5 Based on these examples, it is clear that at least some commercial firms use complex derivative structures to meet their hedging needs.
4 United Continental Holdings, 2014 10‐K Annual Report, p. 52. 5 Carnival Cruise Lines, 2014 10‐K Annual Report, p. 33. Asian options exhibit payouts based on the average price over time of the underlying instrument, as opposed to the price observed at a given point in time.

6
Given the complexity of these different types of derivatives, aggregating them appropriately using similar terms is crucial. For example, it is a widely accepted practice to sum the delta‐adjusted open interest resulting from an option on a future with the futures open interest, and the delta‐adjusted open interest is often referred to as the “futures‐equivalent” open interest. This method is used by the CFTC in its COT report. In addition to the delta‐adjustment, the CFTC converts long‐call and short‐put open interest from options into long, ”futures‐equivalent” open interest, and vice versa.6 These conversions allow for disparate contracts to be measured in equivalent terms.
Commodity swap contracts can also be converted into the equivalent set of futures contracts. Essentially, the swap is decomposed into its component parts, and then each part is represented with measures of size, direction, and expiration equivalent to the main physical‐delivery futures contract for the commodity. In so doing, futures equivalent positions can be constructed that essentially represent the portfolio of futures contracts that would most closely provide the price exposure of that swap. These positions represent the futures contracts an entity would have to hold for similar economic exposure to the commodity (i.e., the hedge portfolio of futures held by the swap dealer). For example, if a swap contract for WTI crude oil expires in three years but has cash flows each month for the next three years, an entity would have to hold equivalent positions in the NYMEX WTI futures for each of the contract months over the next three years in order to replicate the swap. Therefore, this type of swap could be represented as 36 futures‐equivalent positions associated with each of the contract months over the next three years (i.e., 36 monthly values corresponding to the 36 payout dates).7 A graphical representation and a more detailed explanation of the concept of futures equivalence for swaps is available in Appendix A.
3. The Size of Commodity Swaps Markets
3.1. Physical Commodity Swaps Data
We primarily rely on the CFTC’s new regulatory data on OTC commodity swaps. Specifically, we use the CFTC’s Large Trader Reporting for Physical Commodity Swaps.8 Reporting entities (primarily comprised of swap dealers as defined by the CFTC’s regulations) submit daily position reports related to their activity in swaps that are paired to 46 physical commodity futures contracts (e.g., Chicago Board of Trade “CBOT” Corn, New York Mercantile Exchange “NYMEX” Crude Oil, Light Sweet). 9 Swaps are considered to be “paired” if the swap settles using
6 See the Commitment of Traders Explanatory Notes at http://www.cftc.gov/MarketReports/commitmentsofTraders/ExplanatoryNotes/index.htm. 7 The CFTC specifies standard methods for convert swaps into futures‐equivalent positions for reporting purposes in Large Trader Reporting for Physical Commodity Swaps: Division of Market Oversight Guidebook for Part 20 Reports at http://www.cftc.gov/idc/groups/public/@newsroom/documents/file/ltrguidebook062215.pdf. 8 More information about the CFTC’s Large Trader Swaps Reporting is available on the CFTC website: http://www.cftc.gov/LawRegulation/DoddFrankAct/Rulemakings/XXXII.LargeSwapsTraderReporting/index.htm. 9 The largest participants in swaps markets are required to register with the CFTC as either Swap Dealers or as Major Swap Participants. Swap Dealers are required to report large counterparty positions in commodity swaps, although

7
either the price of one of 46 futures contracts or the price of the same commodity for delivery at the same location(s) as one of the 46 futures contracts. The 46 covered futures contracts are listed in Appendix B. Each position report indicates to which futures contract it is paired.
Each reporting entity generally reports positions for both sides of all open swaps they hold: one side for the swap positions of their own principal accounts and the other side held by their direct legal counterparties when such positions become reportable.10 These positions are denoted as ‘Principal’ and as ‘Counterparty’ respectively. Positions resulting from inter‐affiliate transactions are reported as a separate counterparty position – and not as a part of the total principal position for the reporting entity – if the affiliate is a separate legal entity from the reporting entity.
These paired swap positions must be reported to the CFTC as the number of futures‐equivalent contracts (i.e., in terms of the futures contract to which the swap is considered paired) which facilitates comparisons of the swaps and futures markets.11 This includes delta‐adjusted positions resulting from swaptions. See Appendix C for a discussion of the filtering and cleaning applied to the raw data.
These data cover the vast majority of the global market for those physical commodity swaps that are linked to the 46 covered physical commodity futures contracts, and we believe that they provide a comprehensive and representative view of these markets.12 The reporting swap dealers represent a significant global presence, and we expect them to represent a very large fraction of total swaps activity. Because the registration regulations are applied at the legal entity level, many of the largest firms often have multiple entities that meet the swap dealer definition, and many of these are domiciled in different countries. Of the 103 Swap Dealers registered in December 2015, 50 were domiciled in the U.S., 20 were in the U.K., and the remaining 33 were in 13 other countries. Moreover, even though swap dealer registration requirements are based on transacting a certain amount of swaps with “U.S. persons”, reporting applies to all of the swap dealers’ counterparties regardless of whether or not they are U.S. persons.
Major Swap Participants are not required to do so. While the term swap dealer is generically used, the swap dealers who report to CFTC are only those that meet the regulatory definition. 10 Large Trader Reporting for Physical Commodity Swaps is similar to Large Trader Reporting for Futures, such that positions above a threshold are deemed to be reportable; however, for swaps, reporting entities have the option to report only those positions that exceed the threshold or to report all positions. For those entities that do not chose to report all positions, a reportable position is comprised of 50 or more futures‐equivalent paired swaps or swaptions, in any one futures‐equivalent month, based on the same commodity, grouped separately by swaps and swaptions, then grouped by gross long contracts on a futures‐equivalent basis or gross short contracts on a futures‐equivalent basis. Once one position in a commodity is reportable, all of the positions in that commodity for the counterparty are reportable. 11 See Appendix A for a more detailed discussion of futures equivalence for swaps. 12 See Appendix B for the list of covered futures contract.

8
Not all swap dealers transact in or have reportable positions in the physical commodity swaps covered by the Large Trader Reporting for Physical Commodity Swaps. During the time period examined in the paper, the number of swap dealers reporting positions in any commodity ranged from 60‐70, and those reporting positions for WTI swaps ranged from 50‐60. Moreover, swap dealers are only required to report positions that exceed the reportable threshold for both themselves and their counterparties, but some swap dealers choose to report all positions and not just those that exceed the threshold. While there is a small gap in coverage for counterparty reporting (i.e., non‐reportable transactions), we know the size of this segment since the other side of these positions is reported as part of the reporting entities’ positions.
One gap in coverage relates to transactions where one of the counterparties is not registered with the CFTC as a swap dealer. In untabulated computations using transaction data reported to SDRs, we estimate that less than 10% of swap transactions for WTI crude oil do not have a swap dealer on one side of the transaction.13 Many of these transactions appear to be inter‐affiliate transactions, whereby a firm’s legal entities transact among themselves. Hence, many of the transactions “missing” from the data analyzed here are likely not market‐facing transactions. While data reported to the SDRs also does not represent the universe of transactions in the global market, we expect that these transactions are representative.
3.2. Methodology for Calculating the Size of the Swaps Markets
To measure the size of the swaps markets, we calculate the average daily open swaps measured in terms of futures‐equivalent contracts. This allows us to directly compare the size of the swaps markets to the size of the paired futures markets (measured as open interest). While futures open interest is generally calculated using only one side of the market, we calculate open swaps using reporting entities’ gross principal positions (long plus short).
To calculate average daily open swaps, we use data from Large Trader Reporting for Physical Commodity Swaps covering June 1, 2015 to June 30, 2015. We first calculate each reporting entity’s average daily open swaps for the month using the gross principal position. We then sum the average daily open swaps for all principals in order to obtain the average daily open swaps for June 2015. We calculate the average in this way to account for missing reports. This method should be robust to missing reports because the gross positions for reporting entities are fairly stable throughout the month.14
13 In the Swap Dealer De Minimis Exception Final Staff Report, the vast majority (78%) of non‐financial commodity swap transactions are estimated to have a swap dealer on at least one side of the transaction. For more information, see http://www.cftc.gov/idc/groups/public/@swaps/documents/file/dfreport_sddeminis081516.pdf. 14 As a robustness check, we also calculated the average daily open swaps for the reporting month without accounting for the missing reports. We found that the average daily open swaps calculated without adjusting for the missing data was always less than the daily average that does account for missing data and that the two averages are generally close. Because we believe that the average that accounts for the missing data is more representative, we present our results using the methodology accounts for missing data.

9
We use counterparty information to adjust the average daily open swaps to remove positions resulting from inter‐affiliate transactions and to remove duplicative reporting of positions due to transactions between reporting entities. Without this adjustment, these data would overstate the activity in market‐facing swaps: some positions would be reported two or three times in the raw data. For example, consider a commodity swap transaction between an end‐user and a dealer. In many cases, a dealer will then enter into an equal and off‐setting transaction with an affiliate in order to aggregate exposures into a single legal entity for risk management purposes. Suppose in this example that Dealer A’s New York entity transacts with the end‐user and then initiates an offsetting transaction with Dealer A’s London entity. Dealer A’s New York entity would then report their position with the end‐user and also their position with their London affiliate. The London entity would also report their position with the New York entity. Clearly, the reporting of the resulting swap positions by both the New York entity and by the London entity is duplicative, so we adjust to count these positions once. For the purposes of this paper, we also exclude the inter‐affiliate positions and count only the Dealer position with the end‐user. The amount of open swaps excluded depends on the commodity. Duplicate position reporting ranges from approximately 8% of the calculated value for swaps paired to NYMEX Platinum to approximately 17% for swaps paired to NYMEX Palladium and is approximately 9% for NYMEX Light Sweet Crude Oil (WTI). For inter‐affilliate positions, this percentage ranges from 13% (NYMEX Natural Gas) to 27% (COMEX Silver) and is approximately 14% for WTI.
We contend that this measure of the size of a swaps market is comparable to using open interest to measure the size of a futures market. The non‐standard nature of swaps means that swaps do not generally offset the way that futures do. Yet, even in futures, offsetting is generally not done for the same account holder, across accounts with different FCMs, which means that futures traders could hold both long and short positions in the same future in the same contract month with different FCMs, with both sides counting towards open interest. To the extent that offsetting in swaps is done less than offsetting in futures, the measure of size we use in this analysis is likely to be an upper bound for swaps.
3.3. Methodology for Calculating the Size of the Futures Markets
In order to provide context for the size of the swaps markets, we present them in conjunction with their paired futures markets. We use June 2015 month‐end open interest numbers for futures and delta‐adjusted open interest for options on the futures as a measure of the size of futures markets as reported to the CFTC by the exchanges.15 Hereafter, we will refer to these futures and options more generically as “the futures market” or as the “futures data”, for expositional convenience.
3.4. The Size of the Swaps Markets
15 This analysis uses market level, end‐of‐day open interest data for futures that is calculated and directly reported to the CFTC by the registered exchanges.

10
Figure 1 provides an overview of the cross section of commodity futures and swap markets for a representative month, June 2015. The chart displays the average daily number of futures‐equivalent contracts outstanding for 29 different commodities. The blue bar represents the futures market and the red bar represents the paired swaps market. The vertical axis is the one‐sided open interest. This chart highlights intriguing observations related to the size comparison between and across futures and swaps for various markets. First, there are substantial differences in open interest across these markets. The largest market by far is the commodity swaps market paired to the NYMEX natural gas futures, with over 5 million futures‐equivalent contracts, and the swaps market for swaps paired to the NYMEX light, sweet crude oil contract is a distant second with about half as many open contracts. Corn swaps are third with about 1 million open futures‐equivalent contracts. For other swaps markets, the magnitude of open swaps is well below 1 million contract equivalents. Thus, we find that open interest in the commodity swaps market is mainly focused around three commodities, with commodity swaps paired to the NYMEX natural gas futures having the lion’s share of that concentration. The second intriguing observation is that the swaps market is significantly smaller than the futures market for most of the 29 commodities, with rare exceptions. The disparity in swap activity is actually understated by Figure 1, in that the chart excludes many commodities for which data are required to be reported but activity is at even lower levels than the ones presented (e.g., Ethanol, Butter, Cheese, Whey, and others).
In Figure 1, natural gas stands out from the other commodities. The natural gas swaps market is not just substantially larger than the futures market to which it is paired, but it is also almost twice as large as light, sweet crude oil swaps. The difference between natural gas and other commodities is driven by the technical specifications of the data as well as the institutional specifics of the natural gas market. First, there is far more variety in the reported reference prices for the swaps in natural gas than for any other commodity, reflecting the wide variety of delivery locations for natural gas. In natural gas futures, these different locations are generally covered by different futures contracts, but they are all paired to the Henry Hub future for reporting purposes. Second, spot pricing at the various delivery locations for natural gas is generally quoted as a differential to Henry Hub. Because of this, swaps that settle against a price at one of these other locations are indirectly linked, and hence paired, to the NYMEX Natural Gas futures contract with delivery at Henry Hub. These factors act to magnify the quantity of swaps paired to Henry Hub futures.
4. Detailed Analysis of WTI Derivatives Markets
4.1. West Texas Intermediate (WTI) Light Sweet Crude Oil Futures and Paired Swaps
Given the large literature examining crude oil prices and trading activity, we focus our empirical analysis on WTI Light Sweet Crude Oil futures and swaps. The choice is particularly motivated by the importance of crude oil in the financialization literature cited in the introduction, and the potential importance of the swap data gap with which financialization researchers have struggled. We examine the period April 1, 2014 to December 31, 2015, which includes the precipitous decline in oil prices that began in June 2014. We also incorporate the

11
crude oil price into the analysis in order to provide a more complete picture of market activity. In these instances, we use the settlement price for the NYMEX Crude Oil, Light Sweet nearby futures contract.
4.1.1. WTI Futures Data
For an in‐depth comparison between futures and swaps markets using WTI Light Sweet Crude Oil, we use data from the DCOT report for NYMEX Crude Oil, Light Sweet futures and options combined covering the period January 1, 2014 to December 31, 2015.16 The DCOT is published weekly and is based on one day of activity – generally Tuesday. The DCOT reports long and short positions for the following categories of traders:
Producer/Merchant/Processor/User,
Swap Dealers,
Managed Money, and
Other.
For the analyses presented in this paper, we rename the category ‘Producer/Merchant/Processor/User’ to ‘Commercial End‐Users’ for ease of reading. We combine ‘Managed Money’ with ‘Other’ to create a new class which we call ‘Financial End‐Users’. The ‘Managed Money’ category includes registered Commodity Trading Advisors (CTAs), registered Commodity Pool Operators (CPOs), and hedge funds; whereas, the “Other” category includes entities that are not classified as Commercial users or Money Managers that have reportable positions. We find that this “Other” category generally includes institutional money managers such as pension funds, insurance companies, and sovereign wealth funds. Combined, these two categories include entities who are not using the commodity for commercial production and who are not intermediating. In general, these Financial End‐Users are using commodity derivatives for a financial purpose. Hence, we believe that these two categories – Managed Money and Other – generally cover users with similar trading patterns and can be combined without loss of information. To verify this, we also conducted the analysis with these two categories separated. Since the trends between these two categories were very similar and no new information seemed to be gained by looking at them separately, we present results for the combined category. The DCOT has a category for positions that are not reportable called ‘Nonreportables’.
4.1.2. WTI Paired Swaps Data
In order to compare positions by the different participant types that are available in the futures and options data, we manually classified each account found in the large trader swaps
16 As noted earlier, we refer to this as “futures data” for expositional convenience. For additional information about the Historical Disaggregated Commitments of Traders Report, see http://www.cftc.gov/idc/groups/public/@commitmentsoftraders/documents/file/disaggregatedcotexplanatorynot.pdf.

12
reporting using the name of the counterparty for the account as we might if they were going to be used for the DCOT. Hence, we follow the same general breakout of market participants as is used in the DCOT. As we did with the DCOT data, we combine the ‘Managed Money’ and ‘Other’ categories to create a new class which we call ‘Financial End‐Users’. Since the ‘Swap Dealers’ designation for the DCOT encompasses all entities who act as a dealer and is not limited to legal entities provisionally registered as a Swap Dealer, we go beyond registered dealers and include other entities who act as a dealer. The ‘Commercial End‐Users’ category corresponds to those entities that predominately engage in the production, processing, packing, or handling of a physical commodity, just as it does in the DCOT.
We calculate the average daily swap positions for the different participant types on a weekly basis (long, short, and net) in order to match the weekly frequency of the DCOT. An alternative methodology would have been to use the large trader swaps data observed each Tuesday; however, the weekly average smooths some of the noise in the swaps data caused by reporting errors including missing reports.17 We adjust these daily averages by excluding positions resulting from inter‐affiliate transactions and the duplicative reporting for dealer to dealer transactions.
While some of the complexity of the underlying swap is lost in reporting aggregate positions, each reported position also includes an indicator for the type of swap contract: two‐component inter‐commodity spread, two‐component locational basis, index or basket, and direct WTI price exposure.
4.1.3. Comparisons between WTI Swaps and Futures Markets
In this section, we focus on comparisons between the WTI Swaps and Futures Markets. We begin with a general comparison of the size of these markets and then progress to further comparisons using the different participant types in these markets.18 Given the dramatic decline in the price of WTI during this time period, we also look for signs of the impact of this decline on these markets.
We believe that swaps are commonly perceived to have much longer tenors than futures contracts do. Based on anecdotal evidence, our prior belief was that dealers would transact longer‐term contracts and generally hedge them using the most liquid, nearby contracts. Table 1 breaks out the overall WTI swap positions by tenor, with a side‐by‐side comparison for futures
17 While there are some cases in which averaging positions could amplify reporting errors given the persistence of positions, we typically do not find this to be the case in these data. We typically find spikes up and down which generally persist for one day and then revert back to the previously reported position. The majority of these anomalies appear to be due to reporting errors and not due to actual changes in the position. 18 For these analyses, we do not account for missing swaps data as we did in Section 5 due to the complexity of determining missing data for the different participant types. However, we do not expect the missing data to bias our general results. We expect the values presented in this paper to be lower bounds for open swaps and for gross swap positions.

13
open interest.19 The table makes clear that the vast majority (71%) of WTI swaps have a tenor less than one year, mirroring the nature of futures markets to exhibit the majority of positions in these shorter‐dated instruments (78%). Swap positions with tenors of one to two years account for another 21% of the open interest. The remaining 8% is for positions with tenors of two years or more. Based on this sample, swaps markets appear to exhibit the same general term structure as futures markets. This finding contradicts our initial expectation. We believe that understanding the reasons for this is a worthwhile question to explore in future research.
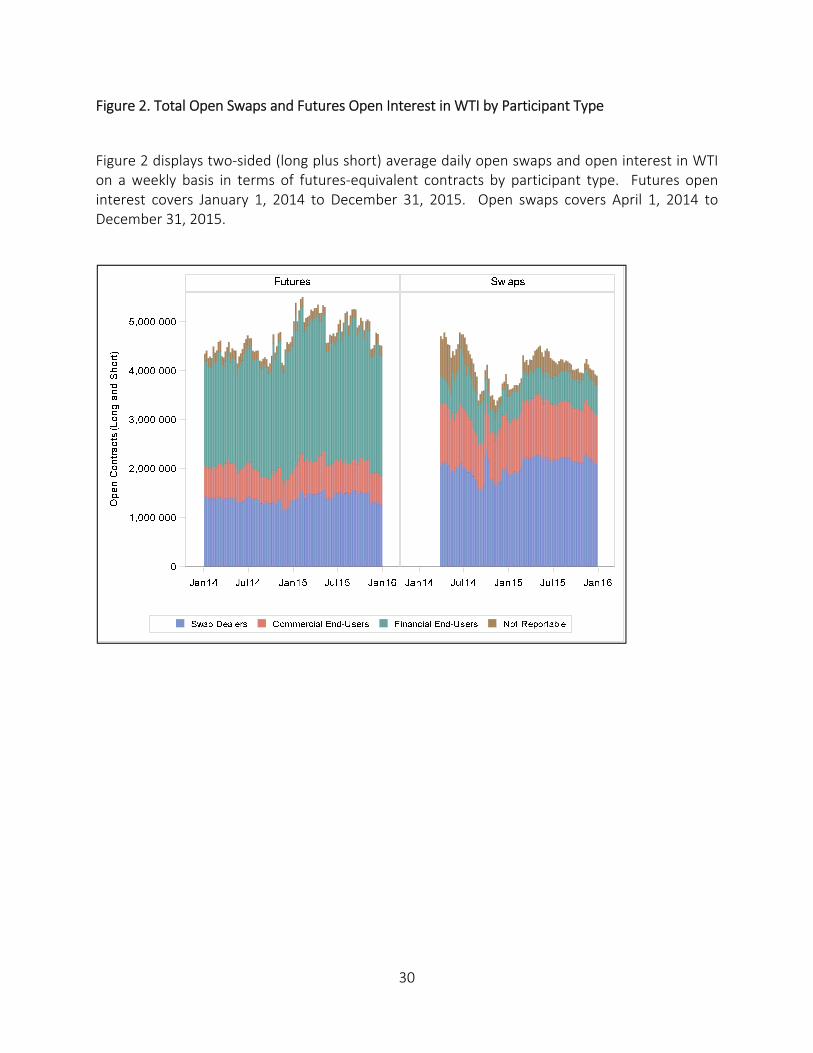
Figure 2 presents a side‐by‐side comparison of the open interest in futures (the left hand chart) and in swaps (the right hand chart) in order to highlight the composition of positions across the two markets. The chart displays the two‐sided open interest figure, i.e., the long plus short open interest, which is twice the one‐sided value. The chart displays the swap dealer open interest in blue, the Commercial End‐Users open interest in red, and the Financial End‐User open interest in green. The non‐reportable portion of open interest and open swaps is shown in brown.
Comparison of the two charts in Figure 2 reveals several interesting observations. First, the swap dealer category is larger in swaps than in futures, with their two‐sided open interest in swaps averaging around 150% of their two‐sided open interest in futures (around 2 million contracts versus 1.4 million contracts, respectively). Second, the Commercial End‐User component is much larger for swaps than for futures; these participants appear to represent about 14% of futures open interest and 29% of open swaps.20 Third, the Financial End‐User category is much larger in futures than in swaps; it represents about 53% of futures open interest but just 16% of open swaps. Finally, the relative magnitudes of these attributions appear generally stable over the sample. Based on the data presented in Figure 2, it is clear that Commercial End‐Users are significant users of WTI futures and, to an even larger extent, swaps while Financial End‐Users are bigger users of futures than swaps.
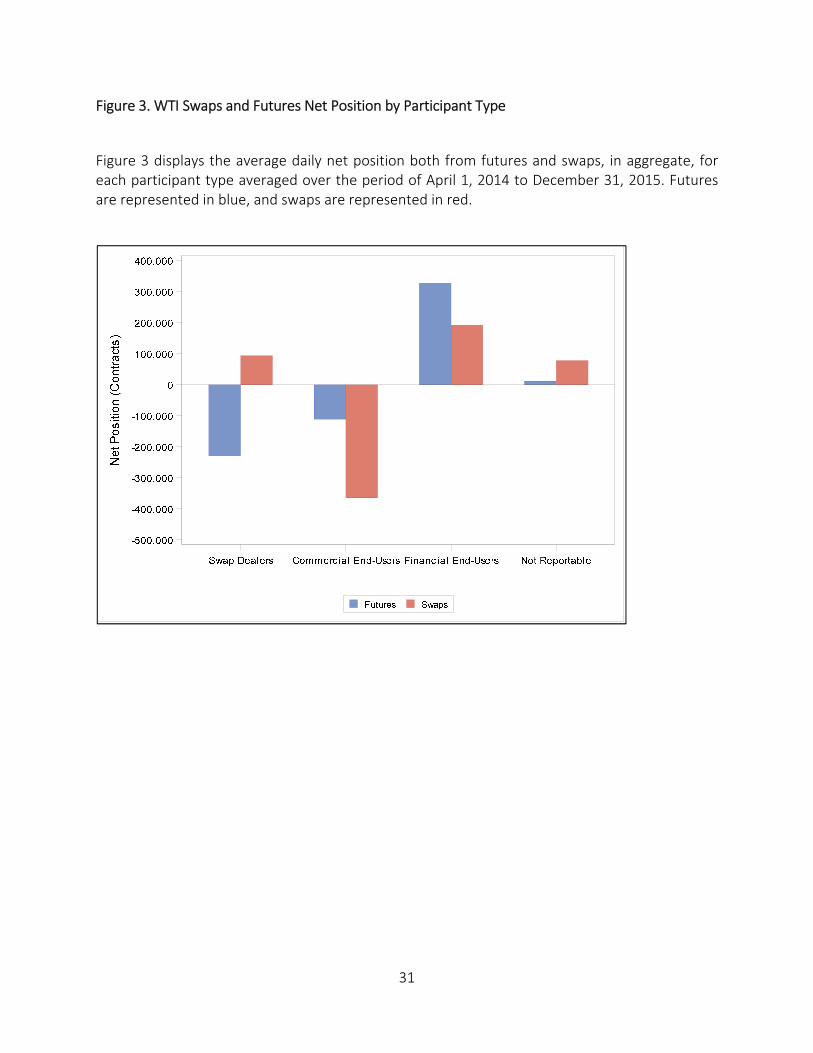
While the gross positions for these participants provide some insight into the overall composition of these markets, the net positions of these participants are of particular interest. Figure 3 displays the average daily net positions of these participant types over the entire period of April 1, 2014 to December 31, 2015. The figure makes clear the consistency in positions across futures and swaps for end‐user categories (i.e., their net position in swaps is in the same direction as their net position in futures). Financial End‐Users, as a group, have net long WTI positions in futures and in swaps, although their futures positions are larger than their swaps positions (340,000 contracts versus 190,000 contracts). Similarly, Commercial End‐Users, as a group, are net short WTI positions in both futures and swaps. However, unlike Financial End‐
19 It is worth reiterating at this point that the tenors reported are not the tenors of the actual swaps but are for the futures‐equivalent positions. Hence, the values in Table 1 should not be interpreted as swap tenors but as futures‐equivalent positions across the term structure.
20 This is true despite the fact that the swaps data do not include swaps between two end users.
14
Users, Commercial End‐Users are far larger in swaps markets than in futures, with an average net short position equal to 100,000 contracts in futures and 340,000 contracts in swaps.
Figure 3 also makes it clear that net Commercial End‐User positions are far larger in magnitude than net Financial End‐User positions. On average, Commercial End‐Users are short more than twice as many futures equivalents as Financial End‐Users are long. Even if we conservatively assume that all of the small, non‐reportable positions are Financial positions, Commercial End‐Users still have a larger position size than Financial End‐Users. In other words, Financial End‐Users do not appear to provide enough liquidity for Commercial End‐Users to offset their hedges. Based on our data, Financial End‐Users do not dominate the WTI swaps market: Commercial End‐Users do.
The other striking observation to take from Figure 3 is that swap dealers have net long positions in swaps but have net short positions in futures. Therefore, swap dealers, as expected, have offsetting positions across futures and swaps, which means that swap dealers appear to have only a moderately balanced position when only looking at futures (net‐to‐gross ratio of 0.18) but a much more balanced position when swaps and futures are combined (net‐to‐gross ratio of ‐0.04).21
Computing this same ratio of the average net position to the average gross position for each of the other participant types suggests that end‐users of swaps are more homogeneous in their directionality than end‐users for futures. In swaps, this ratio is +0.30 for Financial End‐Users and is ‐0.33 for Commercial End‐Users, but it is only 0.05 for Swap Dealers. When these same net‐to‐gross ratios are constructed using the publicly available DCOT data for futures over the corresponding sample, the ratio is +0.13 for Financial End‐Users, ‐0.17 for Commercial End‐Users, and ‐0.16 for Swap Dealers. Finally, note that the average net position of “Not Reportable” accounts is virtually zero in futures but is positive for swaps. 22 However, we believe that this segment of the market is small enough that our conclusions are not qualitatively affected by excluding it from consideration in the more detailed analysis that follows.
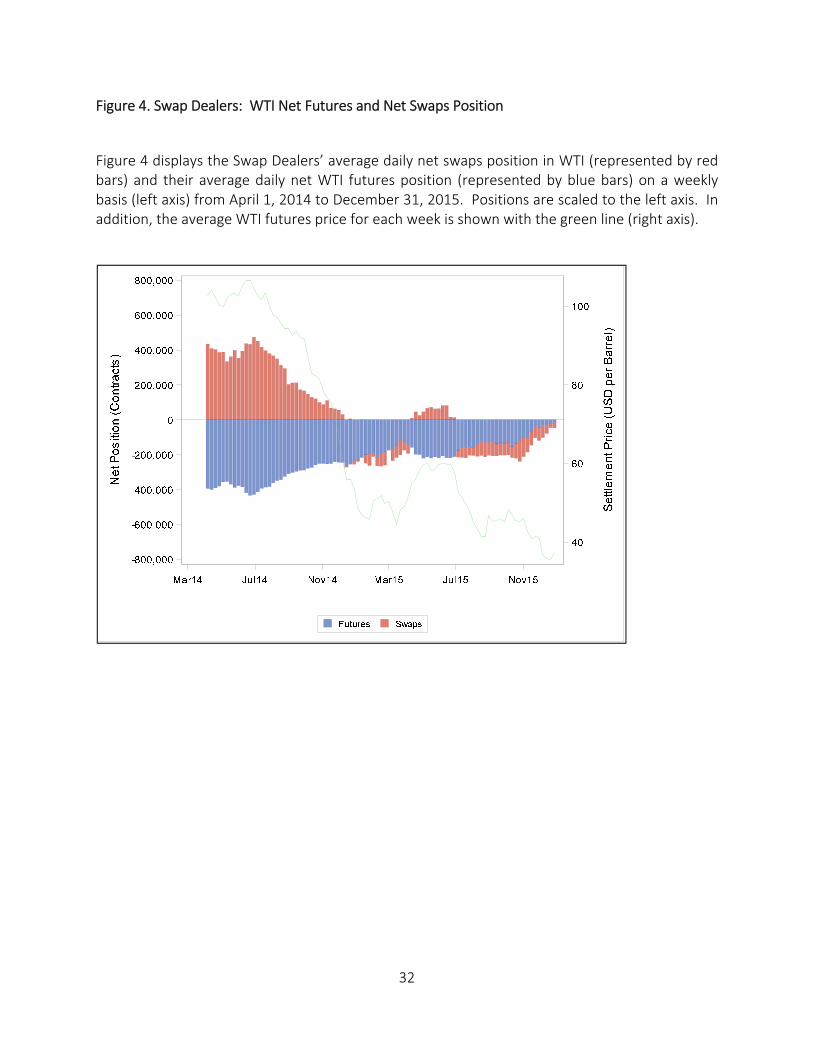
While Figure 3 shows the average net position of our participant types across the entire time period, Figures 4 through 6 show how these participants’ net positions change from week to week for both futures and for swaps. These charts also display the settlement price of the nearby WTI futures contract. For Swap Dealers, Figure 4 highlights swap dealers’ tendencies to generally have offsetting futures and swap positions. The chart also highlights the swap dealers’ relatively large net positioning for both futures and swaps when crude oil was near USD 100 per barrel as well as the shift in the magnitude of these net positions, which are substantially smaller after the price decline starting in mid‐2014. Figures 5 and 6 show the changes over time in net positions of Commercial End‐Users and Financial End‐Users, respectively.
21 This net‐to‐gross ratio is effectively the longs minus shorts divided by the longs plus the shorts, for a particular group. 22 In both futures and swaps, reporting entities are only required to report positions that exceed a specific threshold, though some report all positions regardless of the size.

15
In contrast to what we observe in Figure 4 for Swap Dealers, the most notable characteristic of Figures 5 and 6 appear to be the consistency of net positioning in futures and swaps over time for both Financial End‐Users and for Commercial End‐Users. That is, Financial End‐Users were consistently net long both futures and swaps over this sample, and Commercial End‐Users were consistently net short both futures and swaps over this sample, irrespective of the large price drop during this period. However, Commercial End‐Users appear to increase their net position in futures over this time period while reducing their net position in swaps. Conversely, Financial End‐Users appear to increase their net position in swaps over this time period while reducing their net position in futures.
4.1.4. Further Exploration of WTI Swaps Markets
The figures presented thus far have generally focused on comparing the futures and swaps markets for WTI. Because futures data are publicly available and have been analyzed in other studies, we focus more on the WTI swaps in the remainder of the paper, and elaborate on these novel data. In our focused analysis, we present the long and short positions by participant types, show the distribution of different product types in the WTI swaps market, and how these various product types make up the net position of each participant type.
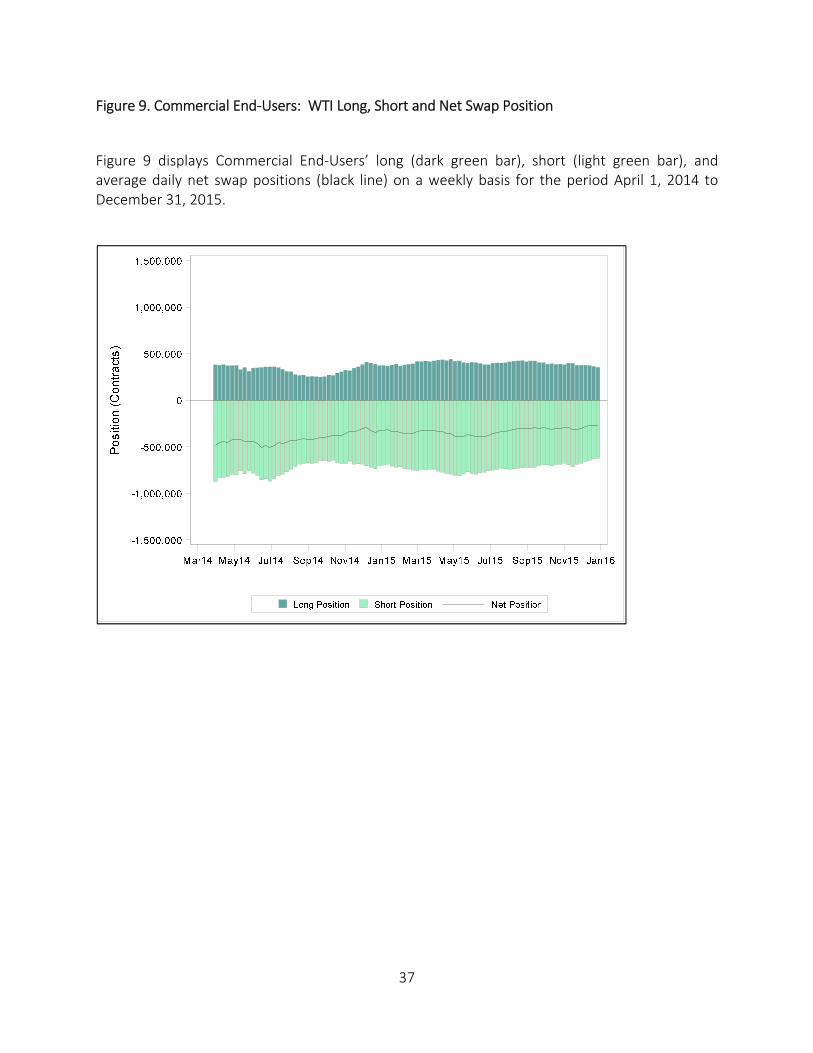
While we represented the positions of the participant types by net positions in the previous analysis, Figures 7 through 9 disaggregate these net swap positions into the component long and short positions held by these participant types. These gross positions are a first step for providing better insight into the counterparty risks faced by these participant types as a group. Figure 7 illustrates the fact that Swap Dealers take significant long and short positions, which is consistent with the business of swap dealers as intermediaries. These results indicate that swap dealers primarily facilitate the net long positioning desired by the money managers and the net short positioning desired by the Commercial End‐Users. Figures 8 and 9 correspondingly break out the long and short positions held by Financial End‐Users and Commercial End‐Users, respectively. While neither of these two groups appears perfectly homogeneous with respect to the directionality of the group members, they do appear to be much more homogeneous than Swap Dealers.23
We next examine the composition of the WTI swaps market with respect to product type. Table 2 provides on overview of this composition by breaking out the average swap positions resulting from different product types (i.e., swaps with direct WTI exposure, index basket swaps, locational basis swaps, and 2‐component inter‐commodity spreads). The largest average daily open swap positions result from direct WTI swaps, accounting for some 67% of the open interest. A further 19% of open swaps are due to positions via index or basket swaps. The remaining 15% of open swap positions are attributable to swaps that contain two floating legs, at least one of which is WTI. These inter‐commodity spreads (e.g., WTI vs. natural gas) or locational
23 As noted earlier, the net‐to‐gross ratio in swaps is +0.30 for Financial End‐Users and is ‐0.33 for Commercial End‐Users, but it is only 0.05 for Swap Dealers.

16
basis swaps (e.g., WTI vs. Louisiana Light Sweet crude) can be long or short WTI, although that distinction does not impact the computation of open interest as shown in the table. The table therefore demonstrates that most WTI swap positions are commodity‐specific, rather than index‐related. We conclude that index swaps, despite the attention they have received in the literature, are only a modest component of the relevant WTI swap activity.
Figures 10 through 12 provide time series charts which elaborate on the average, aggregated net swap positions presented in Figure 3: the net positions are disaggregated by product type. For example, the average net position for swap dealers, as shown in Figure 3, is a long position of roughly 100,000 contracts. Figure 10 provides more detail, hidden by aggregated values, on the underlying composition of this net long position – for these same swap dealers, their overall net position is comprised of net long positions via WTI swaps (long roughly 400,000 contracts on average), net short positions via index or basket swaps (short roughly 225,000 contracts on average), and modest short positions due to basis and spread contracts. Swap Dealers’ net long WTI position combined with their net short position due to index or basket swaps leaves an average net long position of roughly +175,000 contracts. This net long position is further offset by their net short position resulting from inter‐commodity spread contracts, which averages roughly 80,000 contracts. This leaves their overall net long position just below 100,000 contracts, as displayed in Figure 3.
Figure 11 provides the same breakout for the Financial End‐User category, providing more detail on the nearly 200,000 average net long position held by this group. In aggregate, these participants are net long across all of the product types, with roughly 80% of their net position resulting from basket swaps. The remaining net long position is fairly evenly divided between direct WTI swaps and spreads. Further, the scaling of this figure is the same as in Figures 10 and 12, highlighting the relatively small net footprint of Financial End‐Users in the swap space when compared to Swap Dealers and Commercial End‐Users.
Figure 12 provides more context for Commercial End‐User swap activity. While Figure 3 indicates that the group averaged a net short position of approximately 350,000 contracts, Figure 12 reveals that this net position is virtually entirely the result of direct, commodity‐specific WTI swaps. There is a small net long position resulting from spreads (locational basis or inter‐commodity), but this relatively small position does not materially impact the overwhelming nature of the overall net short position of these Commercial End‐Users. Moreover, the net position for this group from index or basket swaps is barely perceptible in the chart.
Taken together, Figures 10 through 12 demonstrate that the net positioning for these participant types has been fairly stable around the averages shown in Figure 3 during the sample period. Further, breaking out the position data by participant type and product type allows us to highlight the importance of swap dealers in intermediating the net quantities demanded from Commercial and Financial End Users. To be more specific, these figures demonstrate that Swap Dealers have substantial net long positions (mostly due to direct WTI swaps with Commercial End Users) and substantial net short positions due to index or basket swaps (mostly with
17
Financial End‐Users). Swap Dealers’ overall net position, therefore, is much smaller in magnitude than either of these components.24
5. Discussion
Researchers have identified interesting questions regarding commodity markets that require comprehensive futures and swaps data, but they have lacked the data to address the questions directly. The problem is especially acute in the energy space, which features significant index and commodity‐specific swap activity. Researchers have responded to the lack of commodity swap data with second‐best tactics such as a) using futures position data as a proxy for the desired data, b) imputing the desired swap data for energy and metals products by using existing data on agricultural products, c) focusing only on agricultural commodities, or d) using relatively low frequency index investment data that is no longer collected.
This paper presents a new, comprehensive regulatory data set that directly measures index swap activity and commodity‐specific activity, with a focus on WTI crude oil. Our analysis has been largely descriptive due to the novel character of our data. We have presented many of the results for swaps alongside the corresponding results for futures in order to emphasize the potential connections between the two markets. For most physical commodities, we find that futures markets are generally larger than the corresponding swaps markets, as measured by open interest, with WTI crude oil being an exception. The magnitude of crude oil swaps trading suggests that futures‐only analyses that ignore swaps activity are at risk of misrepresenting the aggregate WTI derivatives space.
We present a number of new findings. Our results indicate that Commercial End‐Users have a much larger footprint in the WTI swaps space than financial end‐users do. First, we find that the net short position of Commercial End‐Users in swaps always exceeded the net long position of financial end‐users. Financials do not swamp commercials during our sample; in fact, it appears that Financial End‐User swap positions are not large enough to provide the liquidity demanded by commercials. Second, commercials have a much larger net exposure in swaps than in futures, whereas financial end‐users are smaller in swaps than in futures. This characterization further highlights the size of Commercial End‐User net positions in the previously opaque swaps space.
Our data allows us to quantify precisely how Swap Dealers, in aggregate, intermediate swap activity among the different end‐users. We find that swap dealers exhibit a very modest net position in swaps (compared to their much larger gross position), which is negatively correlated with their futures exposure. This is suggestive of active management to neutralize exposures to WTI price changes. The gross size of dealer exposure was relatively large when crude oil was near USD 100 per barrel, but the magnitude of positions is considerably smaller
24 In unreported analysis, we find that the tenor of futures equivalent exposures, for each of the participant types, is similar to the aggregate data displayed in Table 1. There appears to be minimal maturity transformation performed by dealers.

18
after the substantial price decline starting in mid‐2014. In contrast to Swap Dealers’ relatively neutral exposure to WTI price moves, Financial End‐Users consistently exhibit a net long exposure in both futures and swaps over the sample, and Commercial End‐Users consistently exhibit a net short exposure in both futures and swaps over this sample.
We also analyze swap exposures for different tenors and product types. We find that the majority of both swaps and futures exposures have a tenor of less than one year. WTI swaps (used predominately by commercial end‐users) constitute the largest portion of swap exposure, accounting for some two‐thirds of the open interest. A further 19% of the open interest is due to implicit exposures via index or basket swaps, which are predominately used by financial end‐users. The remaining 14% is attributable to swaps that contain two floating legs, one of which is WTI. We conclude that index swaps, despite the attention they have received in the literature, are only a modest component of the relevant WTI swap activity, at least in our sample. Further, our data allow us to quantify the extent to which Swap Dealers intermediate the commodity index demands of Financial End‐Users and the WTI‐specific demands of Commercial End‐Users.
The results presented in this paper suggest a variety of directions for further research. For example, Sanders, Irwin, and Merrin (2010) revisit the “adequacy of speculation” debate by computing Working’s T index in commodity futures markets. Traditionally, the index compares the commercial and financial futures positions in a given commodity, but the strong links between swaps and futures activity means that a more relevant computation might include both futures and swaps positions. In particular, our finding that the magnitude of WTI net swap positions held by commercials significantly exceeds the magnitude of WTI net swap positions held by financial end‐users suggests that futures‐only T index values would overstate the relative amount of speculative activity in WTI derivatives. Another example is motivated by the fact that this swap data begins in 2013; it would be useful to gauge how well this data set tracks other data, such as the CFTC Index Investment Data. Finally, it would be interesting to analyze the disaggregated swap data to gain further insight into the methods by which individual dealers manage a portfolio of commodity swaps, and how price discovery in futures and swaps occurs.

19
APPENDIX A: REPORTING FUTURES‐EQUIVALENT CONTRACTS IN SWAPS
Futures‐equivalence is a methodology that allows for the conversion of disparate derivatives contracts into consistent measures of size, direction, and expiration. Essentially, the futures‐equivalent positions generated from a swap would be the portfolio of futures contracts that would most closely provide the price exposure of that swap in terms of size, direction, and expiration. For direction, the floating‐price payer is reported as short the commodity, and the fixed‐price payer is reported as long the commodity. For size, the notional size of the swap is converted into contract‐equivalents. So, a swap with a notional size of 1 million barrels of WTI light, sweet crude oil would be reported with a position size of 1000 NYMEX light sweet crude oil contracts since one futures contract is for 1000 barrels of oil. As for expiration, one WTI swap contract with 12 monthly settlement periods can be thought of as a series of monthly futures contracts, like holding a strip of futures. Hence, for this swap, a position would be reported for each of the 12 contract months that cover the 12 settlement periods. A graphical representation of this difference in expiration between futures and swaps is provided below.
The futures‐equivalent contracts resulting from this treatment of swaps may differ in some ways from the risk management practices that firms may use in that the futures equivalents may not be the same as the futures contracts and contract expiration months that a firm could actually use to offset the risk of a particular swap. For example, if a swap generated price exposure to the monthly settlement of a futures contract for twelve consecutive futures contract expirations, this price exposure could be offset by “stacking and rolling” a futures market position forward from month to month as liquidity migrates to the nearby futures expiration months. While this may be an acceptable risk management practice, representing the futures‐equivalent position resulting from the swap as if, for the first month, all twelve months of price exposure was obtained from the nearby futures contract, would be incorrect and not consistent with the intent to best represent the price exposure generated by a swap in terms of futures‐equivalent months.
For a further discussion and examples of the conversion of commodity swaps into futures‐equivalent positions for reporting to the CFTC, see Large Trader Reporting for Physical Commodity Swaps: Division of Market Oversight Guidebook for Part 20 Reports (2015).25
25 http://www.cftc.gov/idc/groups/public/@newsroom/documents/file/ltrguidebook062215.pdf.

20

21
APPENDIX B: Large Trader Reporting for Physical Commodity Swaps Covered Futures Contracts
Exchange Contract
Chicago Board of Trade Corn
Ethanol
Oats
Rough Rice
Soybean Meal
Soybean Oil
Soybeans
Wheat
Chicago Mercantile Exchange Butter
Cheese
Dry Whey
Feeder Cattle
Hardwood Pulp
Lean Hogs
Live Cattle
Milk Class III
Non Fat Dry Milk
Random Length Lumber
Softwood Pulp
COMEX Copper Grade 1
Gold
Silver
ICE Futures U.S. Cocoa
Coffee C
Cotton No. 2
Frozen Concentrated Orange Juice
Sugar No. 11
Sugar No. 16
Kansas City Board of Trade Wheat
Minneapolis Grain Exchange Wheat
NYSELiffe Gold, 100 Troy Oz.
Silver, 5000 Troy Oz.
(continued on next page)

22
Exchange Contract
New York Mercantile Exchange Brent Financial
Central Appalachian Coal
Cocoa
Coffee
Cotton
Crude Oil, Light Sweet
Gasoline Blendstock (RBOB)
Hot Rolled Coil Steel
Natural Gas
No. 2 Heating Oil, New York Harbor
Palladium
Platinum
Sugar No. 11
Uranium
Note that Diversified Commodity Index positions can be reported in their own category (and not as futures‐equivalent positions) for diversified indices that are commonly known with publicly available weightings. For our analysis, we convert index positions into futures equivalent positions when necessary.

23
APPENDIX C: CLEANING THE SWAPS DATA
The raw data were filtered and cleaned to remove erroneous information. While the vast majority of records appear appropriate, some require correction. These issues were typically more problematic in the early months of reporting and have become somewhat less of an issue as reporters have been notified of systematic errors and have worked to correct their systems. This appendix describes some of the common, systematic errors found in these data.
For example, a systematic review revealed that some positions were extraordinarily large, either in absolute terms or relative to the expected size of a particular counterparty’s position. To diagnose this and correct the problem in existing data, we note that the reports to the CFTC include two separate fields quantifying the position size. For each record, we compare the “reported position” field (to be reported in futures contract equivalents) to the “reported notional” field (to be reported in notional value). This notional field is expected to equal the number of contracts multiplied by the dollar value of one contract; therefore, the ratio of the two fields (“reported notional” divided by “reported position”) should approximate the dollar value for one futures contract.
We have identified two main systematic errors using this ratio. First, positions are sometimes reported in units rather than futures contract equivalents (e.g., e.g., as 1 million barrels of oil as opposed to 1,000 contracts of NYMEX Light Sweet Crude Oil). For errors of this type, we have contacted reporting entities, who have typically confirmed that these positions were in fact mistakenly reported as the number of units of the underlying commodity as opposed to the number of futures‐equivalent contracts. In this circumstance, the reported positions were adjusted to the number of futures‐equivalent contracts.
Second, some records contain a misplaced decimal (e.g., a position of 2 instead of 200). This appears to occur when the price of a contract is used in internal computations by a dealer to obtain the position to report, but the computation does not properly account for units. For example, a contract quoted in cents per pound might be used in a computation as if it were in dollars per pound. When identified, we also adjusted these records to reflect the correct size.
In some cases, we have identified no systematic adjustment to correct obviously erroneous data. In these instances, the positions were excluded from the analysis. In total, less than 1% of position records are corrected or excluded.
Additional editing of the swaps data was required to correctly distinguish the reporting entities positions from those of their counterparties. Moreover, there are a handful of reporting entities that only report positions for their counterparties. In these cases, the positions of the reporting entities are derived from the positions reported for their counterparties.
We also identified transcription errors by reporters where the name entered in the commodity reference price field (i.e., the price upon which the swap settles) for the swap contract did not exactly correspond to the correct futures market name as reported in the

24
underlying commodity field. For example, in some cases, the relevant commodity reference price is reported as “PALLADIUM‐NYMEX” but the underlying commodity is reported as “NYMEX Platinum” rather than as the corresponding futures market name “NYMEX Palladium”. In these cases, we adjusted the underlying commodity accordingly. In other cases, the commodity reference price indicated that the position did not result from a paired swap (e.g., Japan Yen), so the record was excluded. In speaking with reporting entities and by assessing other information reported for the position, we determined that the commodity reference price is the best indicator of the underlying commodity when the commodity reference price and the underlying commodity do not agree. These adjustments also impacted a small number of records.

25
References Acharya, Viral, Lars Lochstoer, and Tarun Ramadorai (2013) “Limits to Arbitrage and Hedging: Evidence from Commodity Markets,” Journal of Financial Economics, 109, 441‐465. Benos, Evangalos, Richard Payne, and Michalis Vasios (2016) “Centralized Trading, Transparency and Interest Rate Swap Market Liquidity: Evidence From the Implementation of the Dodd‐Frank Act,” Bank of England Staff Working Paper No. 580 Büyükşahin, Bahattin and Jeffrey H. Harris (2011) “Do Speculators Drive Crude Oil Futures Prices?” Energy Journal 32 (2): 167–202. Cheng, Ing‐Haw, and Wei Xiong (2014) “The Financialization of Commodity Markets,” Annual Review of Financial Markets, 6, 419‐441.
Cheng, Ing‐Haw, Andrei Kirilenko, and Wei Xiong (2015) “Convective Risk Flows in Commodity Futures Markets,” Review of Finance, 19, 1733‐1781.
Duffie, Darrell, Martin Scheicher, and Guillaume Vuillemey (2015) “Central Clearing and Collateral Demand,” Journal of Financial Economics, 116, 237‐256.
Getmansky Mila, Giulio Girardi, and Craig Lewis (2016) “Interconnectedness in the CDS Market,” Financial Analysts Journal, forthcoming.
Hamilton, James D., and Cynthia Wu (2014) “Risk Premia in Crude Oil Futures Prices,” Journal of International Money and Finance, 42, 9‐37.
Hamilton, James D., and Cynthia Wu (2015) “Effects of Index‐Fund Investing on Commodity Futures Prices,” International Economic Review, 56 (1): 187‐205.
Heckinger, Richard, and Mengle, David (2013) “Understanding Derivatives: Markets and Infrastructure,” Federal Reserve Bank of Chicago, Financial Markets Group.
Irwin, Scott, and Dwight Sanders (2012) “Testing the Masters Hypothesis in Commodity Futures Markets,” Energy Economics, 34 (1), 256‐269.
Loon, Y. Cheng, and K. Zhaodong Zhong (2014) “The impact of central clearing on counterparty risk, liquidity, and trading: Evidence from the credit default swap market” Journal of Financial Economics, 112 (1), 91‐115.
Loon, Y. Cheng, and K. Zhaodong Zhong (2016) “Does Dodd‐Frank Affect OTC Transaction Costs and Liquidity? Evidence from Real‐Time CDS Trade Reports,” Journal of Financial Economics, forthcoming.
Mixon, Scott, and Esen Onur (2015) “Volatility Derivatives in Practice: Activity and Impact,” Working Paper, Office of the Chief Economist, CFTC

26
Mixon, Scott, and Esen Onur (2017) “Dividend Swaps and Dividend Futures: State of Play,” Journal of Alternative Investments, forthcoming.
Peterson., P. E. (2014) “How Large Is the Agricultural Swaps Market?” Proceedings of the NCCC‐134 Conference on Applied Commodity Price Analysis, Forecasting, and Market Risk Management. St. Louis, MO.[http://www.farmdoc.illinois.edu/nccc134].
Robe, Michel, and Jonathan Wallen (2016) “Fundamentals, Derivatives Market Information and Oil Price Volatility,” Journal of Futures Markets, 36, 317‐344.
Sanders, Dwight, Scott Irwin, and Robert Merrin (2010) “The Adequacy of Speculation in Agricultural Futures Markets: Too Much of a Good Thing?” Applied Economic Perspectives and Policy, 32, 77‐94.
Sanders, Dwight R., and Scott H. Irwin (2013) “Measuring Index Investment in Commodity Futures Markets,” The Energy Journal, 34, 105‐127.
Schachar, Or (2012) “Exposing the Exposed: Intermediation Capacity in the Credit Default Swap Market,” NY Fed Working Paper.
Singleton, Kenneth (2014) “Investor Flows and the 2008 Boom/Bust in Oil Prices,” Management Science, 60 (2), 300‐318.
Siriwardane, N., Emil (2015) “Concentrated Capital Losses and the Pricing of Corporate Risk,” Working Paper, HBS Working Paper Series
Working, Holbrook (1960) “Speculation on Hedging Markets,” Food Research Institute Studies, 1,
185‐220.

27
Table 1. WTI‐Linked Open Swaps Compared to WTI Futures Open Interest by Tenor
Table 1 displays average daily open swaps linked to WTI (in terms of futures‐equivalent contracts) by tenor in comparison to the average daily open interest from futures and delta‐adjusted options in the NYMEX WTI Light, Sweet Crude Oil contracts. The sample period covers April 1, 2014 to December 31, 2015.
Open Swaps Futures Open Interest
Position Tenor
Number
of ContractsPercent of
Total
Number
of ContractsPercent of
Total
0 ‐ 1 year 1,331,164 71 1,856,840 78
1 ‐ 2 year 402,490 21 380,408 16
2 ‐ 3 year 105,143 6 90,186 4
3+ year 44,136 2 45,876 2
Total 1,882,932 100 2,373,310 100

28
Table 2. WTI‐linked Open Swaps by Product Type
Table 2 displays average daily open swaps linked to WTI (in terms of futures‐equivalent contracts) by product type. For the index or basket, location basis, and inter‐commodity spread product types, the open swaps are specific to the WTI component of the swap. The sample period covers April 1, 2014 to December 31, 2015.
Product Type
Number of Contracts Percent of Total
WTI 1,253,075 67%
Index or Basket 350,366 19%
Locational Basis 203,700 11%
Inter‐commodity Spread 75,791 4%
Total 1,882,932 100%

29
Figure 1. Average Daily Open Swaps vs. Month‐End Open Interest for Futures and Options Reported for June 2015
Figure 1 shows the month‐end open interest for select futures contracts relative to the average daily open swaps to which they are paired. Daily open swaps are averaged across the month of June 2015, and open interest values are month‐end (June 30, 2015). Futures are represented in blue and swaps are represented in red.
30
Figure 2. Total Open Swaps and Futures Open Interest in WTI by Participant Type
Figure 2 displays two‐sided (long plus short) average daily open swaps and open interest in WTI on a weekly basis in terms of futures‐equivalent contracts by participant type. Futures open interest covers January 1, 2014 to December 31, 2015. Open swaps covers April 1, 2014 to December 31, 2015.
31
Figure 3. WTI Swaps and Futures Net Position by Participant Type
Figure 3 displays the average daily net position both from futures and swaps, in aggregate, for each participant type averaged over the period of April 1, 2014 to December 31, 2015. Futures are represented in blue, and swaps are represented in red.
32
Figure 4. Swap Dealers: WTI Net Futures and Net Swaps Position
Figure 4 displays the Swap Dealers’ average daily net swaps position in WTI (represented by red bars) and their average daily net WTI futures position (represented by blue bars) on a weekly basis (left axis) from April 1, 2014 to December 31, 2015. Positions are scaled to the left axis. In addition, the average WTI futures price for each week is shown with the green line (right axis).

33
Figure 5. Commercial End‐Users: WTI Net Futures and Net Swaps Position
Figure 5 displays Commercial End Users’ average daily net swaps position (the red component of the bar) and their net futures position (the blue component of the bar) in WTI from April 1, 2014 to December 31, 2015. Their total net position is represented by the entire bar. Positions are scaled to the left axis. In addition, the average WTI futures price for each week is shown with the green line (right axis).

34
Figure 6. Financial End‐Users: WTI Net Futures and Net Swaps Position
Figure 6 displays Financial End‐Users’ average daily net swaps position (the red component of the bar) and their net futures position (the blue component of the bar) in WTI from April 1, 2014 to December 31, 2015. Their total net position is represented by the entire bar. Positions are scaled to the left axis. In addition, the average WTI futures price for each week is shown with the green line (right axis).

35
Figure 7. Swap Dealers: Long, Short and Net Swap Positions
Figure 7 displays Swap Dealers’ average daily long (dark green bar), short (light green bar) and net swap positions (black line) in WTI on a weekly basis for the period April 1, 2014 to December 31, 2015.

36
Figure 8. Financial End‐Users: WTI Long, Short and Net Swap Position
Figure 8 displays Financial End‐Users’ average daily long (dark green bar), short (light green bar), and net swap positions (black line) in WTI on a weekly basis for the period April 1, 2014 to December 31, 2015.
37
Figure 9. Commercial End‐Users: WTI Long, Short and Net Swap Position
Figure 9 displays Commercial End‐Users’ long (dark green bar), short (light green bar), and average daily net swap positions (black line) on a weekly basis for the period April 1, 2014 to December 31, 2015.

38
Figure 10. Swap Dealers: WTI Net Open Swaps Position by Product Type
Figure 10 displays Swap Dealers’ average daily net open swaps position in WTI by product type on a weekly basis for the period April 1, 2014 to December 31, 2015.

39
Figure 11. Financial End‐Users: WTI Net Open Swaps Position by Product Type
Figure 11 displays Financial End‐Users’ average daily net open swaps position in WTI by product type on a weekly basis for the period April 1, 2014 to December 31, 2015.

40
Figure 12. Commercial End‐Users: Net Open Swaps Position by Product Type
Figure 12 displays Commercial End‐Users’ average daily net open swaps position in WTI by product type on a weekly basis for the period April 1, 2014 to December 31, 2015.