exploring electric vehicle adoption in … exploring electric vehicle adoption in new york city:...
TRANSCRIPT
1exploring electric vehicle adoption in new york city: January 2010
The City of New YorkMayor Michael R. Bloomberg
EXPLORING ELECTRIC VEHICLE ADOPTION IN NEW YORK CITYJANUARY 2010A GREENER, GREATER NEW YORK
Executive Summary
Context
Study Methodology
Study Findings
Conclusion
Appendix
Tables and Figures
2
4
8
9
15
16
18
EXPLORING ELECTRIC VEHICLEADOPTION IN NEW YORK CITY
JANUARY 2010
A GREENER GREATER NEW YORK
2 exploring electric vehicle adoption in new york city: january 2010
Executive SummaryPlaNYC, the City’s comprehensive sustainability plan, estab-lished an aggressive strategy to reduce the City’s greenhouse gas emissions in 2030 by 30% from 2005 levels. As part of that overall goal, transportation emissions, which currently account for 22% of New York City’s total greenhouse gas emissions, would be reduced by 44% by 2030. PlaNYC also targeted a re-duction in the city’s levels of harmful particulate emissions and pollutants to improve New York City’s air quality.
Public transportation, bicycling, and walking are critical ele-ments of the City’s sustainable transportation system. In addi-tion to using fewer automobiles, the City can also become more sustainable by making existing vehicles more efficient. In recent years, automotive manufacturers have begun to devel-op and produce a new generation of vehicles that are more energy efficient, emit fewer emissions, and use little or no gas-oline. Among the most promising of these technologies are those that rely on electricity, either to enhance the distance a vehicle can travel before consuming gasoline, or through an entirely electric operation relying on battery storage technol-ogy. For those New Yorkers that will continue to rely on the automobile for their mobility needs, these electric vehicles can offer an improvement over gasoline vehicles in reducing both urban pollution and greenhouse gas emissions, helping to meet the City’s PlaNYC targets. And, although they are current-ly more expensive to purchase than gasoline-powered vehicles, electric vehicles offer the potential to save drivers significant sums of money over time, in fuel and maintenance savings – by some estimates, electric vehicles may be 40% to 70% cheaper to operate, depending on gasoline prices and how far a driver travels each year.
In the last year, discussion of electric vehicles (EVs) has become increasingly prominent in the United States. Manufacturers have announced more than a dozen highway-capable electric vehicle models for introduction between 2010 and 2012. The Obama administration has committed more than $4 billion in support of the design, manufacture, and purchase of electric
vehicles. And regulations requiring vehicle fuel efficiency are being strengthened in the U.S., effectively mandating the intro-duction of advanced vehicle technologies.
While electric vehicle technology offers the promise of reduc-ing emissions of criteria pollutants and CO
2, New York City’s
unique transportation profile requires a tailored strategy to promote the adoption of EVs. Most New Yorkers do not own a car, and those who do may not drive them as far, or as fre-quently, as in other parts of the country. In addition, many New Yorkers park their cars on the street or in commercial garages. As a result, it is unclear who would purchase the first EVs in New York City, how many EVs would be purchased, what the key factors and barriers would be for early adoption, and how EV usage would impact our electrical grid. It is also not clear what incentives – infrastructure investments, subsidies, or oth-er actions – may be needed to promote EVs.
To answer these questions, the City embarked on a study, in partnership with McKinsey & Company, a global management consulting firm, to identify what factors would drive early con-sumers to purchase electric vehicles, and what the City and other stakeholders could do to facilitate early adoption of this technology in the short term. McKinsey & Company is leading a global research effort that also includes the cities of Paris and Shanghai to evaluate the evolution toward an electric vehicle ecosystem. The study has found that:
There is a potentially large group of early adopters willing to change behavior to accommodate electric vehicles. A distinct population of “early adopters” is very positive about electric vehicles and willing to change habits to adapt to the requirements of electric vehicles. This may include, for exam-ple, switching from an on-street parking space to one in a local parking garage to access necessary charging infrastructure. The research also has found that New Yorkers’ attitudes, rather than their driving or parking behaviors, are strong indications of their willingness to adopt electric vehicles. Specifically, early
3exploring electric vehicle adoption in new york city: january 2010
adopters have expressed a desire to espouse an environmen-tally friendly lifestyle, possess vehicles with the latest technol-ogy, and/or challenge themselves to reduce their fuel usage. These early adopters are likely to reside throughout the five boroughs.
These early adopters will likely outstrip the available supply of EVs to the New York market for at least the next five years. The research projects that, by 2015, up to 14-16% of all new vehicles purchased by New Yorkers could be electric ve-hicles. Despite this strong interest from early adopters, only limited numbers and types of electric vehicles are expected to be offered in the New York region to meet projected demand. Given the long period from design to mass production, many manufacturers plan to pilot vehicles in small numbers to test their performance in varied conditions and environments be-fore dramatically expanding production.
Thus, the study suggests targeting early policy actions to those issues that early adopters find most important. Ef-forts focused on other consumer segments should wait for several years. Given the likely strong demand among early adopters and the limited short-term supply of vehicles, initial actions would be most effective if they focused on helping ear-ly adopters enter the EV market. For example, likely early adopters may not fully understand the benefits and challenges of using an electric vehicle, so providing clear information could significantly boost early adoption. Survey respondents also voiced a desire to have a convenient and easy-to-under-stand process to install necessary charging equipment, at home or in a commercial garage. Early adopters expressed a desire to be recognized for purchasing an electric vehicle, by having a tree planted in their honor or some similar public dis-play. And finally, auto manufacturers appear willing to dedicate some number of electric vehicles to markets like New York if there is sufficient demand.
Early adopters do not appear to need a high-density public charging network or local tax incentives. While the availabil-ity of charging at retail and curbside locations may be reassur-ing to the average driver concerned about range limitations, the study suggests that the earliest consumers will be willing to change their driving behavior and parking location, given their strong desire to purchase EVs. Thus, a dense public charg-ing network will not be a strong priority for early adopters. Similarly, early adopters understand that electric vehicles will cost more than a comparable gasoline-powered vehicle – and they appear willing to pay a premium for the benefits that EVs will offer them. So, providing tax incentives, in the form of a local sales tax credit or auto dealer rebate, may only serve to subsidize early adopters who have already made the decision to purchase an EV, rather than attracting additional demand.
The projected level of adoption of EVs should not threaten the stability of the electric grid as long as most chargers are “smart”, allowing charging to take place during off-peak hours. The study indicates ongoing coordination is required to support infrastructure planning that accounts for electric vehi-cles and continues to adjust planning as the growth of electric vehicles is better understood. Smart charging mechanisms that will help utilities accommodate when a vehicle is being charged may play a significant role in alleviating the need for additional infrastructure.
An opportunity exists for industry stakeholders to partner to prepare for, and encourage, EV early adoption. The City, auto manufacturers, Con Edison, and others all will have a role to play in the next five years to encourage early adoption of electric vehicles in New York City.
4 exploring electric vehicle adoption in new york city: january 2010
Electric vehicle charged from renewable source
Best case gas enginetechnology (2030)
116 - 232
Electric vehicle charged on NYC grid
Plug-in hybrid vehicle
g CO2/mile, 2010
116
200
417
0
“business as usual”
PlaNYC 2030
AVOIDED SPRAWL15.6 MIL tons/yr
CLEAN POWER10.6 MIL tons/yr
EFFICIENT BUILDINGS16.4 MIL tons/yr
CLEAN TRANSPORT6.1 MIL tons/yr
1234
millions of metric tons of CO 2e
20
30
50
60
70
80
90
20302005
Conventional gas vehicle
40
30%
ContextElectric vehicles, or EVs, represent a clear economic and environ-mental opportunity – for governments, for drivers, and for manu-facturers. Transitioning to EVs would mean a significant reduction in greenhouse gas emissions and local air pollution for all City resi-dents, as well as reduced operating costs, a quieter ride, and less maintenance for City drivers. And yet, in the next five years at least, there will only be a limited number of these vehicles available for purchase, whether they be those that run on batteries alone or those that also contain a back-up gasoline engine to extend their range. On a national level, the Obama Administration is moving aggressively to support the ability of manufacturers and battery suppliers to meet emerging demand, as well as to subsidize the high upfront cost of these vehicles to consumers. New York City’s unique transportation profile offers particular opportunities and challenges for electric vehicles, necessitating further research into the potential market in the next few years.
electric vehicles could help achieve new york city’s sustainability goals.
PlaNYC, the City’s comprehensive sustainability plan, established an aggressive strategy to reduce the City’s greenhouse gas emis-sions in 2030 by 30% from 2005 levels. As part of that overall goal, transportation emissions would be reduced by 44% by 2030. Trans-portation accounted for 22% of the City’s greenhouse gas emis-sions in 2008, with passenger vehicles and light trucks making up 74% of this total. Electric vehicles could provide a significant reduc-tion in fuel usage, greenhouse gas emissions, noise, and local air pollution compared to conventional gasoline-powered vehicles. EVs do not emit harmful pollutants from the tailpipe that can ex-acerbate respiratory illness. As the highest levels of air pollution occur in areas of the city with heavier traffic, the transition to EVs would be an important step in improving local air quality.
The environmental benefits of electric vehicles over purely gaso-line powered vehicles depend on a number of factors but are de-termined largely by the generation source of the electricity used to charge the electric vehicle’s battery. The mix of generation sources that provide power to the New York City electric grid would prove favorable to electric vehicles, as approximately 40% of the elec-tricity consumed in New York City is generated by clean energy sources such as nuclear and hydroelectric power.
While widespread adoption of electric vehicles may increase greenhouse gas emissions at local power plants, the decrease in emissions from gasoline consumption would outweigh this impact, resulting in a net benefit of lower overall emissions. Further, cen-tralizing the emissions from on-road vehicles at a small number of power plants rather than dispensing emissions at a large number of vehicle tailpipes provides the opportunity for further emissions reduction by continuing to develop lower-emissions renewable sources such as solar and wind.
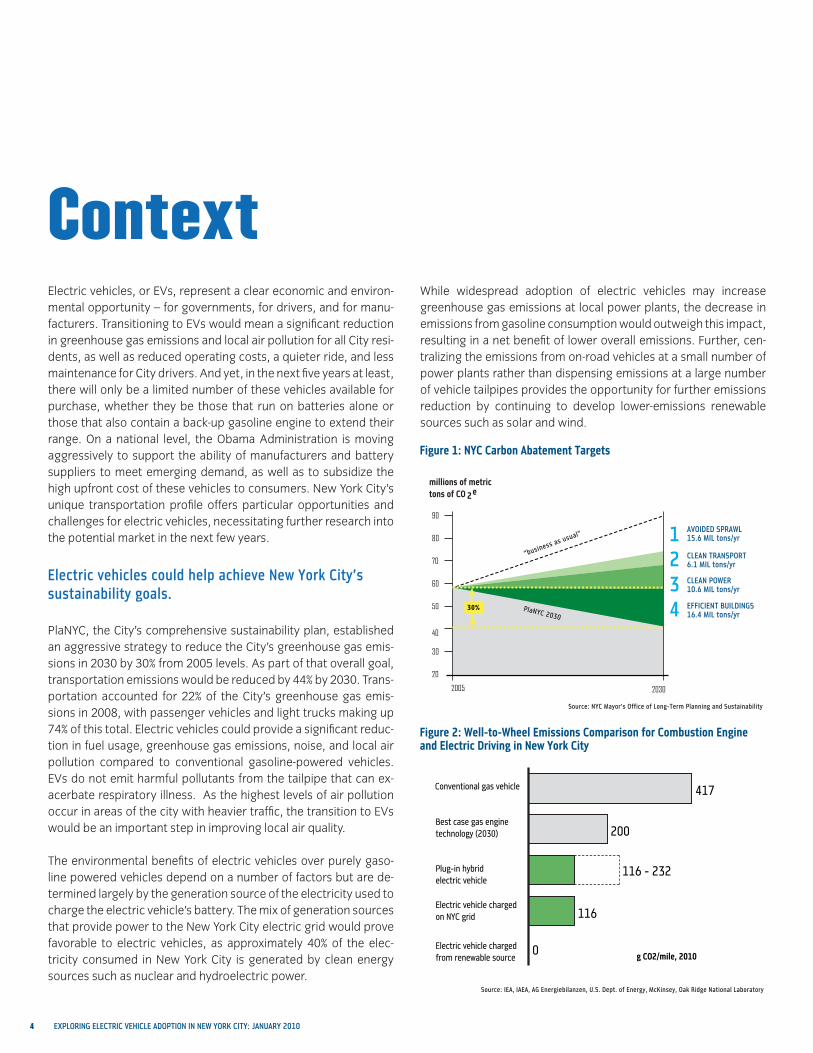
Figure 1: NYC Carbon Abatement Targets
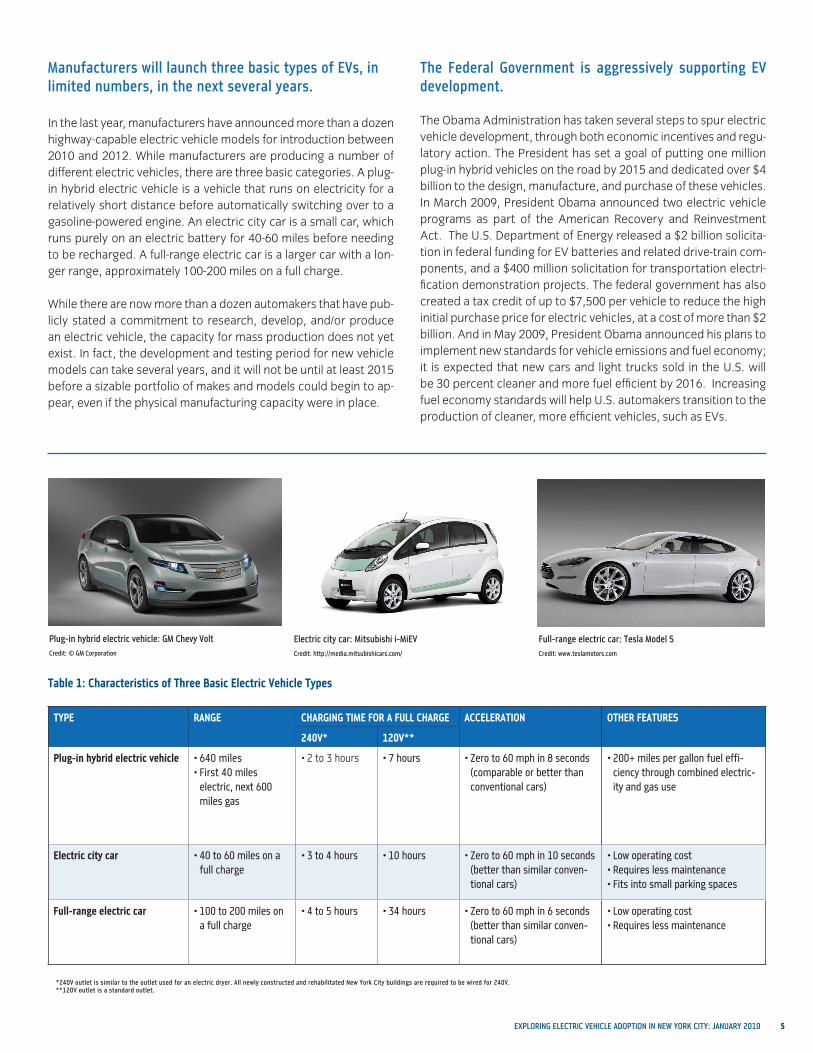
Figure 2: Well-to-Wheel Emissions Comparison for Combustion Engine and Electric Driving in New York City
Source: nyc Mayor’s office of long-term planning and Sustainability
Source: iea, iaea, ag energiebilanzen, u.S. dept. of energy, Mckinsey, oak ridge national laboratory
Electric vehicle charged from renewable source
Best case gas enginetechnology (2030)
116 - 232
Electric vehicle charged on NYC grid
Plug-in hybrid electric vehicle
g CO2/mile, 2010
116
200
417
0
“business as usual”
PlaNYC 2030
avoided sprawl15.6 mIL tons/yr
Clean power10.6 MIL tons/yr
EFFICIENT buildings16.4 MIL tons/yr
SUSTAINABLE transportation6.1 mIL tons/yr
12
34
millions of metric tons of CO 2e
20
30
50
60
70
80
90
20302005
30%
40
Conventional gas vehicle
Electric vehicle charged from renewable source
Best case gas enginetechnology (2030)
116 - 232
Electric vehicle charged on NYC grid
Plug-in hybrid vehicle
g CO2/mile, 2010
116
200
417
0
“business as usual”
PlaNYC 2030
AVOIDED SPRAWL15.6 MIL tons/yr
CLEAN POWER10.6 MIL tons/yr
EFFICIENT BUILDINGS16.4 MIL tons/yr
CLEAN TRANSPORT6.1 MIL tons/yr
1234
millions of metric tons of CO 2e
20
30
50
60
70
80
90
20302005
Conventional gas vehicle
40
30%
5exploring electric vehicle adoption in new york city: january 2010
Manufacturers will launch three basic types of evs, in limited numbers, in the next several years.
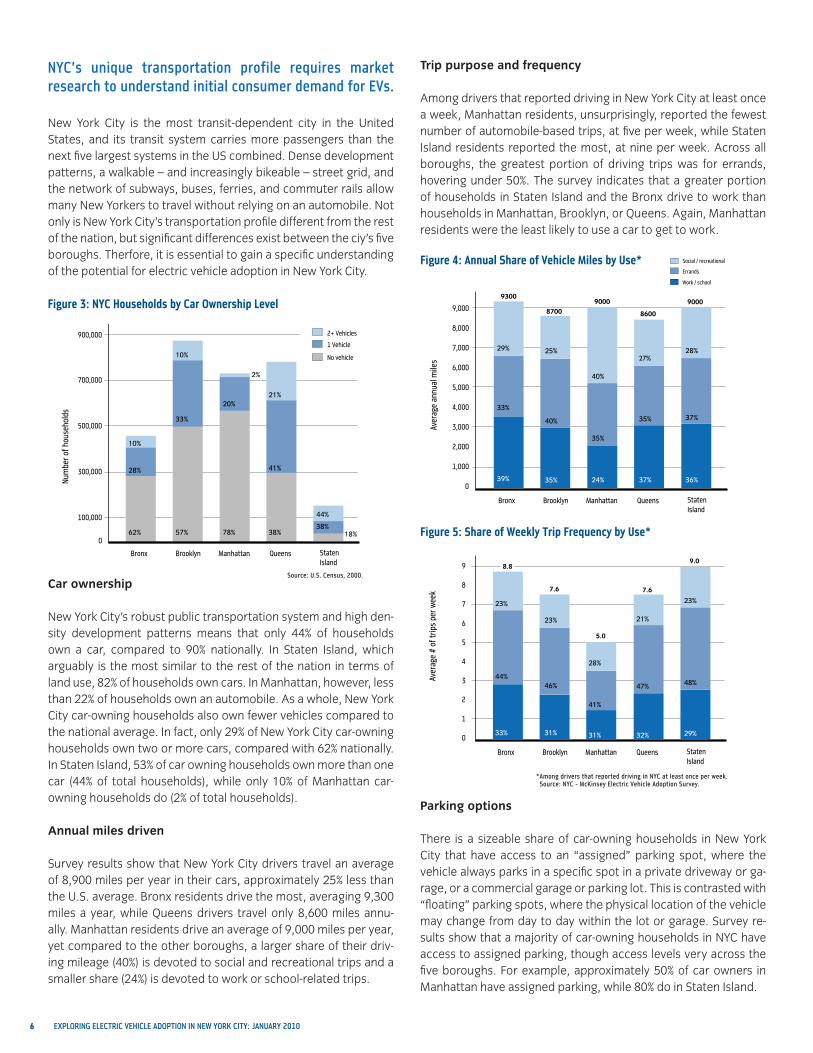
In the last year, manufacturers have announced more than a dozen highway-capable electric vehicle models for introduction between 2010 and 2012. While manufacturers are producing a number of different electric vehicles, there are three basic categories. A plug-in hybrid electric vehicle is a vehicle that runs on electricity for a relatively short distance before automatically switching over to a gasoline-powered engine. An electric city car is a small car, which runs purely on an electric battery for 40-60 miles before needing to be recharged. A full-range electric car is a larger car with a lon-ger range, approximately 100-200 miles on a full charge.
While there are now more than a dozen automakers that have pub-licly stated a commitment to research, develop, and/or produce an electric vehicle, the capacity for mass production does not yet exist. In fact, the development and testing period for new vehicle models can take several years, and it will not be until at least 2015 before a sizable portfolio of makes and models could begin to ap-pear, even if the physical manufacturing capacity were in place.
plug-in hybrid electric vehicle: gM chevy volt credit: © gM corporation
the Federal government is aggressively supporting ev development.
The Obama Administration has taken several steps to spur electric vehicle development, through both economic incentives and regu-latory action. The President has set a goal of putting one million plug-in hybrid vehicles on the road by 2015 and dedicated over $4 billion to the design, manufacture, and purchase of these vehicles. In March 2009, President Obama announced two electric vehicle programs as part of the American Recovery and Reinvestment Act. The U.S. Department of Energy released a $2 billion solicita-tion in federal funding for EV batteries and related drive-train com-ponents, and a $400 million solicitation for transportation electri-fication demonstration projects. The federal government has also created a tax credit of up to $7,500 per vehicle to reduce the high initial purchase price for electric vehicles, at a cost of more than $2 billion. And in May 2009, President Obama announced his plans to implement new standards for vehicle emissions and fuel economy; it is expected that new cars and light trucks sold in the U.S. will be 30 percent cleaner and more fuel efficient by 2016. Increasing fuel economy standards will help U.S. automakers transition to the production of cleaner, more efficient vehicles, such as EVs.
electric city car: Mitsubishi i-Miev credit: http://media.mitsubishicars.com/
Full-range electric car: tesla Model S credit: www.teslamotors.com
Table 1: Characteristics of Three Basic Electric Vehicle Types
*240v outlet is similar to the outlet used for an electric dryer. all newly constructed and rehabilitated new york city buildings are required to be wired for 240v.**120v outlet is a standard outlet.
TYPE RANGE CHARGING TIME FOR A FULL CHARGE ACCELERATION OTHER FEATURES
240V* 120V**
Plug-in hybrid electric vehicle 640 miles• First 40• miles electric, next 600 miles gas
2 to 3 hours• 7 hours• Zero to 60 mph in 8 seconds • (comparable or better than conventional cars)
200+ miles per gallon fuel effi-• ciency through combined electric-ity and gas use
Electric city car 40 to 60 miles on a • full charge
3 to 4 hours• 10 hours• Zero to 60 mph in 10 seconds • (better than similar conven-tional cars)
Low operating cost• Requires less maintenance• Fits into small parking spaces•
Full-range electric car 100 to 200 miles on • a full charge
4 to 5 hours• 34 hours• Zero to 60 mph in 6 seconds • (better than similar conven-tional cars)
Low operating cost• Requires less maintenance•
6 exploring electric vehicle adoption in new york city: january 2010
Trip purpose and frequency
Among drivers that reported driving in New York City at least once a week, Manhattan residents, unsurprisingly, reported the fewest number of automobile-based trips, at five per week, while Staten Island residents reported the most, at nine per week. Across all boroughs, the greatest portion of driving trips was for errands, hovering under 50%. The survey indicates that a greater portion of households in Staten Island and the Bronx drive to work than households in Manhattan, Brooklyn, or Queens. Again, Manhattan residents were the least likely to use a car to get to work.
Parking options
There is a sizeable share of car-owning households in New York City that have access to an “assigned” parking spot, where the vehicle always parks in a specific spot in a private driveway or ga-rage, or a commercial garage or parking lot. This is contrasted with “floating” parking spots, where the physical location of the vehicle may change from day to day within the lot or garage. Survey re-sults show that a majority of car-owning households in NYC have access to assigned parking, though access levels very across the five boroughs. For example, approximately 50% of car owners in Manhattan have assigned parking, while 80% do in Staten Island.
Aver
age
annu
al m
iles
Manhattan QueensBrooklynBronx Staten Island
Manhattan QueensBrooklynBronx Staten Island
Aver
age
# of
trip
s pe
r wee
k
100,000
500,000
700,000
900,000
300,000
Manhattan QueensBrooklynBronx Staten Island
0
1,000
2,000
3,000
4,000
5,000
6,000
7,000
8,000
9,000
39%
33%
29%
35%
40%
25%
24%
35%
40%
37%
35%
27%
36%
37%
28%
9300
87009000
8600
9000
0
1
2
3
4
5
6
7
8
9
33%
44%
23%
7.6
5.0
7.6
9.0
31%
46%
23%
31%
41%
28%
32%
47%
21%
29%
48%
23%
Num
ber o
f hou
seho
lds
62%
28%
10%
57%
33%
10%
78%
20%
2%
38%
41%
21%
18%38%
44%
0
No vehicle
1 Vehicle
2+ Vehicles
Social / recreational
Errands
Work / school
8.8
Aver
age
annu
al m
iles
Manhattan QueensBrooklynBronx Staten Island
Manhattan QueensBrooklynBronx Staten Island
Aver
age
# of
trip
s pe
r wee
k
100,000
500,000
700,000
900,000
300,000
Manhattan QueensBrooklynBronx Staten Island
0
1,000
2,000
3,000
4,000
5,000
6,000
7,000
8,000
9,000
39%
33%
29%
35%
40%
25%
24%
35%
40%
37%
35%
27%
36%
37%
28%
9300
87009000
8600
9000
0
1
2
3
4
5
6
7
8
9
33%
44%
23%
7.6
5.0
7.6
9.0
31%
46%
23%
31%
41%
28%
32%
47%
21%
29%
48%
23%
Num
ber o
f hou
seho
lds
62%
28%
10%
57%
33%
10%
78%
20%
2%
38%
41%
21%
18%38%
44%
0
No vehicle
1 Vehicle
2+ Vehicles
Social / recreational
Errands
Work / school
8.8
nyc’s unique transportation profile requires market research to understand initial consumer demand for evs.
New York City is the most transit-dependent city in the United States, and its transit system carries more passengers than the next five largest systems in the US combined. Dense development patterns, a walkable – and increasingly bikeable – street grid, and the network of subways, buses, ferries, and commuter rails allow many New Yorkers to travel without relying on an automobile. Not only is New York City’s transportation profile different from the rest of the nation, but significant differences exist between the ciy’s five boroughs. Therfore, it is essential to gain a specific understanding of the potential for electric vehicle adoption in New York City.
Car ownership
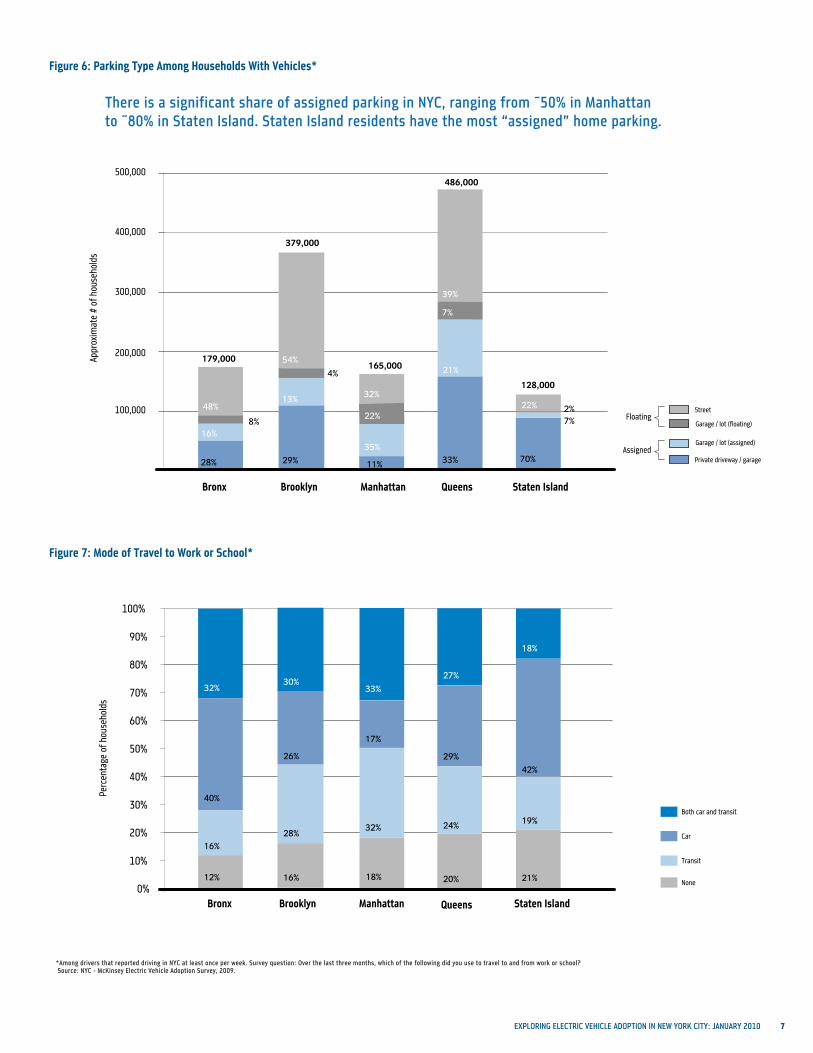
New York City’s robust public transportation system and high den-sity development patterns means that only 44% of households own a car, compared to 90% nationally. In Staten Island, which arguably is the most similar to the rest of the nation in terms of land use, 82% of households own cars. In Manhattan, however, less than 22% of households own an automobile. As a whole, New York City car-owning households also own fewer vehicles compared to the national average. In fact, only 29% of New York City car-owning households own two or more cars, compared with 62% nationally. In Staten Island, 53% of car owning households own more than one car (44% of total households), while only 10% of Manhattan car-owning households do (2% of total households).
Annual miles driven
Survey results show that New York City drivers travel an average of 8,900 miles per year in their cars, approximately 25% less than the U.S. average. Bronx residents drive the most, averaging 9,300 miles a year, while Queens drivers travel only 8,600 miles annu-ally. Manhattan residents drive an average of 9,000 miles per year, yet compared to the other boroughs, a larger share of their driv-ing mileage (40%) is devoted to social and recreational trips and a smaller share (24%) is devoted to work or school-related trips.
Figure 3: NYC Households by Car Ownership Level
Figure 4: Annual Share of Vehicle Miles by Use*
Figure 5: Share of Weekly Trip Frequency by Use*
Source: u.S. census, 2000.
*among drivers that reported driving in nyc at least once per week. Source: nyc - Mckinsey electric vehicle adoption Survey. Av
erag
e an
nual
mile
s
Manhattan QueensBrooklynBronx Staten Island
Manhattan QueensBrooklynBronx Staten Island
Aver
age
# of
trip
s pe
r wee
k
100,000
500,000
700,000
900,000
300,000
Manhattan QueensBrooklynBronx Staten Island
0
1,000
2,000
3,000
4,000
5,000
6,000
7,000
8,000
9,000
39%
33%
29%
35%
40%
25%
24%
35%
40%
37%
35%
27%
36%
37%
28%
9300
87009000
8600
9000
0
1
2
3
4
5
6
7
8
9
33%
44%
23%
7.6
5.0
7.6
9.0
31%
46%
23%
31%
41%
28%
32%
47%
21%
29%
48%
23%
Num
ber o
f hou
seho
lds
62%
28%
10%
57%
33%
10%
78%
20%
2%
38%
41%
21%
18%38%
44%
0
No vehicle
1 Vehicle
2+ Vehicles
Social / recreational
Errands
Work / school
8.8
Aver
age
annu
al m
iles
Manhattan QueensBrooklynBronx Staten Island
Manhattan QueensBrooklynBronx Staten Island
Aver
age
# of
trip
s pe
r wee
k
100,000
500,000
700,000
900,000
300,000
Manhattan QueensBrooklynBronx Staten Island
0
1,000
2,000
3,000
4,000
5,000
6,000
7,000
8,000
9,000
39%
33%
29%
35%
40%
25%
24%
35%
40%
37%
35%
27%
36%
37%
28%
9300
87009000
8600
9000
0
1
2
3
4
5
6
7
8
9
33%
44%
23%
7.6
5.0
7.6
9.0
31%
46%
23%
31%
41%
28%
32%
47%
21%
29%
48%
23%
Num
ber o
f hou
seho
lds
62%
28%
10%
57%
33%
10%
78%
20%
2%
38%
41%
21%
18%38%
44%
0
No vehicle
1 Vehicle
2+ Vehicles
Social / recreational
Errands
Work / school
8.8
7exploring electric vehicle adoption in new york city: january 2010
Figure 6: Parking Type Among Households With Vehicles*
Figure 7: Mode of Travel to Work or School*
*among drivers that reported driving in nyc at least once per week. Survey question: over the last three months, which of the following did you use to travel to and from work or school? Source: nyc - Mckinsey electric vehicle adoption Survey, 2009.
16%28%
32% 24% 19%
40%
26%
17%
29%
42%
32%30%
33%
27%
18%
12% 16% 18% 20% 21%0%
10%
20%
30%
40%
50%
60%
70%
80%
90%
100%
None
Both car and transit
Car
Transit
11%
35%
22%
32%
165,000
Manhattan
33%
21%
7%
39%
486,000
Queens
29%
13%
54%
379,000
Brooklyn
28%
16%8%
48%
179,000
Bronx
70%
7%2%22%
128,000
Staten Island
4%
500,000
Appr
oxim
ate
# of
hou
seho
lds
400,000
300,000
200,000
100,000
Private driveway / garage
Garage / lot (floating)
Garage / lot (assigned)
Street�
Assigned
Floating
Manhattan QueensBrooklynBronx Staten Island
Perc
enta
ge o
f hou
seho
lds
there is a significant share of assigned parking in nyc, ranging from ~50% in Manhattan to ~80% in Staten island. Staten island residents have the most “assigned” home parking.
8 exploring electric vehicle adoption in new york city: january 2010
Study MethodologyWhile a significant body of research exists regarding the overall benefits of electric vehicles, as well as potential technology and implementation challenges, insights from the consumer perspec-tive have been limited and research on the residents of New York City is non-existent. As a result, the City, in partnership with McKin-sey & Company, sought to conduct a market research study to:
McKinsey & Company is leading a global research effort that also includes the cities of Paris and Shanghai to evaluate the evolution toward an electric vehicle ecosystem.
The consumer research was conducted in four phases: informal interviews, an initial quantitative survey, qualitative research in-volving individual and group interviews, and a full-length quantita-tive survey.
Phase 1: Informal interviews
The research team conducted a series of 40-minute interviews with consumers identified through an informal network. These conversations helped the research team form initial opinions re-garding who might adopt EVs, why they would adopt, and particu-lar incentives that may be appealing. The interviews also helped the team understand impressions of, motivations for, and barriers to EV adoption.
Phase 2: Initial quantitative survey
A “quick” quantitative survey was designed to establish a basic fact base regarding current driving and parking patterns in New York City. The survey involved a final sample of over 1,600 drivers, with questions centered on household behaviors such as where they parked their vehicle, how often they used their cars, where they drove to/from, and how far they drove on a regular basis.
Phase 3: Qualitative research
The qualitative research began with interviews of individuals and couples. The research team conducted multi-hour discussions with consumers in their homes and parking/driving space to un-derstand their driving behaviors, vehicle preferences, and perspec-tives on electric cars. The team then conducted focus groups of 4 to 8 individuals, to explore attitudes and consumer reactions to the specific types of electric vehicles. Finally, the team conducted two full-day workshops with more than 20 attendees each, com-prising consumers and industry experts. These workshops were devoted to identifying potential actions that various stakeholders could take to drive EV adoption.
Phase 4: Full-length quantitative survey
In the full-length survey, 1,384 consumers were asked to complete a 45-minute survey. Respondents qualified for the survey if they: owned at least one car; did not reject electric vehicles outright; were between 18 and 65 years of age; were willing to buy or lease a new vehicle; and had a budget of greater than $15,000 for their next vehicle. The survey sample was representative of 28% of the total population of New York City, and 63% of the city’s car-owning households. When exploring consumer preferences where there is a perceived societal preference – like being “green” – it is impor-tant to design research that will overcome this bias. In the quan-titative survey, respondents were first educated about electric ve-hicles, their benefits, and potential drawbacks, so that they could more realistically envision what types of EVs would be available in the market in the next few years. Then, the survey took respon-dents through an exercise where they were presented with a series of scenarios and asked, given various realistic assumptions, which vehicle they would prefer to purchase, including a conventional gasoline-powered vehicle. These assumptions included what the car might look like, its brand and model, purchase price, potential operating costs based on different driving behaviors, and a set of other incentives, such as financial benefits (tax credit or dealer re-bates), charging infrastructure options, and other actions.
Determine potential “early adopters” of electric vehicles•
Identify size and characteristics of EV consumer segmentsUnderstand how NYC driving and parking patterns may af-fect EV uptake
Recommend possible steps the City and other stakehold-ers could take to enable EV adoption
Identify and compare a set of potential initiatives and policies to influence customer behavior
•
9exploring electric vehicle adoption in new york city: january 2010
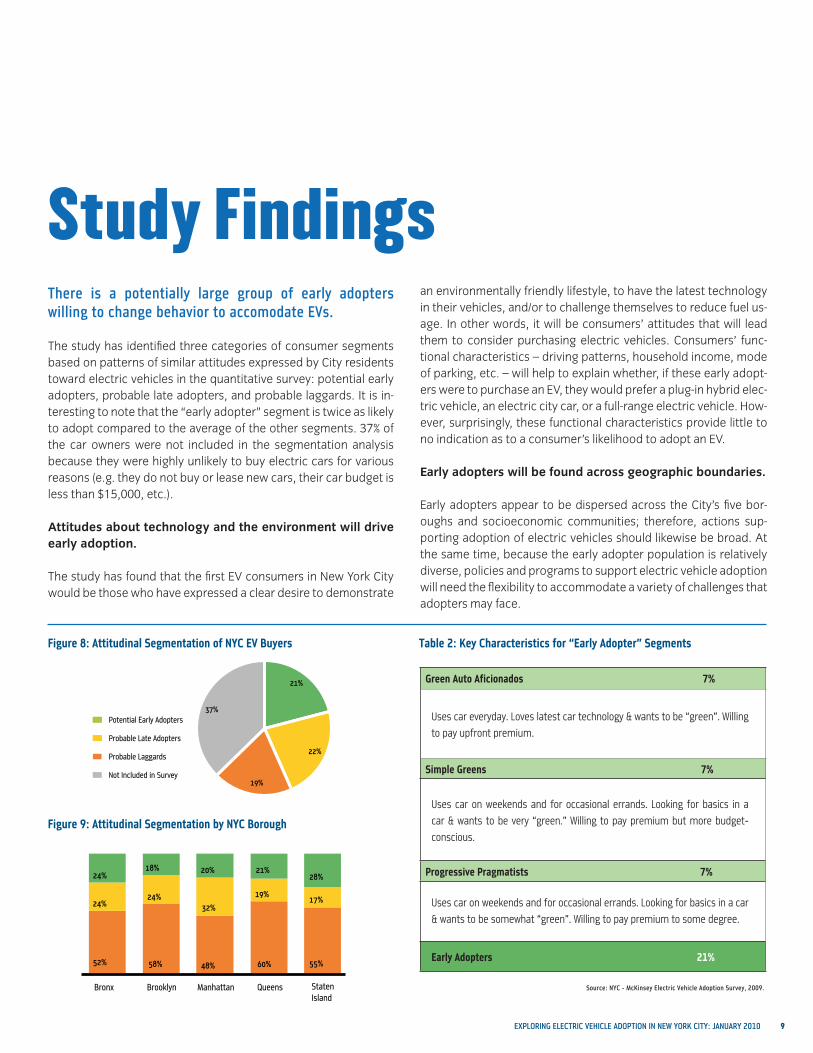
Study Findingsthere is a potentially large group of early adopters willing to change behavior to accomodate evs.
The study has identified three categories of consumer segments based on patterns of similar attitudes expressed by City residents toward electric vehicles in the quantitative survey: potential early adopters, probable late adopters, and probable laggards. It is in-teresting to note that the “early adopter” segment is twice as likely to adopt compared to the average of the other segments. 37% of the car owners were not included in the segmentation analysis because they were highly unlikely to buy electric cars for various reasons (e.g. they do not buy or lease new cars, their car budget is less than $15,000, etc.).
Attitudes about technology and the environment will drive early adoption.
The study has found that the first EV consumers in New York City would be those who have expressed a clear desire to demonstrate
an environmentally friendly lifestyle, to have the latest technology in their vehicles, and/or to challenge themselves to reduce fuel us-age. In other words, it will be consumers’ attitudes that will lead them to consider purchasing electric vehicles. Consumers’ func-tional characteristics – driving patterns, household income, mode of parking, etc. – will help to explain whether, if these early adopt-ers were to purchase an EV, they would prefer a plug-in hybrid elec-tric vehicle, an electric city car, or a full-range electric vehicle. How-ever, surprisingly, these functional characteristics provide little to no indication as to a consumer’s likelihood to adopt an EV.
Early adopters will be found across geographic boundaries.
Early adopters appear to be dispersed across the City’s five bor-oughs and socioeconomic communities; therefore, actions sup-porting adoption of electric vehicles should likewise be broad. At the same time, because the early adopter population is relatively diverse, policies and programs to support electric vehicle adoption will need the flexibility to accommodate a variety of challenges that adopters may face.
Figure 8: Attitudinal Segmentation of NYC EV Buyers Table 2: Key Characteristics for “Early Adopter” Segments
Manhattan QueensBrooklynBronx Staten Island
Potential Early Adopters
Probable Late Adopters
Probable Laggards
Not Included in Survey
21%
22%
19%
37%
24%24%
32%
19%17%
28%
55%48%
21%18%
60%
20%
58%52%
24%
Manhattan QueensBrooklynBronx Staten Island
Potential Early Adopters
Probable Late Adopters
Probable Laggards
Not Included in Survey
21%
22%
19%
37%
24%24%
32%
19%17%
28%
55%48%
21%18%
60%
20%
58%52%
24%
Green Auto Aficionados 7%
Uses car everyday. Loves latest car technology & wants to be “green”. Willing to pay upfront premium.
Simple Greens 7%
Uses car on weekends and for occasional errands. Looking for basics in a car & wants to be very “green.” Willing to pay premium but more budget-conscious.
Progressive Pragmatists 7%
Uses car on weekends and for occasional errands. Looking for basics in a car & wants to be somewhat “green”. Willing to pay premium to some degree.
Early Adopters 21%
Figure 9: Attitudinal Segmentation by NYC Borough
Source: nyc - Mckinsey electric vehicle adoption Survey, 2009.
10 exploring electric vehicle adoption in new york city: january 2010
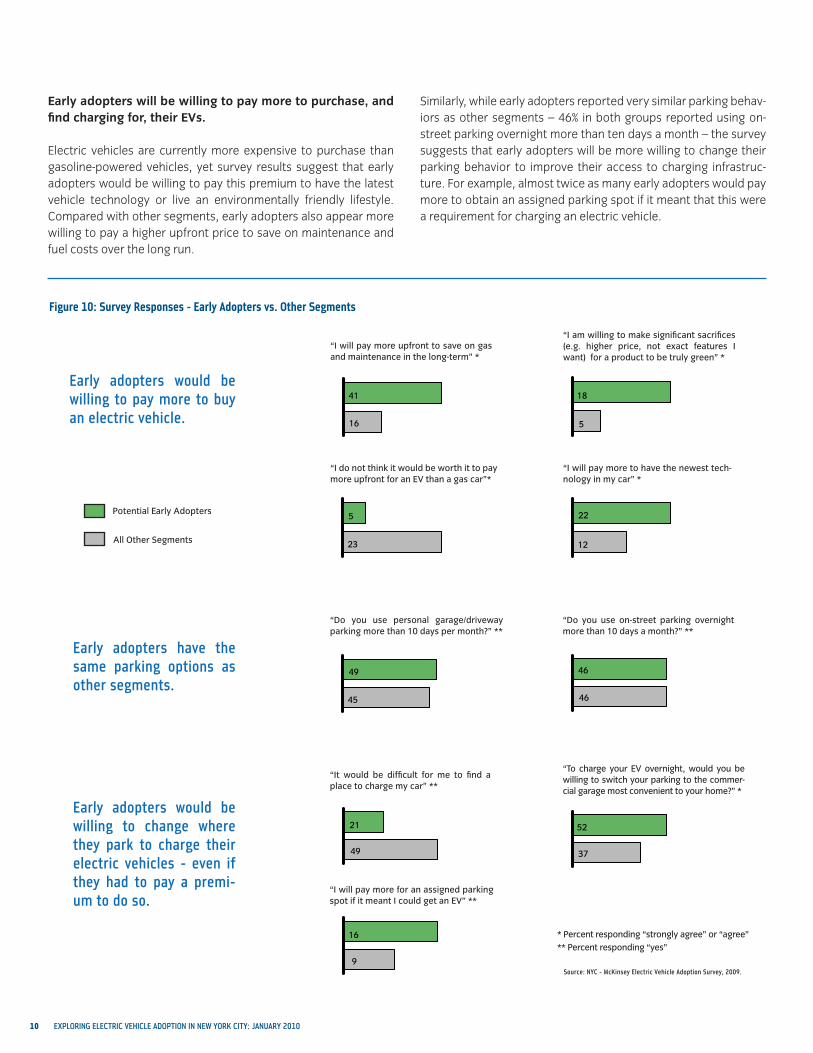
Early adopters will be willing to pay more to purchase, and find charging for, their EVs.
Electric vehicles are currently more expensive to purchase than gasoline-powered vehicles, yet survey results suggest that early adopters would be willing to pay this premium to have the latest vehicle technology or live an environmentally friendly lifestyle. Compared with other segments, early adopters also appear more willing to pay a higher upfront price to save on maintenance and fuel costs over the long run.
Similarly, while early adopters reported very similar parking behav-iors as other segments – 46% in both groups reported using on-street parking overnight more than ten days a month – the survey suggests that early adopters will be more willing to change their parking behavior to improve their access to charging infrastruc-ture. For example, almost twice as many early adopters would pay more to obtain an assigned parking spot if it meant that this were a requirement for charging an electric vehicle.
“I am willing to make significant sacrifices (e.g. higher price, not exact features I want) for a product to be truly green” *
“I will pay more to have the newest tech-nology in my car” *
early adopters have the same parking options as other segments.
“Do you use on-street parking overnight more than 10 days a month?” **
Figure 10: Survey Responses - Early Adopters vs. Other Segments
early adopters would be willing to pay more to buy an electric vehicle. 16
41
5
18
23
5
12
22
49
21
46
46
45
49
9
16
37
52
Early adopters would be willing to pay more to buy an electric vehicle
Early adopters would be willing to change where they park to charge their electric vehicles - even if they had to pay a premium to do so
Early adopters have the same parking options as other segments
Figure 10: Survey responses - Early adopters vs. others
16
41
5
18
23
5
12
22
49
21
46
46
45
49
9
16
37
52
Early adopters would be willing to pay more to buy an electric vehicle
Early adopters would be willing to change where they park to charge their electric vehicles - even if they had to pay a premium to do so
Early adopters have the same parking options as other segments
Figure 10: Survey responses - Early adopters vs. others
“I will pay more upfront to save on gas and maintenance in the long-term” *
16
41
5
18
23
5
12
22
49
21
46
46
45
49
9
16
37
52
Early adopters would be willing to pay more to buy an electric vehicle
Early adopters would be willing to change where they park to charge their electric vehicles - even if they had to pay a premium to do so
Early adopters have the same parking options as other segments
Figure 10: Survey responses - Early adopters vs. others
“I do not think it would be worth it to pay more upfront for an EV than a gas car”*
16
41
5
18
23
5
12
22
49
21
46
46
45
49
9
16
37
52
Early adopters would be willing to pay more to buy an electric vehicle
Early adopters would be willing to change where they park to charge their electric vehicles - even if they had to pay a premium to do so
Early adopters have the same parking options as other segments
Figure 10: Survey responses - Early adopters vs. others
“It would be difficult for me to find a place to charge my car” **
“I will pay more for an assigned parking spot if it meant I could get an EV” **
16
41
5
18
23
5
12
22
49
21
46
46
45
49
9
16
37
52
Early adopters would be willing to pay more to buy an electric vehicle
Early adopters would be willing to change where they park to charge their electric vehicles - even if they had to pay a premium to do so
Early adopters have the same parking options as other segments
Figure 10: Survey responses - Early adopters vs. others
“Do you use personal garage/driveway parking more than 10 days per month?” **
16
41
5
18
23
5
12
22
49
21
46
46
45
49
9
16
37
52
Early adopters would be willing to pay more to buy an electric vehicle
Early adopters would be willing to change where they park to charge their electric vehicles - even if they had to pay a premium to do so
Early adopters have the same parking options as other segments
Figure 10: Survey responses - Early adopters vs. others
early adopters would be willing to change where they park to charge their electric vehicles - even if they had to pay a premi-um to do so.
16
41
5
18
23
5
12
22
49
21
46
46
45
49
9
16
37
52
Early adopters would be willing to pay more to buy an electric vehicle
Early adopters would be willing to change where they park to charge their electric vehicles - even if they had to pay a premium to do so
Early adopters have the same parking options as other segments
Figure 10: Survey responses - Early adopters vs. others
16
41
5
18
23
5
12
22
49
21
46
46
45
49
9
16
37
52
Early adopters would be willing to pay more to buy an electric vehicle
Early adopters would be willing to change where they park to charge their electric vehicles - even if they had to pay a premium to do so
Early adopters have the same parking options as other segments
Figure 10: Survey responses - Early adopters vs. others
“To charge your EV overnight, would you be willing to switch your parking to the commer-cial garage most convenient to your home?” *
* Percent responding “strongly agree” or “agree”
** Percent responding “yes”
Potential Early Adopters
All Other Segments
Source: nyc - Mckinsey electric vehicle adoption Survey, 2009.
11exploring electric vehicle adoption in new york city: january 2010
Plug-in hybrid cars
Electric city cars
Full range electric cars
8 - 9%
5 - 6%
1%
Likelihood of Adoption
11 Source: New York City Electric Vehicle Adoption Survey, 2009, NY State DMV
Theoretical potential
Reduced awareness
Cumulative number of EVs (‘000s)
0
5
10
15
20
2518-20%
14-16%13-15% 5-15%
% of NYC vehicles
Tons of carbon abated (‘000s) per year
Constraining assumptions
50-60 41-47 38-45 15-45
2.5-3.5 2-2.5 2-2.5 0-2.5
170-180 145-160 135-150 50-150
Level of awareness100% 80% 80%80%
Volume availability Limited
Model availability Preferred brands Preferred brands Limited brands
100% 100% 100%
Limited brands
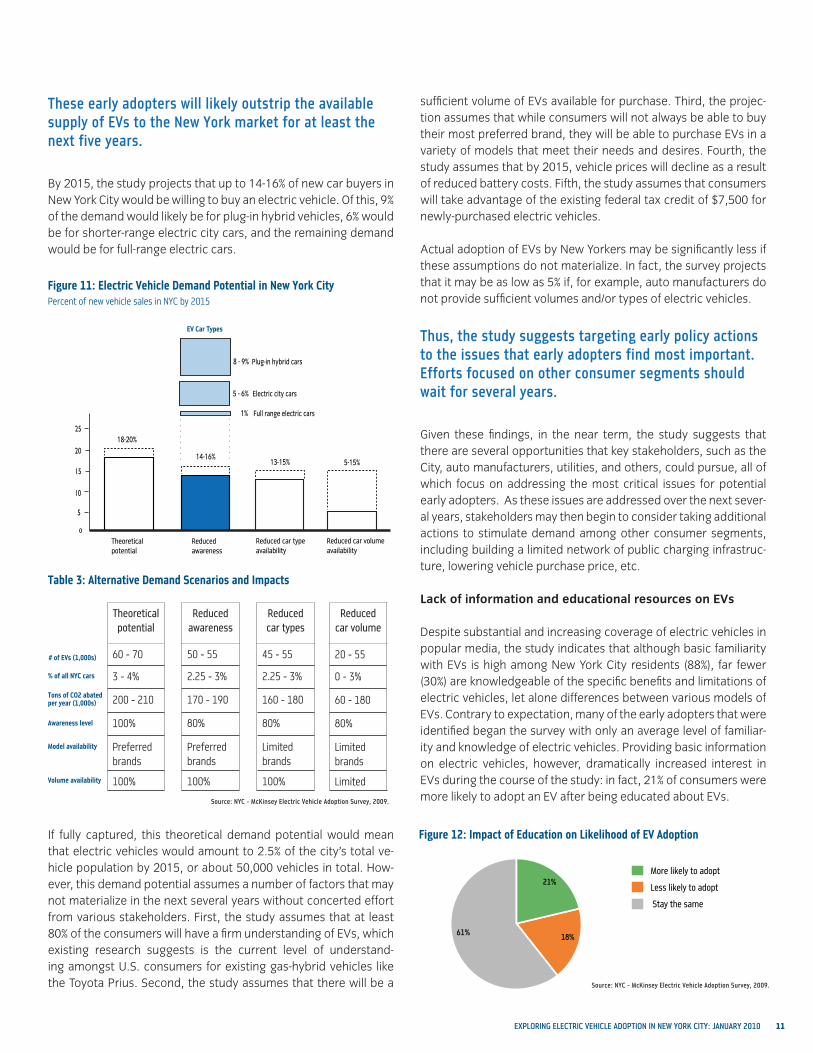
Figure 11: Electric vehicle demand potential in New York City
Reduced car typeavailability
Reduced car volume availability
these early adopters will likely outstrip the available supply of evs to the new york market for at least the next five years.
By 2015, the study projects that up to 14-16% of new car buyers in New York City would be willing to buy an electric vehicle. Of this, 9% of the demand would likely be for plug-in hybrid vehicles, 6% would be for shorter-range electric city cars, and the remaining demand would be for full-range electric cars.
If fully captured, this theoretical demand potential would mean that electric vehicles would amount to 2.5% of the city’s total ve-hicle population by 2015, or about 50,000 vehicles in total. How-ever, this demand potential assumes a number of factors that may not materialize in the next several years without concerted effort from various stakeholders. First, the study assumes that at least 80% of the consumers will have a firm understanding of EVs, which existing research suggests is the current level of understand-ing amongst U.S. consumers for existing gas-hybrid vehicles like the Toyota Prius. Second, the study assumes that there will be a
sufficient volume of EVs available for purchase. Third, the projec-tion assumes that while consumers will not always be able to buy their most preferred brand, they will be able to purchase EVs in a variety of models that meet their needs and desires. Fourth, the study assumes that by 2015, vehicle prices will decline as a result of reduced battery costs. Fifth, the study assumes that consumers will take advantage of the existing federal tax credit of $7,500 for newly-purchased electric vehicles.
Actual adoption of EVs by New Yorkers may be significantly less if these assumptions do not materialize. In fact, the survey projects that it may be as low as 5% if, for example, auto manufacturers do not provide sufficient volumes and/or types of electric vehicles.
thus, the study suggests targeting early policy actions to the issues that early adopters find most important. efforts focused on other consumer segments should wait for several years.
Given these findings, in the near term, the study suggests that there are several opportunities that key stakeholders, such as the City, auto manufacturers, utilities, and others, could pursue, all of which focus on addressing the most critical issues for potential early adopters. As these issues are addressed over the next sever-al years, stakeholders may then begin to consider taking additional actions to stimulate demand among other consumer segments, including building a limited network of public charging infrastruc-ture, lowering vehicle purchase price, etc. Lack of information and educational resources on EVs
Despite substantial and increasing coverage of electric vehicles in popular media, the study indicates that although basic familiarity with EVs is high among New York City residents (88%), far fewer (30%) are knowledgeable of the specific benefits and limitations of electric vehicles, let alone differences between various models of EVs. Contrary to expectation, many of the early adopters that were identified began the survey with only an average level of familiar-ity and knowledge of electric vehicles. Providing basic information on electric vehicles, however, dramatically increased interest in EVs during the course of the study: in fact, 21% of consumers were more likely to adopt an EV after being educated about EVs.
Figure 11: Electric Vehicle Demand Potential in New York City
Figure 12: Impact of Education on Likelihood of EV Adoption
21%
18%61%
More likely to adopt
Less likely to adopt
Stay the same
21%
18%61%
More likely to adopt
Less likely to adopt
Stay the same
Theoretical potential
60 - 70
3 - 4%
200 - 210
100%
Preferred brands
100%
Reduced awareness
50 - 55
2.25 - 3%
170 - 190
80%
Preferred brands
100%
Reduced car types
45 - 55
2.25 - 3%
160 - 180
80%
Limited brands
100%
Reduced car volume
20 - 55
0 - 3%
60 - 180
80%
Limited brands
Limited
# of EVs (1,000s)
% of all NYC cars
Tons of CO2 abated per year (1,000s)
Awareness level
Model availability
Volume availability
Table 3: Alternative Demand Scenarios and Impacts
EV Car Types
Percent of new vehicle sales in NYC by 2015
Source: nyc - Mckinsey electric vehicle adoption Survey, 2009.
Source: nyc - Mckinsey electric vehicle adoption Survey, 2009.
12 exploring electric vehicle adoption in new york city: january 2010
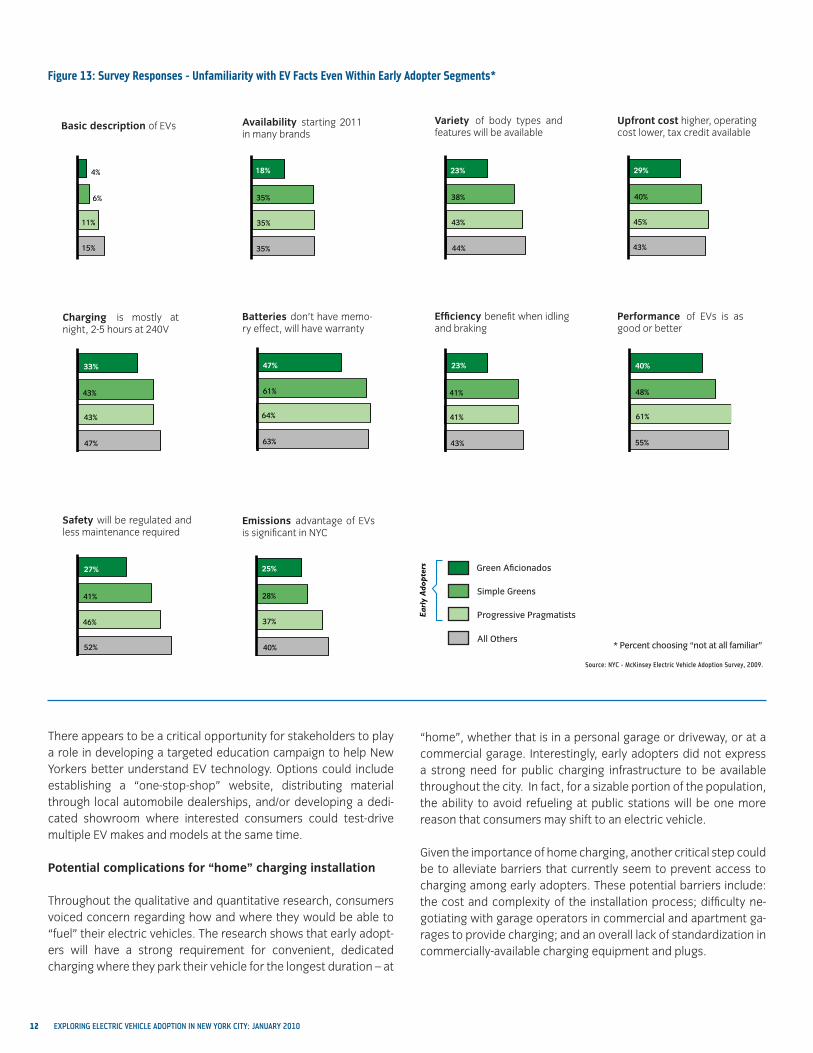
Figure 13: Survey Responses - Unfamiliarity with EV Facts Even Within Early Adopter Segments*
There appears to be a critical opportunity for stakeholders to play a role in developing a targeted education campaign to help New Yorkers better understand EV technology. Options could include establishing a “one-stop-shop” website, distributing material through local automobile dealerships, and/or developing a dedi-cated showroom where interested consumers could test-drive multiple EV makes and models at the same time.
Potential complications for “home” charging installation
Throughout the qualitative and quantitative research, consumers voiced concern regarding how and where they would be able to “fuel” their electric vehicles. The research shows that early adopt-ers will have a strong requirement for convenient, dedicated charging where they park their vehicle for the longest duration – at
“home”, whether that is in a personal garage or driveway, or at a commercial garage. Interestingly, early adopters did not express a strong need for public charging infrastructure to be available throughout the city. In fact, for a sizable portion of the population, the ability to avoid refueling at public stations will be one more reason that consumers may shift to an electric vehicle.
Given the importance of home charging, another critical step could be to alleviate barriers that currently seem to prevent access to charging among early adopters. These potential barriers include: the cost and complexity of the installation process; difficulty ne-gotiating with garage operators in commercial and apartment ga-rages to provide charging; and an overall lack of standardization in commercially-available charging equipment and plugs.
25%27%
40%23%47%33%
29%23%4%
a
28%41%
48%41%61%43%
40%38%6%
37%46%
61%41%64%43%
45%43%11%
40%52%
55%43%63%47%
43%44%15%
Green Aficionados
All Others
Simple Greens
ProgressivePragmatists
Early Adopters
18%
35%
35%
35%
16
41
* Percent choosing “not at all familiar”
Availability starting 2011 in many brands
Variety of body types and features will be available
Upfront cost higher, operating cost lower, tax credit available
25%27%
40%23%47%33%
29%23%4%
a
28%41%
48%41%61%43%
40%38%6%
37%46%
61%41%64%43%
45%43%11%
40%52%
55%43%63%47%
43%44%15%
Green Aficionados
All Others
Simple Greens
ProgressivePragmatists
Early Adopters
18%
35%
35%
35%
16
41
Charging is mostly at night, 2-5 hours at 240V
Batteries don’t have memo-ry effect, will have warranty
Efficiency benefit when idling and braking
Performance of EVs is as good or better
25%27%
40%23%47%33%
29%23%4%
a
28%41%
48%41%61%43%
40%38%6%
37%46%
61%41%64%43%
45%43%11%
40%52%
55%43%63%47%
43%44%15%
Green Aficionados
All Others
Simple Greens
ProgressivePragmatists
Early Adopters
18%
35%
35%
35%
16
41
Safety will be regulated and less maintenance required
Emissions advantage of EVs is significant in NYC
25%27%
40%23%47%33%
29%23%4%
a
28%41%
48%41%61%43%
40%38%6%
37%46%
61%41%64%43%
45%43%11%
40%52%
55%43%63%47%
43%44%15%
Green Aficionados
All Others
Simple Greens
ProgressivePragmatists
Early Adopters
18%
35%
35%
35%
16
41
25%27%
40%23%47%33%
29%23%4%
a
28%41%
48%41%61%43%
40%38%6%
37%46%
61%41%64%43%
45%43%11%
40%52%
55%43%63%47%
43%44%15%
Green Aficionados
All Others
Simple Greens
ProgressivePragmatists
Early Adopters
18%
35%
35%
35%
16
41
Basic description of EVs
Green Aficionados
Simple Greens
Progressive Pragmatists
All Others
25% 27%
40% 23% 47% 33%
29% 23% 4%
a
28% 41%
48% 41% 61% 43%
40% 38% 6%
37% 46%
61% 41% 64% 43%
45% 43% 11%
40% 52%
55% 43% 63% 47%
43% 44% 15%
Green Aficionados
All Others
Simple Greens
ProgressivePragmatists
Earl
y A
dopt
ers
18%
35%
35%
35%
16
41
25%27%
40%23%47%33%
29%23%4%
a
28%41%
48%41%61%43%
40%38%6%
37%46%
61%41%64%43%
45%43%11%
40%52%
55%43%63%47%
43%44%15%
Green Aficionados
All Others
Simple Greens
ProgressivePragmatists
Early Adopters
18%
35%
35%
35%
16
41
25%27%
40%23%47%33%
29%23%4%
a
28%41%
48%41%61%43%
40%38%6%
37%46%
61%41%64%43%
45%43%11%
40%52%
55%43%63%47%
43%44%15%
Green Aficionados
All Others
Simple Greens
ProgressivePragmatists
Early Adopters
18%
35%
35%
35%
16
41
25%27%
40%23%47%33%
29%23%4%
a
28%41%
48%41%61%43%
40%38%6%
37%46%
61%41%64%43%
45%43%11%
40%52%
55%43%63%47%
43%44%15%
Green Aficionados
All Others
Simple Greens
ProgressivePragmatists
Early Adopters
18%
35%
35%
35%
16
41
25%27%
40%23%47%33%
29%23%4%
a
28%41%
48%41%61%43%
40%38%6%
37%46%
61%41%64%43%
45%43%11%
40%52%
55%43%63%47%
43%44%15%
Green Aficionados
All Others
Simple Greens
ProgressivePragmatists
Early Adopters
18%
35%
35%
35%
16
41
25%27%
40%23%47%33%
29%23%4%
a
28%41%
48%41%61%43%
40%38%6%
37%46%
61%41%64%43%
45%43%11%
40%52%
55%43%63%47%
43%44%15%
Green Aficionados
All Others
Simple Greens
ProgressivePragmatists
Early Adopters
18%
35%
35%
35%
16
41
Source: nyc - Mckinsey electric vehicle adoption Survey, 2009.
13exploring electric vehicle adoption in new york city: january 2010
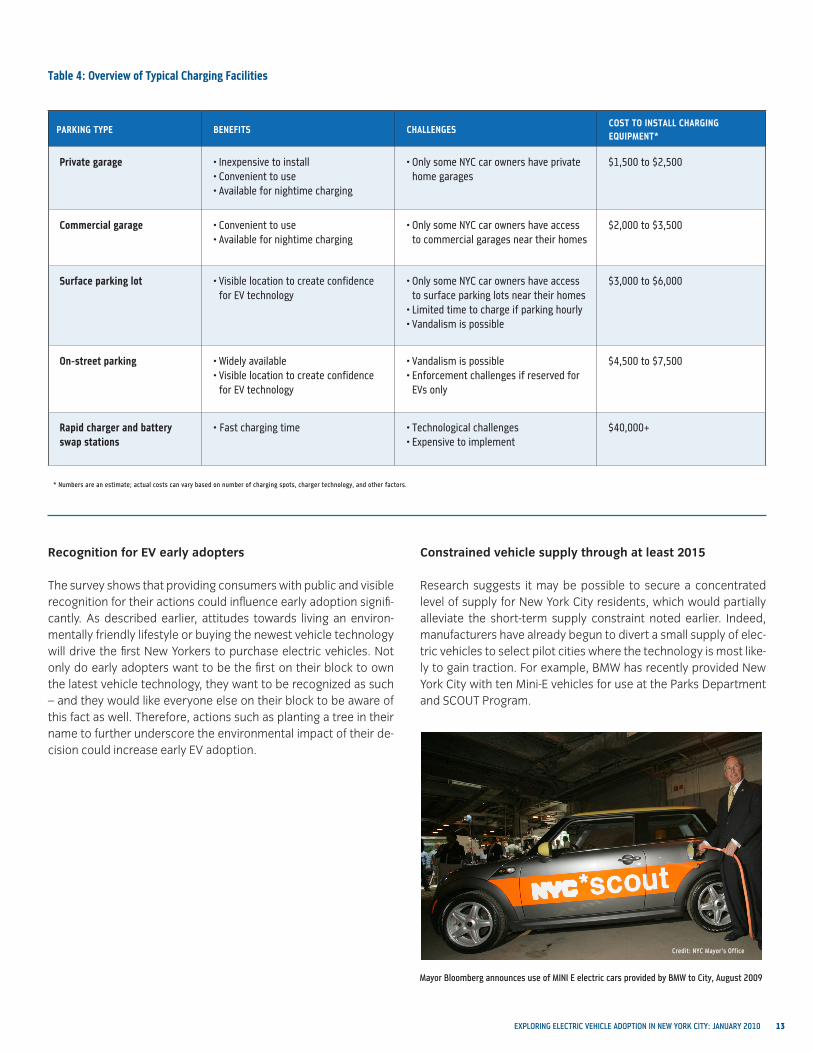
Recognition for EV early adopters
The survey shows that providing consumers with public and visible recognition for their actions could influence early adoption signifi-cantly. As described earlier, attitudes towards living an environ-mentally friendly lifestyle or buying the newest vehicle technology will drive the first New Yorkers to purchase electric vehicles. Not only do early adopters want to be the first on their block to own the latest vehicle technology, they want to be recognized as such – and they would like everyone else on their block to be aware of this fact as well. Therefore, actions such as planting a tree in their name to further underscore the environmental impact of their de-cision could increase early EV adoption.
Constrained vehicle supply through at least 2015
Research suggests it may be possible to secure a concentrated level of supply for New York City residents, which would partially alleviate the short-term supply constraint noted earlier. Indeed, manufacturers have already begun to divert a small supply of elec-tric vehicles to select pilot cities where the technology is most like-ly to gain traction. For example, BMW has recently provided New York City with ten Mini-E vehicles for use at the Parks Department and SCOUT Program.
PARKING TYPE BENEFITS CHALLENGESCOST TO INSTALL CHARGING EqUIPMENT*
Private garage • Inexpensive to install• Convenient to use• Available for nightime charging
Only some NYC car owners have private • home garages
$1,500 to $2,500
Commercial garage • Convenient to use • Available for nightime charging
Only some NYC car owners have access • to commercial garages near their homes
$2,000 to $3,500
Surface parking lot • Visible location to create confidence for EV technology
Only some NYC car owners have access • to surface parking lots near their homesLimited time to charge if parking hourly• Vandalism is possible•
$3,000 to $6,000
On-street parking • Widely available• Visible location to create confidence
for EV technology
Vandalism is possible• Enforcement challenges if reserved for • EVs only
$4,500 to $7,500
Rapid charger and battery swap stations
• Fast charging time Technological challenges• Expensive to implement •
$40,000+
Table 4: Overview of Typical Charging Facilities
* numbers are an estimate; actual costs can vary based on number of charging spots, charger technology, and other factors.
Mayor Bloomberg announces use of Mini e electric cars provided by BMw to city, august 2009
credit: nyc Mayor’s office
14 exploring electric vehicle adoption in new york city: january 2010
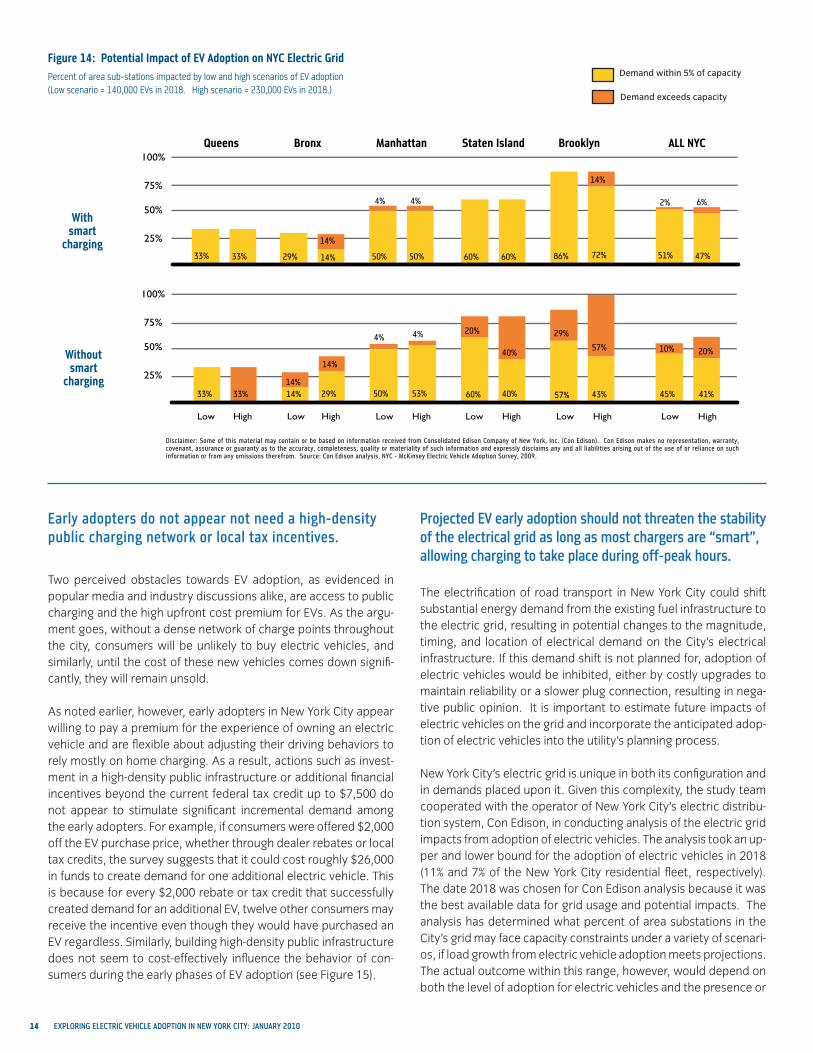
early adopters do not appear not need a high-density public charging network or local tax incentives.
Two perceived obstacles towards EV adoption, as evidenced in popular media and industry discussions alike, are access to public charging and the high upfront cost premium for EVs. As the argu-ment goes, without a dense network of charge points throughout the city, consumers will be unlikely to buy electric vehicles, and similarly, until the cost of these new vehicles comes down signifi-cantly, they will remain unsold.
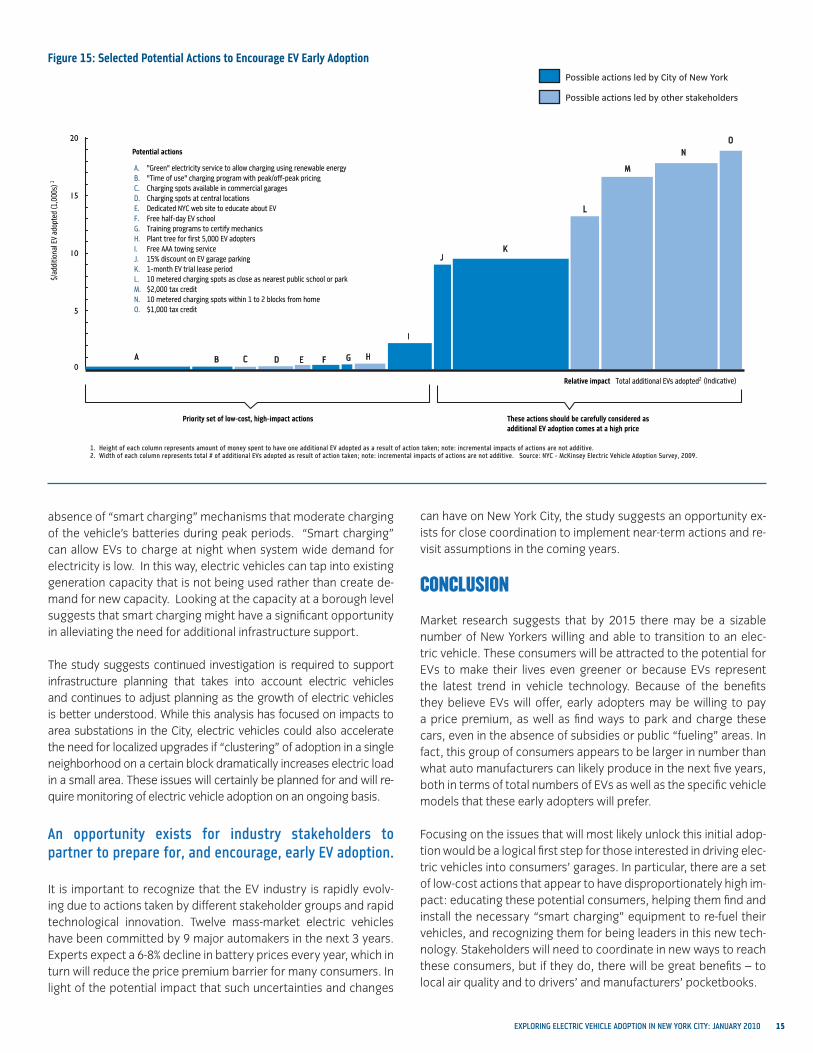
As noted earlier, however, early adopters in New York City appear willing to pay a premium for the experience of owning an electric vehicle and are flexible about adjusting their driving behaviors to rely mostly on home charging. As a result, actions such as invest-ment in a high-density public infrastructure or additional financial incentives beyond the current federal tax credit up to $7,500 do not appear to stimulate significant incremental demand among the early adopters. For example, if consumers were offered $2,000 off the EV purchase price, whether through dealer rebates or local tax credits, the survey suggests that it could cost roughly $26,000 in funds to create demand for one additional electric vehicle. This is because for every $2,000 rebate or tax credit that successfully created demand for an additional EV, twelve other consumers may receive the incentive even though they would have purchased an EV regardless. Similarly, building high-density public infrastructure does not seem to cost-effectively influence the behavior of con-sumers during the early phases of EV adoption (see Figure 15).
projected ev early adoption should not threaten the stability of the electrical grid as long as most chargers are “smart”, allowing charging to take place during off-peak hours.
The electrification of road transport in New York City could shift substantial energy demand from the existing fuel infrastructure to the electric grid, resulting in potential changes to the magnitude, timing, and location of electrical demand on the City’s electrical infrastructure. If this demand shift is not planned for, adoption of electric vehicles would be inhibited, either by costly upgrades to maintain reliability or a slower plug connection, resulting in nega-tive public opinion. It is important to estimate future impacts of electric vehicles on the grid and incorporate the anticipated adop-tion of electric vehicles into the utility’s planning process.
New York City’s electric grid is unique in both its configuration and in demands placed upon it. Given this complexity, the study team cooperated with the operator of New York City’s electric distribu-tion system, Con Edison, in conducting analysis of the electric grid impacts from adoption of electric vehicles. The analysis took an up-per and lower bound for the adoption of electric vehicles in 2018 (11% and 7% of the New York City residential fleet, respectively). The date 2018 was chosen for Con Edison analysis because it was the best available data for grid usage and potential impacts. The analysis has determined what percent of area substations in the City’s grid may face capacity constraints under a variety of scenari-os, if load growth from electric vehicle adoption meets projections. The actual outcome within this range, however, would depend on both the level of adoption for electric vehicles and the presence or
Figure 14: Potential Impact of EV Adoption on NYC Electric Grid
50%
4%
50%
4%
60% 60%14%
14%
29%33%33% 72%
14%
86%
High
50% 53%
Low
4%4%
High
60% 40%
Low
20%
40%14%
Low
14%14%
High
29%
High
33%
Low
33%
High
43%
57%
Low
29%
57%
Queens Bronx Manhattan Staten Island Brooklyn
Demand within 5% of capacity
Demand exceeds capacity
2%
51%
6%
47%
High
41%
20%
Low
45%
10%
ALL NYC
100%
75%
50%
25%
100%
75%
50%
25%
Percent of sub-stations impacted by low and high scenarios of EV adoption
50%
4%
50%
4%
60% 60%14%
14%
29%33%33% 72%
14%
86%
High
50% 53%
Low
4%4%
High
60% 40%
Low
20%
40%14%
Low
14%14%
High
29%
High
33%
Low
33%
High
43%
57%
Low
29%
57%
Queens Bronx Manhattan Staten Island Brooklyn
Demand within 5% of capacity
Demand exceeds capacity
2%
51%
6%
47%
High
41%
20%
Low
45%
10%
ALL NYC
100%
75%
50%
25%
100%
75%
50%
25%
Percent of sub-stations impacted by low and high scenarios of EV adoption
With smart
charging
Without smart
charging
disclaimer: Some of this material may contain or be based on information received from consolidated edison company of new york, inc. (con edison). con edison makes no representation, warranty, covenant, assurance or guaranty as to the accuracy, completeness, quality or materiality of such information and expressly disclaims any and all liabilities arising out of the use of or reliance on such information or from any omissions therefrom. Source: con edison analysis, nyc - Mckinsey electric vehicle adoption Survey, 2009.
Percent of area sub-stations impacted by low and high scenarios of EV adoption(Low scenario = 140,000 EVs in 2018. High scenario = 230,000 EVs in 2018.)
50%
4%
50%
4%
60% 60%14%
14%
29%33%33% 72%
14%
86%
High
50% 53%
Low
4%4%
High
60% 40%
Low
20%
40%14%
Low
14%14%
High
29%
High
33%
Low
33%
High
43%
57%
Low
29%
57%
Queens Bronx Manhattan Staten Island Brooklyn
Demand within 5% of capacity
Demand exceeds capacity
2%
51%
6%
47%
High
41%
20%
Low
45%
10%
ALL NYC
100%
75%
50%
25%
100%
75%
50%
25%
Percent of sub-stations impacted by low and high scenarios of EV adoption
Demand exceeds capacity
Demand within 5% of capacity
15exploring electric vehicle adoption in new york city: january 2010
absence of “smart charging” mechanisms that moderate charging of the vehicle’s batteries during peak periods. “Smart charging” can allow EVs to charge at night when system wide demand for electricity is low. In this way, electric vehicles can tap into existing generation capacity that is not being used rather than create de-mand for new capacity. Looking at the capacity at a borough level suggests that smart charging might have a significant opportunity in alleviating the need for additional infrastructure support.
The study suggests continued investigation is required to support infrastructure planning that takes into account electric vehicles and continues to adjust planning as the growth of electric vehicles is better understood. While this analysis has focused on impacts to area substations in the City, electric vehicles could also accelerate the need for localized upgrades if “clustering” of adoption in a single neighborhood on a certain block dramatically increases electric load in a small area. These issues will certainly be planned for and will re-quire monitoring of electric vehicle adoption on an ongoing basis.
an opportunity exists for industry stakeholders to partner to prepare for, and encourage, early ev adoption.
It is important to recognize that the EV industry is rapidly evolv-ing due to actions taken by different stakeholder groups and rapid technological innovation. Twelve mass-market electric vehicles have been committed by 9 major automakers in the next 3 years. Experts expect a 6-8% decline in battery prices every year, which in turn will reduce the price premium barrier for many consumers. In light of the potential impact that such uncertainties and changes
can have on New York City, the study suggests an opportunity ex-ists for close coordination to implement near-term actions and re-visit assumptions in the coming years.
CONCLUSION
Market research suggests that by 2015 there may be a sizable number of New Yorkers willing and able to transition to an elec-tric vehicle. These consumers will be attracted to the potential for EVs to make their lives even greener or because EVs represent the latest trend in vehicle technology. Because of the benefits they believe EVs will offer, early adopters may be willing to pay a price premium, as well as find ways to park and charge these cars, even in the absence of subsidies or public “fueling” areas. In fact, this group of consumers appears to be larger in number than what auto manufacturers can likely produce in the next five years, both in terms of total numbers of EVs as well as the specific vehicle models that these early adopters will prefer.
Focusing on the issues that will most likely unlock this initial adop-tion would be a logical first step for those interested in driving elec-tric vehicles into consumers’ garages. In particular, there are a set of low-cost actions that appear to have disproportionately high im-pact: educating these potential consumers, helping them find and install the necessary “smart charging” equipment to re-fuel their vehicles, and recognizing them for being leaders in this new tech-nology. Stakeholders will need to coordinate in new ways to reach these consumers, but if they do, there will be great benefits – to local air quality and to drivers’ and manufacturers’ pocketbooks.
Figure 15: Selected Potential Actions to Encourage EV Early Adoption
0
0
5
20
15
10
Relative impact
$/ad
ditio
nal E
V ad
opte
d (1
,000
s) 1
Potential actions
These actions should be carefully considered as additional EV adoption comes at a high price
Priority set of low-cost, high-impact actions
A. "Green" electricity service to allow charging using renewable energyB. "Time of use" charging program with peak/off-peak pricingC. Charging spots available in commercial garagesD. Charging spots at central locationsE. Dedicated NYC web site to educate about EVF. Free half-day EV schoolG. Training programs to certify mechanicsH. Plant tree for first 5,000 EV adoptersI. Free AAA towing serviceJ. 15% discount on EV garage parking K. 1-month EV trial lease periodL. 10 metered charging spots as close as nearest public school or park M. $2,000 tax creditN. 10 metered charging spots within 1 to 2 blocks from homeO. $1,000 tax credit
Possible actions led by City of New YorkPossible actions led by other stakeholders
Total additional EVs adopted2 (Indicative)
A B C D G H
I
JK
L
M
NO
E F
1. height of each column represents amount of money spent to have one additional ev adopted as a result of action taken; note: incremental impacts of actions are not additive. 2. width of each column represents total # of additional evs adopted as result of action taken; note: incremental impacts of actions are not additive. Source: nyc - Mckinsey electric vehicle adoption Survey, 2009.
Possible actions led by City of New York
Possible actions led by other stakeholders

16 exploring electric vehicle adoption in new york city: january 2010
The Frequently Asked Questions below were presented to con-sumers during the third and fourth phases of research.
What is an electric vehicle?
“Electric vehicle” is a term used to describe any car, truck, or SUV that is able to drive on electric power instead of using gasoline. This electric power comes from a battery that is recharged by plugging into an electrical outlet. Some of these electric vehicles drive on electric power only and do not use gasoline. Other elec-tric vehicles operate on electric power, but they also have a gaso-line engine in addition to the electric motor.
When will these electric vehicles be available?
There are very few electric vehicles on the market today, but many major manufacturers will offer them beginning in 2010-2011.
How does the cost of electric vehicles compare?
Electric vehicles are currently more expensive to manufacture than traditional gasoline vehicles but it is not yet clear how that may change. There is currently a $7,500 federal tax credit for pur-chasing an electric vehicle, up to a maximum of 60,000 vehicles per manufacturer.
The day-to-day cost of driving an electric vehicle in New York, in-cluding electricity and maintenance, will be 40% to 70% less than a gasoline vehicle costs to operate, including gasoline and mainte-nance. If gas prices increase, the savings from using electric cars will be higher. The price of electricity may also increase in the future but the price of electricity is more consistent and changes more slowly than gasoline prices. Electric vehicles offer a favorable total cost of ownership only when lower operating costs offset the higher purchase cost. Therefore, higher annual mileage, which al-lows drivers to take advantage of the lower operating cost, proves favorable to the total cost of ownership of EVs.
How do I charge an electric vehicle?
Most owners will charge their electric vehicles when they park at night. Electrical outlets may already exist where they park or they can be installed in a driveway, personal garage, parking lot, park-ing garage, or might be available in the street. Electric vehicles can be charged from a standard 120 volt outlet but will charge faster from a 240 volt outlet. These 240 volt outlets are already present in most homes and are used for electric stoves, electric dryers, and large air conditioners. If the owner doesn’t already have an outlet near where they park, any electrician can perform the installation.
How long will the batteries last?
Electric vehicles contain advanced batteries that can be recharged and unplugged at any time during charging and will last about 7-10 years. Drivers will be able to charge every night without worrying about shortening the battery’s life. When drivers go on vacation, they can leave their vehicle unplugged and it won’t run down or they can leave it plugged in and it will stop charging automatically. State laws in New York, New Jersey, Connecticut and several other states require manufacturers to warranty batteries in electric ve-hicles for at least 10 years or 150,000 miles.
What is it like to drive an electric vehicle?
Electric motors deliver comparable or better acceleration com-pared to gasoline engines. This means that most electric vehicles will accelerate faster from 0 to 60 mph than similar cars powered by gasoline. Electric vehicles may need to be plugged in more fre-quently than you are used to refilling your gas tank but you can recharge from anywhere there is an electric outlet.
How “green” are electric vehicles?
Driving on electric power results in no tailpipe emissions but the electricity to recharge your car may come from power plants that burn fuel. Electric driving is especially “green” in New York City where a large amount of electricity comes from upstate low-emis-sion sources like hydroelectric dams and nuclear.
Appendix

17exploring electric vehicle adoption in new york city: january 2010
A wide range of potential stakeholder actions were identified through qualitative research and then tested for impact through the quantitative survey.
Charging infrastructure
Able to install charger at “home” garage•Able to install charger at “home” garage & public charging •available within 2 miles of homeAble to install charger at “home” garage & public charging •available near closest school or parkAble to install charger at “home” garage & public charging •available within 1-2 blocks of homePublic charging at central locations (Times Square)•Public charging near big shopping centers (IKEA, Target) •Public charging at major transportation areas (Jamaica, Citifield, •JFK, LGA)Public charging at hourly/daily commercial parking garages•Free installation of charger at “home” garage•Battery swap stations where gas stations exist today•Fast-charging stations where gas stations exist today•
Tax credits and rebates
$0 tax credit on upfront price of car•$1,000 tax credit on upfront price of car•$2,000 tax credit on upfront price of car•$3,000 tax credit on upfront price of car•$2,000 OEM rebate on upfront price of car•
Consumer awareness
Training program to certify mechanics to work on EVs, creating •“green jobs”Free half-day EV school providing consumer education and •experience with an EVDedicated NYC website and hotline to educate customers •regarding EVEVs appear on cover of major magazines and driven by major •political/entertainment figures
Other potential actions
15% discount on garage parking space, with EV charging •infrastructure available30% discount on garage parking space, with EV charging •infrastructure available One month trial lease periodFree AAA/towing service anywhere in city and immediate •loaner vehicle if requestedGuarantee EV will have resale value similar to gasoline vehicle•Option to upgrade vehicle to newer technology in future at •pre-determined priceFree unlimited Metrocard for 1 year•EV preferred lanes on select major roads•Low-emission-vehicle-only areas of city•Free rental car for 10 days over 2 years•“Time of use” charging program with different rates for peak/•off-peak rate“Green” electricity to charge EV only with renewable energy•“Green apple” license plate just for EVs•City to plant street tree in name of first 5,000 New Yorkers who •buy an EVCity declares goal for increasing number of EVs in fleet by 2015•EVs on cover of magazines and driven by politicians and •entertainment figures

18 exploring electric vehicle adoption in new york city: january 2010
Figure
Figure 1: Figure 2: Figure 3: Figure 4: Figure 5: Figure 6: Figure 7: Figure 8: Figure 9: Figure 10: Figure 11: Figure 12: Figure 13: Figure 14: Figure 15:
NYC Carbon Abatement Targets.............................................................................................. Well-to-Wheel Emissions Comparison for Combustion Engine and EVs in NYC...........................NYC Households by Car Ownership Level................................................................................Annual Share of Vehicle Miles by Use.....................................................................................Share of Weekly Trip Frequency by Use...................................................................................Parking Type Among Households With Vehicles......................................................................Mode of Travel to Work or School...........................................................................................Attitudinal Segmentation of NYC EV Buyers............................................................................Attitudinal Segmentation by NYC Borough..............................................................................Survey Responses - Early Adopters vs. Others Segments........................................................Electric Vehicle Demand Potential in New York City.................................................................Impact of Education on Likelihood of EV Adoption..................................................................Survey Responses - Unfamiliarity with EV Facts Even Within Early Adopter Segments............Potential Impact of EV Adoption on NYC Electric Grid.............................................................Selected Potential Actions to Encourage EV Early Adoption...................................................
Characteristics of Three Basic Electric Vehicle Types..............................................................Key Characteristics for “Early Adopter” Segments..................................................................Alternative Demand Scenarios and Impacts............................................................................Overview of Typical Charging Facilities....................................................................................
...4
...4
...6
...6
...6
...7
...7
...9
...9
.10
.11
.11
.12
.14
.15
...5
...9
.11
.13
Page
Table Table 1: Table 2:Table 3: Table 4:
Tables and Figures


This report is intended to provide guidance from which policy decisions may be based. The City of New York does not accept responsibility for the completeness or accuracy of this report, and it shall not be held liable for any damage or loss that may result, either directly or indirectly, as a result of its use.

Mayor’s Office of Long-Term Planning and SustainabilityCity HallNew York, NY 10007www.nyc.gov/PlaNYC2030