exploring geological processes: using a classroom ... · pdf fileexploring geological...
TRANSCRIPT

1
ExploringGeologicalProcesses:UsingaClassroom
DeformationalSandbox
MaryEllsworthEarthSystemScienceTeacher
LaurentClercCenterGallaudetUniversityWashington,D.C.
“I unders tand be t ter why there are mounta ins and val l eys and how they
deve loped ove r mil l ions of years . I t g ives me a be t ter s ense of how ol d the Earth ac tual l y is , which is qui te amazing . “
- S. Evringham, Junior

2
TableofContentsIntroductiontothedeformationalsandbox....................... 3 Whatisadeformationalsandbox? ConceptsaddressedthroughsandboxactivitiesExampleUnitSummary:PlateTectonics.........................4ExampleUnitPlan:PlateTectonics.......................... 6Notesonimplementingsandboxesintheclassroom.................. 9Pictorialdescriptionsofbasicsandboxactivities ................ 10
LearningActivity#1:ContractionInvestigation LearningActivity#2:ExtensionInvestigationLearningExtensionActivity:OpenStudentInvestigation................ 14 ScienceContentStandards............................... 15
AAASProject2061BenchmarksNASNationalScienceEducationStandards
Appendix.......................................18
DataSheetforSandboxObservationsReportPresentationRubrics(ASLandOral)ReportWritingChecklists
AdditionalResources:(notincludedinthisGuide,availableonline)
“Analogmodelsetupandsandboxdesign”,byMarioDelCastello http://www.geo.umass.edu/structure/analog_models/App_Des_revised.pdf “SandboxExperiments”,byMicheleCookeandMarioDelCastello
http://www.geo.umass.edu/structure/analog_models/sandbox_experiments.pdf“”THE“UPS”AND“DOWNS”OFTHEEARTHSURFACE”,AreviewofPlateTectonics,byDr.MarioDelCastello http://www.geo.umass.edu/structure/analog_models/Ups_and_downs.pdf
CreditsTheclassroomdeformationalsandboxwasdesignbytheUniversityofMassachusettsGeosciencesDepartmentforstudentsinK‐12classroomsfundedbyagrantfromtheNationalScienceFoundation.ProjectDirectorisDr.MicheleCooke,GeoscienceDepartment,UniversityofMassachusettsAmherst

3
WhatisaDeformationalSandbox? The photo above shows a deformational sandbox designed for use in the middle or high school classroom. As the photo shows, the sandbox has a stationary back wall (to the left), a movable wall (shown cranked nearly to the back wall), two side wall with plexiglass viewing windows and a handle for cranking the moveable wall. Students layer sand in the box and then crank the movable wall either in (for contraction) or out (for extension) to learn how the Earth's crust deforms under these conditions. The deformational sandbox models allow students to create simulations of geologic process that are too large and slow to observe directly. Furthermore, the sandbox set up can be modified to explore a variety of conditions and hypotheses The research sandbox can provide students a depth of understanding of the complexity of crustal processes like no other activity usually found in the high school science classroom. The observations and measurements of fault formation help students better appreciate the geoscientist’s task of sorting out the principles that determine the formation of faults, mountains, rift valleys, and other tectonic features. Concepts addressed through sandbox activities
Plate Tectonics lithosphere theory of plate tectonics plate boundaries tectonic processes fault normal fault reverse or thrust fault contraction extension erosion Earth’s crust crustal plates fault block mountains uplift
Sandbox Modeling accretionary wedge accretionary wedge growth basins subsiding wedge length and height contraction and extension equilibrium erosional event deformation Faults and faulting fault activation fault slipping dip angles back thrust fault boundary effects
Scientific Method and Science Skills observation sketching hypothesis interpreting measuring inference analyzing conclusions scientific method experimental modeling scales of time and space writing and reporting bird’s eye (or map) view

4
cross sectional view

5
Subject/Course:EarthScience UnitTitle:PlateTectonics Grade:8Step 1 - Desired Results
Unit Summary The theory of plate tectonics describes large scale motions of the Earth’s lithosphere. Students will learn the interior structure of the Earth, the nature and structure of the crust, how convection in the mantle drives the movement of the crustal plates, major geological events that result, how to use a physical model to study large scale events, and how to approach the study through the process of scientific inquiry. Standards and indicators Ohio Science Content Standard: Earth and Space Sciences 9. Describe the interior structure of Earth and Earth’s crust, as divided into tectonic plates riding on top of the slow-moving currents of magma in the mantle. 10. Explain that most major geological events (e.g., earthquakes, volcanic eruptions, hot spots and mountain building) result from plate motion. 11. Use models to analyze the size and shape of Earth, its surface and its interior (e.g., globes, topographic maps, satellite images). Ohio Science Content Standard: Scientific Inquiry: 2. Formulate and identify questions to guide scientific investigations that connect to science concepts and can be answered through scientific investigations. 3. Read, construct and interpret data in various forms produced by self and others in both written and oral form (tables, charts, maps, graphs, diagrams and symbols) Big Ideas / Enduring Understandings The Earth’s surface is always changing due to forces within the earth. Plate tectonics explains how many of the Earth’s features form. The Earth’s plates move along cracks called faults at the plate boundaries. We can’t do experiments on the Earth (it’s too big!) but we can use a model to help us study and understand what happens when the plates move.
Essential Questions What is inside the earth? Why do we have earthquakes, volcanic eruptions, hot spots and mountains? How are different landforms made? How did scientists develop theories about and study how the Earth changes?
Content layers inside the earth continental and oceanic crust Moho mantle, outer core and inner core. continental drift. Seafloor spreading Evidence supports continental drift and seafloor spreading. plate boundaries (divergent, convergent and transform) kinds of faults (normal, reverse and slip-strike faults) Heat and plate tectonics. plate tectonics and mountains, ocean basins, rift valleys, volcanic islands, earthquakes, and volcanoes.
SKILLS Use topographical models to show the earth’s surface long ago and today. Construct models to show the earth’s interior structure. Research and analyze the scientific evidence for continental drift. Research and analyze the scientific evidence for seafloor spreading. Observe computer models that show the changes in continents position from 250 million years ago to their present day position. Observe changes in the deformational sandbox under extensional and contraction conditions and draw the observations. Collect data and draw conclusions using a model of contraction and extension conditions. Design and conduct an experiment to test an idea.
Step 2: Evidence of Understanding Assessments
Unit Summary

6
Performance Task: Research Report Research project on Iceland’s rift valley; Hawaiian Island formation; the formation of the Himalayan Mountains; fossil remains that provide support for continental drift Performance Task: Lab Report Write a summary report on the observations made during the sandbox activities, including background information, the purpose of the activities, and conclusions. Performance Task: Written Test Given a diagram label the layers inside the earth; using a map showing the tectonic plates; identify four different plate boundaries; given graphics identify types of faults and whether it is formed under contraction or extension.
Step 3 - Learning Plan Learning Activities • K-W-L: Identify questions students have about the earth.
Discuss what questions scientists may have asked about the earth. How are they the same or different?
• Find out how scientists have used their questions and observations to develop a hypothesis or a theory about how the earth has changed overtime.
• Discuss ways scientist could find out what was inside the earth. • Given the pieces of a map of the world cut out along continental
plates, try to fit them together. • Construct a model of the interior of the Earth; label layers • Use paper to make a model of a divergent boundary with seafloor
spreading. • Set up and run experiments on the deformational sandbox to
show movement of the crust for two kinds of faults: normal (under extension) reverse (under contraction). Use paper to demonstrate strike-slip faults (under lateral movement).
• Using the deformational sandbox, show what happens when continental plates pull apart to form rift valleys.
• Use the deformational sandbox as a model to show what happens at convergent plate boundaries.
• Label a diagram of the Earth’s crust showing the relationships of ., earthquakes, volcanic eruptions, hot spots and mountain building to plate boundaries. (correlate with satellite data).
Resources Internet website:
http://atlas.geo.cornell.edu/education/student/continental_puzzle.html Types of Faults http://scign.jpl.nasa.gov/learn/plate6.htm The Southern California Integrated GPS Network Education Module http://scign.jpl.nasa.gov/learn/index.htm
Smithsonian Museum of Natural History: The Dynamic Earth http://www.mnh.si.edu/earth/main_frames.html Use the Internet to research Pangaea, plate tectonics, hot spots, rift valleys, the formation of the Himalayan Mountains, faults,
7
Subject/Course: Earth Science Grade: Notes on
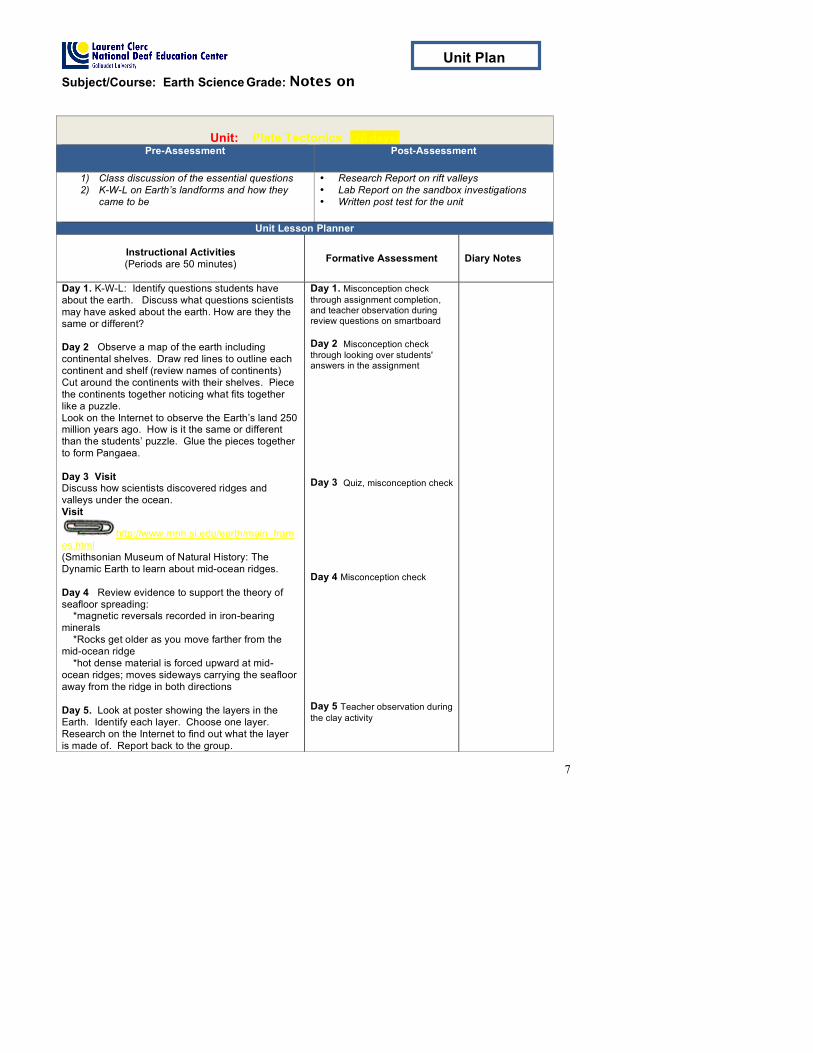
Unit: Plate Tectonics (20 days)
Pre-Assessment Post-Assessment
1) Class discussion of the essential questions 2) K-W-L on Earth’s landforms and how they
came to be
• Research Report on rift valleys • Lab Report on the sandbox investigations • Written post test for the unit
Unit Lesson Planner
Instructional Activities (Periods are 50 minutes) Formative Assessment Diary Notes
Day 1. K-W-L: Identify questions students have about the earth. Discuss what questions scientists may have asked about the earth. How are they the same or different? Day 2 Observe a map of the earth including continental shelves. Draw red lines to outline each continent and shelf (review names of continents) Cut around the continents with their shelves. Piece the continents together noticing what fits together like a puzzle. Look on the Internet to observe the Earth’s land 250 million years ago. How is it the same or different than the students’ puzzle. Glue the pieces together to form Pangaea. Day 3 Visit Discuss how scientists discovered ridges and valleys under the ocean. Visit
http://www.mnh.si.edu/earth/main_frames.html (Smithsonian Museum of Natural History: The Dynamic Earth to learn about mid-ocean ridges. Day 4 Review evidence to support the theory of seafloor spreading: *magnetic reversals recorded in iron-bearing minerals *Rocks get older as you move farther from the mid-ocean ridge *hot dense material is forced upward at mid-ocean ridges; moves sideways carrying the seafloor away from the ridge in both directions Day 5. Look at poster showing the layers in the Earth. Identify each layer. Choose one layer. Research on the Internet to find out what the layer is made of. Report back to the group.
Day 1. Misconception check through assignment completion, and teacher observation during review questions on smartboard Day 2 Misconception check through looking over students' answers in the assignment Day 3 Quiz, misconception check Day 4 Misconception check Day 5 Teacher observation during the clay activity
Unit Plan

8
Use different colors of clay to construct the layers in the earth. (a sphere shape). Cut the sphere in half and label each layer. Type a description of each layer. Day 6 Label the major plates of the lithosphere on a map showing the 16 plates. Discuss that the plates are still moving in different directions. Add arrows to identify which direction the plates are moving. Discuss three types of plate boundaries: convergent boundary. divergent boundary, transverse boundary. Day 7. Plate Puzzle: Students work in small groups to assemble the 16 plates into one whole map of the world. Label different types of plate boundaries on the map showing the 16 different plates. Day 8. Identify three kinds of faults (Normal, Reverse, and Strike-slip) and match them with the types of plate boundaries. Discuss how the interaction of plates produces forces that build mountains, create ocean basins, rift valleys, volcanic islands, earthquakes, and cause volcano. Choose one of the above to research and present in a PowerPoint, poster, or model, etc. Day 9. Continue research. Day 10. Present findings Day 11. Set up for an experiment on the deformational sandbox to show what happens at convergent plate boundaries. (contraction) Write predictions in notebooks, and lay sand layers in the sandbox. Review background information. Day 12. Run the contraction experiment on the deformational sandbox Identify the kinds of faults that form. Make careful drawings of the results as viewed from above and from the side. What kind of faults will develop? Where do the new faults start and what are the angles? Write a summary of your observations. Day 13. Set up for an experiment on the deformational sandbox to show what happens when continental plates pull apart to form rift valleys (extension). Write predictions in notebooks, and lay sand layers in the sandbox. Review background information. Day 14. Run the extension experiment on the deformational sandbox Identify the kinds of faults that form. Make careful drawings of the results as viewed from above and from the side. Write a
Day 6 Misconception check and teacher observation during activity Day 7 Teacher observation during the activity Day 8 Misconception check through assignment completion, and teacher observation during discussion Day 9 Quiz, misconception check Day 10 Teacher observation during the presentations; oral and/or ASL presentation rubrics Day 11 Teacher observation during the activity and misconception check Day 12 Teacher observation during the activity and misconception check; notebook rubrics Day 13 Teacher observation during the activity and misconception check Day 14 Teacher observation during the activity and misconception check
9
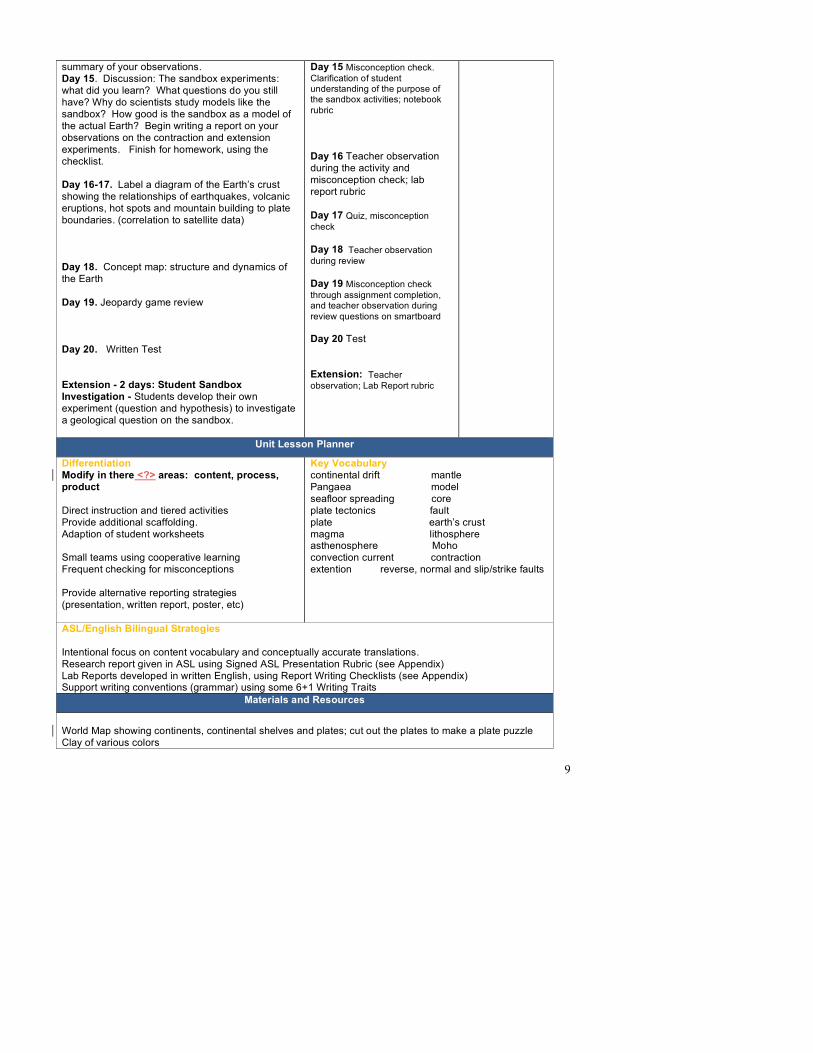
summary of your observations. Day 15. Discussion: The sandbox experiments: what did you learn? What questions do you still have? Why do scientists study models like the sandbox? How good is the sandbox as a model of the actual Earth? Begin writing a report on your observations on the contraction and extension experiments. Finish for homework, using the checklist. Day 16-17. Label a diagram of the Earth’s crust showing the relationships of earthquakes, volcanic eruptions, hot spots and mountain building to plate boundaries. (correlation to satellite data) Day 18. Concept map: structure and dynamics of the Earth Day 19. Jeopardy game review Day 20. Written Test Extension - 2 days: Student Sandbox Investigation - Students develop their own experiment (question and hypothesis) to investigate a geological question on the sandbox.
Day 15 Misconception check. Clarification of student understanding of the purpose of the sandbox activities; notebook rubric Day 16 Teacher observation during the activity and misconception check; lab report rubric Day 17 Quiz, misconception check Day 18 Teacher observation during review Day 19 Misconception check through assignment completion, and teacher observation during review questions on smartboard Day 20 Test Extension: Teacher observation; Lab Report rubric
Unit Lesson Planner
Differentiation Modify in there <?> areas: content, process, product Direct instruction and tiered activities Provide additional scaffolding. Adaption of student worksheets Small teams using cooperative learning Frequent checking for misconceptions Provide alternative reporting strategies (presentation, written report, poster, etc)
Key Vocabulary continental drift mantle Pangaea model seafloor spreading core plate tectonics fault plate earth’s crust magma lithosphere asthenosphere Moho convection current contraction extention reverse, normal and slip/strike faults
ASL/English Bilingual Strategies Intentional focus on content vocabulary and conceptually accurate translations. Research report given in ASL using Signed ASL Presentation Rubric (see Appendix) Lab Reports developed in written English, using Report Writing Checklists (see Appendix) Support writing conventions (grammar) using some 6+1 Writing Traits
Materials and Resources
World Map showing continents, continental shelves and plates; cut out the plates to make a plate puzzle Clay of various colors

10
Deformational sandbox, sandbox sand, colored sand, rulers, protractors, & cups to scoop sand

11
Implementing Sandboxes in the classroom
Tobegininvestigationswiththesandbox,studentsshouldrunatleastonetrialtogetafeelforhowthesandboxworks,andthentheyarereadytosetupforanexperiment.StudentsmightbeinterestedinhowtheEarth’scrustaccommodatesthepressureofcrustalplatespressingtogether,asituationcalledcontraction.InthehistoryoftheEarthcontractionforceshaveproducedlargefaultingthatthrustupmountainrangessuchastheRockyMountainsandHimalaya.
Studentsstartbyfirstlayingdownalternatinglayersofdarkandlightcoloredsandsmoothlyinthebottomofthebox,flatteningeachlayertothedesiredthickness.Forcontractionexperiments,atotalsanddepthofabout7cmisrecommended.Smoothingthesurfaceofthesandisdonewithatrowelortheedgeofaruler.Forextensionadepthofabout2.5cmisrecommendedforbestresults.Note:thesandboxeffectivelymodelstheEarth’scrustonascaleofapproximately1cm=1kmofdepthinthecrust.(See“TheUpsandDownsoftheEarthSurface”byMarioDelCastellofordetailedexplanation)
Studentsusechalktomarkthestartingpositionofthemoveablewall.Whentheset‐upisready,avolunteerbeginstocrankthemoveablewallofthesandbox,compressingthelayerstogether.After10cranks,studentsstopandobservewhathashappened.Studentswillbeabletowatchforboth‘underground’(crosssectional)andsurface(bird’seyeormapview)changes,andmakedrawingsintheirnotebookstoshowbothviews.Theycanlabelfeaturesontheirdrawings:thepositionofthemoveablewall,thenumberofcranks,theview(crosssectionorbird’seye)andthedirectionofforce.Studentsshouldsummarizetheirobservationsintheirownwords.Theycanshowthelocationofanyfaultsthathavestarted,bothintheviewthroughthesidewindowsandfromlookingdownfromabove.Studentsinterestedintheangleofthefaultscanuseaprotractortomeasuretheanglebetweenthehorizontalandthefault.Forcontractionexperiments,thelengthandheightofthewedgecanbemeasuredtorelatedtoequilibriumofforceswithinthesandbox.Whenallobservationshavebeenmade,studentsturnthecrankanother10timesandagainmakenotebookdrawings,labelsandobservationnotes.
Sinceittakessometimetosetupthesandbox,studentscanlayerthesandandpreparetheirnotebooksduringoneclassperiod(questions,predictions,drawingspaces)andthencrankthesandbox,observeandrecordduringasecondclassperiod.
ExampleofStudentnotebookdrawingsandobservations
This is a scan from a student’s notebook, showing a cross-section view (upper) and a bird’s eye view of the sandbox after 40 turns. The student has observed how many faults developed, measured the fault angles and added the measurements to the drawing. The direction of force from the cranking is indicated, along with the location of the newest fault to appear. A note summarizing the student’s observations is at the bottom of the page.

12
Pictorial descriptions of basic sandbox activities Learning Activity 1: Contraction Investigation Contraction happens when the Earth's crustal plates collide. Background When pushing forces on the Earth’s crust overcome the strength of facing tectonic plates, the crust breaks and one block (or plate) slides beneath the other. This situation is called contraction. The faults formed during contraction are called thrust or normal faults. Examples of questions for earth science students:
When forces press towards each other in the sandbox (contraction)… • What kind of faults will develop? • Where do the new faults start and what is their angle? • Do the faults form all at once or one at a time? • What happens to the older faults? • What will the surface of the sand (Earth) look like? • How do the mountains grow?
Above: Students layer colored sand in the sandbox. A base of children's play sand is poured in first, and then smoothed. Colored layers are added at the edges along the viewing windows, mainly to conserve on the more expensive sand, but the color cannot be seen away from the windows anyway. After each colored 'layer' more play sand is layered in across the width of the box.
Left: Here students have finished laying in the sand (six layers shown) and are now ready to run a contraction experiment. About 7 cm of sand are used for a contraction experiment.
The sandbox set-up with play sand reasonably models the Earth's crust on a scale of 1 cm= 1 km, which means each grain of sand is about at the scale of one city block. It has been demonstrated that dry quartz sand can reasonably approximate the mechanical properties of the upper crust. [Cooke]
Formatted: Font color: Automichele User ! 7/6/10 9:21 PM
Formatted: Font color: Automichele User ! 7/6/10 9:21 PM
Formatted: Font color: Automichele User ! 7/6/10 9:21 PM

13
Above: Students crank the movable wall. After 20 turns of the crank they stop and observe the faults, measure the angles, and draw what they see. Then they crank another 20 turns. The photo on the right shows the results after about 60 turns, with a wedge with multiple faults. Six or seven reverse faults are clearly visible cutting across the colored layers. On the surface students can observe fault block mountains and uplift.
Above: Students make notes and drawings in their notebooks and label the wedge, the back thrust fault, the toe of the wedge, the 1st, 2nd, 3rd, etc faults to form. They also use a protractor to measure the angles of the new faults and compare with the older faults. We usually measure dip angles of new faults to be very close to 30 degrees, similar to what is found in the Earth's crust. We observe that new faults are activated towards the front edge of the wedge. After a certain amount of contraction each fault stops slipping and a new fault is activated in front of it. Older faults tend to rotate but not slip any further. As the new faults form in front of the wedge the wedge grows in length but also grows taller. The ratio of wedge height to wedge length remains constant. These dynamics model well the actual dynamics in the Earth's crust, giving the students a three dimensional visual tool for understanding how faults develop and interact, and how what is on the surface (bird's eye view) relates to what is underground (cross sectional view).

14
Learning Activity 2: Extension Investigation Extension happens in places where the Earth's crustal plates are pulling apart.
Background When stretching forces on the Earth’s crust overcome the strength of tectonic plates, the crust breaks and the two parts are able to move apart. T he fractures can be the size of several kilometers or several tens of kilometers, and geologists refer these faults as normal faults. Faults accommodate the motion between two facing blocks. The situation where the blocks are subjected to tension or opposite pulling forces, is called extension, and the resulting area between is called a rift zone.
Above: This photo shows the sandbox set up for an extension experiment. Two metal sheets are attached, one each to the back wall and the movable wall. A rubber sheet is duct taped between the two edges. The rubber helps to distribute the force pulling the two plates apart under extension. Here are examples of questions for students for an extension experiment.
• What kind of faults form during extension? • Where do new faults form and what is the angle (dip), during extension? (Are the angles
the same as in contraction?) • How does the width of the depression change as the land masses pull apart?
Above: Students layer in colored sand, smoothing each layer carefully. For an extension experiment the initial layers will only need to be 4-5 cm deep. On the right, the results after extension. A series of six normal faults are clearly visible from this side view. On the surface a basin and range topography has developed. In the sandbox we find the dip angles of these faults are regularly in the range of 70 degrees, similar to the angles of normal faults found in the Earth's crust. Faults on the left

15
dip towards the right and faults on the right dip towards the left. This graben structure matches fault patterns in rift zones around with rold, such as the Rio Grande Rift and Basin and Range.
Students use a protractor to line up the faults, and measure the angles. They tend to like to use a ruler and marker to outline faults they see right on the window of the sandbox. Again they then draw what they see in their notebooks and identify the faults, label the angles, forces, etc.
Finally students will summarize what they learned about two kinds of faulting that they have observed and draw comparisons between the two kinds of experiments. They can related the fault angles to the forces in the different
experiments to realize that the faults always grow at the same angle with the direction of maximum contraction.
More Sandbox experiments The sandbox as a model of the Earth's crustal movements provides students the opportunity to investigate many different questions. Students can vary the experiment and ask different questions. These experiments can be run with various materials (flour, clay) or with wet sand. Students can add a block of wood of various shapes in the middle of the moving wall to study what different shapes of moving plates might do in the Earth's crust. Other questions that students can explore using the sandbox: • What happens if part of the wedge is eroded while under contraction? (simulates erosion of
mountains) • What if friction is different for one side of the sandbox? (increase basal friction by adding a sand
paper base to part of the box) • Suppose we run the experiment without the rubber base sheet? (simulates extensional ridges
within oceanic crust at spreading centers) • Where would be the safest place to build a nuclear power plant when known faults are in the area?

16
Learning Extension Activity: Student Open Investigation The following activity encourages students to develop their own question to explore using the deformational sandbox.
Student Sandbox Investigation Goal: You will develop your own experiment to investigate a geological question on the sandbox.
Student directions 1. Get together a team of 4 students. 2. Discuss an experiment you'd like to do on the sand box. 3. Write a proposal for your idea. Include the following: - Your team members - Your research question. - Background information. Why are you interested in this question? - Your hypothesis. What idea will you test in the sandbox? - A detailed explanation of your experiment. Tell exactly what you plan to do. - A sketch of the experimental set up. What will your experiment look like at the start? - A title for your experiment. 4. Your proposal is due Friday. Your teacher must approve your experiment and will give you feedback. We will try to start experiments next Tuesday. Your teacher will develop a schedule for sharing the sandboxes. 5. Here are some ideas for experimental questions to get you started. You can invent your own experiment... these are just suggestions! • How do old faults affect new faults? Suppose there are faults already in the sandbox when you start, and
they you push from a different angle. Do the new faults start where the old faults are? Why? • How does the shape of the land affect new faults? Suppose you start with a square block on the pushing
wall - will that change the way the new faults develop? Why might the faults change pattern? • Suppose you start with a pointed block on the pushing wall - where will new faults develop? Why would
faults change their pattern? • Suppose you don't use the rubber sheet under the sand for extension - what will happen? Will faults
develop? Why would faulting be different? • How and why does erosion of mountains change the way faults develop? • Suppose you start with mountain... how does extension affect a mountain? Why would the pattern of faults
be different from starting with a 3 cm thick sand sheet? Guidelines for doing your experiment 1. All of your team must be involved with your experiment. 2. Use your lab notebook to record everything - your question, hypothesis, results (drawings), observations, and conclusions. 3. Observe carefully. Include problems and mistakes in your notebook. Include suggestions to make it a better experiment. 4. You have ONE CLASS PERIOD to do your experiment. Plan ahead - know exactly what you will do. 5. Take pictures during your experiment.

17
6. Write a lab report about your experiment, and include photos. Use the writing checklist for your report (see Appendix #3). National Content Standards and Benchmarks A Unit on Understanding Geological Tectonic Processes AAAS Project 2061 Benchmarks • 11B (6-8) Models are often used to think about processes that happen too slowly, too quickly, or
on too small a scale to observe directly. They are also used for processes that are too vast, too complex, or too dangerous to study.
• 11B (6-8) The usefulness of a model depends on how closely its behavior matches key aspects of what is being modeled. The only way to determine the usefulness of a model is to compare its behavior to the behavior of the real-world object, event, or process being modeled.
• 11B (6-8) A model can sometimes be used to get ideas about how the thing being modeled actually works, but there is no guarantee that these ideas are correct if they are based on the model alone.
• 11B (9-12) The behavior of a physical model cannot ever be expected to represent the full-scale
phenomenon with complete accuracy, not even in the limited set of characteristics being studied. The inappropriateness of a model may be related to differences between the model and what is being modeled.
• 4C (6-8) Some changes in the earth's surface are abrupt (such as earthquakes and volcanic
eruptions) while other changes happen very slowly (such as uplift and wearing down of mountains).
• 4C (6-8) Matching coastlines and similarities in rock types and life forms suggest that today's continents are separated parts of what was long ago a single continent.
• 4C (6-8) The outer layer of the earth—including both the continents and the ocean basins—consists of separate plates.
• 4C (6-8) The earth's plates sit on a dense, hot, somewhat melted layer of the earth. The plates move very slowly, pressing against one another in some places and pulling apart in other places, sometimes scraping alongside each other as they do. Mountains form as two continental plates, or an ocean plate and a continental plate, press together.
• 4C (6-8) There are worldwide patterns to major geological events (such as earthquakes, volcanic eruptions, and mountain building) that coincide with plate boundaries.
• 4C (9-12) Earthquakes often occur along the boundaries between colliding plates, and molten rock
from below creates pressure that is released by volcanic eruptions, helping to build up mountains. Under the ocean basins, molten rock may well up between separating plates to create new ocean floor. Volcanic activity along the ocean floor may form undersea mountains, which can thrust above the ocean's surface to become islands.

18
NAS National Science Education Standards All LEVELS Unifying Concepts and Processes ■ Systems, order, and organization - The natural and designed world is complex: it is too large and complicated to investigate and comprehend all at once. Scientists and students learn to define small portions for the convenience of investigation. The units of investigation can be referred to as “systems.” A system is an organized group of related objects or components that form a whole. Systems can consist, for example, of organisms, machines, fundamental particles, galaxies, ideas, numbers, transportation, and education. The goal of this standard is to think and analyze in terms of systems. ■ Evidence, models, and explanation - Evidence consists of observations and data on which to base scientific explanations. Using evidence to understand interactions allows individuals to predict changes in natural and designed systems. ■ Evidence, models, and explanation - Models are tentative schemes or structures that correspond to real objects, events or classes of events, and that have explanatory power. Models help scientists and engineers understand how things work. ■ Evidence, models, and explanation - Scientific explanations incorporate existing scientific knowledge and new evidence from observations, experiments, or models into internally consistent, logical statements. Different terms, such as ‘hypothesis’, ‘model,’, ‘law,’, ‘principle,’ ‘theory,’ and ‘paradigm’ are used to describe various types of scientific explanations. ■ Constancy, Change, and Measurement - can be transferred and matter can be changed. Nevertheless, when measured, the sum of energy and matter in systems, and by extension in the universe, remains the same. ■ Constancy, Change, and Measurement - Changes in systems can be quantified. Evidence for interactions and subsequent change and the formulation of scientific explanations are often clarified through quantitative distinctions—measurement. Mathematics is essential for accurately measuring change. ■ Evolution and Equilibrium - Equilibrium is a physical state in which forces and changes occur in opposite and off-setting directions. Steady state, balance, and homeostasis also describe equilibrium states. LEVELS 5-8 History and Nature of Science ■ Nature of Science - Scientists formulate and test their explanations of nature using observation, experiments, and theoretical and mathematical models. ■ Nature of Science - It is part of scientific inquiry to evaluate the results of scientific investigations, experiments, observations, theoretical models, and the explanations proposed by other scientists Earth and Space Science ■ Structure of the Earth System - Lithospheric plates on the scales of continents and oceans constantly move at rates of centimeters per year in response to movements in the mantle. Major geological events, such as earthquakes, volcanic eruptions, and mountain building, result from these plate motions. ■ Structure of the Earth System - Land forms are the result of a combination of constructive and destructive forces . Constructive forces include crustal deformation, volcanic eruption, and deposition of sediment, while destructive forces include weathering and erosion. ■ Earth’s History - The earth processes we see today, including erosion, movement of lithospheric plates, and changes in atmospheric composition, are similar to those that occurred in the past. Earth history is also influenced by occasional catastrophes, such as the impact of an asteroid or

19
comet. Science in Personal and Social Perspectives ■ Natural Hazards - Internal and external processes of the earth system cause natural hazards, events that change or destroy human and wildlife habitats, damage property, and harm or kill humans. Natural hazards include earthquakes, landslides, wildfires, volcanic eruptions, floods, storms, and even possible impacts of asteroids. LEVELS 9-12 Science as Inquiry ■ Abilities necessary to do scientific inquiry – Design and conduct scientific investiations. Designing and conducting a scientific investigation requires introduction to the major concepts in the area being investigated, proper equipment, safety precautions, assistance with methodological problems, recommendations for use of technologies, clarification of ideas that guide the inquiry, and scientific knowledge obtained from sources other than the actual investigation. ■ Abilities necessary to do scientific inquiry - Use technology and mathematics to improve investigations and communications. A variety of technologies, such as hand tools, measuring instruments, and calculators, should be an integral component of scientific investigations. ■ Abilities necessary to do scientific inquiry - Formulate and revise scientific explanations and modles using logic and evidence. Student inquiries should culminate in formulating an explanation or model. Models should be physical, conceptual, and mathematical. ■ Understandings about scientific inquiry - Mathematics is essential in scientific inquiry. Mathematical tools and models guide and improve the posing of questions, gathering data, constructing explanations and communicating results. ■ Understandings about scientific inquiry - Scientists usually inquire about how physical, living, or designed systems function. Conceptual principles and knowledge guide scientific inquiries. ■ Understandings about scientific inquiry - Results of scientific inquiry—new knowledge and methods—emerge from different types of investigations and public communication among scientists. Earth and Space Science ■ Energy in the Earth System - The outward transfer of earth's internal heat drives convection circulation in the mantle that propels the plates comprising earth's surface across the face of the globe. ■ The origin and evolution of the Earth System - Interactions among the solid earth, the oceans, the atmosphere, and organisms have resulted in the ongoing evolution of the earth system. We can observe some changes such as earthquakes and volcanic eruptions on a human time scale, but many processes such as mountain building and plate movements take place over hundreds of millions of years. Science in Personal and Social Perspectives ■ Natural and Human-induced hazards - Normal adjustments of earth may be hazardous for humans. Humans live at the interface between the atmosphere driven by solar energy and the upper mantle where convection creates changes in the earth's solid crust. As societies have grown, become

20
stable, and come to value aspects of the environment, vulnerability to natural processes of change has increased.
APPENDIX Data Sheet for Sandbox Observations Sandbox Observations Condition: Contraction 20 Turns Cross Section View
Map View
40 Turns Cross Section View Map View

21
Presentation Rubrics 1. ASL Signed Presentation Rubric
http://www.aslpro.com/lesson_plans/shared_lesson_plans.html ASL Signed Presentation Rubric PERIOD ____ Student _________________ Grade _____
CATEGORY 4 3 2 1 Sign Accuracy
Signs are clear and accurate during most or the entire presentation
Signs are accurate and clear about 80% of the time
Sign placement and direction are correct 50% of the time
Signs are difficult to read
Props/Visual Aids
Student uses several props (could include costume) that show considerable work/creativity and which make the presentation better.
Student uses 1 prop that shows considerable work/creativity and which make the presentation better.
Student uses 1 prop which makes the presentation better.
The student uses no props OR the props chosen detract from the presentation.
Facial Expression
Uses appropriate facial expression during entire presentation to indicate grammar and stress
Uses good facial expression during most of presentation
Uses some facial expression only when making an emphasis
No facial expression noted
Posture and Eye Contact
Stands up straight, looks relaxed and confident. Establishes eye contact with everyone in the room during the presentation.
Stands up straight and establishes eye contact with everyone in the room during the presentation.
Sometimes stands up straight and establishes eye contact.
Slouches and/or does not look at people during the presentation.
Body Language
Body language is appropriate during entire presentation
Body language supports material presented but isn’t consistent
Some Body language is used
Student does not use any body language
Classifiers
Uses classifiers at least twice during presentation that are appropriate and correct and make the content more efficient
Classifiers are used but do not appropriately express/support idea
Attempts to use classifiers but not correct
Doesn’t use any classifiers
Conceptually Accurate
Entire presentation is ASL and ideas are presented with appropriate conceptual sign
Students mixes some concepts with English sign but corrects self
Some concepts are signed in ASL.
Presentation is conducted in English literal language

22
2. Oral Presentation Rubric http://www.tcet.unt.edu/START/instruct/general/oral.htm
Criteria 0 1 2 3
Nonverbal Skills
Eye Contact
Does not attempt to look at audience at all, reads notes the entire time
Only focuses attention to one particular part of the class, does not scan audience
Occasionally looks at someone or some groups during presentation
Constantly looks at someone or some groups at all times
Facial Expressions
Has either a deadpan expression of shows a conflicting expression during entire presentation
Occasionally displays both a deadpan and conflicting expression during presentation
Occasionally demonstrates either a deadpan OR conflicting expression during presentation
Gives audience clues to what the content of speech is about; Appropriate expression, never notice a deadpan or conflicting expression
Gestures No gestures are notices Natural hand gestures are demonstrated
Posture Sits during presentation or slumps Occasionally slums
during presentation
Stands up straight with both feet on the ground.
Vocal Skills
Enthusiasm Shows absolutely no interest in topic presented
Shows some negativity toward topic presented
Occasionally shows positive feelings about topic
Demonstrates a strong positive feeling about topic during entire presentation
Vocalized Pauses (uh, well uh, um) 10 or more are noticed 6-9 are noticed 1-5 are noticed No vocalized pauses
noticed Content
Topic Announced Audience has no idea what the report is on Vaguely tells audience
what report is over Clearly explains what the report is covering
Time frame Presentation is less than minimum time
Presentation is more than maximum time
Presentation falls within required time frame
Visual Aid Poor, distracts audience and is hard to read
Adds nothing to presentation
Thoughts articulated clearly, but not engaging
Visual aid enhances presentation, all thoughts articulated and keeps interest
Completeness of Content
One or more points left out
Majority of points glossed over
Majority of points covered in depth, some points glossed over
Thoroughly explains all points
Professionalism of Presentation
Mumbles, audience has difficulty hearing, confusing
Thoughts don't flow, not clear, does not engage audience
Thoughts articulated clearly, though does not engage audience
Presentation is organized and the interest level of the audience is maintained

23
Report Writing Checklists 1. Check list for notebooks for sandbox observations http://sci.gallaudet.edu/Mary/SandboxNotebookCklist.html
Notebook Checklist: Observations of faults Name __________________________ Date ________________
5 4 3 2 1
Contraction Experiment
Includes title, date, introduction
Question
Hypothesis
Entries includes dates, clear labels
Drawings
Drawings have clear labels (force direction, # of turns,
Drawings show faults and dip of faults (angles)
A summary for each step of the experiment
Summaries show thought & analysis
Extension Experiment
Includes title, date, introduction
Question
Hypothesis
Entries includes dates, clear labels
Drawings
Drawings have clear labels (force direction, # of turns, etc)
Drawings show faults and dip of faults (angles)
A summary for each step of the experiment
Summaries show thought & analysis
Overall Notebook
Includes analysis of sources of error
Includes generalizations to the Earth's crust
Notebook is neat and shows effort

24
2. Sandbox Lab Report Writing Checklist http://sci.gallaudet.edu/Mary/SandboxChecklist.html
Sandbox Experiments Checklist Name _______________ Date _____
Report Criteria: 5 4 3 2 1 0 Part I Introduction
Report Title Background- plate tectonics and faults
fault vocabulary Part II Contraction Experiment
Experiment title The question(s) and your hypothesis
Procedure - clear steps Pictures included in procedure
Summary for each phase of the experiment Final summary and conclusions
Additional interesting information Part III Extension Experiment
Experiment title The question(s) and your hypothesis
Procedure - clear steps Pictures included in procedure
Summary for each phase of the experiment Final summary and conclusions
Additional interesting information Part IV Report Summary
Summarize what you learned What is a model?
Is the sandbox a scientific model? Why?
Identify sources of error in the model Generalization
Report quality
Includes pictures Very few grammar and spelling errors
The report is complete & on time
3. Report Writing Checklist for Student Open Investigation

25
http://sci.gallaudet.edu/Mary/SandboxChecklist2.html
Checklist #2 - Student Experiment Name _________________________ Date _____________
Report Criteria: 5 4 3 2 1 0 Introduction
Report Title
Background- plate tectonics and faults The problem you investigated (your question)
Your hypothesis Procedure
List of your equipment Clear steps for how you did the experiment
Pictures included in procedure Results
Drawing or picture results for each phase (20,40, 60 turns, etc)
Written summary for each step (what you saw and learned)
Conclusions
Summarize what you learned and conclusions Additional interesting information
What real world geology did you model? Identify sources of error in the model
Generalization to the real world Ask a new question
Report Quality
Shows teamwork
Very few grammar and spelling errors
The report is complete, thorough, and on time.