exploring new methods in understanding visitor...
TRANSCRIPT
Exploring New Methods in Understanding Visitor
Experience: Evaluations of the Citi Money Gallery at the
British Museum
An Interactive Qualifying Project
submitted to the Faculty of
WORCESTER POLYTECHNIC INSTITUTE
in partial fulfilment of the requirements for the
degree of Bachelor of Science
by
Giancarlo Savoy
Anjali Venkatesh
Lillian Walker
Eli Wolfang
Date:
01/05/2014
Report Submitted to:
Mr. Ben Alsop
British Museum
Laureen Elgert
Scott Jiusto
Worcester Polytechnic Institute
This report represents work of WPI undergraduate students submitted to the faculty as evidence
of a degree requirement. WPI routinely publishes these reports on its web site without editorial
or peer review. For more information about the projects program at WPI, see http://www.wpi.edu/Academics/Projects.
ii
ABSTRACT
The Citi Money Gallery in the British Museum is re-evaluated yearly in order to present
the sponsor of the gallery, Citibank, with updates on their investment. Our IQP group set out to
complete the required evaluation and use this opportunity to invent new methodologies and
create innovative ways present data. Our discoveries can aid gallery evaluations and museum
studies in the British Museum and elsewhere as well as provide valuable data and
recommendations to the gallery.

iii
ACKNOWLEDGEMENTS
Our team would like to thank our advisors, Laureen Elgert and Scott Jiusto, for their
assistance in completing this project. We would also like to thank our liaison, Ben Alsop, for all
of his help and encouragement during the course of our term abroad, as well as the entire
Department of Coins and Medals for hosting us. In addition, we would like to thank David
Francis for all his insight into gallery evaluations. We would like to thank Rebecca Ziino for her
assistance in developing research strategies and Alyssa Corini for talking to us about her
experience in the gallery in E term.
We would like to thank all of the people who were a part of translating our survey into 17
languages: Natasa Trkulja, Stella Banou, Marinela Kirilova, Carina L’hoste, Lamyae Reklaoui,
Luis Quiroga, Gabriel Morell-Pacheco, Adriana Morell, Timothy Momose, Jingan Wu, Kwan
Yeong “Ashton” Kim, Loan Chau, Magnus Gregersen, and Atieh Sadraei.
iv
EXECUTIVE SUMMARY
Introduction
The Citi Money Gallery in the British Museum is re-evaluated yearly in order to present
the sponsor of the gallery, Citibank, with updates on their investment. Our IQP group set out to
complete the required evaluation and use this opportunity to invent new methodologies and
create innovative ways to present data. Our discoveries can aid gallery evaluations and museum
studies in the British Museum and elsewhere as well as provide valuable data and
recommendations on the gallery.
Methodology
Our methodological approach incorporated the basic methodologies of past evaluations
with innovations of our own. The basic methodology involves using manual “pen and paper”
visitor tracking paired with questionnaires given to those who were tracked. In order to reach the
previously inaccessible group of non-English speaking visitors, we translated our questionnaire
into 17 languages. This facilitated increased engagement with non-English speaking visitors. We
discovered new software, Syntax2D, which enabled us to present visitor paths in a new
understandable way. We also went beyond our basic requirements, tracking 360 visitors, instead
of 300, and giving 128 questionnaires, instead of 100.
Findings
Our methodology enabled us to make useful findings about the gallery from our
data. Some of our findings were guided by specific requests from the museum. We found that the
median time spent in the gallery is 131 seconds (2:11) and the mean time spent in the gallery is
207 seconds (3:27). We also found out that 15 % of visitors were able to recognize Citibank as
the sponsor of the gallery when presented with logos of various banks as options for naming the
sponsor. In addition, the new methodologies we developed allowed us to make new kinds of
findings. These findings covered many topics including visitor attendance, the diversity of
visitors in language and nationality, as well as visitor travel and tendencies within the gallery.
Visitor counting enabled us to calibrate the electronic visitor counter installed in the gallery.
We discovered that the electronic counter has a linear relationship with the number of visitors to
the gallery. The counter fairly consistently underestimated the number of visitors by 25%. Since

v
the combined walkthrough and turnaround rate was 28%, this means that the visitor counter can
be used for a rough estimate of engaged visitors in the gallery.
As the British Museum is a major London attraction, the gallery draws many nationalities of
visitors. Only 20% of visitors to the Money Gallery were from the UK, followed by 13% from
USA, 10% from Spain, and 8% from Italy. Our translated surveys allowed us to reach
international visitors, get their opinions of the gallery, and study their interaction with it. Our
questionnaire refusal rate for this study was 38%, lower than last year’s rate of 48%, primarily
due to our multi-lingual survey. We discovered that some visitors opt to take the survey in
English rather than their first language even when their language is available.
The new software tool, Syntax 2D, shows the flow of visitors through the gallery, which has
not previously been easy to interpret. Syntax 2D’s heat map style presentation is familiar and
well suited to mapping a gallery and makes it easier to identify trends in paths. For example, we
showed that more visitors traveled the north wall than the south wall. Indeed, 35% of visitors
turned north upon entering the gallery while 27% turned south.
Recommendations
Our recommendations stem from the findings we made during this study. Some of the
recommendations for the gallery included making the new Bitcoin case more attractive by
adding more eye-catching pieces, making the wall cases and their info panels more visible,
adding translated versions of English texts to cases, and finding ways to encourage visitor flow
to follow the gallery flow. For future studies we recommend continuing use of translated surveys
to increase response rate and using Syntax 2D to understand visitor flow. The gallery could also
benefit from future studies performing a meta-analysis on case content using past data, and
developing a more streamlined way to electronically enter visitor tracking data.

vi
TABLE OF CONTENTS
ABSTRACT ................................................................................................................... ii
ACKNOWLEDGEMENTS ........................................................................................... iii
EXECUTIVE SUMMARY............................................................................................ iv
TABLE OF CONTENTS ............................................................................................... vi
LIST OF FIGURES ..................................................................................................... viii
LIST OF TABLES ........................................................................................................ ix
Chapter 1: Introduction .................................................................................................1
Chapter 2: Background..................................................................................................3
2.1. Museum Studies .............................................................................................3
2.1.1. History of Museum Studies ..........................................................................3 2.1.2. Tracking Studies ..........................................................................................9
2.1.3. Surveying Visitors ..................................................................................... 12 2.2. The British Museum ..................................................................................... 13
2.3. The Department of Coins and Medals ........................................................... 15 2.4. Recent Findings ............................................................................................ 15
2.4.1. Objectives .................................................................................................. 16 2.4.2. Methodologies ........................................................................................... 17 2.4.3. Findings ..................................................................................................... 19
Chapter 3: Methodology .............................................................................................. 24
3.1. Visitor Counting ........................................................................................... 26
3.2. Visitor Tracking ............................................................................................ 26 3.2.1. The Tracking Process................................................................................. 27
3.2.2. Tracking Analysis ...................................................................................... 28 3.2.3. Tracking Calibration .................................................................................. 28
3.3. Questionnaires .............................................................................................. 29 3.3.1. Demographics ............................................................................................ 29
3.3.2. Exhibit Preferences .................................................................................... 30 3.3.3. Learning Information ................................................................................. 30
3.3.4. Sponsor Recognition .................................................................................. 30 3.3.5. Visitor Guides............................................................................................ 31
3.4. Methodological Innovations .......................................................................... 31 3.4.1. Survey Translations ................................................................................... 31
3.4.2. Visitor Guides............................................................................................ 32 3.4.3. Interactive Methods ................................................................................... 32
3.4.4. Improved Data Presentation ....................................................................... 33 3.4.5. Focus on Learning and Qualitative Feedback ............................................. 34
Chapter 4: Results and analysis ................................................................................... 35
4.1. Results .......................................................................................................... 35
4.1.1. Reaching More Visitors ............................................................................. 36

vii
4.1.2. Visitor Movements .................................................................................... 39 4.1.3. Case Analysis ............................................................................................ 43
4.1.4. Visitor Experience ..................................................................................... 52 4.1.5. Visitor Counter .......................................................................................... 64
4.2. Methods Based Findings ............................................................................... 66 4.2.1. Questionnaire............................................................................................. 66
4.2.2. Presentation and Analysis .......................................................................... 71 Chapter 5: Conclusions ............................................................................................... 75
5.1. Successes ...................................................................................................... 75 5.2. Recommendations to the Gallery................................................................... 75
5.3. Recommendations about Methodologies ....................................................... 76 5.4. Conclusions .................................................................................................. 76
BIBLIOGRAPHY ......................................................................................................... 77
Appendix A: Tracking Sheet .......................................................................................... 79
Appendix B: Visitor Approach Protocol ........................................................................ 80
Appendix C: Questionnaire ............................................................................................ 82
Appendix D: Additional Data for Future Consideration ................................................. 86
Appendix E: Content of Cases ....................................................................................... 93
Appendix F: Syntax 2D Instructions .............................................................................. 95
viii
LIST OF FIGURES
Figure 1 : Hierarchy of Visitor Engagement ................................................................................7 Figure 2: Hierarchy of Meaning Making .....................................................................................8
Figure 3: Impact Climbing Frame................................................................................................9 Figure 4: Percentage of Visitor’s Responses When Refusing Exit Questionnaires or Survey by
Year .................................................................................................................................. 17 Figure 5: Line Map of Visitor’s Paths in the Citi Money Gallery from the 2013 IQP ................. 18
Figure 6: Heat Map of Case Holding Power from the 2010 IQP ................................................ 18 Figure 7: Percentage of Gallery Visitors from the UK as Found by Previous IQPs .................... 19
Figure 8: Primary languages spoken by Museum visitors as determined by previous IQPs ........ 20 Figure 9: Walkthrough rates of various galleries from previous IQPs ........................................ 21
Figure 10: Attracting power of display cases in Money Gallery from previous IQPs.................. 22 Figure 11: Visitor First Langauge .............................................................................................. 36
Figure 12: Visitor Country ........................................................................................................ 37 Figure 13: Language the Survey was Taken In .......................................................................... 38
Figure 14: Visitor Age Distribution ........................................................................................... 39 Figure 15: All Visitor Paths through Gallery (n=233) ................................................................ 44
Figure 16: All Visitor Paths through Gallery, with Attracting Power Heat Map (n=233 ............. 44 Figure 17: View of Gallery from East Entrance ......................................................................... 40
Figure 18: View of Gallery from West Entrance ........................................................................ 40 Figure 19: East Entrances and Their First Case Visited.............................................................. 41
Figure 20: West Entrances and Their First Case Visited ............................................................ 41 Figure 21: Histogram of Dwell Times ....................................................................................... 42
Figure 22: Holding and Attracting Power Before and After the Case 19 Changes ...................... 43 Figure 23: Holding Power of Case 19 for Non-English Speaking Visitors Before and After
Changes............................................................................................................................. 44
Figure 24: Bar Graph of Attracting Power for All Cases ............................................................ 45 Figure 25: Visitor Paths through East Entrance (n=112) ............................................................ 46
Figure 26: Visitor Paths through West Entrance (n=121) ........................................................... 46 Figure 27: First Case Visited by Visitors from the East Door..................................................... 46
Figure 28: Heat Map and Bar Graph of Attracting Power .......................................................... 47 Figure 29: Heat Map and Bar Graph for Holding Power ............................................................ 48
Figure 30: Heat map and Bar Graph of Glances ......................................................................... 49 Figure 31: First Case visited through the East Door ................................................................... 50
Figure 32: First Case visited through the West Door.................................................................. 50 Figure 33: Country of Residence for Surveyed Visitors ............................................................. 52
Figure 34: Country of Origin of Surveyed Visitors .................................................................... 53 Figure 35: Intent to Visit the Money Gallery ............................................................................. 54
Figure 36: How Visitors heard about the gallery ........................................................................ 54 Figure 37: Visitors Who Reported Learning Something ............................................................ 55
Figure 38: “What are some topics you learned about (e.g., coins, history, different cultures)?” .. 56 Figure 39: “What are some themes you noticed while viewing the gallery?” ............................. 57
Figure 40: “Is there anything you would like to learn more about?” ........................................... 58 Figure 41: Breakdown of Sponsor Recognition ......................................................................... 59
ix
Figure 42: Mean and Median Dwell Times by Language Spoken .............................................. 60 Figure 43: Dwell Time by First Language and Language of Questionnaire ................................ 61
Figure 44: Viewing Strategies in Gallery 68 .............................................................................. 62 Figure 45: Reported Reasons for Visiting the British Museum .................................................. 63
Figure 46: Visitors' Meaning Making ........................................................................................ 63 Figure 47: Electronic Visitor Counter Accuracy ........................................................................ 64
Figure 48: Walkthrough and Turnaround Rates ......................................................................... 65 Figure 49: First Language Reported in Questionnaire ................................................................ 67
Figure 50: Language Survey was Taken in ................................................................................ 67 Figure 51: Availability of Language .......................................................................................... 68
Figure 52: Questionnaire Favorite Map Example ....................................................................... 69 Figure 53: Sponsor Recognition Break Down ............................................................................ 70
Figure 54: Heat Map and Bar Graph Pair................................................................................... 73
LIST OF TABLES
Table 1: Project Timeline .......................................................................................................... 24
Table 2: Important Aspects of Visitor Experience ..................................................................... 26 Table 3: Demographic Categories ............................................................................................. 30
Table 4: Door Usage in the Gallery and Direction of Travel ...................................................... 42 Table 5: Country of Origin for the 2013 Study and the Current Study........................................ 53
Table 6: Reasons for Visiting and Meaning Making Strategy .................................................... 74
1
CHAPTER 1: INTRODUCTION
Museums exist with a dual purpose: to educate and entertain their guests. This presents a
unique challenge in determining the best way to present artefacts and information to visitors. The
British Museum in particular, as the most popular tourist attraction in the UK, attracts a wide
array of visitors with many different, sometimes contradictory, opinions and reasons for visiting
("BBC News - British Museum is the most visited UK attraction again," 2014). Obtaining an
understanding of the motivations, expectations, and reactions of the museum’s visitors and the
information they take away is a key part of the constant improvements and updates that the
British Museum makes to its galleries. Knowing what visitors feel about the gallery as it is right
now is a prerequisite to making future improvements which enhance the visitor’s experience.
The Citi Money Gallery, sponsored by Citibank since 2011, is under agreement to be re-
evaluated annually, with a copy of the data presented to the sponsor, in order to keep up with the
constantly changing visitor flow. An IQP study in 2010 (Peterson, Lybarger, Clinckemaillie,
Kazantzis, & Brattin, 2010) found that the demographics of the gallery do change with time,
which affects the design of the exhibit. For example, a higher amount of young children and
school groups viewing the gallery might indicate a change to a more interactive exhibit style to
better serve this population, while an uptick in non-English speaking groups might indicate a
need for more foreign language friendly exhibits and information. However, gathering data is not
always easy. Past studies show high refusal rates in the gallery for questionnaires. In addition,
the types of data gathered in the exhibit, such as visitor path data or qualitative data, are often
difficult to display in an understandable way ("British Museum - History of the collection,"
2014).
Gallery evaluations are nothing new to museums. Museum studies have existed since the
early 20th century. The earliest evaluations simply examined where in the museum visitors
walked, but this has evolved over the years into full inquiries of visitor’s thoughts and reactions
with respect to museum attractions. These inquiries, and the data collected, can be used to tailor
the museum to the needs of the visitors such as the interactivity of the museum and the level of
in depth content available. Methods such as visitor tracking through observation as well as direct
questioning of visitors have been used to gather this type of data (Stephen Bitgood & Shettel,
1996). The British Museum, and more specifically the Money Gallery, is no stranger to these
2
types of evaluations either. Previous IQP groups have conducted visitor tracking studies inside of
the British Museum four of those five groups focused on a study inside the Money Gallery. The
data gathered in our study will be presented to Citi Bank by the British Museum for review.
In spite of all the existing methodologies for data collection at the Citi Money Gallery,
there were some gaps that required addressing. The rate of questionnaire participation with
foreign language visitors has been very low compared to the general response rate. There was an
opportunity for us to collect data from these visitors, which may not have been as successful in
the past due to language barriers. The 2013 IQP team created questionnaires in multiple
languages; however, they were unable to approach visitors in any language other than English,
which led to very few foreign visitor responses (Osborn et al., 2013). Additionally, the gallery
has recently introduced new paper visitor guides. The effectiveness of these guides has not been
studied yet and was of key interest to the Department of Coins and Metals. Finally,
representation of visitor flow through the gallery in the past projects was lackluster. The visual
representations of the visitors paths produced were confusing and difficult to use. Our project
endeavored to devise improved data presentation techniques for such information, making line
maps clearer and more visually appealing. Finally, while quantitative data has been collected
from visitors in the past, the amount of qualitative data pertaining to topics such as visitor
learning from the exhibits has been small. This was also a gap we hoped to address through our
project.
This project presents an analysis of the visitor experience in the Citi Money Gallery of
the British Museum. The team began by developing a practical methodology to gather data about
the visitor experience in the Citi Money Gallery which expanded on the ideas of previous
projects with information gathered through a thorough literature review and our own
innovations. This methodology was used to observe the visitor’s experience in the Money
Gallery. We expanded on these observations with in person questionnaires designed to be easily
implemented in a wide array of languages. These questionnaires also had an increased focus on
qualitative aspects of the visitor experience compared to previous efforts. The newly gathered
data was then analyzed and presented to the British Museum in a simple and easy to understand
format.
3
CHAPTER 2: BACKGROUND
2.1. Museum Studies
Museum Studies is a multi-disciplinary field concerned with all aspects of museum
history, design, and administration. The field includes the psychology of learning, the science of
attention, the sociology of culture, etc. Often the focus of museum studies is the visitor
experience; how to quantify, study, and improve the way a visitor interacts with a museum.
Visitor experience is composed of all of those factors which influence a person’s time in a
museum, from the quality of the exhibit labels on the cases to the learning which takes place long
after they have left the physical structure. The number of aspects that could be explored in this
field is endless, but the exhibit evaluator must find a way to quantify or qualify the experience
(Stephen Bitgood & Shettel, 1996).
2.1.1. History of Museum Studies
Museum studies and museums did not always exist side by side. With the growing
emergence of learning as the outcome of a museum visit, interest in studying exhibits and
visitors has expanded. The emergence of several environment variables and their effects on
visitors in the early 20th century led to a resurgence in the field of visitor studies. The five areas
of visitor studies as identified by Bitgood were Audience Research and Development, Exhibit
Design and Development, Program Design and Development, General Facility Design, and
Visitor Services. These categories address how a museum can attract a visitor, interest a visitor,
and convince a visitor to come again (Stephen Bitgood & Shettel, 1996).
To understand and improve a visitor’s experience museum staff turn to visitor studies.
Visitor studies are a good way to improve a patron’s visitor experience. For example, a study on
how visitors navigate an exhibit and what they look at can inform investigators how to better
arrange or fill the exhibit. Many studies have shown that visitors will often follow the right hand
wall of an exhibit, so the gallery can be arranged to best use that tendency.
4
Why Perform Visitor Studies?
Museums are all about attracting more people and bringing in more visitors, both from
the UK and abroad. The British Museum is the most popular tourist attraction in the UK, and
maintaining and producing stimulating exhibits is part of what keeps the museum at the top of
that list. By performing visitor studies the museum can figure out what types of exhibits excite
viewers and perpetuate a reputation to attract visitors ("BBC News - British Museum is the most
visited UK attraction again," 2014).
At the same time, museums need to appeal to the visitors that come from right around
London. The British government’s initiative of increasing social inclusion has led to an interest
in making museums and other cultural institutions more accessible for visitors of different
backgrounds and educations. Museums were once only accessible to those with knowledge and
cultural experience. The initiative attempts to give the socially excluded the opportunity to
benefit through the consumption of art and culture which understandable to all educational
levels, while not making the experience too simple. Visitor studies can give exhibit designers
feedback on the exhibit and how to make it more accessible and appealing (Durrer & Miles,
2009).
Qualitative and Quantitative Data
As museum studies have developed, data collection has shifted in many places from the
quantitative to the qualitative. Quantitative data, such as stopping time at a case, how many
people stop at a certain case, visitor demographics, etc., is factual information on an exhibit. This
data is usually numerical and can be displayed and interpreted easily. The use of qualitative data,
however, is not as widespread in museum studies. This kind of data could consist of comments
from visitors on the exhibit and what they learned. This data is much harder to display and make
sense of, but gives more insight into the minds of visitors than quantitative data (Macdonald &
Ebrary Academic, 2006).
The use of qualitative data in museum studies is sometimes debated. Analysis of
qualitative data is inevitably subjective, able to be interpreted in multiple ways. As such,
quantitative data is often preferred, even though it lacks the insight into the mind of the visitor.
5
Policy makers often prefer quantitative data for its concrete evidence of visitor behavior. In the
UK, focus on social inclusion has necessitated the collection and analysis of qualitative data in
order to understand how learning is occurring in museums (Macdonald & Ebrary Academic,
2006).
All of these aspects of visitor study end up influencing the visitor experience, which we
are being called on to evaluate. The visitor experience can be described by many metrics, both
quantitative and qualitative, and data can be collected through any number of research methods
including visitor tracking, surveys, and interviews.
Free-Choice Learning
Once primary thought of as research institutions catering to a small number of already
educated visitors, museums have grown to recognize a different basis of visitor. Nowadays,
visitors do not tend to be experts in a field. In fact, the visitor may have had no intention of
visiting a gallery at all. They are visiting the museum to satisfy some desire for knowledge
outside of their daily routine (Macdonald & Ebrary Academic, 2006).
Often called “free-choice learning,” the learning that takes place in museums is informal,
unlike learning which takes place in a classroom. Formal classroom learning is dictated by a
teacher, but in a museum, a visitor is under their own direction. They could choose to follow a
specified path or tour, or merely wander and gather information on their own. Museum designers
may try to influence the path a visitor follows to influence what they learn, but measuring this
learning is difficult without an accurate model. One such model is the context model, which
holds that visitors add gathered information into the context of their own knowledge and come to
their own conclusions (Macdonald & Ebrary Academic, 2006).
As its definition would indicate, free-choice learning is difficult to measure, only its
symptoms can be measured quantitatively (Macdonald & Ebrary Academic, 2006). Several
metrics in visitor studies can be interpreted to show where learning is likely occurring. Two of
these are holding power and attracting power. Holding power is a rating based on the amount of
time a visitor could be expected to spend looking at a particular case. Attracting power is a rating
based on how likely a visitor is to approach an object to begin with (Donald, 1991). These
metrics point to a physical location to which visitors are drawn. It is likely that learning is

6
occurring there, as attention is a precursor to learning, but it is not guaranteed, so these measures
are not so much a measure of learning as an indicator of it (S. Bitgood, 2013).
Another possible way to measure learning is by asking “quiz” questions, such as
identifying a term, of museum visitors about the exhibit they just saw. The 2010 IQP on the
gallery in the British Museum attempted this tactic, but found that few people were able to
correctly answer the question (Peterson et al., 2010). This method is not always foolproof either,
as participants may have already known the answer or may have not had time to process the
exhibit and contextualize their response.
Instead of measuring learning through quantitative means, learning could be measured
qualitatively. Instead of asking hard questions with correct answers, investigators could be more
open, engaging in conversation with their visitors by asking questions such as “What was the
exhibit about?” While not as easy to process, such data shows how information is being
processed into context, especially is the visitor is questioned before and after their experience
(Donald, 1991).
Since the last time the exhibit was evaluated, the Department of Coins and Medals has
added visitor self-guides to the gallery. Guides are a great way for exhibit designers to show
visitors what they mean them to see. Self-guides have also been shown to influence several
factors of learning. For at least the first few displays viewed in the exhibit, time spent and label
reading increase at each case (S. Bitgood, 2013). As the guides in the Citi Money Gallery are
new, we do not yet know how frequently the guides will be picked up or how they will affect the
visitors and the amount of learning that occurs in the exhibit.
Visitor categorization
To design an exhibit which will appeal to visitors, it is important to find out what the
visitors are expecting from the exhibit and how they will chose to interpret the exhibit. One
method used to make sense of these many aspects of visitor experience is modeling; designing a
system of finite categories by which to identify visitor’s needs, expectations, learning styles,
tendencies, etc.
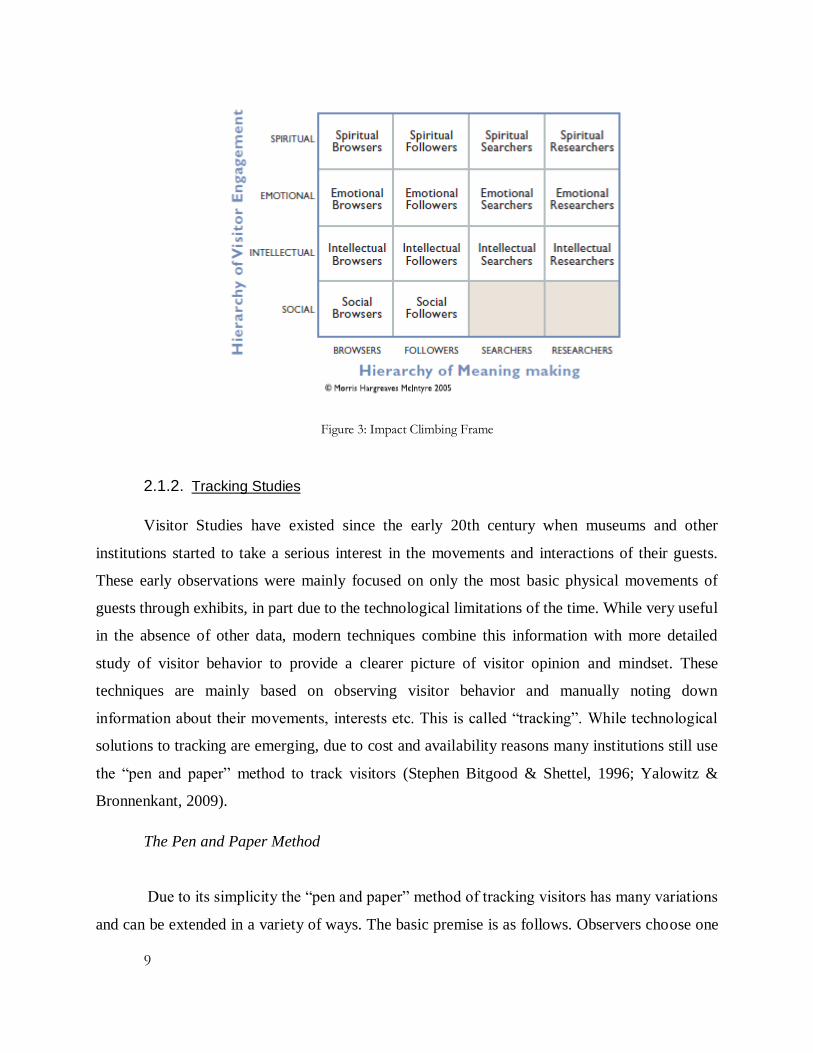
The Morris Hargreaves McIntyre consultancy has developed two models for visitors. The
first is the Hierarchy of Visitor Engagement, which classifies visitor motivations and
7
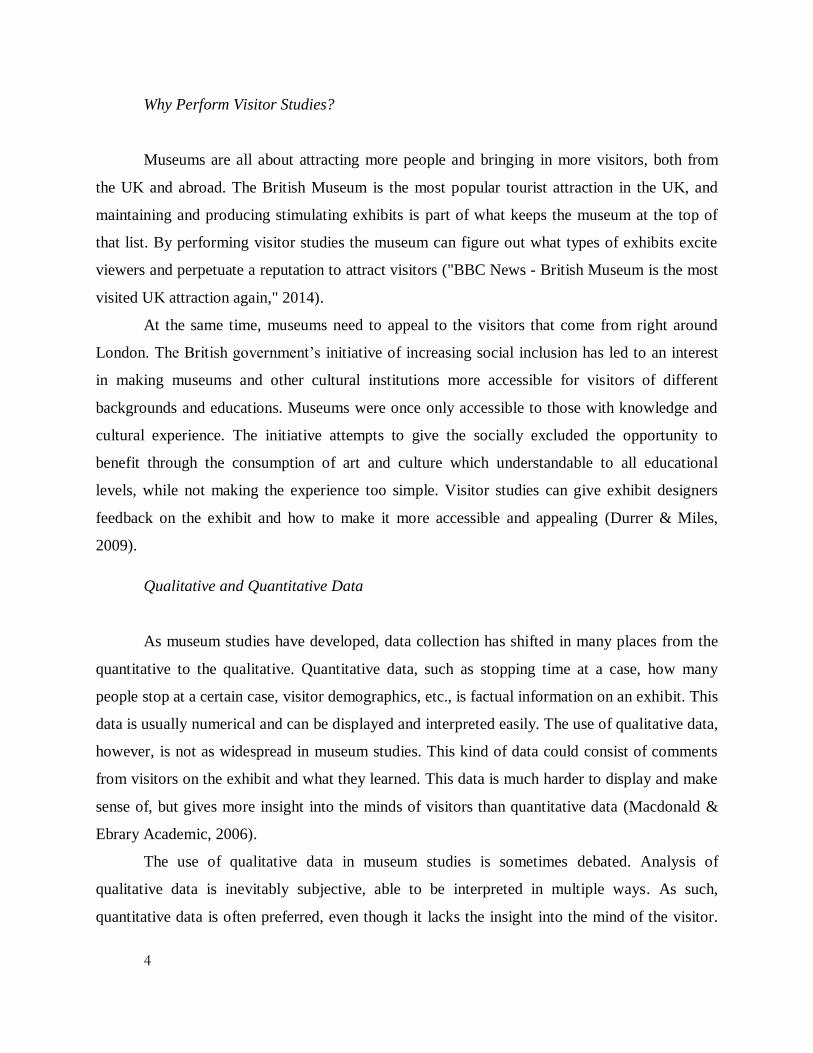
expectations. Figure 1 below summarizes the four types of visitor motivations. In the figure, the
types of visitor engagements are compared to Maslow’s Hierarchy of Needs. The higher up the
hierarchy a visitor’s motivations are, the more deeply engaged he/she is with an object or exhibit
(Morris, Hargreaves, & McIntyre, 2005).
Figure 1 : Hierarchy of Visitor Engagement
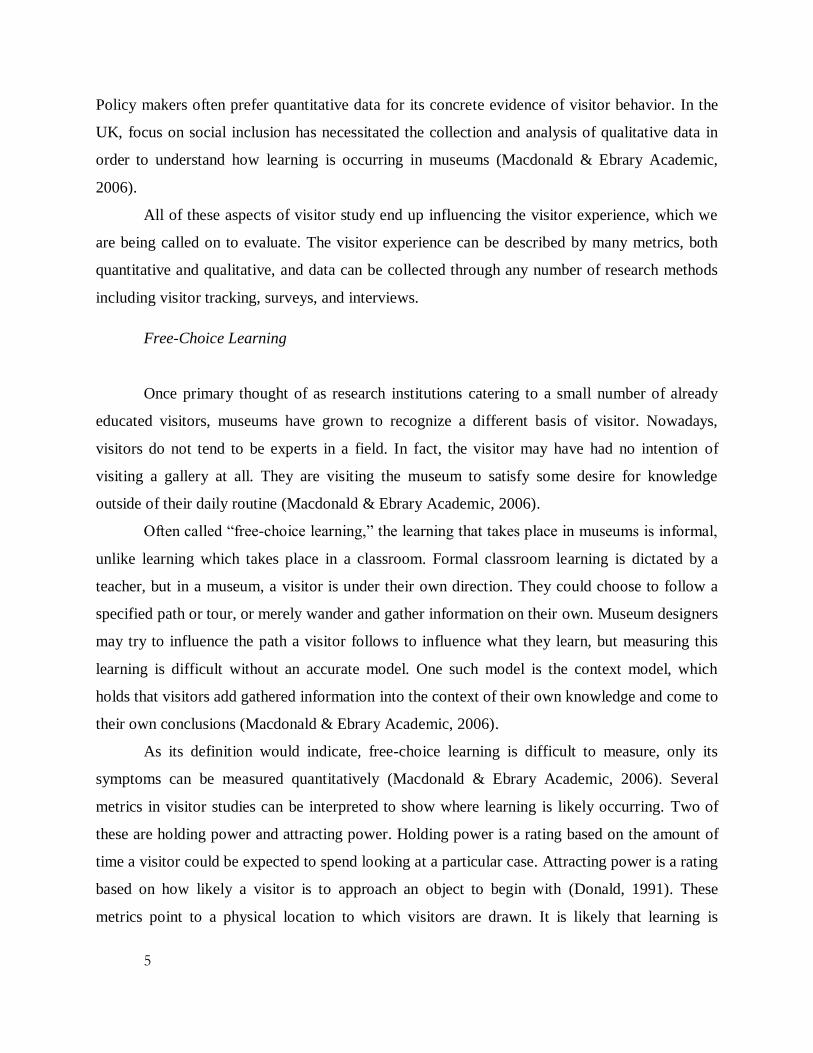
The second categorization system is the Hierarchy of Meaning Making, which
categorizes visitors according to how they derive meaning from what they see during their visit.
A browser will wander about a museum until they find an interesting piece, but they need to be
explained the piece in order to make any meaning from it. A Follower desires to follow a theme
through the exhibit, making meaning through the museum provided narrative. A Searcher takes
an exhaustive path through an exhibit, attempting to learn everything the museum has provided
8
about a theme. Finally, a Researcher is an already well informed visitor who will likely want to
continue studying the topic after leaving the exhibit. Figure 2 shows the four types of meaning
making categorized by what they expect from the museum in terms of objects presented and
information provided (Morris et al., 2005).
Figure 2: Hierarchy of Meaning Making
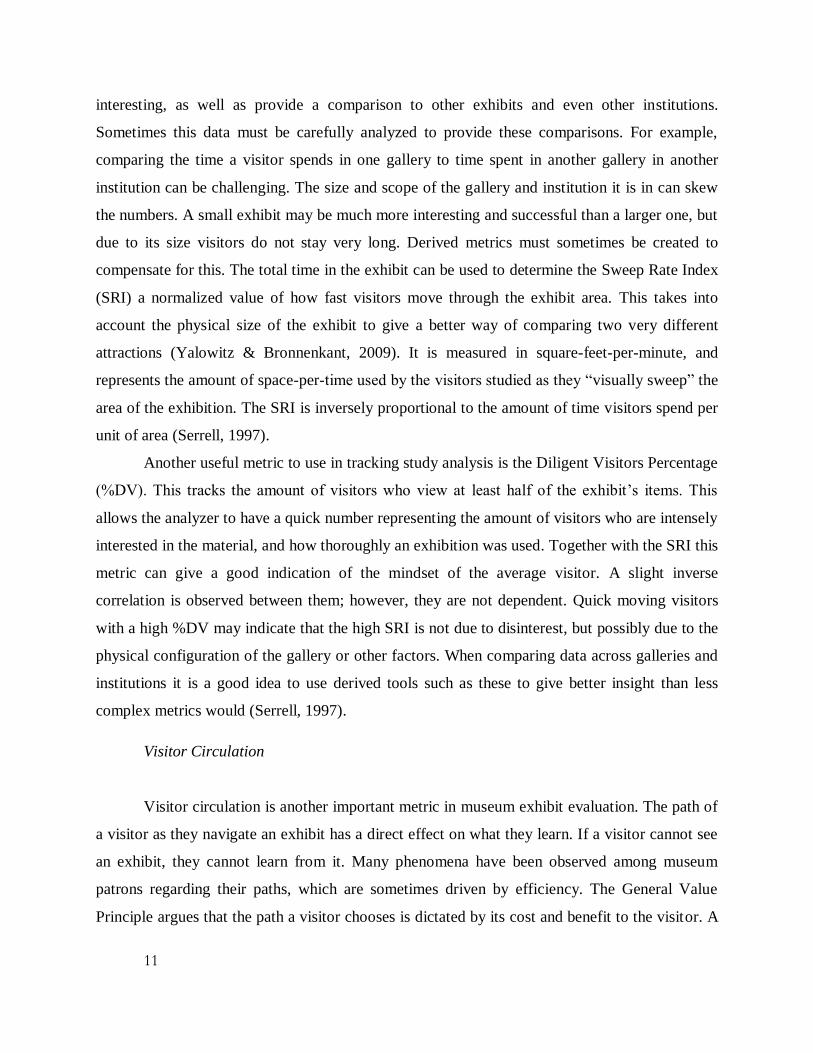
The impact of the exhibit can be measured by the movement of visitors within the
hierarchy. A gallery can be designed to help visitors reach a deeper engagement with objects or
to make more meaning of an exhibit by providing the right gateways (opportunities to follow a
course through an exhibit, engaging or inspiring material etc.). A visitor could enter the gallery,
for example, as a Social Browser. When presented with a guide or path through the exhibit, they
could become a Follower, making more meaning than they would have as a Browser. Similarly,
a visitor could enter as a Social Follower but when presented with very engaging material and
inspired to learn more, he or she becomes an Emotional Searcher. The Impact Climbing Frame
(Figure 13) shows how the depth of engagement can be plotted against the amount of meaning
making to come up with a description of a visitor based on motivations and meaning making
(Morris et al., 2005).
9
Figure 3: Impact Climbing Frame
2.1.2. Tracking Studies
Visitor Studies have existed since the early 20th century when museums and other
institutions started to take a serious interest in the movements and interactions of their guests.
These early observations were mainly focused on only the most basic physical movements of
guests through exhibits, in part due to the technological limitations of the time. While very useful
in the absence of other data, modern techniques combine this information with more detailed
study of visitor behavior to provide a clearer picture of visitor opinion and mindset. These
techniques are mainly based on observing visitor behavior and manually noting down
information about their movements, interests etc. This is called “tracking”. While technological
solutions to tracking are emerging, due to cost and availability reasons many institutions still use
the “pen and paper” method to track visitors (Stephen Bitgood & Shettel, 1996; Yalowitz &
Bronnenkant, 2009).
The Pen and Paper Method
Due to its simplicity the “pen and paper” method of tracking visitors has many variations
and can be extended in a variety of ways. The basic premise is as follows. Observers choose one

10
out of a predetermined number of visitors to the exhibit to track. This is to ensure that there is no
bias in the determination of those to track. This visitor is then observed for the duration of their
stay in the exhibit. Various factors are noted down about their visit such as how long they spend
at an exhibit, or dwell time, the order of the exhibit elements they stop at, and their path through
the gallery. The path can be noted by writing on a paper map of the exhibit. These factors can be
used to determine the holding power and attracting power of a specific display (Yalowitz &
Bronnenkant, 2009).
Another interaction of note is the level of interest a visitor has in a gallery. A visitor
could just be a “walkthrough”, someone using the gallery for a hallway, or a “turnaround”,
someone who walks in, but is uninterested and leaves right away. The rate at which these two
occurrences happen can indicate that the exhibit should be made more visually appealing or more
heavily marketed so visitors stay. For visitors who do engage with the exhibit, their path and first
case visited can indicate their placement in the hierarchy of visitor engagement (e.g. a follower
follows a specified path, a browser is attracted to interesting looking exhibits) (Yalowitz &
Bronnenkant, 2009).
Observers could also record demographic data, such as age or race, in order to determine
which of these groups the gallery appeals to. Are mostly foreigner visitors visiting the exhibit?
Provide translations of important texts near exhibits. Are there a lot of older visitors looking at
the gallery? Provide benches or chairs for breaks from walking (Yalowitz & Bronnenkant, 2009).
There are various schools of thought on the specifics of how to measure these values.
Even something as simple as what constitutes a “stop” at a display can be debated. This
inconsistency is due to the wide variety of sizes, shapes, and other properties of exhibits. A
“stop” at an extremely large exhibit could be counted as a slow walk while looking at it, while a
small display might require both of the subject’s feet being motionless. It is important for these
parameters to be calibrated to the exhibit and institution doing the tracking. As a human is doing
the measurement there will usually be some subjectivity in the observations. It is important to
have all the people doing the tracking “on the same page” about their methodology. This will
allow them to accurately compare data collected within the institution (Yalowitz & Bronnenkant,
2009).
All of this data contributes to understanding visitor experience. It can tell the institution
which individual displays are the most interesting, which types of displays are the most
11
interesting, as well as provide a comparison to other exhibits and even other institutions.
Sometimes this data must be carefully analyzed to provide these comparisons. For example,
comparing the time a visitor spends in one gallery to time spent in another gallery in another
institution can be challenging. The size and scope of the gallery and institution it is in can skew
the numbers. A small exhibit may be much more interesting and successful than a larger one, but
due to its size visitors do not stay very long. Derived metrics must sometimes be created to
compensate for this. The total time in the exhibit can be used to determine the Sweep Rate Index
(SRI) a normalized value of how fast visitors move through the exhibit area. This takes into
account the physical size of the exhibit to give a better way of comparing two very different
attractions (Yalowitz & Bronnenkant, 2009). It is measured in square-feet-per-minute, and
represents the amount of space-per-time used by the visitors studied as they “visually sweep” the
area of the exhibition. The SRI is inversely proportional to the amount of time visitors spend per
unit of area (Serrell, 1997).
Another useful metric to use in tracking study analysis is the Diligent Visitors Percentage
(%DV). This tracks the amount of visitors who view at least half of the exhibit’s items. This
allows the analyzer to have a quick number representing the amount of visitors who are intensely
interested in the material, and how thoroughly an exhibition was used. Together with the SRI this
metric can give a good indication of the mindset of the average visitor. A slight inverse
correlation is observed between them; however, they are not dependent. Quick moving visitors
with a high %DV may indicate that the high SRI is not due to disinterest, but possibly due to the
physical configuration of the gallery or other factors. When comparing data across galleries and
institutions it is a good idea to use derived tools such as these to give better insight than less
complex metrics would (Serrell, 1997).
Visitor Circulation
Visitor circulation is another important metric in museum exhibit evaluation. The path of
a visitor as they navigate an exhibit has a direct effect on what they learn. If a visitor cannot see
an exhibit, they cannot learn from it. Many phenomena have been observed among museum
patrons regarding their paths, which are sometimes driven by efficiency. The General Value
Principle argues that the path a visitor chooses is dictated by its cost and benefit to the visitor. A
12
path which has a high value (e.g. leads to an interesting looking exhibit) and is relatively short
will be travelled more often than a boring looking path to a faraway exhibit. Studying visitor
circulation and chosen paths can reveal information about the eye-catching points of an exhibit,
as well as information about the efficiency of the setup of the cases (Stephen Bitgood, 2006).
Many visitor path phenomena are results of visitors lowering the cost of visiting an
exhibit. For example, visitors often turn right when entering an exhibit because if they are
following typical hallway etiquette, they are already closer to the right edge of the doorway than
the left. Visitors are also subject to a seemingly inertial force, choosing to follow a straight path
as opposed to deviating to walk to an off-course case. There is often an imbalance of visitor
attention between sides of an exhibit, as visitors tend to follow only one wall and not cross the
empty expanse of the gallery center. The visitor desire for efficiency also leads to a tendency for
visitors to not backtrack and continue on to the exit rather than waste steps turning back to visit a
case. Sometimes called the “exit gradient,” this tendency often is demonstrated by visitors
following the shortest path to the exit of the gallery (Stephen Bitgood, 2006).
2.1.3. Surveying Visitors
Questionnaires are a useful tool when evaluating visitor experience. Unlike interviews
which can easily introduce bias into visitors’ responses, questionnaires can be carefully
constructed to be neutral in nearly all respects. In addition, questionnaires can be given at a much
higher rate than interviews as the manpower needed to give them is much less. Questionnaires
are pre-constructed, so they can also be administered to guests who do not speak the same
language as the staff (Diamond, 1999).
Developing a well-constructed questionnaire requires the author to decide on the amount
of quantitative and qualitative questions contained therein. While quantitative questions can be
very useful when doing statistical analysis of the data, respondents often have difficulty
providing accurate information in respect to variables such as time, number of objects seen etc.
Respondents can often, however, respond to more open ended qualitative information about their
own experiences. Questions such as “What did you like about the exhibit?” provide more
accurate data than questions such as “How long did you spend at this exhibit?” The exception to
this quantitative/qualitative rule is when simple demographics questions are asked about the
respondent (Diamond, 1999).
13
Qualitative questions however, require more man power to interpret. Each answer must
be read and interpreted by a human and recorded or placed in a certain category of
answers. While difficult, this can give a very good idea about what visitors really experience,
and can illuminate trends which may not be immediately apparent through quantitative data
alone.
After the quantitative/qualitative question is answered the questionnaire author must
decide on the breadth of the questionnaire. A “lean” survey can often be more effective than one
which explores all possible questions the institution might want to ask a visitor. A questionnaire
which provides context and theme for the visitor will be less confusing to the visitor than one
which is too broad. Individual questions may have context added to them as well through the
wording or answer choice selection (Diamond, 1999).
Additional considerations for the author include reducing bias in questions through
randomizing answer choices and choosing neutral vocabulary in the questions. In quantitative
questioning the “neutral response” rate, the amount of responses which choose the neutral or
middle option, can be overrepresented when a respondent does not feel passionately about their
opinion. This has a simple fix in that the “middle” option is removed from the answer choices.
Questionnaire refusal rate can be reduced through offering even small rewards, such as pencils,
to the visitors as well as making the entire process very easy. A respondent might fill out a
questionnaire, but neglect to return it if he or she is further inconvenienced by having to walk to
another area to hand it in (Diamond, 1999).
2.2. The British Museum
The British Museum was the first national public museum in the world. It is also one of
the largest museums in the world, housing over 8 million artifacts ("British Museum - History of
the collection," 2014). Over its lifetime, it has grown from having 5,000 visitors per year to
nearly 6 million today ("British Museum - General history," 2014). Its founding principles were
making the collections publicly accessible and displaying them to the greatest number of people
possible. It was meant to be a place where “humane cross-cultural examination” could take place
("British Museum - About us," 2014). The British Museum states:
14
“The aim of the British Museum is to hold for the benefit of humanity a collection
representative of world cultures and ensure that the collection is housed in safety, conserved,
curated, researched, exhibited and made available to the widest possible public.
Consistent with this aim is the Museum’s mission to inspire and excite visitors and other
users of the Museum, helping them to enjoy the collections to the fullest extent, through well-
presented and serviced public galleries and study collections, world class exhibitions, education
programmes and publications and imaginative use of media.” ("Report and Accounts for the
Year Ended 31 March 2003," 2014)
The museum goes on to state that one of its priorities to achieve its aim and mission is
continuous improvement in the quality of the general visitor’s experience. Studying visitor
behavior and evaluating visitor experience are important steps in this process of improvement.
Additionally, as Britain’s single most popular tourist attraction, it is important for the museum to
investigate ways to entertain a high number of visitors ("BBC News - British Museum is the
most visited UK attraction again," 2014).
The British Museum was founded through an Act of Parliament in 1753, after Sir Hans
Sloane bequeathed his collection of 71,000 objects to King George II. This initial collection
consisted mainly of books, manuscripts, natural specimens and some antiquities like coins and
medals, and was first housed in a 17th
century mansion known as Montagu House. The museum
first opened to the public in 1759. Since then, it has been open to all, free of charge. The museum
has remained continuously in operation since, except during the two World Wars ("British
Museum - General history," 2014).
The 19th
century was a period of growth in terms of the illustriousness of artifacts, the
number of exhibits and the number of visitors. The museum acquired the Rosetta Stone in 1802
and the Parthenon sculptures in 1816 among other high profile artifacts. The museum also built
additions such as the quadrangular building in 1852 and the round Reading Room in 1857. The
20th century saw further expansion, especially in public services offered by the museum. It also
went through additional expansions, including the construction of the Duveen Gallery to house
the Parthenon sculptures. The museum also branched into the ten divisions that still exist today.
While some departments are focused on specific geographic locations, others such as the
Department of Coins and Medals focus more on trends throughout history ("British Museum -
General history," 2014).
15
The British Museum is now located on Great Russell Street in Central London. Four new
permanent galleries opened in 2008-09. The next major project is the World Conservation and
Exhibitions Centre. Restoration work has also been done on existing buildings and exhibits. The
permanent exhibit of the Department of Coins and Medals underwent substantial renovation in
2012 ("British Museum - Coins and Medals," 2014; "British Museum - General history," 2014;
"Catching up with progress in the Money Gallery," 2014).
2.3. The Department of Coins and Medals
The Department of Coins and Medals is responsible for the British Museum’s
numismatic collection, comprising about 1 million objects. The department’s aim is for its
collection to serve as a key reference for scholars and members of the public. The collection was
built on the 20,000 coins and medals from Sir Hans Sloane’s donation. It has a wide variety of
objects, spanning the history of coinage and currency-related material. The collection of paper
money comprises 50,000 specimens ("British Museum - History of the collection," 2014).
The Citi Money Gallery is a popular exhibit contained within the Department of Coins
and Medals. In 2012, the gallery changed sponsors and entered into a five-year contract with Citi
Bank. Substantial renovation work was conducted in the gallery, taking into account existing
visitor tracking data while creating the new gallery layout. The contents of display cases were
also changed based on data from visitor questionnaires ("Catching up with progress in the
Money Gallery," 2014). Our objective is re-evaluating the gallery based on visitor tracking and
questionnaires, gauging the effectiveness of the renovations and presenting our findings with
recommendations.
2.4. Recent Findings
In the past seven years Worcester Polytechnic Institute students have conducted gallery
evaluations for the Department of Coins and Medals at the British Museum a total of five times.
The first evaluation was in 2007(Stanford et al., 2007), followed by evaluations in the years 2008
(Klebanov, Glover, Carlyle, Clark, & Ray, 2008), 2009 (White et al., 2009), 2010 (Peterson et
al., 2010), and most recently 2013 (Osborn et al., 2013). These reports focused on evaluations of
16
multiple galleries within the British Museum, namely the Egyptian Sculpture Gallery, the Roman
Empire Gallery, North America Gallery, temporary exhibits in Gallery 69a, and finally the Citi
Money Gallery or HSBC Money Gallery as it was known prior to 2012. Here, we look at the
motivation and objectives behind each of these studies, as well as their findings and how they
have changed over time. From their methodologies and findings we can gather valuable data
which is useful for the development of our own methodology.
2.4.1. Objectives
The 2007 IQP group focused specifically on the experience of families in these exhibits
rather than all of the galleries’ visitors. They evaluated both the HSBC Money gallery and
the Egyptian Sculpture gallery to provide information which would be useful for upcoming
renovations.
The 2008 IQP group was focused on updating the visitor study methodologies of the British
museum that were already in place at the time. They executed their methodologies on the
North America, Roman Empire, and Egyptian Death and Afterlife exhibits.
The 2009 IQP group focused on specific metrics used in visitor studies, including holding
power, attracting power, dwell time, and visitor circulation. This group evaluated the HSBC
Money Gallery and the temporary gallery 69a, which then housed an exhibit entitled “The
Splendor of Isfahan: Coins from Iran.”
The 2010 IQP group evaluated some specific cases in the HSBC Money Gallery, as well as
Gallery 69a, which held temporary exhibits displaying currencies from different cultures that
rotated every 6 months, and the effectiveness of the visitor study process the currently
museum had in place.
In 2013, the gallery underwent renovations after entrance into a five year contract with Citi
Bank, following some of the recommendations form the 2010 team. As a result, the 2013
IQP group was tasked with evaluating the effectiveness of the renovations that the Citi
Money Gallery underwent to improve the visitor experience.
17
2.4.2. Methodologies
All the aforementioned IQP teams employed strategies of tracking individual visitors as
well as providing surveys and questionnaires to visitors as they exited the galleries. When
looking at questionnaires there were many common questions asked over the years. These
questions focused on demographics of the visitors like nationality, first language, age, and
gender. Other common questions were about the person’s reason for going to the museum,
reason for going to a specific gallery, and the most enjoyable part of the specific gallery for the
visitor. These common questions provide our group with a starting point when creating our own
questionnaires to be implemented in our own methodologies.
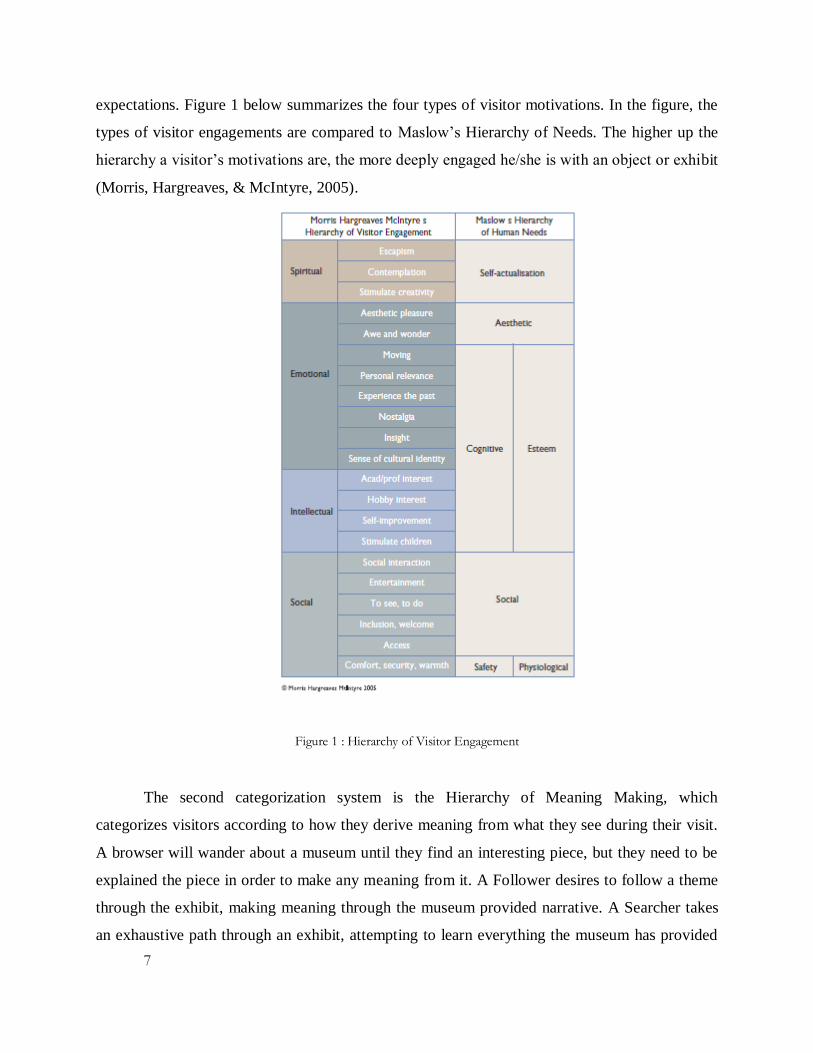
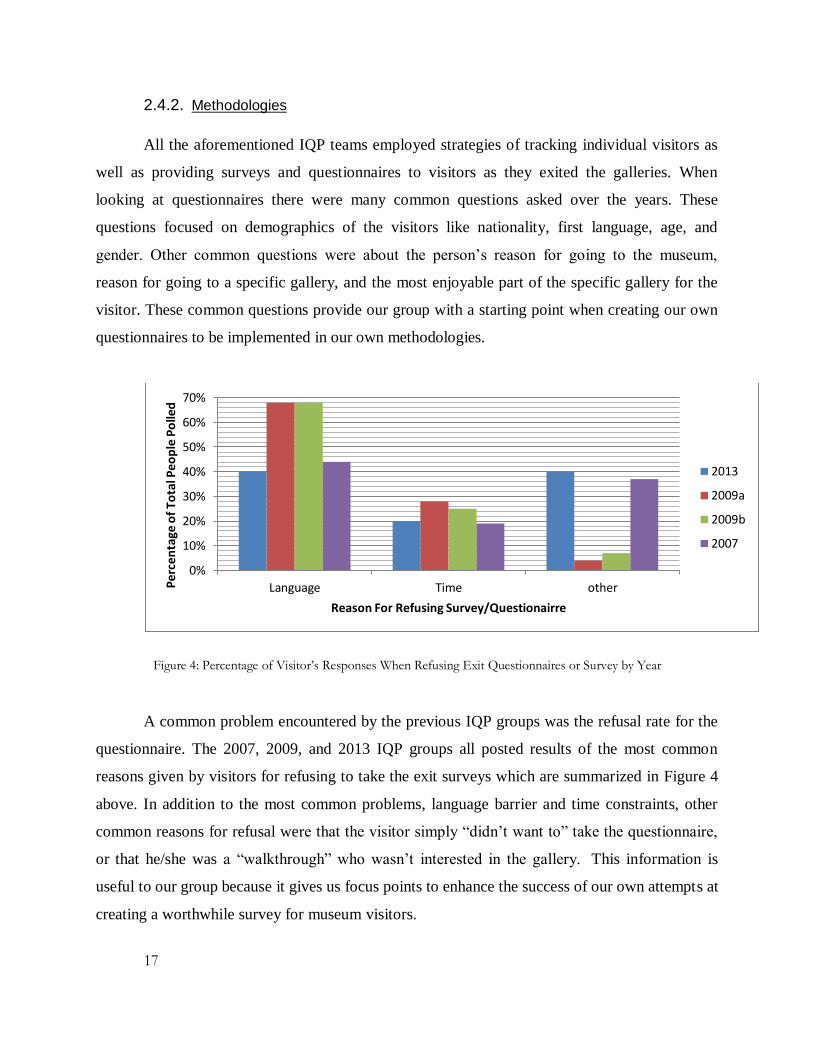
Figure 4: Percentage of Visitor’s Responses When Refusing Exit Questionnaires or Survey by Year
A common problem encountered by the previous IQP groups was the refusal rate for the
questionnaire. The 2007, 2009, and 2013 IQP groups all posted results of the most common
reasons given by visitors for refusing to take the exit surveys which are summarized in Figure 4
above. In addition to the most common problems, language barrier and time constraints, other
common reasons for refusal were that the visitor simply “didn’t want to” take the questionnaire,
or that he/she was a “walkthrough” who wasn’t interested in the gallery. This information is
useful to our group because it gives us focus points to enhance the success of our own attempts at
creating a worthwhile survey for museum visitors.
0%
10%
20%
30%
40%
50%
60%
70%
Language Time otherPer
cen
tage
of
Tota
l Peo
ple
Po
lled
Reason For Refusing Survey/Questionairre
2013
2009a
2009b
2007
18
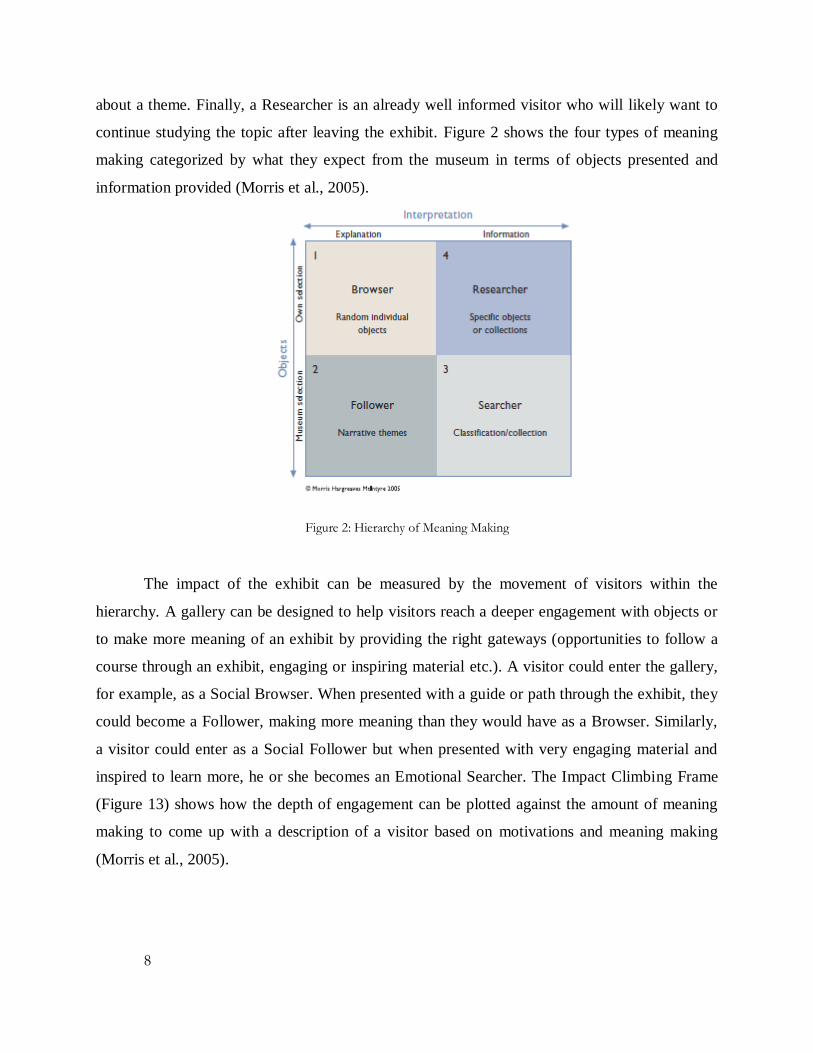
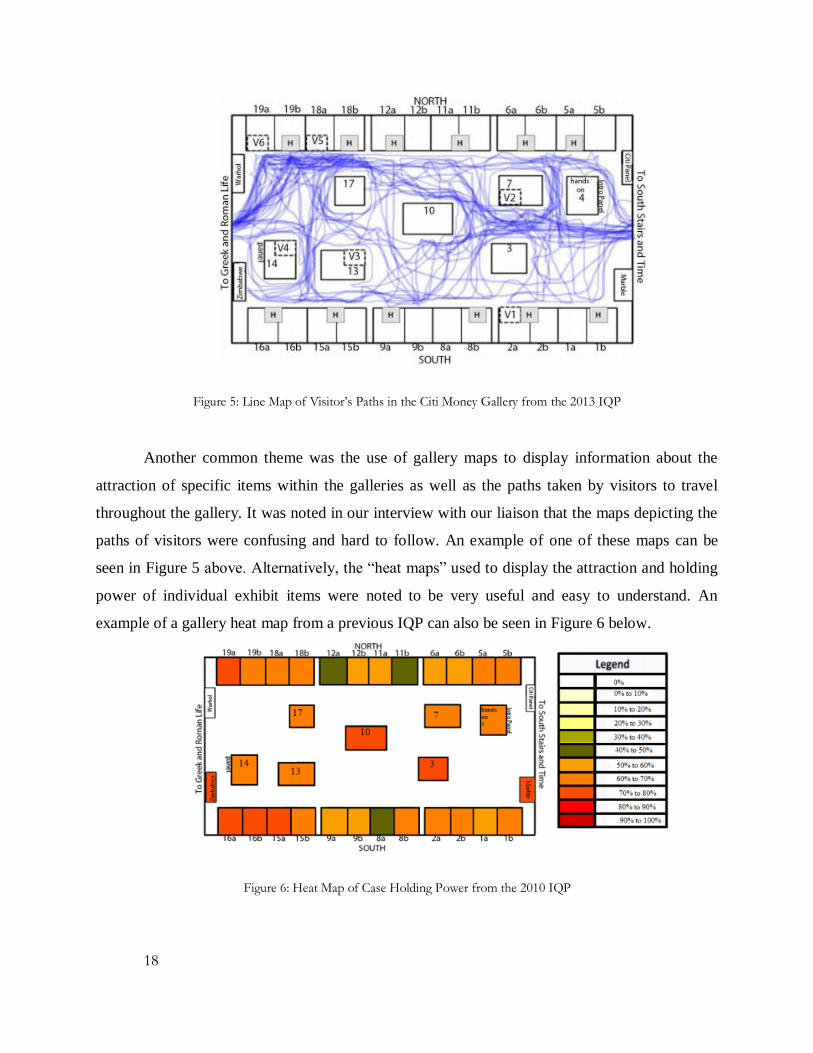
Figure 5: Line Map of Visitor’s Paths in the Citi Money Gallery from the 2013 IQP
Another common theme was the use of gallery maps to display information about the
attraction of specific items within the galleries as well as the paths taken by visitors to travel
throughout the gallery. It was noted in our interview with our liaison that the maps depicting the
paths of visitors were confusing and hard to follow. An example of one of these maps can be
seen in Figure 5 above. Alternatively, the “heat maps” used to display the attraction and holding
power of individual exhibit items were noted to be very useful and easy to understand. An
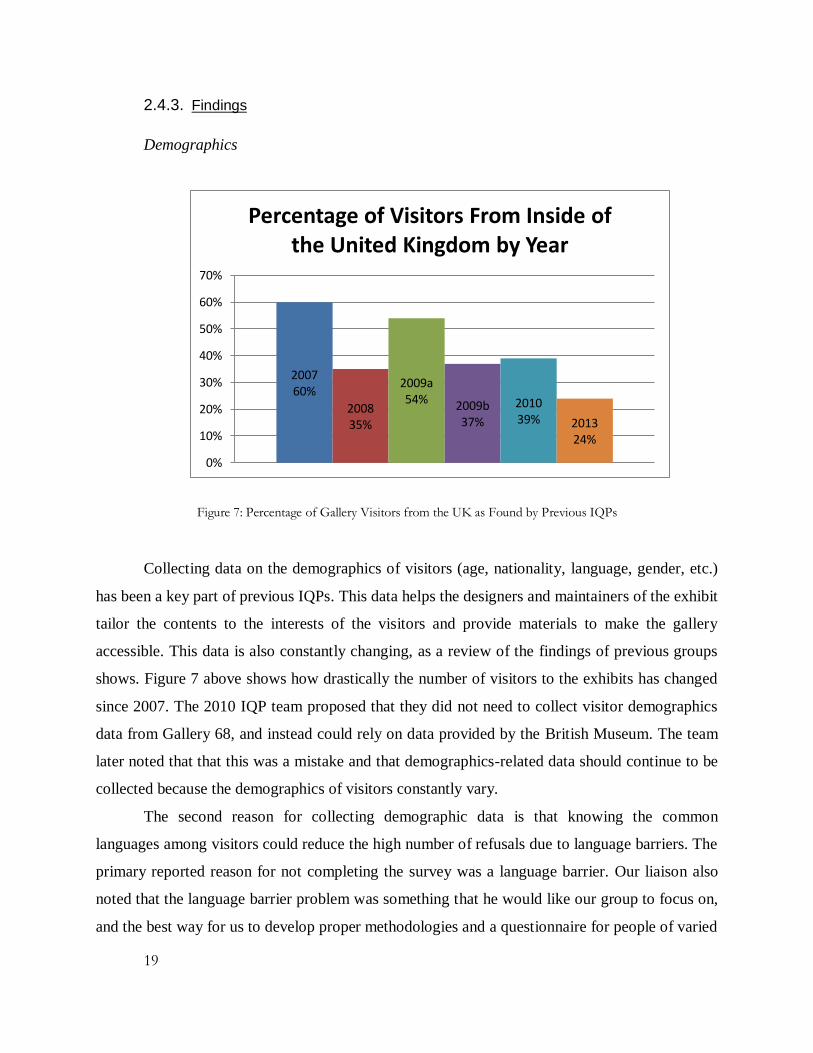
example of a gallery heat map from a previous IQP can also be seen in Figure 6 below.
Figure 6: Heat Map of Case Holding Power from the 2010 IQP
19
2.4.3. Findings
Demographics
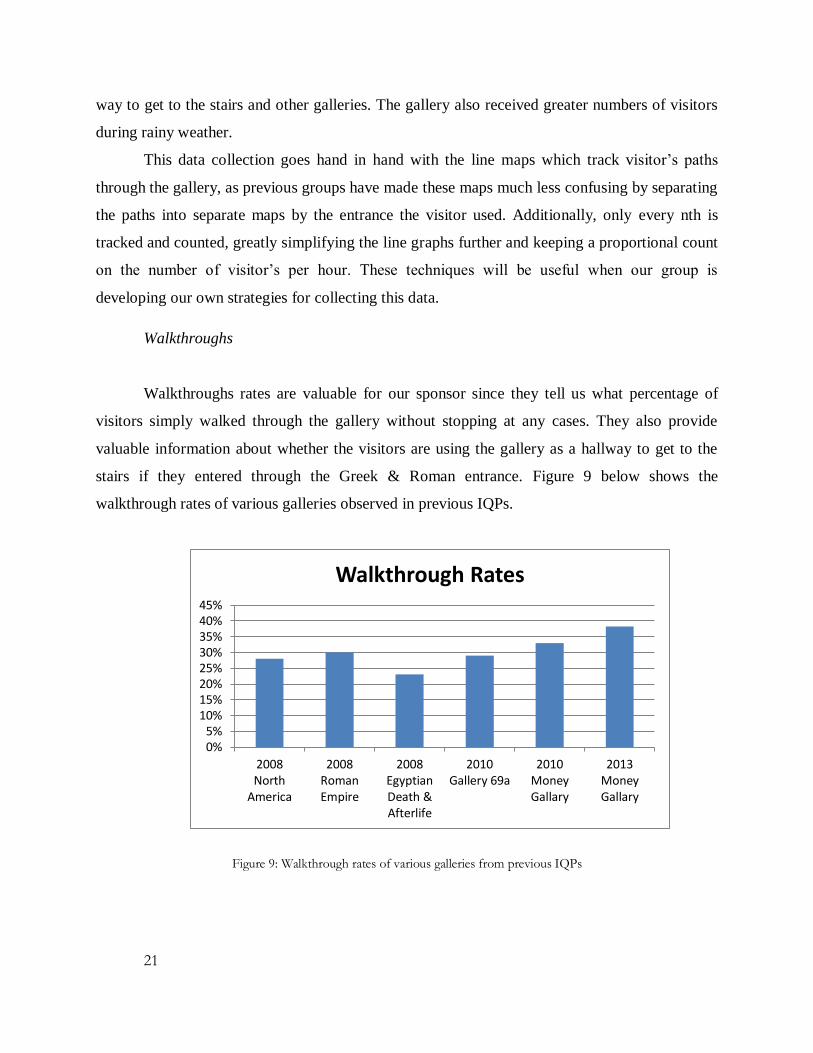
Figure 7: Percentage of Gallery Visitors from the UK as Found by Previous IQPs
Collecting data on the demographics of visitors (age, nationality, language, gender, etc.)
has been a key part of previous IQPs. This data helps the designers and maintainers of the exhibit
tailor the contents to the interests of the visitors and provide materials to make the gallery
accessible. This data is also constantly changing, as a review of the findings of previous groups
shows. Figure 7 above shows how drastically the number of visitors to the exhibits has changed
since 2007. The 2010 IQP team proposed that they did not need to collect visitor demographics
data from Gallery 68, and instead could rely on data provided by the British Museum. The team
later noted that that this was a mistake and that demographics-related data should continue to be
collected because the demographics of visitors constantly vary.
The second reason for collecting demographic data is that knowing the common
languages among visitors could reduce the high number of refusals due to language barriers. The
primary reported reason for not completing the survey was a language barrier. Our liaison also
noted that the language barrier problem was something that he would like our group to focus on,
and the best way for us to develop proper methodologies and a questionnaire for people of varied
2007 60%
2008 35%
2009a 54% 2009b
37%
2010 39% 2013
24%
0%
10%
20%
30%
40%
50%
60%
70%
Percentage of Visitors From Inside of the United Kingdom by Year

20
languages is to know what languages they speak. Figure 8 shows the primary languages spoken
by the people surveyed in all previous IQPs at the British Museum. While only the seven most
frequently spoken languages are listed, the “other” category consisted of the following nineteen
languages: Afrikaans, Bosnian, Bulgarian, Croatian, Czech, Danish, Dutch, Finnish, Greek,
Hindi, Japanese, Korean, Lithuanian, Norwegian, Persian, Polish, Spanish, Swedish, and
Vietnamese. In the 2013 IQP, it was interesting to note that while the team had translated the
questionnaires to many different languages, they ran into difficulties approaching foreign
language speakers and informing them of the availability of foreign language questionnaires.
Bridging this communication gap is one of the bigger challenges our team faces.
Figure 8: Primary languages spoken by Museum visitors as determined by previous IQPs
Visitor Counting
Another kind of data which the Department of Coins and Medals indicated was useful
was the count of visitors through different doors and at different times. The 2013 team found that
the highest number visitors came in during 11:00am, and a drop was seen around lunchtime. Of
the two entrances of the gallery, the Greek & Roman side received a greater number of visitors
than the staircase side, which led the team to conclude that more visitors used the gallery as a
0%10%20%30%40%50%60%70%80%90%
100%
Per
cen
tage
of
Tota
l Peo
ple
Po
lled
Primary Language Spoken by Visitors of the British Museum
2013
2010
2009
2008
2007
21
way to get to the stairs and other galleries. The gallery also received greater numbers of visitors
during rainy weather.
This data collection goes hand in hand with the line maps which track visitor’s paths
through the gallery, as previous groups have made these maps much less confusing by separating
the paths into separate maps by the entrance the visitor used. Additionally, only every nth is
tracked and counted, greatly simplifying the line graphs further and keeping a proportional count
on the number of visitor’s per hour. These techniques will be useful when our group is
developing our own strategies for collecting this data.
Walkthroughs
Walkthroughs rates are valuable for our sponsor since they tell us what percentage of
visitors simply walked through the gallery without stopping at any cases. They also provide
valuable information about whether the visitors are using the gallery as a hallway to get to the
stairs if they entered through the Greek & Roman entrance. Figure 9 below shows the
walkthrough rates of various galleries observed in previous IQPs.
Figure 9: Walkthrough rates of various galleries from previous IQPs
0%5%
10%15%20%25%30%35%40%45%
2008North
America
2008RomanEmpire
2008EgyptianDeath &Afterlife
2010Gallery 69a
2010MoneyGallary
2013MoneyGallary
Walkthrough Rates
22
Walkthroughs rates are also considered when simplifying the line charts discussed earlier.
The 2013 IQP Group created entirely separate maps to designate the paths taken by people
walking through the gallery so that the maps would be overall less confusing. This is an
approach which our group could take when depicting data.
Visitor Classification
The 2009 IQP was the first to classify visitors into Browsers, Followers, Searchers and
Researchers based on viewing strategy. The same rubric was used to classify users in the 2010
ans 2013 IQPs. Social, Intellectual, Emotional and Spiritual were the four categories of visitor
motivation and outcomes used in 2009, 2010, and 2013. In 2009 and 2010, but not in the 2013,
IQP Visitors were also classified as having four depths of engagement. These classifications
were Orientation, Exploration, Discovery and Immersion. Information about visitor classification
helps formulate recommendations to the Department of Coins and Medals about what sort of
visitors they should primarily tailor the gallery’s visitor experience to. Our group intends to use
the first two of these classifications when we develop our own methodologies for evaluating
visitors.
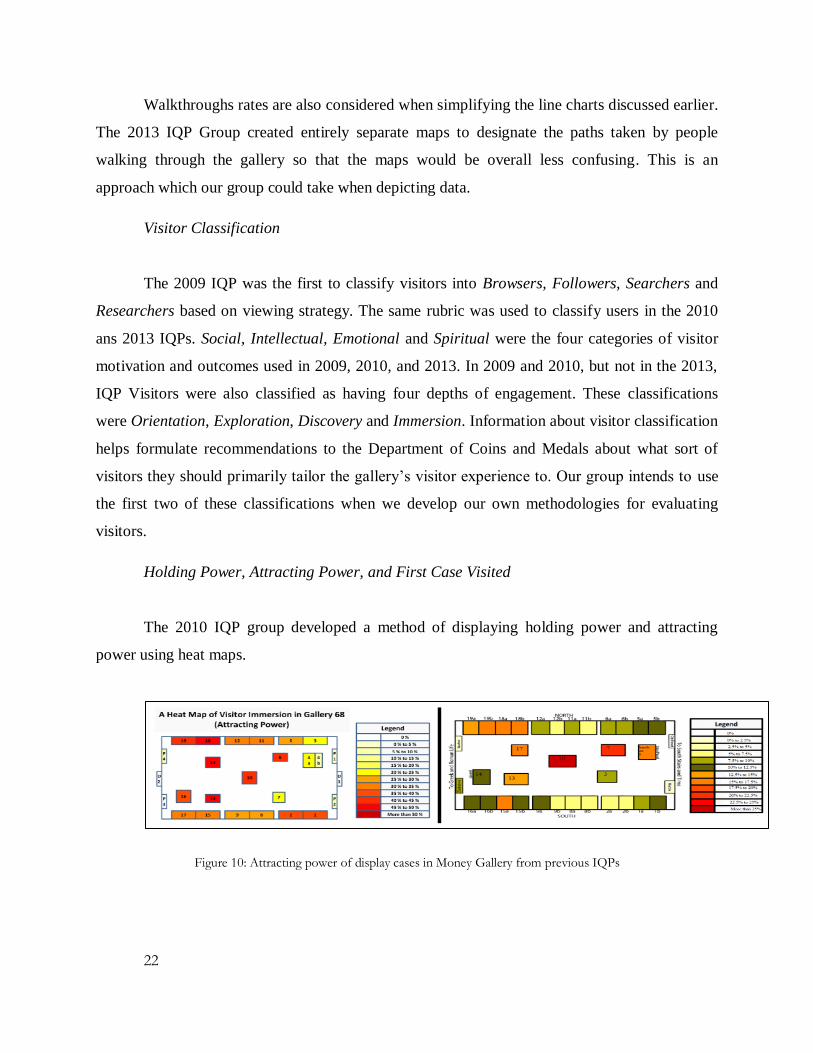
Holding Power, Attracting Power, and First Case Visited
The 2010 IQP group developed a method of displaying holding power and attracting
power using heat maps.
Figure 10: Attracting power of display cases in Money Gallery from previous IQPs
23
Comparing the heat maps from the 2010 IQP and the 2013 IQP, we can see that the older
gallery setup had overall higher attracting power for cases. In comparison, the new setup had a
greater holding power. The 2013 team concluded that this indicated “increased involvement with
individual cases” post-renovations. Additionally, they also found that key objects did not appear
to be more frequently visited, despite being the ‘highlights’ of the gallery. Both IQPs also found
that the cases closest to the doors had the highest number of first visits, and we expect similar
results in our study.
Name Recognition
Another notable finding is the recognition of Citi Bank as the sponsor of the money
gallery. The 2013 IQP found that a mere 57% of visitors knew the name of the gallery and only
16% knew that Citi Bank sponsored the Gallery. From visitor interviews, they concluded that
due to the lack of the Citi Bank logo and the name of the gallery displayed in gold lettering,
visitors failed to relate the gold word ‘Citi’ to Citi Bank.
24
CHAPTER 3: METHODOLOGY
The ultimate goal of our project is to present an analysis of the visitor experience in the
Citi Money Gallery of the British Museum. We updated and refined the methodology of previous
groups in an effort to gather more useful data from visitors. We relied on our background
research, interviews, past IQPs and creativity to aid the process of achieving our objectives,
which are:
1. Assess the current state of the industry regarding museum visitor experience assessment.
2. Determine what information would be useful for the museum and devise practical
revisions to the current methodologies for data collection about visitor experience.
3. Collect data from gallery visitors through visitor tracking and questionnaires.
4. Analyze visitor behaviors and attitudes from the newly gathered data and interpret it to
formulate recommendations.
5. Present statistical data and recommendations to the Department of Coins and Medals
staff.
Objective 1 was met in the Background chapter, objectives 2 and 3 were met by the
methodologies described in this chapter, and objectives 4 and 5 will be discussed in the Results
and Analysis chapter.
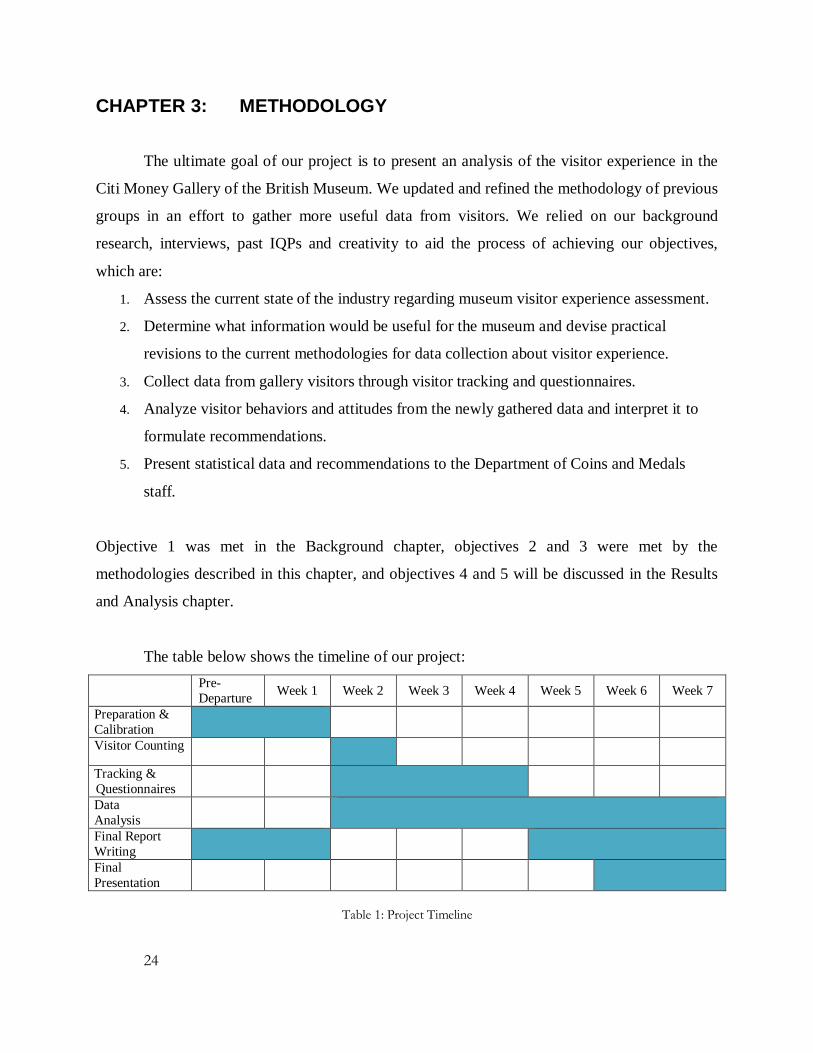
The table below shows the timeline of our project:
Pre-
Departure Week 1 Week 2 Week 3 Week 4 Week 5 Week 6 Week 7
Preparation &
Calibration
Visitor Counting
Tracking &
Questionnaires
Data
Analysis
Final Report
Writing
Final
Presentation
Table 1: Project Timeline
25
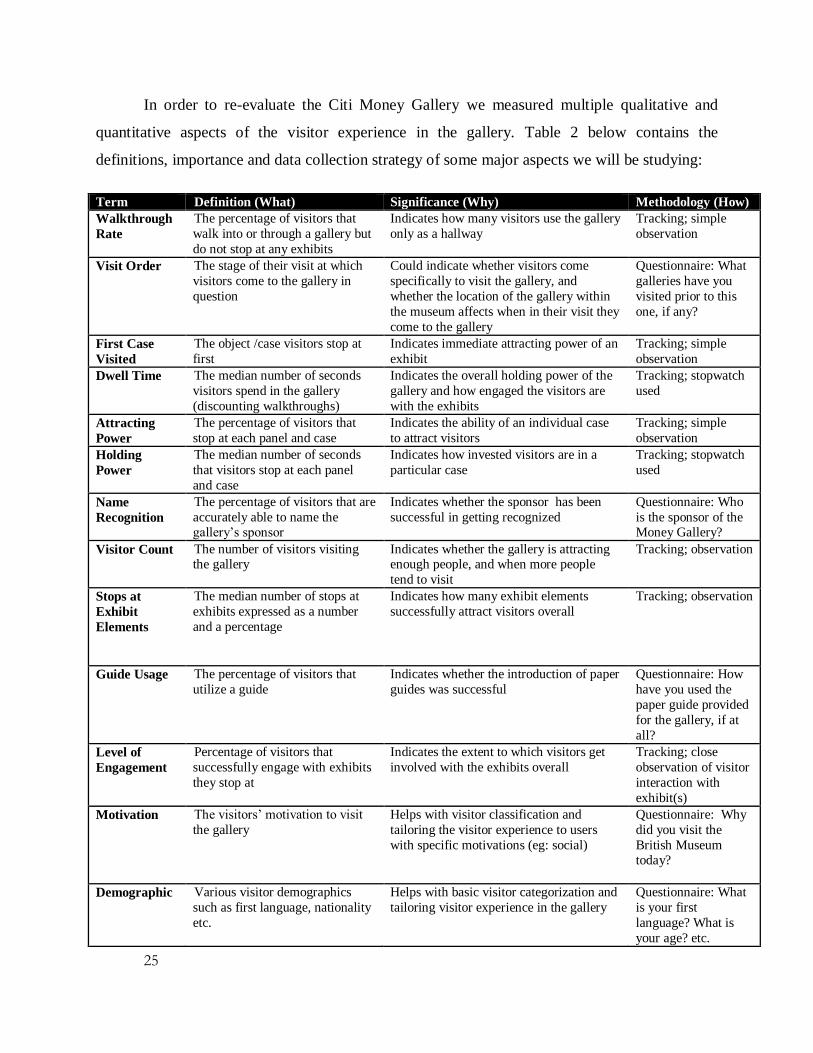
In order to re-evaluate the Citi Money Gallery we measured multiple qualitative and
quantitative aspects of the visitor experience in the gallery. Table 2 below contains the
definitions, importance and data collection strategy of some major aspects we will be studying:
Term Definition (What) Significance (Why) Methodology (How)
Walkthrough
Rate
The percentage of visitors that
walk into or through a gallery but
do not stop at any exhibits
Indicates how many visitors use the gallery
only as a hallway
Tracking; simple
observation
Visit Order The stage of their visit at which
visitors come to the gallery in
question
Could indicate whether visitors come
specifically to visit the gallery, and
whether the location of the gallery within
the museum affects when in their visit they
come to the gallery
Questionnaire: What
galleries have you
visited prior to this
one, if any?
First Case
Visited
The object /case visitors stop at
first
Indicates immediate attracting power of an
exhibit
Tracking; simple
observation
Dwell Time The median number of seconds
visitors spend in the gallery
(discounting walkthroughs)
Indicates the overall holding power of the
gallery and how engaged the visitors are
with the exhibits
Tracking; stopwatch
used
Attracting
Power
The percentage of visitors that
stop at each panel and case
Indicates the ability of an individual case
to attract visitors
Tracking; simple
observation
Holding
Power
The median number of seconds
that visitors stop at each panel
and case
Indicates how invested visitors are in a
particular case
Tracking; stopwatch
used
Name
Recognition
The percentage of visitors that are
accurately able to name the gallery’s sponsor
Indicates whether the sponsor has been
successful in getting recognized
Questionnaire: Who
is the sponsor of the Money Gallery?
Visitor Count The number of visitors visiting the gallery
Indicates whether the gallery is attracting enough people, and when more people
tend to visit
Tracking; observation
Stops at
Exhibit
Elements
The median number of stops at
exhibits expressed as a number
and a percentage
Indicates how many exhibit elements
successfully attract visitors overall
Tracking; observation
Guide Usage The percentage of visitors that
utilize a guide
Indicates whether the introduction of paper
guides was successful
Questionnaire: How
have you used the
paper guide provided
for the gallery, if at
all?
Level of
Engagement
Percentage of visitors that
successfully engage with exhibits
they stop at
Indicates the extent to which visitors get
involved with the exhibits overall
Tracking; close
observation of visitor
interaction with
exhibit(s)
Motivation The visitors’ motivation to visit
the gallery
Helps with visitor classification and
tailoring the visitor experience to users
with specific motivations (eg: social)
Questionnaire: Why
did you visit the
British Museum today?
Demographic Various visitor demographics
such as first language, nationality
etc.
Helps with basic visitor categorization and
tailoring visitor experience in the gallery
Questionnaire: What
is your first
language? What is
your age? etc.

26
Table 2: Important Aspects of Visitor Experience
3.1. Visitor Counting
In order to determine the accuracy of the electronic visitor counter on the east entrance,
we performed visitor counting. Two observers stood at each of the two doors, one counting the
number of visitors entering and one counting the number of exits. Each observer used either a
piece of paper and pencil or a smartphone app to count visitors. The electronic counter was reset
to zero at the beginning of the study and was not reset again. The number was checked at the
beginning and end of each time interval and recorded for later analysis with the manual count.
3.2. Visitor Tracking
In order to collect much of the information we wished to present to The British Museum
at the end of our project, we took time to observe the behaviours of visitors’ inside of the Citi
Money Gallery. This was accomplished by tracking individual visitors throughout the entirety of
their time inside of the gallery and making notes of all of their actions. The information we
collected by tracking these individuals included walkthrough rate of the gallery, exhibit visit
order, first case visited, exhibit dwell times, attracting power of cases, holding power of cases,
guide usage, levels of engagement, and visitor viewing strategy.
Term Definition (What) Significance (Why) Methodology (How)
Visitor
Behavior
Percentage of browsers,
followers, searchers and
researchers
Helps with basic visitor categorization and
tailoring visitor experience in the gallery
Tracking (viewing
strategy),
questionnaire: Why
did you visit the
British Museum
today?
Visitor
Response
Categorizing visitors as social,
intellectual, emotional and
spiritual based on their responses
to the gallery as a whole, as well
as to individual objects
Helps with basic visitor categorization and
tailoring visitor experience in the gallery
Questionnaire: Why
did you visit the
British Museum
today? What did you
take away from the
Money gallery?
27
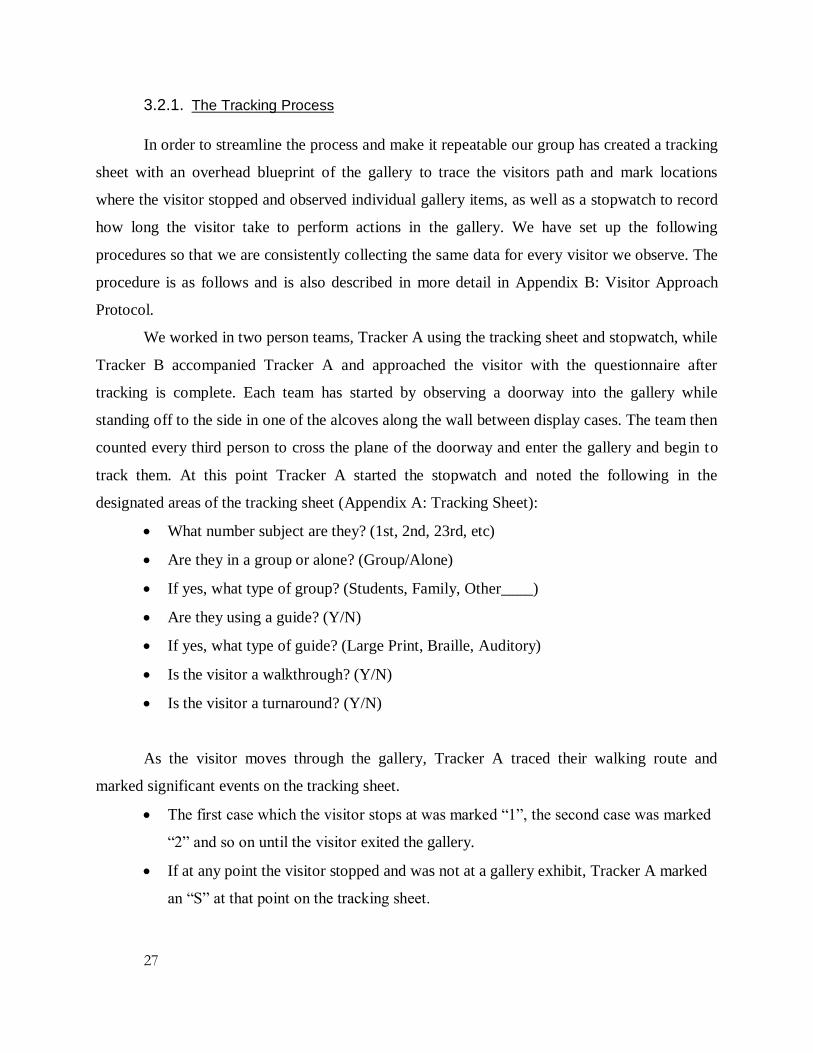
3.2.1. The Tracking Process
In order to streamline the process and make it repeatable our group has created a tracking
sheet with an overhead blueprint of the gallery to trace the visitors path and mark locations
where the visitor stopped and observed individual gallery items, as well as a stopwatch to record
how long the visitor take to perform actions in the gallery. We have set up the following
procedures so that we are consistently collecting the same data for every visitor we observe. The
procedure is as follows and is also described in more detail in Appendix B: Visitor Approach
Protocol.
We worked in two person teams, Tracker A using the tracking sheet and stopwatch, while
Tracker B accompanied Tracker A and approached the visitor with the questionnaire after
tracking is complete. Each team has started by observing a doorway into the gallery while
standing off to the side in one of the alcoves along the wall between display cases. The team then
counted every third person to cross the plane of the doorway and enter the gallery and begin to
track them. At this point Tracker A started the stopwatch and noted the following in the
designated areas of the tracking sheet (Appendix A: Tracking Sheet):
What number subject are they? (1st, 2nd, 23rd, etc)
Are they in a group or alone? (Group/Alone)
If yes, what type of group? (Students, Family, Other____)
Are they using a guide? (Y/N)
If yes, what type of guide? (Large Print, Braille, Auditory)
Is the visitor a walkthrough? (Y/N)
Is the visitor a turnaround? (Y/N)
As the visitor moves through the gallery, Tracker A traced their walking route and
marked significant events on the tracking sheet.
The first case which the visitor stops at was marked “1”, the second case was marked
“2” and so on until the visitor exited the gallery.
If at any point the visitor stopped and was not at a gallery exhibit, Tracker A marked
an “S” at that point on the tracking sheet.
28
If the visitor photographed any part of the gallery Tracker A marked “P” on the
object that is photographed on the tracking sheet.
If the visitor glanced at an exhibit but did not stop, Tracker A marked “G” on that
exhibit glanced at on the tracking sheet.
If the visitor held a discussion with another visitor, Tracker A marked “D” where the
discussion took place on the tracking sheet.
Any time a stop occurred, at an exhibit or otherwise, Tracker A used the “lap “ function
of the stopwatch to record the point at which the visitor stopped moving and the point at which
they started to walk again. As the visitor moved through the gallery, the team moved between
alcoves to follow the visitor, and Tracker B moved to whatever exit the visitor is heading
towards.
When the person moves to exit the gallery, Tracker B approached the visitor with a
questionnaire. Tracker A made note of the exit being used on the tracking sheet. If the
questionnaire was refused, the reason for refusal was marked on the tracking sheet by Tracker A.
Tracker A also recorded the overall lap times in the table on the back of the tracking sheet. When
the questionnaire was completed, the team moved back to their starting position and repeated this
process again.
3.2.2. Tracking Analysis
For the entirety of the visitor’s path through the gallery Tracker A records any notes they
might have on visitor behaviour to be used in determining visitors’ meaning making and viewing
strategies. At a later date the tracking sheet along with its paired questionnaire response was
analysed using the rubric developed for the hierarchy of meaning making and the hierarchy of
visitor engagement to classify the visitor by their viewing strategy the as well as their level of
engagement with the gallery.
3.2.3. Tracking Calibration
We practiced the tracking procedures during our first few days working at the British
Museum to make sure that everyone was performing the study on the same way, to test our

29
equipment, and to see which pairs worked best together for maximum efficiency and the best
results. We prepared a list of people we did not track and give questionnaires to (such as people
under the age of 18, people in tour groups etc.). We also decided where in the gallery we should
stand while tracking visitors so as not to disrupt the flow of the gallery or draw attention to
ourselves.
The most important prerequisite for collecting reliable data is making sure all the team
members are performing consistently when it comes to what information they are gathering. This
was achieved by studying the list of definitions of key aspects being studied followed by
practicing data collection. We practiced visitor tracking by having all team members track the
same visitors simultaneously. We then compared the data collected to ensure it was the same,
and repeated the process until we were satisfied with the results.
3.3. Questionnaires
In order to begin to understand the visitor experience in the Citi Money Gallery
with real depth it is necessary to move beyond simple observation. We are interested in the
thoughts that are going through visitors’ heads as they transit the gallery, what they like and
dislike, and it is only possible to get a base sense of what those are with passive techniques.
Using a questionnaire to directly access this information is a good way of evaluating visitor
experience. The questionnaire we have composed can be seen in Appendix C: Questionnaire.
There are several categories of information we wanted to obtain with a
questionnaire:
3.3.1. Demographics
To place visitor responses in the right context it is a good idea to get demographic
information from them. If a certain segment of population corresponds to a certain type of
visitor, that information can be used by the museum to increase the impact of the gallery. Table 3
below shows the types of demographic data have collected as part of our questionnaire as well as
some of the reasons why.

30
Information Type Why?
Age A visitor’s age will let us know if interest in the gallery comes from one specific age
group, or is spread throughout all groups. The gallery could be tailored to the most
common age group to increase their enjoyment of it, or changed to attract a different
audience.
Nationality This statistic will tell us if there is any specific country of origin the gallery may want to
tailor their exhibits to in the future.
First Language Foreign language support is an important factor that is missing in the gallery and gallery
evaluations. Knowing which languages to support will be very important in rectifying that.
Table 3: Demographic Categories
3.3.2. Exhibit Preferences
Understanding which exhibits the visitor liked or disliked, and correlating these with the
tracking data can give an idea of which exhibits are most popular, and why. Some example
questions are below.
Which exhibits were your favorites?
Which exhibits were your least favorites?
What attracted your attention the most?
3.3.3. Learning Information
As the goal of a museum is to educate visitors, the amount of information visitors learn
from the gallery is also important. Questions about the individual exhibits, especially the ones
they like the most, can give information about what the visitors are taking away from the gallery.
Some example questions are below.
What is one thing that you learned from this gallery as a whole?
What did you learn from your favorite exhibit?
Is there anything you would like to learn more about?
3.3.4. Sponsor Recognition
As it is the sponsor of the Money Gallery, Citibank would like to know how well the
gallery advertises them. In previous studies, this has been found by asking visitors if they know
the sponsor or to name the sponsor of the gallery. For our study we asked visitors to pick from
31
three banks logos (Citi, HSBC, and JPMorgan) to see if they could recognize the sponsor of the
gallery.
3.3.5. Visitor Guides
Finally, in our questionnaire we asked visitors about their use of the large print and tactile
guides available in the gallery near either door. If they did not use the guide, we asked for their
reasons why in order to determine how the gallery can encourage visitors to use the guides. If
they did use the guide, we asked them to rate the guides’ usefulness.
3.4. Methodological Innovations
There are two factors of the visitor study which we have improved at the British
Museum: the way in which data is gathered, and the way in which data is presented. Visitor
studies have been performed for years, but there is always room for improvement in all
methodologies. Gathering a new type of data or gathering the data in another way has yielded
better insight into the minds of visitors. However, this data is useless if it cannot be interpreted
and learned from. For this reason, we have also found new ways to present data to our liaison,
sponsors, and the rest of the British Museum community.
3.4.1. Survey Translations
An important focus of our project which distinguishes us from past IQP groups is our
intent to gather data from foreign language visitors. While the 2013 IQP group created foreign
language questionnaires, they were only able to get data from a small number of foreign visitors
as they had difficulty approaching them in any language except English (Osborn et al., 2013).
We have overcome this difficulty by translating the questionnaire into 17 different languages and
created an approach protocol which we think will be suitable for presenting visitors with
questionnaires. While approaching these visitors was more difficult than English speaking
visitors, the increase in data gathered in this large demographic is valued very highly. Offing the
survey in multiple languages also has an effect on questionnaire refusal rate, as more people are
able to take the survey.

32
There is no currently accepted protocol for approaching visitors, and as part of our
project we have tried to find an effective and friendly way to give surveys to the foreign
language speakers in the British Museum. This procedure includes the language in which the
visitors are approached. We will also consider how to explain the project to both native English
speakers and those who can’t speak English.
To facilitate the use of multiple language surveys Apple iPad tablets were used to deliver
the surveys. This eliminated the need for multiple copies of the questionnaires in each language.
One issue this raises is that this use of technology in conjunction with our qualitative question
philosophy is that data input into the tablet may bias the responses we get. Lower income
respondents with less experience with tablets may produce shorter and/or less informative
responses than those with previous experience typing on tablets.
In order to ensure that our data collection is accurate and efficient, we undertook a
number of pre-testing procedures completed both in Worcester and at the British Museum. First,
we choose an iOS app that helped us administer the questionnaire to tracked visitors. We chose
the Qualtrics® software which offers survey services on both iOS and Android devices, and is
currently used by WPI. Later in pretesting we tested the questionnaire on the chosen application
to make sure it could be taken correctly every time.
3.4.2. Visitor Guides
We are the first group to study the effectiveness of the paper gallery guides offered by the
Citi Money Gallery. In order to do so, we have utilized both tracking methodologies as well as
the questionnaire. We have recorded the percentage of visitors tracked that pick up a guide as
well as the percentage of visitors that appear to actively follow the guide and base their viewing
strategy on it. The questionnaire also contains questions such as whether the visitors found the
guide helpful, etc.
3.4.3. Interactive Methods
We wanted to make the visitor feedback process more interactive and enjoyable for
visitors than simply answering a plain text questionnaire. We aimed to achieve this by including
33
interactive pictures in the questionnaire and considered presenting the visitors with a poster
board displaying pictures of exhibits from the gallery and asking them to mark their favorite
exhibits with stickers. We are also experimenting with the idea of incorporating QR codes for
users who are interested in knowing more about the exhibits. While we did include interactive
pictures in the questionnaire, we did not have time to implement the poster and upon arrival
found QR codes already in some use in the gallery.
Another way we considered trying to improve data was making our questionnaire have
some sort of incentive for visitors, which would increase their overall satisfaction in taking the
survey and make them feel more contractually obligated to provide good information. While we
did not implement this, we would suggest it as a consideration for future projects. The incentive
could be in the form of interaction, such as putting a sticker on a board to mark their favorite
exhibit. Incentive could also be in the form of a souvenir like a pencil or sticker for the
participant.
3.4.4. Improved Data Presentation
Our liaison has indicated that they are interested in seeing new ways of presenting certain
data, especially the line maps depicting visitor paths through the gallery. We are experimenting
with various methods of presenting such data, including color coding and varying the
thicknesses/densities of the lines followed by visitors to indicate varying concentrations of
people, average dwell times, etc.
We first considered writing our own Android based app to use in tracking. The app would
record the path of a visitor entered by the tracker on the device’s touchscreen. This goal was
outside of our time constraints once we arrived in London, so we began looking at existing
software to perform a similar function. We looked into Geographical Information System (GIS)
software, but were informed that this software might have more capabilities than we needed and
had a steep learning curve. We found another piece of software, Syntax 2D, developed by the
University of Michigan, which we intend to use for data presentation.
Syntax 2D can be used to calculate a myriad of things, including a Path Count, which
shows a heat map of paths. Where many people walk, the map is red. Where very few people
walk the map is dark blue. It also includes a labelled color scale so the viewer can see what the
34
max number of visitor paths in a grid. Appendix F: Syntax 2D Instructions contains instructions
to generate a Path Count in Syntax 2D.
3.4.5. Focus on Learning and Qualitative Feedback
Instead of collecting largely quantitative data from visitors, we focused on the more
qualitative aspects of visitor experience, such as visitor learning through exhibits. Questions
pertaining to the visitors’ favorite exhibits, such as what attracted them to an exhibit first, and
what they would like to know more about were presented in “free response” manner in an
attempt to obtain more accurate, in depth, and visitor specific information than a multiple choice
format might generate.
The types of questions being asked on our questionnaire are slightly different from the
ones asked in previous efforts. We want to get a more qualitative view of the visitor experience
in the gallery. Thus we included more “free response” questions that forced the respondent to jog
their memory and write down information about their experience. In addition to this we included
a more graphical questionnaire than previous groups. Graphics, as opposed to text, will set the
respondent more at ease and can result in a higher rate of completion as well as better responses
(Diamond, 1999).

35
CHAPTER 4: RESULTS AND ANALYSIS
This chapter outlines the findings that we made while analyzing and interpreting the data
gathered during the course of our study. Findings are organized according to the headings at the
beginnings of sections 4.1 and 4.2. Section 4.1 describes results relating to the gallery, its
contents and set up, as well as visitor data. Section 4.2 contains findings on our methodologies,
specifically our questionnaire innovations and new methods of presenting data.
4.1. Results
Reaching More Visitors
Visitors by First Language and Country of Origin
Visitor Age Distribution and Group Size
Visitor Movements
Visitors travel along the north wall more than the south wall
Visitors are most likely to be drawn in during the first third of the gallery
Visitors entering from different directions tend to behave differently
The mean time spent in the gallery is longer than in previous years
Case Analysis
Reworking of Case 19 changed the behavior of viewers
Case 3 is not well set up to attract attention
Case 17 is good at pulling visitors in
Wall Displays receive less attention than other cases
Free standing cases have higher attracting power than other cases
Case Content Analysis
Visitor Experience
The gallery attracts many nationalities of visitors
Visitors do not usually intend to visit the Money Gallery
Learning in the gallery
Citibank sponsorship recognition is low
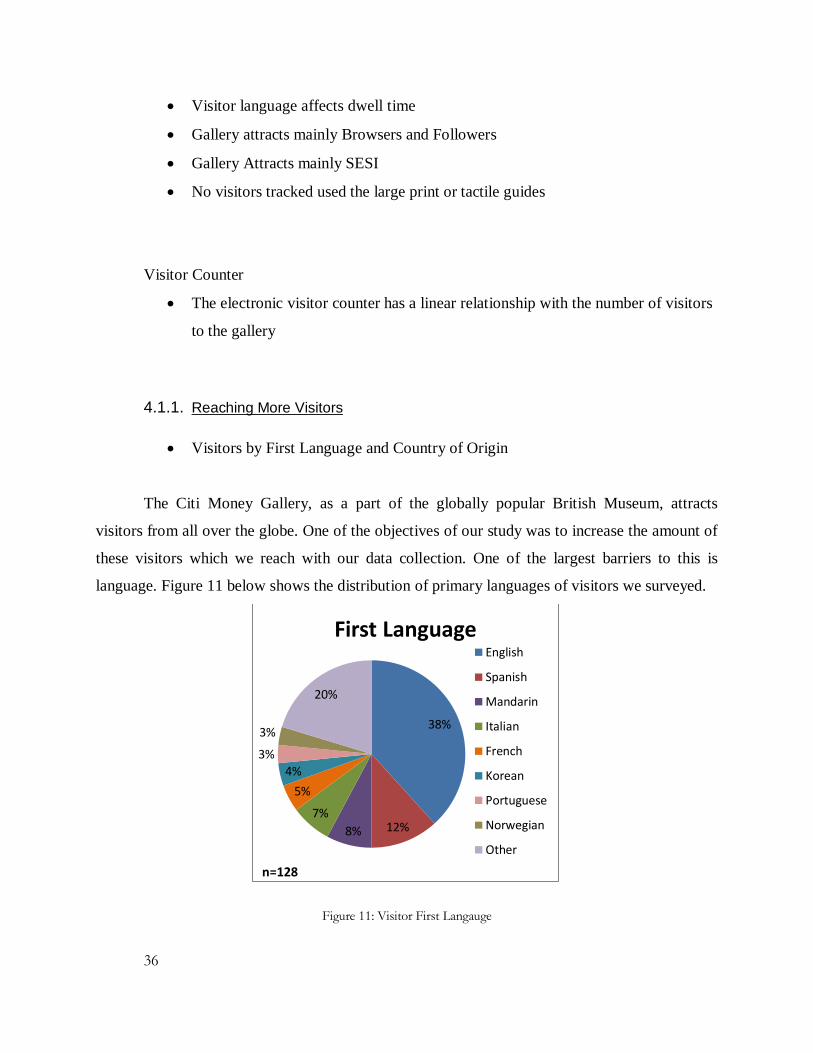
36
Visitor language affects dwell time
Gallery attracts mainly Browsers and Followers
Gallery Attracts mainly SESI
No visitors tracked used the large print or tactile guides
Visitor Counter
The electronic visitor counter has a linear relationship with the number of visitors
to the gallery
4.1.1. Reaching More Visitors
Visitors by First Language and Country of Origin
The Citi Money Gallery, as a part of the globally popular British Museum, attracts
visitors from all over the globe. One of the objectives of our study was to increase the amount of
these visitors which we reach with our data collection. One of the largest barriers to this is
language. Figure 11 below shows the distribution of primary languages of visitors we surveyed.
Figure 11: Visitor First Langauge
38%
12% 8%
7%
5%
4%
3%
3%
20%
First Language English
Spanish
Mandarin
Italian
French
Korean
Portuguese
Norwegian
Other
n=128
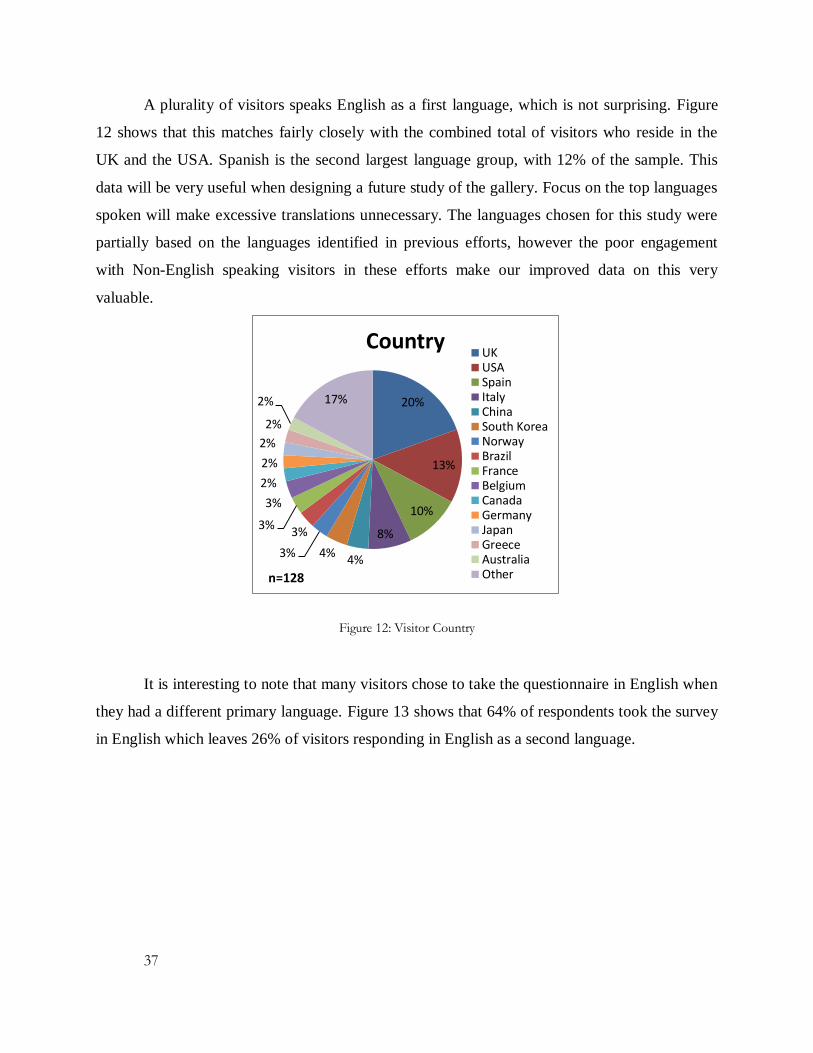
37
A plurality of visitors speaks English as a first language, which is not surprising. Figure
12 shows that this matches fairly closely with the combined total of visitors who reside in the
UK and the USA. Spanish is the second largest language group, with 12% of the sample. This
data will be very useful when designing a future study of the gallery. Focus on the top languages
spoken will make excessive translations unnecessary. The languages chosen for this study were
partially based on the languages identified in previous efforts, however the poor engagement
with Non-English speaking visitors in these efforts make our improved data on this very
valuable.
Figure 12: Visitor Country
It is interesting to note that many visitors chose to take the questionnaire in English when
they had a different primary language. Figure 13 shows that 64% of respondents took the survey
in English which leaves 26% of visitors responding in English as a second language.
20%
13%
10%
8%
4% 4% 3%
3% 3%
3%
2%
2%
2%
2%
2% 17%
Country UKUSASpainItalyChinaSouth KoreaNorwayBrazilFranceBelgiumCanadaGermanyJapanGreeceAustraliaOthern=128
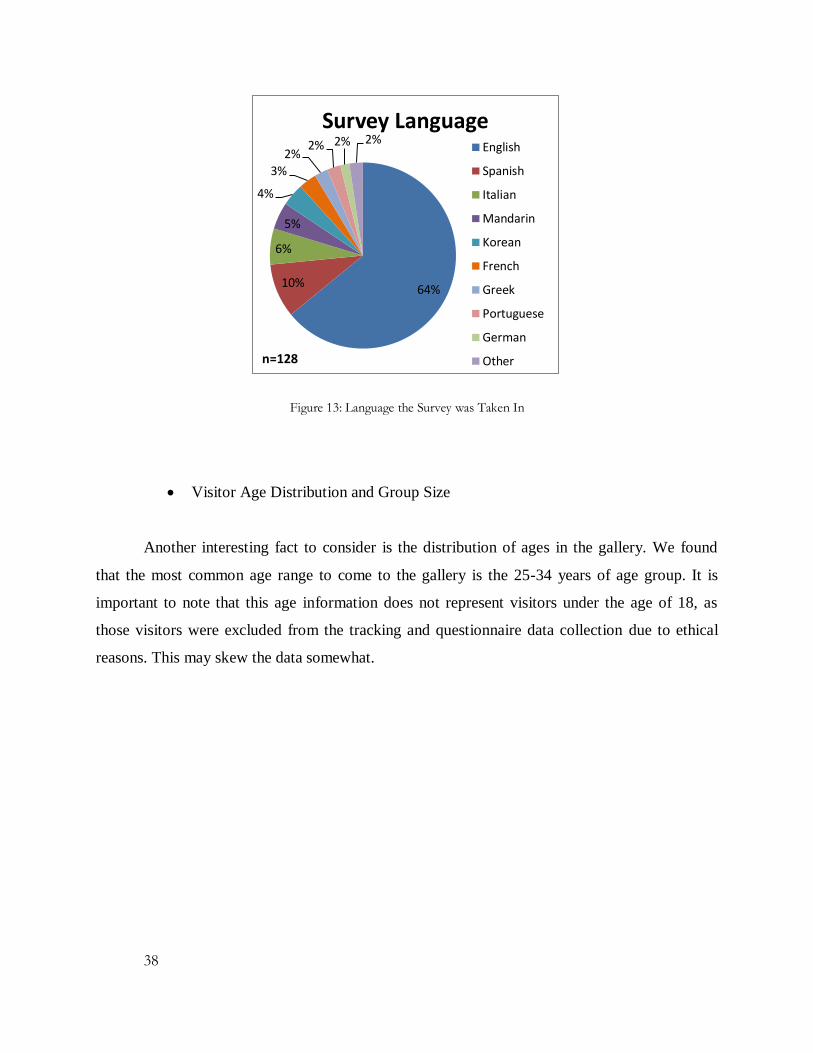
38
Figure 13: Language the Survey was Taken In
Visitor Age Distribution and Group Size
Another interesting fact to consider is the distribution of ages in the gallery. We found
that the most common age range to come to the gallery is the 25-34 years of age group. It is
important to note that this age information does not represent visitors under the age of 18, as
those visitors were excluded from the tracking and questionnaire data collection due to ethical
reasons. This may skew the data somewhat.
64% 10%
6%
5%
4%
3%
2% 2% 2% 2%
Survey Language English
Spanish
Italian
Mandarin
Korean
French
Greek
Portuguese
German
Othern=128
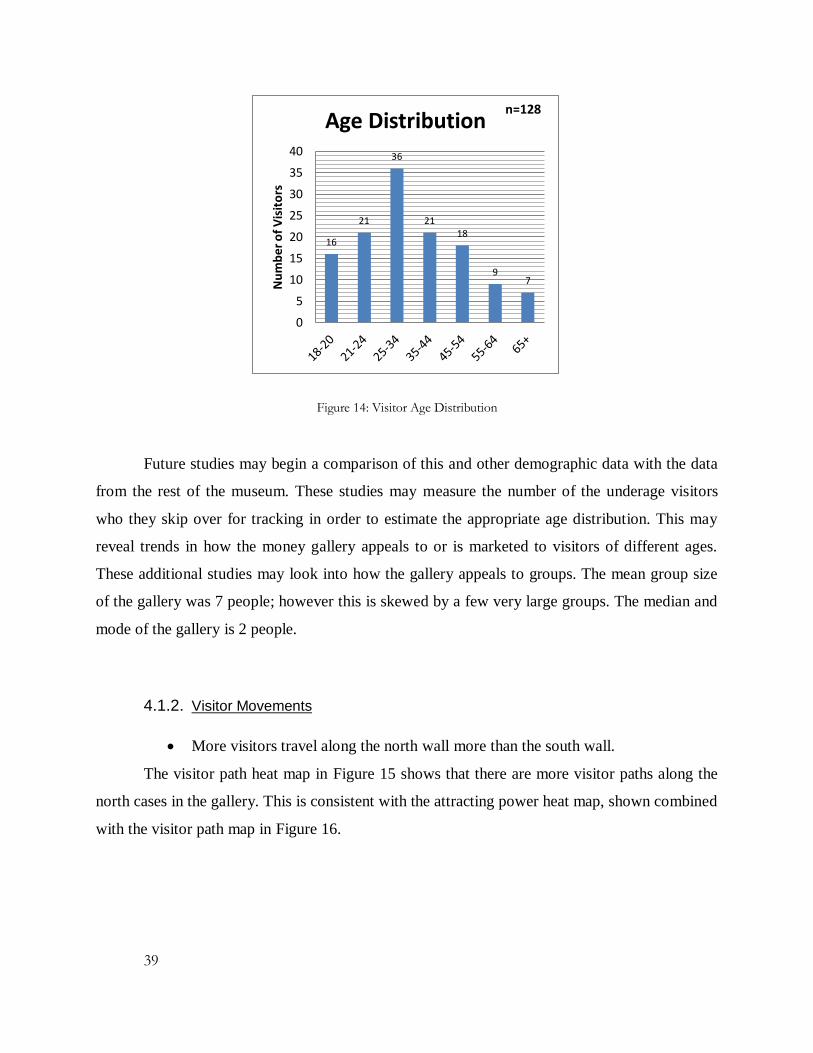
39
Figure 14: Visitor Age Distribution
Future studies may begin a comparison of this and other demographic data with the data
from the rest of the museum. These studies may measure the number of the underage visitors
who they skip over for tracking in order to estimate the appropriate age distribution. This may
reveal trends in how the money gallery appeals to or is marketed to visitors of different ages.
These additional studies may look into how the gallery appeals to groups. The mean group size
of the gallery was 7 people; however this is skewed by a few very large groups. The median and
mode of the gallery is 2 people.
4.1.2. Visitor Movements
More visitors travel along the north wall more than the south wall.
The visitor path heat map in Figure 15 shows that there are more visitor paths along the
north cases in the gallery. This is consistent with the attracting power heat map, shown combined
with the visitor path map in Figure 16.
16
21
36
21 18
9 7
0
5
10
15
20
25
30
35
40
Nu
mb
er
of
Vis
ito
rs
Age Distribution n=128
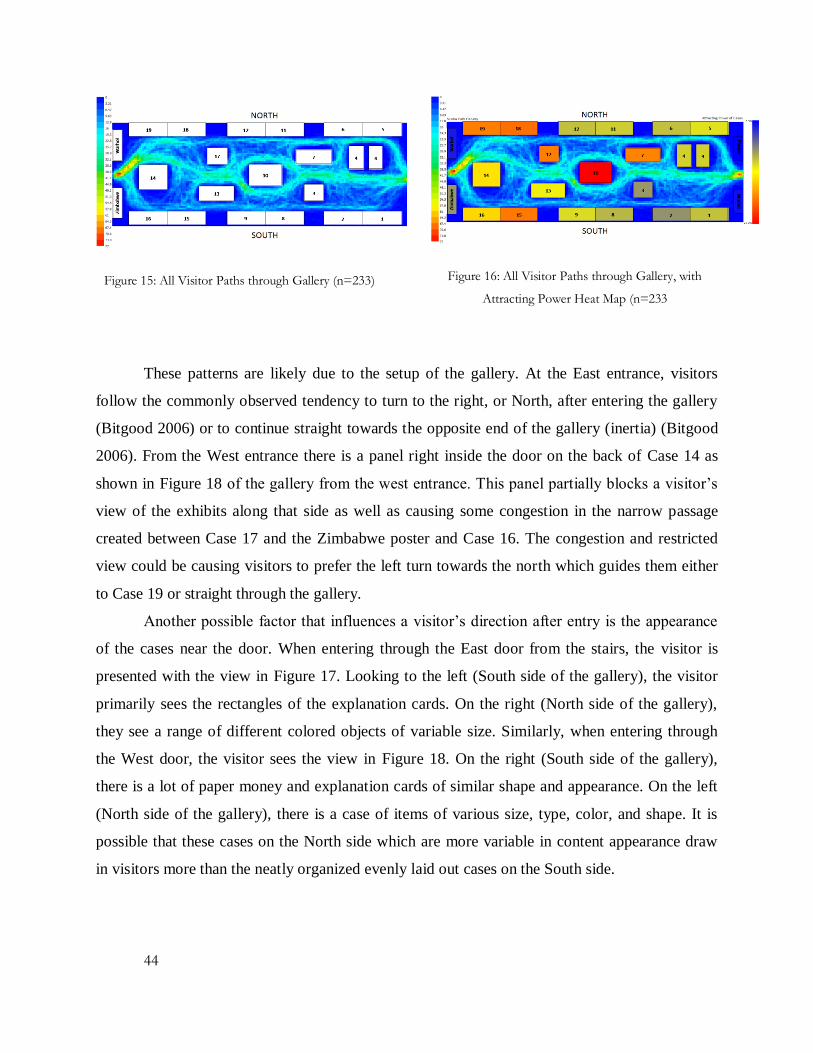
44
Figure 15: All Visitor Paths through Gallery (n=233)
Figure 16: All Visitor Paths through Gallery, with
Attracting Power Heat Map (n=233
These patterns are likely due to the setup of the gallery. At the East entrance, visitors
follow the commonly observed tendency to turn to the right, or North, after entering the gallery
(Bitgood 2006) or to continue straight towards the opposite end of the gallery (inertia) (Bitgood
2006). From the West entrance there is a panel right inside the door on the back of Case 14 as
shown in Figure 18 of the gallery from the west entrance. This panel partially blocks a visitor’s
view of the exhibits along that side as well as causing some congestion in the narrow passage
created between Case 17 and the Zimbabwe poster and Case 16. The congestion and restricted
view could be causing visitors to prefer the left turn towards the north which guides them either
to Case 19 or straight through the gallery.
Another possible factor that influences a visitor’s direction after entry is the appearance
of the cases near the door. When entering through the East door from the stairs, the visitor is
presented with the view in Figure 17. Looking to the left (South side of the gallery), the visitor
primarily sees the rectangles of the explanation cards. On the right (North side of the gallery),
they see a range of different colored objects of variable size. Similarly, when entering through
the West door, the visitor sees the view in Figure 18. On the right (South side of the gallery),
there is a lot of paper money and explanation cards of similar shape and appearance. On the left
(North side of the gallery), there is a case of items of various size, type, color, and shape. It is
possible that these cases on the North side which are more variable in content appearance draw
in visitors more than the neatly organized evenly laid out cases on the South side.

40
Figure 17: View of Gallery from East Entrance
Figure 18: View of Gallery from West Entrance
Visitors are most likely to be drawn in during the first third of the gallery
Figure 19 and Figure 20 show the first case stopped at by visitors coming through the east
and west doors respectively. The visitors entering through the west door are most likely to stop
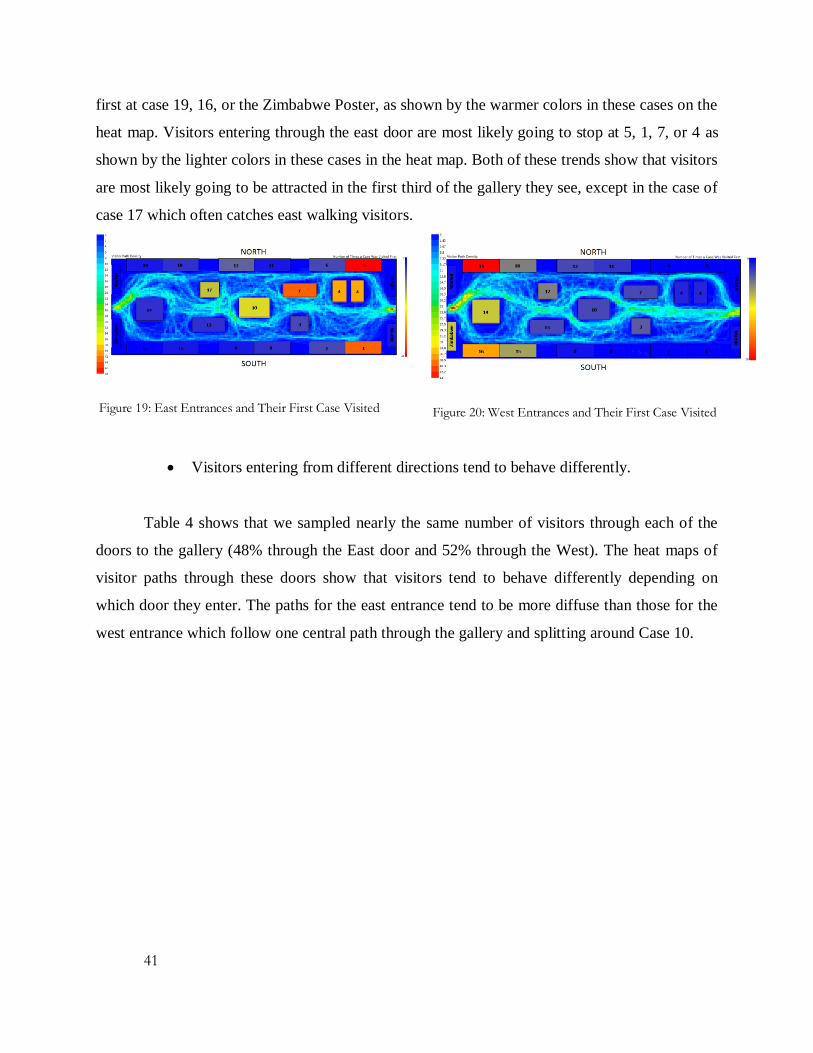
41
first at case 19, 16, or the Zimbabwe Poster, as shown by the warmer colors in these cases on the
heat map. Visitors entering through the east door are most likely going to stop at 5, 1, 7, or 4 as
shown by the lighter colors in these cases in the heat map. Both of these trends show that visitors
are most likely going to be attracted in the first third of the gallery they see, except in the case of
case 17 which often catches east walking visitors.
Figure 19: East Entrances and Their First Case Visited
Figure 20: West Entrances and Their First Case Visited
Visitors entering from different directions tend to behave differently.
Table 4 shows that we sampled nearly the same number of visitors through each of the
doors to the gallery (48% through the East door and 52% through the West). The heat maps of
visitor paths through these doors show that visitors tend to behave differently depending on
which door they enter. The paths for the east entrance tend to be more diffuse than those for the
west entrance which follow one central path through the gallery and splitting around Case 10.
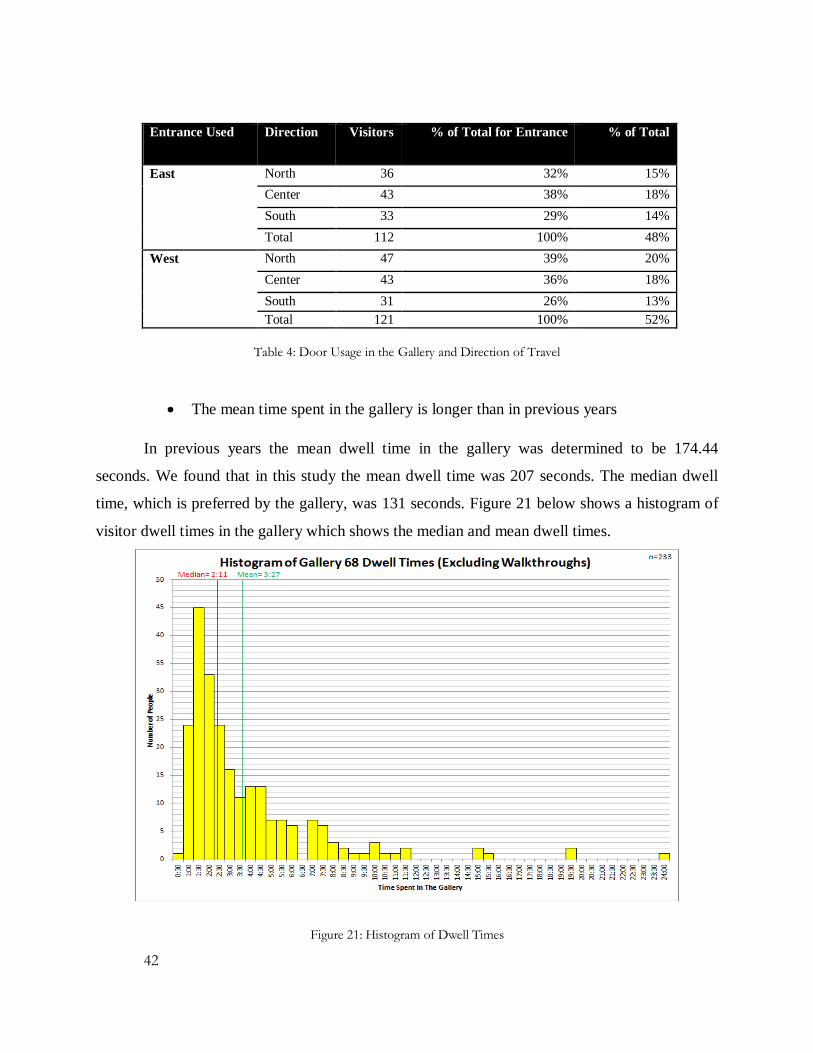
42
Entrance Used Direction Visitors % of Total for Entrance % of Total
East North 36 32% 15%
Center 43 38% 18%
South 33 29% 14%
Total 112 100% 48%
West North 47 39% 20%
Center 43 36% 18%
South 31 26% 13%
Total 121 100% 52%
Table 4: Door Usage in the Gallery and Direction of Travel
The mean time spent in the gallery is longer than in previous years
In previous years the mean dwell time in the gallery was determined to be 174.44
seconds. We found that in this study the mean dwell time was 207 seconds. The median dwell
time, which is preferred by the gallery, was 131 seconds. Figure 21 below shows a histogram of
visitor dwell times in the gallery which shows the median and mean dwell times.
Figure 21: Histogram of Dwell Times

43
This graph excludes walkthroughs and turnarounds and as such only considers visitors
who engage with the gallery. The most common visitor time is between 60 and 90 seconds in the
gallery.
4.1.3. Case Analysis
Reworking of Case 19 changed the behavior of viewers.
During our tracking and questionnaire study the display in Case 19 changed from a
display about mobile money to a display about Bitcoin. This new display contains much more
text than the previous display. This leads to visitors staying at Case 19 for longer than in the past.
This is shown in the increased holding power. Unfortunately the increased reading material
comes at the expense of visually interesting items which can capture visitor’s attention from a
distance. This lowers the attracting power of the case compared to the previous display. These
changes are shown in the below graph.
Figure 22: Holding and Attracting Power Before and After the Case 19 Changes
We can corroborate the assumption that the text-heavy nature of the display is having this
effect by looking at the holding power of non-English speaking visitors before and after the
change. As you can see from the graph below there is a marked decrease in holding power from
these visitors, as these visitors cannot read the English text in the display.
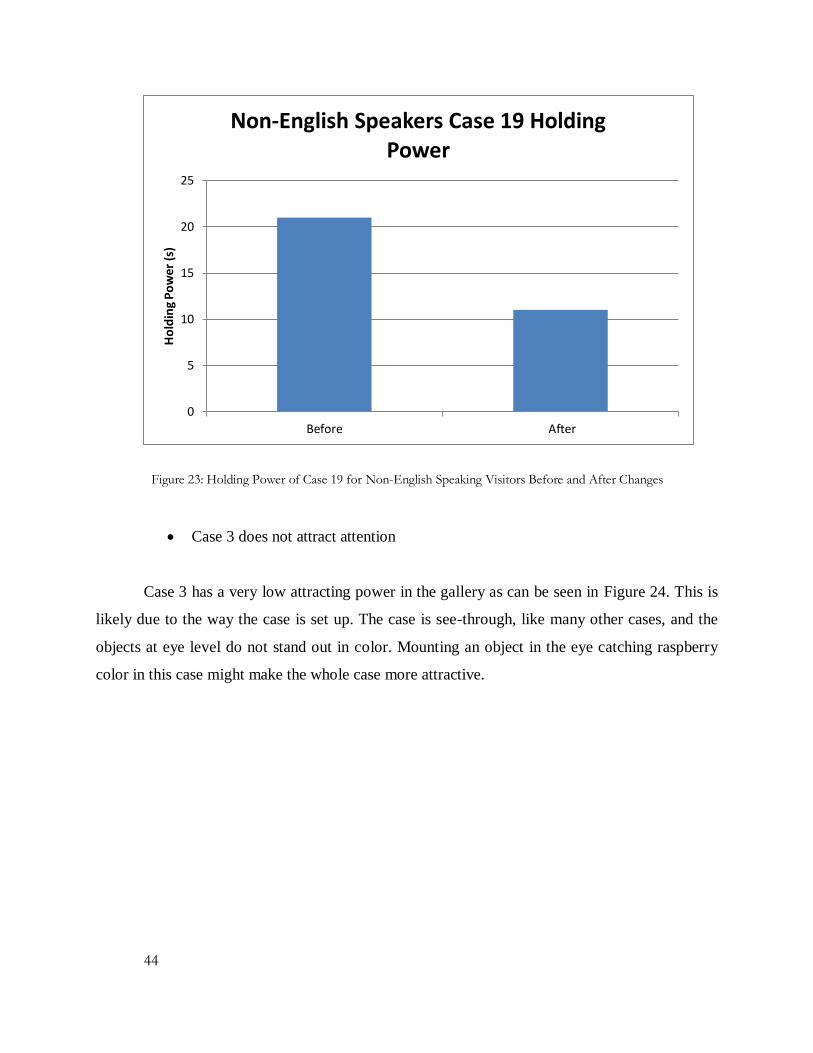
44
Figure 23: Holding Power of Case 19 for Non-English Speaking Visitors Before and After Changes
Case 3 does not attract attention
Case 3 has a very low attracting power in the gallery as can be seen in Figure 24. This is
likely due to the way the case is set up. The case is see-through, like many other cases, and the
objects at eye level do not stand out in color. Mounting an object in the eye catching raspberry
color in this case might make the whole case more attractive.
0
5
10
15
20
25
Before After
Ho
ldin
g P
ow
er
(s)
Non-English Speakers Case 19 Holding Power
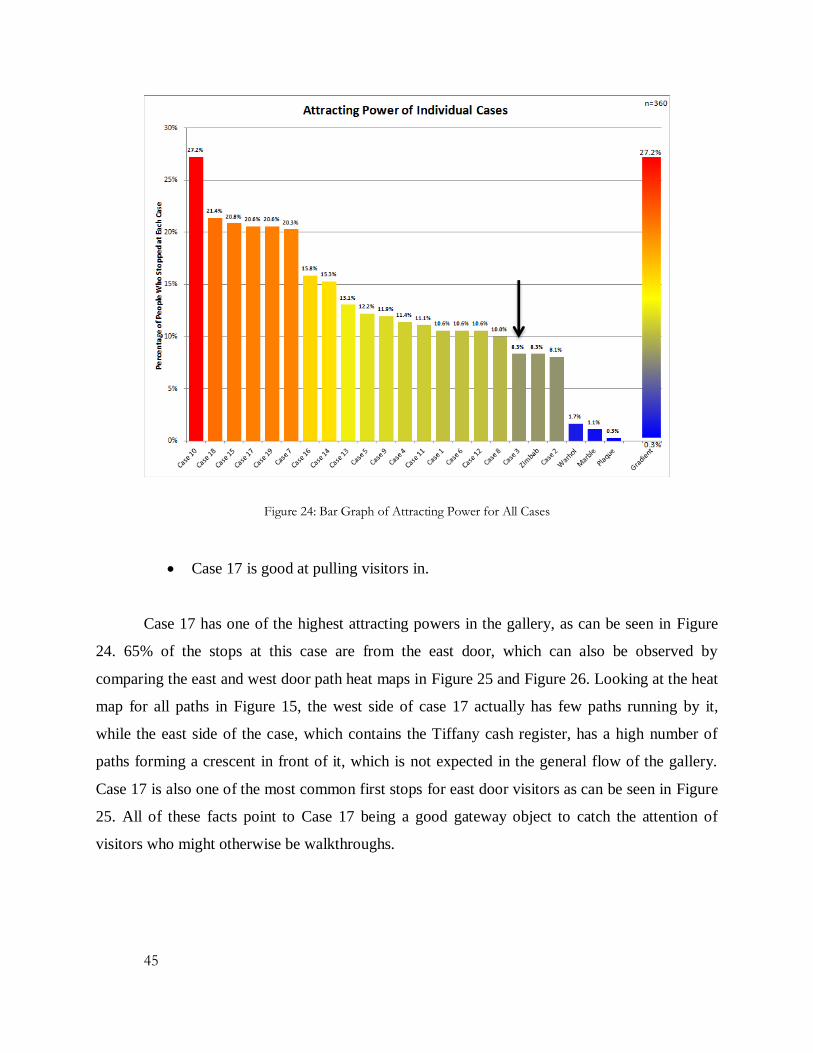
45
Figure 24: Bar Graph of Attracting Power for All Cases
Case 17 is good at pulling visitors in.
Case 17 has one of the highest attracting powers in the gallery, as can be seen in Figure
24. 65% of the stops at this case are from the east door, which can also be observed by
comparing the east and west door path heat maps in Figure 25 and Figure 26. Looking at the heat
map for all paths in Figure 15, the west side of case 17 actually has few paths running by it,
while the east side of the case, which contains the Tiffany cash register, has a high number of
paths forming a crescent in front of it, which is not expected in the general flow of the gallery.
Case 17 is also one of the most common first stops for east door visitors as can be seen in Figure
25. All of these facts point to Case 17 being a good gateway object to catch the attention of
visitors who might otherwise be walkthroughs.

46
Figure 25: Visitor Paths through East Entrance
(n=112)
Figure 26: Visitor Paths through West Entrance
(n=121)
Figure 27: First Case Visited by Visitors from the East Door
Wall Displays receive less attention than other cases
The four wall display cases near the entrances to the gallery attract less attention than
other cases. The wall cases have very low attracting power as indicated by the blue color of the
wall cases in Figure 28: Heat Map and Bar Graph of Attracting Power, and receive the least
number of glances from visitors as well (Figure 30: Heat map and Bar Graph of Glances). As
seen in Figure 29: Heat Map and Bar Graph for Holding Power three of the four wall cases have
a holding power more in line with the rest of the gallery as seen by the warmer colors of the
cases.
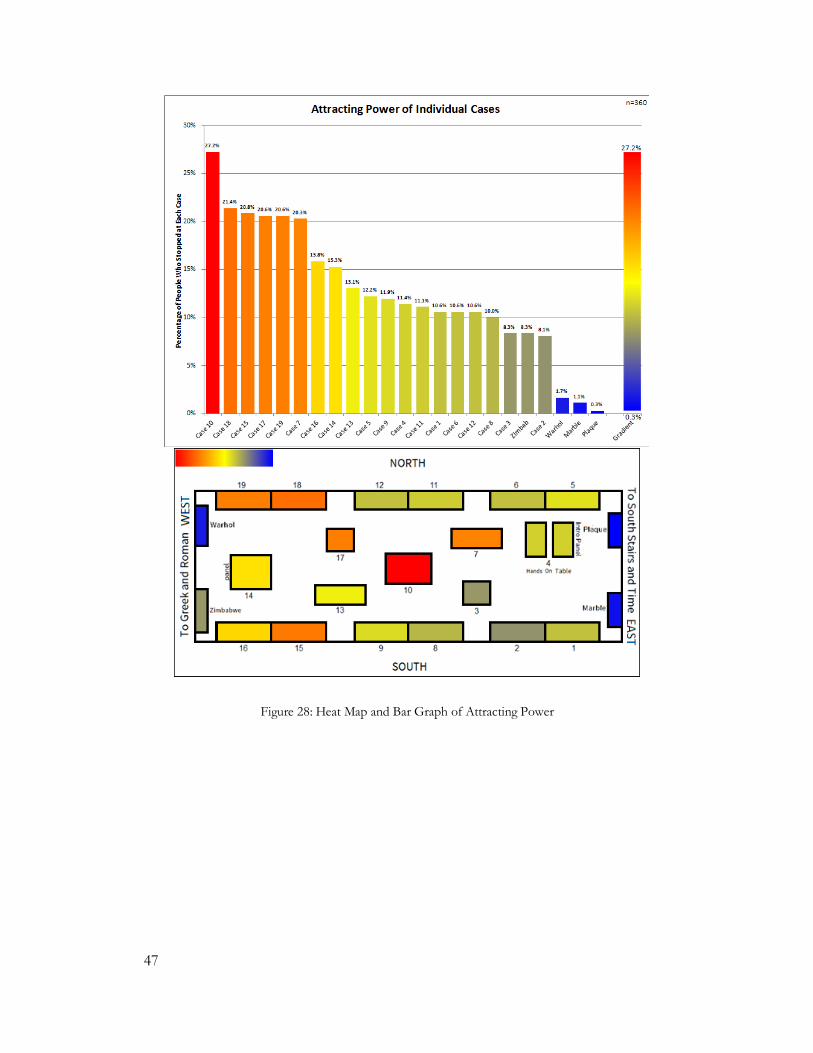
47
Figure 28: Heat Map and Bar Graph of Attracting Power
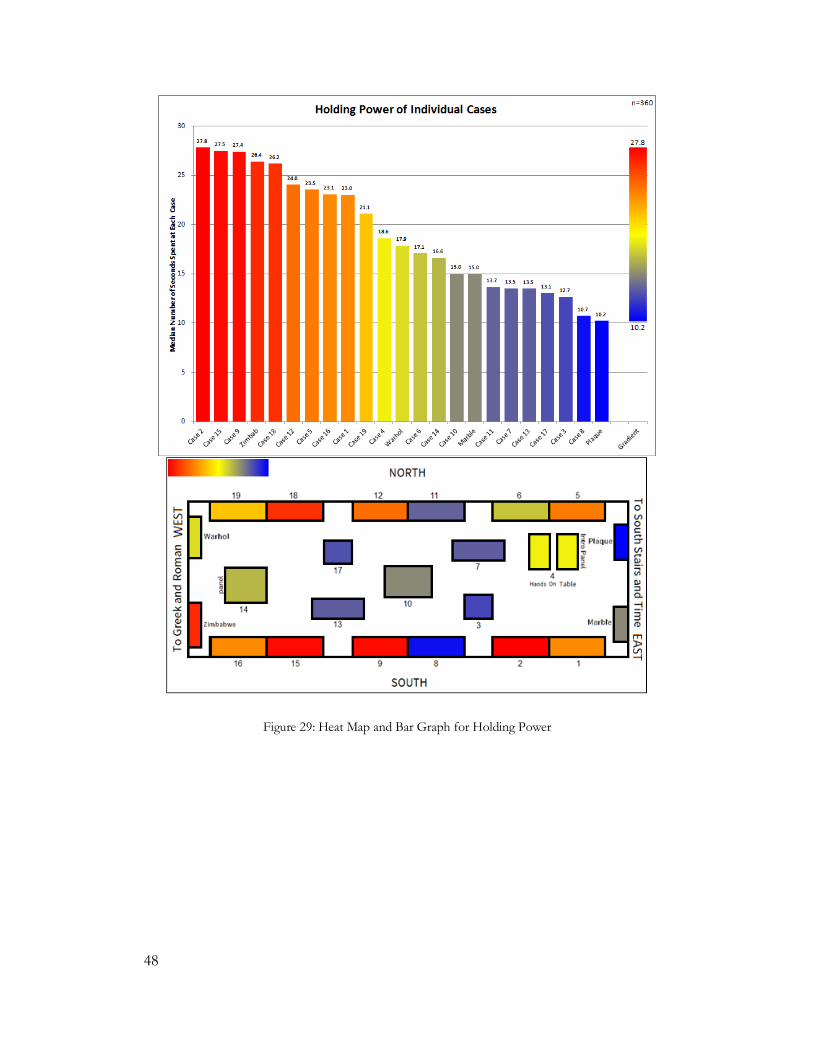
48
Figure 29: Heat Map and Bar Graph for Holding Power
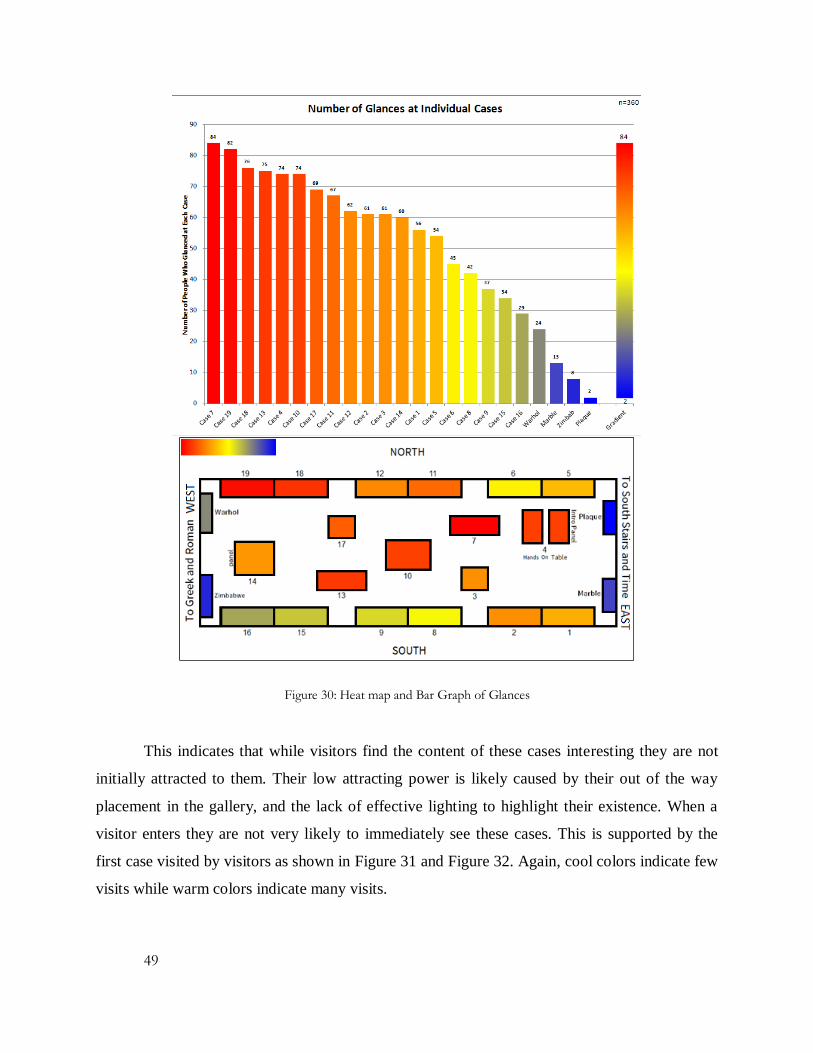
49
Figure 30: Heat map and Bar Graph of Glances
This indicates that while visitors find the content of these cases interesting they are not
initially attracted to them. Their low attracting power is likely caused by their out of the way
placement in the gallery, and the lack of effective lighting to highlight their existence. When a
visitor enters they are not very likely to immediately see these cases. This is supported by the
first case visited by visitors as shown in Figure 31 and Figure 32. Again, cool colors indicate few
visits while warm colors indicate many visits.

50
Figure 31: First Case visited through the East Door
Figure 32: First Case visited through the West Door
More attractive lighting is the primary method that we recommend to increases these
cases’ attracting power. This lighting would highlight these cases to visitors who are about to
exit the gallery. In addition more eye catching description plaques may increase these cases
attracting power.
Free standing cases have higher attracting power than other cases.
Figure 15 shows the visitor path map for all non-walkthrough visitors tracked. When
overlaid with the attracting power heat map (Figure 16), the free standing cases are shown to
have higher attracting power in general than wall cases or regular cases. In fact, all of the free
standing cases are in the top 50% of cases for attracting power.
Case Content Analysis
When we look at the attracting and holding power of certain cases (Figure 28 and Figure
29) and compare them to the content of the cases, some interesting observations can be made. Of
all cases, Case 10 (Faking and Counterfeiting) has the highest attracting power. It stands in the
center of the gallery, and contains two swirls consisting respectively of counterfeit pound coins
and counterfeit ancient Roman coins. The swirls are very eye-catching, however, due to the
sparse text and small variety of items in the case, the case has a low attracting power. On the
other hand, Case 18 (Money and society), attracts a lot of people due to its proximity to the West
door and an array of familiar items such as coins from Harry Potter, a Nirvana record and a
Doctor Who pound note, but also has a high holding power. There are many other familiar and
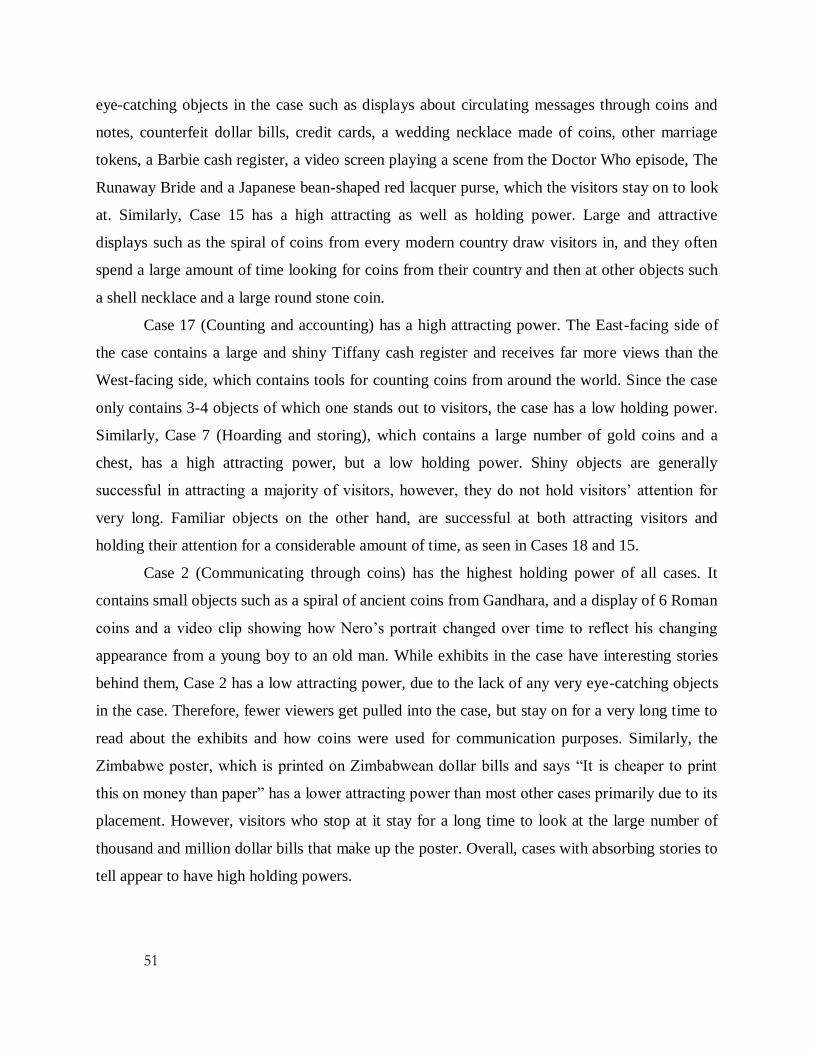
51
eye-catching objects in the case such as displays about circulating messages through coins and
notes, counterfeit dollar bills, credit cards, a wedding necklace made of coins, other marriage
tokens, a Barbie cash register, a video screen playing a scene from the Doctor Who episode, The
Runaway Bride and a Japanese bean-shaped red lacquer purse, which the visitors stay on to look
at. Similarly, Case 15 has a high attracting as well as holding power. Large and attractive
displays such as the spiral of coins from every modern country draw visitors in, and they often
spend a large amount of time looking for coins from their country and then at other objects such
a shell necklace and a large round stone coin.
Case 17 (Counting and accounting) has a high attracting power. The East-facing side of
the case contains a large and shiny Tiffany cash register and receives far more views than the
West-facing side, which contains tools for counting coins from around the world. Since the case
only contains 3-4 objects of which one stands out to visitors, the case has a low holding power.
Similarly, Case 7 (Hoarding and storing), which contains a large number of gold coins and a
chest, has a high attracting power, but a low holding power. Shiny objects are generally
successful in attracting a majority of visitors, however, they do not hold visitors’ attention for
very long. Familiar objects on the other hand, are successful at both attracting visitors and
holding their attention for a considerable amount of time, as seen in Cases 18 and 15.
Case 2 (Communicating through coins) has the highest holding power of all cases. It
contains small objects such as a spiral of ancient coins from Gandhara, and a display of 6 Roman
coins and a video clip showing how Nero’s portrait changed over time to reflect his changing
appearance from a young boy to an old man. While exhibits in the case have interesting stories
behind them, Case 2 has a low attracting power, due to the lack of any very eye-catching objects
in the case. Therefore, fewer viewers get pulled into the case, but stay on for a very long time to
read about the exhibits and how coins were used for communication purposes. Similarly, the
Zimbabwe poster, which is printed on Zimbabwean dollar bills and says “It is cheaper to print
this on money than paper” has a lower attracting power than most other cases primarily due to its
placement. However, visitors who stop at it stay for a long time to look at the large number of
thousand and million dollar bills that make up the poster. Overall, cases with absorbing stories to
tell appear to have high holding powers.
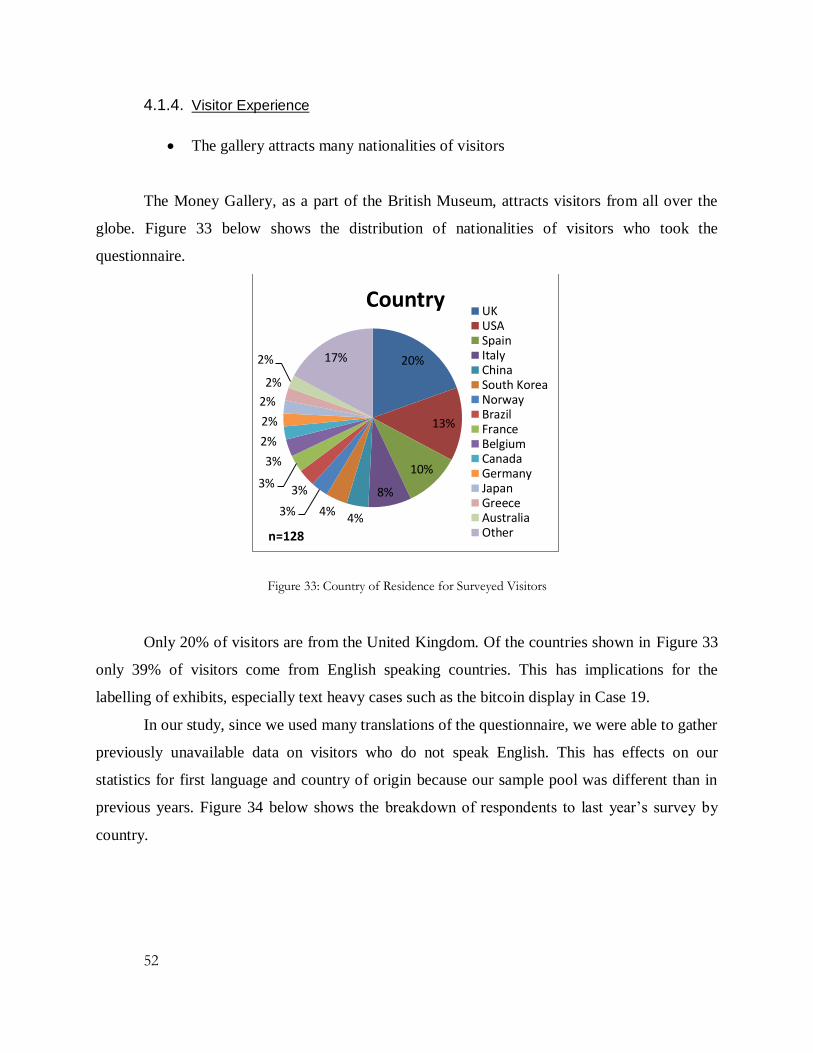
52
4.1.4. Visitor Experience
The gallery attracts many nationalities of visitors
The Money Gallery, as a part of the British Museum, attracts visitors from all over the
globe. Figure 33 below shows the distribution of nationalities of visitors who took the
questionnaire.
Figure 33: Country of Residence for Surveyed Visitors
Only 20% of visitors are from the United Kingdom. Of the countries shown in Figure 33
only 39% of visitors come from English speaking countries. This has implications for the
labelling of exhibits, especially text heavy cases such as the bitcoin display in Case 19.
In our study, since we used many translations of the questionnaire, we were able to gather
previously unavailable data on visitors who do not speak English. This has effects on our
statistics for first language and country of origin because our sample pool was different than in
previous years. Figure 34 below shows the breakdown of respondents to last year’s survey by
country.
20%
13%
10%
8%
4% 4% 3%
3% 3%
3%
2%
2%
2%
2%
2% 17%
Country UKUSASpainItalyChinaSouth KoreaNorwayBrazilFranceBelgiumCanadaGermanyJapanGreeceAustraliaOthern=128
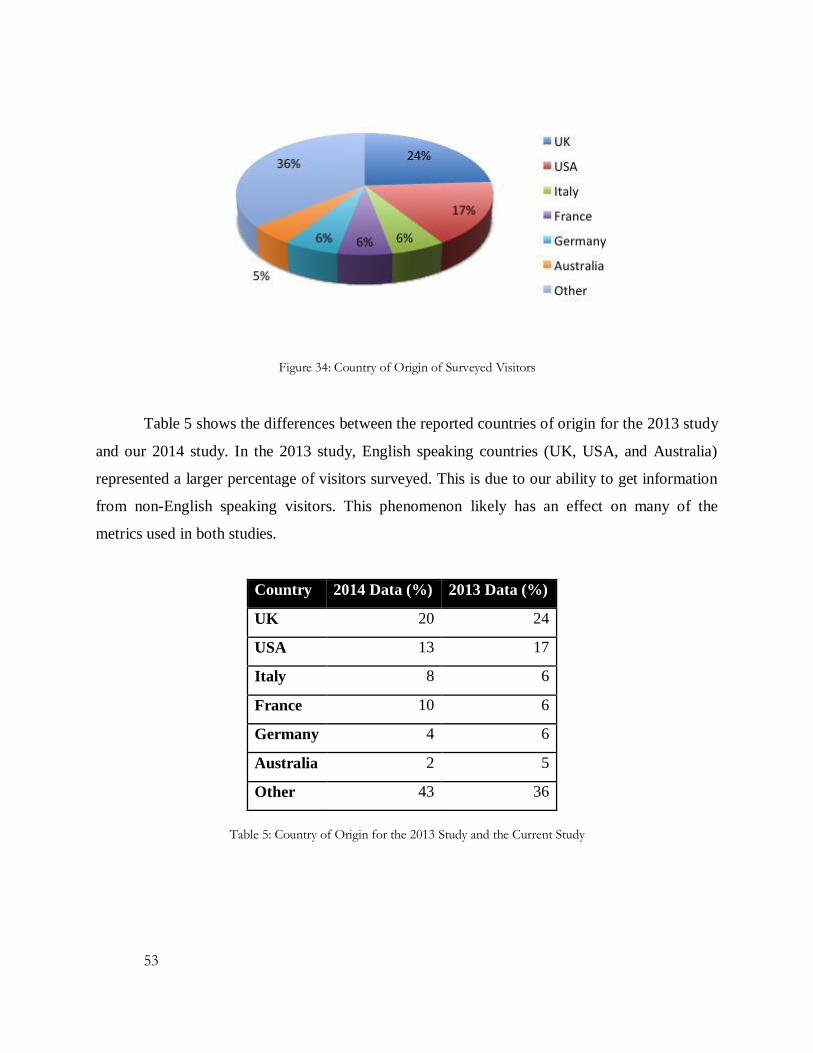
53
Figure 34: Country of Origin of Surveyed Visitors
Table 5 shows the differences between the reported countries of origin for the 2013 study
and our 2014 study. In the 2013 study, English speaking countries (UK, USA, and Australia)
represented a larger percentage of visitors surveyed. This is due to our ability to get information
from non-English speaking visitors. This phenomenon likely has an effect on many of the
metrics used in both studies.
Country 2014 Data (%) 2013 Data (%)
UK 20 24
USA 13 17
Italy 8 6
France 10 6
Germany 4 6
Australia 2 5
Other 43 36
Table 5: Country of Origin for the 2013 Study and the Current Study

54
Visitors do not usually intend to visit the Money Gallery
Of the visitors surveyed, 40% reported that they had intended to visit the Money Gallery,
and of those, 27% had heard of the gallery through leaflets, 24% had heard of the gallery through
word-of-mouth and another 24% through the museum website. Others had heard of the gallery
through their professors or from traveller books.
Figure 35: Intent to Visit the Money Gallery
Figure 36: How Visitors heard about the gallery
Yes 51
40%
No 77
60%
Did You Intend to Visit the Gallery?
27%
25% 24%
24%
How Did Visitors Hear About the Gallery?
Leaflets
Other
Word-of-mouth
British MuseumWebsite
n=51
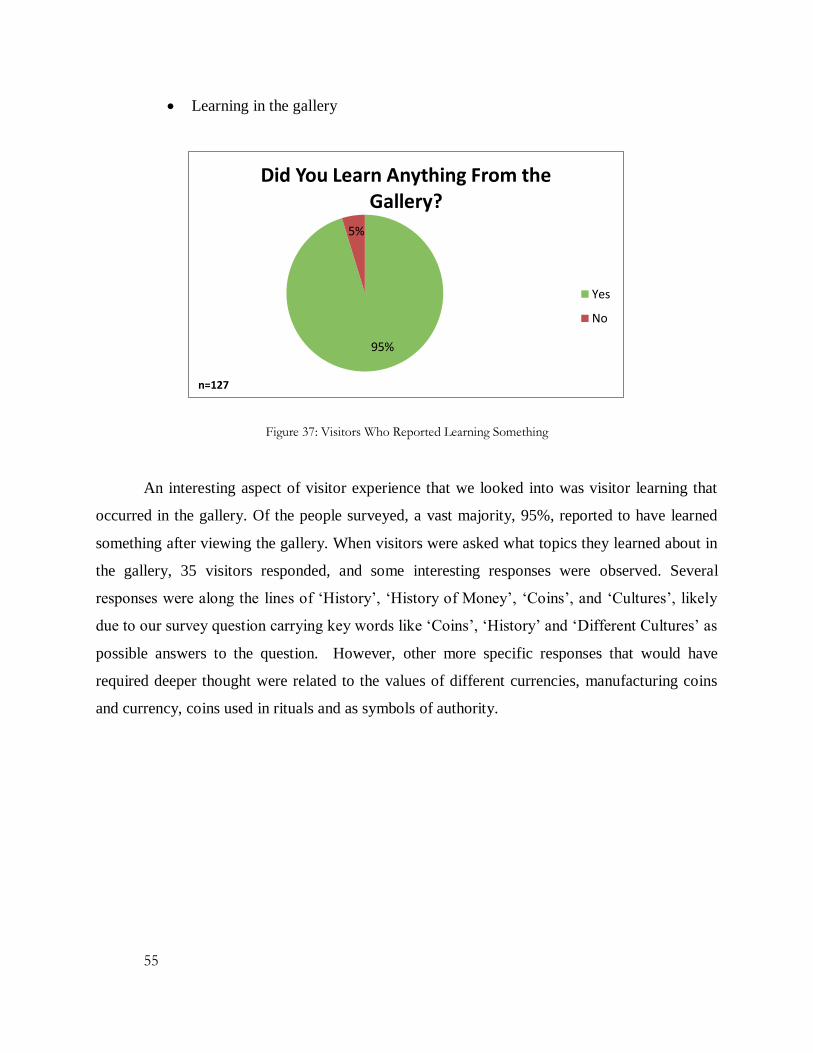
55
Learning in the gallery
Figure 37: Visitors Who Reported Learning Something
An interesting aspect of visitor experience that we looked into was visitor learning that
occurred in the gallery. Of the people surveyed, a vast majority, 95%, reported to have learned
something after viewing the gallery. When visitors were asked what topics they learned about in
the gallery, 35 visitors responded, and some interesting responses were observed. Several
responses were along the lines of ‘History’, ‘History of Money’, ‘Coins’, and ‘Cultures’, likely
due to our survey question carrying key words like ‘Coins’, ‘History’ and ‘Different Cultures’ as
possible answers to the question. However, other more specific responses that would have
required deeper thought were related to the values of different currencies, manufacturing coins
and currency, coins used in rituals and as symbols of authority.
95%
5%
Did You Learn Anything From the Gallery?
Yes
No
n=127

56
Figure 38: “What are some topics you learned about (e.g., coins, history, different cultures)?”
When visitors were asked about what themes they observed in the gallery, a greater
number and variety of responses was observed. 56 visitors responded, and some interesting
responses pertained to mechanization, power and politics, manufacturing of money, religion,
power and money, the unreliable value of currency, economic status in society, and the
continuity of currency. Overall, this question received a greater number of thoughtful responses
than the previous one, indicating that, of the visitors who chose to respond to this question, at
least 18 visitors, or 32%, were able to pick up on the deeper themes in the gallery.
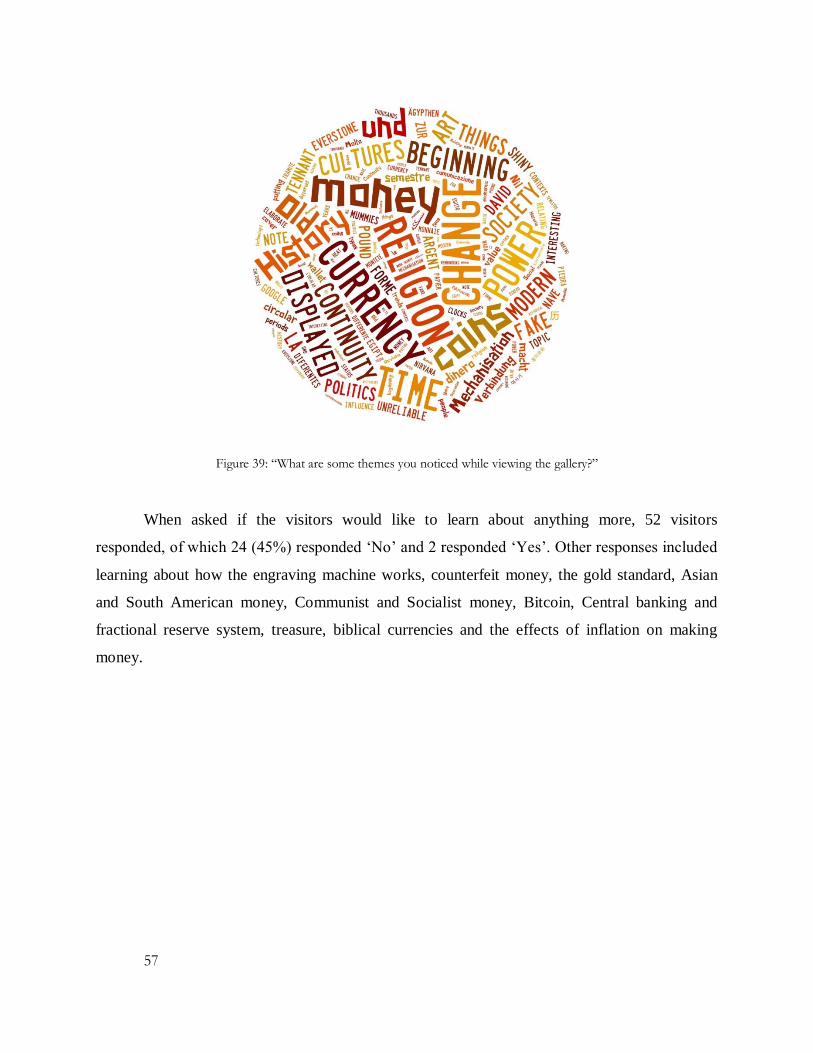
57
Figure 39: “What are some themes you noticed while viewing the gallery?”
When asked if the visitors would like to learn about anything more, 52 visitors
responded, of which 24 (45%) responded ‘No’ and 2 responded ‘Yes’. Other responses included
learning about how the engraving machine works, counterfeit money, the gold standard, Asian
and South American money, Communist and Socialist money, Bitcoin, Central banking and
fractional reserve system, treasure, biblical currencies and the effects of inflation on making
money.
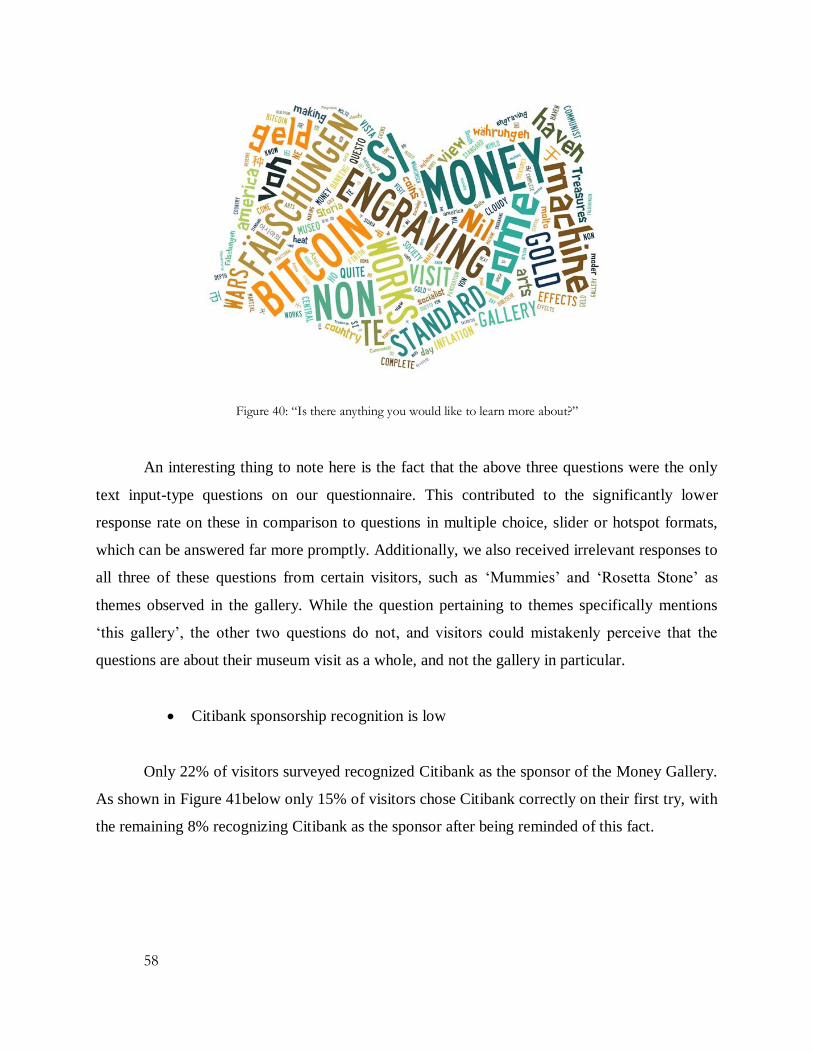
58
Figure 40: “Is there anything you would like to learn more about?”
An interesting thing to note here is the fact that the above three questions were the only
text input-type questions on our questionnaire. This contributed to the significantly lower
response rate on these in comparison to questions in multiple choice, slider or hotspot formats,
which can be answered far more promptly. Additionally, we also received irrelevant responses to
all three of these questions from certain visitors, such as ‘Mummies’ and ‘Rosetta Stone’ as
themes observed in the gallery. While the question pertaining to themes specifically mentions
‘this gallery’, the other two questions do not, and visitors could mistakenly perceive that the
questions are about their museum visit as a whole, and not the gallery in particular.
Citibank sponsorship recognition is low
Only 22% of visitors surveyed recognized Citibank as the sponsor of the Money Gallery.
As shown in Figure 41below only 15% of visitors chose Citibank correctly on their first try, with
the remaining 8% recognizing Citibank as the sponsor after being reminded of this fact.
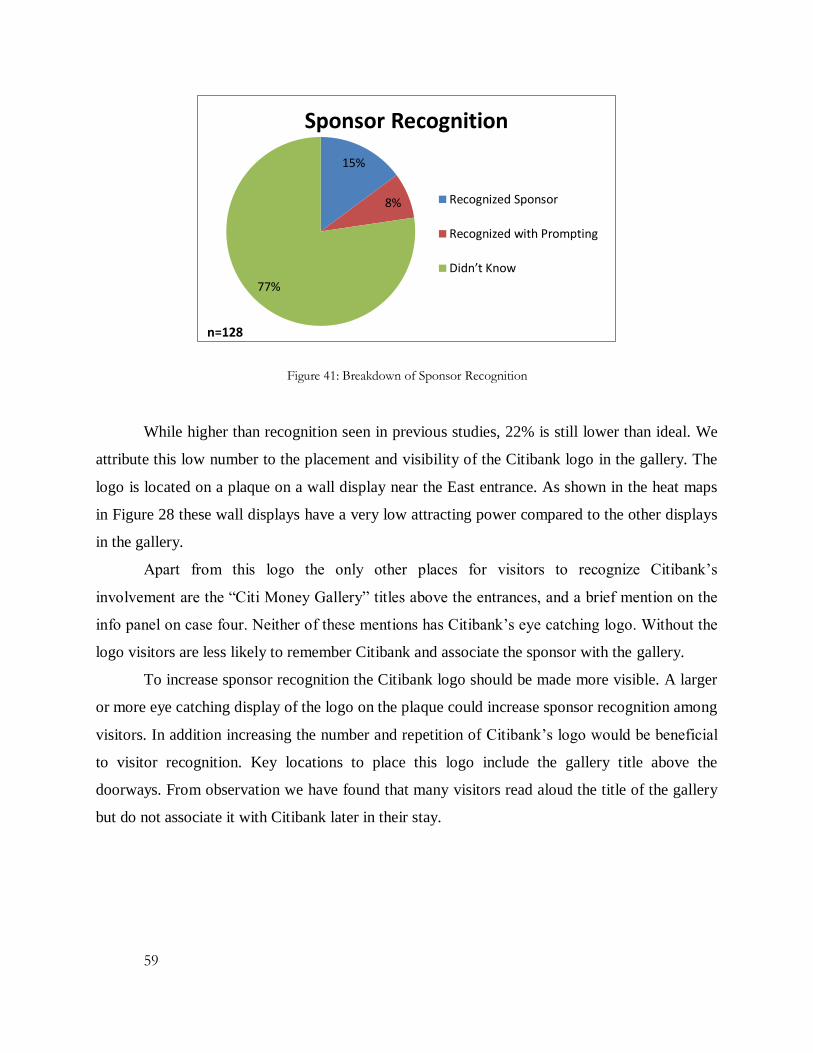
59
Figure 41: Breakdown of Sponsor Recognition
While higher than recognition seen in previous studies, 22% is still lower than ideal. We
attribute this low number to the placement and visibility of the Citibank logo in the gallery. The
logo is located on a plaque on a wall display near the East entrance. As shown in the heat maps
in Figure 28 these wall displays have a very low attracting power compared to the other displays
in the gallery.
Apart from this logo the only other places for visitors to recognize Citibank’s
involvement are the “Citi Money Gallery” titles above the entrances, and a brief mention on the
info panel on case four. Neither of these mentions has Citibank’s eye catching logo. Without the
logo visitors are less likely to remember Citibank and associate the sponsor with the gallery.
To increase sponsor recognition the Citibank logo should be made more visible. A larger
or more eye catching display of the logo on the plaque could increase sponsor recognition among
visitors. In addition increasing the number and repetition of Citibank’s logo would be beneficial
to visitor recognition. Key locations to place this logo include the gallery title above the
doorways. From observation we have found that many visitors read aloud the title of the gallery
but do not associate it with Citibank later in their stay.
15%
8%
77%
Sponsor Recognition
Recognized Sponsor
Recognized with Prompting
Didn’t Know
n=128
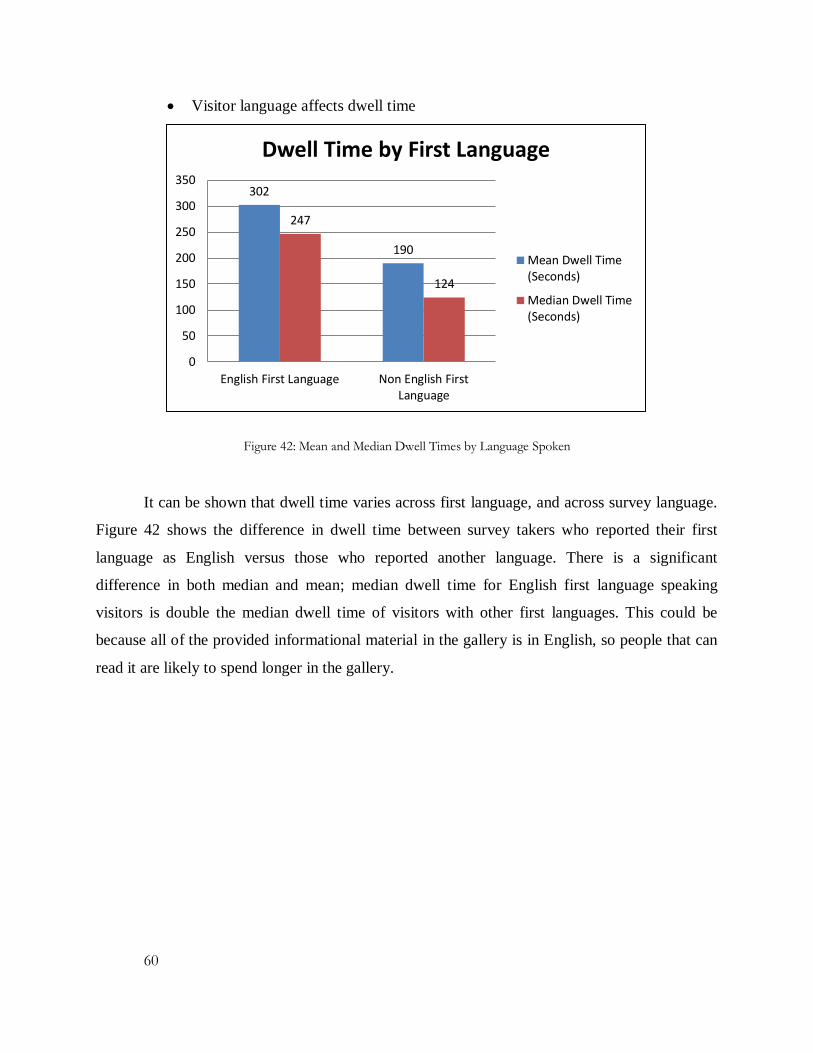
60
Visitor language affects dwell time
Figure 42: Mean and Median Dwell Times by Language Spoken
It can be shown that dwell time varies across first language, and across survey language.
Figure 42 shows the difference in dwell time between survey takers who reported their first
language as English versus those who reported another language. There is a significant
difference in both median and mean; median dwell time for English first language speaking
visitors is double the median dwell time of visitors with other first languages. This could be
because all of the provided informational material in the gallery is in English, so people that can
read it are likely to spend longer in the gallery.
302
190
247
124
0
50
100
150
200
250
300
350
English First Language Non English FirstLanguage
Dwell Time by First Language
Mean Dwell Time(Seconds)
Median Dwell Time(Seconds)
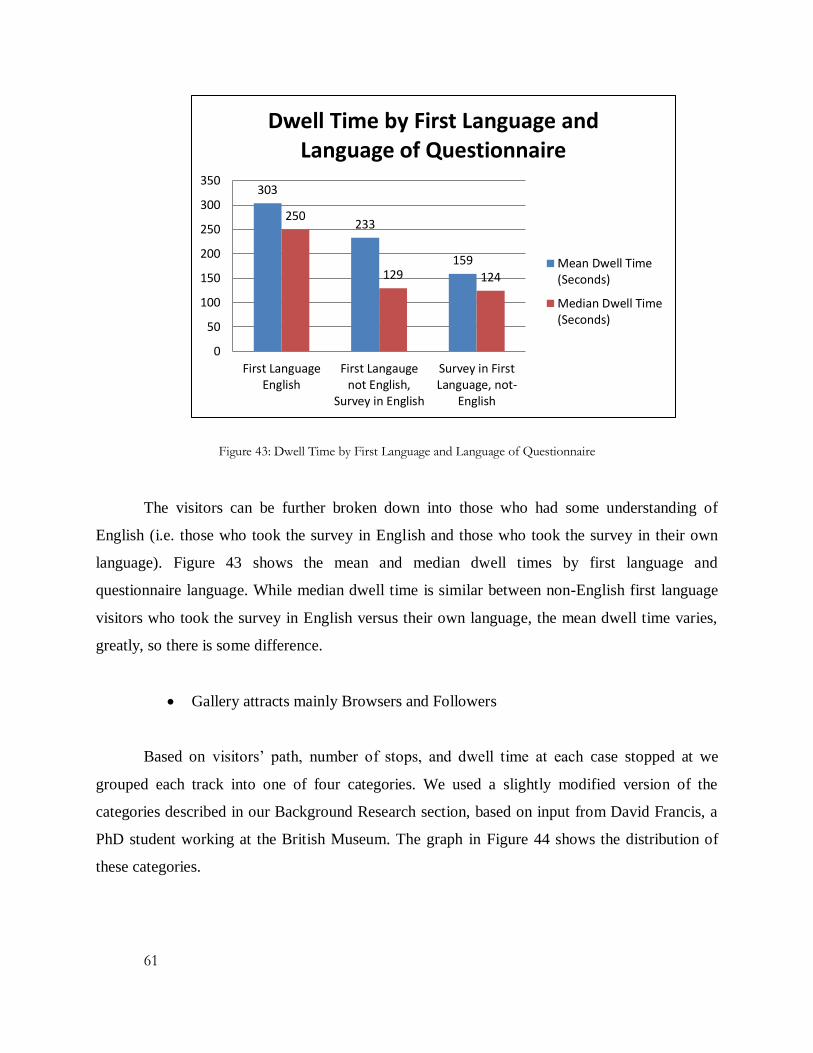
61
Figure 43: Dwell Time by First Language and Language of Questionnaire
The visitors can be further broken down into those who had some understanding of
English (i.e. those who took the survey in English and those who took the survey in their own
language). Figure 43 shows the mean and median dwell times by first language and
questionnaire language. While median dwell time is similar between non-English first language
visitors who took the survey in English versus their own language, the mean dwell time varies,
greatly, so there is some difference.
Gallery attracts mainly Browsers and Followers
Based on visitors’ path, number of stops, and dwell time at each case stopped at we
grouped each track into one of four categories. We used a slightly modified version of the
categories described in our Background Research section, based on input from David Francis, a
PhD student working at the British Museum. The graph in Figure 44 shows the distribution of
these categories.
303
233
159
250
129 124
0
50
100
150
200
250
300
350
First LanguageEnglish
First Langaugenot English,
Survey in English
Survey in FirstLanguage, not-
English
Dwell Time by First Language and Language of Questionnaire
Mean Dwell Time(Seconds)
Median Dwell Time(Seconds)

62
Figure 44: Viewing Strategies in Gallery 68
These results show an overwhelming amount of “browsers” at 58%, succeeded by
“followers” at 18%, with “single item” and “completest” visitors coming after. This is
unsurprising as most other studies which use a similar system of categories find the distribution
of visitors to heavily favor “browsers”, with “followers” coming in second. This shows that the
majority of visitors will not be using the “narrative” set by the museum in their construction of
the gallery, as they simply browse through the gallery ignoring the path set out for them.
Gallery Attracts mainly Social visitors
A majority of the visitors surveyed, 70%, were first-time visitors to the museum. A
majority of visitors said they visited the museum, among other reasons, because it is a major
London attraction. Other major reasons given by visitors were ‘To see amazing artifacts’, ‘To
understand other cultures’ and ‘To learn/further my own knowledge’. Fewer visitors responded
with ‘To stimulate my own creativity’, ‘It’s a good way to pass the time’, ‘For peaceful, quiet
contemplation’ and ‘I have a professional interest in the museum/a particular exhibit’. A
breakdown of answers to this question is shown in Figure 45.
58% 18%
15%
9%
Visitors' Viewing Strategy
Browser
Follower
Single Item
Completist
n=233
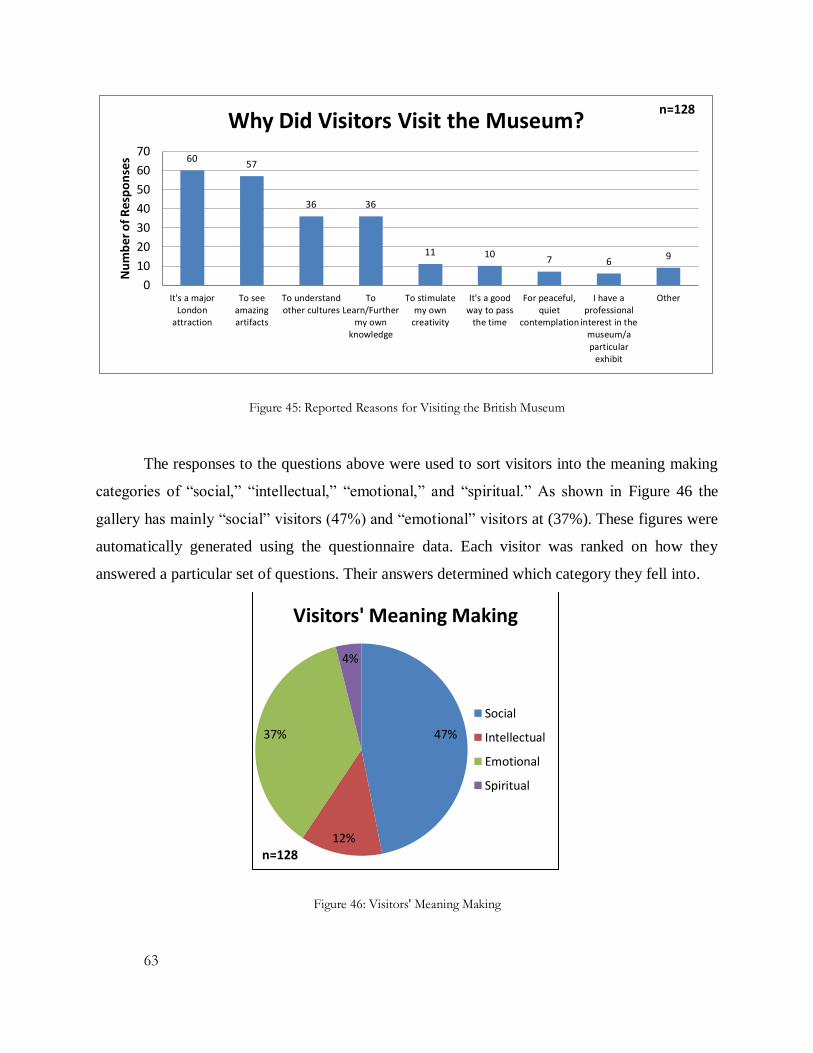
63
Figure 45: Reported Reasons for Visiting the British Museum
The responses to the questions above were used to sort visitors into the meaning making
categories of “social,” “intellectual,” “emotional,” and “spiritual.” As shown in Figure 46 the
gallery has mainly “social” visitors (47%) and “emotional” visitors at (37%). These figures were
automatically generated using the questionnaire data. Each visitor was ranked on how they
answered a particular set of questions. Their answers determined which category they fell into.
Figure 46: Visitors' Meaning Making
60 57
36 36
11 10 7 6
9
0
10
20
30
40
50
60
70
It's a majorLondon
attraction
To seeamazingartifacts
To understandother cultures
ToLearn/Further
my ownknowledge
To stimulatemy own
creativity
It's a goodway to pass
the time
For peaceful,quiet
contemplation
I have aprofessional
interest in themuseum/a
particularexhibit
Other
Nu
mb
er
of
Re
spo
nse
s Why Did Visitors Visit the Museum?
n=128
47%
12%
37%
4%
Visitors' Meaning Making
Social
Intellectual
Emotional
Spiritual
n=128

64
No visitors tracked used the large print or tactile guides
0% of the visitors we tracked used the large print or tactile guides provided at the
entrances of Gallery 68. In addition, only three people were recorded looking at or interacting
with the guides in any way. We suspect that this can be attributed to their size and location. They
are hardly noticed by visitors, and when they are they find them to be quite large and difficult to
carry.
4.1.5. Visitor Counter
The electronic visitor counter has a linear relationship with the number of visitors
to the gallery
The electronic visitor counter in the Money Gallery can be a very useful tool for
determining a rough estimate of the number of visitors to the gallery. This counter must be
calibrated however, as it is a simple device mounted on only one entrance. The device counts up
when a visitor breaks the laser beam it projects across the east doorway. This is not the most
accurate way of counting as visitors might stand in the doorway blocking or repeatedly breaking
the beam for prolonged periods. This, along with large groups passing through the doorway,
results in an inaccurate count.
Figure 47: Electronic Visitor Counter Accuracy
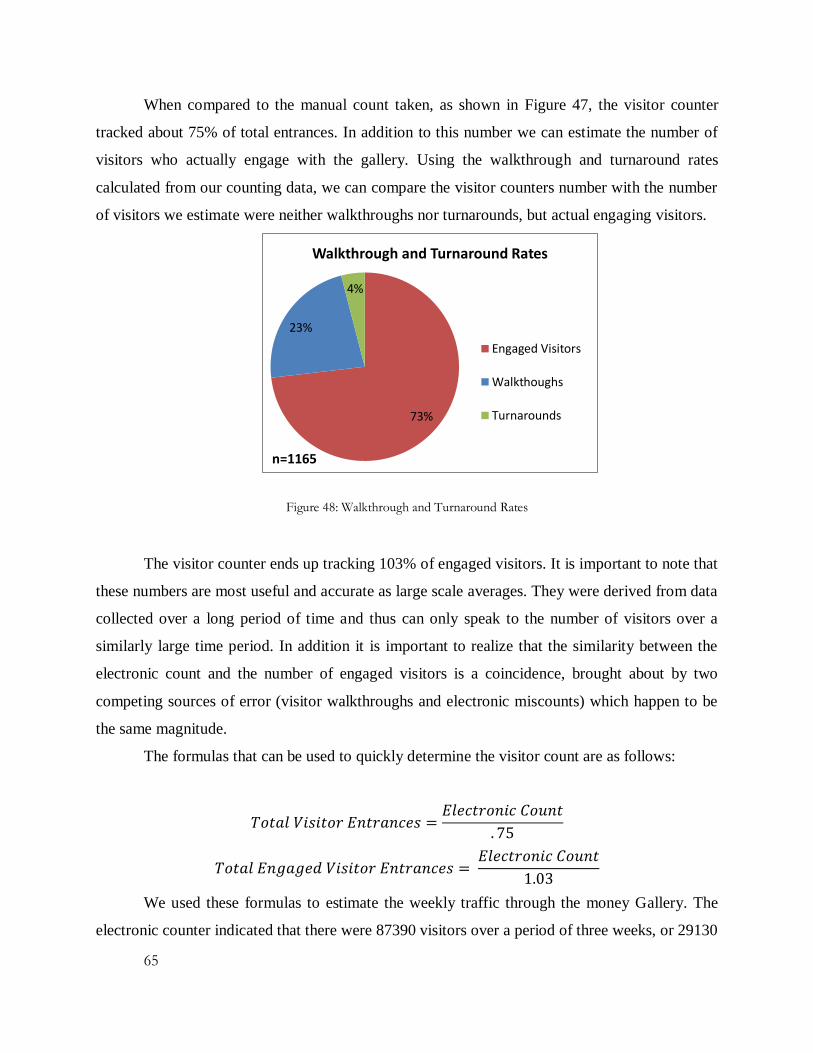
65
When compared to the manual count taken, as shown in Figure 47, the visitor counter
tracked about 75% of total entrances. In addition to this number we can estimate the number of
visitors who actually engage with the gallery. Using the walkthrough and turnaround rates
calculated from our counting data, we can compare the visitor counters number with the number
of visitors we estimate were neither walkthroughs nor turnarounds, but actual engaging visitors.
Figure 48: Walkthrough and Turnaround Rates
The visitor counter ends up tracking 103% of engaged visitors. It is important to note that
these numbers are most useful and accurate as large scale averages. They were derived from data
collected over a long period of time and thus can only speak to the number of visitors over a
similarly large time period. In addition it is important to realize that the similarity between the
electronic count and the number of engaged visitors is a coincidence, brought about by two
competing sources of error (visitor walkthroughs and electronic miscounts) which happen to be
the same magnitude.
The formulas that can be used to quickly determine the visitor count are as follows:
We used these formulas to estimate the weekly traffic through the money Gallery. The
electronic counter indicated that there were 87390 visitors over a period of three weeks, or 29130
73%
23%
4%
Walkthrough and Turnaround Rates
Engaged Visitors
Walkthoughs
Turnarounds
n=1165

66
visitors per week. Using our calibration this comes out to 38702 people entering the gallery per
week and 28300 people engaging with the gallery per week.
4.2. Methods Based Findings
Questionnaire
Survey language and first language often differ
Questionnaire Refusal rate for this study was relatively low
New Kinds of Questions
Recognition gives Visitors a better Chance of naming the sponsor of the gallery
Presentation and Analysis
Syntax 2D makes path data more intuitive to readers
Syntax 2D shows the flow of visitors through the gallery
Syntax 2D maps show which sides of standing exhibits are most popular
Bar Graphs Paired with Heat Maps
Meaning Making in Excel
4.2.1. Questionnaire
Survey language and first language often differ
Many visitors report a different first language than the one they take the survey in.
Comparing Figure 49 and Figure 50 below, it can be seen that far more people take the survey in
English than report it as their first language.

67
Figure 49: First Language Reported in Questionnaire
Figure 50: Language Survey was Taken in
There are several possible reasons for this difference. In all cases where the first language
and survey language were not the same, the survey was taken in English. Figure 51 below shows
a breakdown of visitors who took the survey in English even though it wasn’t their first language
according to whether or not their language was available. For 42% of visitors, the appropriate
language of survey was not available, but they spoke English well enough to take the survey in
English. The languages which were not available were Norwegian, Romanian, Russian,
Cantonese, Swedish, Polish, Finnish, and Dutch. 58% of visitors took the survey in English
rather than an available survey, and there are many possible reasons why. They could be
bilingual due to country of origin or immigration. They could also consider speaking English to
be part of their experience in the UK.
38%
12% 8%
7%
5%
4%
3%
3%
20%
First Language English
Spanish
Mandarin
Italian
French
Korean
Portuguese
Norwegian
Other
n=128
64% 10%
6%
5%
4%
3%
2% 2% 2% 2%
Survey Language English
Spanish
Italian
Mandarin
Korean
French
Greek
Portuguese
German
Othern=128
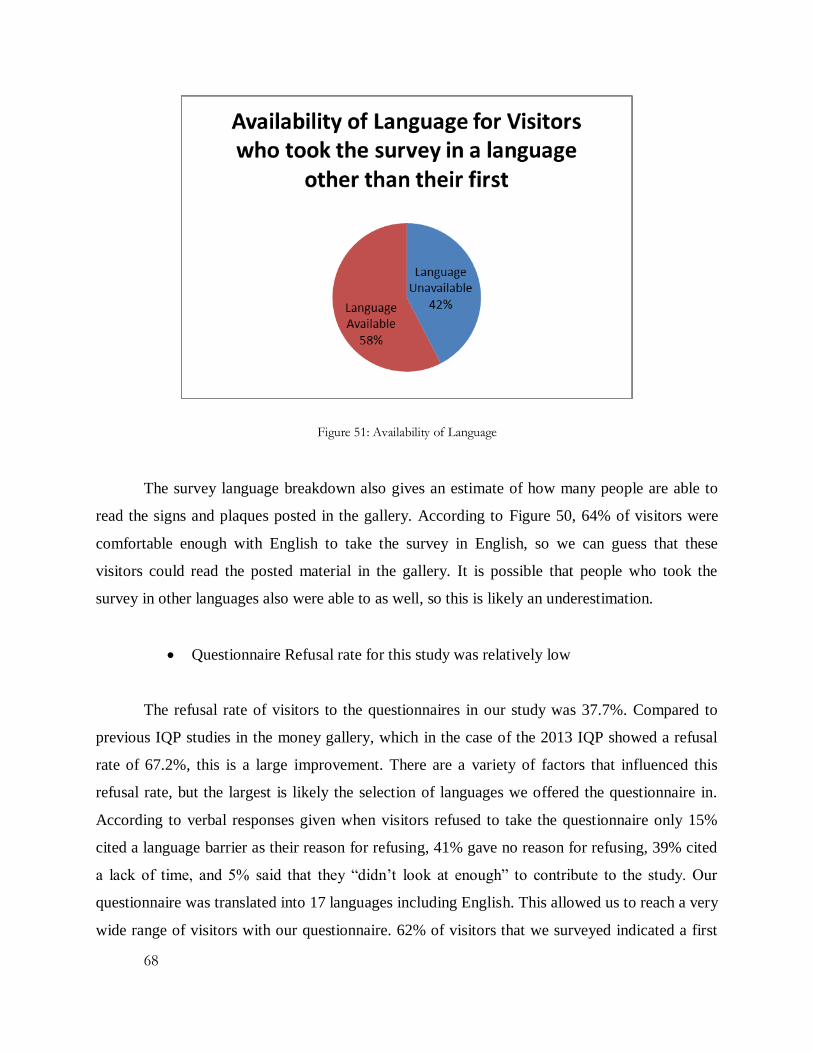
68
Figure 51: Availability of Language
The survey language breakdown also gives an estimate of how many people are able to
read the signs and plaques posted in the gallery. According to Figure 50, 64% of visitors were
comfortable enough with English to take the survey in English, so we can guess that these
visitors could read the posted material in the gallery. It is possible that people who took the
survey in other languages also were able to as well, so this is likely an underestimation.
Questionnaire Refusal rate for this study was relatively low
The refusal rate of visitors to the questionnaires in our study was 37.7%. Compared to
previous IQP studies in the money gallery, which in the case of the 2013 IQP showed a refusal
rate of 67.2%, this is a large improvement. There are a variety of factors that influenced this
refusal rate, but the largest is likely the selection of languages we offered the questionnaire in.
According to verbal responses given when visitors refused to take the questionnaire only 15%
cited a language barrier as their reason for refusing, 41% gave no reason for refusing, 39% cited
a lack of time, and 5% said that they “didn’t look at enough” to contribute to the study. Our
questionnaire was translated into 17 languages including English. This allowed us to reach a very
wide range of visitors with our questionnaire. 62% of visitors that we surveyed indicated a first
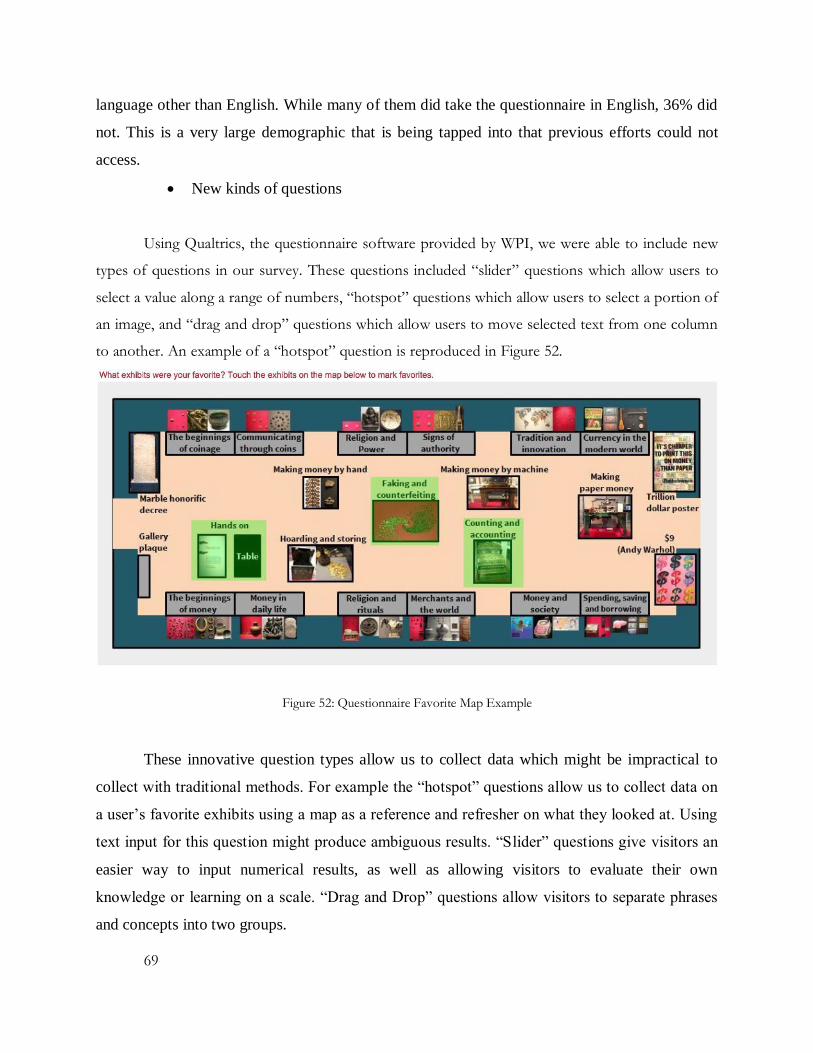
69
language other than English. While many of them did take the questionnaire in English, 36% did
not. This is a very large demographic that is being tapped into that previous efforts could not
access.
New kinds of questions
Using Qualtrics, the questionnaire software provided by WPI, we were able to include new
types of questions in our survey. These questions included “slider” questions which allow users to
select a value along a range of numbers, “hotspot” questions which allow users to select a portion of
an image, and “drag and drop” questions which allow users to move selected text from one column
to another. An example of a “hotspot” question is reproduced in Figure 52.
Figure 52: Questionnaire Favorite Map Example
These innovative question types allow us to collect data which might be impractical to
collect with traditional methods. For example the “hotspot” questions allow us to collect data on
a user’s favorite exhibits using a map as a reference and refresher on what they looked at. Using
text input for this question might produce ambiguous results. “Slider” questions give visitors an
easier way to input numerical results, as well as allowing visitors to evaluate their own
knowledge or learning on a scale. “Drag and Drop” questions allow visitors to separate phrases
and concepts into two groups.
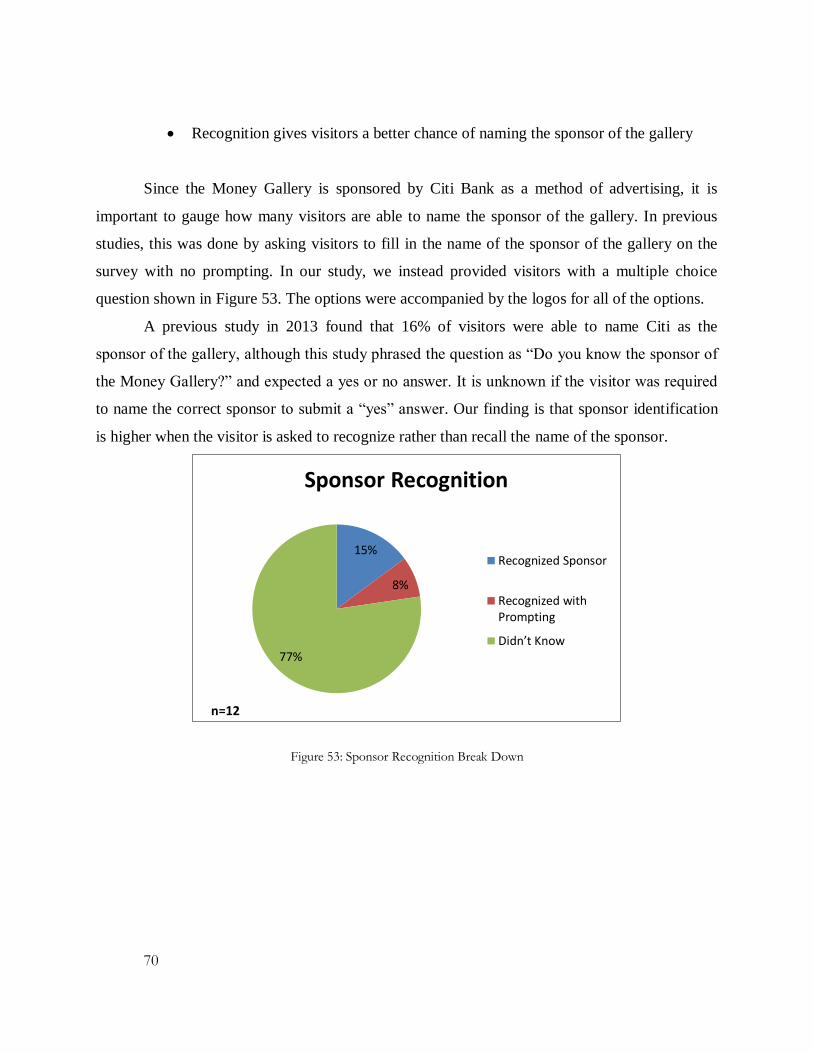
70
Recognition gives visitors a better chance of naming the sponsor of the gallery
Since the Money Gallery is sponsored by Citi Bank as a method of advertising, it is
important to gauge how many visitors are able to name the sponsor of the gallery. In previous
studies, this was done by asking visitors to fill in the name of the sponsor of the gallery on the
survey with no prompting. In our study, we instead provided visitors with a multiple choice
question shown in Figure 53. The options were accompanied by the logos for all of the options.
A previous study in 2013 found that 16% of visitors were able to name Citi as the
sponsor of the gallery, although this study phrased the question as “Do you know the sponsor of
the Money Gallery?” and expected a yes or no answer. It is unknown if the visitor was required
to name the correct sponsor to submit a “yes” answer. Our finding is that sponsor identification
is higher when the visitor is asked to recognize rather than recall the name of the sponsor.
Figure 53: Sponsor Recognition Break Down
15%
8%
77%
Sponsor Recognition
Recognized Sponsor
Recognized withPrompting
Didn’t Know
n=128
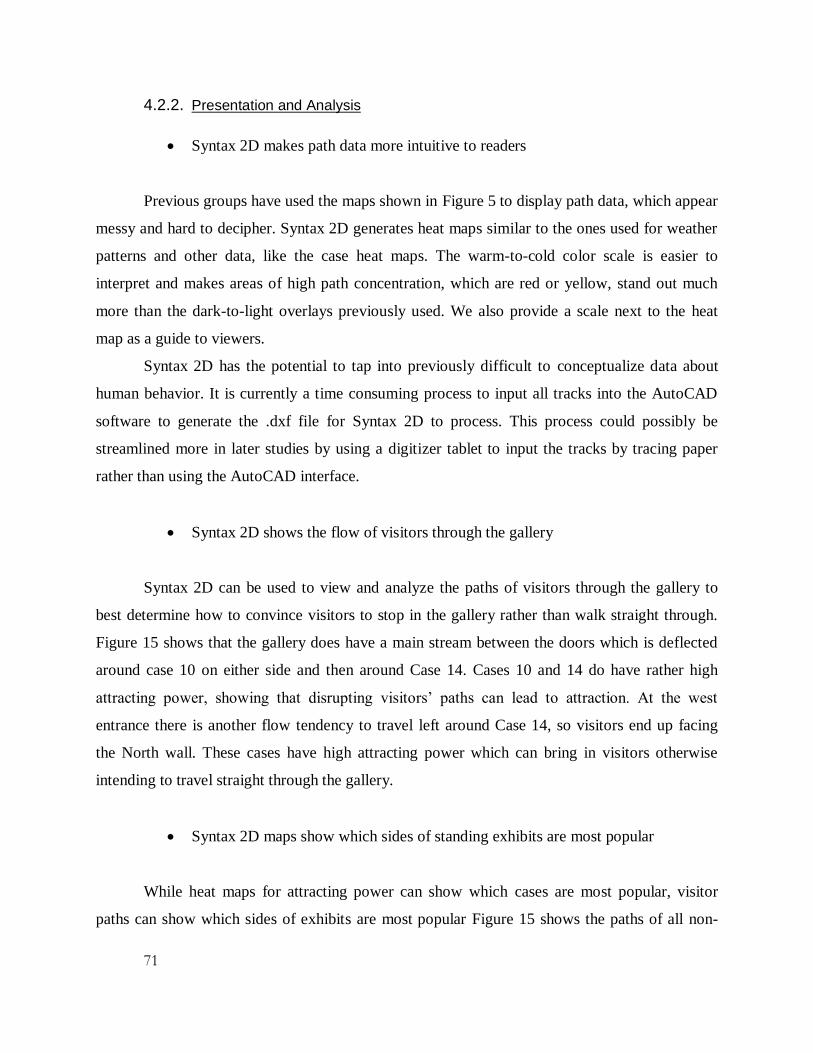
71
4.2.2. Presentation and Analysis
Syntax 2D makes path data more intuitive to readers
Previous groups have used the maps shown in Figure 5 to display path data, which appear
messy and hard to decipher. Syntax 2D generates heat maps similar to the ones used for weather
patterns and other data, like the case heat maps. The warm-to-cold color scale is easier to
interpret and makes areas of high path concentration, which are red or yellow, stand out much
more than the dark-to-light overlays previously used. We also provide a scale next to the heat
map as a guide to viewers.
Syntax 2D has the potential to tap into previously difficult to conceptualize data about
human behavior. It is currently a time consuming process to input all tracks into the AutoCAD
software to generate the .dxf file for Syntax 2D to process. This process could possibly be
streamlined more in later studies by using a digitizer tablet to input the tracks by tracing paper
rather than using the AutoCAD interface.
Syntax 2D shows the flow of visitors through the gallery
Syntax 2D can be used to view and analyze the paths of visitors through the gallery to
best determine how to convince visitors to stop in the gallery rather than walk straight through.
Figure 15 shows that the gallery does have a main stream between the doors which is deflected
around case 10 on either side and then around Case 14. Cases 10 and 14 do have rather high
attracting power, showing that disrupting visitors’ paths can lead to attraction. At the west
entrance there is another flow tendency to travel left around Case 14, so visitors end up facing
the North wall. These cases have high attracting power which can bring in visitors otherwise
intending to travel straight through the gallery.
Syntax 2D maps show which sides of standing exhibits are most popular
While heat maps for attracting power can show which cases are most popular, visitor
paths can show which sides of exhibits are most popular Figure 15 shows the paths of all non-

72
walkthrough tracked visitors. Looking at Case 17, it can be seen that the east side of the case has
many more neighboring paths. Looking at the data from our tracking, 65% of visitors at the case
were from the east. This case is also more common for first stops from the east than the west
even though it is closer to the west.
Bar Graphs Paired with Heat Maps
Previous efforts at evaluating the Citi Money Gallery have used rudimentary heat maps
of the gallery to show metrics such as attracting power and holding power. Unfortunately these
were often created with a single, difficult to understand, unappealing color gradient. We have
instead used a color gradient with many bright colors which is easier on the eye, and easier to
understand. In addition we have paired the heat maps with bar graphs of the values used for
better understanding. By color coding the bar graphs with the same colors as on the heat maps it
makes it easy to reference from one to another. In addition the multiple color gradients make it
easy to distinguish one color/bar pair from another. An example of these graph pairs is below in
Figure 54.
73
Figure 54: Heat Map and Bar Graph Pair
Meaning making in Excel
Since we decided to determine our Meaning making statistics using our questionnaire
data, we used an excel formula to determine what class of meaning making a visitor used. The
responses to the question “Why did you come to the British Museum today?” were sorted such

74
that each of the eight responses correlated to one of the four types of meaning making (Social,
Emotional, Intellectual Spiritual) according to table x. The number of responses in each category
was calculated and the most represented category was returned. Ties were determined by
deferring to the “lower” meaning making level.
Reason for Visiting Meaning Making Strategy
It's a major London attraction
Social
It's a good way to pass the time
Social
To understand other cultures
Emotional
To see amazing artifacts
Emotional
I have a professional interest in the
museum/a particular exhibit
Intellectual
To Learn/Further my own knowledge
Intellectual
To stimulate my own creativity
Spiritual
For peaceful, quiet contemplation
Spiritual
Table 6: Reasons for Visiting and Meaning Making Strategy

75
CHAPTER 5: CONCLUSIONS
5.1. Successes
During the course of our IQP, we were able to not only perform the required traditional
gallery evaluation, but develop some new and innovative ways of gathering and processing data.
The use of Qualtrics software enabled us to offer questionnaire on iPads and we were able to use
new question types as a result. The software also gave us the opportunity to enter translated
versions of our English survey in order to reach non-English speaking visitors and gather more
diverse information about the gallery.
We were also able to use analysis software to present data in more easily understood
formats than ever before. We used excel to generate bar graphs and heat maps that complimented
each other. We also discovered an entirely new software, Syntax 2D which gives the museum the
opportunity to use and analyze visitor paths.
5.2. Recommendations to the Gallery
We have some recommendations to the gallery based on our findings. These findings are
focus on increasing attracting power and holding power as well as making the gallery more
friendly to the large number of non-English speaking visitors.
Include more eye catching objects in the case 19 Bitcoin display in addition to the text
heavy portions.
Add attractive lighting to the wall cases to increase their attracting power.
Increase visibility of wall case info panels.
Consider adding translations of English text into other languages.
Increase size and visibility of Citibank logo on the wall plaque and consider adding the
logo to other parts of the gallery, including the gallery titles above the entrances.
Consider increasing visibility of the branching Chinese coin mold in case 3.
Look at ways to encourage visitors to follow the narrative of the gallery, or match the
narrative to the visitor flow.
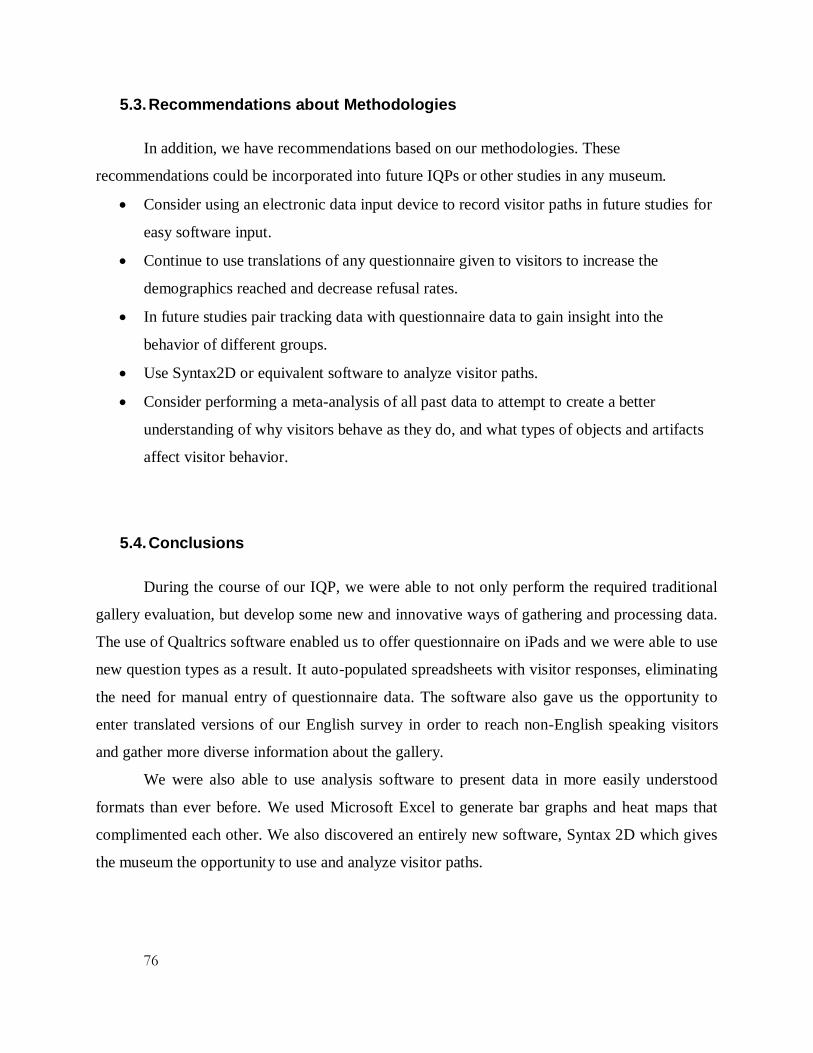
76
5.3. Recommendations about Methodologies
In addition, we have recommendations based on our methodologies. These
recommendations could be incorporated into future IQPs or other studies in any museum.
Consider using an electronic data input device to record visitor paths in future studies for
easy software input.
Continue to use translations of any questionnaire given to visitors to increase the
demographics reached and decrease refusal rates.
In future studies pair tracking data with questionnaire data to gain insight into the
behavior of different groups.
Use Syntax2D or equivalent software to analyze visitor paths.
Consider performing a meta-analysis of all past data to attempt to create a better
understanding of why visitors behave as they do, and what types of objects and artifacts
affect visitor behavior.
5.4. Conclusions
During the course of our IQP, we were able to not only perform the required traditional
gallery evaluation, but develop some new and innovative ways of gathering and processing data.
The use of Qualtrics software enabled us to offer questionnaire on iPads and we were able to use
new question types as a result. It auto-populated spreadsheets with visitor responses, eliminating
the need for manual entry of questionnaire data. The software also gave us the opportunity to
enter translated versions of our English survey in order to reach non-English speaking visitors
and gather more diverse information about the gallery.
We were also able to use analysis software to present data in more easily understood
formats than ever before. We used Microsoft Excel to generate bar graphs and heat maps that
complimented each other. We also discovered an entirely new software, Syntax 2D which gives
the museum the opportunity to use and analyze visitor paths.
77
BIBLIOGRAPHY
BBC News - British Museum is the most visited UK attraction again. (2014).
Bitgood, S. (2006). An analysis of visitor circulation: Movement patterns and the general
value principle. Curator: The Museum Journal, 49(4), 463-475.
Bitgood, S. (2013). Attention and Value: Keys to Understanding Museum Visitors: Left
Coast Press.
Bitgood, S., & Shettel, H. H. (1996). An Overview of Visitor Studies. The Journal of
Museum Education, 21(3), 6-10.
British Museum - About us. (2014). from
http://www.britishmuseum.org/about_us/management/about_us.aspx
British Museum - Coins and Medals. (2014). from
http://www.britishmuseum.org/about_us/departments/coins_and_medals.aspx
British Museum - General history. (2014). from
http://www.britishmuseum.org/about_us/the_museums_story/general_history.aspx
British Museum - History of the collection. (2014). from
http://www.britishmuseum.org/about_us/the_museums_story/the_collection.aspx
Catching up with progress in the Money Gallery. (2014).
Diamond, J. (1999). Practical evaluation guide: tools for museums and other informal
educational settings: AltaMira Press.
Donald, J. G. (1991). The Measurement of Learning in the Museum. Canadian Journal of
Education / Revue canadienne de l'éducation, 16(3), 371-382. doi: 10.2307/1494885
Durrer, V., & Miles, S. (2009). New perspectives on the role of cultural intermediaries in
social inclusion in the UK. Consumption, Markets and Culture, 12(3), 225-241.
Klebanov, A., Glover, T. J., Carlyle, S. L., Clark, C. A., & Ray, M. H. (2008). Creating a
methodology for evaluating a gallery. Worcester, MA: Worcester Polytechnic Institute.
Macdonald, S., & Ebrary Academic, C. (2006). A companion to museum studies (Vol.
12). Malden, MA: Blackwell Pub.
Morris, Hargreaves, & McIntyre. (2005). NEVER MIND THE WIDTH, FEEL THE
QUALITY: The Museums & Heritage Show Ltd.
Osborn, S. D., Moore, W. C., Liu, Z., Corini, A. C., Hou, Z., & Mott, W. T. (2013).
Evaluating Visitor Experience in the Citi Money Gallery at the British Museum. Worcester, MA:
Worcester Polytechnic Institute.
Peterson, D. A., Lybarger, A. R., Clinckemaillie, F. E., Kazantzis, N. K., & Brattin, J. J.
(2010). Evaluating visitor experience in the Department of Coins and Medals. Worcester, MA:
Worcester Polytechnic Institute.
Report and Accounts for the Year Ended 31 March 2003. (2014). from
http://www.britishmuseum.org/pdf/TAR02-03.pdf
Serrell, B. (1997). Paying attention: The duration and allocation of visitors' time in
museum exhibitions. Curator: The Museum Journal, 40(2), 108-125.
Stanford, R. B., Moscardini, M., Ernst, C. L., Cleary, C. J., Mott, W. T., & Salazar, G. F.
(2007). British Museum gallery study -- An analysis of the effectiveness of select galleries for
families. Worcester, MA: Worcester Polytechnic Institute.

78
White, K. J., Skorinko, N. M., Skene, W. T., Gaxho, D., Golding, D., & Davis, P. W.
(2009). Evaluating the galleries of the Department of Coins and Medals at the British Museum.
Worcester, MA: Worcester Polytechnic Institute.
Yalowitz, S. S., & Bronnenkant, K. (2009). Timing and Tracking: Unlocking Visitor
Behavior. Visitor Studies, 12(1), 47-64. doi: 10.1080/10645570902769134
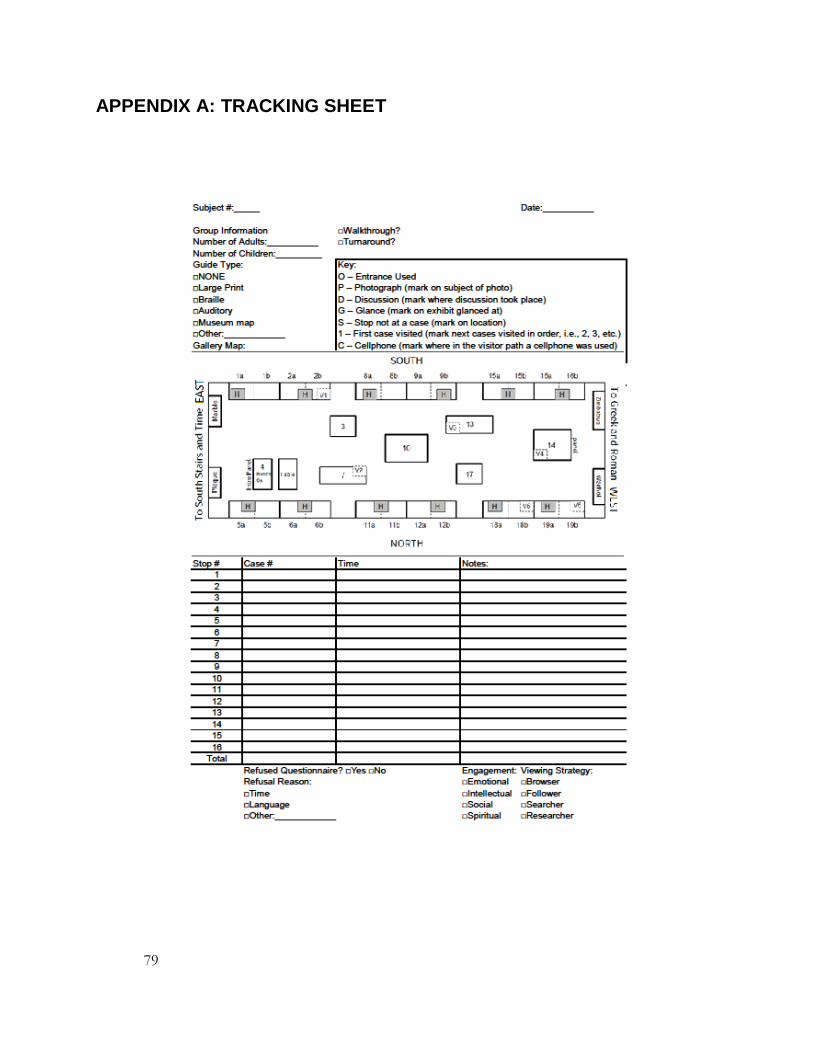
79
APPENDIX A: TRACKING SHEET
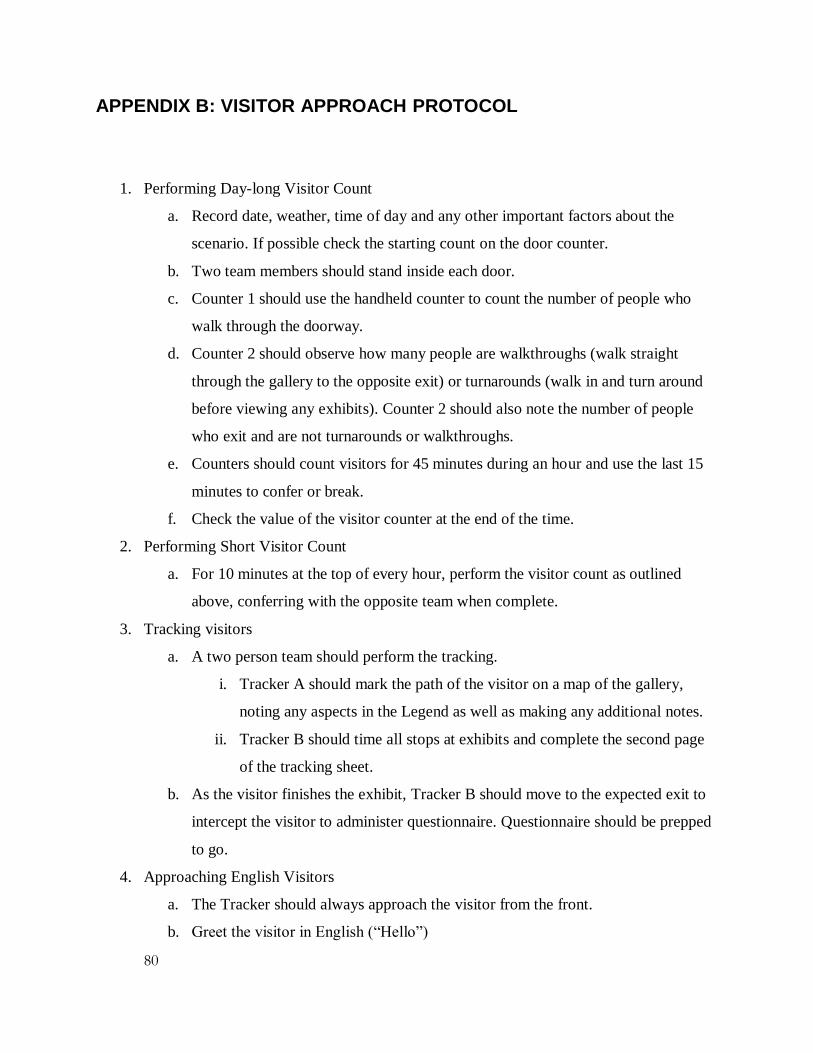
80
APPENDIX B: VISITOR APPROACH PROTOCOL
1. Performing Day-long Visitor Count
a. Record date, weather, time of day and any other important factors about the
scenario. If possible check the starting count on the door counter.
b. Two team members should stand inside each door.
c. Counter 1 should use the handheld counter to count the number of people who
walk through the doorway.
d. Counter 2 should observe how many people are walkthroughs (walk straight
through the gallery to the opposite exit) or turnarounds (walk in and turn around
before viewing any exhibits). Counter 2 should also note the number of people
who exit and are not turnarounds or walkthroughs.
e. Counters should count visitors for 45 minutes during an hour and use the last 15
minutes to confer or break.
f. Check the value of the visitor counter at the end of the time.
2. Performing Short Visitor Count
a. For 10 minutes at the top of every hour, perform the visitor count as outlined
above, conferring with the opposite team when complete.
3. Tracking visitors
a. A two person team should perform the tracking.
i. Tracker A should mark the path of the visitor on a map of the gallery,
noting any aspects in the Legend as well as making any additional notes.
ii. Tracker B should time all stops at exhibits and complete the second page
of the tracking sheet.
b. As the visitor finishes the exhibit, Tracker B should move to the expected exit to
intercept the visitor to administer questionnaire. Questionnaire should be prepped
to go.
4. Approaching English Visitors
a. The Tracker should always approach the visitor from the front.
b. Greet the visitor in English (“Hello”)

81
c. Offer Survey and explain project
i. “Hello! My name is… I am working on behalf of the British Museum.
Would you mind filling out a three minute survey about your experience
in the gallery?”
d. If visitor accepts:
i. “Thank You! Please let me know if you have any questions about the
survey”
ii. While visitor is completing survey, complete any note on the tracking
sheet. Seem busy so as not to rush visitor.
iii. Thank the Visitor for their participation. Record the questionnaire number
on the tracking sheet and on the final screen of the iPad.
e. If visitor refuses:
i. Mark on tracking sheet reason for refusal. If requested, destroy tracking
sheet
5. Approaching Foreign Visitors
a. The Tracker should always approach the visitor from the front.
b. Greet the visitor in English (“Hello”).
c. If the visitor indicates that they do not speak English, offer explanation card/Point
to sign.
i. “Please take our three minute survey about your experience in the gallery
today! Our survey is available in languages other than English.”
d. If visitor accepts:
i. While visitor is completing survey, complete any note on the tracking
sheet. Seem busy so as not to rush visitor.
ii. Thank the visitor for their participation.
e. If visitor refuses:
i. Mark on tracking sheet reason for refusal. If requested, destroy tracking
sheet
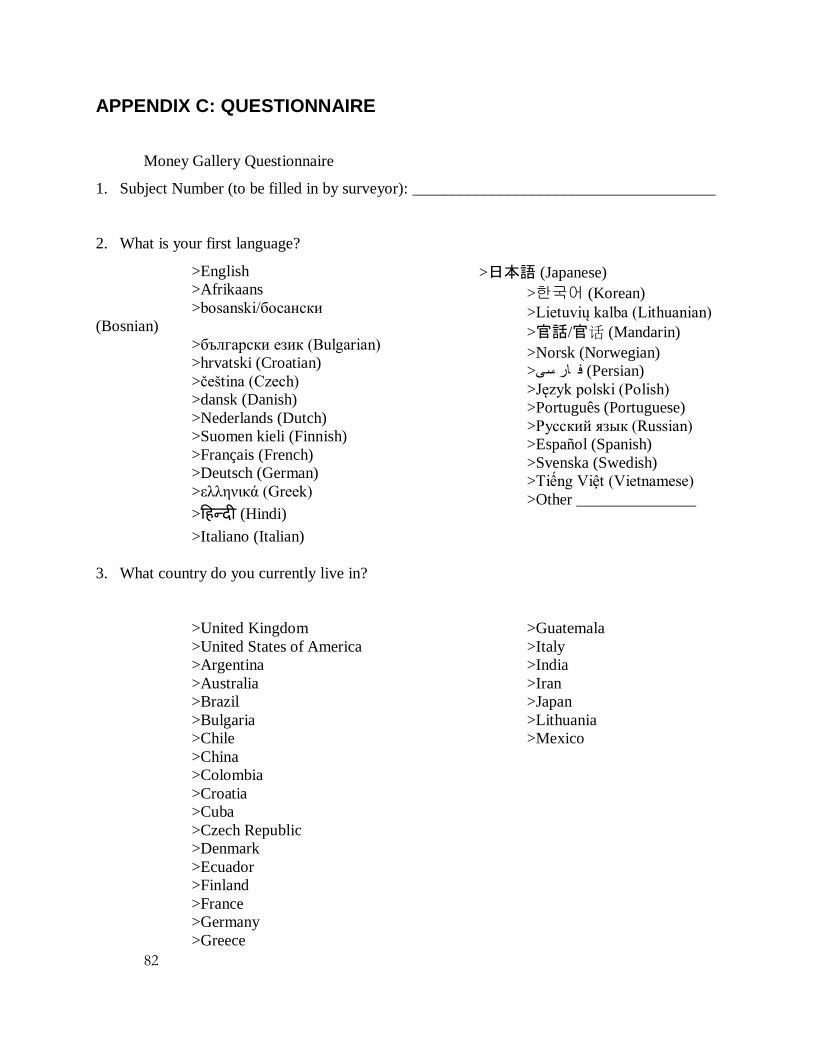
82
APPENDIX C: QUESTIONNAIRE
Money Gallery Questionnaire
1. Subject Number (to be filled in by surveyor): ______________________________________
2. What is your first language?
>English
>Afrikaans
>bosanski/босански
(Bosnian)
>български език (Bulgarian)
>hrvatski (Croatian)
>čeština (Czech)
>dansk (Danish)
>Nederlands (Dutch)
>Suomen kieli (Finnish)
>Français (French)
>Deutsch (German)
>ελληνικά (Greek)
> (Hindi)
>Italiano (Italian)
>日本語 (Japanese)
>한국어 (Korean)
>Lietuvių kalba (Lithuanian)
>官話/官话 (Mandarin)
>Norsk (Norwegian)
سی< ار (Persian) ف
>Język polski (Polish)
>Português (Portuguese)
>Русский язык (Russian)
>Español (Spanish)
>Svenska (Swedish)
>Tiếng Việt (Vietnamese)
>Other _______________
3. What country do you currently live in?
>United Kingdom
>United States of America
>Argentina
>Australia
>Brazil
>Bulgaria
>Chile
>China
>Colombia
>Croatia
>Cuba
>Czech Republic
>Denmark
>Ecuador
>Finland
>France
>Germany
>Greece
>Guatemala
>Italy
>India
>Iran
>Japan
>Lithuania
>Mexico

83
>Norway
>Peru
>Poland
>Russia
>Spain
>South Korea
>Sweden
>The Netherlands
>Venezuela
>Vietnam
>Other
_______________________
4. What is your age? >18-20 >21-24 >25-34 >35-44 >45-54 >55-64 >65+
5. What is your gender? >Male >Female >Other >Prefer Not to Answer
6. Are you alone or with a group?
>Alone
>Group
6. a. How many people were in your group?
0 11 20
-----------------------------------------||------------------------------------------
7. Why did you visit the British Museum today?
>It is a major London attraction
>It is a good way to pass the time
>To learn/Further my own knowledge
>To understand other cultures
>To see amazing artifacts
>I have a professional interest in the museum
>Other ______________________________
8. Why did you visit Money Gallery today?
>No particular reason
>I have a professional interest in the subject
>I have a personal interest in the subject
>Other ______________________________
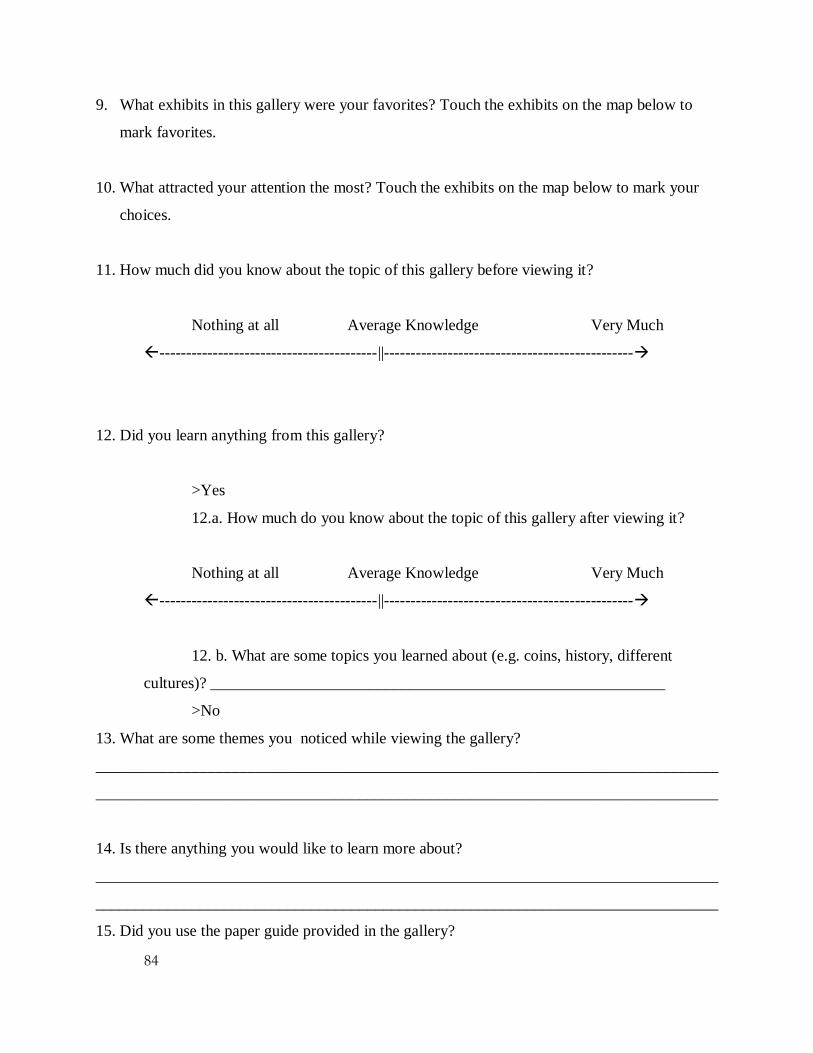
84
9. What exhibits in this gallery were your favorites? Touch the exhibits on the map below to
mark favorites.
10. What attracted your attention the most? Touch the exhibits on the map below to mark your
choices.
11. How much did you know about the topic of this gallery before viewing it?
Nothing at all Average Knowledge Very Much
-----------------------------------------||-----------------------------------------------
12. Did you learn anything from this gallery?
>Yes
12.a. How much do you know about the topic of this gallery after viewing it?
Nothing at all Average Knowledge Very Much
-----------------------------------------||-----------------------------------------------
12. b. What are some topics you learned about (e.g. coins, history, different
cultures)? _________________________________________________________
>No
13. What are some themes you noticed while viewing the gallery?
______________________________________________________________________________
______________________________________________________________________________
14. Is there anything you would like to learn more about?
______________________________________________________________________________
______________________________________________________________________________
15. Did you use the paper guide provided in the gallery?
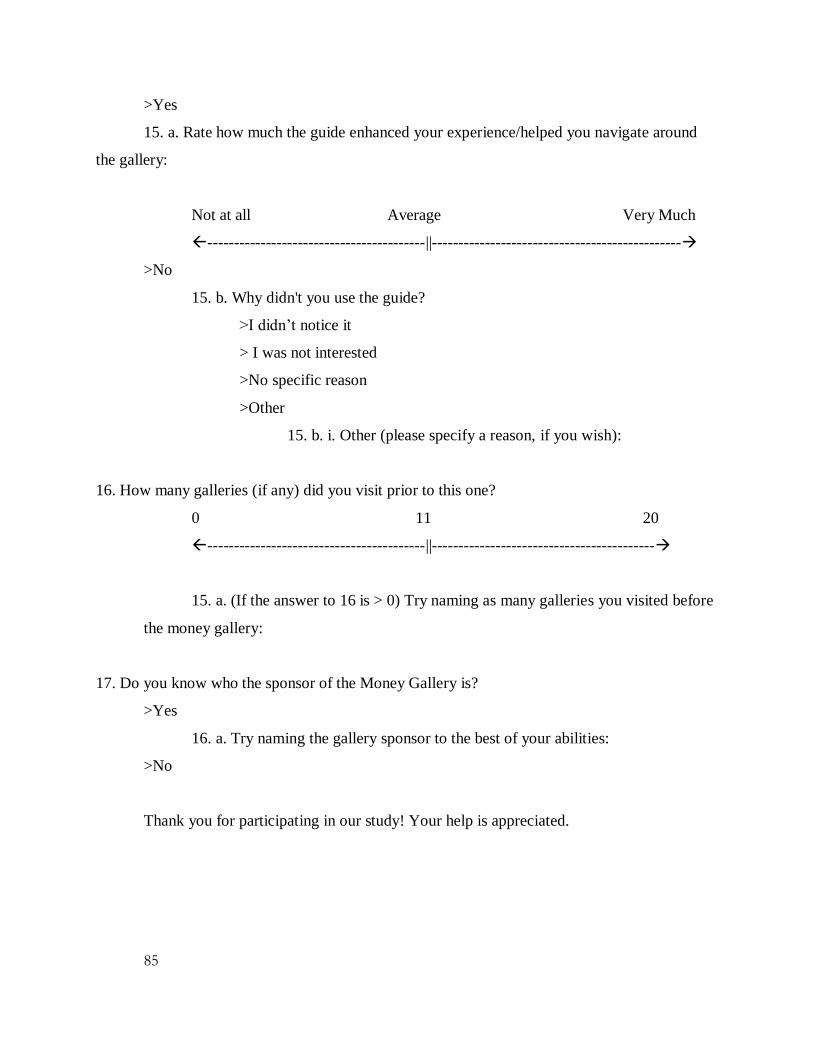
85
>Yes
15. a. Rate how much the guide enhanced your experience/helped you navigate around
the gallery:
Not at all Average Very Much
-----------------------------------------||-----------------------------------------------
>No
15. b. Why didn't you use the guide?
>I didn’t notice it
> I was not interested
>No specific reason
>Other
15. b. i. Other (please specify a reason, if you wish):
16. How many galleries (if any) did you visit prior to this one?
0 11 20
-----------------------------------------||------------------------------------------
15. a. (If the answer to 16 is > 0) Try naming as many galleries you visited before
the money gallery:
17. Do you know who the sponsor of the Money Gallery is?
>Yes
16. a. Try naming the gallery sponsor to the best of your abilities:
>No
Thank you for participating in our study! Your help is appreciated.

86
APPENDIX D: ADDITIONAL DATA FOR FUTURE CONSIDERATION
The above graph and map show which cases inside of gallery 68 were the last stop of
visitors who exited through the east doors of the gallery. It only takes into account the visitors
who exited through the east doors of the gallery and is looking at their last case visited.

87
The above graph and map show which cases inside of gallery 68 were the last stop of
visitors who exited through the west doors of the gallery. It only takes into account the visitors
who exited through the west doors of the gallery and is looking at their last case visited.
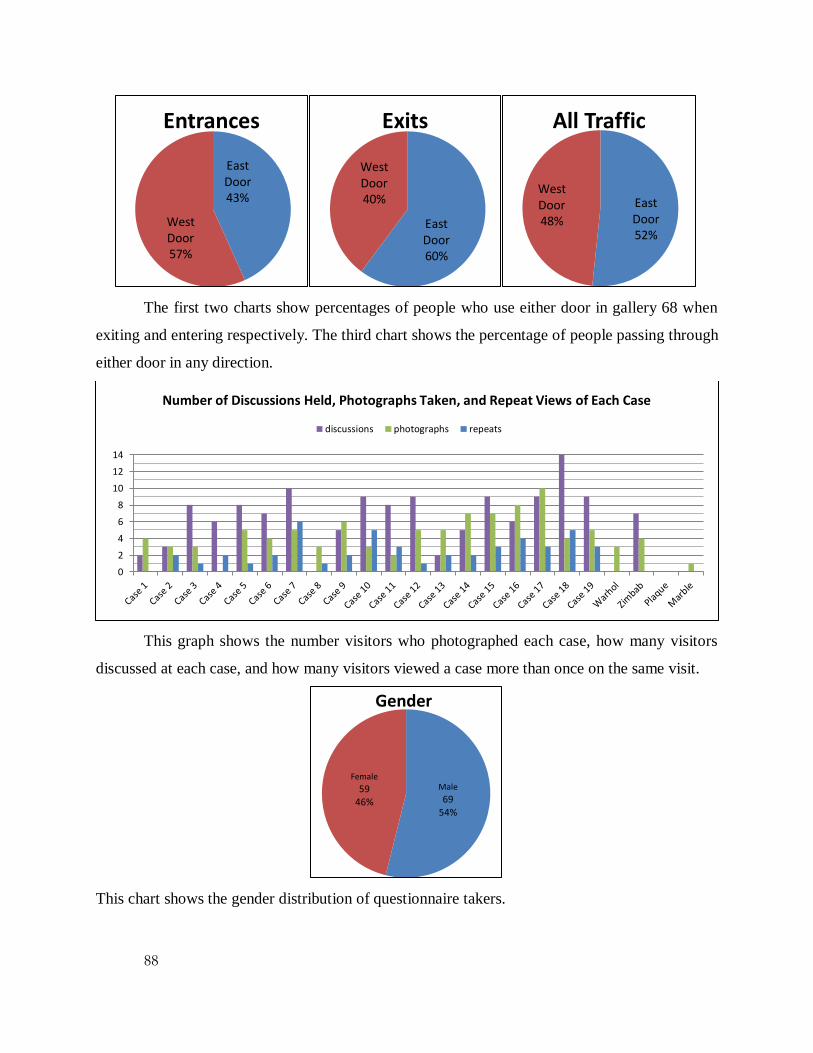
88
The first two charts show percentages of people who use either door in gallery 68 when
exiting and entering respectively. The third chart shows the percentage of people passing through
either door in any direction.
This graph shows the number visitors who photographed each case, how many visitors
discussed at each case, and how many visitors viewed a case more than once on the same visit.
This chart shows the gender distribution of questionnaire takers.
East Door 43%
West Door 57%
Entrances
East Door 60%
West Door 40%
Exits
East Door 52%
West Door 48%
All Traffic
0
2
4
6
8
10
12
14
Number of Discussions Held, Photographs Taken, and Repeat Views of Each Case
discussions photographs repeats
Male 69
54%
Female 59
46%
Gender
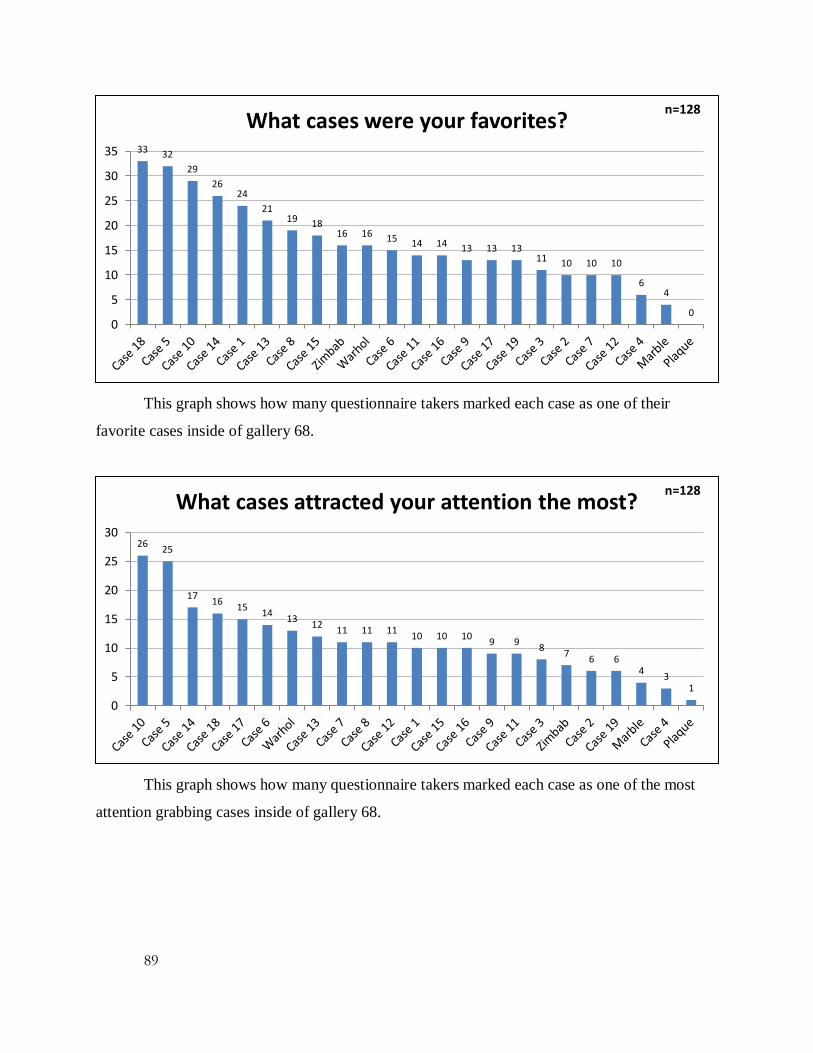
89
This graph shows how many questionnaire takers marked each case as one of their
favorite cases inside of gallery 68.
This graph shows how many questionnaire takers marked each case as one of the most
attention grabbing cases inside of gallery 68.
33 32
29
26 24
21 19 18
16 16 15 14 14 13 13 13 11 10 10 10
6 4
0 0
5
10
15
20
25
30
35
What cases were your favorites? n=128
26 25
17 16
15 14
13 12
11 11 11 10 10 10
9 9 8
7 6 6
4 3
1
0
5
10
15
20
25
30
What cases attracted your attention the most? n=128

90
These graphs break down the discrepancies between the cases indicated as attracting and
the cases visitors actually stopped or glanced at.
How many galleries did you visit prior to the money gallery?
The median number of galleries visited prior to the money gallery was 7. The median
number of galleries visited prior was 6. The mode number of galleries visited was 4.
All Paths and Holding Power
62% 11%
9%
6%
12%
Survey Language of Surveys with Attractive Case Discrepancies
English
Italian
Spanish
Mandarin
Other
n=65
55%
45%
Surveys Taken in English with Attractive Case Discrepancies
English as FirstLanguage
English as SecondLanguage
n=40
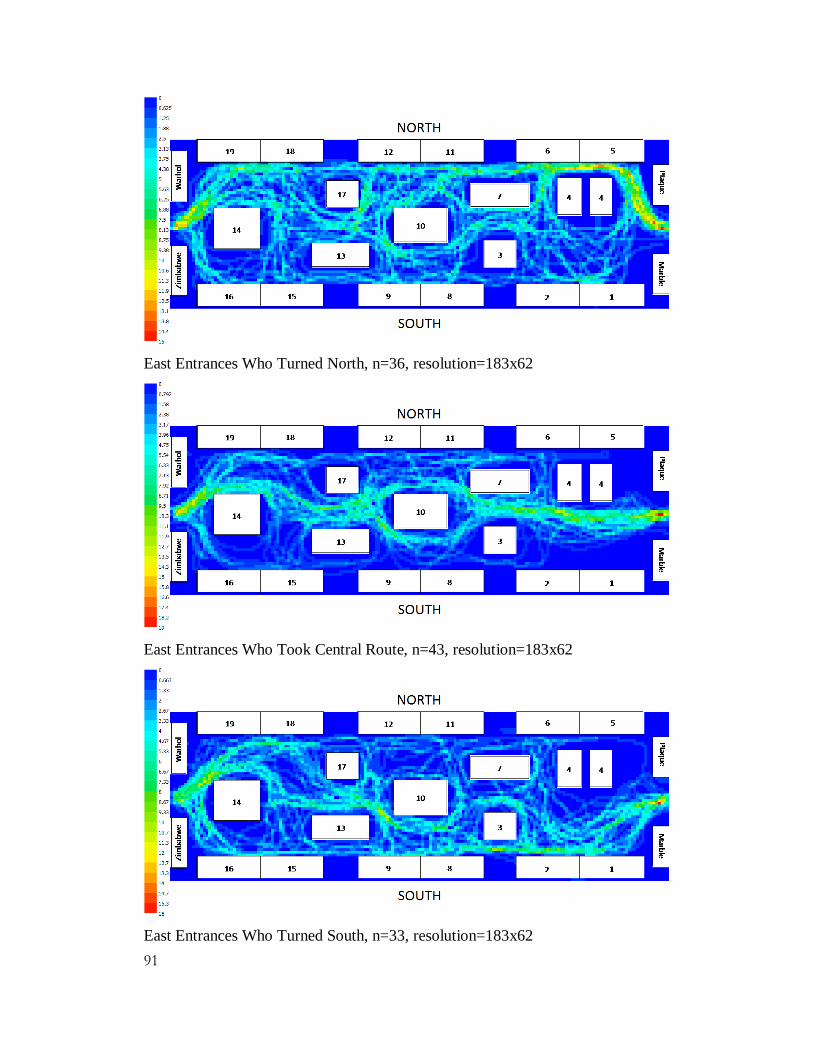
91
East Entrances Who Turned North, n=36, resolution=183x62
East Entrances Who Took Central Route, n=43, resolution=183x62
East Entrances Who Turned South, n=33, resolution=183x62

92
West Entrances Who Turned North, n=47, resolution=183x62
West Entrances Who Took Central Route, n=43, resolution=183x62
West Entrances Who Turned South, n=31, resolution=183x62

93
APPENDIX E: CONTENT OF CASES
Case Title Case Type Contents
Case 1 The beginnings of
coinage
Wall case on South
wall
Small objects, earliest coins (case highlight),
spade money
Case 2 Communicating
through coins
Wall case on South
wall
Small objects, small spiral of coins from
Gandhara, case highlight display of 6 Nero coins
showing how his portrait changed over time
Case 3 Making money by
hand
Free-standing case on
the Southern side of
the gallery, see-
through
Some old coins, a strip of farthing coins, a tree-
like mold of Chinese coins with square holes
Case 4 Hands-on table Free-standing case and
a table for hands-on
activities
When ongoing, it has various coins from around
the world that visitors can touch and hold
Case 5 The beginnings of
money
Wall case on the
North wall
Bigger, golden objects, El Amarna (case
highlight) and some other hoards, cowrie shells, a bronze vessel, a few coins
Case 6 Money in daily life Wall case on the North wall
Ancient Greek necklace, a hoard, large and small coins, a Buddhist statue, the case highlight section
contains a vase and coins used as
spiritualofferings
Case 7 Hoarding and storing Free-standing case on
Northern side of the
gallery
A big chest, a vase and many gold coins, some
other coins and smaller objects
Case 8 Religion and power Wall case on South
wall
Statue of a Goddess, largely coins about religion
and the proclamation of faith (case highlight), a
bowl
Case 9 Signs of authority Wall case on South
wall
Ming dynasty bank note, Chinese coins linked
together, a dagger, the first global currency from
Mexico and Bolivia (case highlight)
Case 10 Faking and
counterfeiting
Free-standing case in
the middle of the
gallery
Two swirls consisting respectively of counterfeit
pound coins and counterfeit ancient Roman coins
Case 11 Religion and rituals Wall case on the
North wall
Large Chinese coins with square holes, a few
smaller gold coins, a 16th century collecting box
from Italy (case highlight), a horse statue, other
coins and objects
Case 12 Merchants and the
world
Wall case on the
North wall
A balance scale and other objects to weigh gold
dust (case highlight), ceramic objects such as
pieces of plates, vases, pots and a necklace, a massive Swedish copper coin
Case 13 Making money by machine
Free-standing case on the Southern side of
the gallery
An old machine to make coins, large molds for pound coins
Case 14 Making paper money Free-standing case on
the Southern side of
the gallery
A machine to print currency notes
Case 15 Tradition and
innovation
Wall case on South
wall
Large spiral of coins from every country in the
modern world (case highlight), necklace, large
round stone coin, other banknotes and coins
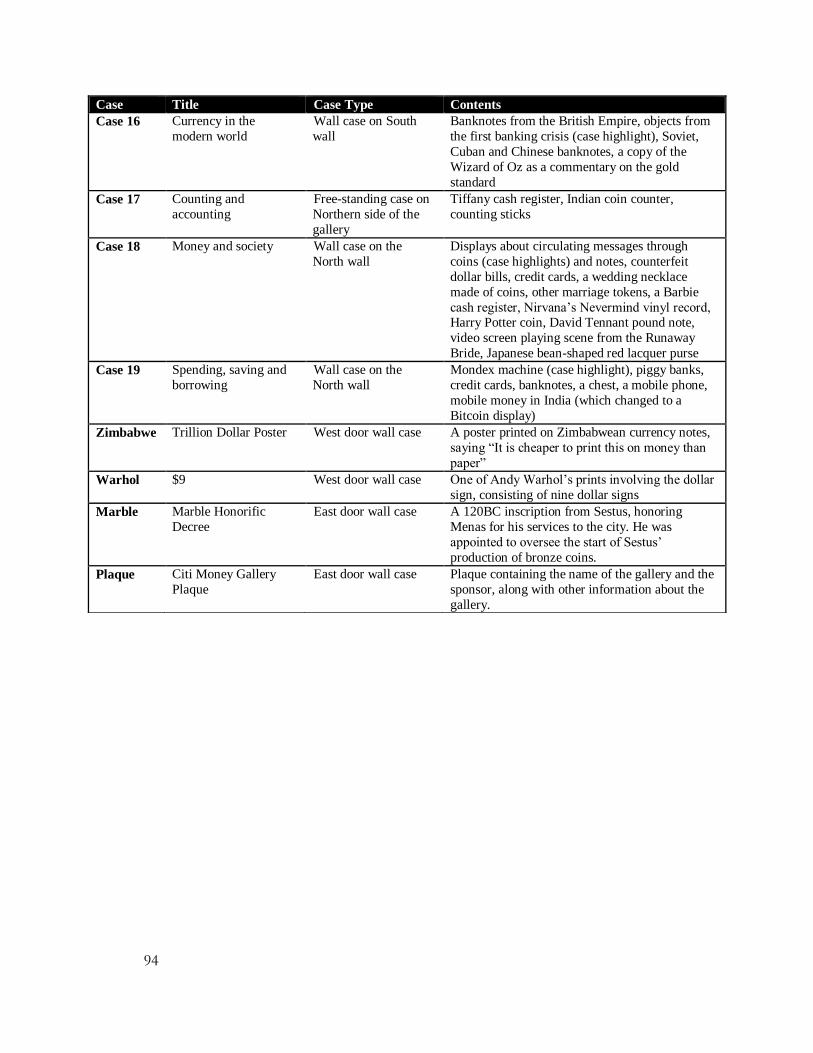
94
Case Title Case Type Contents
Case 16 Currency in the
modern world
Wall case on South
wall
Banknotes from the British Empire, objects from
the first banking crisis (case highlight), Soviet,
Cuban and Chinese banknotes, a copy of the
Wizard of Oz as a commentary on the gold
standard
Case 17 Counting and
accounting
Free-standing case on
Northern side of the
gallery
Tiffany cash register, Indian coin counter,
counting sticks
Case 18 Money and society Wall case on the
North wall
Displays about circulating messages through
coins (case highlights) and notes, counterfeit
dollar bills, credit cards, a wedding necklace
made of coins, other marriage tokens, a Barbie
cash register, Nirvana’s Nevermind vinyl record, Harry Potter coin, David Tennant pound note,
video screen playing scene from the Runaway
Bride, Japanese bean-shaped red lacquer purse
Case 19 Spending, saving and
borrowing
Wall case on the
North wall
Mondex machine (case highlight), piggy banks,
credit cards, banknotes, a chest, a mobile phone,
mobile money in India (which changed to a
Bitcoin display)
Zimbabwe Trillion Dollar Poster West door wall case A poster printed on Zimbabwean currency notes,
saying “It is cheaper to print this on money than
paper”
Warhol $9 West door wall case One of Andy Warhol’s prints involving the dollar
sign, consisting of nine dollar signs
Marble Marble Honorific
Decree
East door wall case A 120BC inscription from Sestus, honoring
Menas for his services to the city. He was
appointed to oversee the start of Sestus’
production of bronze coins.
Plaque Citi Money Gallery
Plaque
East door wall case Plaque containing the name of the gallery and the
sponsor, along with other information about the
gallery.
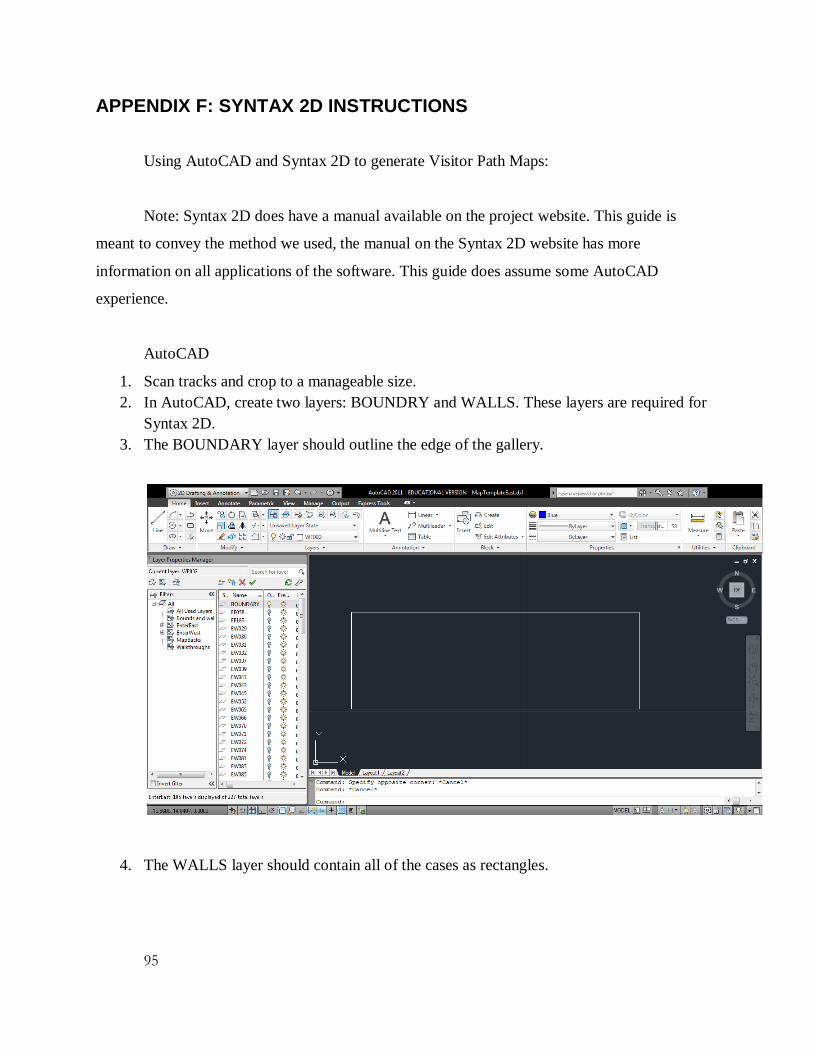
95
APPENDIX F: SYNTAX 2D INSTRUCTIONS
Using AutoCAD and Syntax 2D to generate Visitor Path Maps:
Note: Syntax 2D does have a manual available on the project website. This guide is
meant to convey the method we used, the manual on the Syntax 2D website has more
information on all applications of the software. This guide does assume some AutoCAD
experience.
AutoCAD
1. Scan tracks and crop to a manageable size.
2. In AutoCAD, create two layers: BOUNDRY and WALLS. These layers are required for
Syntax 2D.
3. The BOUNDARY layer should outline the edge of the gallery.
4. The WALLS layer should contain all of the cases as rectangles.
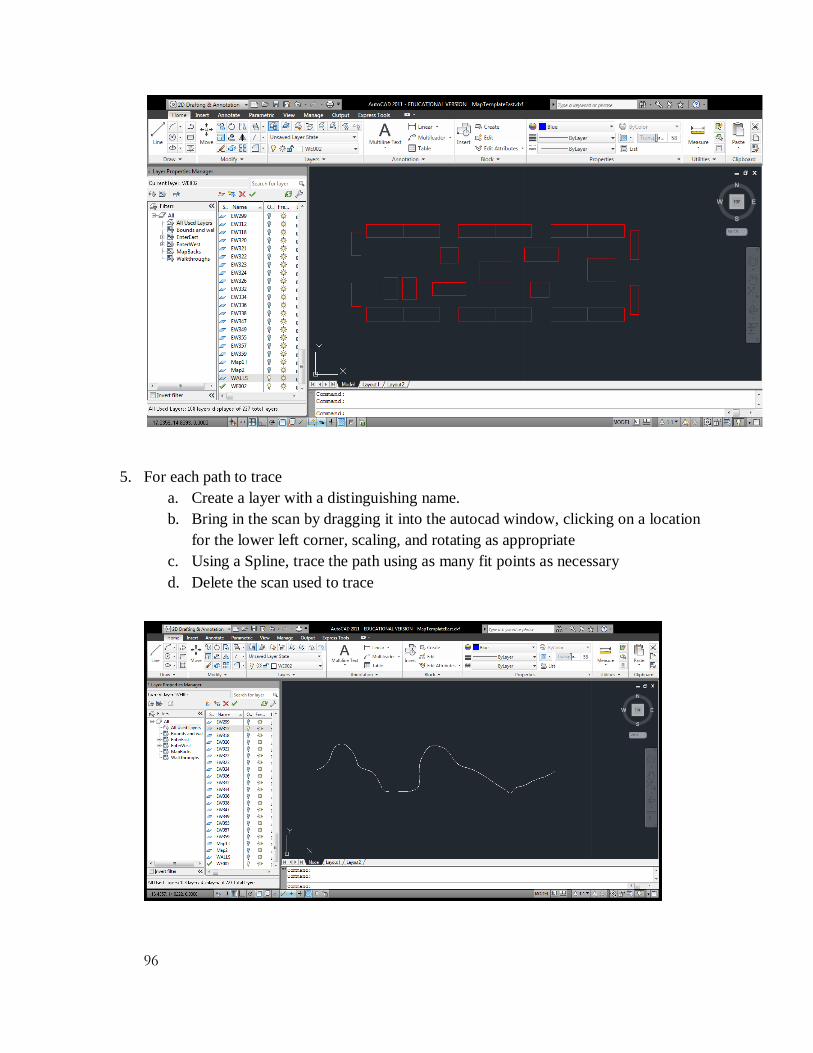
96
5. For each path to trace
a. Create a layer with a distinguishing name.
b. Bring in the scan by dragging it into the autocad window, clicking on a location
for the lower left corner, scaling, and rotating as appropriate
c. Using a Spline, trace the path using as many fit points as necessary
d. Delete the scan used to trace
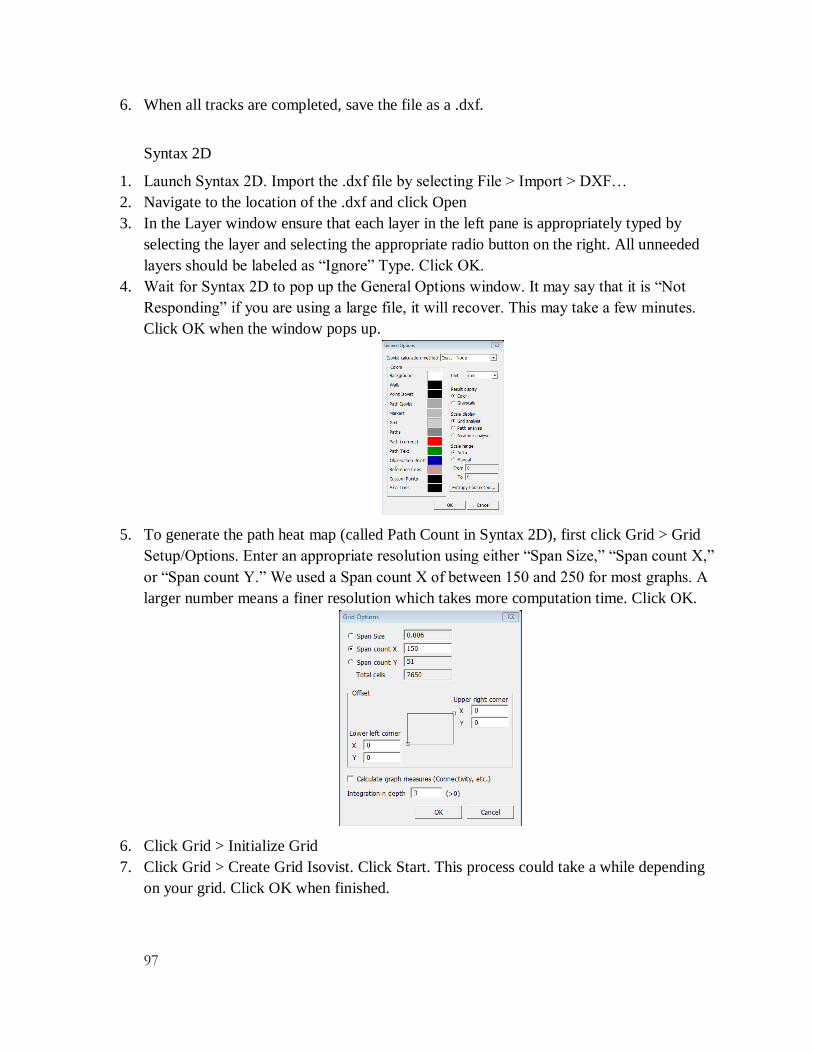
97
6. When all tracks are completed, save the file as a .dxf.
Syntax 2D
1. Launch Syntax 2D. Import the .dxf file by selecting File > Import > DXF…
2. Navigate to the location of the .dxf and click Open
3. In the Layer window ensure that each layer in the left pane is appropriately typed by
selecting the layer and selecting the appropriate radio button on the right. All unneeded
layers should be labeled as “Ignore” Type. Click OK.
4. Wait for Syntax 2D to pop up the General Options window. It may say that it is “Not
Responding” if you are using a large file, it will recover. This may take a few minutes.
Click OK when the window pops up.
5. To generate the path heat map (called Path Count in Syntax 2D), first click Grid > Grid
Setup/Options. Enter an appropriate resolution using either “Span Size,” “Span count X,”
or “Span count Y.” We used a Span count X of between 150 and 250 for most graphs. A
larger number means a finer resolution which takes more computation time. Click OK.
6. Click Grid > Initialize Grid
7. Click Grid > Create Grid Isovist. Click Start. This process could take a while depending
on your grid. Click OK when finished.

98
8. When completed, click Grid > Grid Options > Path Count to display the Visitor Path
Heat Map. The buttons below can be used to hide the paths, grid, etc. to show the map
more clearly.