exploring patient choice in gp services - gov.uk · exploring patient choice in gp services ......
TRANSCRIPT

1
© Ipsos MORI
Exploring patient choice in GP services December 2014
This research was commissioned and funded by Monitor

2
© Ipsos MORI
Aims and Methodology
Aims
This study was carried out by Ipsos MORI on behalf of Monitor, as part of Monitor’s review of GP services.
The survey explores what patients look for in a GP practice and whether and how patients exercise their right to
choose a GP practice.
The aims of the survey are to try and understand:
whether patients engage in actively considering their choice of GP services provider;
whether patients are able to assess which GP services provider best satisfies their needs; and,
whether patients are able to successfully change to a GP services provider which best meets their needs.
Methodology
Interviews were carried out by Ipsos MORI’s face-to-face omnibus survey.
3,315 interviews were completed with adults between 7th and 20th November 2014.
Data has been weighted to be representative of adults / GP patient population aged 15+ in England.

3
© Ipsos MORI
Convenience, access and quality are key considerations when choosing a GP
practice
• Most people are registered with a GP practice, and those that are tend to use it regularly
• 96% are currently registered with a GP practice.
• 75% of those who are registered have visited their GP practice in the last 6 months.
• Convenience of location, access and quality are the main things patients say they look for in a GP practice
• Proximity of the practice to their home (58%), how easy it is to get an appointment (57%) and good quality diagnosis and
treatment (41%) are the most common things people seek from a GP practice.
• However, when patients actually make a choice, convenience of location is the main consideration
• 77% of patients who have registered with their GP practice in the last 10 years say its location close to their home was the
main reason for choosing their GP practice.
• Most patients are satisfied with their GP practice and their expectations are largely being met
• One in ten patients (10%) are dissatisfied with their GP practice.
• The majority of patients say that their GP practice meets their expectations, particularly around aspects of convenience of
location and quality.
• However, a significant minority of patients feel their expectations around appointments are not being met by their current
GP provider
• At least three in ten patients say their practice is below their expectations for ease of getting an appointment (30%), being
offered appointments online (34%), being able to see the same doctor every time (35%) and being open evening and
weekends (46%).
• When patients are unable to get a GP appointment some say they would use urgent or emergency services instead
• 27% say they would go to a walk-in centre instead.
• 17% say they would go to A&E / hospital instead.

4
© Ipsos MORI
Although choice is seen as important, a lack of ‘engagement’ with choice
means few actually consider alternatives when choosing a GP practice
• The vast majority of patients say they are aware that they have the right to choose their GP practice, and think it
is important to be able to do so
• 91% know they have the right to choose a GP practice, while 89% know they have the right to ask to see a
particular GP within a practice.
• 92% think it is important to be able to make a choice about which GP practice to register with.
• However, when registering with a GP practice only a minority considered an alternative GP practice or
compared GP practices in their area
• Most patients who registered with their GP practice in the last 10 years did not consider any other practices at the
time that they registered (84%).
• 40% of these patients have never tried to compare GP practices, rising to nine in ten (88%) of those who have
been registered for more than 10 years.
• The majority of patients rate their current GP practice as average or above average, which may show that
patients are unaware of the true performance of their GP practice relative to others in their area
• 3% say that their GP practice is below average.
• 42% say their GP practice is average, 40% say their GP practice is better than average.
• A significant proportion of patients do not feel as though they have a choice of GP practice if they wanted to
change
• 29% do not feel they have a choice.
• 65% feel they have a choice of GP practice if they wanted to change.
• Worsening quality of diagnosis (for a serious illness) and dissatisfaction with care are the most likely reasons
to make patients change GP practice
• Though the availability of appointments and other quality and access issues are also important for some.

5
© Ipsos MORI
Most patients rely on word of mouth to compare GP practices rather than on available
information about GP practices’ performance
When comparing GP practices patients tend to rely on word of mouth rather than information available on
quality and access
60% of patients who compared GP practices relied on recommendations from family and friends.
Few use public sources of information when making these comparisons; 15% use the NHS Choices website
while just five per cent use GP patient survey results.
The majority of those who have used information on GP practice performance found it easy to find and
understand
However, information on quality of diagnosis and treatment was not as easy to find and understand

6
© Ipsos MORI
Majority of patients find registering easy, but there is room for making the
process simpler
The vast majority of patients find registering with a GP practice easy
88% of those who have registered with their GP practice in the last 10 years say they found it easy to do.
For the minority who found it difficult, they cite inconvenience and time as the main issues
20%* of these patients cite inconvenience of paperwork as an issue.
18%* cite both the time taken to transfer records and the number of procedures as issues.
A small number of patients who considered alternative GP practices when choosing their current GP
practice cite practice boundaries and being refused registration as main reasons why they did not
register with an alternative provider
21% of those who have registered with their GP practice in the last 10 years say their GP practice was the
only one they were in the catchment area for.
12% of these patients say they tried to register with another GP practice but were refused registration / they
were full.
* Please note small base size (34) so results should be treated with caution and seen as indicative only.

7
© Ipsos MORI
Overview

8
© Ipsos MORI
Interpreting the data
Interpreting the data
For each question, the responses to each answer are presented as a percentage (%).
The number of respondents answering (the base size) is stated at the bottom of each slide for each question.
For questions with fewer than 100 responses, we strongly recommend that findings are interpreted with caution.
Where results do not sum to 100%, or where individual responses (e.g. tend to agree; strongly agree) do not sum
to combined responses (e.g. strongly/tend to agree) this is due to rounding.
Text summaries have been included for particular subgroups of interest, only significant differences (at 95%
significance level) have been commented on in these cases.

9
© Ipsos MORI
Nearly all are registered with a GP practice, with many registered with
their current GP practice for a long time
7%
11%
9%
14% 47%
10%
1%
Less than a year ago 1 year up to and including 3 years ago
Over 3 years up to and including 5 years ago Over 5 years up to and including 10 years ago
More than 10 years ago Registered since birth
Don’t know – someone else registered for me
S1. Are you currently registered with a GP practice?
Q3. When did you register with your current GP practice?
Base S1: All respondents (3,315)
Base Q3: All respondents currently registered with a GP practice (3,192)
• Most people (96%) are registered
with a GP practice – significantly
more women than men are (98% v
94%).
• Households with children are more
likely to be registered than child-free
households (97% v 95%).
• Likelihood of being registered with a
GP practice increases with age –
those aged 15-24 least likely to be
registered (89% v 96% overall).
Up to and including
10 Years ago:
42%
More than 10
Years ago:
57%
S1. Are you currently registered with a
GP practice Q3. When did you register with your current GP practice?

10
© Ipsos MORI
84%
7%
2%
1%
1%
1% 1%
2%
1%
Moved home Dissatisfied with my previous GP practice / GP
Move to GP practice that delivers particular service I need Did not register with new GP
GP retired/passed away/left Location/nearer home
Surgery closed down Other (specify)
Don’t know / Can’t remember
When patients do change GP practice this is usually because
they have moved home
Q4. Why did you need to register with a new GP practice at that time?
• Moving home is the most common
reason to move GP practices – women
(86%), those aged 25-44 (89%) and full-
time workers (87%) are more likely than
others to give this reason (84% overall).
• People aged 65+ are more likely to
change GP practice due to being
dissatisfied with their previous GP
practice (17% v 7% overall).
Base Q4: All respondents registered with their current GP practice in the last 10 years (1,276)
Moved home:
84%
11
© Ipsos MORI
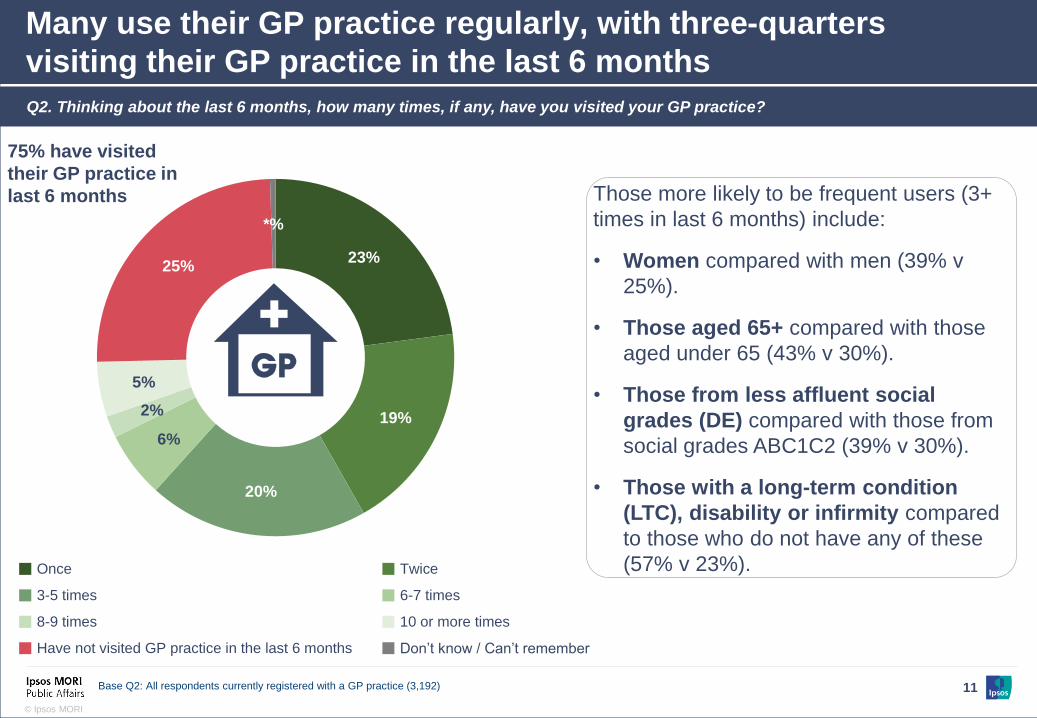
Many use their GP practice regularly, with three-quarters
visiting their GP practice in the last 6 months
23%
19%
20%
6%
2%
5%
25%
*%
Once Twice
3-5 times 6-7 times
8-9 times 10 or more times
Have not visited GP practice in the last 6 months Don’t know / Can’t remember
Q2. Thinking about the last 6 months, how many times, if any, have you visited your GP practice?
Base Q2: All respondents currently registered with a GP practice (3,192)
Those more likely to be frequent users (3+
times in last 6 months) include:
• Women compared with men (39% v
25%).
• Those aged 65+ compared with those
aged under 65 (43% v 30%).
• Those from less affluent social
grades (DE) compared with those from
social grades ABC1C2 (39% v 30%).
• Those with a long-term condition
(LTC), disability or infirmity compared
to those who do not have any of these
(57% v 23%).
75% have visited
their GP practice in
last 6 months

12
© Ipsos MORI
Location, accessibility and quality are the main things people say
they look for in a GP practice…
58%
57%
41%
26%
26%
17%
16%
14%
14%
13%
Close to home
Easy to get an appointment
Good quality of diagnosis and treatment
Good reputation
Friendly and attentive staff
Can see the same doctor every time
Male and female GPs available
Open evening and weekends
Clean
GP practice offers appointments with other healthcareprofessionals
Q1a. What are the main things you look for in a GP practice? Please read the list of 26 options and then select up to five options.
Base Q1a: All respondents currently registered with a GP practice (3,192)
Top 10 responses

13
© Ipsos MORI
… and are also the aspects that continued to be valued by those
who have been registered with their GP practice for a long time
25%
16%
12%
6%
4%
4%
3%
3%
2%
2%
2%
Good quality of diagnosis/treatment
Easy to get appointment
Close to home
Good reputation
Can see same doctor every time
Friendly and attentive staff
GPs speak my language
That it delivers a particular service I need
Male and Female GPs available
Offers appointments with other healthcareprofessionals
Clean
Q28b. You mentioned a number of aspects you value about your current GP practice. Which one of the following is the MOST
important aspect to you?
Top responses shown (2%+)
Base Q28: All respondents registered with their current GP practice for more than 10 years (1,916)
*Throughout the report we make comparisons by the type of area people live in. There are four definitions based on the density of population. The definitions for these are as
follows: <40,000 inhabitants = Rural; 40,000 – 100,000 inhabitants = Suburban; 100,000- <550,000 inhabitants = Urban; 550,000+ = Metropolitan
• Those aged 15-44 more likely than those
aged 65+ to value convenience of
location (24% v 10%).
• In contrast, those aged 65+ are more
likely than those aged 15-24 to value
quality of services (47% v 36%).
• Those with children in the household
more likely than those who do not have
any to value convenience of location
(20% v 13%).
• Those who live in metropolitan and
urban areas are more likely than those
who live in rural areas to value
convenience of location (16% v 10%)*.

14
© Ipsos MORI
However, when people actually make a choice of which GP practice to
register with, the majority do so based on its proximity to their home
77%
21%
16%
14%
11%
10%
9%
9%
8%
8%
Close to home
Easy to get an appointment
Good reputation
It was recommented to me by friends/family
Good quality of diagnosis and treatment
Male and female GPs available
Easy to get to
Friendly and attentive staff
Close to work
Close to a pharmacy
Q7a. Why did you choose to register at your current GP practice?
Base Q7a.: All respondents registered with their current GP practice in the last 10 years (1,276)
Top 10 responses

15
© Ipsos MORI
The majority of patients are mostly happy with their GP practice’s
offering
97%
97%
95%
94%
94%
94%
94%
93%
93%
93%
92%
89%
89%
3%
3%
5%
6%
6%
5%
6%
7%
7%
7%
8%
11%
10%
*%
*%
1%
*%
*%
1%
*%
Close to a pharmacy (295)
Clean (463)
Easy to get to (311)
Close to home (1,847)
Comfortable waiting rooms and facilities (153)
Male and female GPs available (510)
Can get the prescription I need (239)
Close to work (106)
Close to family (96)
Good reputation (855)
GPs speak my language (389)
Good quality of diagnosis and treatment (1,342)
Friendly and attentive staff (840)
Meets my expectations Below my expectations Don't know
Q1b. And for each of the things you look for in a GP practice, to what extent, if at all, does your current GP practice meet your
expectations?
Base Q1b: All respondents currently registered with a GP practice (numbers in brackets)
• However, when we asked patients to rate the performance of their GP practice only four per cent said their GP
practice was worse than average. This raises the question about how well informed patients are about the quality
of GP services.
16
© Ipsos MORI
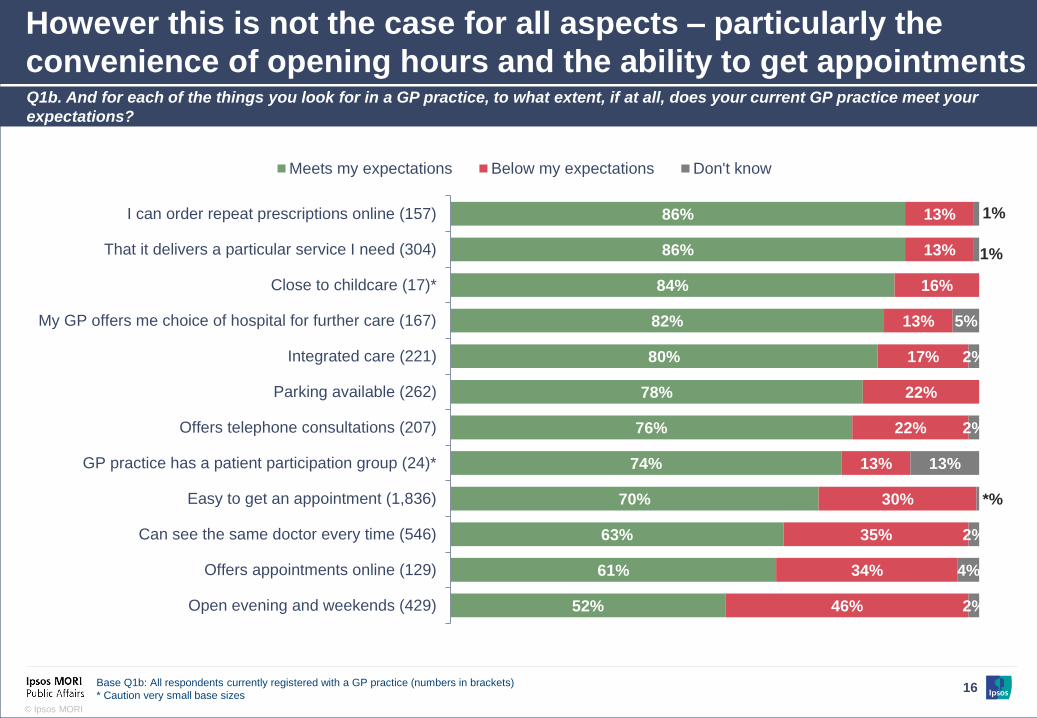
However this is not the case for all aspects – particularly the
convenience of opening hours and the ability to get appointments
86%
86%
84%
82%
80%
78%
76%
74%
70%
63%
61%
52%
13%
13%
16%
13%
17%
22%
22%
13%
30%
35%
34%
46%
1%
1%
5%
2%
2%
13%
*%
2%
4%
2%
I can order repeat prescriptions online (157)
That it delivers a particular service I need (304)
Close to childcare (17)*
My GP offers me choice of hospital for further care (167)
Integrated care (221)
Parking available (262)
Offers telephone consultations (207)
GP practice has a patient participation group (24)*
Easy to get an appointment (1,836)
Can see the same doctor every time (546)
Offers appointments online (129)
Open evening and weekends (429)
Meets my expectations Below my expectations Don't know
Q1b. And for each of the things you look for in a GP practice, to what extent, if at all, does your current GP practice meet your
expectations?
Base Q1b: All respondents currently registered with a GP practice (numbers in brackets)
* Caution very small base sizes

17
© Ipsos MORI
This is an issue as when appointments are unavailable, people
tend to seek treatment elsewhere rather than wait
27%
17%
16%
12%
6%
5%
4%
2%
2%
2%
2%
1%
1%
1%
1%
Go to a walk-in centre
Go to A&E / Hospital
Make an appointment with my GP for a different time
Call NHS 111
See an out-of-hours GP
Visit a pharmacy
Wait to see if the condition got worse
Not seek medical attention / self-medicate
Look for information / advice on NHS Choices / online
Ask friends / family for advice
Ask for a home visit
Go to surgery and wait to be seen
See another GP in the practice
Other
Don’t know
Responses 1%+
Q8/Q29. If you wanted to see a GP because you were unwell but were unable to get an appointment when you wanted, what would
you be most likely to do instead?
Base Q8/Q29: All respondents registered with a GP practice (3,192)

18
© Ipsos MORI
While most are satisfied with their GP practice, one in ten are
dissatisfied
Q21/Q36. Overall, how satisfied or dissatisfied are you with your current GP practice?
• People aged 65+ are more likely to be very
satisfied than those aged 15-54 (54% v 36%).
• Those from more affluent social grades (ABC1)
are more likely to be satisfied than those from
less affluent social grades (C2DE) (83% v
78%).
• Those who have a car in their household are
more likely to be satisfied than those who do
not (82% v 77%) – perhaps linked to the issues
around expectations of opening hours and
appointments.
• Those living in rural areas are more likely to be
satisfied than those in metropolitan areas (85%
vs 78%).
• Those registered with their GP practice for
more than 10 years are more satisfied than
those who registered with their practice in the
last 10 years (82% v 78%).
41%
40%
9%
7%
3%
*%
Very satisfied Fairly satisfied
Neither satisfied nor dissatisfied Fairly dissatisfied
Very dissatisfied Don’t know
Base Q21/Q36: All respondents registered with a GP practice (3,192)

19
© Ipsos MORI
Are respondents able to
engage:
Are respondents aware they
can choose their GP practice?

20
© Ipsos MORI
Most people know they have a right to choose their GP
practice and ask to see a particular GP
91% 89%
7% 10%
2% 1%
All registered with a GP practice All registered with a GP practice
YesNo
Q5/Q26. Do you think you have the right to…?
Choose your GP
Practice Ask to see a particular
GP within a practice
• People aged 65+ are more likely than younger
age groups (15-34) to report being aware that
they have a right to choose their GP practice
(94% v 88%).
• Women are also more aware than men that they
have this choice (92% v 89%).
• People who think choice is important are more
likely to be aware they are able to choose their
GP practice than those who do not think it is
important (93% v 73%).
• However, those who live in metropolitan areas are
less likely than those who live in urban, suburban
or rural areas to be aware that they have the right
to choose their GP practice (85% v 93%).
• There is less variation between sub-groups in
claimed knowledge of the right to ask to see a
particular GP within a practice.
• Those who have visited a GP practice at least 5
times in the last 6 months are more likely to know
they can ask to see a particular GP in the practice
than those who have not visited in this time period
(93% vs 86%).
Base Q5/Q26: All respondents registered with a GP practice (3,192)

21
© Ipsos MORI
Most also think having a choice of GP practice is important
Q6/Q27. How important, if at all, do you think it is to be able to choose the GP practice you register at?
• Women are more likely than men to
think that having this choice is very
important (61% v 52%).
• As do those aged 55+ compared with
those aged 15-24 (60% v 43%).
• Those from more affluent social grades
(AB) are more likely than other patients
to think this choice is not important (10%
v 8%).
• All those who moved to their current GP
practice because they were unsatisfied
with their previous GP think that choice
is important (100%).
57%
35%
6% 2%
*%
Very important Fairly important Not vey important
Not at all important Don’t know
Base Q6/Q27: All respondents registered with a GP practice (3,192)

22
© Ipsos MORI
Despite this, few actually exercise this choice; only a minority considered
alternative GP practices – with proximity to home a big reason for not doing so
57%
12%
11%
7%
6%
4%
3%
3%
2%
2%
GP practice is close to my home
GP practice I chose had a good reputation
It was recommended to me
My family were already registered with this practice
There are no other GP practices near my home or work / that are convenient to get to
GP practice is close to my family
GP practice is close to my job / workplace
Didn’t have time to think about alternatives
I did not know that I could choose a GP practice / GP
They are all the same
Q11. At the time when you registered with your current GP practice, did you consider any other GP practices?
Q12. What were the main reasons why you did not consider any other GP practices at that time?
Top responses shown
Base Q11: All respondents registered with their current GP practice in the last 10 years (1,276)
Base Q12: All respondents registered with their current GP practice for less than 10 years who did not consider any other GP practices at the time they registered with their
current GP practice (1,069)
16%
84%
*%
Yes No Don't know
Q11. Did you consider any other GP
practices? Q12. What were the main reasons why you did not consider any other
GP practices at that time?

23
© Ipsos MORI
Only a small number of patients appear to exercise choice; those who did consider
alternatives being most likely to compare on reputation / patient satisfaction
40%
25%
18%
16%
14%
13%
11%
9%
8%
7%
6%
I have never tried to compare GP practices
Reputation/patient satisfaction rates
Opening times
Quality of treatment
The number of GPs at the surgery
Quality of diagnosis
Availability of evening / weekend appointments
Transport links/length of time or travel distance
Availability of appointments with other heathcare professionals
What clinical services are available
Availability of male and female GPs
Q11. At the time when you registered with your current GP practice, did you consider any other GP practices?
Q15. When you were choosing your GP practice, did you try to compare GP practices for any of the following?
Base Q11: All respondents registered with their current GP practice in the last 10 years (1,276)
Base Q15: All respondents registered with their current GP practice in the last 10 years who considered other GP practices when they registered with their current practice (204)
16%
84%
*%
Yes No Don't know
Q11. Did you consider any other GP
practices?
Q15. When you were choosing your GP practice, did you try to
compare GP practices for any of the following?
24
© Ipsos MORI
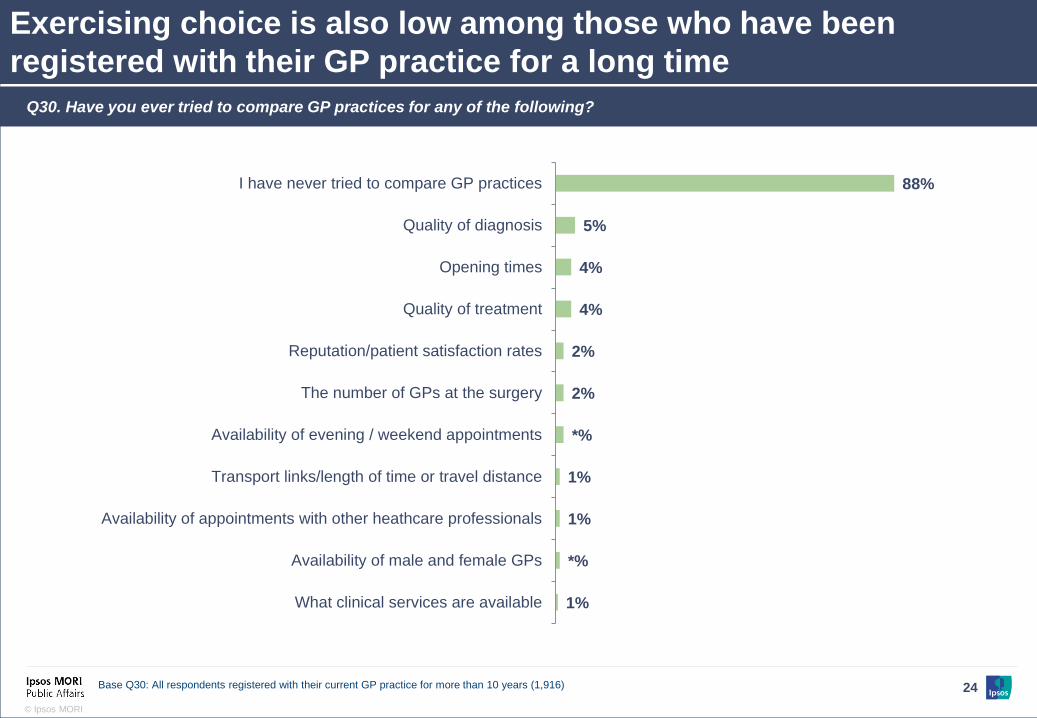
Exercising choice is also low among those who have been
registered with their GP practice for a long time
88%
5%
4%
4%
2%
2%
*%
1%
1%
*%
1%
I have never tried to compare GP practices
Quality of diagnosis
Opening times
Quality of treatment
Reputation/patient satisfaction rates
The number of GPs at the surgery
Availability of evening / weekend appointments
Transport links/length of time or travel distance
Availability of appointments with other heathcare professionals
Availability of male and female GPs
What clinical services are available
Q30. Have you ever tried to compare GP practices for any of the following?
Base Q30: All respondents registered with their current GP practice for more than 10 years (1,916)

25
© Ipsos MORI
The majority of patients rate their current GP practice as average or above average,
which may show that patients are unaware of the true performance of their GP practice
relative to others in their area
Q19/Q34. How would you describe your GP practice relative to other practices in your local area, would you say it was…?
40%
42%
3%
5%
10%
Better than average Average
Worse than average No other GP practices in my local area
Don’t know
Base Q19/Q34: All respondents registered with a GP practice (3,192)

26
© Ipsos MORI
A lack of alternatives, satisfaction with an individual GP or effort in changing
GP practice is preventing those who are dissatisfied from switching GP practice
19%
18%
14%
10%
9%
8%
6%
3%
2%
2%
2%
6%
1%
10%
41%
16%
4%
8%
3%
1%
3%
1%
3%
1%
2%
5%
There are no alternatives
Happy/satisfied with GP
Requires too much effort / I don’t have time
I didn’t know I could change GP practice
Don’t expect new GP practice to be better than current GP practice/ all the same
Currently in process of moving
I have complained and waiting to see if the situation improves / changes
This was the only GP practice I was in the catchment area for
I moved to a different GP within my GP practice
A new GP will not know me and my medical history
Lack of information to compare GP practices against each other
I won’t be able to see the same GP every time at the new GP practice
Other
Don’t know
Patients who haveregistered with theirGP practice in thelast 10 years
Patients who havebeen registered withtheir GP practice formore than 10 years
Q23/Q38. What is the main reason why you have not moved to a different GP practice?
Base Q23: All respondents registered with their current GP practice in the last 10 years who are dissatisfied with their current GP practice (129)
Base Q38: All respondents registered with their current GP practice for more than 10 years who are dissatisfied with their current GP practice (189)
Only 10% are
dissatisfied with
their current GP
practice
27
© Ipsos MORI
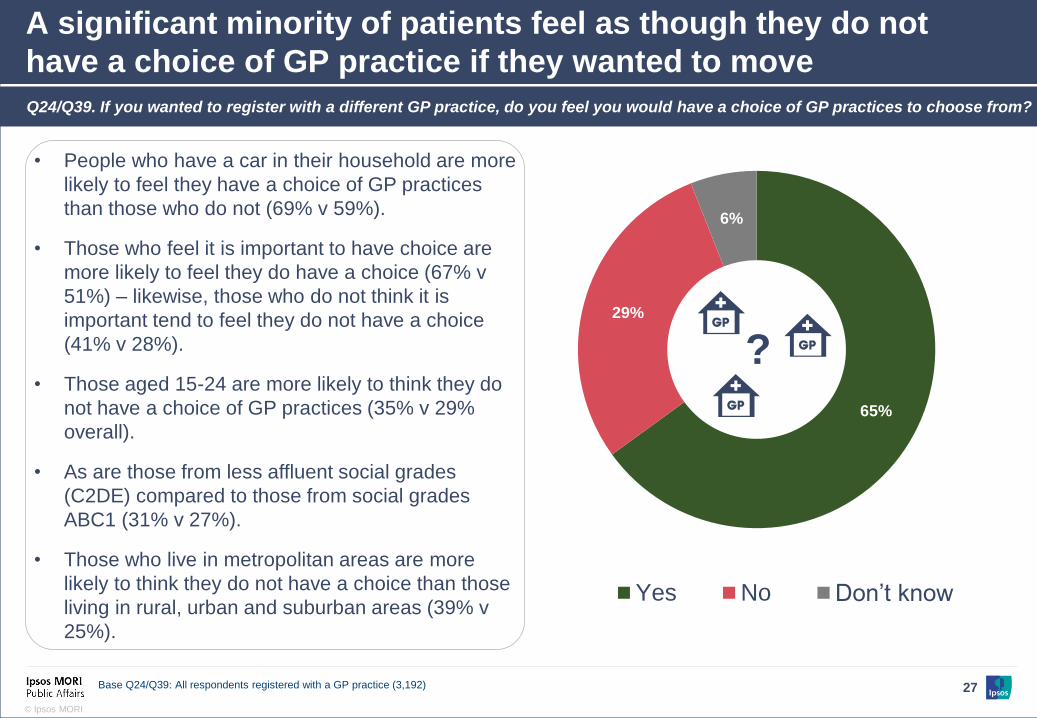
A significant minority of patients feel as though they do not
have a choice of GP practice if they wanted to move
Q24/Q39. If you wanted to register with a different GP practice, do you feel you would have a choice of GP practices to choose from?
• People who have a car in their household are more
likely to feel they have a choice of GP practices
than those who do not (69% v 59%).
• Those who feel it is important to have choice are
more likely to feel they do have a choice (67% v
51%) – likewise, those who do not think it is
important tend to feel they do not have a choice
(41% v 28%).
• Those aged 15-24 are more likely to think they do
not have a choice of GP practices (35% v 29%
overall).
• As are those from less affluent social grades
(C2DE) compared to those from social grades
ABC1 (31% v 27%).
• Those who live in metropolitan areas are more
likely to think they do not have a choice than those
living in rural, urban and suburban areas (39% v
25%).
65%
29%
6%
Yes No Don’t know
Base Q24/Q39: All respondents registered with a GP practice (3,192)
?

28
© Ipsos MORI
Few have actually considered moving GP practice
Q22/Q37. Have you ever considered moving from your current GP practice and registering with a different GP practice?
• Those who live in households with children
are more likely to have considered moving
GP practice than child-free households
(12% v 8%).
• Those aged 25-34 are most likely to
consider moving GP practices (14% vs 9%
overall).
• More frequent and heavier users of GPs
(i.e. those who have used their GP practice
5 or more times in the last 6 months) are
more likely to have considered moving GP
practice than those who have not used it at
all over the same period (14% v 8%).
• Those who are dissatisfied with their
current GP practice are more likely than
those who are satisfied to have considered
moving practice (31% v 5%).
9%
89%
2%
Yes
No
I did not know I could register at a different GP practice
Base Q22/Q37: All respondents registered with a GP practice (3,192)

29
© Ipsos MORI
Worsening of clinical quality is most likely to make people switch GP practice
Q25/Q40. I am going to read out a number of situations. For each please tell me how likely or unlikely you would be to move to a
different GP practice as a result.
Statement Total
Respondents who have
been registered with their
GP practice for less than
10 years
Respondents who have been
registered with their GP
practice for more than 10
years
If you found out that the diagnosis of a serious
condition (such as cancer) became less accurate 6.70 7.03 6.46
If you became less satisfied with the treatment
you received for your condition (e.g. back pain) 6.02 6.45 5.72
If the facilities at the GP practice became less
clean (for example the waiting room, toilets etc.) 5.54 5.93 5.27
If it became more difficult to get an appointment
when you wanted one 5.47 5.91 5.16
If it became less likely that you would be offered
a choice of hospital for further care 4.97 5.39 4.66
If it became more difficult to order repeat
prescriptions 4.83 5.26 4.52
If it became more difficult to see the same GP /
the GP you wanted to see 4.56 4.94 4.28
If the receptionist became less polite / friendly 4.12 4.58 3.79
• Those registered with their GP practice for more than 10 years are less likely to switch for any of the
situations, compared to those who registered with their GP practice in the last 10 years
Base Q25/Q40: All respondents registered with a GP practice (3,192)

30
© Ipsos MORI
Are respondents able to
assess their options?

31
© Ipsos MORI
Recommendations from family/friends and NHS Choices website are two key sources of
information for those registered with their GP practice in the last 10 years
55%
23%
15%
14%
11%
8%
5%
4%
Recommendations from family/friends
NHS Choices website
Visited GP practice to find out information
Phoned GP practice to find out information
GP practice website
Online GP survey results
Other
Don’t know / Can’t remember
Q16. And what were the main sources of information you used when you were comparing GP practices?
Base Q16: All respondents registered with their current GP practice in the last 10 years who used sources of information when comparing GP practices (121)

32
© Ipsos MORI
Whilst those registered with their practice for more than 10 years tend
to rely on their friends and family as a source of information
62%
19%
13%
10%
5%
3%
2%
1%
4%
5%
Recommendations from family/friends
Visited GP practice to find out information
Phoned GP practice to find out information
NHS Choices website
GP practice website
Own personal experience
Online GP survey results
My Health London website
Other
Don’t know / Can’t remember
Q31. And what were the main sources of information you used when you were comparing GP practices?
Base Q31: All respondents registered with their current GP practice for less than 10 years who used sources of information when comparing GP practices (236)

33
© Ipsos MORI
29%
19% 25% 27%
39%
38% 33%
47%
21%
27% 27%
14%
7% 11% 10%
8%
3% 3% 5% 4% 1%
2%
Opening times (107) Quality of diagnosis(128)
Quality of treatment(107)
Reputation / patientsatisfaction rates (83)
Those who have looked for information report that it is relatively easy to
locate for opening times and reputation / patient satisfaction rates
Q17/Q32. How easy or difficult was it to find information on…
Very easy Fairly easy Neither easy nor difficult Fairly difficult Very difficult Don’t know
Base: All respondents registered with their current GP practice who compared GP practices at the time they registered with their current GP practice – bases shown for each of the
aspects compared (in brackets). Respondents were also asked about availability of online / email access for making an appointment, but the base for these aspects are too small to
chart.
34
© Ipsos MORI
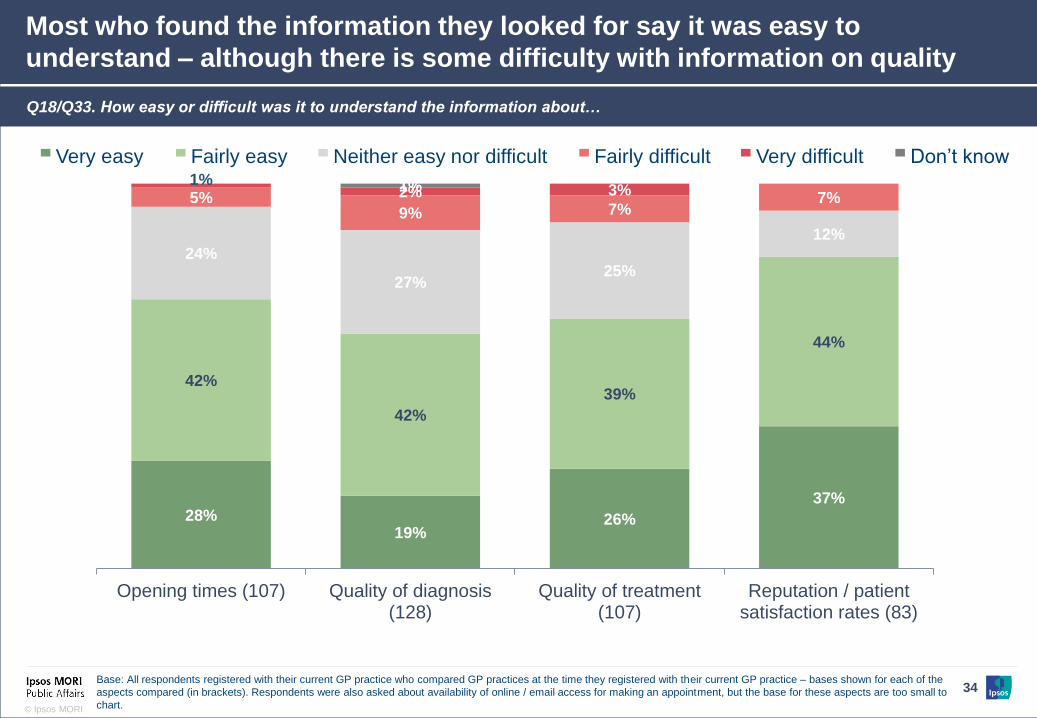
28% 19%
26%
37%
42%
42%
39%
44%
24%
27% 25%
12%
5% 9% 7%
7% 1%
2% 3% 1%
Opening times (107) Quality of diagnosis(128)
Quality of treatment(107)
Reputation / patientsatisfaction rates (83)
Most who found the information they looked for say it was easy to
understand – although there is some difficulty with information on quality
Base: All respondents registered with their current GP practice who compared GP practices at the time they registered with their current GP practice – bases shown for each of the
aspects compared (in brackets). Respondents were also asked about availability of online / email access for making an appointment, but the base for these aspects are too small to
chart.
Very easy Fairly easy Neither easy nor difficult Fairly difficult Very difficult Don’t know
Q18/Q33. How easy or difficult was it to understand the information about…

35
© Ipsos MORI
Patients tend to use public information when forming their opinion
on the service their GP practice provides
51%
25%
25%
4%
3%
2%
2%
My personal experience of other GP practices
A sense I got at the GP practice/gut feeling
Feedback from family/friends
Information available on performance of other GP practices(e.g. NHS Choices, GP Patient Survey results etc.)
Happy with present GP
Other
Don’t know
Answers over 2%
Q20/Q35. You said that you think your GP practice is better than/ worse than/average, why do you say that?
Base Q25/Q40: All respondents registered with a GP practice who would describe their practice as average, better than average or worse than average (2,734)
36
© Ipsos MORI
Are respondents able to
successfully switch?

37
© Ipsos MORI
The vast majority report registering with a GP practice as easy
54% 34%
9% 2%
*%
*%
Very easy Fairly easy
Neither easy nor difficult Fairly difficult
Very difficult Don’t know
Q9. How easy or difficult did you find registering with your current GP practice?
Those groups more likely to find registering
with a GP practice as easy include:
• Those aged 35+ – compared with
those aged 15-24 (91% v 80%).
• Those in more affluent social grades
(ABC1) – compared with those in social
grades C2DE (91% v 84%).
• Those with access to a car in their
household – compared with those who
do not (90% v 84%).
• Those who think their GP practice is
better than average – compared with
those who say it is average or worse
than average (92% v 85% and 70%
respectively).
Base Q9: All respondents registered with their current GP practice in the last 10 years (1,276)

38
© Ipsos MORI
Of the few who found it difficult, paperwork, time and
inconvenience are the main reasons why they say this
20%
18%
18%
14%
10%
6%
2%
28%
Inconvenience of filling in paperwork
It took a long time to transfer my files / records
Lots of procedures to go through
Inconvenience of having to visit the surgery to register
It was difficult to provide the relevant / required documents
I did not know my NHS number
I did not know where my local practices were/I could not find out which GP practices I
could register with
Other
Q10. For what reasons did you find registering with your current GP practice difficult?
Top responses shown (34)*
Base Q10: All respondents registered with their current GP practice in the last 10 years who found registering with their current GP practice difficult
* Caution small base size (34)
88% 9%
3% 1%
Easy
Neither easy nor difficult
Difficult
Don’t know
Q9. How easy or difficult did you find
registering with your current GP practice? Q10. For what reasons did you find registering with your current GP
practice difficult?

39
© Ipsos MORI
For patients who have moved GP practice, boundaries and full GP
practices appear to prevent some patients from exercising choice
21%
12%
1%
52%
2% 4%
1%
2% 5%
Only GP practice I was in the catchment area for Tried to register with another GP practice but they refused / were full
I expected that I would not be allowed to register I found that this was the best option
I thought registering with a new practice would be difficult GP practice close to home
Better / more modern facilities Recommendations
Other
Q13. What was the main reason why did you not register with any of the other GP practices you considered?
• Those without a car in their household
are more likely than those with a car to
say they are with their current GP as it is
the only one in their catchment area
(30% v 16%).
• People with a car tended to choose the
practice that was the best option for them
(59% v 39% without a car).
Base Q13: All respondents registered with their current GP practice in the last 10 years who considered other GP practices at the time they registered with their current GP practice
(204)

40
© Ipsos MORI
Appendix

41
© Ipsos MORI
Variation by region in patients currently registered with a GP
practice
98%
97% 97% 97% 97% 97%
96%
95% 95%
89%
South East(410)
North West(438)
WestMidlands
(445)
Yorkshireand Humber
(419)
EastMidlands
(217)
South West(326)
EnglandAverage(3,315)
North East(165)
London(619)
Eastern(276)
% Registered with a GP practice
Q1. Are you currently registered with a GP practice?
Base Q1: All respondents age 15+ (in brackets)
Significantly
lower than
average

42
© Ipsos MORI
Variation by region in whether location of GP practice meets
expectations
97% 96% 94% 94% 94% 94% 93% 92% 92% 90%
3% 4% 6% 5% 6% 6% 7% 8% 7% 8%
*% *% *% 2%
Yorkshireand Humber
(248)
North East(88)
EnglandAverage(1,847)
London(382)
South West(190)
WestMidlands
(223)
South East(236)
EastMidlands
(123)
North West(220)
Eastern(137)
Meets my expectations Below my expectations Don’t know
Q1B. To what extent, if at all, does your current GP practice meet your expectations? Close to home
Base Q1b: All respondents who selected reason at Q1 (in brackets)

43
© Ipsos MORI
Variation by region in whether quality of diagnosis and treatment
at GP practice meets expectations
93% 92% 92% 89% 88% 88% 88% 86% 85% 84%
7% 7% 8% 11% 10% 12% 12% 13%
14% 14%
1% 1% 2% 2% 1%
EastMidlands
(65)
North West(176)
South West(131)
EnglandAverage(1,342)
South East(180)
WestMidlands
(214)
Yorkshireand Humber
(173)
London(235)
Eastern(107)
North East(61)
Meets my expectations Below my expectations Don’t know
Q1B. To what extent, if at all, does your current GP practice meet your expectations? Good quality of diagnosis and treatment
Base Q1b: All respondents who selected reason at Q1 (in brackets)

44
© Ipsos MORI
Variation by region in whether ability to make an appointment at
GP practice meets expectations
79% 79% 78% 71% 70% 70% 68% 66% 62%
56%
21% 21% 21% 29% 30% 29% 31% 33% 38%
44%
1% *% *% 1% 2% *%
EastMidlands
(119)
South West(164)
Eastern(142)
WestMidlands
(258)
EnglandAverage(1,836)
South East(240)
North West(259)
Yorkshireand Humber
(254)
London(320)
North East(80)
Meets my expectations Below my expectations Don’t know
Q1B. To what extent, if at all, does your current GP practice meet your expectations? Easy to get an appointment
Base Q1b: All respondents who selected reason at Q1 (in brackets)

45
© Ipsos MORI
Variation by region in whether continuity of service at GP practice
meets expectations
49% 53% 57% 59% 59% 63% 64% 76% 77%
82%
51% 44% 40% 41% 40% 35% 34%
20% 23%
18%
3% 3% 1% 2% 1% 4%
North East(37)
South East(92)
North West(80)
London (46) Yorkshireand Humber
(83)
EnglandAverage
(546)
WestMidlands
(71)
EastMidlands
(28)
South West(68)
Eastern (41)
Meets my expectations Below my expectations Don’t know
Q1B. To what extent, if at all, does your current GP practice meet your expectations? Can see the same doctor every time
Base Q1b: All respondents who selected reason at Q1 (in brackets)

46
© Ipsos MORI
Variation by region in how satisfied patients are with their current
GP practice
75% 76% 77% 81% 82% 83% 84% 85% 85% 85%
14% 9% 10% 9% 8% 7% 8% 7% 10% 8%
11% 14% 13% 10% 10% 10% 8% 8% 5% 7%
London(589)
Yorkshireand Humber
(406)
South East(401)
EnglandAverage(3,192)
North West(426)
South West(318)
WestMidlands
(433)
EastMidlands
(212)
Eastern(250)
North East(157)
Satisfied Neither satisfied nor dissatisfied Dissatisfied
Q21/Q36. Overall, how satisfied or dissatisfied are you with your current GP practice?
Base Q21/Q36: All respondents registered with a GP practice (3,192)

47
© Ipsos MORI
Variation by region on how patients describe their GP practice
30% 37% 38% 39% 39% 40% 41% 44% 45% 46%
36%
51% 43% 40%
48% 42% 45% 40%
31% 33%
4%
6%
4% 1%
1% 3%
3% 4%
3% 4%
5%
1%
9% 6%
5% 5%
2% 3%
8% 5% 24%
4% 7% 13%
7% 10% 9% 9% 13% 12%
North East(157)
London(589)
South East(401)
Eastern(250)
East-Midlands(212)
EnglandAverage(3,192)
North West(426)
West-Midlands(433)
South West(318)
Yorkshire andHumber
(406)
Above average Average Below average There are no other GP praactices in my local area Don’t know
Q19/34. How would you describe your GP practice relative to other practices in your local area, would
you say it was…?
Base Q19/34: All respondents registered with their current GP practice (3,192)

48
© Ipsos MORI
A reduction in the quality of diagnosis (for a serious illness) and dissatisfaction with care
are the reasons people say they would be most likely to switch GP practice for
6%
10%
7%
12%
8%
12%
3%
4%
3%
4%
3%
6%
3%
4%
3%
5%
5%
6%
3%
4%
4%
4%
5%
6%
3%
3%
4%
4%
5%
5%
12%
10%
14%
15%
17%
15%
5%
6%
9%
8%
9%
8%
9%
7%
11%
12%
12%
11%
14%
13%
16%
14%
13%
11%
17%
16%
16%
12%
12%
9%
25%
22%
13%
10%
10%
9%
Up to and including 10 years
More than 10 years
Up to and including 10 years
More than 10 years
Up to and including 10 years
More than 10 years
0 = Very unlikely to move to a different practice 1 2 3 4 5 6 7 8 9 10 = Very likely to move to a different practice
7.03
6.46
6.45
5.72
If you found out that
the diagnosis of a
serious condition
(such as cancer)
became less
accurate
If you became less
satisfied with the
treatment you
received for your
condition (e.g. back
pain)
Mean
score
Q25/Q40. I am going to read out a number of situations. For each please tell me how likely or unlikely you would be to move to a
different GP practice as a result.
Base Q25: All respondents registered with their current GP practice in the last 10 years (1,276) – excluding don’t know
Base Q40: All respondents registered with their current GP practice for more than 10 years (1,916) – excluding don’t know
5.93
5.27
If the facilities at the
GP practice became
less clean (for
example the waiting
room, toilets etc.)

49
© Ipsos MORI
Availability of appointments, less choice of hospital care and difficulty in
getting repeat prescriptions are less likely to make people switch GP practice
9%
12%
12%
16%
11%
16%
4%
5%
4%
6%
5%
6%
4%
7%
5%
7%
6%
8%
5%
6%
6%
6%
7%
7%
4%
5%
4%
5%
5%
6%
17%
16%
21%
19%
19%
19%
10%
9%
9%
8%
11%
7%
12%
11%
10%
10%
10%
11%
14%
13%
13%
9%
11%
8%
11%
9%
8%
6%
10%
6%
10%
6%
9%
6%
6%
5%
Up to and including 10 years
More than 10 years
Up to and including 10 years
More than 10 years
Up to and including 10 years
More than 10 years
0 = Very unlikely to move to a different practice 1 2 3 4 5 6 7 8 9 10 = Very likely to move to a different practice
Q25/Q40. I am going to read out a number of situations. For each please tell me how likely or unlikely you would be to move to a
different GP practice as a result.
Mean
score
5.91
5.16
If it became more
difficult to get an
appointment when
you wanted one
Base Q25: All respondents registered with their current GP practice in the last 10 years (1,276) – excluding don’t know
Base Q40: All respondents registered with their current GP practice for more than 10 years (1,916) – excluding don’t know
5.39
4.66
If it became less
likely that you would
be offered a choice
of hospital for
further care
5.26
4.52
If it became more
difficult to order
repeat prescriptions

50
© Ipsos MORI
As are continuity of seeing the same GP or the politeness of
the receptionist
13%
17%
13%
20%
5%
8%
7%
10%
6%
9%
9%
11%
8%
8%
9%
9%
6%
6%
7%
6%
18%
16%
19%
17%
10%
7%
9%
7%
10%
8%
8%
8%
11%
10%
8%
6%
8%
6%
7%
4%
5%
4%
5%
3%
Up to and including 10 years
More than 10 years
Up to and including 10 years
More than 10 years
0 = Very unlikely to move to a different practice 1 2 3 4 5 6 7 8 9 10 = Very likely to move to a different practice
Mean
score
Q25/Q40. I am going to read out a number of situations. For each please tell me how likely or unlikely you would be to move to a
different GP practice as a result.
Base Q25: All respondents registered with their current GP practice in the last 10 years (1,276)
Base Q40: All respondents registered with their current GP practice for more than 10 years (1,916)
4.94
4.28
If it became more
difficult to see the
same GP / the GP
you wanted to see
4.58
3.79
If the receptionist
became less polite /
friendly

51
© Ipsos MORI
[email protected] | 0207 347 3323
[email protected] | 0207 347 3349
[email protected] | 0207 347 3094
© Ipsos MORI This work was carried out in accordance with the requirements of the international quality standard for market research, ISO 20252:2006 and with the Ipsos MORI Terms and Conditions which can be found here