exploring recent relatedness ibd and biparental ancestry
TRANSCRIPT

EXPLORING RECENT RELATEDNESS
IBD AND BIPARENTAL ANCESTRY
Peter Ralph and Graham Coop
Department of Evolution and EcologyUC Davis
June 11th, 2012, CIRMProbability, Population Genetics and Evolution

OUTLINE
INTRODUCTION
PROBABILITY: INHERITANCE THROUGH THE PEDIGREE
DATA: COMMON GENETIC ANCESTORS
WHEN DID THESE COMMON ANCESTORS LIVE?
NEXT STEPS

POPULATION HISTORY AND SPATIAL DYNAMICS
(from Feldman & Cavalli-Svorza)
Humans:I range expansion(s)I admixtureI adaptation locally and to local conditions
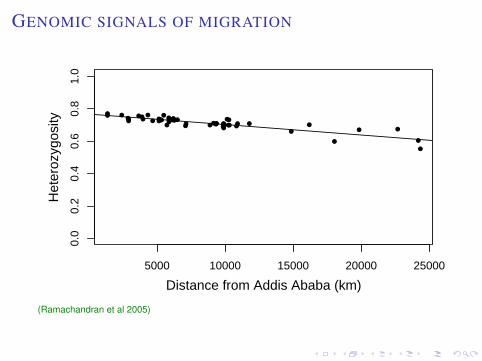
GENOMIC SIGNALS OF MIGRATION
● ●●●●●●●●●● ●
●● ●●●● ● ●● ●●●●
●● ●●● ● ●●●
● ●●●● ● ●●●
●●● ●
● ●
●
●
●
●
5000 10000 15000 20000 25000
0.0
0.2
0.4
0.6
0.8
1.0
Distance from Addis Ababa (km)
Het
eroz
ygos
ity
(Ramachandran et al 2005)

HISTORY FROM GENOMES
Goal: infer recent migrations and population structure.
Method:I Infer rates of shared ancestryI by identifying close relatives (10th–100th cousins)I How can we hope to do this?
I Unlikely that any given pair are 10th cousins, butI many ways to be related, andI between thousands of samples there are millions of possibly
related pairs.

MEIOSIS & RECOMBINATION (SEX)
I You have two copies of each chromosome,one from each parent.
I When you make a gamete, the copies recombine.I genetic distance: such that recombination rate is unityI units of centiMorgans (cM) ≈ 106 bp in humans

IBD: “IDENTITY BY DESCENT”
Definition: A block is IBD between two chromosomes if inherited fromthe same ancestor, without intervening recombinations.
Everyone is IBD everywhere, but the blocks are mostly short and old.

IBD: “IDENTITY BY DESCENT”
Definition: A block is IBD between two chromosomes if inherited fromthe same ancestor, without intervening recombinations.
IBD
Everyone is IBD everywhere, but the blocks are mostly short and old.

THE PEDIGREE AND IBD
Fragmentation-coalescencein the pedigree
I number ofgenealogical ancestorsfrom n generations agois 2n
I number of geneticancestors growslinearly
I since n meiosesdivides a 1Mchromosome into ∼ nblocks

THE PEDIGREE AND IBD
Fragmentation-coalescencein the pedigree
I number ofgenealogical ancestorsfrom n generations agois 2n
I number of geneticancestors growslinearly
I since n meiosesdivides a 1Mchromosome into ∼ nblocks

THE PEDIGREE AND IBD
IBDIBD
Fragmentation-coalescencein the pedigree
I number ofgenealogical ancestorsfrom n generations agois 2n
I number of geneticancestors growslinearly
I since n meiosesdivides a 1Mchromosome into ∼ nblocks

THE PEDIGREE AND IBD
IBDIBD
Fragmentation-coalescencein the pedigree
I number ofgenealogical ancestorsfrom n generations agois 2n
I number of geneticancestors growslinearly
I since n meiosesdivides a 1Mchromosome into ∼ nblocks

THE PEDIGREE AND IBD
Fragmentation-coalescencein the pedigree
I number ofgenealogical ancestorsfrom n generations agois 2n
I number of geneticancestors growslinearly
I since n meiosesdivides a 1Mchromosome into ∼ nblocks

WHAT WE ACTUALLY OBSERVE: MUTATIONSInfer IBD from long regions of agreement (relative to everyone else).

BLACK BOX IBD FINDING
I fastIBD inBEAGLE(Browning &
Browning)
I Fits a variablelength Markovchain to phasedata and inferIBD blocks.
I Power analysisI False positive
rate

ON TO SOME DATA
Data from POPRES:(Nelson et al 2008)
I 2257 Europeansafter removingoutliers and closerelatives
I have country andlanguage data: 40populations
I ∼500,000 SNPs

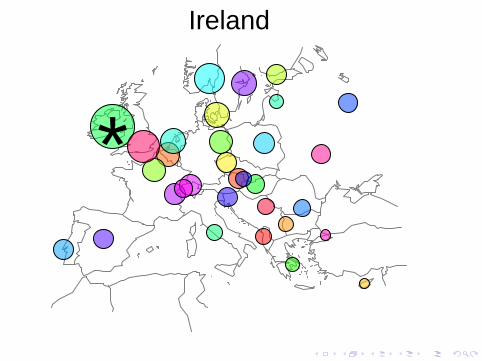
PLENTY OF IBD BLOCKSI 1877114 blocksI 831 blocks per indiv, 0.737 per pairI covering 30–250% of each individual
1
Ireland
United Kingdom
Swiss French
Swiss German
Spain
Portugal
Italy
Yugoslavia

PLENTY OF IBD BLOCKSI 1877114 blocksI 831 blocks per indiv, 0.737 per pairI covering 30–250% of each individual
11
Ireland
United Kingdom
Swiss French
Swiss German
Spain
Portugal
Italy
Yugoslavia

MEAN WITHIN-COUNTRY IBD RATES
Mean # blocks > 1cM
Italy 0.44France 0.62Belgium 0.97Swiss.German 1.32Swiss.French 1.01Germany 1.01Spain 1.14Portugal 1.40United.Kingdom 1.04Ireland 2.15Poland 3.40Yugoslavia 3.59
Ireland
*

Germany
*

Sweden
*

Poland
*

Albania
*

Turkey
*

Spain
*

Italy
*

DECAY OF IBD WITH DISTANCE
0 1000 2000 3000 4000
0.00
50.
020
0.05
00.
200
0.50
0(1,3]cM
# bl
ocks
per
pai
r
0 1000 2000 3000 4000
(3,5]cM
dist (km)0 1000 2000 3000 4000
>5cM
Decay with distance is steeper for longer (older) blocks.(circle size is sample size)

COMMON ANCESTORS ACROSS GEOGRAPHY
10 gens
distance
20 gens
r
Geographic distribution ofnth generation co-locatedancestors:
more recent⇒ more localized
Gaussian distribution⇒coancestry at distance r∝ C
n exp(− r2
nσ2
)

COMMON ANCESTORS ACROSS GEOGRAPHY
10 gens
distance
20 gens
r
Geographic distribution ofnth generation co-locatedancestors:
more recent⇒ more localized
Gaussian distribution⇒coancestry at distance r∝ C
n exp(− r2
nσ2
)

DECAY OF IBD WITH DISTANCE
0 1000 2000 3000 4000
0.00
50.
020
0.05
00.
200
0.50
0(1,3]cM
# bl
ocks
per
pai
r(3,5]cM
dist (km)0 1000 2000 3000 4000
>5cM
within Easternto Turkeyto Italy except Turkeywithin Western and to Eastern
. . . and differs by location.Italians have much slower decay (older?).

WHEN DID THESE COMMON ANCESTORS LIVE?
0 1000 2000 3000 4000
0.00
50.
020
0.05
00.
200
0.50
0
(1,3]cM#
bloc
ks p
er p
air
(3,5]cM
dist (km)0 1000 2000 3000 4000
>5cM
within Easternto Turkeyto Italy except Turkeywithin Western and to Eastern

BACK TO THEORY: EXPECTED IBD
I Fix pedigree (not recombinations), andtwo (sampled) chromosomes of length G.
I N(x) = #{ IBD blocks of length ≥ x}I Decompose N(x) =
∑T NT (x)
by paths T through the pedigreeI E[NT (x)] = K (|T |, x) 4−|T |, whereI |T | = # of meioses along T ,I 0 = R0 ≤ R1 ≤ . . .Rk = G
locations of recombinationsI K (t , x) = E[#{j : Rj − Rj−1 > x}].

EXPECTED NUMBER OF LONG IBD BLOCKS
Coalescent distribution: choose path T withprobability 4−|T |. Let |T | = τ .
Expected block length distribution is a linearfunction of coalescent distribution:
E[N(x)] =∑
t
P{τ = t}K (t , x)
If recombinations are Poisson,
K (t , x) = (1 + t(G − x))e−tx

MEAN BLOCK RATE AND COALESCENT DISTRIBUTION
Actually: mean IBD length distribution is a linear function of thecoalescent distribution, so with
µ(t) := P{τ = t},
N(x) is Poisson with mean density
− ddx
E[N(x)] =∑
t
µ(t)K (t , y)γ(y)∫ G
0f (y , x)dy + ξ(x)
=∑
t
µ(t)K̃ (t , x) + ξ(x)
with: power γ, false positive rate ξ, and error kernel f .
. . . maximum likelihood?

EXPLORING THE LIKELIHOOD RIDGE
● ● ● ● ● ●● ●
●● ●
●● ●
●●
●●
●●
●●
●●
●●
●●
●● ● ● ● ● ● ● ● ● ● ● ● ● ● ● ● ● ● ● ● ●
0 10 20 30 40 50
1e−
111e
−05
1e+
01
eige
nval
ue
0 20 40 60 80 100
−0.
3−
0.1
0.1
0.3
generations
2 4 6 8 10
−0.
4−
0.2
0.0
0.2
0.4
block length (cM)
(Poisson) log likelihood function
L(N|µ)
is very flat in many directions(“ridged”).
We’re doing inference, so: need toexplore it.
We do this by finding maximizers to
L(N|µ)− γ(µ)
for various penalizations γ.
Call µ′ feasible ifL(N|µ′) + 2 ≥ maxν L(N|ν).

COALESCENT DISTRIBUTION WITHIN THE UK:Grey is “best” solution; red is “smoothest” solution(differing by no more than 2 units of log likelihood).
0.0
1.0
UK−IE
0.0
1.0
UK−FR
coal
rat
e *
1000
00.
01.
0
UK−IT
0.0
1.0
UK−TK
0 1000 2000 3000 4000years ago

NUMBERS OF GENETIC COMMON ANCESTORS:Grey is “best” solution; red is “smoothest” solution(differing by no more than 2 units of log likelihood).
010
25
UK−IE
010
25
UK−FR
# ge
netic
anc
esto
rs0
1025
UK−IT
010
25
UK−TK
0 1000 2000 3000 4000years ago

COMMON ANCESTRY WITH THE BALKANS:
(“Balkans” is peninsula except Albanian speakers.)0
1025
Balkans
010
25
Balk−Alb
# ge
netic
anc
esto
rs0
1025
Balk−IT
010
25
Balk−FR
0 1000 2000 3000 4000years ago

SUMMARIES OF COMMON ANCESTRY
Box: “best” & “smoothest”; whiskers: most & least0
515
0−540 years ago
020
0
555−1500 years ago
# ge
netic
anc
esto
rs
010
0020
00
1515−2535 years ago
S/C PL RO/BG FR Bal UK IT

FROM WHENCE EASTERN IBD?Numbers of common ancestors shared with:Serbo-Croatian speakers
0−540 yaS/C 555−1500 ya 1515−2535 ya
Poland0−540 yaPL 555−1500 ya 1515−2535 ya

SIGNS OF PAST INVASIONS?
Hunnic empire, 1550ya:
credit: wikipedia

WHAT ABOUT THE GERMANIC MOVEMENTS?

WHAT ABOUT THE GERMANIC MOVEMENTS?0−540 yaFR 555−1500 ya 1515−2535 ya
0−540 yaIT 555−1500 ya 1515−2535 ya
0−540 yaIber 555−1500 ya 1515−2535 ya

FURTHER DIRECTIONS
I Further work on fragmentation-coalescence (in a pedigree?)I Look at the process along the genome.I Lack of fit at short lengths: improve the model.I Geographic method of coalescent distribution inference – more
than pairwise?I What does the coalescent distribution tell us, anyhow?

A PROBLEM WITH SMALL BLOCKS
Some assumptions of the model break down at short lengths:0.
00.
20.
40.
60.
8IB
D r
ate
1 2 3 4 5 6block length (cM)
UK−IE
false pos
15−540
555−1500
1515−2535
2550−4335
4350−7935
(we used blocks > 2cM for timing inference)

GEOGRAPHY: MORE THAN PAIRWISE
We find coalescent distribution: pairwise, nonparametric.Could fit more than pairwise in parametric model. Other ideas?

COALESCENT TIME DISTRIBUTIONS?
We can∗ infer distribution ofcoalescent time in thepedigree, across samples.
What does this tell us aboutshared history?
Intuition is mostly from:I n-deme migration
(usually, n = 2;rigorous)
I cartoons (not so much)∗ maybe
10 gens
distance
20 gens
r

SUMMARY
Patterns of recent relatedness between Europeans are shapedprimarily by:
I continuous, local gene flow – isolation by distanceI large population expansions – Slavs, Huns?I other historical factors – language, stability, . . .
Summaries of long shared tracts of genome from recent commonancestors:
I have lots of signal about recent history in modern datasetsI can be used to infer statistical properties of the recent pedigreeI but may have fundamental drawbacks

THANKS
Graham Coop
Steve Evans, Charles Langley, Yaniv Brandvain, Torsten Günther
Funding: NIH