exploring the cost of milk production & potential economies of scale in a dairy cooperative
DESCRIPTION
Exploring the Cost of Milk Production & PotentialEconomies of Scale in a Dairy CooperativeTRANSCRIPT

University of PennsylvaniaScholarlyCommons
Wharton Research Scholars Journal Wharton School
5-22-2012
Exploring the Cost of Milk Production & PotentialEconomies of Scale in a Dairy CooperativeParth ShahWH, UPenn
This paper is posted at ScholarlyCommons. http://repository.upenn.edu/wharton_research_scholars/93For more information, please contact [email protected].
Exploring the cost of milk production & potential economies of scale in a
dairy cooperative Parth Shah
May 22nd, 2012
2
Acknowledgements
This research would not have been possible without the support of following individuals &
institutions:
Mr. Sharad Pawar, Minister of Agriculture, Government of India
Mr. Bhagwat, Secretary to the Minister of Agriculture, Government of India
Dr. Vivek Bhandari, Former Director, Institute of Rural Management at Anand (IRMA)
Dr. Saswata Biswas, Professor, Institute of Rural Management at Anand (IRMA)
Dr. Durga Prasad, Associate Professor, Institute of Rural Management at Anand (IRMA)
Dr. Srilata Gangulee, Associate Dean, College of Arts & Sciences, University of Pennsylvania
Dr. Mekhala Krishnamurthy, Ph.D., University College London
Dr. Jeremy Tobacman, Professor, Wharton School of University of Pennsylvania
Dr. Santosh Anagol, Professor, Wharton School of University of Pennsylvania
Dr. Martin Asher, Director of Research and Scholar Programs, Wharton School of University
of Pennsylvania
Dr. Devesh Kapur, Director, Center for the Advanced Study of India, University of
Pennsylvania
Ms. Anita Mukherjee, Ph.D. Candidate, The Wharton School, University of Pennsylvania
Dr. Wallace Genser, Director, Center for Undergraduate Research and Fellowships, University of
Pennsylvania
Mr. S. S. Sundaran, Senior Executive of Public Relations, AMUL
Dr. Girish Sohani, President, BAIF Development Research Foundation
Dr. Ashok B. Pande, Vice President & Head of CRS, BAIF Development Research Foundation
3
Mr. Krishna Yeri, Head Librarian, Institute of Rural Management at Anand (IRMA)
Ms. Avani Bhatt, Associate Librarian, Institute of Rural Management at Anand (IRMA)
Mr. Kanubhai Parmar, Administration, Institute of Rural Management at Anand (IRMA)
People of the Villages of Navli, Napad, Sandesar, Bedva, Valasan, Vadod, and Chikodhra
Secretaries of the Village Milk Collection societies of Navli, Sandesar, Vadod, Valasan, and Bedva
Faculty and staff at Institute of Rural Management at Anand (IRMA)
Center for Advanced Studies of India
Wharton Research Scholars Program
Wharton Program for Social Impact
Center for Undergraduate Research and Fellowships
The Wharton School, University of Pennsylvania
Ministry of Agriculture, Government of India
Employees and Staff of AMUL
Assistants who helped me collect data
4
Abstract
Agricultural cooperatives have been a unique way of addressing the concerns of the
producers and consumers regarding pricing, storage, marketing, and other such activities of
bringing the commodity to the market. One of such sectors is the dairy, where there are
cooperatives in both the developed and developing countries. Amul Dairy, a milk cooperative in
India is, synonymous with quality of its milk and milk products as well as fair prices to both the
consumer and producer. In this study, we will examine the effectiveness of Amul by comparing
the procurement prices offered by the dairy cooperative to the cost of producing milk. In
addition, we will measure whether there are economies of scale in milk production.
Objective and Methodology
The primary objectives of this study are twofold: to analyze the effectiveness of a dairy
cooperative via comparison of procurement prices to milk production, and determine whether
there are economies of scale in milk production. Both of these objectives hold tremendous policy
implications not only for cooperative executives, but also for policymakers and rest of the dairy
private sector. Over the past couple of decades, India’s milk production has grown to make it one
of the largest milk producers in the world. Unlike rest of the major milk producers (primarily in
the developed world), India’s milk producers tend to be on a much smaller scale. Each milk
producers tends to only have one or two animals resulting in low economies of scale. This
particular scenario makes it even more critical for cooperative executives and policymakers to
know the cost of milk production faced by milk producers. Although there has been a prior
formula which approximates the cost of milk production by tracking national statistical
organizations, the particular formula does not take into account different types of fodder used by
the milk producer and more importantly does not calculate labor cost.
In contrast, the survey used in this study includes varying cost components (such as
fodder, shelter, cattle feed, labor cost) as well as varying amounts of milk produced during the
summer and winter costs. The survey was developed in coordination with milk producers as
well as researchers at Indian Institute of Rural Management. The results of this study are quite
significant because it will provide policymakers and cooperative executives with the current state
of the Indian dairy market. As the per capita income of India increases over the next couple of

5
decades, India’s dairy production will need to increase to meet the increasing demand. In my
recent meeting with the Agricultural Minister, he indicated that the government was considering
implementing a National Dairy Plan. The National Dairy Plan is aimed at increasing dairy
production by improving fodder access to farmers and improving the quality of cows and
buffaloes via artificial insemination. The government intends to spend $3B over the next ten
years to achieve this objective. The study will provide policymakers with a picture of different
cost pressures faced by farmers in the dairy sector. Furthermore, it will determine whether milk
production contains substantial financial incentives for new entrants to enter this activity or to
maintain the current ones. This is particularly important to the government as it strives to
increase milk production to meet the growing demand. Before we proceed any further, it would
be useful to the reader to learn about the structure of the cooperative, and nature of the
membership of the milk producer. I have discussed them in detail in an earlier paper on this
subject, and have included them here for the reader’s reference.
Structure
The Kaira District Union was later followed by milk collection centers and cooperatives
set up in other villages and districts of Gujarat. In 1973, all the cooperatives were organized
under an apex body the Gujarat Co-operative Milk Marketing Federation Ltd. (GCMMF). Amul
is the brand name of the milk and milk products that come out of GCMMF. It is a three-tiered
system consisting of milk collection centers at the village level, a collection of village collection
centers into a cooperative at the district level and the GCMMF at the top. Each district union
such as Kaira District Co-operative Milk Producers’ Union Ltd sets its own milk prices in the
district each year.
The cows and buffaloes give milk twice a day for about 8-9 months and 6-7 respectively.
The period, in which they provide milk, is known as the lactation period. The milk producer
makes his money from the animal during this period. He collects the milk from the cow or
buffalo, and goes to his local collection center. These local collection centers are in each village
(or in a couple of villages grouped together), where the dairy cooperatives’ employees measure
the amount of milk, % fat, and % SNF. There is a two-tier system in which the amount of money
paid to each individual is determined by whether it’s cow’s or buffalo’s milk, and the % fat in
the milk. The % SNF does not tend to vary as much, making the % fat the primary factor in

6
determining the price. Although cows produce more milk daily and for a longer period of time,
the milk has lower fat content. The cooperative does not prefer one animal over the other, and
does has procurement prices accordingly.
Figure 1: Structure of the Kaira District Milk Producers’ Union in State of Gujarat
Source: Indian Institute of Management - Ahmedabad
Nature of the Membership
Each member of the union is obligated to sell at least 1liter (L) of milk daily to the local
collection centre to continue the district union’s services. In addition, the membership of the
union costs a one-time fee of Rs. 60. These services include access to the veterinary doctor,
which charge a minimal amount of Rs. 60 per visit (compared to Rs. 300 per visit for a private
doctor), and the treatment is of no extra cost. There is no contractual obligation, and each
member can potentially sell milk over and above 1 liter to a private dairy. However, as there are

7
no private diaries in the nearby area, that privilege has remained a theoretical one. Most of the
milk producers (that we surveyed in the village) keep a portion of the milk for daily
consumption, since it is more expensive to buy the milk from Amul’s local collection center than
cost of producing it. In addition to the veterinary services, members also have access to Amul
Dan (nutrition enriched fodder for cows and buffaloes), which allows cows and buffaloes to
produce better quality of milk.
Purpose
As the above background suggests, the primary purpose of the Union was to provide fair
prices to the milk producers without alienating the consumer. Over the course of several years,
the Union has acted against price controls that kept the price of the milk low because that created
a disincentive for production. The Union has been successful in increasing the milk production in
the district primarily by bringing more milk producers into the union, rather than increasing each
individual member’s ability to produce more milk (for example, by getting a better breed of
cows). In recent years, Amul has expanded beyond its initial mission and offers services such as
fodder, education to members, extension of credit to members, etc.
Procedure
The survey was administered in seven villages: Navli, Napad, Chikodhra, Valasan,
Sandesar, Vadod, and Bedva between December 30, 2011 and January 3, 2012. These villages
were recommended by Amul to me based on my criteria of close proximity to Anand. The close
proximity of these villages ensured that the milk producers either provided their milk to the local
collection center or kept for domestic consumption. All of these villages are within a ten
kilometer radius of Anand, and as such, fall under the Kaira District Co-operative Milk
Producers’ union collection facilities. All of the milk collected in these villages flows to
Anand’s Amul dairy, and as a result, all the milk producers are reimbursed based on the same
pricing scale. I had conducted a similar survey in Navli back in May 2011. Based on my
interaction with farmers in Navli and feedback from the professors at Institute of Rural
Management at Anand, I constructed a more detailed questionnaire to be administered to the
farmers. The questionnaire was in Gujarati. A copy of the survey is included in the appendix in
both Gujarati and English. With the help of the four research assistants, I conducted this survey.

8
The survey was administered orally to the villagers and their responses were subsequently
recorded. The assistants were paid for their effort, and before the study was conducted, I gave
them detailed directions, and answered any questions they had. We conducted the survey after
the milk producers had dropped off their milk at the collection center in the morning and
evening. Furthermore, some of these responses were also recorded at the farmer’s dairy farms or
homes. In two of these villages (Chikodra and Napad), the data was only collected from farmers
at their homes or milk farms rather than at the collection facility.
Results
Table 1: Revenue Part of the Survey conducted in villages around Anand, Gujarat
*The unit of observation is a village household, that owns cows or buffaloes. If the household owns both types of animals,
income & expenses are divided based on the amount of revenue contributed by each animal.
**All the amounts are in liters and Indian Rupees.
Buffaloes Cows
Number of Villagers 222.00 129
Number of Animals 2.10 5.32
Daily Total Amount of Milk in Summer 8.82 40.08
Daily Total Amount of Milk in Winter 10.02 46.19
Daily Total Amount of Milk poured in the dairy in Summer 6.92 38.27
Daily Total Amount of Milk poured in the dairy in Winter 7.85 44.00
Amount of Fat 7.4% 3.9%
Number of Months Buffalo continously gives milk for 7.75 8.29
Number of Months between lactation periods 4.23 3.13
Number of Lactation periods during a buffalo's lifetime 9.55 9.89
How many buffaloes did you purchase? 1.03 4.21
Average Purchase Price of Buffalo 25,386.02 26,660.01
Do you keep the buffalo till it becomes old? 95% 90%
Do you sell the buffalo before it becomes old? 5% 10%
Selling Price of the buffalo? 22,378.79 24,722.00
Total Amount of Milk Produced in a year 2,192.61 12,170.34
Total Amount of Milk Sold to Dairy in a year 1,638.44 11,580.28
Total Amount of Annual Revenue from selling milk to dairy 52,933.05 229,035.77
Annual Deprecation cost of animal 5,864.72 18,579.85
Annual Salvage Costs of Animal 80,769.58 24,033.07
Average Amount of Annual Milk per animal 1,079.87 2,099.42
Total Raw Annual Revenue 61,202.72 229,035.77
Total Annual Bonus (20% of Raw Annual Revenue) 11,605.25 45,807.15
Total Trolley Revenue (1 Animal = Rs. 500/yr) 1,051.80 2,658.91
Total Cumulative Annual Revenue 73,807.50 277,501.84

9
Table 2: Expenses Part of the Survey conducted in villages around Anand, Gujarat
Buffaloes Cows
Expenses
Fixed Costs (Shetler, Electricity, and Water) 1,299.76 7,398.59
Feeding Costs
Total daily amount of Amuldaan fed to animals (kg) 5.67 22.22
Total daily amount of Dry Grass fed to animals (pura) 12.73 24.90
Total daily amount of Green Grass fed to animals (mandh) 1.94 4.37
Total daily amount of Makai Khor fed to animals (kg) 3.33 4.04
Total daily amount of Kapas Khor fed to animals (kg) 2.20 3.06
Total daily amount of Makai Phatri fed to animals (kg) 0.05 1.13
Total daily amount of Tuver Chuni fed to animals (kg) 0.01 2.09
Total daily additional feeding costs - 141.88
Total Annual Feed Costs 95,038.94 221,626.05
Medical/Insurance Expenses
Do your animals have insurance? 5% 9%
Average coverage per animal 25,583.33 3,527.13
Average annual premium per animal (in respect to coverage) 1,351.92 157.95
Number of Doctor visits in a year 2.30 1.79
Total Annual Medical & Insurance Expenses 428.23 5,981.03
Labor Costs
Total number of unpaid daily hours 2.33 9.81
Annual cost of daily unpaid labor 13,638.00 14,716.67
Annual Salary paid to hired individuals 678.01 7,112.38
Total Annual Labor Costs 14,316.01 21,829.05
Total Annual Costs (excl. labor) 102,022.70 245,756.27
Total Annual Costs (incl. labor) 116,338.70 289,141.49
Total Amount of Milk Produced in a year 2,192.61 12,170.34
Milk Cost (Rs./L) excluding labor 52.20 28.82
Milk Cost (Rs./L) including labor 62.00 33.42
10
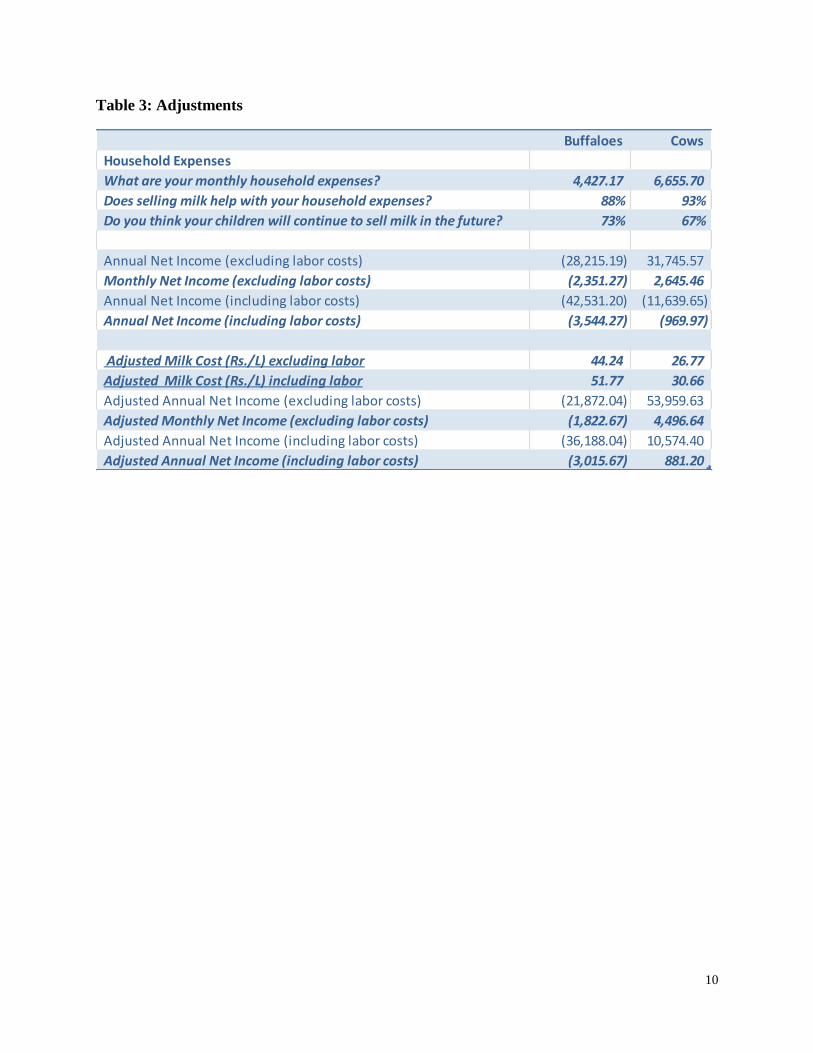
Table 3: Adjustments
Buffaloes Cows
Household Expenses
What are your monthly household expenses? 4,427.17 6,655.70
Does selling milk help with your household expenses? 88% 93%
Do you think your children will continue to sell milk in the future? 73% 67%
Annual Net Income (excluding labor costs) (28,215.19) 31,745.57
Monthly Net Income (excluding labor costs) (2,351.27) 2,645.46
Annual Net Income (including labor costs) (42,531.20) (11,639.65)
Annual Net Income (including labor costs) (3,544.27) (969.97)
Adjusted Milk Cost (Rs./L) excluding labor 44.24 26.77
Adjusted Milk Cost (Rs./L) including labor 51.77 30.66
Adjusted Annual Net Income (excluding labor costs) (21,872.04) 53,959.63
Adjusted Monthly Net Income (excluding labor costs) (1,822.67) 4,496.64
Adjusted Annual Net Income (including labor costs) (36,188.04) 10,574.40
Adjusted Annual Net Income (including labor costs) (3,015.67) 881.20

11
Figure 2:
Distribution of Number of Buffaloes Distribution of Number of Cows

12
Figure 3: Adjusted Cow Milk Cost vs. Three variables (Number of Cows, Amount of Cow
Fat, and Average Purchase Price of Cow)

13
Figure 4:
Distribution of Feed Costs Distribution of Feed Costs
(% of Total Costs ex. labor) (% of Total Costs inc. labor)
s

14
Table 4: Sensitivity Table for Feed Costs
Rate of Return = Annual Net Income/Investment
Investment = Market Price of Animals * Number of Animals
Estimated Market Price of Animal (Cow or Buffalo) = Rs. 25000 (from the survey)
Feeding Costs
Buffalo Monthly Net
Income (Adjusted)
Buffalo Rate of
Return (Annual)
Cows Monthly Net
Income (Adjusted)
Cow Rate of Return
(Annual)
0% 6,097.18 172% 22,965.39 210%
10% 5,305.19 152% 21,118.51 191%
20% 4,513.20 133% 19,271.62 173%
30% 3,721.21 113% 17,424.74 154%
40% 2,929.22 94% 15,577.86 135%
50% 2,137.23 74% 13,730.97 116%
60% 1,345.24 55% 11,884.09 97%
70% 553.24 35% 10,037.20 78%
80% (238.75) 16% 8,190.32 60%
90% (1,030.74) -4% 6,343.44 41%
100% (1,822.73) -23% 4,496.55 22%
15
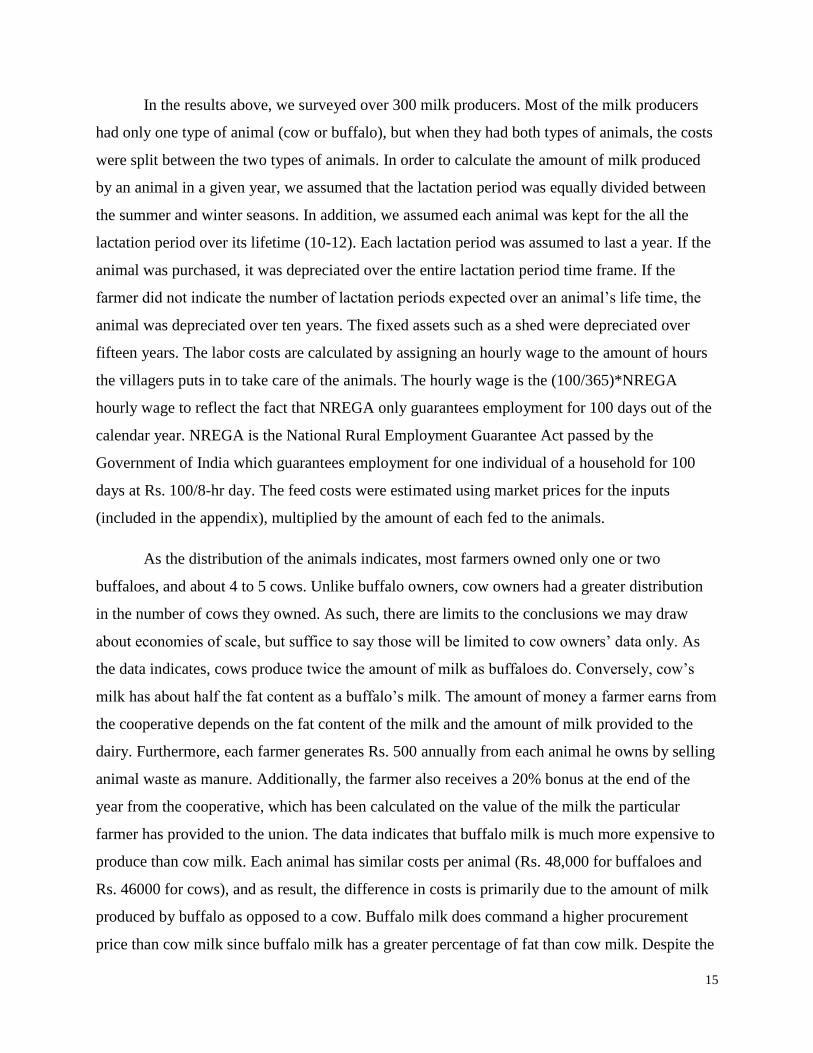
In the results above, we surveyed over 300 milk producers. Most of the milk producers
had only one type of animal (cow or buffalo), but when they had both types of animals, the costs
were split between the two types of animals. In order to calculate the amount of milk produced
by an animal in a given year, we assumed that the lactation period was equally divided between
the summer and winter seasons. In addition, we assumed each animal was kept for the all the
lactation period over its lifetime (10-12). Each lactation period was assumed to last a year. If the
animal was purchased, it was depreciated over the entire lactation period time frame. If the
farmer did not indicate the number of lactation periods expected over an animal’s life time, the
animal was depreciated over ten years. The fixed assets such as a shed were depreciated over
fifteen years. The labor costs are calculated by assigning an hourly wage to the amount of hours
the villagers puts in to take care of the animals. The hourly wage is the (100/365)*NREGA
hourly wage to reflect the fact that NREGA only guarantees employment for 100 days out of the
calendar year. NREGA is the National Rural Employment Guarantee Act passed by the
Government of India which guarantees employment for one individual of a household for 100
days at Rs. 100/8-hr day. The feed costs were estimated using market prices for the inputs
(included in the appendix), multiplied by the amount of each fed to the animals.
As the distribution of the animals indicates, most farmers owned only one or two
buffaloes, and about 4 to 5 cows. Unlike buffalo owners, cow owners had a greater distribution
in the number of cows they owned. As such, there are limits to the conclusions we may draw
about economies of scale, but suffice to say those will be limited to cow owners’ data only. As
the data indicates, cows produce twice the amount of milk as buffaloes do. Conversely, cow’s
milk has about half the fat content as a buffalo’s milk. The amount of money a farmer earns from
the cooperative depends on the fat content of the milk and the amount of milk provided to the
dairy. Furthermore, each farmer generates Rs. 500 annually from each animal he owns by selling
animal waste as manure. Additionally, the farmer also receives a 20% bonus at the end of the
year from the cooperative, which has been calculated on the value of the milk the particular
farmer has provided to the union. The data indicates that buffalo milk is much more expensive to
produce than cow milk. Each animal has similar costs per animal (Rs. 48,000 for buffaloes and
Rs. 46000 for cows), and as result, the difference in costs is primarily due to the amount of milk
produced by buffalo as opposed to a cow. Buffalo milk does command a higher procurement
price than cow milk since buffalo milk has a greater percentage of fat than cow milk. Despite the

16
higher procurement price, the data suggests that owning a buffalo results in negative income
(even before labor costs are factored in). One might suggest that there might be an inclination to
move away from buffaloes to cows; however, we don’t see that in the data. There are more
farmers who own buffaloes than cows. An explanation as to why this is the case is explored
further in the discussion section. In addition, the data indicates (not surprisingly) that most milk
farmers do not have insurance (95% and 90% for buffaloes and cows respectively). This might
be attributed to the fact that the insurance premium for any particular animal is Rs. 1200 for
coverage of Rs. 20,000. The insurance premium would reduce the monthly net income of
farmers (who own cows and generate positive income) by 20%, making it unlikely to be bought
by many. However, many farmers indicated that they would like to buy insurance, but insurance
companies no longer offer them. A possible explanation was offered by a professor at IRMA
who had done similar research in Rajasthan. He commented that there was a moral hazard
problem because the insurance company could not accurately judge the health of an animal, and
it was difficult to determine whether the animal died of natural causes or otherwise. As such,
most insurance companies had stopped issuing such contracts except in areas where there was a
strong local authority, which would hold the policyholder accountable. Another point to
highlight from the data is that the feed costs (includes all types of fodder and feed) comprises
over 90% of the total costs (ex-labor), and between 57%-95% of the total costs (inc-labor).
Discussion
Before we start detailed discussion on this topic, we should acknowledge the fact that
milking is a secondary source of income for most farmers. They are unlikely to pursue this
activity if it does not generate positive net income for their household. However, my data seems
to suggest the opposite when labor costs are included for both cows and buffaloes. Given that the
total costs including labor result in a negative income for both cow and buffalo owners, this is an
economic activity that generates wages (similar to a job) rather than a business. Let us for a
moment ignore labor costs and assume that whatever positive income the farmer generates is fair
compensation for his effort. The data indicates that buffalo owners still do not generate a positive
net income, yet most of the farmers are buffalo owners. Unless they are doing this activity for
altruistic purposes which we already know they are not, then there must be an alternative
explanation. One could point to the fact that the feed costs (which comprise almost all of the

17
costs) were improperly calculated. Maybe some of the fodder is not fed throughout the entire
calendar year. That would be a possible explanation, however, the results already control for it.
An alternative explanation could either be that the farmers have exaggerated the amount of
fodder they feed the animals or that most farmers do not pay the market prices of fodder. As the
sensitivity table indicates, if the fodder costs are 50% of what I have estimated them to be, a
buffalo owner will generate Rs. 1100 (of monthly income) for one buffalo and Rs. 2400 for one
cow. The results are similar to what I found in my earlier study in which I indicated that the
margins for cow and buffalo milks are similar, and as a result, one prefers the animal with the
higher milk output. The results indicate that there should be an incentive away from buffalo
ownership towards cow ownership. However, there is no way to measure this trend unless one
has data about animal ownership over the years to see whether such a trend is taking place. If in
fact, the true fodder costs faced by many of these farmers are 50% of what I have estimated,
milking remains a profitable enterprise. However, if the costs are closer to what I estimate, then
it is likely that many of these animal owners will exit the business in the upcoming years.
Interestingly, a couple of farmers commented on the fact that if one had to buy all the ingredients
at the prevailing market price, they would not make any money. This would suggest that many
farmers buy at least some of these ingredients at below market prices. Many farmers grow their
own dry and green grass, which make up over 50% of the fodder costs, at 20% of the market
prices for those ingredients. The value of 20% of the market price only includes the price of
seeds, fertilizer, and water required to grow these ingredients. It does not include the price of the
land in its computation. For the purposes of this activity, we have assumed that the farmer
already owns this land and is not using it for any other purposes, diminishing the possible
opportunity cost. By growing their own dry and green grass, the overall fodder costs are closer to
the 50% threshold in the sensitivity table, leading to lucrative rates of return (74% and 114% for
buffaloes and cows) and significant secondary income. If one is a landless farmer, the only way
for one to make money in the milking enterprise is to receive certain ingredients at a below
market cost. It is certainly the case that some farm hands (who are landless) are allowed to take
some green and dry grass with them to feed their animals at little to no cost. It is likely the case
that overall feed costs for them are closer to 70-75% of the estimated feed costs, making it just
the case that milking is a profitable enterprise. Most of the landless owners are ones who own

18
buffaloes rather than cows. If the farm hands are no longer allowed to take these grasses at little
or no cost, they will likely be driven out of the milking enterprise.
The above analysis assumes that milk procurement prices will not be increasing any time
soon. Milk demand is expected to rise 29% over the next five years to 150 million tones, where
as production is not expected to ramp up as quickly. This will put an upward pressure on the end
price the consumer has to pay, which will end up benefiting the milk farmers. The increased
demand on milk will cause the supply side to ramp up as well. If that is so the case, there will be
increased demand for feed. The supply of feed will determine how high its price can go, which
can potentially diminish the overall profit opportunity in the milking business. If the profit
opportunity does survive, it is likely the case that the consumer will end up paying significantly
higher prices for milk than he is currently paying. It is likely that the supply of feed is limited as
well given that India is primarily utilizing its irrigable land for agricultural purposes for humans
rather than growing fodder. What is one to do in such a scenario?
One may state that higher prices for a commodity due to increased demand and low
supply is basic economics and hence, are justified. However, one ignores the nutritional
importance of milk in the Indian diet, emphasized by milk producers setting aside a portion for
their children. It is an important source of protein and other vitamins, which might make it
difficult to replace in a vegetarian diet. Many Indian consumers, especially lower-income ones,
of milk may no longer be able to afford the commodity because of higher prices. The Indian state
might be truly worried about this particular aspect of the problem if the prices truly start to make
milk unaffordable to wide swath of the population.
There are a number of ways in which the Indian state might respond to this problem. In
the short-run, the Indian state could open up the domestic milk market to the rest of the world in
a limited manner. There could be a quota of importing milk powder to meet the increased
demand and keep a check on prices. For example, if there is a gap between production and
consumption of 10 million tones, the government could set a quota of 7 million tones. The
remaining 3 million tones would put upward pressure on the prices, creating an incentive for
milk farmers to ramp up production as the milk prices continue to rise, albeit at a slower pace.
Secondly, the cooperative establishment could incentivize milk farmers to increase productivity
of their animals by providing low interest loans. There is a lot of room to increase the

19
productivity of Indian cows and buffaloes. According to my data, the buffaloes produce on
average between 4-5 liters of milk in a day. A recent article cited that the government of Punjab
was taking steps to allow importation of Pakistani buffaloes, which produce 36 liters of milk in a
day. A report back in 1996 stated that high yielding animals are likely to consume more fodder
and feed than the animals they are replacing. The cooperative should likely target farmers who
already own land because their feed costs are 50% of the market value of the feed. One could
also suggest that the cooperative could encourage increased ownership of animals. However, the
data (at least for the cow owners) indicates that having a greater amount of animals does not lead
to lower cost. As we stated later, the conclusions one can draw from this are limited since the
distribution of the number of cows owned by milk farmers is quite skewed. This means that there
are few savings to be drawn from having a greater number of animals. However, having a greater
number of animals incentivizes the farmer to set aside a piece of his land particularly for fodder
production reducing his overall costs. If he doesn’t have a greater number of animals, setting
aside a piece of land might result in a higher opportunity cost and he may decide against doing
so.
Thirdly, since the supply of the irrigable land that can be set aside for fodder is limited,
the government might feel the need to subsidize fodder. However, I argue there is little need to
do so. The higher demand for fodder will be an incentive itself to farmers in the form of higher
prices. Milk producers, who own land, will set aside more of their land to produce fodder
pushing down its demand. The government could create incentives for farmers who produce
fodder to improve the productivity of fodder farms, and form partnerships with private players to
set up additional feed processing facilities.
Government and Cooperative Response
As discussed in the introduction, the government has moved in this regard by introducing
a National Dairy Plan, the first phase of which is being partly funded by the World Bank. The
plan is aimed at increasing the quality of the animal through artificial insemination, and setting
up plants to augment cattle feed. Though the dairy plan does state so otherwise, the government
could also consider investing in research to increase the yield per acre of fodder and feed in
addition to setting up feed plants.

20
I had the opportunity to share my preliminary findings with Mr. Rahul Kumar, Managing
Director of Kaira District Co-operative Milk Producers’ Union Ltd. He mentioned that he too
expected milk demand to double in the next decade. He expects consolidation in the milking
arena from smaller producers to medium size producers and increase in number of milk farms. In
order to meet the new demand, there will be need to be increase in the number of
animals/producer as well as an increase in the productivity of each of those animals. He
envisions increased productivity through higher breed of cows, and introduction of milking
machines (which cost Rs. 48000 and can milk four cows at a time, and are subsidized to cost Rs.
24000 to a farmer). Amul is taking steps to support the transition from smaller (1-2 animals)
which constitute 80% of Amul’s procurement to larger farmers which constitute about 20% of its
procurement. It is envisioning giving smaller milk coolers to milk farmers and collecting their
output directly, instead of those milk producers visiting their milk dairy (resulting in higher
transportation expenses and wastage of time). Furthermore, the cooperative has partnered with
banks to provide low cost loans to farmers, who are deemed credit worthy by their local village
society. The credit worthiness of farmers is determined by the secretary of the village milk
collection society, who oversees the daily collection of milk in the local village dairy. These
loans cost roughly 10% (1% above the existing rate) instead of the loans a farmer would be able
to get otherwise (at 13-14%) if he is able to pass all the hurdles the banks throw at him. Amul
facilitates farmers getting loans by guaranteeing that they will pay by deducting their principal
and interest from the amount of milk they pour at the dairy. Loan is necessary because most of
these farmers (80% who own 1-2 animals) do not accumulate capital over the course of the year
through selling of milk because the net income they generate through this activity goes into
running their households. Thus loans are necessary in order to buy a better breed and quality of
animals (which cost more) as well as to increase the number of animals they currently own. Mr.
Kumar agreed with the fact that there will be consolidation over the next 10 years as individuals
realize the economies of scale and they will move in this direction due to high labor and feeding
costs. He also agreed with the finding that individuals who are able to sustain this activity need
to have some amount of token land where they can grow some of the fodder because home
grown fodder costs significantly less than (1/5 of market price) the price it is available in the
market.
Possible Challenges

21
The above steps face a couple of challenges, excluding the ones pertaining to
implementation.
1) Real Estate Prices: In the area that I surveyed, real estate prices have skyrocketed in the past
few years. According to farmers, farmers with land are selling a portion of their land holdings,
which are being converted from agricultural to residential land diminishing the overall land area
for agriculture. This will result in a local shortage of fodder, and put an upward pressure on
fodder prices. Even if the upward pressure on prices does not materialize, it will force several
milk producers to purchase fodder at market prices diminishing their net income and some
instances even making milking unsustainable. When I discussed this phenomenon with Mr.
Rahul Kumar, he stated that high real estate prices are prevalent only in villages in close
proximity to urban centers. He stated that farmers internally are not selling their land because
there are few purchasers of those land holdings. However, this problem does result in the need to
produce more fodder from a smaller pool of irrigable land. The dairy plan could potentially also
focus improving the productivity of the remaining irrigable land set aside for fodder and cattle
feed.
2) Rate of Return: As discussed in the above paragraph, land prices affect the rate of return that
is required by farmers to be in this business. If a farmer has a choice between either earning 9%
(fixed deposit rates in India) on the money he has received by selling the land or milking, it will
depend on the rate of return. In the sensitivity table, the rates of return were calculated only for
an annual year. In the following example, I calculate a return for a piece of land that the farmer
could use for his milking enterprise. The cost of construction of a shed would Rs. 1 Million and
purchasing 10 cows would cost anywhere between Rs. 250,000 – Rs. 400,000. Let us use the
market price that we used earlier which is Rs. 25, 000 for an animal. We will peg the monthly net
income earned from an animal at Rs. 2500, and multiplied by 10 each month will result in a
monthly income of the farm of Rs. 250,000. We realize that the rate of return is a comfortable
20%, and the farmer would be happy to pursue such an activity. The rate of return calculated in
this instance is an internal rate of return. However, we must not forget the fact that this would
elevate milking from a secondary source of income to a primary source of income. We must also
remember that milking would experience higher volatility than placing one’s money in a fixed

22
deposit account. However, the differential is large enough that the farmer would be tempted to
enter the milking industry.
3) Labor Shortage: In the above example, we have calculated monthly net income excluding
labor costs. We have operated under the assumption, that this activity will be pursued by
members of the household who otherwise have no other outlet to generate activity. However, this
would not be a correct assumption when discussing a milk farm. The family is likely to hire a
farm hand, and due to labor shortages in the area, likely to pay him around Rs. 4000/month to
take care and run the enterprise. Let us see how that affects internal rate of return.
Construction of Shed
-1,000,000
Purchasing 10 Cows -250,000
Income in Year 1 252000
Income in Year 2 252000
Income in Year 3 252000
Income in Year 4 252000
Income in Year 5 252000
Income in Year 6 252000
Income in Year 7 252000
Income in Year 8 252000
Income in Year 9 252000
Income in Year 10 252000
Rate of Return (IRR) 15%
Construction of Shed -1,000,000
Purchasing 10 Cows -250,000
Income in Year 1 300000
Income in Year 2 300000
Income in Year 3 300000
Income in Year 4 300000
Income in Year 5 300000
Income in Year 6 300000
Income in Year 7 300000
Income in Year 8 300000
Income in Year 9 300000
Income in Year 10 300000
Rate of Return (IRR) 20%

23
The inclusion of labor costs reduced the internal rate of return by 25%. If the farmer has to pay
the farm hand a Rs. 1000/month, IRR drops to 14%. The IRR in milking is still higher than that
rate of return offered by the checking account, but if he sells his land for a high enough price, his
absolute monthly income could be higher than the one generated via milking.
Conclusion
Though the above steps might suggest that the government is intervening heavily in the
dairy market, such is not the case. The market is still what dictates the steps the supply side of
the equation might take to rectify the problem. The above policies allow the sector to be ready
for the changes that are likely to occur over the next few years. The sector will likely make these
changes regardless due to the upward price pressure, but these policies may allow certain
segments of the population to continue to be able to afford and consume milk. The reader should
be aware of the fact that the cooperative studied in this case is one of the most productive,
successful dairy cooperatives in India and take that into consideration when extrapolating the
results of this study.
24
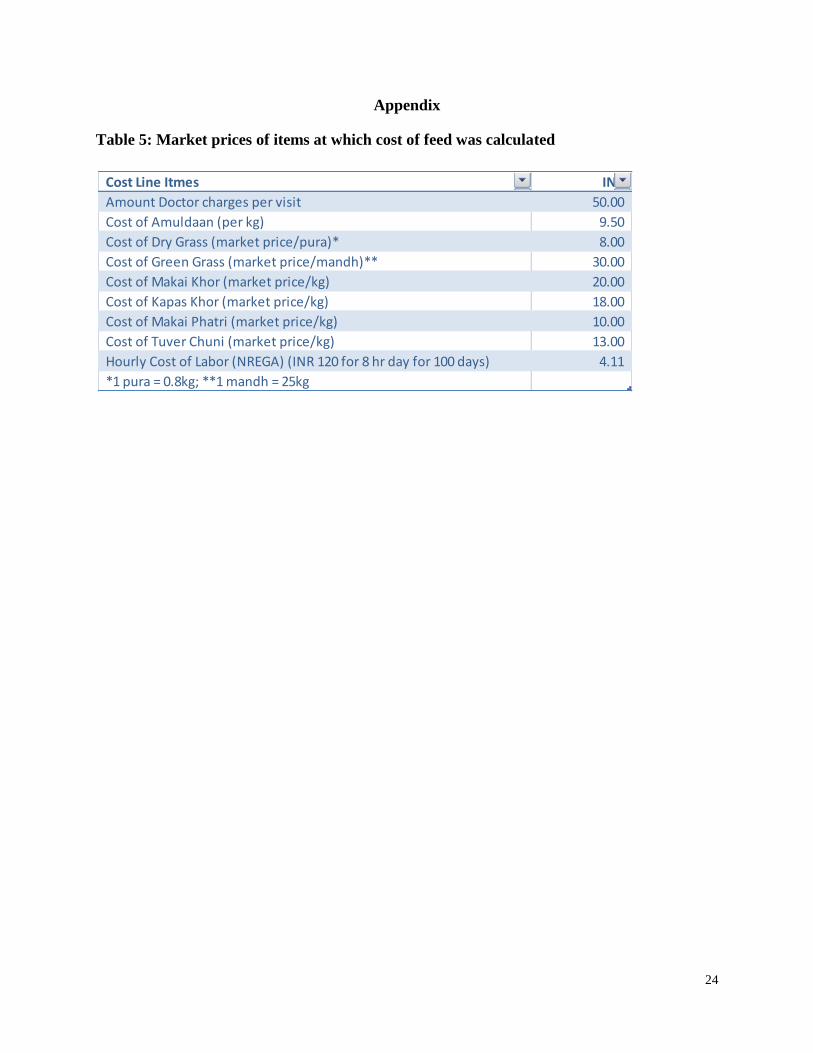
Appendix
Table 5: Market prices of items at which cost of feed was calculated
Cost Line Itmes INR
Amount Doctor charges per visit 50.00
Cost of Amuldaan (per kg) 9.50
Cost of Dry Grass (market price/pura)* 8.00
Cost of Green Grass (market price/mandh)** 30.00
Cost of Makai Khor (market price/kg) 20.00
Cost of Kapas Khor (market price/kg) 18.00
Cost of Makai Phatri (market price/kg) 10.00
Cost of Tuver Chuni (market price/kg) 13.00
Hourly Cost of Labor (NREGA) (INR 120 for 8 hr day for 100 days) 4.11
*1 pura = 0.8kg; **1 mandh = 25kg
25
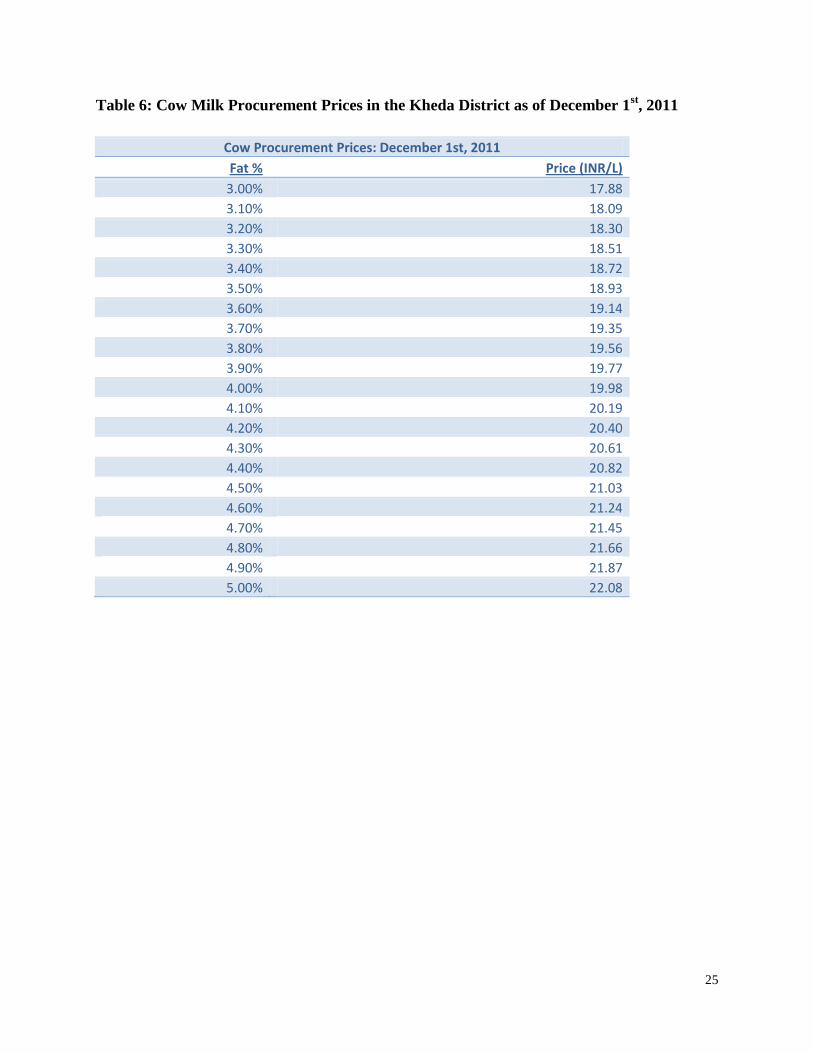
Table 6: Cow Milk Procurement Prices in the Kheda District as of December 1st, 2011
Cow Procurement Prices: December 1st, 2011
Fat % Price (INR/L)
3.00% 17.88
3.10% 18.09
3.20% 18.30
3.30% 18.51
3.40% 18.72
3.50% 18.93
3.60% 19.14
3.70% 19.35
3.80% 19.56
3.90% 19.77
4.00% 19.98
4.10% 20.19
4.20% 20.40
4.30% 20.61
4.40% 20.82
4.50% 21.03
4.60% 21.24
4.70% 21.45
4.80% 21.66
4.90% 21.87
5.00% 22.08

26
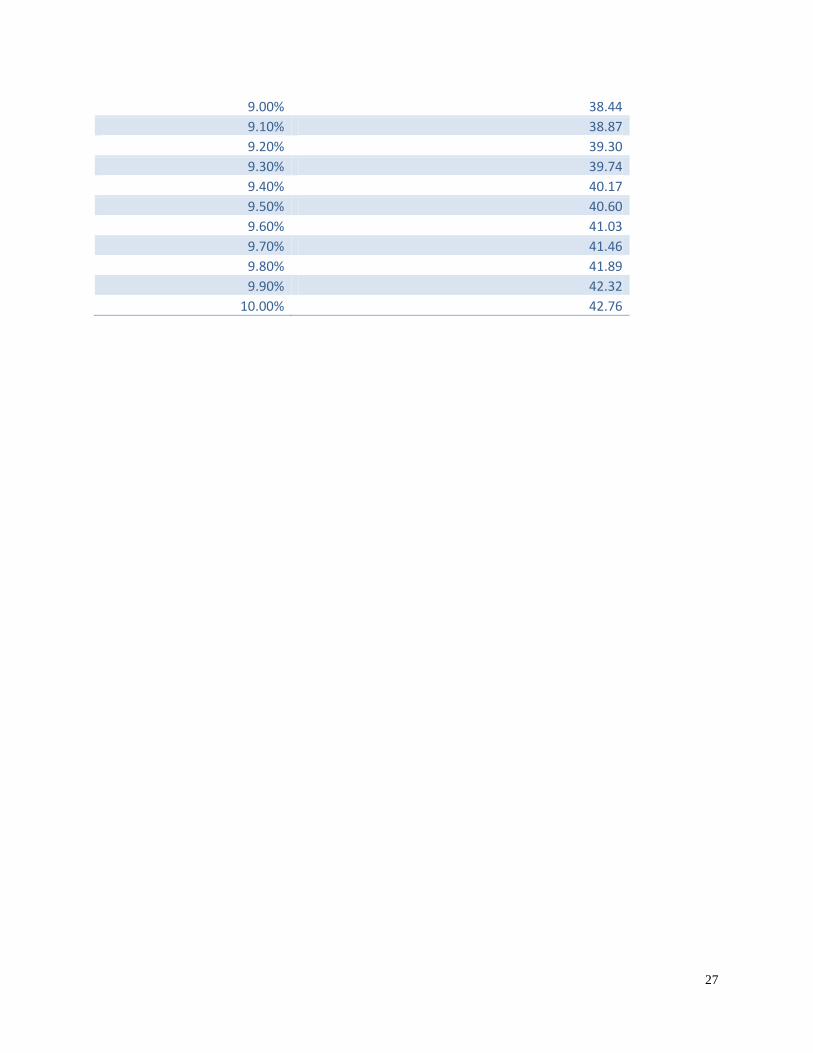
Table 7: Buffalo Milk Procurement Prices in the Kheda district as of December 1st, 2011
Buffalo Procurement Prices: December 1st, 2011
Fat % Price (INR/L)
5.10% 21.40
5.20% 21.82
5.30% 22.25
5.40% 22.68
5.50% 23.34
5.60% 23.77
5.70% 24.20
5.80% 24.63
5.90% 25.07
6.00% 25.50
6.10% 25.93
6.20% 26.36
6.30% 26.79
6.40% 27.22
6.50% 27.65
6.60% 28.09
6.70% 28.52
6.80% 28.95
6.90% 29.38
7.00% 29.81
7.10% 30.24
7.20% 30.68
7.30% 31.11
7.40% 31.54
7.50% 31.97
7.60% 32.40
7.70% 32.83
7.80% 33.26
7.90% 33.70
8.00% 34.13
8.10% 34.56
8.20% 34.99
8.30% 35.42
8.40% 35.85
8.50% 36.28
8.60% 36.72
8.70% 37.15
8.80% 37.58
8.90% 38.01
27
9.00% 38.44
9.10% 38.87
9.20% 39.30
9.30% 39.74
9.40% 40.17
9.50% 40.60
9.60% 41.03
9.70% 41.46
9.80% 41.89
9.90% 42.32
10.00% 42.76
28
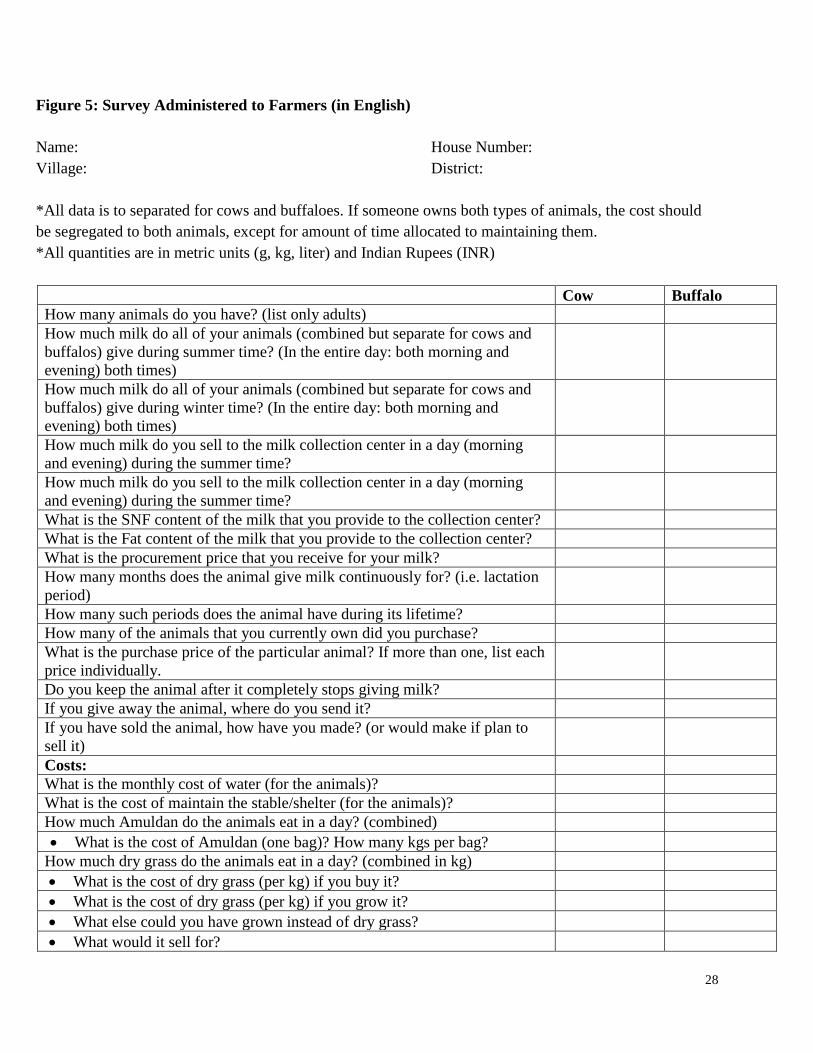
Figure 5: Survey Administered to Farmers (in English)
Name: House Number:
Village: District:
*All data is to separated for cows and buffaloes. If someone owns both types of animals, the cost should
be segregated to both animals, except for amount of time allocated to maintaining them.
*All quantities are in metric units (g, kg, liter) and Indian Rupees (INR)
Cow Buffalo
How many animals do you have? (list only adults)
How much milk do all of your animals (combined but separate for cows and
buffalos) give during summer time? (In the entire day: both morning and
evening) both times)
How much milk do all of your animals (combined but separate for cows and
buffalos) give during winter time? (In the entire day: both morning and
evening) both times)
How much milk do you sell to the milk collection center in a day (morning
and evening) during the summer time?
How much milk do you sell to the milk collection center in a day (morning
and evening) during the summer time?
What is the SNF content of the milk that you provide to the collection center?
What is the Fat content of the milk that you provide to the collection center?
What is the procurement price that you receive for your milk?
How many months does the animal give milk continuously for? (i.e. lactation
period)
How many such periods does the animal have during its lifetime?
How many of the animals that you currently own did you purchase?
What is the purchase price of the particular animal? If more than one, list each
price individually.
Do you keep the animal after it completely stops giving milk?
If you give away the animal, where do you send it?
If you have sold the animal, how have you made? (or would make if plan to
sell it)
Costs:
What is the monthly cost of water (for the animals)?
What is the cost of maintain the stable/shelter (for the animals)?
How much Amuldan do the animals eat in a day? (combined)
What is the cost of Amuldan (one bag)? How many kgs per bag?
How much dry grass do the animals eat in a day? (combined in kg)
What is the cost of dry grass (per kg) if you buy it?
What is the cost of dry grass (per kg) if you grow it?
What else could you have grown instead of dry grass?
What would it sell for?

29
How much could you have sold the other crop for?
How much green grass do the animals eat in a day? (combined in kg)
What is the cost of green grass (per kg) if you buy it?
What is the cost of green grass (per kg) if you grow it?
What else could you have grown instead of dry grass?
What would it sell for?
How much could you have sold the other crop for?
How much Makai Khor do the animals eat in a day? (combined in kg)
What is the cost of Makai Khor? (per kg)
How much Kapas do the animals eat in a day? (combined in kg)
What is the cost of Kapas? (per kg)
Cow Buffalo
Costs continued:
How much mineral powder do you feed the animals? (combined in kg)
What is the cost of mineral powder? (per kg)
What else do you feed the animals?
How much do you feed it (in a day combined)?
What is the cost? (per kg)
Do you have insurance for the animals? (Yes or no)
What is the annual insurance premium (per animal per coverage)?
How many times do you call the doctor for check up on the animals? (in a
year)
What is the cost of each doctor’s visit?
What is the annual cost of medications for the animals?
Do you ever call the specialist doctor (outside of Amul)?
How many times does the specialist doctor visit in a year?
What is the cost of specialist’s doctor?
How much time (throughout the day) do you spend taking care of the animal?
Does anybody else assist you?
How many individuals assist you?
How much time do they spend taking care of the animals (throughout the
day)?
Do you pay any of these individuals?
How many individuals do you pay?
How much do you pay them? (per hour/per day)
When the animal is not giving milk (out of the lactation period), do you
still provide the following? In the same amount? (Make a note of change
in quantity)
Amuldaan? (yes or no)
Dry Grass? (yes or no)
Green Grass? (yes or no)
Makai Khor? (yes or no)
Kapas? (yes or no)
Any other items? (yes or no)

30
If you keep the animal after it completely stops producing milk do you
still provide the following? In the same amount? (Make a note of change
in quantity)
Amuldaan? (yes or no)
Dry Grass? (yes or no)
Green Grass? (yes or no)
Makai Khor? (yes or no)
Kapas? (yes or no)
Any other items? (yes or no)
Household Income:
How much money do you earn from selling milk to the milk collection center
(monthly)?
What other jobs do you do to earn money besides selling milk to the dairy?
How much money do you earn from your other activities (jobs) in a month?
What is the size of your monthly household budget?
Do you think this activity is a significant source of income for your
household?
If you did not sell milk, what other job (activity) could you do to earn money?
How much would someone (or you) earn in this other job (in a month)?
How many hours (in a day) and days in a week would this job require?
Do you believe your children will continue to sell milk to Amul?

31
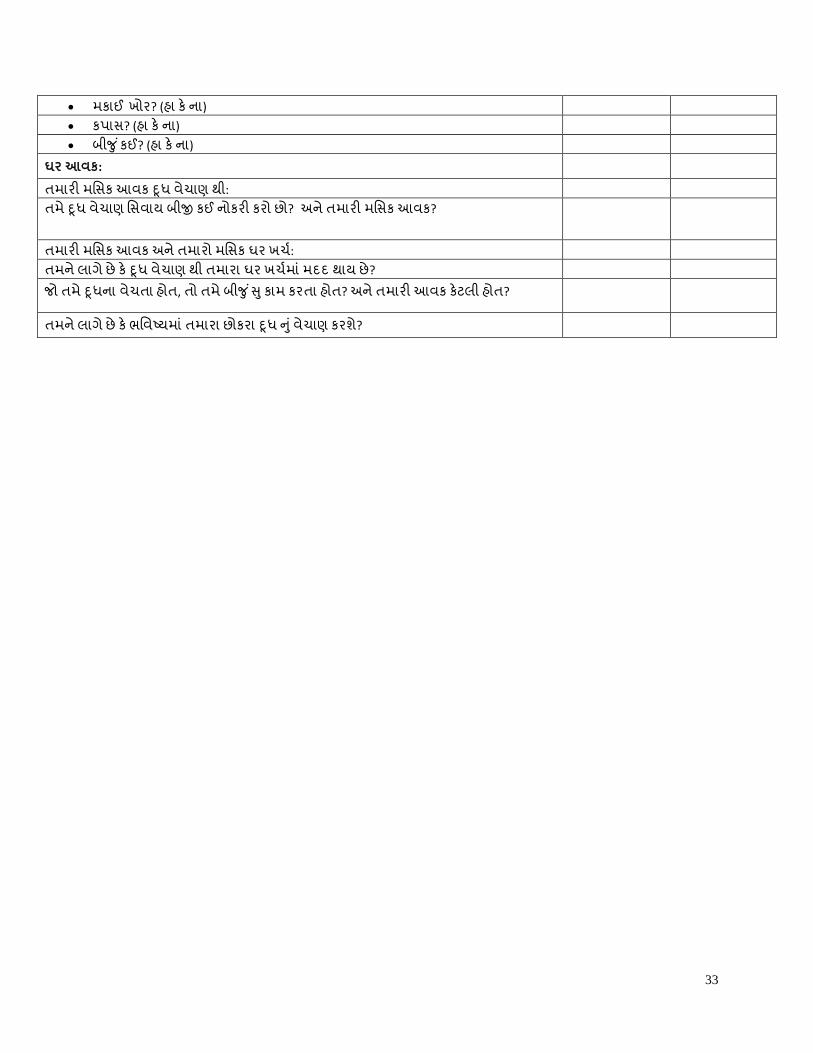
Figure 6: Copy of the survey administered
: ઘર ર:
: :
* ર . ર , ર . * ર ( , , ) .
ર ર ? ( )
ર ( ર ) ર ? ( )
ર ( ર ) ર ? ( )
ર ર ( ર ) ?
ર ર ( ર ) ?
ર . . . (SNF ) ?
ર (fat ) ?
ર ર ?
ર ? ( )
ર ( ) ર ?
ર ર ?
ર ર
ર ઇ , ર ?
ર ર , ?
ર , ?
:
( ર ):
ર ( ર ર ) ( ર ):
ર . ? ( )
? ( )
ર ( ર ) ઘ ? (
)
ર , ઘ :
, ઘ :

32
ર ( ર ) ઘ ? (
)
ર , ઘ :
, ઘ :
ર ( ર ) ર ? (
)
ર :
:
ર ( ર ) ? (
)
:
ર ( ર ) ર ર ? ( )
ર ર :
ર ? ( )
, ?
, ર ?
ર ર ર ર ?
ર :
ર ?
( ર ) ર ?
ર ર ?
ર ર ?
ર ર , ર ( ર ) ?
ર ર ર , ?
? ( )
ઘ ? ( )
ઘ ? ( )
ર? ( )
? ( )
? ( )
ર ઇ ર , ?
? ( )
ઘ ? ( )
ઘ ? ( )
33
ર? ( )
? ( )
? ( )
ઘર :
ર :
ર ર ? ર ?
ર ર ઘર :
ર ઘર ?
, ર ? ર ?
ર ર ર ?

34
Bibliography
Chandra, Pankaj, and Devanath Tirupati. "Business Strategies for Managing Complex Supply
Chains in Large Emerging Economies: The Story of AMUL." Indian Institute of
Management - Ahmedabad. (2003).
Ebrahim, Alnoor. “Agricultural cooperatives in Gujarat, Indi: agents of equity or
differentiation?” Development in Practice 10 (2000): 178-188.
"Export of Pakistani buffaloes for India’s dairy consumption ." Dawn [Chandigarh] 05 Apr 2012,
<http://dawn.com/2012/04/05/export-of-pakistani-buffaloes-for-indias-dairy-
consumption/>
"India to face milk shortage as demand rises: NDDB chief." Times of India [Anand] 17 Feb
2010, <http://articles.timesofindia.indiatimes.com/2010-02-
17/vadodara/28149024_1_milk-production-milk-shortage-higher-import>.
Jain, J.L., Awadh Prasad, and Gopi Nath Gupta. Organised Milk Marketing in India: Socio-
Economic Impact: a study of Delhi Milk Scheme in N.W. Rajasthan. Jaipur: Kumarapa
institute of Gram Swaraj, 1982.
Kaira District Co-Operative Milk Producers’ Union Limited. 64th
Annual Report. Anand, India:
2009.
Karmakar, K.G., and G.D. Banerjee. "Opportunities And Challenges in The Indian Dairy
Industry." NABARD Technical Digest. 2006: 24-27.
"KIT: The dairy market in India." Business Standard [New Delhi] 02 Dec 2008,
<http://www.business-standard.com/india/news/kitdairy-market-in-india/341845/>.
Kulandaiswamy, V. Cooperative Dairying in India. Coimbatore: Rainbow Publications, 1982.
Kurien, Verghese. I Too Had a Dream. 1st ed. 249. New Delhi, India: Roli Books, 2007.
Ranade, C.G., D.P. Mathur, B. Rangarajan, and V.K. Gupta. Performance of Integrated Milk Co-
Operatives: a study of selected co-operative dairies in Gujarat and Maharashtra. New
Delhi: Indian Institute of Management-Ahmedabad and Concept Publishing Company,
1985.

35
Scholten, Bruce A. India’s White Revolution: Operation Flood, Food Aid & Development
London: Tauris Academic Studies, 2010.
Shah, D.R. An Economic Analysis of Co-operative Dairy Farming in Gujarat. Bombay: Somaiya
Publications, 1985.
Shah, Dilip. Dairy Cooperativization: An Instrument of Social Change. New Delhi: Rawat
Publications, 1992.
Singh, Katar, and Virendra P. Singh. "Dairy Development in India: Retrospect and
Prospect." Institute of Rural Management, Anand Research Papers. 15. (1998).
Singh, S.P. and Paul L. Kelly. AMUL: An Experiment in Rural Economic Development.
Delhi: Macmillan India Limited, 1981.
The following four articles are from the book Who Shares? Cooperatives and Rural
Development edited by B. S. Baviskar and David Attwood:
Baviskar, B.S. “Dairy Co-operatives and Rural Development in Gujarat”. Who Shares:
Cooperatives and Rural Development. Delhi: Oxford University Press, 1988.
Patel, A.S. “Co-operative Dairying and Rural Development: A Case Study of AMUL”. Who
Shares:Cooperatives and Rural Development. Delhi: Oxford University Press, 1988.
Apte, D. P. “The role of Co-operative Dairy Schemes in the Rural Development of India”. Who
Shares: Cooperatives and Rural Development. Delhi: Oxford University Press, 1988.
George, Shanti. “Co-operatives and Indian Dairy Policy: More Anand than Pattern”. Who
Shares:Cooperatives and Rural Development. Delhi: Oxford University Press, 1988.