exploring the differences between forward osmosis and
TRANSCRIPT
This document is downloaded from DR‑NTU (https://dr.ntu.edu.sg)Nanyang Technological University, Singapore.
Exploring the differences between forwardosmosis and reverse osmosis fouling
Siddiqui, Farrukh Arsalan; She, Qianhong; Fane, Anthony Gordon; Field, Robert W.
2018
Siddiqui, F. A., She, Q., Fane, A. G., & Field, R. W. (2018). Exploring the differences betweenforward osmosis and reverse osmosis fouling. Journal of Membrane Science, 565, 241‑253.doi:10.1016/j.memsci.2018.08.034
https://hdl.handle.net/10356/138826
https://doi.org/10.1016/j.memsci.2018.08.034
© 2018 Elsevier B.V. All rights reserved. This paper was published in Journal of MembraneScience and is made available with permission of Elsevier B.V.
Downloaded on 17 Oct 2021 01:38:35 SGT
1
Exploring the Differences between Forward Osmosis and Reverse Osmosis Fouling 1 2
3
4
Farrukh Arsalan Siddiqui a,1
, Qianhong She b,c*
, Anthony G. Fane b,d
, Robert W. Field a**
5
6
7 a Department of Engineering Science, University of Oxford, United Kingdom 8
b Singapore Membrane Technology Centre, Nanyang Environment & Water Research 9
Institute, Nanyang Technological University, Singapore 10 c School of Chemical and Biomolecular Engineering, The University of Sydney, NSW 2006, 11
Australia 12 d UNESCO Centre for Membrane Science and Technology, University of New South Wales, 13
NSW 2052, Australia 14
15
16 * Corresponding author address: The University of Sydney, Room 494, Level 4, Chemical 17
Engineering Building J01, Darlington, NSW 2006, Australia; Tel: +61 2 8627 6071; Fax: +61 18
2 9351 2854; Email: [email protected] 19
20 **
Corresponding author address: University of Oxford, Parks Road, Oxford, OX1 3PJ, UK; 21
Tel: +44 1865 273181; Fax: +44 1865 273010; Email: [email protected] 22
23
24
25 1 Permanent address: Department of Mechanical Engineering, Bahauddin Zakariya University, 26
Bosan Road, Multan 60800, Pakistan 27
28
29
30
31
32
33
34
35
36
37
2
Abstract 38
A comparison of alginate fouling in forward osmosis (FO) with that in reverse osmosis (RO) 39
was made. A key experimental finding, corroborated by membrane autopsies, was that FO is 40
essentially more prone to fouling than RO, which is opposite to a common claim in the 41
literature where deductions on fouling are often based solely on the water flux profiles. Our 42
theoretical analysis shows that, due to a decrease in the intensity of internal concentration 43
polarization (ICP), and thus an increase in the effective osmotic driving force during FO 44
fouling tests, the similarity of experimental water flux profiles for FO and RO is in 45
accordance with there being greater fouling in FO than RO. The specific foulant resistance 46
for FO was also found to be greater than that for RO. Possible explanations are discussed and 47
these include the influence of reverse solute diffusion from draw solution. Whilst this 48
explanation regarding specific foulant resistance is dependent on the draw solution properties, 49
the finding of greater overall foulant accumulation in FO is considered to be a general finding. 50
Additionally, the present study did not find evidence that hydraulic pressure in RO plays a 51
critical role in foulant layer compaction. Overall this study demonstrated that although FO 52
has higher fouling propensity, it offers superior water flux stability against fouling. For 53
certain practical applications this resilience may be important. 54
55
56
Keywords: forward osmosis; reverse osmosis; fouling; internal concentration polarization 57
(ICP); cake-enhanced concentration polarization (CECP) 58
59
3
60
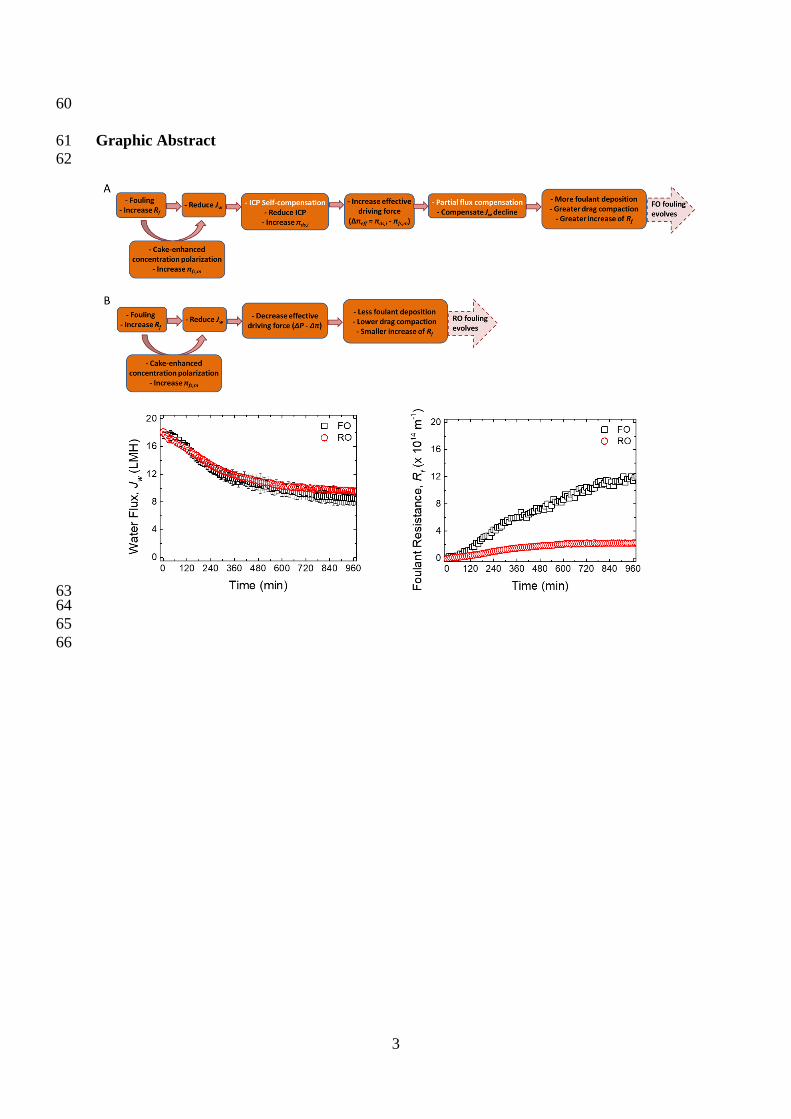
Graphic Abstract 61
62
63 64
65
66
4
1. Introduction 67
Forward osmosis (FO) has received considerable interest in the recent decade for various 68
applications such as desalination [1-4], wastewater treatment [3-6], trace contaminant 69
removal [7-9], and resource recovery [10, 11]. In an FO process a draw solution (DS) with a 70
higher osmotic pressure on one side of a selective membrane draws the water from a feed 71
solution (FS) with a lower osmotic pressure on the other side of the membrane [1]. Unlike 72
pressure-driven reverse osmosis (RO) that is a relatively energy-intensive process, 73
osmotically driven FO process only requires minimum electrical energy for pumping the DS 74
and FS solutions. In those special cases where the application does not require the 75
regeneration of the DS (e.g., the osmotic dilution of the fertilizer-based DS [12] and/or the 76
concentration of the FS for nutrient recovery [10]), FO has an outstanding advantage in 77
terms of lower energy consumption. Also it has been suggested that a hybrid FO system that 78
incorporates a DS regeneration process may also outperform conventional RO when treating 79
challenging feedwaters (e.g., the feedwater with high salinity or specific challenging 80
contaminants) [4, 13, 14]. Whilst energy consumption is a major factor in the evaluation 81
between FO and RO [13, 15, 16], membrane fouling is another important consideration when 82
comparing the performance of FO and RO in practical applications [3-5, 13, 14, 17]. 83
84
1.1. Critical review of prior studies on the comparison of fouling in FO and RO 85
Owing to the different driving forces for FO and RO (i.e., osmotic pressure vs. hydraulic 86
pressure), fouling behaviour between FO and RO has been presumed to be different. The 87
comparison of membrane fouling between FO and RO processes has been studied extensively 88
and it has been broadly claimed that osmotically driven FO has lower fouling tendency and 89
greater fouling reversibility than pressure-driven RO [13, 18-28]. These studies attributed 90
their claim to the lack of hydraulic compaction of the foulant layer in the FO process, which 91
5
resulted in the formation of different foulant layer structure in FO compared to that in RO. 92
They stated that in FO the foulant layer is looser and less compacted and thereby the fouled 93
membrane can be easily cleaned by a brief water rinsing, whereas in RO the foulant layer is 94
densely compacted and tightly held on the membrane under the action of hydraulic pressure, 95
thereby resulting in a reduced cleaning efficiency [19, 24]. 96
97
On the other hand, a number of other studies have reported opposing observations [29-32]. 98
Lay et al. did not observe differences in the flux decline between FO and RO fouling and they 99
attributed this to the low initial water flux that was said to be below the critical flux [29], 100
which today might be better termed threshold flux [33]. For alginate and silica fouling, Jang 101
et al. observed in a laboratory study that fouling propensity was the highest for FO compared 102
with RO and membrane distillation [30]. Tow et al. developed a method of in situ membrane 103
fouling quantification and found greater foulant accumulation with FO than with RO, which 104
suggests that fouling in FO might be more severe than RO despite the observed lower flux 105
decline in FO [31]. In addition, their study did not find any evidence that the thinner cake 106
layer (less foulant accumulation) in RO could be attributed to the hydraulic pressure 107
compaction [31]. In an earlier study on alginate and silica fouling in RO under constant flux 108
operation, Fane and Chong observed no clear difference in the trans-membrane pressure 109
(TMP) profiles for a flux of 40 l/m2hr (well above the critical flux for both foulants) with 110
varying feed pressures from 22 to 30 bar, suggesting that foulant layer compaction is 111
physically related to water flux not hydraulic pressure per se [32]. 112
113
1.2. Analysis of possible reasons for the different findings on FO and RO fouling 114
The inconsistent findings on FO and RO fouling between different groups of researchers 115
probably lie in the discrepancies with respect to experimental methods used, as well as in the 116
6
different analytical approaches. Firstly, in most of the prior studies experimental conditions 117
for FO and RO were not comparably controlled. For example, (i) in many cases the apparent 118
driving force for RO (i.e., hydraulic pressure, ΔP) was maintained constant during the entire 119
RO experimental test, whereas that for FO (i.e., osmotic pressure difference between the bulk 120
DS and the bulk FS, Δπ) was gradually decreasing during the FO experimental test as the DS 121
was gradually diluted and the FS was gradually concentrated [19-21, 23, 24, 30, 31, 34]; (ii) 122
different types of membranes were used for FO and RO tests, for which different membrane 123
properties may influence the fouling behaviour [26, 31]. Secondly, in many prior studies the 124
reported water flux for RO was directly observed from experiments, whereas for FO it was 125
not the experimentally observed flux but a corrected one by using experimental fouling flux 126
and baseline flux under non-fouling conditions [19-24]. Typically, the approach to correct the 127
observed FO flux was to eliminate the effects of DS dilution and the FS concentration during 128
the test. However, the approach of flux correction did not take into account the effects of 129
concentration polarization (CP) especially internal concentration polarization (ICP) that is 130
strongly dependent on the solution concentration and will significantly influence the observed 131
flux via the change in effective driving force [35-37]. Thirdly, the majority of prior studies 132
compared the fouling propensity between FO and RO based on the extent of flux decline [19-133
24, 26, 30, 34]. However, in both FO and RO, especially FO, temporal changes in flux do 134
not properly reflect the evolution of foulant accumulation on the membrane, because the flux 135
decline is related not only to the hydraulic resistance of the foulant layer accumulated on the 136
membrane but also to the CP that will result in the decrease of effective driving force [20, 31, 137
36-39]. It is also noted that the foulant layer formed on the membrane might influence the 138
degree of external CP through the process of ―cake-enhanced concentration polarization‖ [38]. 139
Although Tow et al. developed a method to quantify membrane fouling by employing two 140
parameters – cake structural parameter (that is related to cake-enhanced concentration 141
7
polarization) and pore hydraulic diameter (that is related to hydraulic resistance of foulant 142
layer), it appears that their study only focused on the analysis of the former under conditions 143
where cake hydraulic resistance is negligible [31]. 144
145
1.3. Definition of fouling and objectives of the current study 146
The controversy over FO and RO fouling in prior studies has provided an impetus for us to 147
perform an insightful comparison of fouling between FO and RO processes. It is noted that 148
the majority of prior studies comparing fouling between FO and RO were based solely on the 149
water flux profiles [18-26]. It was generally assumed that a water decline was an appropriate 150
metric for fouling behaviour in both cases [18-26]. However, this overlooks a key difference 151
between fouling in FO compared with that in RO. This is because water flux decline is 152
dependent not only on fouling but also on driving force (i.e., osmotic pressure for FO and 153
hydraulic pressure for RO), as shown below: 154
(1) 155
where J is water flux, F is driving force, µ is viscosity of the solution, and R is the overall 156
hydraulic resistance of membrane and foulant layer. 157
Now in this study we specifically define that fouling is the accumulation of foulant on the 158
membrane, and is quantified by the foulant layer resistance (Rf), which is consistent with 159
previous studies quantifying fouling of desalination membranes [32, 40-42]. As CP is flux 160
dependent, fouling will change the effective driving forces in FO and RO because of changes 161
in CP. Due to ICP changing with water flux, the changes in effective driving force are 162
particularly significant for FO [36, 37]. Therefore, for FO processes, an examination of the 163
decline in flux in isolation does not properly reflect the extent of fouling (i.e., the evolution of 164
foulant accumulation on the membrane). 165
166
8
Consequently the current study aims to compare the fouling between FO and RO focusing on 167
the comparison of hydraulic resistances of the foulant layers with due allowance for the CP 168
effects. A specific objective is to have a mechanistic understanding of the differences of 169
fouling and its influences on water flux between FO and RO. To enable a fair comparison our 170
experiments were designed to use the same membranes, have essentially the same initial 171
water flux, and have well controlled conditions including constant overall driving force, 172
throughout the complete experiments as detailed in section 2.2. 173
174
2. Materials and Methods 175
2.1. Chemicals and membranes 176
Unless otherwise stated, all the chemicals used in this study were of analytical grade. 177
Ultrapure deionised (DI) water which was supplied by a Milli-Q Ultrapure water system 178
(Millipore Singapore Pte Ltd) with a resistivity of 18.2 MΩ cm was used to prepare all the 179
solutions. Sodium salt of alginic acid (alginate, Sigma-Aldrich St. Louis, MO) was used as 180
model foulant to study membrane fouling. It gives gel-layer fouling rather than cake-layer 181
fouling but the term cake-enhanced concentration polarization (CECP) has been retained in 182
this paper. The feed solution in both FO and RO fouling experiments was composed of 45 183
mM NaCl, 5 mM CaCl2 and 200 mg/L alginate. The draw solution for FO experiments was 184
composed of 1.5 M NaCl. The initial volume of the feed solution and draw solution was 5 L. 185
186
A cellulose triacetate (CTA) membrane provided by Hydration Technology Innovations (HTI, 187
Albany, OR) was used in both FO and RO experimental tests. The CTA membrane 188
comprised a dense selective layer and a porous support layer embedded within a polyester 189
woven mesh fabric. This membrane has been widely used as a model membrane to compare 190
fouling in FO and RO [19-21, 31]. The reason for the use of the same membrane in both FO 191
9
and RO tests is to eliminate the influence of membrane materials on fouling and thus generate 192
a fair comparison between fouling in FO and RO. 193
194
2.2. FO and RO membrane fouling experiments 195
The same experimental setup was used for FO and RO experimental tests with only slight 196
modification between the two different test modes (Fig. S1 in Supporting Information S1). 197
This setup has also been used in our previous osmotic membrane fouling experiments and 198
benefits, inter alia, from being able to maintain a constant draw concentration [43]. The setup 199
had a PLC control system that allowed automatic control of experimental operation and data 200
acquisition. For FO tests, both FS and DS were recirculated with Hydra-Cell positive 201
displacement diaphragm pumps (Fig. S1A). The FO membrane test cell (CF042, Sterlitech 202
Corporation) was comprised of two symmetric Delrin half-cells (top cell and bottom cell) 203
with identical dimension of flow channel (85 mm length × 39 mm width × 2.3 mm height). A 204
net spacer was placed in the DS flow channel to enhance the mixing and mass transfer of DS 205
[44]. The DS cross-flow velocity was 11.1 cm/s. The draw solution conductivity (and thus 206
concentration) was maintained constant by dosing with a more concentrated NaCl solution. 207
The feed solution conductivity was monitored with time to estimate the reverse solute flux 208
following the same methods described previously [44]. For RO tests, only FS was 209
recirculated, while the permeate water was collected directly in a permeate tank (Fig. S1B). 210
There was dosing of the feed with DI water to ensure concentration was kept constant. The 211
RO membrane test cell had the same FS flow channel as that for FO. The permeate channel 212
was filled with sintered porous metal plate (with ~20 µm mean pore size) that could fully 213
support the membrane against deformation in the RO test. The feed and permeate 214
conductivity were monitored with time to estimate the rejection. 215
216
10
For both FO and RO tests, the FS tank was placed on a digital balance and the FS mass (and 217
thus FS volume and foulant concentration) was maintained constant via continuous dosing 218
with DI water (see Fig S1B). Small amounts of salt leakage did occur from the DS side but 219
the increase in bulk FS concentration was marginal due to large volume (5 L) of FS used in 220
the experiments and its influence on the bulk DS and FS osmotic pressure difference is 221
negligible according to conductivity monitoring. The mass change of the DI water with time 222
was recorded and used to determine the water flux. No feed spacer was placed in the FS 223
channel to accelerate fouling. The membrane active layer was facing the FS. The cross-flow 224
velocity of FS was 7.4 cm/s. The apparent driving forces for both RO and FO (i.e., the 225
applied hydraulic pressure for RO and the osmotic pressure difference between the bulk DS 226
and the bulk FS for FO) were maintained constant. 227
228
After each fouling test, the fouled membrane was either cleaned via surface flushing to 229
investigate the fouling reversibility or autopsied to determine the foulant deposition. During 230
surface flushing, the FS was replaced with DI water and the cross-flow velocity of FS was 231
increased to 29.6 cm/s. For the FO fouled membrane the DS was also replaced with DI and 232
not recirculated; for the RO fouled membrane the applied hydraulic pressure was reduced to 233
zero. In both cases the surface flushing was performed for 30 minutes. The foulant mass load 234
(i.e., amount of foulant deposited on unit area of membrane surface) was determined by 235
foulant extraction followed by measurement of the total organic carbon (TOC) using a similar 236
protocol reported elsewhere [43]. The protocol is briefly summarized in Supporting 237
Information S2. 238
239
11
2.3. Determination of foulant resistance for fouled membranes in FO and RO 240
Before the determination of the foulant resistance on the fouled membranes ( ), the clean 241
membrane resistance ( ) was first measured via a RO test using a foulant-free feed solution 242
with the same background electrolyte used for the fouling test. The for the clean 243
membrane was estimated using the following osmotic-resistance filtration (ORF) model for 244
RO that was reported elsewhere [45] and can be simplified from the universal ORF model for 245
osmotically driven membrane processes (ODMPs) ([37] and Appendix A). 246
(
)
(2) 247
where is the effective applied hydraulic pressure, is the solute rejection that was 248
determined based on conductivity measurement of permeate and feed water, is the 249
osmotic pressure of the feed solution (that can be correlated by the van’t Hoff equation 250
where is concentration, is van’t Hoff coefficient, is the universal gas 251
constant and is temperature), is the water flux, is the mass transfer coefficient 252
near the membrane surface, and is the viscosity of the feed solution. The membrane 253
resistance is related to the water permeability coefficient (A) by ⁄ . Note that 254
external concentration polarization (ECP) has been incorporated in Eq. (2) and that for the 255
feed channel can be estimated following the approach reported elsewhere [46]. 256
257
The structural parameter (S) of the FO membrane was determined by inputting and , 258
and the foulant-free experimentally obtained parameters (i.e., , , ) into the 259
following equation that is rearranged from the ORF model [37]. 260
[
( ) (
) ] (3) 261
12
The value of was the same value as that estimated for RO because the membrane cell for 262
the FO tests and RO tests had the same feed-side flow channel hydrodynamics. 263
264
The foulant resistance ( ) on the RO fouled membrane was determined by inputting , , 265
and the experimentally obtained , into Eq. (4) which, through the term , 266
includes an adjustment for cake-enhanced concentration polarization (CECP). 267
(
)
( ) (4) 268
where is the fouling water flux, is the membrane rejection during the RO fouling 269
test, and is the overall mass transfer coefficient across the foulant layer and external 270
concentration polarization boundary layer. As shown by Eq. (5) is dependent on both 271
the external concentration polarization (ECP) and CECP at the feed side. Thus 272
consists of two terms, one is related to the mass transfer within the foulant layer on the 273
membrane ( ) and the other to the ECP boundary layer above the foulant layer ( ). 274
(5) 275
where is the boundary layer thickness adjacent to the foulant layer and it can be estimated 276
from for an empty channel [46]; is the structural parameter of the foulant layer that 277
has an analogous definition to the membrane structural parameter [31]; is the sum of and 278
and is defined as the overall effective thickness of the CP boundary layer that incorporates 279
both CECP within the foulant cake layer and the external CP adjacent to the foulant layer. 280
For the calculation of Rf, a range of from 125 µm to 719 µm (where 125 µm is the ECP 281
boundary layer thickness) was selected based on the nature of alginate fouling [47]. Clearly 282
the CECP effect is negligible when . The selected range of was rationalized 283
via the sensitivity analysis as detailed in Appendix B. The numerator of Eq. (4) represents the 284
13
effective driving force for RO during fouling and is used to calculate the RO effective driving 285
force. 286
287
The on the fouled FO membrane was calculated using , , and the experimentally 288
obtained parameters ( , ⁄ , and ) based on the ORF model given below [37]. 289
( ) (
) (
)
( ) (6) 290
where the external concentration polarization (ECP) factor, , at the feed side and 291
dilutive concentration polarization (DCP) factor, , at the draw side are expressed by Eq. 292
(7) and Eq. (8), respectively. 293
(
) (7) 294
(
) (
⁄) (8) 295
Eq. (6) incorporates the effect of reverse solute diffusion (i.e., Js/Jw), internal concentration 296
polarization (included in Fdcp), and cake-enhanced concentration polarization (included in 297
Fecp,f). The term in Eq. (7) was determined by Eq. (5) following similar approaches to 298
those for RO. Although a precise value of was not determined in this study, the selected 299
range of readily indicates the trend of the calculated Rf for FO and RO (also refer to 300
Appendix B). The numerator of Eq. (6) represents the effective driving force for FO during 301
the fouling test and is used to calculate the FO effective driving force. The effect of different 302
scenarios of on the calculated and effective driving forces for FO and RO fouled 303
membranes will be evaluated and compared. ORF models show that the mass transfer 304
limitation for RO (Eq. (4)) only lies on the feed side but for FO (Eq. (6)) it lies on both the 305
feed and draw (permeate) sides which concurs with an earlier analysis [48]. As shown later 306
ICP (or ) at the draw side plays a significant role in determining the difference between 307
14
FO and RO fouling behaviours. It is important to note that the calculation of for both FO 308
and RO fouled membranes (Eq. (4) and Eq. (6)) is based on the experimentally measured 309
parameters, which is essentially similar to the method for calculating clean membrane 310
resistance (or clean membrane water permeability A) widely used in the research 311
community [36, 41, 49, 50]. 312
313
3. Results and Discussion 314
3.1. Comparison of water flux performance between FO and RO 315
For both FO and RO tests, the initial water flux was controlled at the same level of ~18 LMH 316
and the respective overall driving forces were maintained constant. Prior to fouling tests, 317
baseline tests without adding foulant in the FS were performed. The results show that 318
baseline fluxes for both FO and RO were almost constant during the entire test (Fig. S2 in 319
Supporting Information S3). Therefore, the flux decline during the fouling test is solely due 320
to the addition of foulant in the FS. 321
322
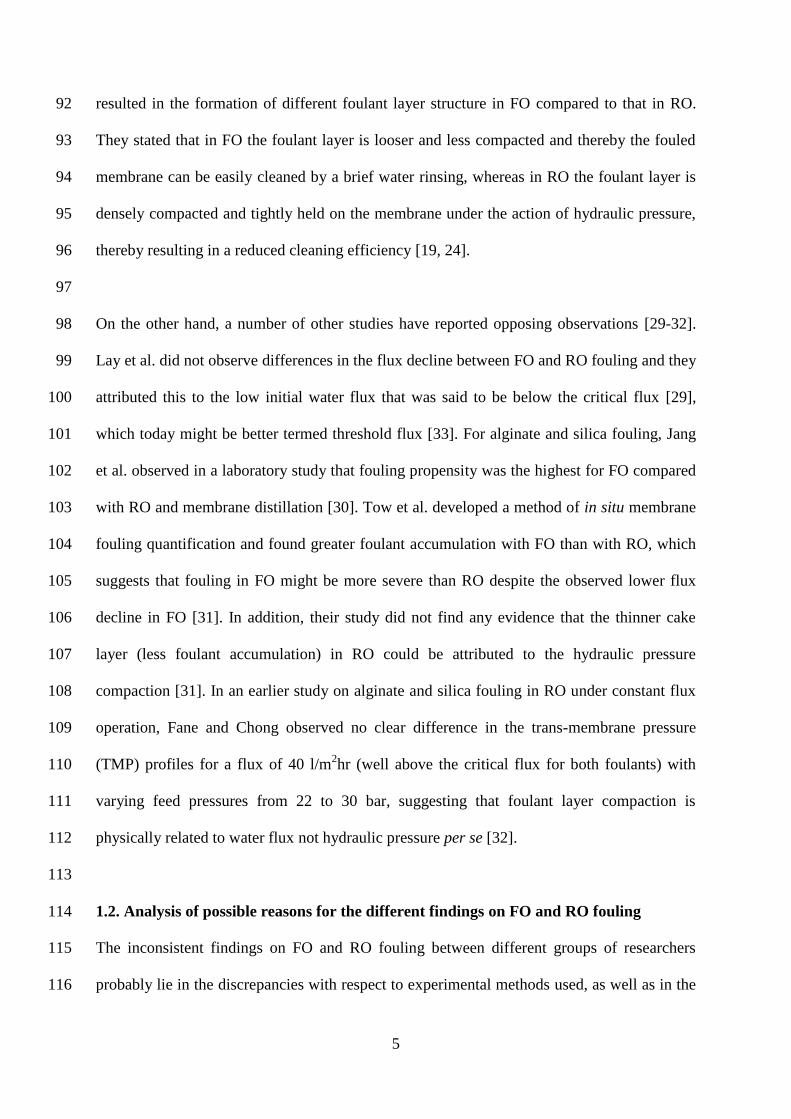
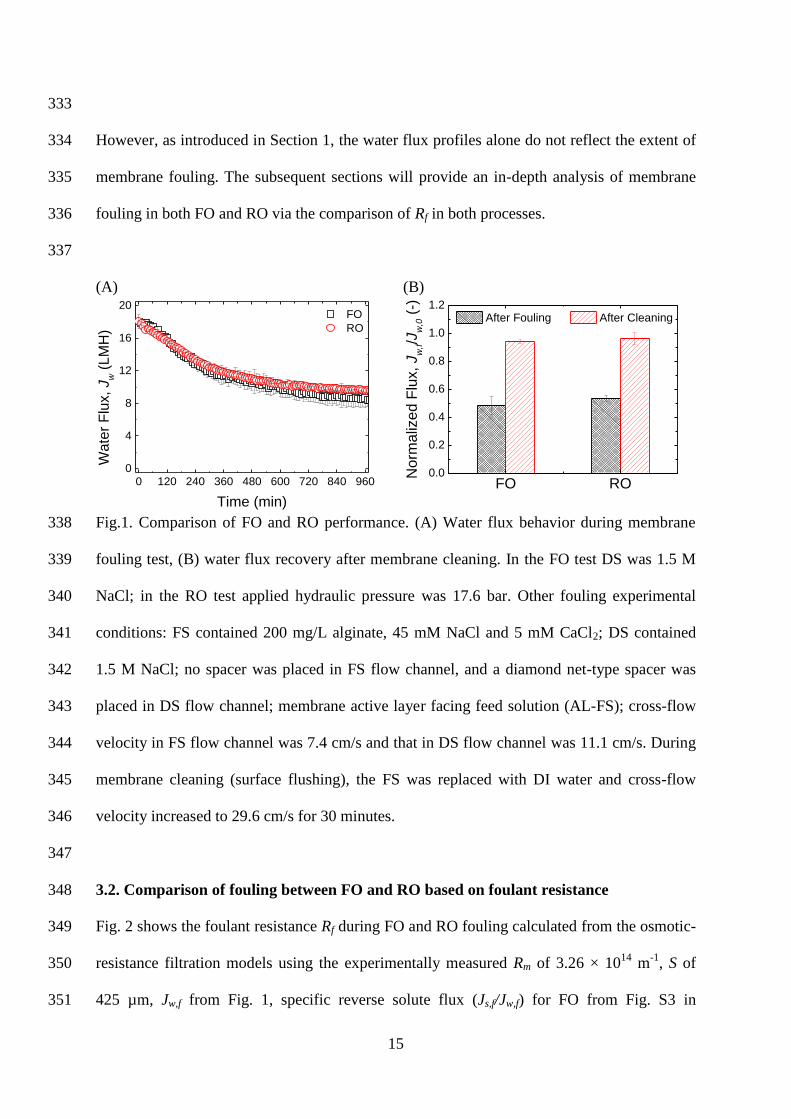
Fig. 1 shows the water flux behavior during FO and RO fouling tests and flux recovery after 323
membrane cleaning by water flushing. As shown in Fig. 1a, the water flux decline due to 324
membrane fouling in both FO and RO followed nearly the same trend. Similar observations 325
have been reported previously [19, 21, 24]. After the physical cleaning, water fluxes for both 326
FO and RO recovered significantly (Fig. 1b) with water flux recovery values of ~94% for FO 327
and ~96% for RO. Given the error bars the difference is not statistically significant. This 328
observation is different from that reported in previous studies in which flux recovery in FO 329
was generally much greater than that in RO [19-22, 24, 51]. Our results show that FO and RO 330
can have similar water flux decline trends during fouling and similar water flux recovery after 331
physical cleaning. 332
15
333
However, as introduced in Section 1, the water flux profiles alone do not reflect the extent of 334
membrane fouling. The subsequent sections will provide an in-depth analysis of membrane 335
fouling in both FO and RO via the comparison of Rf in both processes. 336
337
(A)
(B)
Fig.1. Comparison of FO and RO performance. (A) Water flux behavior during membrane 338
fouling test, (B) water flux recovery after membrane cleaning. In the FO test DS was 1.5 M 339
NaCl; in the RO test applied hydraulic pressure was 17.6 bar. Other fouling experimental 340
conditions: FS contained 200 mg/L alginate, 45 mM NaCl and 5 mM CaCl2; DS contained 341
1.5 M NaCl; no spacer was placed in FS flow channel, and a diamond net-type spacer was 342
placed in DS flow channel; membrane active layer facing feed solution (AL-FS); cross-flow 343
velocity in FS flow channel was 7.4 cm/s and that in DS flow channel was 11.1 cm/s. During 344
membrane cleaning (surface flushing), the FS was replaced with DI water and cross-flow 345
velocity increased to 29.6 cm/s for 30 minutes. 346
347
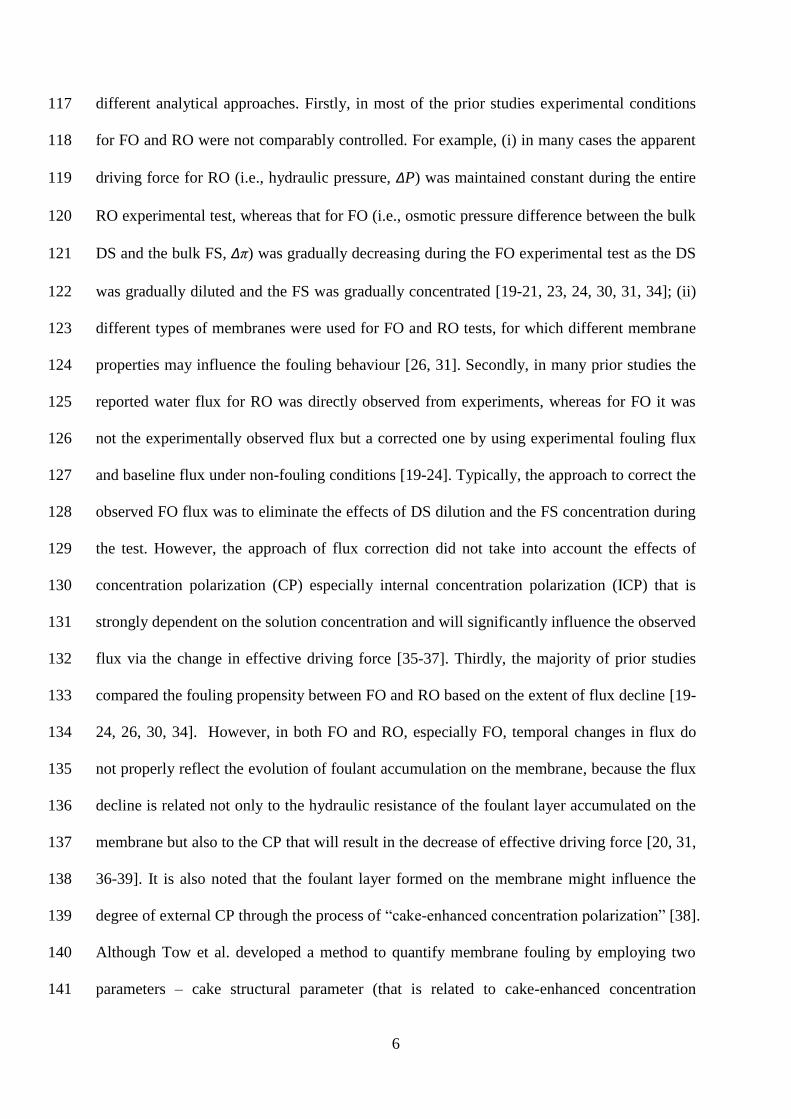
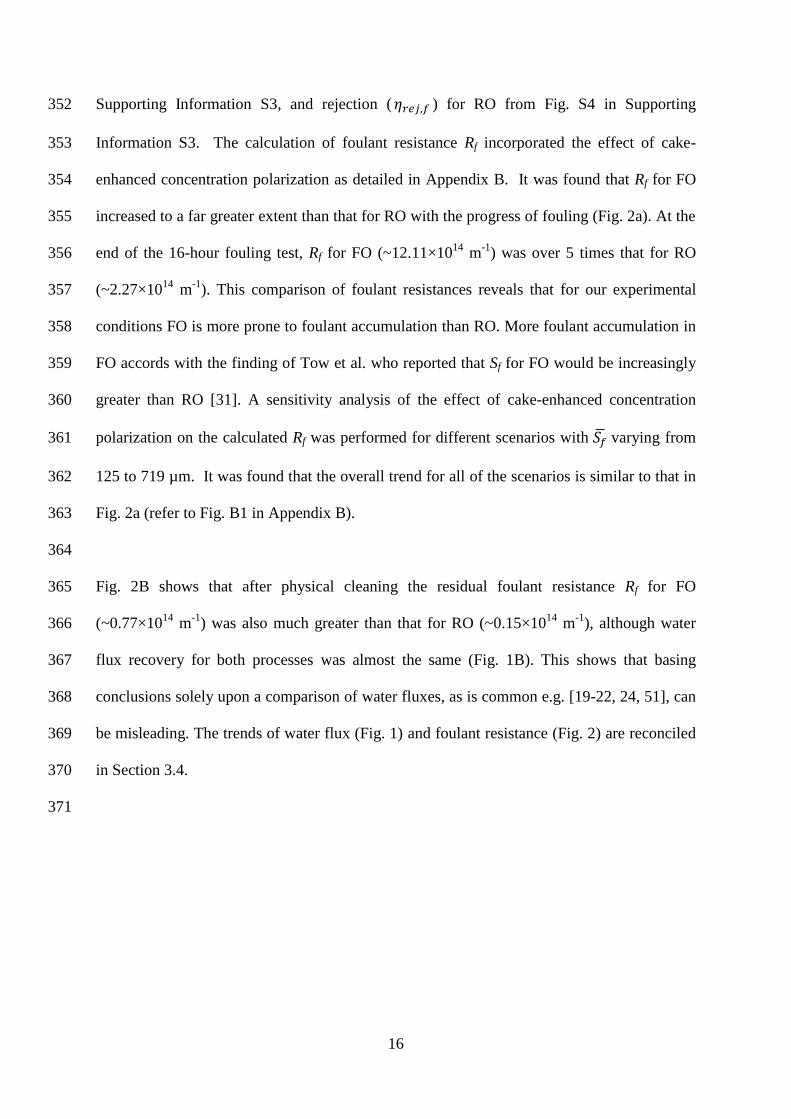
3.2. Comparison of fouling between FO and RO based on foulant resistance 348
Fig. 2 shows the foulant resistance Rf during FO and RO fouling calculated from the osmotic-349
resistance filtration models using the experimentally measured Rm of 3.26 × 10¹⁴
m-1
, S of 350
425 µm, Jw,f from Fig. 1, specific reverse solute flux (Js,f/Jw,f) for FO from Fig. S3 in 351
0 120 240 360 480 600 720 840 9600
4
8
12
16
20
FO
RO
Wate
r F
lux,
Jw (
LM
H)
Time (min)
FO RO0.0
0.2
0.4
0.6
0.8
1.0
1.2
Norm
aliz
ed F
lux,
Jw
,f/J
w,0 (
-)
After Fouling After Cleaning
16
Supporting Information S3, and rejection ( ) for RO from Fig. S4 in Supporting 352
Information S3. The calculation of foulant resistance Rf incorporated the effect of cake-353
enhanced concentration polarization as detailed in Appendix B. It was found that Rf for FO 354
increased to a far greater extent than that for RO with the progress of fouling (Fig. 2a). At the 355
end of the 16-hour fouling test, Rf for FO (~12.11×10¹⁴
m-1
) was over 5 times that for RO 356
(~2.27×10¹⁴
m-1
). This comparison of foulant resistances reveals that for our experimental 357
conditions FO is more prone to foulant accumulation than RO. More foulant accumulation in 358
FO accords with the finding of Tow et al. who reported that Sf for FO would be increasingly 359
greater than RO [31]. A sensitivity analysis of the effect of cake-enhanced concentration 360
polarization on the calculated Rf was performed for different scenarios with varying from 361
125 to 719 µm. It was found that the overall trend for all of the scenarios is similar to that in 362
Fig. 2a (refer to Fig. B1 in Appendix B). 363
364
Fig. 2B shows that after physical cleaning the residual foulant resistance Rf for FO 365
(~0.77×10¹⁴
m-1
) was also much greater than that for RO (~0.15×10¹⁴
m-1
), although water 366
flux recovery for both processes was almost the same (Fig. 1B). This shows that basing 367
conclusions solely upon a comparison of water fluxes, as is common e.g. [19-22, 24, 51], can 368
be misleading. The trends of water flux (Fig. 1) and foulant resistance (Fig. 2) are reconciled 369
in Section 3.4. 370
371
17
372
(A)
(B)
373
Fig. 2 – (A) Foulant resistance Rf during membrane fouling, and (B) Foulant resistance Rf 374
after membrane cleaning. Rf was calculated based on the osmotic-resistance filtration models 375
(Eq. (4) for RO and Eq. (6) for FO) using the experimentally measured water flux in Fig. 2, 376
specific reverse solute flux (Js/Jw) from Fig. S3 in Supporting Information S3 for FO, 377
rejection for RO from Fig. S4 in Supporting Information S3, and basic membrane parameters 378
(Rm and S), and incorporating the cake-enhanced concentration polarization. 379
380
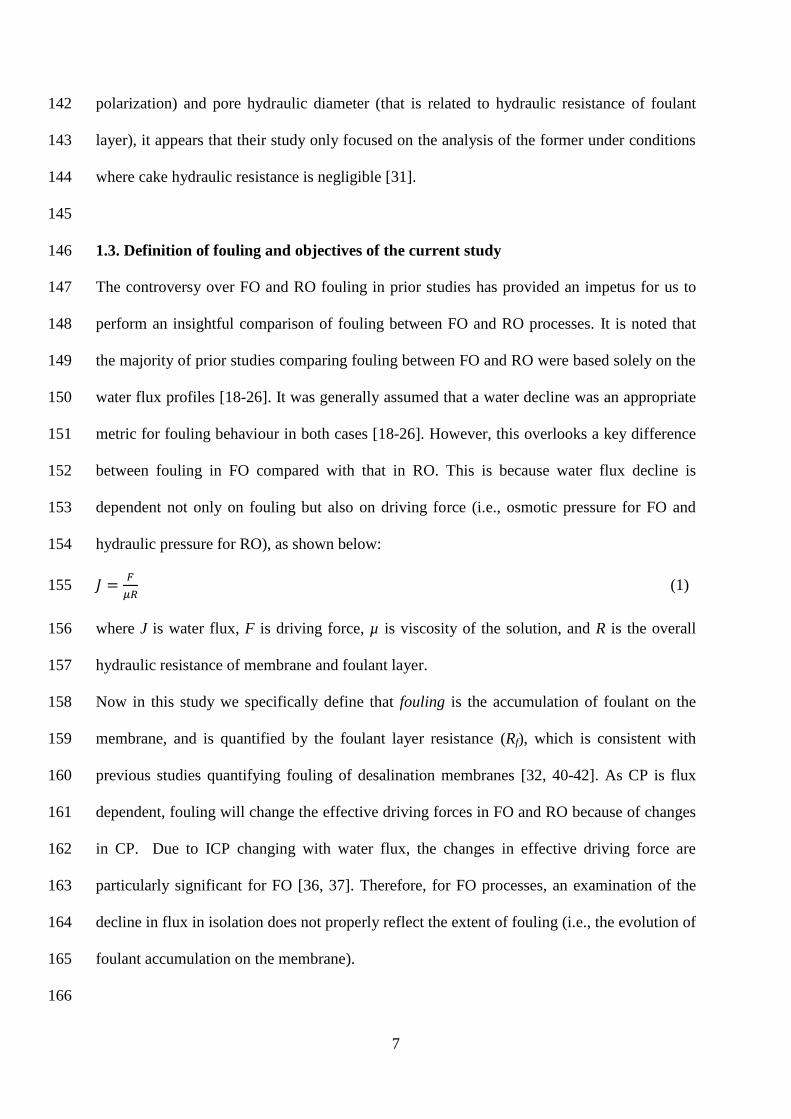
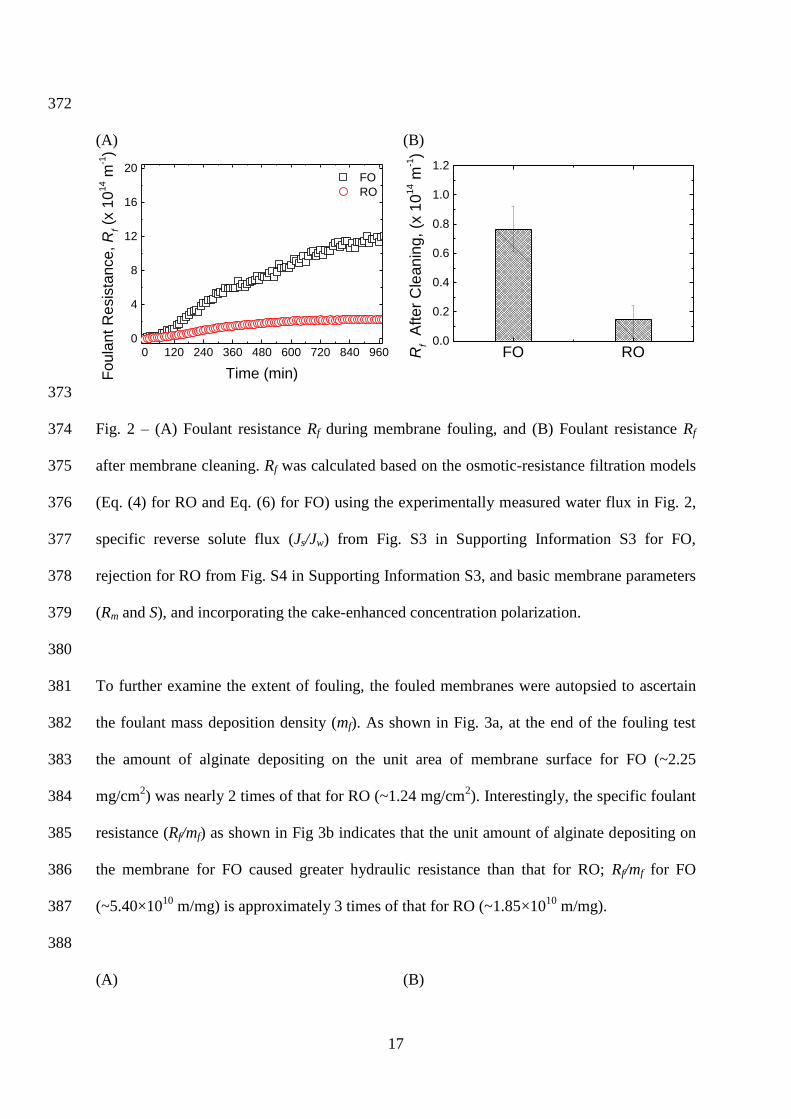
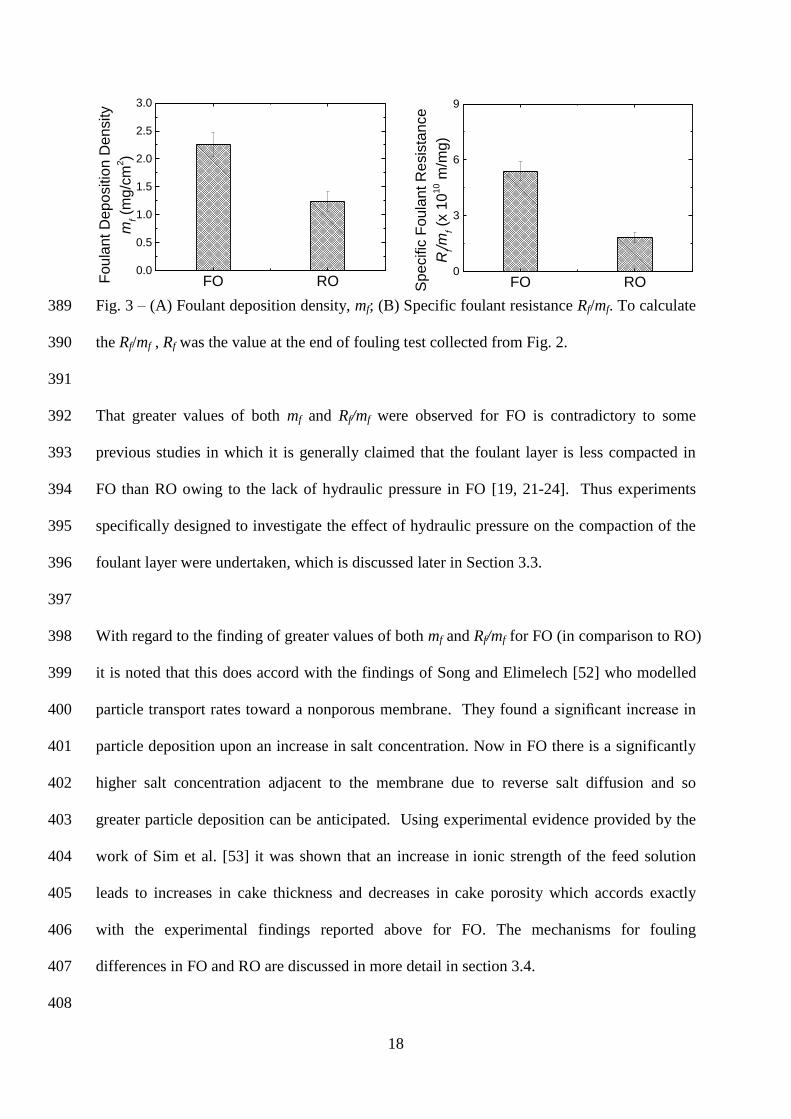
To further examine the extent of fouling, the fouled membranes were autopsied to ascertain 381
the foulant mass deposition density (mf). As shown in Fig. 3a, at the end of the fouling test 382
the amount of alginate depositing on the unit area of membrane surface for FO (~2.25 383
mg/cm2) was nearly 2 times of that for RO (~1.24 mg/cm
2). Interestingly, the specific foulant 384
resistance (Rf/mf) as shown in Fig 3b indicates that the unit amount of alginate depositing on 385
the membrane for FO caused greater hydraulic resistance than that for RO; Rf/mf for FO 386
(~5.40×10¹⁰
m/mg) is approximately 3 times of that for RO (~1.85×10¹⁰
m/mg). 387
388
(A) (B)
0 120 240 360 480 600 720 840 9600
4
8
12
16
20
FO
RO
Fo
ula
nt
Re
sis
tan
ce
, R
f (x 1
014 m
-1)
Time (min)
FO RO0.0
0.2
0.4
0.6
0.8
1.0
1.2
Rf
After
Cle
anin
g, (x
10
14 m
-1)
18
Fig. 3 – (A) Foulant deposition density, mf; (B) Specific foulant resistance Rf/mf. To calculate 389
the Rf/mf , Rf was the value at the end of fouling test collected from Fig. 2. 390
391
That greater values of both mf and Rf/mf were observed for FO is contradictory to some 392
previous studies in which it is generally claimed that the foulant layer is less compacted in 393
FO than RO owing to the lack of hydraulic pressure in FO [19, 21-24]. Thus experiments 394
specifically designed to investigate the effect of hydraulic pressure on the compaction of the 395
foulant layer were undertaken, which is discussed later in Section 3.3. 396
397
With regard to the finding of greater values of both mf and Rf/mf for FO (in comparison to RO) 398
it is noted that this does accord with the findings of Song and Elimelech [52] who modelled 399
particle transport rates toward a nonporous membrane. They found a significant increase in 400
particle deposition upon an increase in salt concentration. Now in FO there is a significantly 401
higher salt concentration adjacent to the membrane due to reverse salt diffusion and so 402
greater particle deposition can be anticipated. Using experimental evidence provided by the 403
work of Sim et al. [53] it was shown that an increase in ionic strength of the feed solution 404
leads to increases in cake thickness and decreases in cake porosity which accords exactly 405
with the experimental findings reported above for FO. The mechanisms for fouling 406
differences in FO and RO are discussed in more detail in section 3.4. 407
408
FO RO0.0
0.5
1.0
1.5
2.0
2.5
3.0
Fo
ula
nt
De
po
sitio
n D
en
sity
mf (
mg
/cm
2)
FO RO0
3
6
9
Specific
Foula
nt R
esis
tance
Rf/m
f (x 1
010 m
/mg)
19
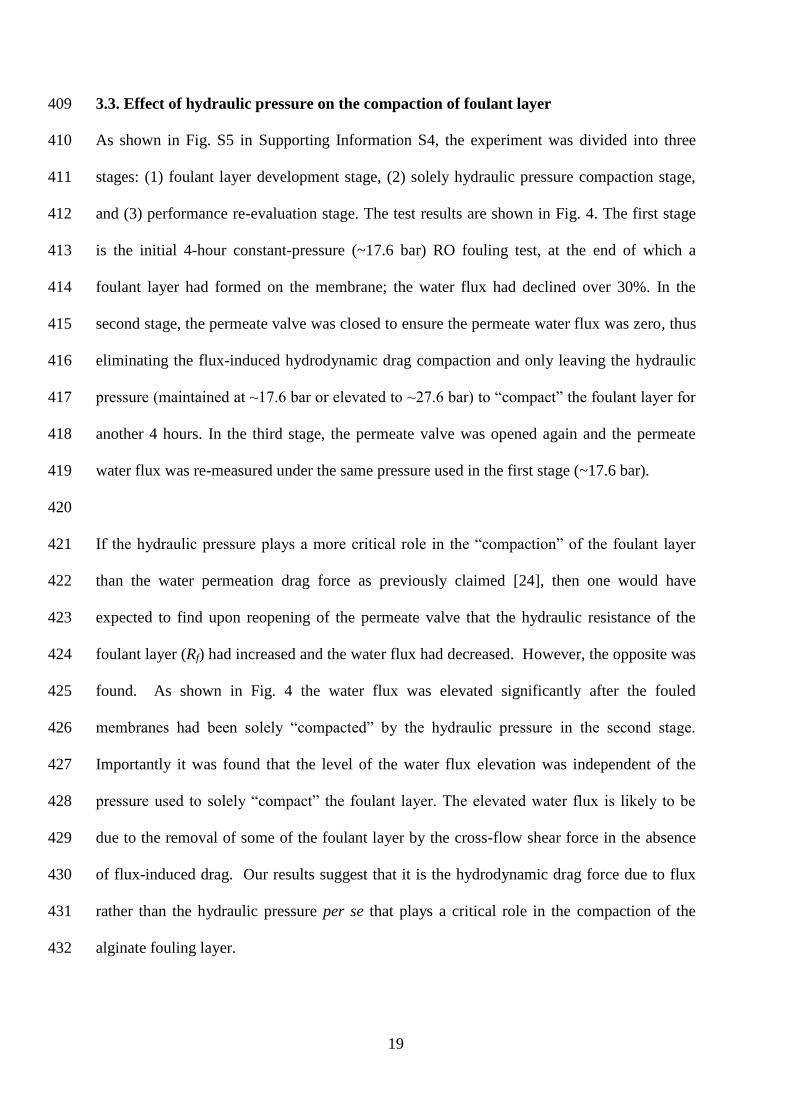
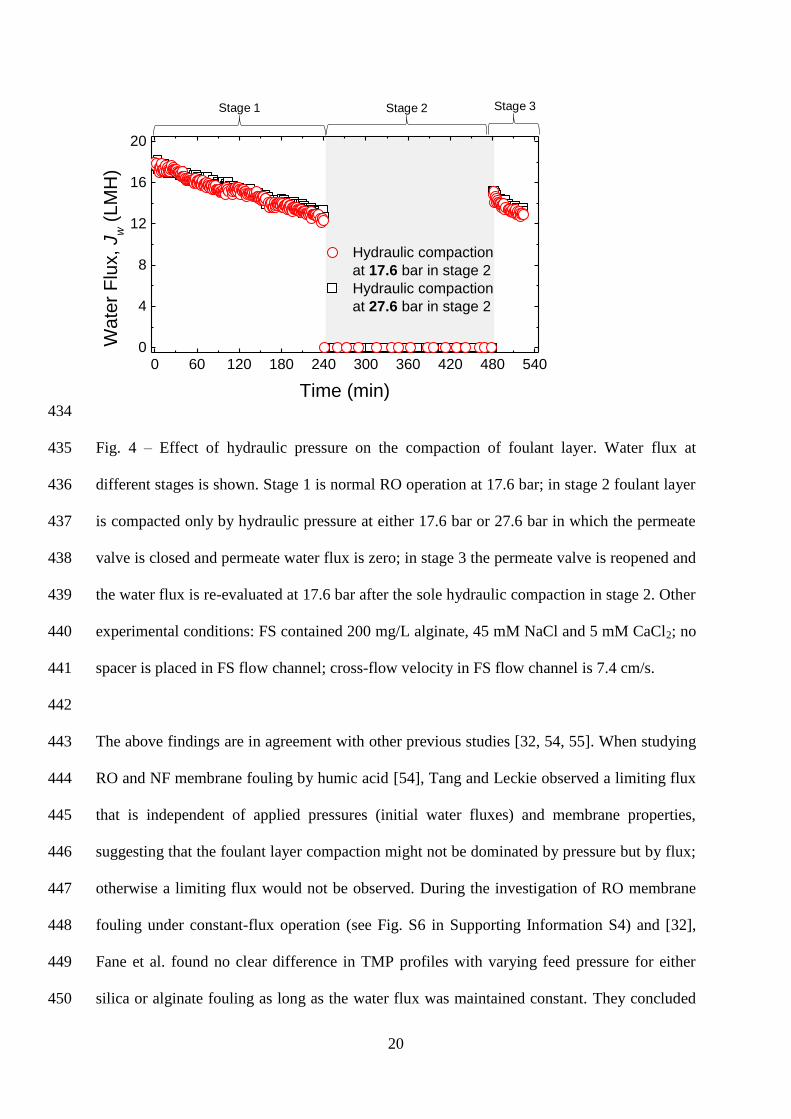
3.3. Effect of hydraulic pressure on the compaction of foulant layer 409
As shown in Fig. S5 in Supporting Information S4, the experiment was divided into three 410
stages: (1) foulant layer development stage, (2) solely hydraulic pressure compaction stage, 411
and (3) performance re-evaluation stage. The test results are shown in Fig. 4. The first stage 412
is the initial 4-hour constant-pressure (~17.6 bar) RO fouling test, at the end of which a 413
foulant layer had formed on the membrane; the water flux had declined over 30%. In the 414
second stage, the permeate valve was closed to ensure the permeate water flux was zero, thus 415
eliminating the flux-induced hydrodynamic drag compaction and only leaving the hydraulic 416
pressure (maintained at ~17.6 bar or elevated to ~27.6 bar) to ―compact‖ the foulant layer for 417
another 4 hours. In the third stage, the permeate valve was opened again and the permeate 418
water flux was re-measured under the same pressure used in the first stage (~17.6 bar). 419
420
If the hydraulic pressure plays a more critical role in the ―compaction‖ of the foulant layer 421
than the water permeation drag force as previously claimed [24], then one would have 422
expected to find upon reopening of the permeate valve that the hydraulic resistance of the 423
foulant layer (Rf) had increased and the water flux had decreased. However, the opposite was 424
found. As shown in Fig. 4 the water flux was elevated significantly after the fouled 425
membranes had been solely ―compacted‖ by the hydraulic pressure in the second stage. 426
Importantly it was found that the level of the water flux elevation was independent of the 427
pressure used to solely ―compact‖ the foulant layer. The elevated water flux is likely to be 428
due to the removal of some of the foulant layer by the cross-flow shear force in the absence 429
of flux-induced drag. Our results suggest that it is the hydrodynamic drag force due to flux 430
rather than the hydraulic pressure per se that plays a critical role in the compaction of the 431
alginate fouling layer. 432
20
433
434
Fig. 4 – Effect of hydraulic pressure on the compaction of foulant layer. Water flux at 435
different stages is shown. Stage 1 is normal RO operation at 17.6 bar; in stage 2 foulant layer 436
is compacted only by hydraulic pressure at either 17.6 bar or 27.6 bar in which the permeate 437
valve is closed and permeate water flux is zero; in stage 3 the permeate valve is reopened and 438
the water flux is re-evaluated at 17.6 bar after the sole hydraulic compaction in stage 2. Other 439
experimental conditions: FS contained 200 mg/L alginate, 45 mM NaCl and 5 mM CaCl2; no 440
spacer is placed in FS flow channel; cross-flow velocity in FS flow channel is 7.4 cm/s. 441
442
The above findings are in agreement with other previous studies [32, 54, 55]. When studying 443
RO and NF membrane fouling by humic acid [54], Tang and Leckie observed a limiting flux 444
that is independent of applied pressures (initial water fluxes) and membrane properties, 445
suggesting that the foulant layer compaction might not be dominated by pressure but by flux; 446
otherwise a limiting flux would not be observed. During the investigation of RO membrane 447
fouling under constant-flux operation (see Fig. S6 in Supporting Information S4) and [32], 448
Fane et al. found no clear difference in TMP profiles with varying feed pressure for either 449
silica or alginate fouling as long as the water flux was maintained constant. They concluded 450
Stage 1 Stage 2 Stage 3
0 60 120 180 240 300 360 420 480 5400
4
8
12
16
20
Hydraulic compaction
at 17.6 bar in stage 2
Hydraulic compaction
at 27.6 bar in stage 2
W
ate
r F
lux,
Jw (
LM
H)
Time (min)
21
that cake filtration is related to the differential pressure across the fouling layer that is 451
physically related to flux (Eq. (4)) rather than to the absolute pressure itself [56]. In a recent 452
study Tow and Lienhard found that alginate gel compaction by high feed hydraulic pressure 453
does not occur and suggested that other explanations should be sought for FO’s fouling 454
resistance relative to RO [55]. In the following sections we will explore further the 455
mechanisms governing the different fouling behaviours between FO and RO observed in this 456
study. 457
458
3.4. Mechanisms for the different fouling behaviours between FO and RO 459
3.4.1. ICP self-compensation effect 460
The difference in foulant accumulation between FO and RO can be attributed primarily to the 461
different responses of their driving forces to the water flux. For FO the effective osmotic 462
driving force is significantly influenced by the ICP that is exponentially proportional to the 463
water flux [35, 36]. A small variation of water flux can result in a significant variation of ICP 464
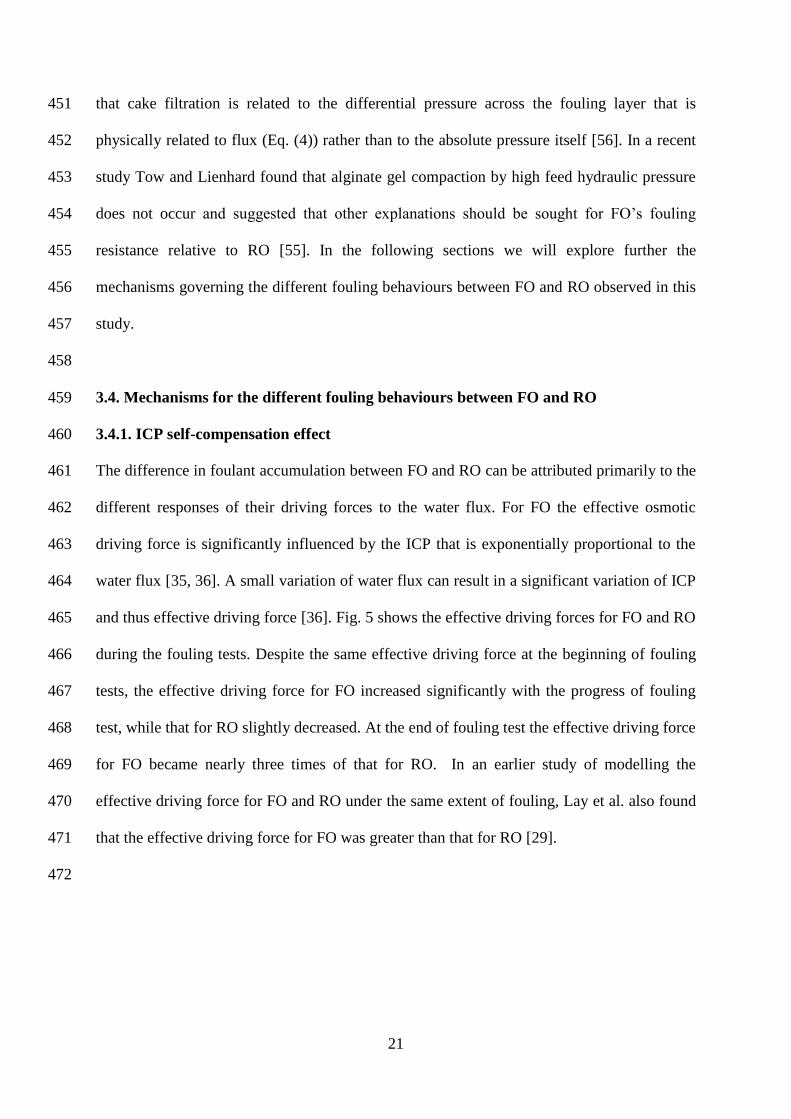
and thus effective driving force [36]. Fig. 5 shows the effective driving forces for FO and RO 465
during the fouling tests. Despite the same effective driving force at the beginning of fouling 466
tests, the effective driving force for FO increased significantly with the progress of fouling 467
test, while that for RO slightly decreased. At the end of fouling test the effective driving force 468
for FO became nearly three times of that for RO. In an earlier study of modelling the 469
effective driving force for FO and RO under the same extent of fouling, Lay et al. also found 470
that the effective driving force for FO was greater than that for RO [29]. 471
472
22
473
Fig. 5 – Comparison of effective driving force in FO and RO during the fouling test. 474
Effective driving force is the numerator of osmotic-resistance filtration models (Eq. (4) for 475
RO and Eq. (6) for FO) and is calculated using the experimentally obtained water flux in Fig. 476
2, specific reverse solute flux (Js/Jw) from Fig. S3 in Supporting Information S3 for FO, 477
rejection for RO from Fig. S4 in Supporting Information S3, and basic membrane parameters 478
(Rm and S), and incorporating the cake-enhanced concentration polarization. 479
480
The progressively increased effective driving force in FO is due to the ICP self-compensation 481
effect [36, 37]. That is, the decreased water flux due to membrane fouling results in a 482
decrease in ICP, which in turn leads to an increase in the effective osmotic driving force. The 483
different evolution of fouling in FO and RO is elaborated through simulation as discussed in 484
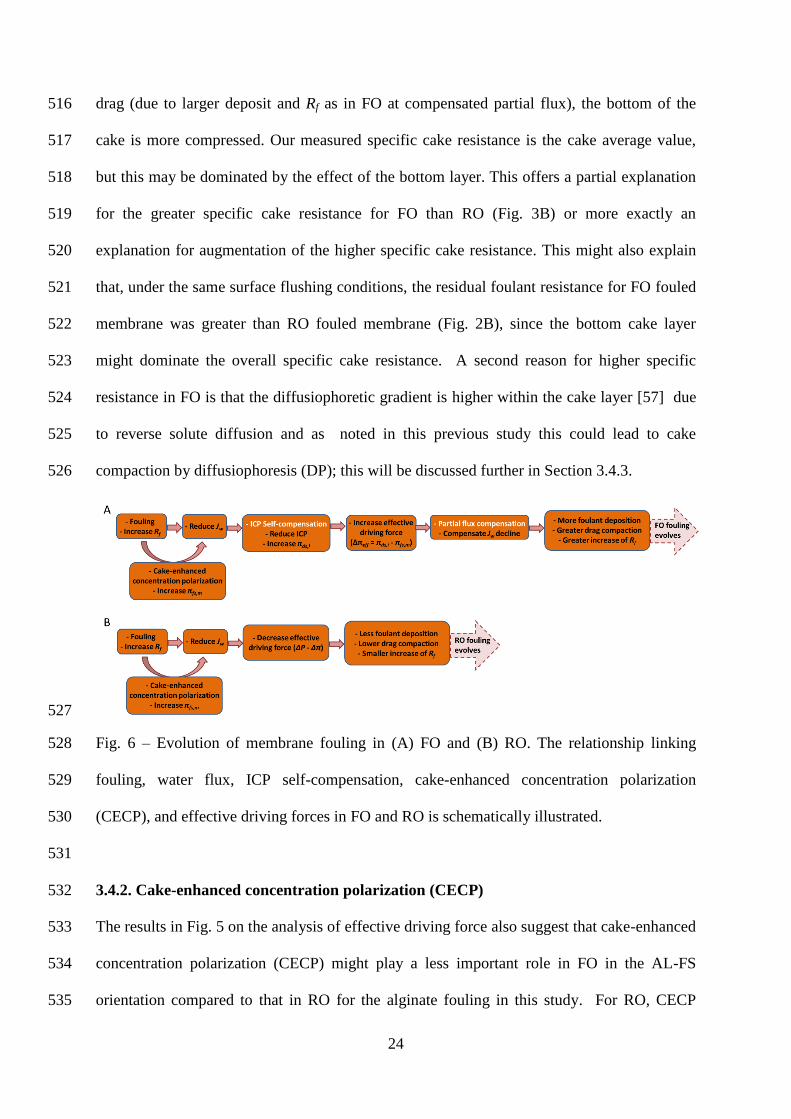
detail in Section 3.5 and as shown in Fig. 8 later. Here a pictorial explanation is given. 485
Although there are not discreet steps, one can view the evolution of the flux decline as 486
consisting of a number of components as depicted in Fig. 6A. The increase in the effective 487
driving force in FO leads to partial flux compensation which in turn leads to greater foulant 488
accumulation. More accumulation leads to a further decrease in water flux and with the 489
decreased water flux (and the consequent ICP self-compensation) the process continues until 490
0 120 240 360 480 600 720 840 9600
10
20
30
40
50
FO
RO
Effective d
rivin
g forc
e (
bar)
Time (min)
23
there is a balance between foulant being convected to the surface and foulant being removed 491
by crossflow. 492
493
In contrast, the effective driving force for RO (i.e., the difference between the hydraulic 494
pressure and the osmotic pressure) responds much less significantly to the change of water 495
flux, noting that in RO only external CP changes with flux but hydraulic pressure is 496
maintained constant. It could even decrease with the progression of fouling due to increased 497
cake-enhanced concentration polarization (Fig. 6B). Thus, the compensation for partial flux 498
decline is much weaker or does not exist for RO. Consequently, the increase of foulant 499
resistance for RO is much smaller than that for FO (Fig. 2A) and the foulant deposit in RO is 500
smaller than FO (Fig. 3A). 501
502
The evolution of foulant accumulation (Rf) can also be explained mathematically by 503
differentiating the water flux equation with respect to time (t), which is easy to 504
show that 505
⁄
( ⁄ )
⁄
(9) 506
where J is water flux, F is driving force, and R is resistance. Thus the relative increase in 507
resistance at any point during the evolution of the resistance is the sum of the relative flux 508
decline and the relative increase in driving force. In the case of RO the third term is 509
negligible or very small but in the case of FO it is not. Therefore for the similar water flux 510
decline profile, the increase in resistance for FO is increasingly greater than RO. 511
512
It is well known that for a compressible filter cake that the porosity at the bottom, i.e., nearest 513
the support (it is membrane in our case), is lowest. This is because the bottom layers of the 514
cake have to support the drag forces imparted on the top layer of the cake. If there is more 515
24
drag (due to larger deposit and Rf as in FO at compensated partial flux), the bottom of the 516
cake is more compressed. Our measured specific cake resistance is the cake average value, 517
but this may be dominated by the effect of the bottom layer. This offers a partial explanation 518
for the greater specific cake resistance for FO than RO (Fig. 3B) or more exactly an 519
explanation for augmentation of the higher specific cake resistance. This might also explain 520
that, under the same surface flushing conditions, the residual foulant resistance for FO fouled 521
membrane was greater than RO fouled membrane (Fig. 2B), since the bottom cake layer 522
might dominate the overall specific cake resistance. A second reason for higher specific 523
resistance in FO is that the diffusiophoretic gradient is higher within the cake layer [57] due 524
to reverse solute diffusion and as noted in this previous study this could lead to cake 525
compaction by diffusiophoresis (DP); this will be discussed further in Section 3.4.3. 526
527
Fig. 6 – Evolution of membrane fouling in (A) FO and (B) RO. The relationship linking 528
fouling, water flux, ICP self-compensation, cake-enhanced concentration polarization 529
(CECP), and effective driving forces in FO and RO is schematically illustrated. 530
531
3.4.2. Cake-enhanced concentration polarization (CECP) 532
The results in Fig. 5 on the analysis of effective driving force also suggest that cake-enhanced 533
concentration polarization (CECP) might play a less important role in FO in the AL-FS 534
orientation compared to that in RO for the alginate fouling in this study. For RO, CECP 535
25
could result in the decrease of effective driving force that further aggravates the decrease of 536
water flux. However, for FO, CECP would not change the trend where the effective driving 537
force tends to increase with the progress of fouling. The reasoning again relates to the ICP 538
self-compensation effect – the decreased ICP at the draw side due to the decrease of water 539
flux by fouling was much more significant than the cake-enhanced CP at the feed side in this 540
study. This was further demonstrated through sensitivity analysis for a wide range of 541
scenarios - see Fig. B1b in Appendix B. This shows that the increase of effective driving 542
force for FO could be moderately slowed down at an increased CECP, but the overall trend 543
(effective driving force for FO significantly > RO) remains unchanged as long as the fouling 544
continues to lead to an increase of foulant resistance (Rf). This finding supports an earlier 545
study on the modelling of the effect of feed concentration on FO water flux, where She et al. 546
suggested that CECP might not be important for FO in the AL-FS membrane orientation due 547
to the strong ICP self-compensation effect [37]. 548
549
3.4.3. Reverse solute diffusion (RSD) 550
The reverse diffusion of draw solute into the FS can influence the fouling behaviour (either 551
increasing or decreasing fouling) due to the change of local feed solution chemistry near the 552
FO membrane surface, which has been identified to be a unique fouling mechanism for 553
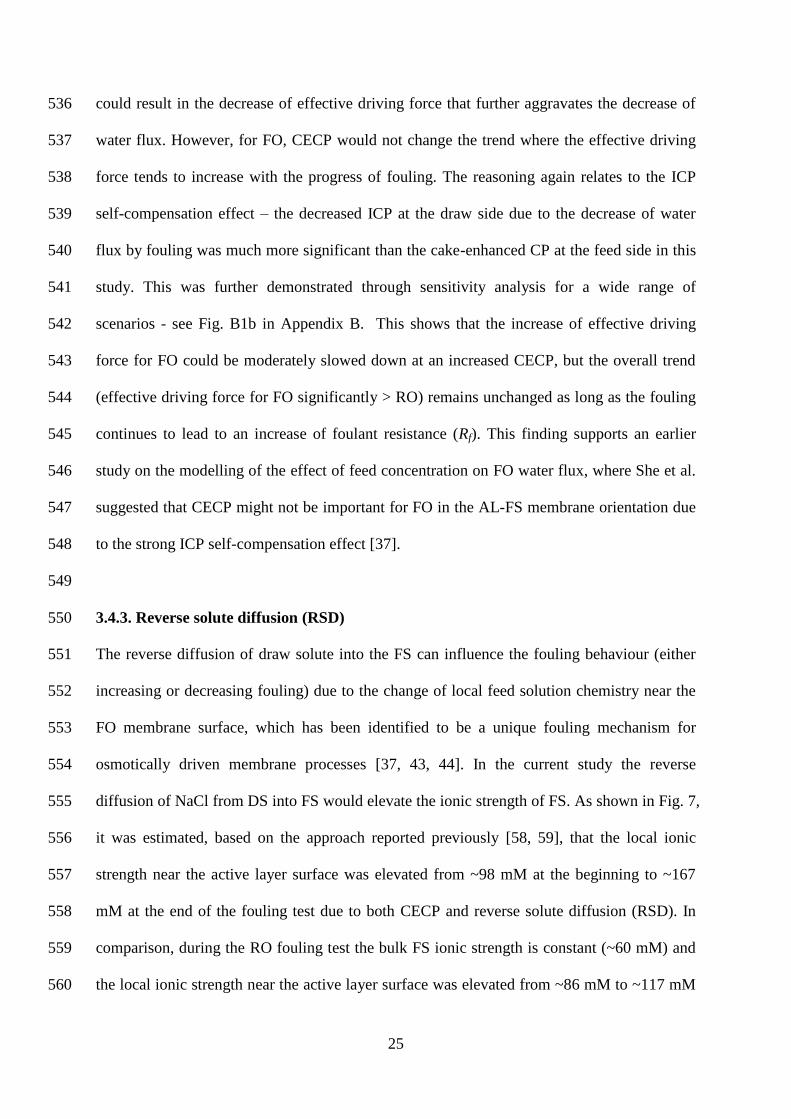
osmotically driven membrane processes [37, 43, 44]. In the current study the reverse 554
diffusion of NaCl from DS into FS would elevate the ionic strength of FS. As shown in Fig. 7, 555
it was estimated, based on the approach reported previously [58, 59], that the local ionic 556
strength near the active layer surface was elevated from ~98 mM at the beginning to ~167 557
mM at the end of the fouling test due to both CECP and reverse solute diffusion (RSD). In 558
comparison, during the RO fouling test the bulk FS ionic strength is constant (~60 mM) and 559
the local ionic strength near the active layer surface was elevated from ~86 mM to ~117 mM 560
26
due to CECP. It has been reported that with an increased ionic strength, the alginate fouling 561
rate reduces when the feed solution has a high Ca2+
concentration (> 1 mM) [60, 61] due to 562
the reduced binding affinity between Ca2+
and carboxyl units of the organic compounds [60-563
63]. Owing to the relatively high Ca2+
concentration (5 mM) in the feed solution in the 564
present study, it was expected that the increased ionic strength at the feed side in FO due to 565
reverse diffusion of NaCl could lead to a decreased specific cake resistance. However 566
experimental results in Fig. 2 show that the specific cake resistance as well as the overall 567
foulant resistance was greater for FO compared with RO. This suggests there would be other 568
reasons. In addition to the ICP self-compensation as discussed in Section 3.4.1, another 569
potential contributing effect is diffusiophoresis (DP) [57]. 570
571
In FO, due to RSD, there would be a steeper concentration gradient of salinity across the 572
foulant layer, which aligns with estimates in Fig 7. This would invoke a stronger 573
diffusiophoresis (DP) effect in FO than RO, particularly if the feed solution is of low salinity. 574
This stronger effect in FO may not only lead to a great specific resistance but could also 575
augment the degree of deposition. Whilst the greater foulant load in FO compared to RO is 576
definitely due in part to the decrease in the intensity of ICP with time, and hence the increase 577
in effective driving force, it may be augmented by DP. Previous work has shown that the 578
critical flux for a feed consisting principally of humic acid had a lower value with an RO 579
membrane compared to the value for a UF membrane. (Taheri paper JMS 2015). Now this 580
was partially attributed to DP because for the RO membrane (unlike the UF one) salt 581
gradients would be established. The plateau fluxes in Fig. 1 (which can be taken as a 582
measure of the critical fluxes) are lower for FO than RO by around 10-15% and this accords 583
with DP having a potential role in determining the net flux of foulants towards the membrane 584
surface. 585
27
586
587
Fig. 7 – Estimated local ionic strength near the membrane active layer surface for FO and RO 588
during the fouling test. The calculation of local ionic strength followed the method reported 589
previously [58, 59] incorporating cake-enhanced concentration polarization. 590
591
3.5. Implications 592
The above experimental results show that although FO is more prone to fouling in terms of 593
more foulant accumulation and greater foulant hydraulic resistance than RO, the water flux in 594
FO might be more stable against fouling, which could enable FO to be a more resilient 595
process in some applications. This is further elaborated in this section by the simulation of 596
FO and RO water fluxes as a function of the extent of fouling (i.e., foulant resistance) in Fig. 597
8. The slope of Fig. 8 was mathematically derived in Appendix C to further help the analysis 598
of the fouling behaviour. For the same extent of fouling (i.e., at the same Rf when 0fR ) it 599
is apparent that the water flux for FO is intrinsically higher than that for RO, demonstrating 600
the superiority of FO to RO in terms of water flux performance. However, the same extent of 601
fouling will not be a stable condition in a practical operation. This is because a higher flux in 602
FO under such conditions would bring more foulants towards the membrane and lead to a 603
0 120 240 360 480 600 720 840 9600
50
100
150
200
FO
RO
Local Io
nic
Str
ength
(m
M)
Time (min)
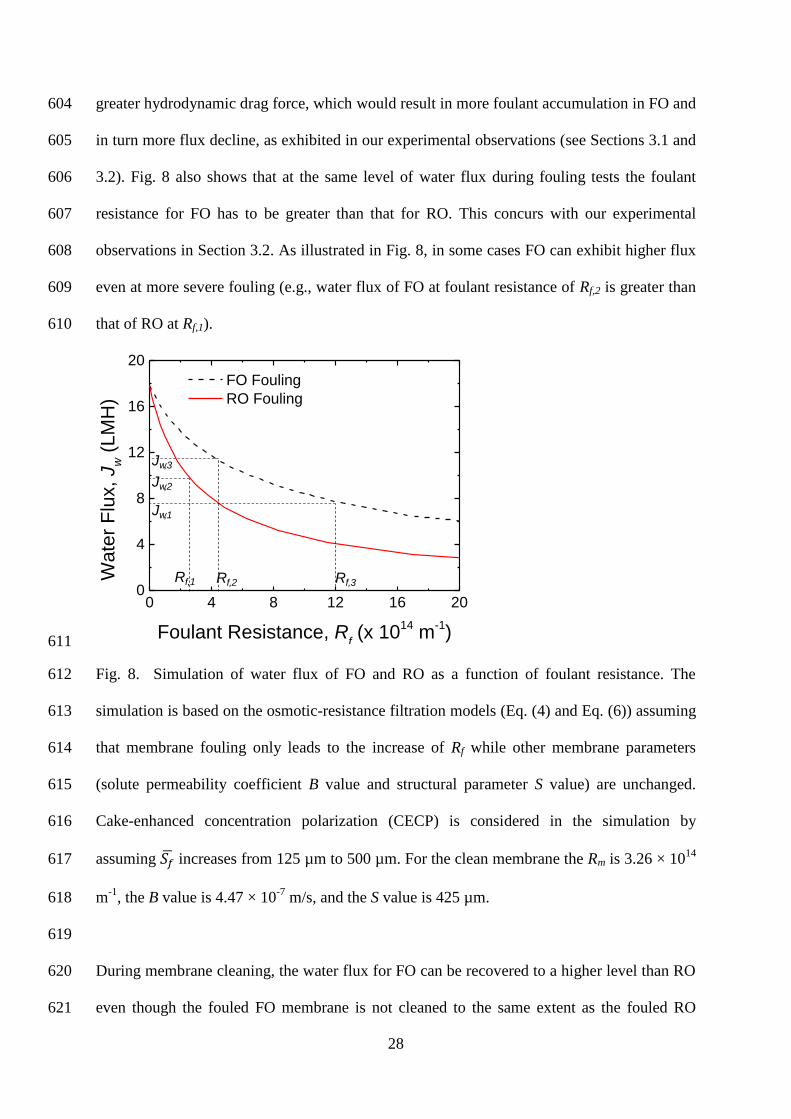
28
greater hydrodynamic drag force, which would result in more foulant accumulation in FO and 604
in turn more flux decline, as exhibited in our experimental observations (see Sections 3.1 and 605
3.2). Fig. 8 also shows that at the same level of water flux during fouling tests the foulant 606
resistance for FO has to be greater than that for RO. This concurs with our experimental 607
observations in Section 3.2. As illustrated in Fig. 8, in some cases FO can exhibit higher flux 608
even at more severe fouling (e.g., water flux of FO at foulant resistance of Rf,2 is greater than 609
that of RO at Rf,1). 610
611
Fig. 8. Simulation of water flux of FO and RO as a function of foulant resistance. The 612
simulation is based on the osmotic-resistance filtration models (Eq. (4) and Eq. (6)) assuming 613
that membrane fouling only leads to the increase of Rf while other membrane parameters 614
(solute permeability coefficient B value and structural parameter S value) are unchanged. 615
Cake-enhanced concentration polarization (CECP) is considered in the simulation by 616
assuming increases from 125 µm to 500 µm. For the clean membrane the Rm is 3.26 × 10¹⁴
617
m-1
, the B value is 4.47 × 10⁻⁷
m/s, and the S value is 425 µm. 618
619
During membrane cleaning, the water flux for FO can be recovered to a higher level than RO 620
even though the fouled FO membrane is not cleaned to the same extent as the fouled RO 621
0 4 8 12 16 200
4
8
12
16
20
FO Fouling
RO Fouling
Wate
r F
lux,
Jw (
LM
H)
Foulant Resistance, Rf (x 10
14 m
-1)
Rf,3Rf,2Rf,1
Jw,1
Jw,2
Jw,3
29
membrane. This point is illustrated in Fig. 8. Considering that the foulant resistance for FO is 622
reduced from Rf,3 to Rf,2 after membrane cleaning (Fig. 8), the water flux for FO will still be 623
greater than that for RO when the foulant resistance is reduced from Rf,2 to Rf,1 in Fig. 8. 624
Again this indicates that the change of water flux in FO in response to a given change of 625
foulant resistance (i.e. fouling) is much less than that in RO. This also explains why fouling 626
reversibility, based on measured water fluxes, appears to be more effective for FO than RO 627
[19-25, 27]. This is not due to the foulant layer in FO being less compacted (indeed on the 628
contrary we found the specific resistance to be higher for FO) but because the change in ICP 629
(and thus the change in effective driving force) in FO leads to a higher flux in the presence of 630
residual fouling. 631
632
The above modelling does not incorporate the influence of diffusiophoretic deposition (DP). 633
As elegantly illustrated in Fig.9 of their paper, Guha et al [57] showed that for filtration-634
based particle deposition leading to convective cake formation one can often expect filtration-635
based ion concentration polarization which leads to diffusiophoretic movement augmenting 636
particle deposition and this in turn creates both a greater level of cake formation and 637
compaction, and further enhanced ion concentration polarization. Thus there is a positive 638
feed-back loop further enhancing fouling. 639
640
In summary, the advantage of greater water flux stability of FO over RO is due to the ICP 641
self-compensation effect for FO that can result in a partial water flux compensation and 642
leverage the water flux decline by increasing the effective driving force. Our results suggest 643
that, contrary to earlier reports, FO does not benefit from less foulant compression due to its 644
low hydraulic pressure operation. While ICP is generally regarded as a detrimental effect for 645
FO, the current study reveals that ICP can also have an upside in that it helps to maintain 646
30
water flux stability. An interesting corollary to this is that the quest for FO membranes with 647
smaller and smaller S values to reduce ICP needs to consider whether there is an optimal S 648
value that balances the magnitude of flux decline and the resilience that the ICP 649
compensation imparts upon the system. 650
651
4. Conclusions 652
In this study the differences in membrane fouling between FO and RO were explored under 653
comparably controlled experimental conditions in which the apparent driving forces for FO 654
and RO were maintained constant. Sodium alginate was the foulant. It was found that: 655
1. Water flux decline during both FO and RO fouling tests followed broadly the same trend 656
and water flux recovery after membrane cleaning for both FO and RO reached a similar 657
level. However, the driving forces of FO and RO respond differently to the progression of 658
fouling and as a result the foulant resistance for FO was increasingly greater than that for 659
RO. 660
2. Membrane autopsy after the fouling tests showed that more foulant had been deposited on 661
the FO fouled membrane than the RO fouled membrane. Also, the specific foulant 662
resistance was greater with FO than RO. 663
3. The dominant reason for the higher fouling propensity in FO is due to the change of ICP 664
and effective driving force in response to the evolution of fouling; it is true for all systems 665
with manifest ICP. 666
4. Calculations suggest that CECP does not play an important role in flux decline in FO due 667
to the dominance of the ICP self-compensation effect. 668
5. The reverse diffusion of draw solute into feed solution could also influence fouling in FO 669
in two ways. Firstly directly as a result in the change of feed solution chemistry, an effect 670
that is strongly dependent on the draw solution properties. Secondly RSD will also 671
31
influence the salinity gradient across the FO foulant layer. This gradient will be greater in 672
FO than the corresponding one for RO and probably led to diffusiophoresis (DP). The 673
role of DP in FO is worthy of further investigation. 674
6. No evidence was found that hydraulic pressure in RO plays a critical role in the 675
compaction of alginate fouling layers. Furthermore the generally observed high flux 676
reversibility of FO after membrane cleaning is probably due to the change of ICP (and 677
thus effective driving force) in response to fouling rather than the lack of compaction due 678
to hydraulic pressure. 679
7. Overall and not withstanding its higher fouling propensity, FO was found to exhibit 680
higher flux stability against membrane fouling. Excluding those applications where the 681
reverse salt flux generates additional fouling FO is potentially a more resilient process 682
than RO. 683
684
Acknowledgements 685
This research was supported by a grant from the Singapore National Research Foundation 686
under its Environmental and Water Technologies Strategic Research Programme and 687
administered by the Environment and Water Industry Programme Office (EWI) of the PUB 688
under the project number: 1102-IRIS-07-01. Q.S. is grateful to the support of FEIT ECR and 689
Newly Appointed Staff Funding Scheme at The University of Sydney. Professor Rong Wang 690
and Professor Chuyang Tang are thanked for their valuable comments. F.A.S. is grateful to 691
SMTC at NTU, Singapore for hosting a year-long research visit. 692
693
Appendix A. Derivation of osmotic-resistance filtration model for RO 694
The osmotic-resistance filtration model of Eq. (A1) is originally derived for osmotically 695
driven membrane processes and differentiates all the driving forces incorporating 696
concentration polarization and reverse solute diffusion [37]. 697
32
( ) (
) (
)
(A1) 698
where and are the concentrative external concentration polarization (ECP) factor at 699
the feed side and dilutive concentration polarization (DCP) factor at the draw side 700
respectively. They are expressed by Eq. (A2) and Eq. (A3). 701
(
) (A2) 702
(
) (
⁄) (A3) 703
Eq. (A1) is also applicable for RO and can be expressed as Eq. (A4) considering the direction 704
of water flux and solute flux as well as the redefinition of signs to represent the parameters 705
for RO. 706
( ) (
)
(A4) 707
At equilibrium DCP does not exist in RO and the specific solute flux (
) can be correlated to 708
the permeate concentration ( ) by Eq. (A5). 709
(A5) 710
Inserting Eq. (A2) and Eq. (A5) into Eq. (A4) yields the expected equation: 711
( ) (
)
(A6) 712
By assuming that the concentration and osmotic pressure follow the van’t Hoff equation, the 713
solute rejection in RO can be expressed below. 714
(A7) 715
Inserting Eq. (A7) into Eq. (A6) yields 716
(
)
(A8) 717
33
718
Appendix B. Sensitivity analysis of the effect of cake-enhanced concentration 719
polarization (CECP) on the calculated values of foulant resistance Rf 720
This section shows the results of a sensitive analysis in which the influence of assumed levels 721
of cake-enhanced concentration polarization (CECP) on the calculated for FO and RO 722
were explored. was calculated for the following four scenarios using the experimentally 723
measured data (i.e., , , , S, and ). 724
Case (1): ECP at the feed side is neglected (i.e., assuming in Eq. (5)). 725
Case (2): ECP at the feed side is considered but CECP is neglected (i.e., assuming 726
and in Eq. (5); using of 125 µm that is estimated for empty flow channel 727
following the method reported elsewhere [46]). 728
Case (3): CECP is considered and is the same for both FO and RO (i.e., assuming that 729
for both FO and RO increases at the same rate with the progress of fouling test from 730
125 µm at the beginning of fouling test to 422 µm at the end of fouling test). 731
Case (4): CECP is considered and for FO becomes increasingly greater than that for 732
RO based on the analysis of Tow et al. [31] (i.e., for FO increases faster with the 733
progress of fouling than that for RO; specifically it was assumed that for FO increases 734
from 125 µm to 719 µm whilst that for RO increases from 125 µm to 422 µm during the 735
fouling tests). 736
As shown in Fig. B1a, for all the scenarios for both FO and RO increased with the 737
progress of fouling test. Moreover, although the increase of concentration polarization from 738
Case (1) to (4) at a fixed time could decrease the calculated for both FO and RO, for all 739
scenarios for FObecomes increasingly greater than that for RO. Note that for Case (4) the 740
selected range of for FO from 125 µm to 719 µm over the testing period approaches an 741
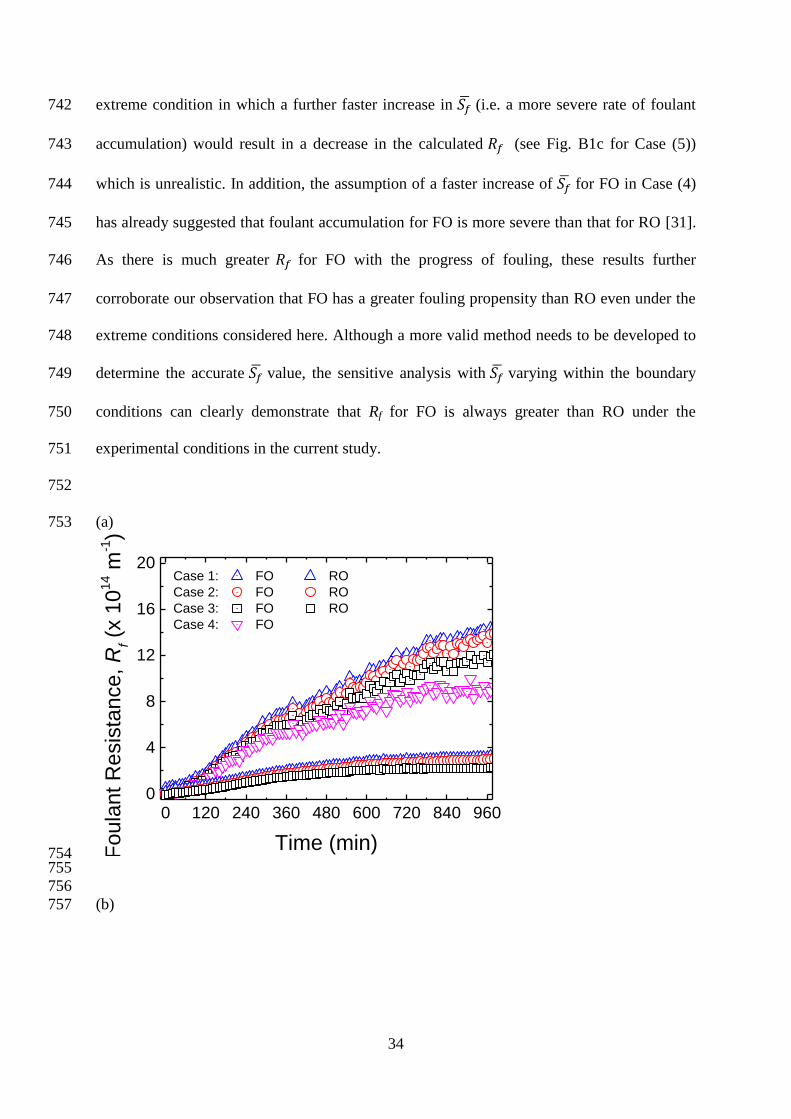
34
extreme condition in which a further faster increase in (i.e. a more severe rate of foulant 742
accumulation) would result in a decrease in the calculated (see Fig. B1c for Case (5)) 743
which is unrealistic. In addition, the assumption of a faster increase of for FO in Case (4) 744
has already suggested that foulant accumulation for FO is more severe than that for RO [31]. 745
As there is much greater for FO with the progress of fouling, these results further 746
corroborate our observation that FO has a greater fouling propensity than RO even under the 747
extreme conditions considered here. Although a more valid method needs to be developed to 748
determine the accurate value, the sensitive analysis with varying within the boundary 749
conditions can clearly demonstrate that Rf for FO is always greater than RO under the 750
experimental conditions in the current study. 751
752
(a) 753
754 755
756
(b) 757
0 120 240 360 480 600 720 840 9600
4
8
12
16
20
Case 1: FO RO
Case 2: FO RO
Case 3: FO RO
Case 4: FO
Foula
nt R
esis
tance,
Rf (
x 1
014 m
-1)
Time (min)
35
758 759
(c) 760
761 762
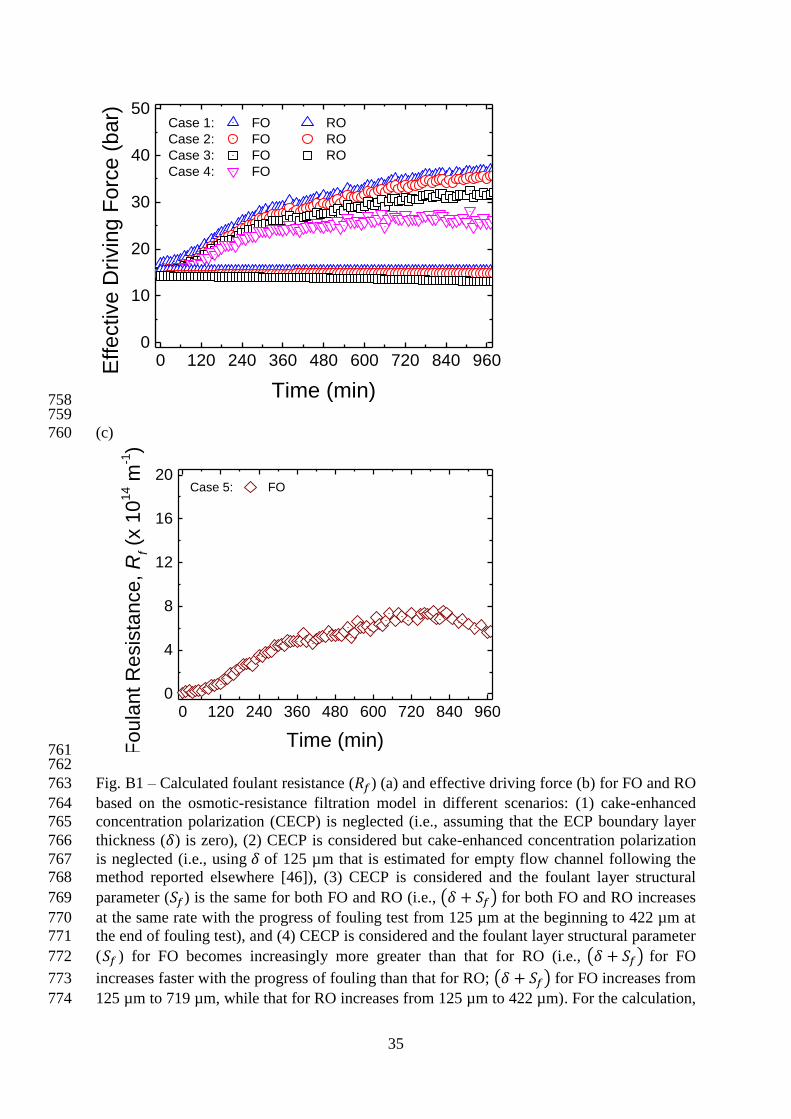
Fig. B1 – Calculated foulant resistance ( ) (a) and effective driving force (b) for FO and RO 763
based on the osmotic-resistance filtration model in different scenarios: (1) cake-enhanced 764
concentration polarization (CECP) is neglected (i.e., assuming that the ECP boundary layer 765
thickness ( ) is zero), (2) CECP is considered but cake-enhanced concentration polarization 766
is neglected (i.e., using of 125 µm that is estimated for empty flow channel following the 767
method reported elsewhere [46]), (3) CECP is considered and the foulant layer structural 768
parameter ( ) is the same for both FO and RO (i.e., ( ) for both FO and RO increases 769
at the same rate with the progress of fouling test from 125 µm at the beginning to 422 µm at 770
the end of fouling test), and (4) CECP is considered and the foulant layer structural parameter 771
( ) for FO becomes increasingly more greater than that for RO (i.e., ( ) for FO 772
increases faster with the progress of fouling than that for RO; ( ) for FO increases from 773
125 µm to 719 µm, while that for RO increases from 125 µm to 422 µm). For the calculation, 774
0 120 240 360 480 600 720 840 9600
10
20
30
40
50
Case 1: FO RO
Case 2: FO RO
Case 3: FO RO
Case 4: FO
Effe
ctive
Drivin
g F
orc
e (
ba
r)
Time (min)
0 120 240 360 480 600 720 840 9600
4
8
12
16
20
Case 5: FO
Fo
ula
nt
Re
sis
tan
ce
, R
f (x 1
014 m
-1)
Time (min)
36
the experimentally obtained clean membrane resistance Rm is 3.26 × 10¹⁴
m-1
and structural 775
parameter S is 425 µm. (c) foulant resistance ( ) for case (5) when the has a faster 776
increase than that in case (4). 777
778
Fig. B1b shows the effective driving force for FO and RO. For all the Cases the effective 779
driving force for FO increased with the progress of fouling test and became increasingly 780
greater than that for RO. In contrast to FO, the effective driving force for RO behaved 781
differently for different scenarios: it maintained constant for Case (1), increased gradually 782
with fouling test for Case (2), and decreased gradually with fouling test for Case (3). 783
Although the increase of concentration polarization from Case (1) to Case (4) led to the 784
decrease of effective driving force for both FO and RO at a fixed time of fouling test, the 785
effective driving force for FO was always increasing with the fouling test and becoming 786
increasingly greater than that for RO. This suggests that (1) the different response of the 787
effective driving force to fouling test between FO and RO is the major reason for their 788
different fouling behaviours, and (2) CECP for FO plays a much less important role in flux 789
decline than it does for RO. 790
791
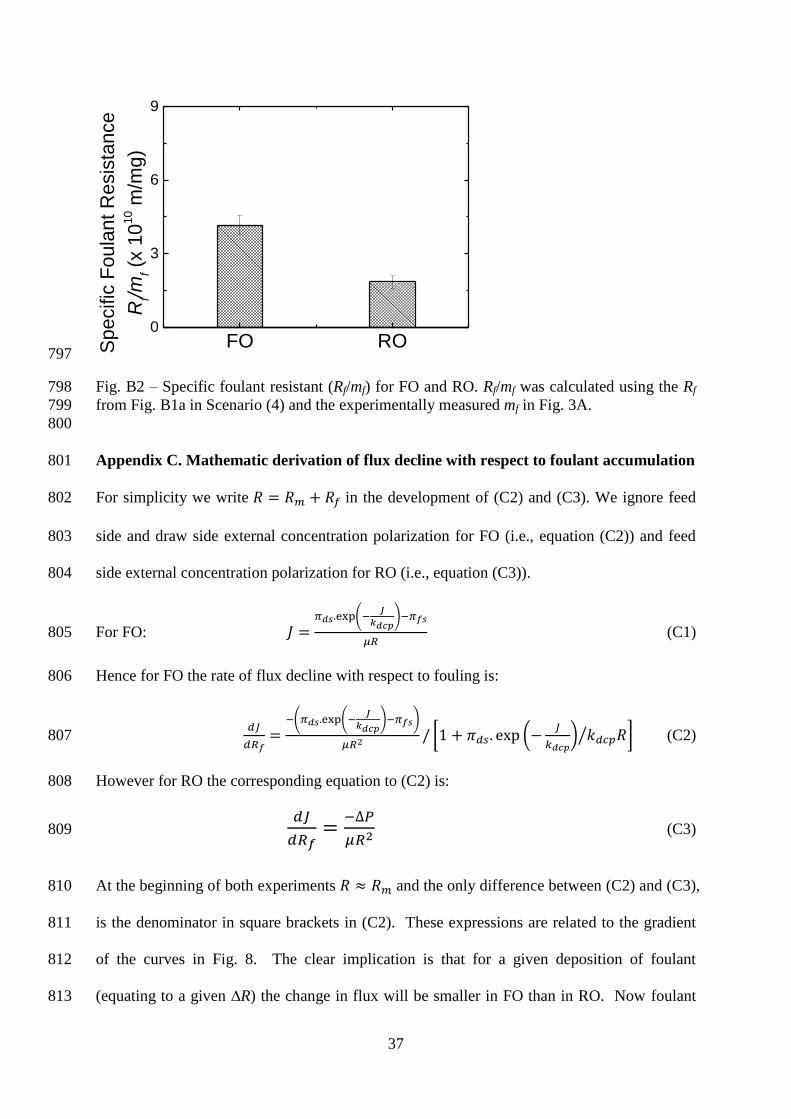
Fig. B2 shows the calculated specific foulant resistance ( ⁄ ) using the experimentally 792
measured foulant deposition density ( ) and calculated in Case (4) that is under the 793
extreme conditions. Interestingly, the specific foulant resistance ( ⁄ ) for FO is still 794
consistently greater than RO even under the case of extreme conditions. 795
796
37
797
Fig. B2 – Specific foulant resistant (Rf/mf) for FO and RO. Rf/mf was calculated using the Rf 798
from Fig. B1a in Scenario (4) and the experimentally measured mf in Fig. 3A. 799
800
Appendix C. Mathematic derivation of flux decline with respect to foulant accumulation 801
For simplicity we write in the development of (C2) and (C3). We ignore feed 802
side and draw side external concentration polarization for FO (i.e., equation (C2)) and feed 803
side external concentration polarization for RO (i.e., equation (C3)). 804
For FO: (
)
(C1) 805
Hence for FO the rate of flux decline with respect to fouling is: 806
( (
) )
[ (
) ⁄ ] (C2) 807
However for RO the corresponding equation to (C2) is: 808
(C3) 809
At the beginning of both experiments and the only difference between (C2) and (C3), 810
is the denominator in square brackets in (C2). These expressions are related to the gradient 811
of the curves in Fig. 8. The clear implication is that for a given deposition of foulant 812
(equating to a given ∆R) the change in flux will be smaller in FO than in RO. Now foulant 813
FO RO0
3
6
9
Specific
Foula
nt R
esis
tance
Rf/m
f (x 1
010 m
/mg)
38
accumulation can be expected to continue at a decreasing rate until there is a balance between 814
deposition, by convective flow to and through the membrane, and removal by shear [64]. 815
Now given that flux is declining more slowly with respect to a given amount of foulant 816
accumulation in FO than RO there will naturally be a greater amount of foulant deposition in 817
FO before the limiting flux is reached. 818
819
Appendix D. Supplementary material 820
The supplementary data can be found online via the link of http:// 821
822
823
824
39
Abbreviations 825
826
AL–FS active layer facing feed side 827
CECP cake-enhanced concentration polarisation 828
CEOP cake-enhanced osmotic pressure 829
CP concentration polarisation 830
CTA cellulose triacetate 831
DCP dilutive concentration polarisation 832
DI de-ionised 833
DS draw solution 834
ECP external concentration polarisation 835
FO forward osmosis 836
FS feed solution 837
ICP internal concentration polarisation 838
NF nanofiltration 839
ODMPs osmotically driven membrane processes 840
ORF osmotic-resistance filtration 841
RO reverse osmosis 842
RSD reverse solute diffusion 843
844
845
846
Nomenclature 847
848
A water permeability coefficient (m3/m
2-Pa) 849
B solute permeability coefficient (m3/m
2) 850
C concentration (moles/m3) 851
D diffusion coefficient (m2/s) 852
Fcecp concentration polarization factor for CECP (dimensionless) 853
Fdcp concentration polarization factor for DCP (dimensionless) 854
Fecp concentration polarization factor for ECP (dimensionless) 855
Js solute flux (m3/m
2 s) 856
Jw water flux (m3/m
2 s) 857
Jw,f fouling water flux (m3/m
2 s) 858
k mass transfer coefficient (m/s) 859
kcecp mass transfer coefficient near the membrane surface (m/s) 860
kecp,f overall mass transfer coefficient across the foulant layer and external 861
concentration polarization boundary layer (m/s) 862
kecp,f* mass transfer coefficient within the foulant layer on the membrane (m/s) 863
kecp,o mass transfer coefficient to the ECP boundary layer above the foulant layer 864
(m/s) 865
M molar (moles/m3) 866
mf mass deposition density (g/m2) 867
Rf foulant resistance (m-1
) 868
Rf/mf specific foulant resistance (m/g) 869
Rg universal gas constant (8.3145 m3 Pa mol
–1 K
–1) 870
Rm hydraulic resistance of the membrane (m–1
) 871
40
S structural parameter (m–1
) 872
Sf structural parameter of the foulant layer (m–1
) 873
overall effective thickness of the CP boundary layer (m) 874
T temperature (K) 875
TMP transmembrane pressure (Pa) 876
TOC total organic carbon (g/m3) 877
van’t Hoff coefficient 878
boundary layer thickness (m) 879
fluid viscosity (Pa s) 880
rej solute rejection 881
ds osmotic pressure of the draw solution (Pa) 882
fs osmotic pressure of the feed solution (Pa) 883
fs,m osmotic pressure of the feed solution at the membrane surface (Pa) 884
i osmotic pressure of the draw at the interface between the active layer of the 885
membrane and the support 886
Δπ osmotic pressure difference across the membrane (Pa) 887
P effective applied hydraulic pressure (Pa) 888
889
890
41
References 891
[1] T.Y. Cath, A.E. Childress, M. Elimelech, Forward osmosis: Principles, applications, and 892
recent developments, J. Membr. Sci., 281 (2006) 70-87. 893
[2] S. Zhao, L. Zou, C.Y. Tang, D. Mulcahy, Recent developments in forward osmosis: 894
Opportunities and challenges, J. Membr. Sci., 396 (2012) 1-21. 895
[3] R. Valladares Linares, Z. Li, S. Sarp, S. Bucs, G. Amy, J.S. Vrouwenvelder, Forward 896
osmosis niches in seawater desalination and wastewater reuse, Water Res., 66 (2014) 122-897
139. 898
[4] G. Blandin, A. Verliefde, J. Comas, I. Rodriguez-Roda, P. Le-Clech, Efficiently 899
Combining Water Reuse and Desalination through Forward Osmosis—Reverse Osmosis 900
(FO-RO) Hybrids: A Critical Review, Membranes, 6 (2016) 37. 901
[5] K. Lutchmiah, A.R.D. Verliefde, K. Roest, L.C. Rietveld, E.R. Cornelissen, Forward 902
osmosis for application in wastewater treatment: A review, Water Res., 58 (2014) 179-197. 903
[6] X. Wang, V.W.C. Chang, C.Y. Tang, Osmotic membrane bioreactor (OMBR) technology 904
for wastewater treatment and reclamation: Advances, challenges, and prospects for the future, 905
J. Membr. Sci., 504 (2016) 113-132. 906
[7] B.D. Coday, B.G.M. Yaffe, P. Xu, T.Y. Cath, Rejection of Trace Organic Compounds by 907
Forward Osmosis Membranes: A Literature Review, Environmental Science & Technology, 908
48 (2014) 3612-3624. 909
[8] X. Wang, J. Zhang, V.W.C. Chang, Q. She, C.Y. Tang, Removal of cytostatic drugs from 910
wastewater by an anaerobic osmotic membrane bioreactor, Chem. Eng. J., 339 (2018) 153-911
161. 912
[9] X. Jin, Q. She, X. Ang, C.Y. Tang, Removal of boron and arsenic by forward osmosis 913
membrane: Influence of membrane orientation and organic fouling, J. Membr. Sci., 389 914
(2012) 182-187. 915
[10] J. Zhang, Q. She, V.W.C. Chang, C.Y. Tang, R.D. Webster, Mining Nutrients (N, K, P) 916
from Urban Source-Separated Urine by Forward Osmosis Dewatering, Environ. Sci. Technol., 917
48 (2014) 3386-3394. 918
[11] A.J. Ansari, F.I. Hai, W.E. Price, J.E. Drewes, L.D. Nghiem, Forward osmosis as a 919
platform for resource recovery from municipal wastewater - A critical assessment of the 920
literature, J. Membr. Sci., 529 (2017) 195-206. 921
[12] S. Phuntsho, H.K. Shon, S. Hong, S. Lee, S. Vigneswaran, A novel low energy fertilizer 922
driven forward osmosis desalination for direct fertigation: Evaluating the performance of 923
fertilizer draw solutions, J. Membr. Sci., 375 (2011) 172-181. 924
[13] D.L. Shaffer, J.R. Werber, H. Jaramillo, S. Lin, M. Elimelech, Forward osmosis: Where 925
are we now?, Desalination, 356 (2015) 271-284. 926
[14] L. Chekli, S. Phuntsho, J.E. Kim, J. Kim, J.Y. Choi, J.-S. Choi, S. Kim, J.H. Kim, S. 927
Hong, J. Sohn, H.K. Shon, A comprehensive review of hybrid forward osmosis systems: 928
Performance, applications and future prospects, J. Membr. Sci., 497 (2016) 430-449. 929
[15] R.K. McGovern, J.H. Lienhard V, On the potential of forward osmosis to energetically 930
outperform reverse osmosis desalination, J. Membr. Sci., 469 (2014) 245-250. 931
[16] N.M. Mazlan, D. Peshev, A.G. Livingston, Energy consumption for desalination — A 932
comparison of forward osmosis with reverse osmosis, and the potential for perfect 933
membranes, Desalination, 377 (2016) 138-151. 934
[17] T.-S. Chung, L. Luo, C.F. Wan, Y. Cui, G. Amy, What is next for forward osmosis (FO) 935
and pressure retarded osmosis (PRO), Sep. Purif. Technol., 156 (2015) 856-860. 936
[18] A. Achilli, T.Y. Cath, E.A. Marchand, A.E. Childress, The forward osmosis membrane 937
bioreactor: A low fouling alternative to MBR processes, Desalination, 238 (2009) 10-21. 938
42
[19] B. Mi, M. Elimelech, Organic fouling of forward osmosis membranes: Fouling 939
reversibility and cleaning without chemical reagents, J. Membr. Sci., 348 (2010) 337-345. 940
[20] S. Lee, C. Boo, M. Elimelech, S. Hong, Comparison of fouling behavior in forward 941
osmosis (FO) and reverse osmosis (RO), J. Membr. Sci., 365 (2010) 34-39. 942
[21] B. Mi, M. Elimelech, Silica scaling and scaling reversibility in forward osmosis, 943
Desalination, 312 (2013) 75-81. 944
[22] Y. Kim, M. Elimelech, H.K. Shon, S. Hong, Combined organic and colloidal fouling in 945
forward osmosis: Fouling reversibility and the role of applied pressure, J. Membr. Sci., 460 946
(2014) 206-212. 947
[23] S.E. Kwan, E. Bar-Zeev, M. Elimelech, Biofouling in forward osmosis and reverse 948
osmosis: Measurements and mechanisms, J. Membr. Sci., 493 (2015) 703-708. 949
[24] M. Xie, J. Lee, L.D. Nghiem, M. Elimelech, Role of pressure in organic fouling in 950
forward osmosis and reverse osmosis, J. Membr. Sci., 493 (2015) 748-754. 951
[25] F. Lotfi, L. Chekli, S. Phuntsho, S. Hong, J.Y. Choi, H.K. Shon, Understanding the 952
possible underlying mechanisms for low fouling tendency of the forward osmosis and 953
pressure assisted osmosis processes, Desalination, (2017). 954
[26] Y. Yu, S. Lee, S.K. Maeng, Forward osmosis membrane fouling and cleaning for 955
wastewater reuse, Journal of Water Reuse and Desalination, 7 (2017) 111-120. 956
[27] J. Lee, S. Kook, C. Lee, I.S. Kim, Effect of intermittent pressure-assisted forward 957
osmosis (I-PAFO) on organic fouling, Desalination, 419 (2017) 60-69. 958
[28] G. Blandin, A.R.D. Verliefde, P. Le-Clech, Pressure enhanced fouling and adapted anti-959
fouling strategy in pressure assisted osmosis (PAO), J. Membr. Sci., 493 (2015) 557-567. 960
[29] W.C.L. Lay, T.H. Chong, C.Y. Tang, A.G. Fane, J. Zhang, Y. Liu, Fouling propensity of 961
forward osmosis: Investigation of the slower flux decline phenomenon, Water Sci. Technol., 962
61 (2010) 927-936. 963
[30] Y. Jang, H. Cho, Y. Shin, Y. Choi, S. Lee, J. Koo, Comparison of fouling propensity and 964
physical cleaning effect in forward osmosis, reverse osmosis, and membrane distillation, 965
Desalination and Water Treatment, 57 (2016) 24532-24541. 966
[31] E.W. Tow, J.H. Lienhard V, Quantifying osmotic membrane fouling to enable 967
comparisons across diverse processes, J. Membr. Sci., 511 (2016) 92-107. 968
[32] A.G. Fane, T.H. Chong, J. Zhang, W.C.L. Lay, The Effect of Flux and Pressure on 969
Fouling in Reverse Osmosis Desalination, Proceedings IDA World Congress, (2009) Paper 970
DB09-128. 971
[33] R.W. Field, G.K. Pearce, Critical, sustainable and threshold fluxes for membrane 972
filtration with water industry applications, Adv. Colloid Interface Sci., 164 (2011) 38-44. 973
[34] Z. Xie, N. Nagaraja, L. Skillman, D. Li, G. Ho, Comparison of polysaccharide fouling in 974
forward osmosis and reverse osmosis separations, Desalination, 402 (2017) 174-184. 975
[35] J.R. McCutcheon, M. Elimelech, Influence of concentrative and dilutive internal 976
concentration polarization on flux behavior in forward osmosis, J. Membr. Sci., 284 (2006) 977
237-247. 978
[36] C.Y. Tang, Q. She, W.C.L. Lay, R. Wang, A.G. Fane, Coupled effects of internal 979
concentration polarization and fouling on flux behavior of forward osmosis membranes 980
during humic acid filtration, J. Membr. Sci., 354 (2010) 123-133. 981
[37] Q. She, R. Wang, A.G. Fane, C.Y. Tang, Membrane fouling in osmotically driven 982
membrane processes: A review, J. Membr. Sci., 499 (2016) 201-233. 983
[38] E.M.V. Hoek, M. Elimelech, Cake-Enhanced Concentration Polarization: A New 984
Fouling Mechanism for Salt-Rejecting Membranes, Environ. Sci. Technol., 37 (2003) 5581-985
5588. 986
43
[39] T.H. Chong, F.S. Wong, A.G. Fane, Implications of critical flux and cake enhanced 987
osmotic pressure (CEOP) on colloidal fouling in reverse osmosis: Experimental observations, 988
J. Membr. Sci., 314 (2008) 101-111. 989
[40] C.Y. Tang, Y.N. Kwon, J.O. Leckie, Characterization of humic acid fouled reverse 990
osmosis and nanofiltration membranes by transmission electron microscopy and streaming 991
potential measurements, Environ. Sci. Technol., 41 (2007) 942-949. 992
[41] A. Tiraferri, N.Y. Yip, A.P. Straub, S. Romero-Vargas Castrillon, M. Elimelech, A 993
method for the simultaneous determination of transport and structural parameters of forward 994
osmosis membranes, J. Membr. Sci., 444 (2013) 523-538. 995
[42] A.J. Karabelas, D.C. Sioutopoulos, Toward improvement of methods for predicting 996
fouling of desalination membranes — The effect of permeate flux on specific fouling 997
resistance, Desalination, 343 (2014) 97-105. 998
[43] Q. She, Y.K.W. Wong, S. Zhao, C.Y. Tang, Organic fouling in pressure retarded 999
osmosis: Experiments, mechanisms and implications, J. Membr. Sci., 428 (2013) 181-189. 1000
[44] Q. She, X. Jin, Q. Li, C.Y. Tang, Relating reverse and forward solute diffusion to 1001
membrane fouling in osmotically driven membrane processes, Water Res., 46 (2012) 2478-1002
2486. 1003
[45] Q. She, D. Hou, J. Liu, K.H. Tan, C.Y. Tang, Effect of feed spacer induced membrane 1004
deformation on the performance of pressure retarded osmosis (PRO): Implications for PRO 1005
process operation, J. Membr. Sci., 445 (2013) 170-182. 1006
[46] E.M.V. Hoek, A.S. Kim, M. Elimelech, Influence of crossflow membrane filter 1007
geometry and shear rate on colloidal fouling in reverse osmosis and nanofiltration separations, 1008
Environmental Engineering Science, 19 (2002) 357-372. 1009
[47] C.Y. Tang, T.H. Chong, A.G. Fane, Colloidal interactions and fouling of NF and RO 1010
membranes: A review, Adv. Colloid Interface Sci., 164 (2011) 126-143. 1011
[48] R.W. Field, J.J. Wu, Mass transfer limitations in forward osmosis: Are some potential 1012
applications overhyped?, Desalination, 318 (2013) 118-124. 1013
[49] T.Y. Cath, M. Elimelech, J.R. McCutcheon, R.L. McGinnis, A. Achilli, D. Anastasio, 1014
A.R. Brady, A.E. Childress, I.V. Farr, N.T. Hancock, J. Lampi, L.D. Nghiem, M. Xie, N.Y. 1015
Yip, Standard Methodology for Evaluating Membrane Performance in Osmotically Driven 1016
Membrane Processes, Desalination, (2012). 1017
[50] B. Kim, G. Gwak, S. Hong, Review on methodology for determining forward osmosis 1018
(FO) membrane characteristics: Water permeability (A), solute permeability (B), and 1019
structural parameter (S), Desalination, 422 (2017) 5-16. 1020
[51] B. Mi, M. Elimelech, Gypsum scaling and cleaning in forward osmosis: Measurements 1021
and mechanisms, Environ. Sci. Technol., 44 (2010) 2022-2028. 1022
[52] L. Song, M. Elimelech, Particle Deposition onto a Permeable Surface in Laminar Flow, J. 1023
Colloid Interface Sci., 173 (1995) 165-180. 1024
[53] L.N. Sim, Y. Ye, V. Chen, A.G. Fane, Investigations of the coupled effect of cake-1025
enhanced osmotic pressure and colloidal fouling in RO using crossflow sampler-modified 1026
fouling index ultrafiltration, Desalination, 273 (2011) 184-196. 1027
[54] C.Y. Tang, J.O. Leckie, Membrane independent limiting flux for RO and NF membranes 1028
fouled by humic acid, Environ. Sci. Technol., 41 (2007) 4767-4773. 1029
[55] E.W. Tow, J.H. Lienhard V, Unpacking compaction: Effect of hydraulic pressure on 1030
alginate fouling, J. Membr. Sci., 544 (2017) 221-233. 1031
[56] A. Rushton, A.S. Ward, R.G. Holdich, Solid-Liquid Filtration and Separation 1032
Technology, Wiley-VCH, 1996. 1033
[57] R. Guha, X. Shang, A.L. Zydney, D. Velegol, M. Kumar, Diffusiophoresis contributes 1034
significantly to colloidal fouling in low salinity reverse osmosis systems, J. Membr. Sci., 479 1035
(2015) 67-76. 1036
44
[58] M. Zhang, D. Hou, Q. She, C.Y. Tang, Gypsum scaling in pressure retarded osmosis: 1037
Experiments, mechanisms and implications, Water Res., 48 (2014) 387-395. 1038
[59] M. Zhang, Q. She, X. Yan, C.Y. Tang, Effect of reverse solute diffusion on scaling in 1039
forward osmosis: A new control strategy by tailoring draw solution chemistry, Desalination, 1040
401 (2017) 230-237. 1041
[60] P. van den Brink, A. Zwijnenburg, G. Smith, H. Temmink, M. van Loosdrecht, Effect of 1042
free calcium concentration and ionic strength on alginate fouling in cross-flow membrane 1043
filtration, J. Membr. Sci., 345 (2009) 207-216. 1044
[61] S. Meng, Y. Liu, Transparent exopolymer particles (TEP)-associated membrane fouling 1045
at different Na+ concentrations, Water Res., 111 (2017) 52-58. 1046
[62] J. BAUMY, J., G. BRULE, Effect of pH and ionic strength on the binding of bivalent 1047
cations to β-casein, Lait, 68 (1988) 409-417. 1048
[63] K.J. Thomas, C.V. Rice, Revised model of calcium and magnesium binding to the 1049
bacterial cell wall, BioMetals, 27 (2014) 1361-1370. 1050
[64] R.W. Field, J.J. Wu, Modelling of permeability loss in membrane filtration: Re-1051
examination of fundamental fouling equations and their link to critical flux, Desalination, 283 1052
(2011) 68-74. 1053
1054
1
Supporting Information
for
Exploring the Differences between Forward Osmosis and Reverse Osmosis Fouling
Farrukh Arsalan Siddiqui a,1
, Qianhong She b,c*
, Anthony G. Fane b,d
, Robert W. Field a**
a Department of Engineering Science, University of Oxford, United Kingdom
b Singapore Membrane Technology Centre, Nanyang Environment & Water Research Institute,
Nanyang Technological University, Singapore c School of Chemical and Biomolecular Engineering, The University of Sydney, NSW 2006,
Australia d UNESCO Centre for Membrane Science and Technology, University of New South Wales, NSW
2052, Australia
* Corresponding author address: The University of Sydney, Room 494, Level 4, Chemical
Engineering Building J01, Darlington, NSW 2006, Australia; Tel: +61 2 8627 6071; Fax: +61 2
9351 2854; Email: [email protected]
**
Corresponding author address: University of Oxford, Parks Road, Oxford, OX1 3PJ, UK;
Tel: +44 1865 273181; Fax: +44 1865 273010; Email: [email protected]
1 Permanent address: Department of Mechanical Engineering, Bahauddin Zakariya University,
Bosan Road, Multan 60800, Pakistan
Number of Pages 6
Number of Figures 6
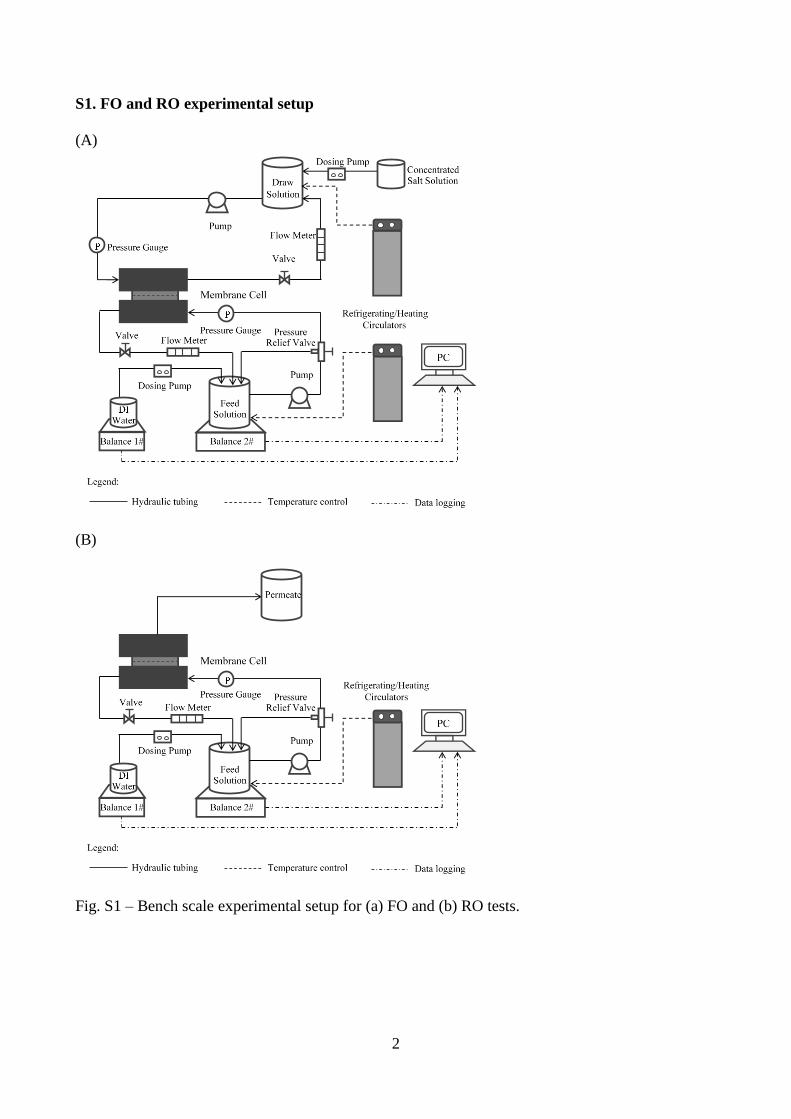
2
S1. FO and RO experimental setup
(A)
(B)
Fig. S1 – Bench scale experimental setup for (a) FO and (b) RO tests.
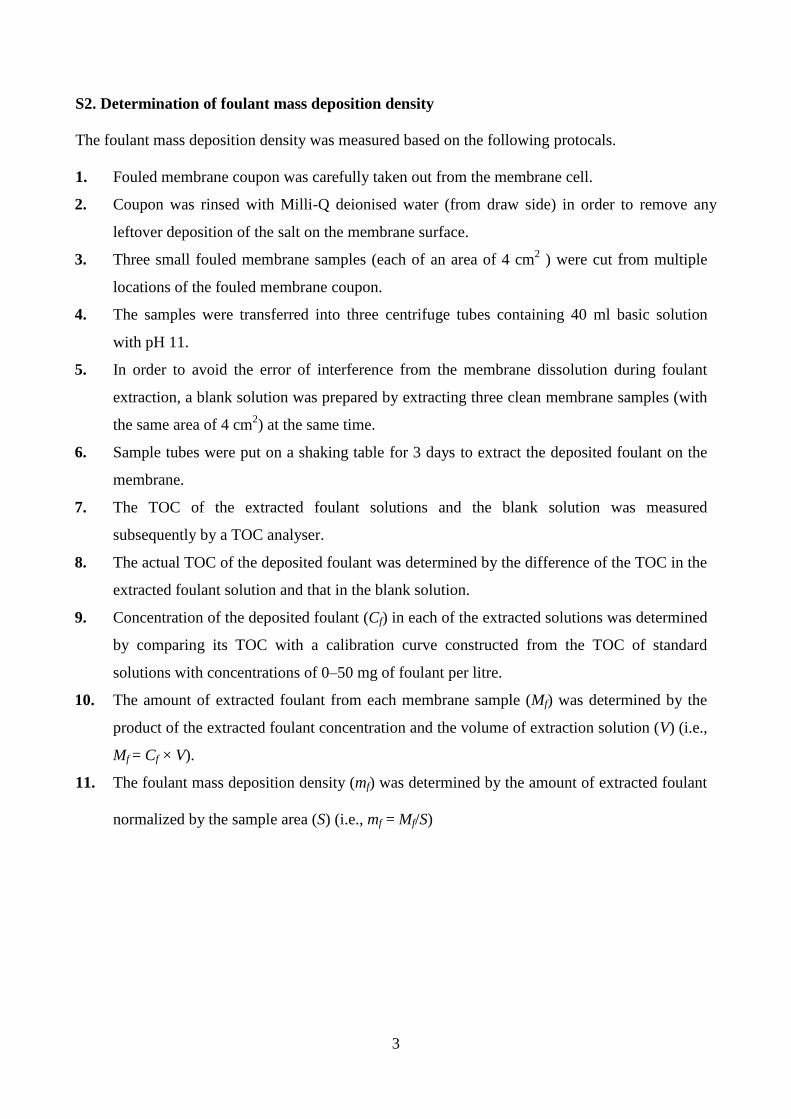
3
S2. Determination of foulant mass deposition density
The foulant mass deposition density was measured based on the following protocals.
1. Fouled membrane coupon was carefully taken out from the membrane cell.
2. Coupon was rinsed with Milli-Q deionised water (from draw side) in order to remove any
leftover deposition of the salt on the membrane surface.
3. Three small fouled membrane samples (each of an area of 4 cm2 ) were cut from multiple
locations of the fouled membrane coupon.
4. The samples were transferred into three centrifuge tubes containing 40 ml basic solution
with pH 11.
5. In order to avoid the error of interference from the membrane dissolution during foulant
extraction, a blank solution was prepared by extracting three clean membrane samples (with
the same area of 4 cm2) at the same time.
6. Sample tubes were put on a shaking table for 3 days to extract the deposited foulant on the
membrane.
7. The TOC of the extracted foulant solutions and the blank solution was measured
subsequently by a TOC analyser.
8. The actual TOC of the deposited foulant was determined by the difference of the TOC in the
extracted foulant solution and that in the blank solution.
9. Concentration of the deposited foulant (Cf) in each of the extracted solutions was determined
by comparing its TOC with a calibration curve constructed from the TOC of standard
solutions with concentrations of 0–50 mg of foulant per litre.
10. The amount of extracted foulant from each membrane sample (Mf) was determined by the
product of the extracted foulant concentration and the volume of extraction solution (V) (i.e.,
Mf = Cf × V).
11. The foulant mass deposition density (mf) was determined by the amount of extracted foulant
normalized by the sample area (S) (i.e., mf = Mf/S)
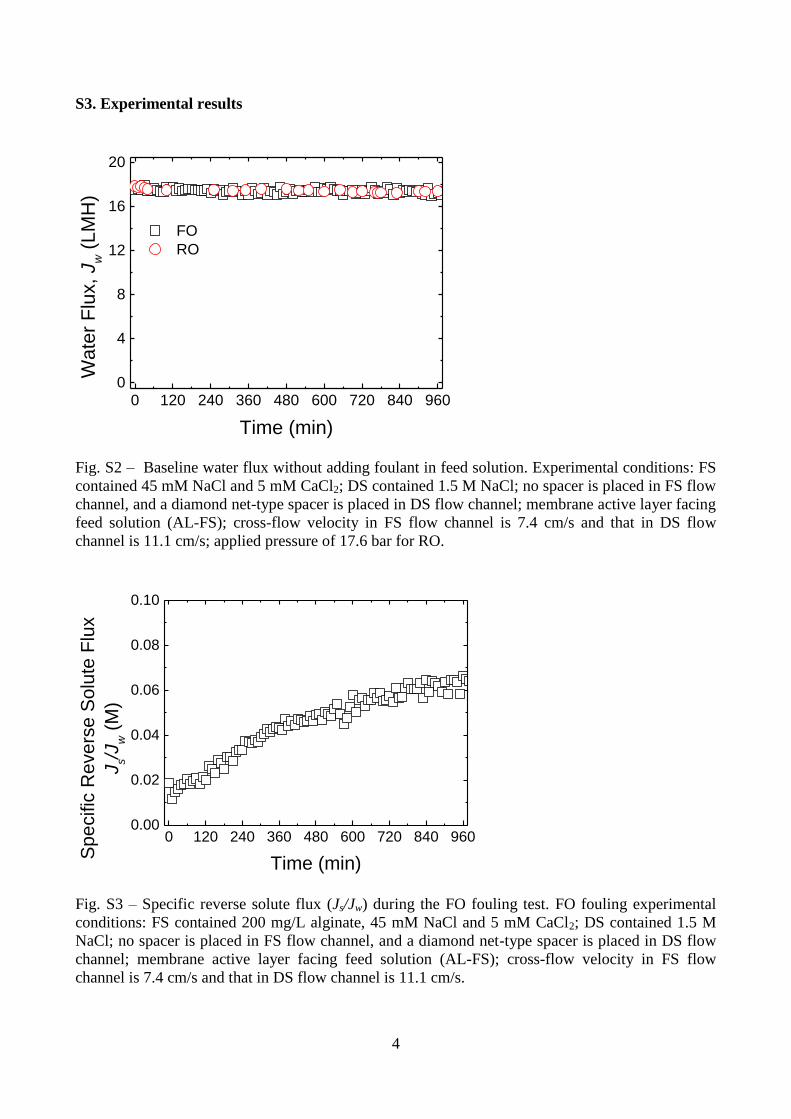
4
S3. Experimental results
Fig. S2 – Baseline water flux without adding foulant in feed solution. Experimental conditions: FS
contained 45 mM NaCl and 5 mM CaCl2; DS contained 1.5 M NaCl; no spacer is placed in FS flow
channel, and a diamond net-type spacer is placed in DS flow channel; membrane active layer facing
feed solution (AL-FS); cross-flow velocity in FS flow channel is 7.4 cm/s and that in DS flow
channel is 11.1 cm/s; applied pressure of 17.6 bar for RO.
Fig. S3 – Specific reverse solute flux (Js/Jw) during the FO fouling test. FO fouling experimental
conditions: FS contained 200 mg/L alginate, 45 mM NaCl and 5 mM CaCl2; DS contained 1.5 M
NaCl; no spacer is placed in FS flow channel, and a diamond net-type spacer is placed in DS flow
channel; membrane active layer facing feed solution (AL-FS); cross-flow velocity in FS flow
channel is 7.4 cm/s and that in DS flow channel is 11.1 cm/s.
0 120 240 360 480 600 720 840 9600
4
8
12
16
20
FO
RO
Wa
ter
Flu
x,
Jw (
LM
H)
Time (min)
0 120 240 360 480 600 720 840 9600.00
0.02
0.04
0.06
0.08
0.10
Sp
ecific
Re
ve
rse
So
lute
Flu
x
Js/J
w (
M)
Time (min)
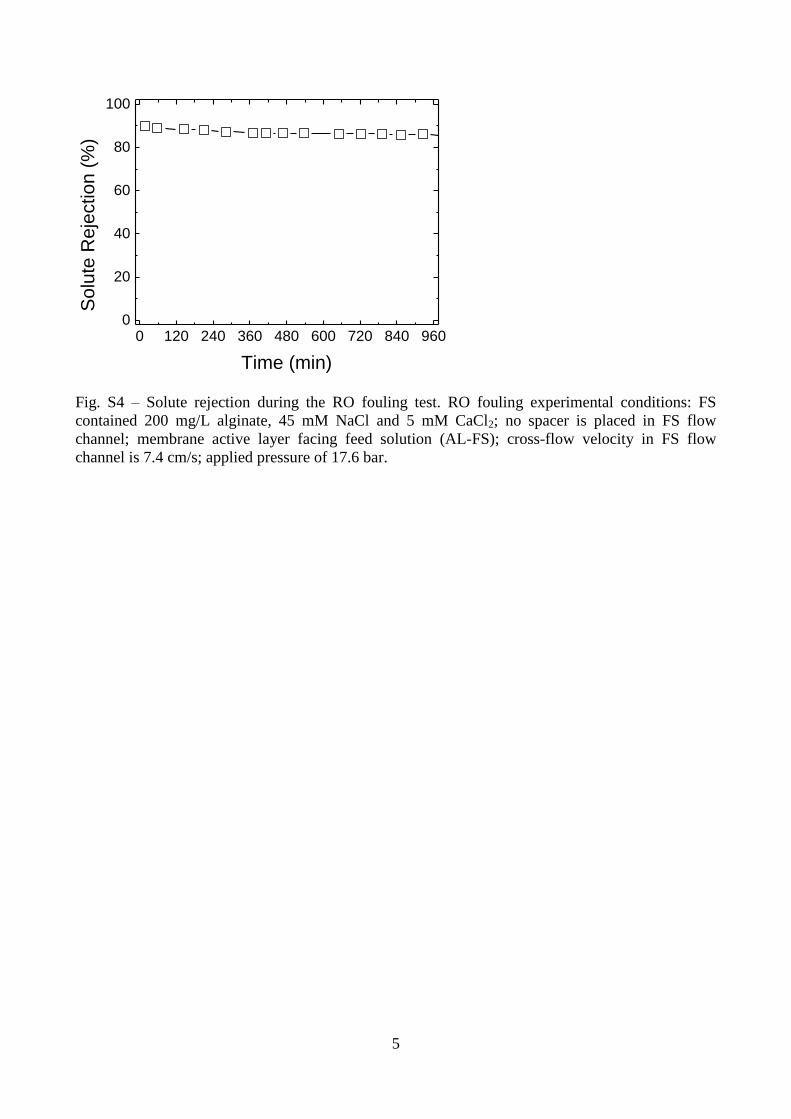
5
Fig. S4 – Solute rejection during the RO fouling test. RO fouling experimental conditions: FS
contained 200 mg/L alginate, 45 mM NaCl and 5 mM CaCl2; no spacer is placed in FS flow
channel; membrane active layer facing feed solution (AL-FS); cross-flow velocity in FS flow
channel is 7.4 cm/s; applied pressure of 17.6 bar.
0 120 240 360 480 600 720 840 9600
20
40
60
80
100
S
olu
te R
eje
ctio
n (
%)
Time (min)
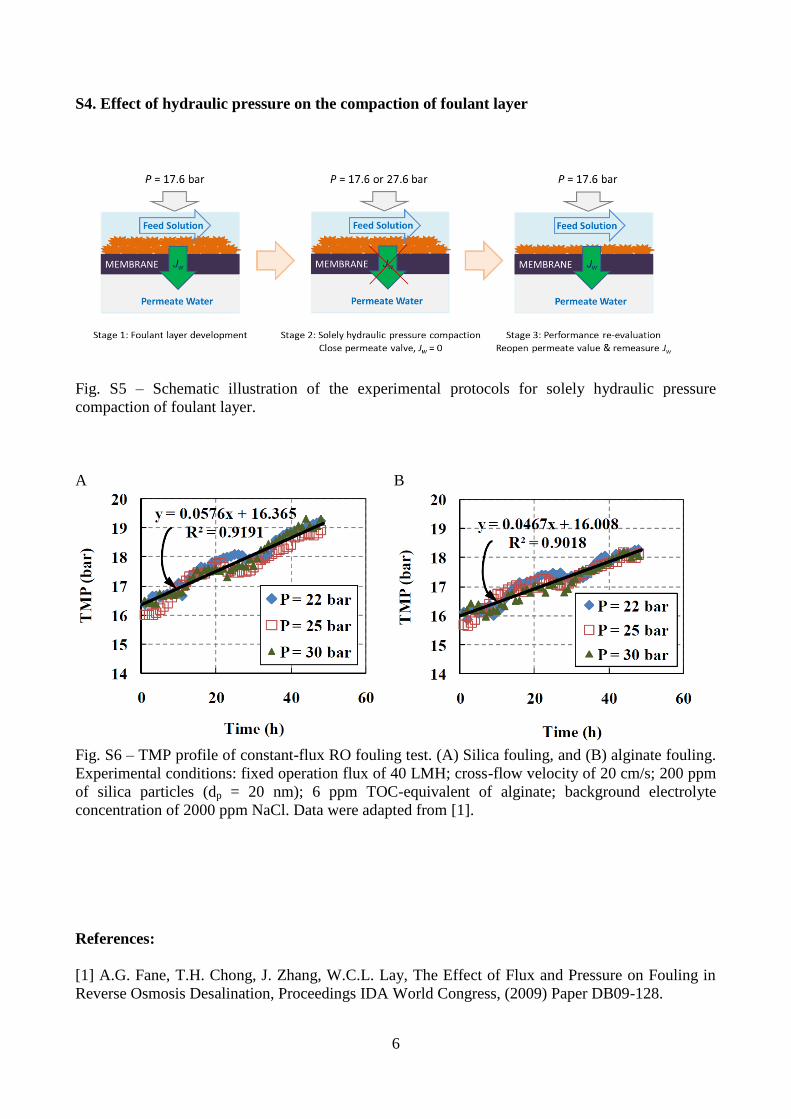
6
S4. Effect of hydraulic pressure on the compaction of foulant layer
Fig. S5 – Schematic illustration of the experimental protocols for solely hydraulic pressure
compaction of foulant layer.
A
B
Fig. S6 – TMP profile of constant-flux RO fouling test. (A) Silica fouling, and (B) alginate fouling.
Experimental conditions: fixed operation flux of 40 LMH; cross-flow velocity of 20 cm/s; 200 ppm
of silica particles (dp = 20 nm); 6 ppm TOC-equivalent of alginate; background electrolyte
concentration of 2000 ppm NaCl. Data were adapted from [1].
References:
[1] A.G. Fane, T.H. Chong, J. Zhang, W.C.L. Lay, The Effect of Flux and Pressure on Fouling in
Reverse Osmosis Desalination, Proceedings IDA World Congress, (2009) Paper DB09-128.