exploring the impact of size of training sets for the development of predictive qsar models
TRANSCRIPT

Available online at www.sciencedirect.com
tory Systems 90 (2008) 31–42www.elsevier.com/locate/chemolab
Chemometrics and Intelligent Labora
Exploring the impact of size of training sets for the developmentof predictive QSAR models
Partha Pratim Roy a, J. Thomas Leonard b, Kunal Roy a,⁎
a Drug Theoretics and Cheminformatics Lab, Division of Medicinal and Pharmaceutical Chemistry, Department of Pharmaceutical Technology,Jadavpur University, Kolkata 700 032, India
b Department of Pharmaceutical Chemistry, KM College of Pharmacy, Madurai 625 107, India
Received 8 December 2006; received in revised form 26 July 2007; accepted 31 July 2007Available online 7 August 2007
Abstract
While building a predictive quantitative structure-activity relationship (QSAR), validation of the developed model is a very important task.However, a truly new set of data being often unavailable for checking predictability and robustness of the developed model, a typical externalvalidation in QSAR studies is commonly performed by splitting the available data into training and test sets. In the present work we haveattempted to explore the impact of training set size on the quality of prediction using different topological descriptors and three different statisticaltechniques. Three different data sets of moderate size have been used for the present study: cytoprotection data of anti-HIV thiocarbamates(n=62), HIV reverse transcriptase inhibition data of 1-[(2-hydroxyethoxy)methyl]-6-(phenylthio)thymine (HEPT) derivatives (n=107) andbioconcentration factor data of diverse functional compounds (n=122). In each case, the data set was divided into different combinations oftraining and test sets maintaining different size ratios in several iterations. In cases of the first two data sets, significant impact of reduction oftraining set size was found on the predictive ability of the models while the first data set showing higher dependence on the size than the secondone. However, in case of modeling of bioconcentration factor, no significant impact of training set size on the quality of prediction could be found.Hence, no general rule can be formulated regarding the impact of training set size on the quality of prediction. Optimum size of the training setshould be set based on a particular data set and types of descriptors and statistical analysis being used.© 2007 Elsevier B.V. All rights reserved.
Keywords: QSAR; Validation; Training set size; K-means clusters; Stepwise regression; FA-MLR; PLS
1. Introduction
Similar molecules with just a slight variation in their structurescan exhibit either different magnitudes of a particular biologicalactivity or quite different types of biological activities. This kindof relationship between molecular structure and changes inbiological activity developed on a quantitative basis is the centerof focus for the field of quantitative structure–activity relation-ships (QSAR). In the field of QSAR, the main objective is toinvestigate these relationships by building mathematical modelsthat explain the relationship in a statistical way. QSARs are beingapplied in many disciplines like risk assessment, toxicityprediction, and regulatory decisions [1,2] apart from drug
⁎ Corresponding author. Fax: +91 33 2837 1078.E-mail address: [email protected] (K. Roy).URL: http://www.geocities.com/kunalroy_in (K. Roy).
0169-7439/$ - see front matter © 2007 Elsevier B.V. All rights reserved.doi:10.1016/j.chemolab.2007.07.004
discovery and lead optimization [3]. The QSAR models areuseful for various purposes including the prediction of activitiesof untested chemicals. The success of drug discovery effortswithin the pharmaceutical industry depends heavily on utilizationof SAR techniques for these and related purposes. A QSARmodel's utility and, in the case of regulatory decisions,justification for usage increasingly depend on the ability toquantify a model's potential for predicting unknown chemicalswith some known degree of certainty [4]. Over the years ofdevelopment, many methods, algorithms and techniques havebeen discovered and applied in QSAR studies [5]. The challenge,therefore, is to select the group of descriptors that describe themost critical structural and physicochemical features associatedwith activity. Effective descriptor or variable selection is anintegral part of theQSARmodeling process [6]. Obtaining a goodquality QSAR model depends on many factors, such as thequality of biological data, the choice of descriptors and statistical

32 P.P. Roy et al. / Chemometrics and Intelligent Laboratory Systems 90 (2008) 31–42
methods. Given the technological advances and broaderavailability of various statistical methods and types of descrip-tors, it is now relatively simple and straightforward to develop astatistically sound model. Any QSAR modeling should ulti-mately lead to statistically robust models capable of makingaccurate and reliable predictions of biological activities ofcompounds. The application of QSAR models for virtualscreening places a special emphasis on statistical significanceand predictive ability of these models as their most crucialcharacteristics. The process of QSARmodel development can begenerally divided into three stages: data preparation, dataanalysis, and model validation. These steps represent a standardpractice of any QSAR modeling, and the researcher's interests,experience, and software availability often determine theirimplementations. The validation strategies check the reliabilityof the developed models for their possible application on a newset of data, and confidence of prediction can thus be judged.
For validation of QSAR models usually four strategies areadopted [7]: (a) internal validation or crossvalidation; (b) validationby dividing the data set into training and test compounds; (c) trueexternal validation by application of model on external data and (d)data randomization or Y-scrambling. Most of the QSARmodelingmethods implement the leave-one-out (LOO) or leave-some-out(LSO) cross-validation procedure. The outcome from the cross-validation procedure is cross-validated R2 (LOO-Q2 or LSO-Q2)which is used as a criterion of both robustness and predictive abilityof the model. Cross-validated squared correlation coefficient R2
(LOO-Q2) is calculated according to the formula
Q2 ¼ 1�P
Yobs � Ycalð Þ2P
Yobs � PYð Þ2 ð1Þ
In Eq. (1), PY means average activity value of the entire data setwhileYobs andYcal represent observed and estimated activity valuesrespectively. Often, a high Q2 value (Q2N0.5) is considered as aproof of high predictive ability of the model [4]. Furthermore, thedifference between model R2 and leave-one-out Q2 should notexceed 0.3 [8,9]. But it has been found that if a test set with knownvalues of biological activities is available for prediction, there maynot exist any correlation between LOO-(or LSO-) cross-validatedR2 (Q2) and correlation coefficient R2 between the predicted andobserved activities for the test set [10,11]. Leave-one-out crossvalidation has been criticized by many authors as it generally leadsto an overestimation of predictive capacity [12]. Another widelyused approach to establish model robustness is so called Y-scrambling (random permutation of response values, i.e., activi-ties). It consists of repeating the calculation procedure withrandomized activities and subsequent probability assessment ofresultant statistics [13]. When several trials have been performed,histograms of R2 and Q2 provide a precise estimate of thesignificance level of the real QSARmodel. It is expected that a dataset with randomized activity would have low values of Q2.However sometimes models based on the randomized data havehigh Q2 values due to chance correlation or structural redundancy[14]. Very often randomization is combined with cross validation.The final statistical measure of predictive capability of a QSARmodel may be obtained by application of the model on new query
compounds, i.e., compounds not included in the original dataset.However, truly new set of data being often unavailable forchecking predictability and robustness of the developed model, atypical external validation is commonly done in QSAR studies bysplitting the available data into two sub-samples with one beingused to fit (training set) and the other to test (test set)[15]. Modelsare generated based on training set compounds and predictivecapacity of the models is judged based on the predictiveR2 (R2
pred)values calculated according to the following equation [16]:
R2pred ¼ 1�
PYpredðTestÞ � YðTestÞ� �2
PYðTestÞ � PY training
� �2 ð2Þ
In Eq. (2), Ypred(Test) and Y(Test) indicate predicted and observedactivity values respectively of the test set compounds andPY training
indicate mean activity value of the training set.Selection of the training set compounds is significantly
important in QSAR analysis. One most widely used method fordividing a data set into training and test sets is mere randomselection. Another frequently used method is based on theactivity sampling in which the data could be ranked accordingto the magnitude of biological response, and the sorted data setis divided into some groups based on the proportion of the totalnumber of compounds required to be included in the test set andthen every first compound from each group could be removedas a member of test set. However, the most rational approach ofselection of training set is based on relevant physicochemicaldescriptors and structural similarity principle [11,17]. Theprocess is based on the assumption that a molecule that isstructurally very similar to the training set molecules will bepredicted well because the model has captured features that arecommon to the training set molecules and is able to find them inthe new molecule. On the other hand, a new molecule which hasvery little in common with the training set data should not bepredicted very well, i.e., the confidence in its prediction shouldbe low [18]. Recently, Leonard and Roy [10] have performedvalidation of QSAR models for three data sets with differentsizes based on random division, sorted biological activity dataand K-means clusters for the factor scores of the originalvariable matrix along with/without biological activity values.When the training and test sets were generated by randomdivision or by the activity-range algorithm, predictive modelswere not obtained in most of the cases. However, good externalvalidation statistics were obtained when training and test setswere selected based on K-means clusters of factor scores of thedescriptor space along with/without the biological activityvalues. In case of random division of the data sets into trainingand test sets, there was no correlation between internal andexternal validation statistics. Some other rational methods oftraining set selection are based on Kohonen's self-organizingmap (SOM) [19], Kennard-stone method [20,21], D-optimaldesign [22], sphere exclusion method [23], etc.
Another important aspect that should be considered duringtraining set selection is the size of the training set in comparisonto that of the whole data set. In absence of any generalguideline, different QSAR groups perform this task arbitrarily

Table 1Structural features and observed cytoprotection activity values of anti-HIV thiocarbamates
Sl. no B1/2 R R1 R2 Observed a Sl. no B1/2 R R1 R2 Observed a
1 B1 H H H 2.921 32 B1 4-OC2H5 H H 2.1552 B1 2-CH3 H H 2.432 33 B2 H H H 2.5233 B1 2-CH(CH3)2 H H 1.367 34 B2 2-CH3 H H 1.5694 B1 2-CF3 H H 1.187 35 B2 2-F H H 3.3015 B1 2-F H H 2.523 36 B2 2-OCH3 H H 1.1876 B1 2-Cl H H 1.770 37 B2 3-CH3 H H 2.3017 B1 2-Br H H 1.854 38 B2 3-Cl H H 2.5238 B1 2-OCH3 H H 2.252 39 B2 3-OCH3 H H 2.5859 B1 3-CH3 H H 2.824 40 B2 3-SO2–CH3 H H 1.95910 B1 3-CF3 H H 1.886 41 B2 4-CH3 H H 3.39811 B1 3-COCH3 H H 2.367 42 B2 4-C2H5 H H 3.52312 B1 3-COOCH3 H H 1.678 43 B2 4-CH(CH3)2 H H 2.43213 B1 3-Cl H H 2.699 44 B2 4-CN H H 4.00014 B1 3-SO2–CH3 H H 2.155 45 B2 4-F H H 3.60215 B1 3-NO2 H H 3.222 46 B2 4-Cl H H 4.00016 B1 3-OCH3 H H 2.398 47 B2 4-Br H H 4.00017 B1 4-CH3 H H 4.699 48 B2 4-I H H 3.88618 B1 4-C2H5 H H 4.097 49 B2 4-NO2 H H 3.52319 B1 4-CH(CH3)2 H H 4.398 50 B2 4-OCH3 H H 3.69920 B1 4-CF3 H H 4.398 51 B2 4-OC2H5 H H 2.69921 B1 4-COOC2H5 H H 1.638 52 B2 4-OCH2C6H5 H H 3.30122 B1 4-COCH3 H H 3.854 53 B2 4-CH3 H CH3 1.38723 B1 4-CN H H 4.155 54 B2 4-Cl CH3 H 2.30124 B1 4-F H H 4.000 55 B2 4-NO2 CH3 H 1.88625 B1 4-Cl H H 4.398 56 B1 4-Cl CH3 H 4.30126 B1 4-Br H H 4.523 57 B1 4-NO2 CH3 H 3.22227 B1 4-I H H 4.699 58 B1 4-CH3 H CH3 1.31928 B1 4-NH(CH3)2 H H 3.222 59 B1 4-CN H CH3 1.44429 B1 4-NH(C2H5)2 H H 2.854 60 B1 4-Cl H CH3 2.77030 B1 4-NO2 H H 4.398 61 B1 4-Br H CH3 2.63831 B1 4-OCH3 H H 4.523 62 B1 4-NO2 H CH3 2.066a Taken from Ref. [27].
33P.P. Roy et al. / Chemometrics and Intelligent Laboratory Systems 90 (2008) 31–42
and there is no uniformity in published QSAR reports withrespect to the ratio of sizes of training and test sets. Except a fewreports [24–26], not many reports are found in the QSARliterature on the systematic study of effect of training test size onthe quality of prediction. If the test set size is comparativelylarger (i.e., training set size is comparatively smaller), some ofthe major structural and chemical properties could be missed outin model development using the training set. Sometimes, whenthe number of compounds in the training set is too low, lessnumber of variables can be incorporated in the model (as therecommended ratio of number of compounds to the number ofdescriptors should be at least 5:1 [8]), and it leads to poorprediction for the test set. If the test set is too small, it can bemanipulated to maximize the predictive capacity of the modelbeing published. In this background, the objective of the presentwork has been to explore the impact of the ratio of sizes of the
training and test sets on the quality of prediction by developingQSAR models for three different data sets of moderate size[cytoprotection data of substituted thiocarbamates (n=62); HIVreverse transcriptase inhibition of 1-[(2-hydroxyethoxy)meth-yl]-6-(phenylthio)thymine (HEPT) derivatives (n=107); bio-concentration factor of diverse functional compounds(n=122)]. Attempt has been made to see whether it is possibleto get an optimum ratio of sizes of training and test sets whilesplitting a parent data set for QSAR analysis so that maximumpredictivity can be achieved.
2. Materials and methods
In this paper, three different data sets of moderate size havebeen used to check the impact of training set size on the qualityof prediction. In each case, the data set was divided into training

Table 2Chemical structures with the observed values of the anti-HIV activity for theHEPT derivatives
Sl.no.
R1 R2 R3 X Reversetranscriptaseinhibitionactivity a
1 2-Me Me CH2OCH2CH2OH O 4.152 2-NO2 Me CH2OCH2CH2OH O 3.853 2-OMe Me CH2OCH2CH2OH O 4.724 3-Me Me CH2OCH2CH2OH O 5.595 3-Et Me CH2OCH2CH2OH O 5.576 3-t-Bu Me CH2OCH2CH2OH O 4.927 3-CF3 Me CH2OCH2CH2OH O 4.358 3-F Me CH2OCH2CH2OH O 5.489 3-Cl Me CH2OCH2CH2OH O 4.8910 3-Br Me CH2OCH2CH2OH O 5.2411 3-I Me CH2OCH2CH2OH O 5.0012 3-NO2 Me CH2OCH2CH2OH O 4.4713 3-OH Me CH2OCH2CH2OH O 4.0914 3-OMe Me CH2OCH2CH2OH O 4.6615 3,5-Me2 Me CH2OCH2CH2OH O 6.5916 3,5-Cl2 Me CH2OCH2CH2OH O 5.8917 3,5-Me2 Me CH2OCH2CH2OH S 6.6618 3 -
COOMeMe CH2OCH2CH2OH O 5.10
19 3-COMe Me CH2OCH2CH2OH O 5.1420 3-CN Me CH2OCH2CH2OH O 5.0021 H CH2CH_CH2 CH2OCH2CH2OH O 5.6022 H Et CH2OCH2CH2OH S 6.9623 H Pr CH2OCH2CH2OH S 5.0024 H i-Pr CH2OCH2CH2OH S 7.2325 3,5-Me2 Et CH2OCH2CH2OH S 8.1126 3,5-Me2 i-Pr CH2OCH2CH2OH S 8.3027 3,5-Cl2 Et CH2OCH2CH2OH S 7.3728 H Et CH2OCH2CH2OH O 6.9229 H Pr CH2OCH2CH2OH O 5.4730 H i-Pr CH2OCH2CH2OH O 7.231 3,5-Me2 Et CH2OCH2CH2OH O 7.8932 3,5-Me2 i-Pr CH2OCH2CH2OH O 8.5733 3,5-Cl2 Et CH2OCH2CH2OH O 7.8534 4-Me Me CH2OCH2CH2OH O 3.6635 H Me CH2OCH2CH2OH O 5.1536 H Me CH2OCH2CH2OH S 6.0137 H I CH2OCH2CH2OH O 5.4438 H CH2_CH2 CH2OCH2CH2OH O 5.6939 H CH2_CHPh CH2OCH2CH2OH O 5.2240 H CH2Ph CH2OCH2CH2OH O 4.3741 H CH2_CPh2 CH2OCH2CH2OH O 6.0742 H Me CH2OCH2CH2OMe O 5.0643 H Me CH2OCH2CH2OAc O 5.1744 H Me CH2OCH2CH2OCOPh O 5.12
Table 2 (continued)
Sl.no.
R1 R2 R3 X Reversetranscriptaseinhibitionactivity a
45 H Me CH2OCH2Me O 6.4846 H Me CH2OCH2CH2Cl O 5.8247 H Me CH2OCH2CH2N3 O 5.2448 H Me CH2OCH2CH2F O 5.9649 H Me CH2OCH2CH2Me O 5.4850 H Me CH2OCH2Ph O 7.0651 H Et CH2OCH2Me O 7.7252 H Et CH2OCH2Me S 7.5853 3,5-Me2 Et CH2OCH2Me O 8.2454 3,5-Me2 Et CH2OCH2Me S 8.3055 H Et CH2OCH2Ph O 8.2356 3,5-Me2 Et CH2OCH2Ph O 8.5557 H Et CH2OCH2Ph S 8.0958 3,5-Me2 Et CH2OCH2Ph S 8.1459 H i-Pr CH2OCH2Me O 7.9960 H i-Pr CH2OCH2Ph O 8.5161 H i-Pr CH2OCH2Me S 7.8962 H i-Pr CH2OCH2Ph S 8.1463 H Me CH2OMe O 5.6864 H Me CH2OBu O 5.3365 H Me Et O 5.6666 H Me Bu O 5.9267 3,5-Cl2 Et CH2OCH2Me S 7.8968 H Et CH2O-i-Pr S 6.6669 H Et CH2O-c-Hex S 5.7970 H Et CH2OCH2-c-Hex S 6.4571 H Et CH2OCH2CH2C6H4(4-
Me)S 7.11
72 H Et CH2OCH2CH2C6H4(4-Cl)
S 7.92
73 H Et CH2OCH2Ph S 7.0474 3,5-Cl2 Et CH2OCH2Me O 8.1375 H Et CH2O-i-Pr O 6.4776 H Et CH2O-c-Hex O 5.4077 H Et CH2OCH2-c-Hex O 6.3578 H Et CH2OCH2Ph O 7.0279 H c-Pr CH2OCH2Me S 7.0280 H c-Pr CH2OCH2Me O 7.0081 H Me CH2OCH2CH2OC5H11-
nO 4.46
82 2-Cl Me CH2OCH2CH2OH O 3.8983 3 -
CH2OHMe CH2OCH2CH2OH O 3.53
84 4-F Me CH2OCH2CH2OH O 3.685 4-Cl Me CH2OCH2CH2OH O 3.6086 4-NO2 Me CH2OCH2CH2OH O 3.7287 4-CN Me CH2OCH2CH2OH O 3.6088 4-OH Me CH2OCH2CH2OH O 3.5689 4-OMe Me CH2OCH2CH2OH O 3.6090 4-COMe Me CH2OCH2CH2OH O 3.9691 3-COOH Me CH2OCH2CH2OH O 3.4592 3 -
CONH2
Me CH2OCH2CH2OH O 3.51
93 H COOMe CH2OCH2CH2OH O 5.1894 H CONHPh CH2OCH2CH2OH O 4.7495 H SPh CH2OCH2CH2OH O 4.6896 H C`CH CH2OCH2CH2OH O 4.7497 H C`C-Ph CH2OCH2CH2OH O 5.4798 3-NH2 Me CH2OCH2CH2OH O 3.6099 H COCHMe2 CH2OCH2CH2OH O 4.92100 H COPh CH2OCH2CH2OH O 4.89
34 P.P. Roy et al. / Chemometrics and Intelligent Laboratory Systems 90 (2008) 31–42

Table 2 (continued)
Sl.no.
R1 R2 R3 X Reversetranscriptaseinhibitionactivity a
101 H C`CMe CH2OCH2CH2OH O 4.72102 H F CH2OCH2CH2OH O 4.00103 H Cl CH2OCH2CH2OH O 4.52104 H Br CH2OCH2CH2OH O 4.70105 H Me CH2OCH2CH2OCH2Ph O 4.70106 H Me H O 3.60107 H Me Me O 3.82a Taken from Ref.[30].
35P.P. Roy et al. / Chemometrics and Intelligent Laboratory Systems 90 (2008) 31–42
and test sets with different size ratios in different iterations. Fora particular iteration, training set compounds were used todevelop the models and subsequently the developed modelswere used to predict the activity values of corresponding test setcompounds. In a particular trial, the compounds, which werenot included in the training set, served as test set compounds forthat run. For each iteration, and for a particular statisticalmodeling tool applied, variable selection was done in a mannerindependent of other iterations.
2.1. The data sets and descriptors
2.1.1. Data set IThe cytoprotection data reported by Ranise et al. [27] have
been used as the first dataset: the cytoprotection data [EC50
(μM)] of substituted thiocarbamates (Table 1) have beenconverted to the logarithmic scale [pEC50(mM)] and then usedfor subsequent QSAR analyses as the response variable. Thereare four regions of structural variations in the compounds: oneis the R position of the phenyl ring (showing diversesubstitution pattern), and the remaining are R1, R2 and B1/2
positions (showing limited substitution pattern) (Table 1). Theanalyses were performed using topological and indicatorparameters. Various topological indices like Wiener, Zagreb,Balaban J, connectivity indices (0χ, 1χ, 2χ, 3χP,
3χC,0χv,
1χv, 2χv, 3χvP,3χvC), kappa shape indices (1κ, 2κ, 3κ, 1κα,
2κα, 3κα) and E-state parameters were calculated usingDescriptor+ module of the Cerius2 version 4.8 software [28].Different indicator variables used in the study have beendefined Ref. [29].
2.1.2. Data set IIAnti-HIV 1-[(2-hydroxyethoxy)methyl]-6-(phenylthio)thy-
mine (HEPT) derivatives (n=107, Table 2) [30] were used asthe second data set. The activity data (reverse transcriptaseinhibition data in logarithmic scale) were subjected to classicalQSAR analyses using topological (as described in section2.1.1), information (mean information content, structuralinformation content, complementary information content andbonding information content) and physicochemical (AlogP98,MolRef, hydrogen bond donor) indices. There are four regions
of structural variations in the compounds: R1, R2, R3 and Xpositions (Table 2). The descriptors were calculated usingDescriptor+ module of the Cerius2 version 4.8 software [28].
2.1.3. Data set IIIThe bioconcentration factor data for 122 nonionic organic
compounds (Table 3) were taken from the literature [31]. Thisdata set includes diverse compounds like halogenated benzenes,halogenated biphenyls, chlorinated aliphatic hydrocarbons,polychlorinated anilines, polychlorinated nitrobenzenes andpolychlorinated phenols, alkyl benzenes and alkyl phenols.Different topological descriptors as detailed in Ref. [32] havebeen used for developing models from this data set.
2.2. Model development
To begin with the model development process, the data setswere separately classified into clusters by using K-meanscluster based on standardized descriptor matrix (values 0 to 1).This approach (clustering) ensures that the similarity principlecan be employed for the activity prediction of the test set. K-means clustering is a non-hierarchical classification method,which expresses the final cluster membership for each case only[33]. It must be supplied with the number of clusters (K) intowhich the data are to be grouped [33]. The idea consists ofclustering a series of compounds into several statisticallyrepresentative classes of chemicals. At the end of the analysisthe data are split into K clusters. As the result of a K-meansclustering analysis, one can examine the means for each clusteron each dimension to assess how distinct the K clusters are. Thisprocedure ensures that all chemical classes (as determined bythe clusters derived form the K-means clustering technique) willbe represented in both series of compounds (i.e., training andtest sets) [33–35].
For each data sets, the training sets were selected based onthe K-means clustering and subsequently the developed modelswere used for prediction of activities of the corresponding testset compounds. Initially the training set size was set at 85%(first data set)/75% (second and third data sets) of thecorresponding full data set size and it was gradually decreasedup to 40% (first data set)/25% (second and third data sets).Different sizes of the training sets (85%, 75%, 60%, 50% and40% of the full data set size for the first data set while 75%,60%, 50%, 40% and 25% of the full data set size for the secondand third data sets) were used to develop the models andsubsequently the developed models were used to predict thecorresponding activity/property values of corresponding test setcompounds. In a particular trial, the compounds, which are notincluded in the training set, served as test set compounds for thatrun. For each trial, model building has been combined withvariable selection step independent of other trials.
For model building, three methods were used (1) stepwiseregression (2) FA-MLR (3) PLS. In stepwise regression [36], amultiple-term linear equation was built step-by-step. The basicprocedures involve (1) identifying an initial model, (2)iteratively “stepping,” that is, repeatedly altering the model atthe previous step by adding or removing a predictor variable in

Table 3Bioconcentation factor (logBCF) for 122 nonionic organic chemicals
Sl. no. Compounds logBCF a Sl. no. Compounds logBCF a
1 1,1,1-Trichloroethane 0.95 2 1,1,2,2-Tetrachloroethane 0.93 1,1,2,3,4,4-Hexachloro-1,3-butadiene 3.76 4 Trichloroethylene 1.595 1,2-Dichloroethane 0.3 6 Tetrachloromethane 1.487 Trichloromethane 0.78 8 Hexachloroethane 2.929 Pentachloroethane 1.83 10 Tetrachloroethylene 1.7411 Benzene 0.64 12 Toluene 1.1213 Ethyl benzene 1.19 14 o-Xylene 1.2415 m-Xylene 1.27 16 p-Xylene 1.2717 Isopropylbenzene 1.55 18 Biphenyl 2.6419 1,2,3,4-Tetrachlorobenzene 3.72 20 1,2,3,5-Tetrachlorobenzene 3.3621 1,2,3-Trichlorobenzene 2.9 22 1,2,4,5-Tetrachlorobenzene 3.6123 1,2,4-Trichlorobenzene 2.95 24 1,2-Dichlorobenzene 2.4325 1,3,5-Trichlorobenzene 3.26 26 1,3-Dichlorobenzene 2.6527 1,4-Dichlorobenzene 2.47 28 Hexachlorobenzene 4.1629 2,4,5-Trichlorotoluene 3.87 30 Chlorobenzene 1.8531 Pentachlorobenzene 3.45 32 1,2,4,5-Tetrabromobenzene 3.8133 1,2,4-Tribromobenzene 3.66 34 1,3,5-Tribromobenzene 3.735 1,3-Dibromobenzene 2.8 36 1,4-Dibromobenzene 2.8337 Bromobenzene 1.7 38 1,2-Dibromobenzene 2.739 2,2′,4,5-Tetrachlorobiphenyl 5 40 2,2′,5,5′-Tetrachlorobiphenyl 4.6341 2,2′,5-Trichlorobiphenyl 4.01 42 2,2′,4,4′-Tetrachlorobiphenyl 4.0243 2,2′-Dichlorobiphenyl 3.26 44 2,3′,4′,5-Tetrachlorobipenyl 4.6245 2,3-Dichlorobiphenyl 4.25 46 2,4,4′-Trichlorobiphenyl 4.6347 2,4′,5-Trichlorobiphenyl 3.75 48 2,4,5-Trichlorobiphenyl 4.0249 2,4′-Dichlorobiphenyl 3.55 50 2,5-Dichlorobiphenyl 451 3,3′,4,4′-Tetrachlorobiphenyl 3.9 52 3,5-Dichlorobiphenyl 3.7853 4-Chlorobiphenyl 2.69 54 4,4′-Dichlorobiphenyl 3.2855 2,2′,3,3′-Tetrachlorobiphenyl 4.23 56 2,2′, 4,5,5′-Pentachlorobiphenyl 5.457 2,2′,4,4′,5,5′-Hexachlorobiphenyl 4.83 58 2,2′,4,4′,6,6′-Hexachlorobiphenyl 4.9359 2,2′,3,3′,4,4′,5,5′-Octachlorobiphenyl 5.08 60 2,2′,3,5′-Tetrachlorobiphenyl 4.8461 2,2′,4,5′-Tetrachlorobiphenyl 4.84 62 2,2′,6,6′-Tetrachlorobiphenyl 3.8563 2,2′,3,4,5′-Pentachlorobiphenyl 5.38 64 2,2′,3′,4,5-Pentachlorobiphenyl 5.4365 3,3′,4,4′,5-Pentachlorobiphenyl 5.81 66 2,2′,3,3′,4,4′-Hexachlorobiphenyl 5.7767 2,2′,3,3′,6,6′-Hexachlorobiphenyl 5.43 68 2,2′,3,4,4′,5-Hexachlorobiphenyl 5.8869 2,2′,3,4,5,5′-Hexachlorobiphenyl 5.81 70 2,2′,3,4,4′,5′,6-Heptachlorobiphenyl 5.8471 2,2′,3,3′,4,4′,5,6-Octachlorobiphenyl 5.92 72 2,2′,3,3′,4,5,5′,6-Octachlorobiphenyl 5.8873 2,2′,3,3′,5,5′,6,6′-Octachlorobiphenyl 5.82 74 2,2′,3,3′,4,4′,5,5′,6-Nonachlorobiphenyl 5.7175 2,2′,5,5′-Tetrabromobiphenyl 4.8 76 2,4,6-Tribromobiphenyl 3.9377 4,4′-Dibromobiphenyl 4.19 78 2,4-Dichlorophenol 279 Pentachlorophenol 2.99 80 2,4,6-Trichlorophenol 2.4381 2-Chlorophenol 2.33 82 3-Chlorophenol 1.383 2-Methylphenol 1.03 84 Phenol 1.2485 4-t-Butylphenol 2.07 86 2,4-Dimethylphenol 2.1887 4-Bromophenol 1.56 88 p-sec-Butylphenol 1.5789 2-Chloroaniline 1.18 90 3-Chloroaniline 1.0691 Diphenylamine 1.48 92 Pentachloroaniline 3.7893 2,3,4,5-Tetrachloroaniline 3.28 94 2,3,5,6-Tetrachloroaniline 3.0395 2,3,4-Trichloroaniline 2.31 96 2,4,5-Trichloroaniline 2.6197 2,4,6-Trichloroaniline 2.73 98 3,4,5-Trichloroaniline 2.799 4-Chloroaniline 0.91 100 2,4-Dichloroaniline 1.98101 3,4-Dichloroaniline 1.48 102 Aniline 0.41103 2-Nitrophenol 1.6 104 2-Chloronitrobenzene 2.1105 3-Chloronitrobenzene 1.89 106 4-Chloronitrobenzene 2107 2,3-Dichloronitrobenzene 2.16 108 2,4-Dichloronitrobenzene 2.07109 2,5-Dichloronitrobenzene 2.05 110 3,4-Dichloronitrobenzene 2.07111 3,5-Dichloronitrobenzene 2.23 112 2-Methyl-4,6-dinitrophenol 0.16113 3-Nitrophenol 1.4 114 Pentachloronitrobenzene 2.4115 2,3,4,5-Tetrachloronitrobenzene 1.89 116 2,3,5,6-Tetrachloronitrobenzene 3.2117 2,3,4-Trichloronitrobenzene 2.2 118 2,4,5-Trichloronitrobenzene 1.84119 4-Nitroaniline 0.64 120 3-Nitroaniline 0.92121 2-Nitroaniline 0.91 122 2,4,6-Tribromophenol 2.71
a Taken from Ref. [31].
36 P.P. Roy et al. / Chemometrics and Intelligent Laboratory Systems 90 (2008) 31–42

37P.P. Roy et al. / Chemometrics and Intelligent Laboratory Systems 90 (2008) 31–42
accordance with the “stepping criteria,” (F=4 for inclusion;F=3.5 for exclusion) and (3) terminating the search whenstepping is no longer possible given the stepping criteria, orwhen a specified maximum number of steps has been reached.Specifically, at each step all variables are reviewed andevaluated to determine which one will contribute most to theequation. That variable will then be included in the model, andthe process starts again. A limitation of the stepwise regressionsearch approach is that it presumes that there is a single “best”subset of X variables and seeks to identify it. There is often nounique “best” subset, and all possible regression models with asimilar number of X variables as in the stepwise regressionsolution should be fitted subsequently to study whether someother subsets of X variables might be better.
In case of FA-MLR, classical approach of multiple linearregression (MLR) technique was used as the final statistical toolfor developing classical QSAR relations and factor analysis (FA)[37,38] was used as the data-preprocessing step to identify theimportant descriptors contributing to the response variable and toavoid collinearities among them. FA-MLR is different fromprincipal component regression analysis (PCRA) where factorscores are used as variables instead of the original descriptors. In atypical factor analysis procedure, the data matrix is firststandardized, and correlation matrix and subsequently thereduced correlation matrix are constructed. An eigen valueproblem is then solved and the factor pattern can be obtained fromthe corresponding eigen vectors. The principal objectives of factoranalysis are to display multidimensional data in a space of lowerdimensionality with minimum loss of information (explainingN95% of the variance of the data matrix) and to extract the basicfeatures behind the datawith ultimate goal of interpretation and/orprediction. Factor analysis was performed on the data set(s)containing biological activity and all descriptor variables, whichwere to be considered. The factors were extracted by principalcomponent method and then rotated by VARIMAX rotation (akind of rotation which is used in principal component analysis sothat the axes are rotated to a position in which the sum of thevariances of the loadings is the maximum possible) to obtainThurston's simple structure. The simple structure is characterizedby the property that as many variables as possible fall on thecoordinate axes when presented in common factor space, so thatthe largest possible number of factor loadings becomes zero. Thisis done to obtain a numerically comprehensive picture of therelatedness of the variables. Only variables with non-zeroloadings in such factors where biological activity (or response
Table 4K-means clustering for data set I (anti-HIV thiocarbamates) using standardized desc
Cluster No. Number of compounds in a cluster Compounds (Sl nos.) in ea
1 15 33 34 37 382 24 1 2 3 5
22 23 24 253 5 12 21 29 324 5 4 10 14 205 6 35 36 44 456 7 56 57 58 59
property) also has non-zero loading were considered important inexplaining variance of the activity (or response). Further,variables with non-zero loadings in different factors werecombined in a multivariate equation.
PLS is a generalization of regression, which can handle datawith strongly correlated and/or noisy or numerous X variables[39]. It gives a reduced solution, which is statistically morerobust than MLR. The linear PLS model finds “new variables”(latent variables or X scores) which are linear combinations ofthe original variables. To avoid overfitting, a strict test for thesignificance of each consecutive PLS component is necessaryand then stopping when the components are non-significant.Crossvalidation is a reliable and commonly used method fortesting this significance [40]. However, recently it has beenshown that from the viewpoint of external predictability, choiceof variables for PLS based on internal validation may not beoptimum [41]. Application of PLS allows the construction oflarger QSAR equations while still avoiding overfitting andeliminating most variables. PLS is normally used in combina-tion with cross validation to obtain the optimum number ofcomponents. This ensures that the QSAR equations are selectedbased on their ability to predict the data rather than to fit the data[42]. Based on the standardized regression coefficients, thevariables with smaller coefficients were removed from the PLSregression, until there was no further improvement in Q2 value,irrespective of the components.
The stepwise regression and factor analysis (FA) wereperformed using the statistical software SPSS [43]. Standard-ization of the data matrix and PLS regression were performedusing the statistical software MINITAB [44]. The statisticalqualities of the equations [45] were judged by the parameterslike explained variance (Ra
2), correlation coefficient (R), stan-dard error of estimate (s), and variance ratio (F) at specifieddegrees of freedom (df). All accepted MLR equations haveregression coefficients and F ratios significant at 95% and 99%levels respectively, if not stated otherwise. The generatedQSAR equations were internally validated by leave-one-outcross-validation R2 (Q2) and then externally by predictive R2
(R2pred) calculated based on the predicted values of the
corresponding test set compounds [46,47].
3. Results and discussion
The results of the analyses on three data sets are shown inTables 4–9.
riptors
ch cluster
39 41 42 43 46 47 48 50 51 53 546 7 8 9 11 13 15 16 17 18 1926 27 28 30 31524049 5560 61 62

Table 5Statistical quality of the developed models using training sets of various sizes (Data set I) a
Stepwise regression FA-MLR PLS
Trial R2 Q2 R2pred R2 Q2 R2pred R2 Q2 R2pred
Training set size=85% of the total number of data points1 0.694 0.619 0.721 0.653 0.581 0.626 0.730 0.643 0.8352 0.751 0.683 0.633 0.666 0.594 0.599 0.766 0.674 0.5583 0.718 0.596 0.661 0.659 0.549 0.588 0.706 0.593 0.7194 0.725 0.637 0.365 0.662 0.548 0.634 0.755 0.657 0.5165 0.667 0.569 0.864 0.623 0.535 0.870 0.677 0.555 0.7676 0.735 0.636 0.605 0.724 0.660 0.610 0.756 0.656 0.7057 0.685 0.615 0.737 0.622 0.545 0.712 0.735 0.626 0.7918 0.673 0.583 0.832 0.633 0.550 0.827 0.690 0.569 0.8029 0.710 0.634 0.514 0.604 0.512 0.666 0.735 0.650 0.66910 0.737 0.677 0.589 0.678 0.602 0.565 0.755 0.664 0.645
Training set size=75% of the total number of data points11 0.803 0.720 0.238 0.637 0.552 0.475 0.810 0.718 0.38212 0.691 0.617 0.727 0.641 0.557 0.701 0.713 0.640 0.81713 0.746 0.650 0.668 0.694 0.610 0.712 0.752 0.614 0.71214 0.719 0.621 0.695 0.685 0.606 0.729 0.720 0.587 0.68215 0.706 0.629 0.678 0.659 0.571 0.632 0.734 0.616 0.65216 0.761 0.648 0.734 0.708 0.633 0.670 0.778 0.585 0.69117 0.687 0.589 0.850 0.610 0.525 0.752 0.708 0.570 0.86018 0.746 0.680 0.549 0.683 0.609 0.528 0.768 0.648 0.69019 0.779 0.710 0.361 0.723 0.583 0.484 0.808 0.717 0.49620 0.784 0.699 0.413 0.690 0.616 0.496 0.801 0.719 0.444
Training set size=60% of the total number of data points21 0.608 0.490 0.565 0.616 0.490 0.690 0.692 0.535 0.67622 0.740 0.556 0.537 0.638 0.529 0.656 0.714 0.512 0.61723 0.792 0.621 0.168 0.744 0.585 0.365 0.696 0.606 −0.36924 0.865 0.797 0.095 0.723 0.654 0.431 0.866 0.803 0.12725 0.672 0.574 0.306 0.586 0.506 0.362 0.729 0.540 0.59226 0.796 0.705 0.543 0.777 0.697 0.533 0.832 0.747 0.46027 0.733 0.655 0.308 0.774 0.708 0.432 0.849 0.730 0.50928 0.873 0.782 0.461 0.785 0.708 0.537 0.851 0.743 0.41929 0.789 0.717 0.258 0.746 0.678 0.270 0.807 0.722 0.42930 0.802 0.688 0.183 0.701 0.593 0.554 0.812 0.684 0.568
Training set size=50% of the total number of data points31 0.853 0.764 0.156 0.810 0.731 0.462 0.805 0.711 0.30532 0.880 0.790 0.424 0.691 0.543 0.670 0.902 0.775 0.40233 0.845 0.707 0.399 0.809 0.695 0.358 0.792 0.630 −0.16534 0.716 0.625 0.540 0.716 0.625 0.547 0.762 0.515 0.05035 0.871 0.724 −0.553 0.788 0.661 0.383 0.793 0.662 0.10536 0.703 0.575 0.386 0.637 0.557 0.278 0.784 0.641 0.30037 0.780 0.708 0.415 0.780 0.708 0.416 0.845 0.754 0.43138 0.727 0.634 0.639 0.647 0.534 0.608 0.725 0.581 0.50139 0.821 0.738 0.453 0.741 0.642 0.324 0.824 0.699 0.35340 0.828 0.697 0.112 0.712 0.626 0.387 0.923 0.836 −0.007
Training set size=40% of the total number of data points41 0.742 0.578 0.360 0.742 0.578 0.350 0.600 0.502 −0.11342 0.773 0.690 0.523 0.772 0.687 0.517 0.780 0.594 0.55743 0.787 0.687 0.394 0.742 0.593 −0.187 0.788 0.646 0.44844 0.828 0.696 0.334 0.706 0.559 0.481 0.812 0.620 0.60045 0.891 0.835 0.599 0.552 0.421 0.301 0.949 0.883 0.06946 0.932 0.853 0.256 0.804 0.733 −0.002 0.905 0.832 0.31247 0.608 0.482 0.330 0.608 0.482 0.329 0.614 0.503 −0.37348 0.785 0.612 0.548 0.706 0.555 0.598 0.777 0.604 0.52749 0.909 0.820 0.576 0.827 0.751 0.575 0.904 0.789 0.62350 0.868 0.780 −0.607 0.850 0.758 −0.212 0.908 0.807 −1.316a R2pred values less than 0.5 are marked as bold.
38 P.P. Roy et al. / Chemometrics and Intelligent Laboratory Systems 90 (2008) 31–42
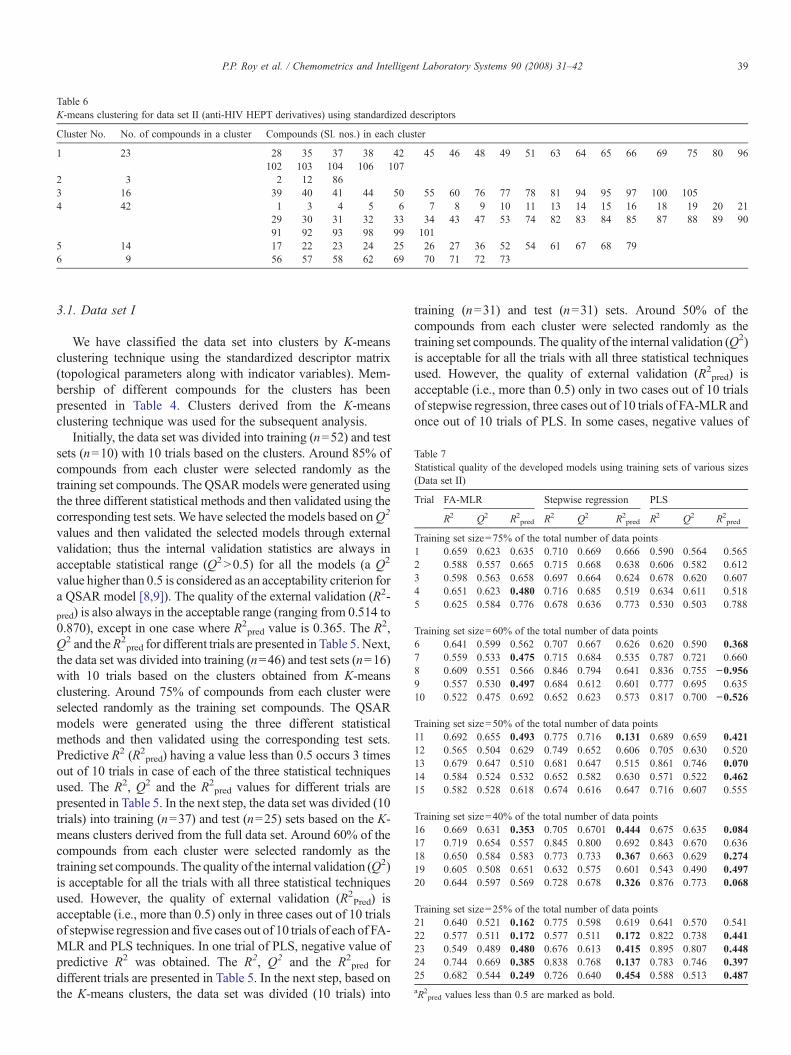
Table 6K-means clustering for data set II (anti-HIV HEPT derivatives) using standardized descriptors
Cluster No. No. of compounds in a cluster Compounds (Sl. nos.) in each cluster
1 23 28 35 37 38 42 45 46 48 49 51 63 64 65 66 69 75 80 96102 103 104 106 107
2 3 2 12 863 16 39 40 41 44 50 55 60 76 77 78 81 94 95 97 100 1054 42 1 3 4 5 6 7 8 9 10 11 13 14 15 16 18 19 20 21
29 30 31 32 33 34 43 47 53 74 82 83 84 85 87 88 89 9091 92 93 98 99 101
5 14 17 22 23 24 25 26 27 36 52 54 61 67 68 796 9 56 57 58 62 69 70 71 72 73
Table 7Statistical quality of the developed models using training sets of various sizes(Data set II)
Trial FA-MLR Stepwise regression PLS
R2 Q2 R2pred R2 Q2 R2pred R2 Q2 R2pred
Training set size=75% of the total number of data points1 0.659 0.623 0.635 0.710 0.669 0.666 0.590 0.564 0.5652 0.588 0.557 0.665 0.715 0.668 0.638 0.606 0.582 0.6123 0.598 0.563 0.658 0.697 0.664 0.624 0.678 0.620 0.6074 0.651 0.623 0.480 0.716 0.685 0.519 0.634 0.611 0.5185 0.625 0.584 0.776 0.678 0.636 0.773 0.530 0.503 0.788
Training set size=60% of the total number of data points6 0.641 0.599 0.562 0.707 0.667 0.626 0.620 0.590 0.3687 0.559 0.533 0.475 0.715 0.684 0.535 0.787 0.721 0.6608 0.609 0.551 0.566 0.846 0.794 0.641 0.836 0.755 −0.9569 0.557 0.530 0.497 0.684 0.612 0.601 0.777 0.695 0.63510 0.522 0.475 0.692 0.652 0.623 0.573 0.817 0.700 −0.526
Training set size=50% of the total number of data points11 0.692 0.655 0.493 0.775 0.716 0.131 0.689 0.659 0.42112 0.565 0.504 0.629 0.749 0.652 0.606 0.705 0.630 0.52013 0.679 0.647 0.510 0.681 0.647 0.515 0.861 0.746 0.07014 0.584 0.524 0.532 0.652 0.582 0.630 0.571 0.522 0.46215 0.582 0.528 0.618 0.674 0.616 0.647 0.716 0.607 0.555
Training set size=40% of the total number of data points16 0.669 0.631 0.353 0.705 0.6701 0.444 0.675 0.635 0.08417 0.719 0.654 0.557 0.845 0.800 0.692 0.843 0.670 0.63618 0.650 0.584 0.583 0.773 0.733 0.367 0.663 0.629 0.27419 0.605 0.508 0.651 0.632 0.575 0.601 0.543 0.490 0.49720 0.644 0.597 0.569 0.728 0.678 0.326 0.876 0.773 0.068
Training set size=25% of the total number of data points21 0.640 0.521 0.162 0.775 0.598 0.619 0.641 0.570 0.54122 0.577 0.511 0.172 0.577 0.511 0.172 0.822 0.738 0.44123 0.549 0.489 0.480 0.676 0.613 0.415 0.895 0.807 0.44824 0.744 0.669 0.385 0.838 0.768 0.137 0.783 0.746 0.39725 0.682 0.544 0.249 0.726 0.640 0.454 0.588 0.513 0.487aR2pred values less than 0.5 are marked as bold.
39P.P. Roy et al. / Chemometrics and Intelligent Laboratory Systems 90 (2008) 31–42
3.1. Data set I
We have classified the data set into clusters by K-meansclustering technique using the standardized descriptor matrix(topological parameters along with indicator variables). Mem-bership of different compounds for the clusters has beenpresented in Table 4. Clusters derived from the K-meansclustering technique was used for the subsequent analysis.
Initially, the data set was divided into training (n=52) and testsets (n=10) with 10 trials based on the clusters. Around 85% ofcompounds from each cluster were selected randomly as thetraining set compounds. The QSARmodels were generated usingthe three different statistical methods and then validated using thecorresponding test sets. We have selected the models based onQ2
values and then validated the selected models through externalvalidation; thus the internal validation statistics are always inacceptable statistical range (Q2N0.5) for all the models (a Q2
value higher than 0.5 is considered as an acceptability criterion fora QSAR model [8,9]). The quality of the external validation (R2-pred) is also always in the acceptable range (ranging from 0.514 to0.870), except in one case where R2
pred value is 0.365. The R2,
Q2 and theR2pred for different trials are presented in Table 5. Next,
the data set was divided into training (n=46) and test sets (n=16)with 10 trials based on the clusters obtained from K-meansclustering. Around 75% of compounds from each cluster wereselected randomly as the training set compounds. The QSARmodels were generated using the three different statisticalmethods and then validated using the corresponding test sets.Predictive R2 (R2
pred) having a value less than 0.5 occurs 3 timesout of 10 trials in case of each of the three statistical techniquesused. The R2, Q2 and the R2
pred values for different trials arepresented in Table 5. In the next step, the data set was divided (10trials) into training (n=37) and test (n=25) sets based on the K-means clusters derived from the full data set. Around 60% of thecompounds from each cluster were selected randomly as thetraining set compounds. The quality of the internal validation (Q2)is acceptable for all the trials with all three statistical techniquesused. However, the quality of external validation (R2
Pred) isacceptable (i.e., more than 0.5) only in three cases out of 10 trialsof stepwise regression and five cases out of 10 trials of each of FA-MLR and PLS techniques. In one trial of PLS, negative value ofpredictive R2 was obtained. The R2, Q2 and the R2
pred fordifferent trials are presented in Table 5. In the next step, based onthe K-means clusters, the data set was divided (10 trials) into
training (n=31) and test (n=31) sets. Around 50% of thecompounds from each cluster were selected randomly as thetraining set compounds. The quality of the internal validation (Q2)is acceptable for all the trials with all three statistical techniquesused. However, the quality of external validation (R2
pred) isacceptable (i.e., more than 0.5) only in two cases out of 10 trialsof stepwise regression, three cases out of 10 trials of FA-MLR andonce out of 10 trials of PLS. In some cases, negative values of

Table 8K-means clustering for data set III (bioconcentration factor data) using standardized descriptors
Cluster no. No. of compounds in a cluster Compounds (Sl nos.) in each cluster
1 59 1 2 4 5 6 7 8 9 10 11 12 13 14 15 1617 21 23 24 25 26 27 29 30 33 34 35 36 37 3878 80 81 82 83 84 85 86 87 88 89 90 95 96 9798 99 100 101 102 103 104 105 106 113 119 120 121 122
2 36 3 18 19 20 22 28 31 32 41 43 45 46 47 48 4950 52 53 54 77 79 91 92 93 94 107 108 109 110 111112 114 115 116 117 118
3 27 39 40 42 44 51 55 56 57 58 59 60 61 62 63 6465 66 67 68 69 70 71 72 73 74 75 76
40 P.P. Roy et al. / Chemometrics and Intelligent Laboratory Systems 90 (2008) 31–42
predictive R2 were obtained. Next, clusters derived from the K-means clustering technique was used for division of the data setinto training (n=25) and test (n=37) sets (10 trials). About 40%ofcompounds from each cluster were selected randomly as thetraining set compounds. In majority of the cases, the quality of theinternal validation was acceptable (Q2N0.5). Poor Q2 valuesobtained in some casesmay be due to the fact that reduced numberof training set compounds allowed selection of less number of
Table 9Statistical quality of the developed models using training sets of various sizes(Data set III)
Trial FA-MLR Stepwise regression PLS
R2 Q2 R2pred R2 Q2 R2pred R2 Q2 R2pred
Training set size=75% of the total number of data points1 0.959 0.953 0.753 0.976 0.971 0.780 0.950 0.947 0.9172 0.942 0.938 0.941 0.955 0.920 0.953 0.915 0.911 0.9373 0.946 0.942 0.925 0.955 0.923 0.950 0.950 0.946 0.9454 0.945 0.938 0.956 0.952 0.912 0.966 0.929 0.925 0.9445 0.946 0.942 0.947 0.947 0.943 0.962 0.921 0.917 0.935
Training set size=60% of the total number of data points6 0.932 0.925 0.953 0.945 0.940 0.959 0.942 0.935 0.9497 0.940 0.934 0.951 0.953 0.948 0.956 0.937 0.930 0.9478 0.968 0.964 0.896 0.974 0.968 0.916 0.912 0.907 0.8529 0.973 0.971 0.916 0.975 0.972 0.923 0.953 0.950 0.89710 0.929 0.922 0.967 0.940 0.935 0.975 0.908 0.902 0.931
Training set size=50% of the total number of data points11 0.935 0.927 0.954 0.943 0.937 0.959 0.941 0.934 0.95212 0.933 0.926 0.956 0.927 0.922 0.961 0.910 0.903 0.93113 0.969 0.965 0.911 0.970 0.964 0.916 0.943 0.938 0.88914 0.934 0.926 0.947 0.937 0.930 0.964 0.902 0.895 0.93615 0.974 0.970 0.919 0.976 0.972 0.928 0.968 0.965 0.924
Training set size=40% of the total number of data points16 0.963 0.958 0.923 0.974 0.960 0.942 0.947 0.942 0.90517 0.957 0.943 0.927 0.964 0.953 0.942 0.937 0.927 0.89018 0.919 0.912 0.956 0.919 0.912 0.956 0.923 0.914 0.96319 0.934 0.924 0.952 0.951 0.911 0.913 0.915 0.905 0.93820 0.974 0.969 0.908 0.982 0.979 0.921 0.974 0.946 0.899
Training set size=25% of the total number of data points21 0.970 0.962 0.935 0.983 0.979 0.909 0.973 0.970 0.92722 0.929 0.920 0.948 0.965 0.897 0.798 0.934 0.922 0.95223 0.986 0.980 0.925 0.978 0.973 0.923 0.953 0.946 0.92624 0.967 0.949 0.908 0.972 0.957 0.914 0.939 0.923 0.90325 0.969 0.953 0.944 0.968 0.963 0.935 0.958 0.952 0.933
descriptors in the models (the recommended ratio of number ofcompounds to the number of descriptors is at least 5:1 [8]). Thequality of external validation (R2
pred) is acceptable (i.e., more than0.5) only in three cases out of 10 trials of FA-MLR and four casesout of 10 trials of each of stepwise regression and PLS techniques.
The mean and corresponding standard deviation values ofdifferent statistical parameters (R2, Q2 and R2
pred) in differenttrials are shown in Table 10 which shows that quality of theexternal validation statistics goes on decreasing when thetraining set size is gradually decreased. Thus, the developmentof validated and predictive QSAR models for this data set isdependent on the size of the training sets.
3.2. Data set II
Membership of different compounds of data set II for differentclusters has been presented in Table 6. Clusters derived from theK-means clustering technique was used for the subsequentanalysis. Attempt was made to see the impact of decreasingtraining set size on the quality of prediction as shown in Table 7.Initially, the data set was divided into training (n=80) and test sets(n=27) with 5 trials based on the clusters derived from the K-means clustering technique. Around 75% of compounds fromeach cluster were selected randomly as the training setcompounds. The QSAR models were generated using the threedifferent statistical methods and then validated using thecorresponding test sets. The internal validation statistics arealways in acceptable statistical range (Q2N0.5) for all the models.Similarly, the quality of the external validation (R2
pred) is always inthe acceptable range (ranging from 0.518 to 0.788), except in onecase where R2
pred value is 0.480. Next, the data set was dividedinto training (n=64) and test (n=43) sets with 5 trials based on theclusters obtained from K-means clustering. Around 60% ofcompounds from each cluster were selected randomly as thetraining set compounds. Predictive R2 (R2
pred) having a value lessthan 0.5 occurs 5 times out of 15 trials considering all threestatistical technique used. In the next step, the data set was divided(5 trials) into training (n=53) and test (n=54) sets based on theK-means clusters derived from the full data set. Around 50% of thecompounds from each cluster were selected randomly as thetraining set compounds. The quality of the internal validation (Q2)is acceptable for all the trials with all three statistical techniquesused. However, the quality of external validation (R2
pred) isunacceptable (i.e., less than 0.5) in five cases out of 15 trials

Table 10Impact of training set size on the quality of prediction a
Trainingset sizerelativeto thewholedata setsize
FA-MLR Stepwise regression PLS
R2 Q2 R2pred R2 Q2 R2pred R2 Q2 R2pred
Data set I85% 0.710±0.029 0.625±0.037 0.652±0.148 0.652±0.034 0.568±0.043 0.670±0.103 0.731±0.030 0.629±0.042 0.701±0.10575% 0.742±0.040 0.656±0.044 0.591±0.195 0.673±0.035 0.586±0.034 0.618±0.111 0.759±0.040 0.641±0.058 0.643±0.15560% 0.767±0.082 0.659±0.099 0.342±0.173 0.709±0.072 0.615±0.086 0.483±0.134 0.785±0.069 0.662±0.105 0.403±0.31150% 0.802±0.066 0.696±0.066 0.297±0.338 0.733±0.063 0.632±0.07 0.443±0.127 0.816±0.061 0.68±0.095 0.228±0.31140% 0.812±0.096 0.703±0.121 0.331±0.351 0.731±0.094 0.612±0.116 0.275±0.304 0.804±0.121 0.678±0.139 0.133±0.610
Data set II75% 0.624±0.031 0.590±0.032 0.643±0.106 0.703±0.016 0.664±0.018 0.644±0.091 0.608±0.055 0.576±0.047 0.618±0.10260% 0.578±0.047 0.538±0.045 0.558±0.085 0.721±0.074 0.676±0.072 0.595±0.042 0.767±0.086 0.692±0.062 0.036±0.73550% 0.620±0.060 0.572±0.073 0.556±0.063 0.706±0.053 0.643±0.05 0.506±0.216 0.708±0.103 0.633±0.081 0.406±0.19540% 0.657±0.042 0.595±0.056 0.543±0.112 0.737±0.079 0.691±0.083 0.486±0.156 0.720±0.138 0.639±0.102 0.312±0.25125% 0.638±0.079 0.547±0.071 0.290±0.139 0.718±0.099 0.626±0.093 0.359±0.202 0.746±0.128 0.675±0.126 0.463±0.054
Data set III75% 0.948±0.007 0.943±0.006 0.904±0.085 0.957±0.011 0.934±0.024 0.922±0.080 0.933±0.016 0.929±0.017 0.936±0.01160% 0.948±0.021 0.943±0.023 0.937±0.029 0.957±0.016 0.953±0.017 0.946±0.025 0.930±0.02 0.925±0.02 0.915±0.04150% 0.949±0.021 0.943±0.023 0.937±0.021 0.951±0.021 0.945±0.022 0.946±0.022 0.933±0.027 0.927±0.028 0.926±0.02340% 0.949±0.022 0.941±0.023 0.933±0.02 0.958±0.025 0.943±0.03 0.935±0.017 0.939±0.023 0.927±0.018 0.919±0.03125% 0.964±0.021 0.953±0.022 0.932±0.016 0.973±0.007 0.954±0.033 0.896±0.056 0.951±0.016 0.943±0.02 0.928±0.018aMean±standard deviation values of the statistical parameters are shown. The number of trials for each size of training set and each statistical technique used is 10 (dataset I) or 5 (data sets II and III). Mean value of R2pred in each case is shown in bold.
41P.P. Roy et al. / Chemometrics and Intelligent Laboratory Systems 90 (2008) 31–42
considering all three statistical techniques. In the next step, basedon the K-means clusters, the data set was divided (5 trials) intotraining (n=43) and test (n=64) sets. Around 40% of thecompounds from each cluster were selected randomly as thetraining set compounds. The quality of the internal validation (Q2)is acceptable for all the trials with all three statistical techniquesused. However, the quality of external validation (R2
pred) isunacceptable (i.e., less than 0.5) in four cases out of five trials ofFA-MLR, three cases out of five trials of stepwise regression andfour out of five trials of PLS. Next, clusters derived from the K-means clustering technique was used for division of the data setinto training (n=27) and test (n=80) sets (5 trials). About 25% ofcompounds from each cluster were selected randomly as thetraining set compounds. In all the cases, the quality of the internalvalidation was acceptable (Q2N0.5). The quality of externalvalidation (R2
pred) is acceptable (i.e., more than 0.5) only in onecase out of 5 trials of each of stepwise regression and PLStechniques and no case of five trials of FA-MLR. The mean andcorresponding standard deviation values of different statisticalparameters (R2, Q2 and R2
pred) in different trials are shown inTable 10. From Table 10, it is found that quality of the externalvalidation statistics goes on decreasingwhen the training set size isgradually decreased. With the decrease of training set size (clusterbased division) (Table 6), number of acceptable predictive modelsdecreases: 10 out of 15, 10 out of 15, 7 out of 15 and 2 out of 15 fortraining set sizes of 60%, 50%, 40% and 25% respectively.However, the detrimental impact of decrease in training set size onthe quality of prediction is less pronounced in this data set than theprevious one (Table 10).
3.3. Data set III
Membership of different compounds of data set III fordifferent clusters has been presented in Table 8. Different sizesof the training sets (75%, 60%, 50%, 40% and 25% of the fulldata set size) were used to develop the models and subsequentlythe developed models were used to predict the response valuesof corresponding test set compounds (Table 9). Five trials wereperformed for each statistical method used for a particular sizeof training set. Good predictive R2 (R2
pred) values wereobtained in all cases irrespective of statistical methods usedand size of the training sets. In most of the cases, the predictiveR2 value is more than or near to 0.9, even with the training setsize set to 25% of the total data set size. The mean andcorresponding standard deviation values of different statisticalparameters (R2, Q2 and R2
pred) in different trials are shown inTable 10 which shows that in case of modeling of bioconcen-tration factor, there is no significant impact of training set sizeon the quality of prediction.
4. Overview and conclusion
In this study we have presented the impact of the size oftraining sets on the predictive QSAR model development forthree data sets of moderate size. In cases of modelingcytoprotection activity of anti-HIV thiocarbamates and reversetranscriptase inhibition of anti-HIVHEPT derivatives, significantimpact of reduction of training set size was found on thepredictive ability of the models. Though QSAR models derived

42 P.P. Roy et al. / Chemometrics and Intelligent Laboratory Systems 90 (2008) 31–42
from K-means clustering technique could produce good externalvalidation (R2
pred) statistics when the training sets werecomposed of considerable portion (85% or 75%) of the fulldata set, quality of the external validation statistics went ondecreasing when the training set size was gradually decreased. Sothe size of training sets relative to the whole data set size has beenproved important for generation of predictive QSAR models forthese two anti-HIV data sets.When the training set size was smallin comparison to the full data set size, information was lost to asignificant extent and the models, which were developed fromsuch training sets of reduced size, could not perform well whilepredicting the test set compounds. Again, the detrimental effect ofreduction of training set size was more pronounced for thethiocarbamate data set than the other one. In case of modeling ofbioconcentration factor, no significant impact of training set sizeon the quality of prediction could be found. Hence, no generalrule can be formulated regarding the impact of training set size onthe quality of prediction. Thus, it may be concluded that optimumsize of the training set should be set based on a particular data setand type of descriptors and statistical analysis being used. Thequality of prediction is sensitive to the dependence of theresponse variable being considered on structural specificity,structural diversity present in the data set, total data set size, typeof descriptors and statistical techniques used, range of values ofthe response variable, etc. It may be mentioned here that thoughthe first two anti-HIV data sets deal with structurally specificresponse values, the third data set used in the study deals withstructurally non-specific bioconcentration factor which largelydepends on lipid-water partition coefficient [48]. This explainswhy no dependence of the predictive ability on training set sizecould be found in case of bioconcentration factor. There arereports of some successful QSAR analyses using small trainingset size [49,50], especially in 3D-QSAR [51]. However, theresults of the present study indicates that it would be interestingfor a QSAR analyst to study the impact of training set size on thequality of models being generated.
References
[1] W. Tong, H. Hong, Q. Xie, L. Shi, H. Fang, R. Perkins, Curr. Comp.-AidedDrug Design 2 (2005) 195–205.
[2] J.C. Dearden, J. Comput.-Aided Mol. Des. 17 (2003) 119–127.[3] L. He, P.C. Jurs, J. Mol. Graph. Model. 23 (2005) 503–523.[4] H. Kubinyi, F.A. Hamprecht, T. Mietzner, J. Med. Chem. 41 (1998)
2553–2564.[5] W. Tong, W.J. Welsh, L. Shi, H. Fang, R. Perkins, Environ. Toxicol. Chem.
22 (2003) 1680–1695.[6] T.Ghafourian,M.T.D.Cronin, SARQSAREnviron. Res. 16 (2005) 171–190.[7] S. Wold, L. Eriksson, in: H. van de Waterbeemd (Ed.), Chemometric
Methods in Molecular Design, VCH, Weinheim, 1995, pp. 312–317.[8] J.D. Walker, J. Jaworska, M.H.I. Comber, T.W. Schultz, J.C. Dearden,
Environ. Toxicol. Chem. 22 (2003) 1653–1665.[9] L. Eriksson, J. Jaworska, A.P. Worth, M.T.D. Cronin, R.M. McDowell, P.
Gramatica, Environ. Health Perspect. 111 (2003) 1361–1375.[10] J.T. Leonard, K. Roy, QSAR Comb. Sci. 25 (2006) 235–251.[11] A. Golbraikh, A. Tropsha, Mol. Divers. 5 (2000) 231–243.[12] P. Gramatica, QSAR Comb. Sci. 26 (2007) 694–701.[13] R.D. Clark, D.G. Sprous, J.M. Leonard, in: H.-D. Höltje, W. Sippl (Eds.),
Rational Approaches to Drug Design, Prous Science, Barcelona, 2001,pp. 475–485.
[14] A. Golbraikh, A. Tropsha, J. Comput.-Aided Mol. Des. 16 (2002) 357–369.[15] D.M. Hawkins, S.C. Basak, D. Mills, J. Chem. Inf. Comput. Sci. 43 (2003)
579–586.[16] G.R. Marshall, in: H. Kubinyi (Ed.), 3D QSAR in Drug Design— Theory,
Methods and Applications, ESCOM, Leiden, 1994, pp. 117–133.[17] W. Wu, B. Walczak, D.L. Massart, S. Heuerding, F. Erni, I.R. Last, K.A.
Prebble, Chemometr. Intell. Lab. Syst. 33 (1996) 35–46.[18] R. Guha, P.C. Jurs, J. Chem. Inf. Model. 45 (2005) 65–73.[19] J. Gasteiger, J. Zupan, Angew. Chem. 32 (1993) 503–527.[20] M. Lajiness, M.A. Johnson, G.M. Maggiora, in: J.L. Fauchere (Ed.),
QSAR: Quantitative Structure–Activity Relationships in Drug Design,Alan R. Liss Inc., New York, 1989, pp. 173–176.
[21] R. Taylor, J. Chem. Inf. Comput. Sci. 35 (1995) 59–67.[22] R. Carlson, Design and Optimization in Organic Synthesis, Elsevier,
Amsterdam, 1992.[23] A. Golbraikh, J. Chem. Inf. Comput. Sci., 40 (2000) 414–425.[24] W. Tong, Q. Xie, H. Song, L. Shi, H. Fang, R. Perkins, Environ. Health
Perspect. 112 (2004) 1249–1254.[25] S. Srivastava, G.M. Crippen, J. Med. Chem. 12 (1993) 3572–3579.[26] R.D. Clark, J. Comput.-Aided Mol. Des. 17 (2003) 265–275.[27] A. Ranise, A. Spallarossa, S. Cesarini, F. Bondavalli, S. Schenone, O. Bruno,
G. Menozzi, P. Fossa, L. Mosti, M. La Colla, G. Sanna, M. Murreddu,G. Collu, B. Busonera, M.E. Marongiu, A. Pani, P. La Colla, R. Loddo,J. Med. Chem. 48 (2005) 3858–3873.
[28] Cerius2 version 4.8 is a product of Accelrys, Inc., San Diego, USA,http://www.accelrys.com/cerius2.
[29] J.T. Leonard, K. Roy, QSAR Comb. Sci. 26 (2007) http://dx.doi.org/10.1002/qsar.200630140.
[30] A. Bak, J. Polanski, Bioorg. Med. Chem. 14 (2006) 273–279.[31] M.T. Sacan, S.S. Erdem, G.A. Ozpinar, I.A. Balcioglu, J. Chem. Inf.
Comput. Sci. 44 (2004) 985–992.[32] K. Roy, I. Sanyal, G. Ghosh, QSAR Comb. Sci., 26 (2007) 629–646.[33] B.S. Everitt, S. Landau, M. Leese, Cluster Analysis, Edward Arnold,
London, 2001.[34] R.B. Kowalski, S. Wold, Handbook of Statistics, North Holland Publishing
Company, Amsterdam, 1982.[35] G.M. Downs, P. Willett, in: H. van de Waterbeemd (Ed.), Advanced
Computer Assisted Techniques in Drug Discovery, VCH,Weinheim, 1995,pp. 111–130.
[36] R.B. Darlington, Regression and Linear Models, McGraw-Hill, New York,1990.
[37] R. Franke, Theoretical Drug Design Methods, Elsevier, Amsterdam, 1984,pp. 184–195.
[38] R. Franke, A. Gruska, in: H. van de Waterbeemd (Ed.), ChemometricMethods in Molecular Design, VCH, Weinheim, 1995, pp. 113–163.
[39] S. Wold, in: H. van de Waterbeemd (Ed.), Chemometric Methods inMolecular Design, vol. 2, VCH, Weinheim, 1995, pp. 195–218.
[40] Y. Fan, L.M. Shi, K.W. Kohn, Y. Pommier, J.N. Weinstein, J. Med. Chem.44 (2001) 3254–3263.
[41] P.P. Roy, K. Roy, QSAR Comb. Sci. 26 (2007) http://dx.doi.org/10.1002/qsar.200710043.
[42] S.S. Kulkarni, V.M. Kulkarni, J. Med. Chem. 42 (1999) 373–380.[43] SPSS is a statistical software of SPSS Inc., IL, USA.[44] MINITAB is a statistical software of Minitab Inc., USA.[45] G.W. Snedecor, W.G. Cochran, Statistical Methods, Oxford & IBH
Publishing Co. Pvt. Ltd., New Delhi, 1967, pp. 381–418.[46] S. Wold, L. Eriksson, in: H. van de Waterbeemd (Ed.), Chemometric
Methods in Molecular Design, VCH, Weinheim, 1995, pp. 312–317.[47] A.K. Debnath, in: A.K. Ghose, V.N. Viswanadhan (Eds.), Combinatorial
Library Design and Evaluation, Marcel Dekker, Inc., New York, 2001,pp. 73–129.
[48] K. Roy, I. Sanyal, P.P. Roy, SAR QSAR Environ. Res. 17 (2006) 563–582.[49] I. Kahn, D. Fara, M. Karelson, U. Maran, J. Chem. Inf. Model. 45 (2005)
94–105.[50] P. Gramatica, E. Giani, E. Papa, J. Mol. Graph. Model. 25 (2007) 755–766.[51] A.K. Debnath, J. Med. Chem. 46 (2003) 4501–4515.