exploring the optimal utilization of locational banking ... · 8.2.2.2 developing links ......
TRANSCRIPT

i
NOVA Information Management School Instituto Superior de Estatística e Gestão de Informação
Universidade Nova de Lisboa
EXPLORING THE OPTIMAL UTILIZATION OF LOCATIONAL BANKING STATISTICS DATA BY A NATIONAL CENTRAL BANK
THE SOUTH AFRICAN PERSPECTIVE
by
Alida Maria de Beer
Project work presented as partial requirement for obtaining the Master’s degree in Statistics and Information Management
Advisor: Filipa Lima, Ph.D.
Co Advisor: João Falcao Silva
May 2017

ii
DEDICATION
There are a number of people without whom this work project might not have been written, and to whom I am greatly indebted to.
Firstly, to my dear husband Barend, who has been a source of encouragement and inspiration to me during our life together and more specifically through the months of writing. Throughout our relationship, you have actively supported me and encouraged me to realize my full potential. A very special thank you for nurturing me through the difficult time I had to overcome on a personal level which coincided with the writing of this work project. Thank you for the practical and emotional support as I juggled between the roles of wife and mother and the challenging demands of work and study. I am tremendously appreciative as we mutually engaged on this journey together and at times had to make sense of the various challenges we faced and also provide encouragement to each other at times when it seemed difficult to continue. You are my soulmate and comrade.
Thanks to my wonderful sons Alex and Elmo, for being so understanding and supportive. I know I had to divide my attention and could not always focus on your needs as I would have wanted to. Hopefully I have set a good example for you in the process and have inspired you to do the same one day.
A special word of gratitude to my sister Eileen, who has never left my side and is incredibly special to me. You have been my best cheerleader.
I would also like to thank my friend and colleague, Marian who has supported me throughout the process.
Most of all thanks to God who have blessed me with the abilities and support system to make this possible.

iii
ACKNOWLEDGEMENTS
Firstly, I would like to extend my utmost thankfulness and gratitude to my supervisor Filipa Lima and my co-supervisor João Falcao Silva for their invaluable assistance, advice and encouragement. They have been more than generous with their expertise and precious time.
I would also like to express my sincere gratitude to João Cadete de Matos who provided the vital motivation to participate in this programme.

iv
ABSTRACT
The financial crisis that emerged in 2008 highlighted the importance of tracking global vulnerabilities through joint analysis of data covering many financial institutions. Locational banking statistics (LBS) were designed to provide comprehensive and consistent data on the banking systems’ funding and lending patterns (BIS, 2014) . The main purpose of the data is to provide information on the role of banks and financial centers in the intermediation of international capital flows. Apart from operational activities, procedures and systems to compile sound cross-border banking system data, there is a need to improve the understanding of the analysis techniques and research outcomes pertaining to this data and specifically how these elements feed into the broader macroeconomic framework, the financial stability regime, and ultimately into policy advice. This study is conducted within a positivist paradigm and investigates the key analytical uses of the LBS data from a national central bank perspective whilst utilising a quantitative approach to develop a suite of analysis mainly through the use of exploratory data analysis (EDA) techniques.
KEYWORDS
Locational banking statistics; Cross-border banking activity; Bank funding and lending, Financial stability, National central bank

v
INDEX
1. Introduction .................................................................................................................. 1
2. Background ................................................................................................................... 2
3. Problem Statement ...................................................................................................... 3
4. Aims and objectives ...................................................................................................... 4
5. Relevance ...................................................................................................................... 5
6. Literature review .......................................................................................................... 7
7. Methodology .............................................................................................................. 10
7.1 Methodological approach ................................................................................... 10
7.2 Data source and characteristics of variables ....................................................... 10
7.3 Research design ................................................................................................... 12
8. Analysis and presentation of results .......................................................................... 14
8.1 In-depth analysis of LBS balance sheet data ....................................................... 14
8.1.1 Contextualizing SA banks’ international banking activities ......................... 14
8.1.2 Analysis of LBS components ......................................................................... 15
8.1.2.1 Residency and nationality ...................................................................... 15
8.1.2.2 Understanding SA banks’ counterparties .............................................. 18
8.1.2.3 Instrument breakdown: Monitoring sources of funding ....................... 19
8.1.2.4 Monitoring foreign currency exposure ................................................. 21
8.1.2.5 Assessing and explaining developments in LBS data ............................ 22
8.1.2.6 Publication and dissemination of analysis results ................................. 22
8.2 Ensuring internal and external data consistency and quality and
contextualizing the LBS data within other macro-economic domains ............... 23
8.2.1 Ensuring consistency and quality ................................................................. 23
8.2.1.1 Mirror exercises ..................................................................................... 23
8.2.1.2 LBS as quality assurance mechanism for source data ........................... 24
8.2.2 LBS as supplementary data source for other macro-economic datasets .... 26
8.2.2.1 Expanding the monetary and credit aggregates ................................... 27
8.2.2.2 Developing links between LBS and external account data ................... 27
8.2.2.3 Financial Balance Sheet and Accumulation Accounts ........................... 31
8.2.2.4 Improved sector decomposition for South African sectors .................. 31
8.3 Identifying indicators of vulnerability ................................................................. 31
8.3.1 Currency breakdowns and mismatches ....................................................... 32
8.3.2 Assessment of structural vulnerabilities through the use of ratio analysis . 36

vi
8.3.2.1 Relative size of banking sector ratio ...................................................... 36
8.3.2.2 Foreign lending ratio ............................................................................. 37
8.3.2.3 Borrower concentration ratio ............................................................... 38
8.3.3 Network analysis .......................................................................................... 39
8.4 Dissemination strategy and analytical research outputs .................................... 42
9. Limitations and recommendations for future work ................................................... 43
10. Conclusion ................................................................................................................ 45
11. Bibliography .............................................................................................................. 46
12. Appendices ............................................................................................................... 49
12.1 Appendix I: Example of a proposed quarterly report providing the main
highlights of the LBS .......................................................................................... 49
12.2 Appendix II: High-level comparability outline between LBS and
Monetary data ................................................................................................... 55
12.3 Appendix III: Detailed results for the network analysis performed
in figure 8.16 ...................................................................................................... 59
13. Annexures ................................................................................................................. 63
13.1 Annexure I: Reporting requirements for the LBS as provided by the BIS ......... 63

vii
LIST OF FIGURES
Figure 8.1 - SA banks’ resident and non-resident positions 2009 - 2015 ....................... 14
Figure 8.2 - SA banks’ non-resident asset and liability exposure to
Developing Africa and Middle East 2009 - 2015 .......................................... 16
Figure 8.3 - SA banks’ non-resident assets and liabilities by nationality as at end December 2015 ................................................................................. 17
Figure 8.4 - SA banks’ net positions per counterparty sector as at end
December 2015 ............................................................................................ 18
Figure 8.5 - SA banks’ non-resident assets and liabilities per instrument 2013 - 2015 .. 19
Figure 8.6 - Non-resident loan-to-deposit ratio since end-2009 .................................... 20
Figure 8.7 - SA banks’ total assets and liabilities per currency since 2013 ..................... 21
Figure 8.8 - Links between LBS and external account data ............................................ 28
Figure 8.9 - Global BIS database breakdown .................................................................. 30
Figure 8.10 - Foreign assets and liabilities of SA banks 2009 - 2015 .............................. 33
Figure 8.11 - Net foreign asset position in foreign currency 2009 - 2015 ...................... 34
Figure 8.12 - SA banks’ FX hedge position 2009 - 2015 .................................................. 34
Figure 8.13 - Net foreign currency exposure of non-resident sectors 2013 - 2015 ........ 35
Figure 8.14 - Relative size of the banking sectors compared to their GDP as at end December 2015 .......................................................................... 37
Figure 8.15 - Foreign lending ratios as at end December 2015 ...................................... 38
Figure 8.16 - Linkages in the international banking system as at end December 2015 . 41

viii
LIST OF TABLES
Table 7.1 - Simplified overview of the SA LBS data ......................................................... 12
Table 8.1 - SA Banks’ International financial position by location
as at end December 2015............................................................................. 16
Table 8.2 - SA Banks’ international assets and liabilities by nationality since end 2013 .............................................................................................. 17
Table 8.3 - Top 5 net lending and borrowing countries by counterparty sector
as at end December 2015............................................................................. 19
Table 8.4 - Mirror data for SA banks’ deposits/loans vis-à-vis UK as at December 2015 .................................................................................... 24
Table 8.5 - Relationship between different data sources of SA banks’
balance sheet data ....................................................................................... 25
Table 8.6 - SA banks’ foreign currency exposure vis-à-vis non-resident sectors, end December 2015........................................................................ 35
Table 8.7 - South Africa’s exposures against top ten countries as at end December 2015 ..................................................................................... 39
Table 8.8 - BIS reporting countries .................................................................................. 40

ix
LIST OF ABBREVIATIONS AND ACRONYMS
BIS Bank for International Settlements
BOP Balance of Payments
CBS Consolidated Banking Statistics
CGFS Committee on the Global Financial System
CEPR Centre for Economic Policy Research
CPIS Coordinated Portfolio Investment Survey
DTC Deposit Taking Corporation
EDA Exploratory data analysis
ERSD Economic Research and Statistics Department
GDP Gross Domestic Product
G-SIBs Global Systemically Important Banks
IBS International Banking Statistics
IIP International Investment Position
LBS Locational Banking Statistics
MFI Monetary and Financial Institutions (MFI)
MFSMCG Monetary and Financial Statistics Manual and Compilation Guide
ROW Rest of the World
SNA System of National Accounts manual
SA banks South African banks
The Bank South African Reserve Bank
UK United Kingdom

1
1. INTRODUCTION1
The global financial crisis that emerged in 2008 highlighted the increased pervasiveness of financial globalization; heightened cross-border capital flows; and the increasing pressure on global systemic risk. If left unchecked, the possible impact of this risk has the ability to eradicate all the positive developments that accompany the increasing financial globalization of the world economy. Successful tracking of global vulnerabilities requires comprehensive joint analysis of data covering many financial institutions. However, while the analysis of aggregate data has merit in identifying cross-border exposure, it also has the potential of masking systemic exposures to a particular asset class or funding source (Caruana, 2012). Therefore the use of more granular data which allows for further in depth analysis up to institutional level can assist greatly to identify specific vulnerabilities that macro indicators collected at a sector- or country-level can less easily capture. For example, a country may have limited exposure to foreign investments, but when these investments are with institutions exposed to financial risks it may become a financial stability issue - especially in times of crisis.
Modern day central bank economists are faced with a rapidly evolving financial environment resulting in more profound changes than ever before. The widespread inability to predict the recent global financial crisis has challenged central banks in two related but divergent areas – firstly at policy and institutional level, and secondly at the level of economic and financial theory underpinning policy decisions. “The main reason crises occur is not lack of statistics, but the failure to interpret them correctly and to take remedial action” (Caruana, 2012, p.3). The result has been a dramatic rethink within the economic analysis function encompassing new fields of research and disciplines where central bank economists are developing new approaches, methods and techniques in order to better support the policymaking functions. Underlying this is the need to have sound systems for acquiring and analyzing economic and financial data in order to respond timely to unforeseen developments. Statistics are not only vital tools for economists to serve policymakers, but their broader dissemination is important to achieve credibility, accountability and transparency which will reinforce the integrity and effectiveness of policy decisions.
1 The views expressed in this work project are those of the author and not necessarily the views of the
Central Bank of South Africa.

2
2. BACKGROUND
“The mission of the Bank for International Settlements (BIS) is to serve central banks in their pursuit of monetary and financial stability, to foster international cooperation in those areas and to act as a bank for central banks” (BIS, n.d., para. 3). The BIS started collecting International Banking Statistics (IBS) in the 1960’s, under the auspices of the Committee on the Global Financial System (CGFS) and with each subsequent financial crises, the identified data gaps prompted refinements. The LBS data were designed to provide comprehensive and consistent quarterly data on major banking systems’ funding and lending patterns. The main purpose of the data is to provide information on the role of banks and financial centers in the intermediation of international capital flows. The basic organizing principle underlying the reporting requirements is the residence of the reporting banks which conforms to balance of payments (BOP) and external debt methodology. Banks report their own international banking business, including international transactions entered into with any of their own affiliates (branches, subsidiaries or joint ventures).
On grounds of the regional influence and the importance of cross-border banking activity in South Africa, the BIS approached the South African Reserve Bank (the Bank) to participate and in 2009 South Africa became the forty-third member country to provide LBS data to the BIS. The development and implementation of a granular national dataset that flows into the global BIS dataset entailed a labour- and time-intensive process and the compilation of high quality statistics continue to require extensive data cleaning and quality checking.
The compilation of LBS data has developed significantly over the past decade with many countries improving the quality and timeliness of their data to adhere to strict reporting guidelines laid down by the BIS. Although the compilation methodology and soundness of these datasets are of utmost importance, the significance of country-level analysis and dissemination of this type of data should not be underestimated. The LBS data provide a wealth of information with detailed cross-border exposures of a country’s banking system, a sector which is critical to any free-market economy and also vital for ever-continuing globalization. The richness and usefulness of the LBS data also transverses many macroeconomic statistical domains (such as BOP) and offers unique opportunities to cross-check traditional data sources (Wooldridge, 2002). In addition, there are a host of analytics available that can be applied to the LBS data to assist in explaining push and pull factors pertaining to international capital movements and geographical dispersion of bank exposures - all of which could potentially be very beneficial to policy makers.

3
3. PROBLEM STATEMENT
In an effort to convert the global LBS output into a national asset, a number of central banks have started exploring ways to use institution-level data to support financial stability analysis, and in particular identify system-wide vulnerabilities and channels of contagion (Iazzetta & Manna, 2009). Currently no in-depth analysis of the South African LBS data is available as most of the resources are being devoted to the compilation of the data. The Economic Research and Statistics Department (ERSD) has recently launched a process of data, system and analysis rejuvenation and one of the key focus areas is to ensure that the resources employed to produce statistical outputs for International Organizations simultaneously add value to the strategic objectives of the department. Thus, in order to ensure the most efficient use of existing resources and knowledge deployed in the LBS data compilation and to keep abreast with international developments in this field it has become necessary to develop a sound and comprehensive suite of analysis.
Following these considerations, the proposed research problem is to study the key analytical uses of the LBS data from a national central bank perspective and to develop the most appropriate strategy for the analysis of this data to be optimized at country level.
4
4. AIMS AND OBJECTIVES
There is a need to improve the understanding of the uses of the LBS dataset for South African banks (SA banks) which will inform the development of the analysis and research output. It relates not only to developing analysis techniques and research outcomes, but also to the understanding of how they feed into the broader macroeconomic framework, the financial stability regime, and ultimately into policy inputs.
The development of the LBS analysis suite has three separate but closely related objectives, namely:
1. Assessing the primary uses of the LBS data and determining the main contributory role within a statistical department in a central bank;
2. Developing a quantitative framework for short-term structural analysis of LBS data; and
3. Generating analytical research outputs and integrating them into the existing body of macroeconomic analysis in order to serve the various user groups. This includes investigating the possibility of creating a user-friendly database for potential internal and external users.

5
5. RELEVANCE
The development of the LBS data analysis suite will contribute to the strategy of the ERSD, specifically with reference to its goal of in-depth analysis and research to improve measurement of the economy, which will in turn support the overall strategy of the Bank. The outcome of this project could also serve as a useful benchmark for other central banks, especially in emerging economies, who would like to expand their LBS data analysis.
Although the benefits emanating from the proposed study can be pervasive, it is important from an organizational point of view that they link with the overarching strategy of the organization. In this regard, the following strategic objectives have been identified within the ambit of the ERSD strategic vision:
Ex-post analysis of the financial stocks and flows of the South African banking sector;
Improved compilation of economic statistics in areas such as BOP and integrated economic accounts;
Monitoring and review of the South African economy within the international context; and
In-depth analysis and research to improve measurement methodology.
Taking the abovementioned strategic objectives into consideration, it is envisaged that the proposed study will complement the existing knowledge base on cross-border banking activity that currently exist within the central bank yielding the following main benefits:
1. Improving the understanding of the underlying methodological foundation of LBS data;
2. Contextualizing this data within other statistical domains, e.g. BOP;
3. Benchmarking and comparisons vis-à-vis other countries in terms of both overall market share as well as available categorization of the data for example by identifying major lending and borrowing sectors and maturity and currency composition;
4. Identifying economic trends that other banking statistics cannot fully capture, especially due to its focus on cross-border activity – in particular, the sensitivity to economic cycles in specific foreign economies and regions;
5. Tracking of sectors that account for build-up of risks, determining channels through which shocks are transmitted for early identification of large international banking flows that may require closer inspection;
6. Evaluating the geographical composition of external claims and the degree to which SA banks are exposed to their parent country banking systems. The extent of these exposures can have implications for financial stability and also partly explain disturbances in international financial systems and the routes through which they might be transmitted to South Africa;

6
7. Building a research database on South African LBS data that could provide useful insights for policy and broader financial economy dynamics;
8. Developing a dissemination strategy that is aligned with the requirements of the different users; and
9. Educating potential users (including management of the Bank) on the wealth of information available in the LBS data.

7
6. LITERATURE REVIEW
This chapter reviews the theoretical literature found on the issue being studied. The following sections present the main strands of research in order to provide a general knowledge on the subject at hand and to facilitate further analysis of the LBS data from a South African perspective. The theoretical literature also guides the selection of the different variables and methods used in the analysis.
The literature review presented in this study relates to four main strands of research. Firstly, it covers studies conducted by International Organizations and other research bodies to determine the main uses of LBS data. Secondly, studies relating to broad policy and financial stability issues will be examined through the utilization of institution-level data in order to identify system-wide vulnerabilities and channels of contagion. Thirdly, the review is complemented by papers from several authors who have applied network analysis tools to determine financial linkages in global markets and their implications for the emergence and management of bank systemic risk, based on data on cross-border exposure. Finally, topical research articles and papers from other central banks are investigated to facilitate further analyses of the LBS data from a central bank perspective.
Studies on main uses of LBS
Numerous analytical studies make use of BIS statistics for a wide variety of purposes and comparisons. Wooldridge (2002) found that it is of paramount importance since it presents a basis for key analytical uses of the statistics and it also provides a glimpse of how the statistics can be applied in a supplementary manner. Wooldridge’s paper addresses banking system-related issues in several broad areas including: facilitating the expansion of domestic monetary and credit aggregates; complementing traditional data sources on external debt and BOP; and analyzing banks’ country risk exposures and monitoring changes in financial intermediation. The author also acknowledges that although the LBS data are compiled with a specific purpose, it has a wide range of possible uses and these are further explored and outlined in the paper (Wooldridge, 2002). McGuire & Tarashev (2008) provide valuable insights on a variety of applications of the BIS IBS by looking at the evolution of the structure of international banking and its implications for financial stability on both domestic and international level. These studies serve as the departure point for determining the possible uses of LBS data and tailoring a suite of analysis for the Bank.
Studies on the use of LBS for financial stability purposes
Various researches have been done on the relationship between cross-border banking and financial stability. Allen et al. (2011) acknowledge the importance of cross-border banking data in their report Cross-Border Banking in Europe: Implications for Financial Stability and Macroeconomic Policies and describes the relationship between cross-border banking and financial stability and the macroeconomic aspects thereof. The report serves as an important source of information which is potentially relevant for the purposes of this study. In addition, international banking system information can be used to expose complementary financial stability issues – e.g. country risk exposures, funding risks in different currencies, and banks’ role in the transmission of financial stress across countries (Aminudin, Gadanecz, & Tissot, 2014).
8
The paper by Weistroffer & Möbert (2010) provides a guideline on how the LBS can be used to calculate simple ratios at country level with the aim to assess possible vulnerability of lenders to cross-border exposures.
Research that utilized the BIS data to analyze currency positions include McGuire & von Peter (2009) and Baba, McCauley, & Ramaswamy (2009). These authors use the LBS data in the estimation of the size of funding mismatches which occurred in 2008 when short-term USD funding sources dried up. Lane & Shambaugh (2009) use data for a broad set of countries over the period 1990 to 2004 to compile and describe the currency composition of foreign asset and liability positions. In this work they discovered tremendous variation in the currency profiles of international portfolios. Their goal in the paper is to expand knowledge regarding data on currency composition of cross-border portfolios (Lane & Shambaugh, 2009).
Studies on network analysis tools using LBS
There are numerous papers from several authors who have used network analysis tools to determine financial linkages in global markets. Von Peter (2007) combines cross-border linkages into a global network and utilizes network methods to identify important banking centres. Weistroffer & Möbert (2010) apply the network perspective to data relating to BIS reporting countries in order to visualize various cross-border interlinkages. Fender & McGuire (2010) explore the extent to which the LBS can be used in the measurement of system-level funding risk and the monitoring of interlinkages in bank balance sheets across office locations. In their paper they show how the underlying structure of the LBS data allows for the monitoring of banking systems’ international funding and lending activities (Fender & McGuire, 2010). To various degrees, these papers all include some reference to the concept of interbank network and the extent to which the network is prone to contagion. These studies are of particular relevance as they could assist in developing a network analysis component for the overall South African LBS suite of analysis.
Studies by other central banks
Various central banks have utilized components of the LBS in topical research articles and papers. An article done by O’Connor (2004) from the Bank of England explores both locational and consolidated data and considers the importance of the United Kingdom (UK) within this market. The author further looks at the changes in the composition of the data over the last 10 years. Network topology techniques are utilized by the Bank of Italy to gain more insight into the manner in which a liquidity crisis spreads (Iazzetta & Manna, 2009). Coates, Everett, McNeill & Moloney (2015) provide an overview of the Irish IBS. Their paper outlines the framework which underpins the statistics and also describes the IBS. It furthermore looks at the methodological issues which influence the Irish data and then provides an evolution of the IBS for Ireland (Coates, et al., 2015).
The aforementioned literature reveals a number of relevant ways in which the LBS data can be explored and mined. Selected parts of the literature presented in the above sections give a better description combined, than each of the single studies on their own. Previous researchers have conducted research based on some of the topics in the above section, but have used different variables that suit their specific situations.

9
The research done in this study will however contribute to the existing literature in several ways - this will be the first study that explores the entire range of key analytical uses of the LBS data from the perspective of a national central bank. In addition, the research will draw on existing literature to develop a suite of analysis which currently does not exist in South Africa.

10
7. METHODOLOGY
7.1 METHODOLOGICAL APPROACH
The previous chapter outlined the main strands of available theoretical literature, which have exploited the LBS data in some format to conduct various types of studies or analyses. In this chapter, we formulate the methodological approach on which the work project will be based.
The study is anchored in a positivist paradigm which emphasizes a scientific and systematic approach to research and as such lends itself to the use of quantitative methodology (Gray, 2014). Quantitative research refers to the systematic empirical investigation of social phenomena using statistical, mathematical or computation techniques. The quantitative method is chosen because it is generally useful when studying large scale patterns or behaviors and when the identified subject of interest can be measured and quantified. Within the quantitative design context there will be utilization of a mixed mode approach combining exploratory and descriptive research. The following sections present information on the scope of the census based longitudinal data to be used as well as the proposed methods of data analyses.
7.2 DATA SOURCE AND CHARACTERISTICS OF VARIABLES
The data set to be used in the development of the suite of analysis is the BIS’s data on IBS - which is known to be the most comprehensive source of information on banks’ international assets and liabilities. Reporting banks supply data to an official authority in their respective country, usually the central bank, which then aggregates the data and submits it to the BIS for further aggregation, analysis and publication. The BIS provides guidelines to compilers in reporting countries with definitions and requirements for the reporting of data in order to facilitate the compilation of national data in a consistent and comparable way. Annexure I in section 13.1 contains the detailed reporting requirements for the LBS as provided by the BIS (BIS, 2015).
The template utilized for reporting cross-border financial activity in South Africa is the LBS survey forms. LBS reporting is mandatory for all resident banks located within the borders of South Africa as stipulated in South African banking legislation. The LBS data comprises of comprehensive on-balance sheet financial assets and liabilities of all banks located in South Africa and are conceptually similar to the financial assets and liabilities of other depository corporations compiled from monetary and financial statistics. The basic organizing principle underlying the LBS reporting requirements is the residence of the reporting banks which conforms to BOP and external debt methodology. The banks report their own international banking business, including international transactions entered into with any of their own affiliates (branches, subsidiaries or joint ventures). The asset and liability positions of banking offices located in the LBS reporting countries are reported with a comprehensive breakdown by both the residence of the counterparty (LBS by residence) and the nationality of the reporting institution (LBS by nationality). The LBS by residence are reported by four types of institutions depending on the nationality of the controlling parent institution namely domestic banks, foreign subsidiaries, foreign branches and consortium banks (not applicable to South Africa). The LBS by nationality is generated by regrouping the LBS by residence according to the nationality of the reporting bank’s controlling parent institution. Total claims and liabilities (and their respective

11
breakdowns) for all banks reported in the LBS by residence should equal the total claims and liabilities of all banks reported in the LBS by nationality.
SA banks’ total positions are further disaggregated by:
(a) Counterparty country
Reporters are requested to provide a full counterparty-country breakdown of banks’ financial claims and liabilities covering 200+ territories.
d) Currency
Reporting countries are requested to provide a breakdown of positions into domestic currency as well as individual foreign currencies. The minimum recommended currency breakdown includes the domestic currency of the reporting country, US dollar, euro, Japanese yen, Swiss franc, British pound, Pound sterling and a residual category.
(c) Counterparty sector
Reporters are requested to provide a counterparty-sector breakdown according to the following sectors: banks (inter-office, central banks); non-bank financial institutions; non-financial sector (non-financial institutions, general government, households); and unallocated by sector.
(d) Type of instrument
SA banks’ assets/claims are broken down into: loans and deposits, which comprise interbank deposits with and loans and advances (to banks or non-banks); holdings of debt securities; and other assets. Similarly, SA banks’ liabilities are broken down into: loans and deposits, which comprise interbank loans received and deposits (from banks or non-banks); own issues of debt securities; and other liabilities.
Due to the expansive nature of the BIS reporting template, a simplified overview of the South African LBS data is provided in table 7.1.
Reported breakdowns Locational by residency Locational by nationality
1. Reporting basis Unconsolidated data, including inter-office positions.
Unconsolidated data, including inter-office positions.
2. Reported positions Cross-border and domestic financial assets and liabilities of all resident banks and by type of reporting bank: - Domestic banks - All branches of foreign banks - All subsidiaries of foreign
banks.
Cross-border and domestic financial assets and liabilities by nationality of resident banks: - Domestic banks - All other BIS reporting bank
nationalities.
3. Vis-à-vis country Residents and non-residents of 230+ individual countries.
Residents and non-residents of minimum of 76 individual countries*.

12
Reported breakdowns Locational by residency Locational by nationality
4. Currencies Domestic and Foreign: USD, EUR, JPY, GBP, CHF and other.
Domestic and Foreign: USD, EUR, JPY, GBP, CHF and other.
5. Counterparty sector
Banks including monetary authorities;
Non-bank financial corporations;
Other non-banks: - Government; - Non-financial corporations;
and - Households
Banks including monetary authorities; Non-bank financial corporations; Other non-banks:
- Government; - Non-financial corporations;
and - Households
6. Type of instrument
Loans/deposits Debt-securities:
- Total; and - Short-term
Other assets/liabilities
Loans/deposits Debt-securities:
- Total; and - Short-term
Other assets/liabilities * South Africa’s LBS data covers the full 230+ individual counterparty country breakdown
Table 7.1 - Simplified overview of the SA LBS data
Reporting institutions, which currently consist of 31 registered SA banks, submit their returns electronically to the Bank on a quarterly basis and validation rules are applied to ensure correct reporting by respondents. In addition, electronic reports are used to check for consistency and excessive deviations in line items. This is followed up with banks for clarification and adjustment if necessary.
7.3 RESEARCH DESIGN
Flowing from the literature review the first component of the research design will focus on grouping the main uses of LBS data into four broad categories, namely:
1. In-depth analysis of LBS balance sheet data by monitoring the growth of both aggregate and disaggregated (instrument, type of counterparty and residence of reporting institution) balance sheet data;
2. Ensuring internal and external data consistency and quality by performing a reconciliation analysis between LBS data and other source data and contextualizing the LBS data within other macroeconomic domains;
3. Identifying indicators of vulnerability, with particular focus on currency mismatches; and
4. Analytical research outputs.
Descriptive statistics and graphical visualization techniques will be applied within each of these areas to develop a core analytical framework. By focusing the exploratory analysis on different aspects of the LBS data the proposed research aims to provide a better understanding of the usefulness of the LBS data. Typically the first step in understanding a data set will be to summarize its main
13
characteristics, often with the use of simple descriptive statistics and graphical visualization techniques. These results may either form the basis of the initial description of the data as part of a more extensive quantitative analysis or may in itself be sufficient to satisfy the particular objectives of a study.
Microsoft Excel is a widely used software package which serves as a tool for data summary, presentation and other basic statistical analysis. It also provides a set of data analysis tools called the Analysis ToolPak which can be used to develop more complex statistical analyses. The study will commence with one of the most basic approaches namely performing a first-level analysis of the absolute nominal stock data obtained from the South African LBS data. Thereafter a breakdown by instrument, sector and residence of reporting institution will allow a more in-depth analysis of the balance sheet data. Peer group analysis will provide a useful tool to identify: banks’ underlying changes in the aggregate balance sheet; sectoral concentrations in lending for particular types of banks; the degree to which different groups of banks have interbank exposures; and finally it guards against overlooking trends among smaller institutions that would make little contribution to aggregate growth. The main goal of this type of analysis is to monitor the growth of various components as well as the changes within these segments.
The analysis will be based on calculating levels, proportional contributions and growth - for example determining the trend followed by each instrument/sector over the past few quarters, comparing with the previous quarter as well as the same period one year earlier. One way of analyzing internal and external consistency and quality of LBS data can be through conducting mirror exercises by comparing the stock of deposits reported on the asset side of the balance sheet by the banking system of country i vis-à-vis the banking system of country j. This should be equal to the stock reported in the liability side of country j versus country i. For this particular study a customized and confidential data set made available by the BIS which allows for bilateral disaggregation will be used.
The final component of the study will transform the produced quantitative analysis into research output by contextualizing and relating the analytical results to the current macroeconomic and financial environment in a written format. In addition, this part of the study will also develop a dissemination strategy to internal and external stake holders.
The dissemination strategy forms an integral part of the overall analytical suite development due to the fact that statistics and analysis are produced with the purpose to benefit end users and is not done in isolation. The intention is to spread the usefulness of the LBS analysis across a broad audience and also solicit feedback that could continually improve the output.

14
8. ANALYSIS AND PRESENTATION OF RESULTS
This chapter applies the techniques discussed previously in order to achieve the objectives set out in chapter 4. The following section is divided into four subsections which will present the findings of the work project.
8.1 IN-DEPTH ANALYSIS OF LBS BALANCE SHEET DATA
The quantity and dimensions of the available LBS data far surpass the ability to interpret such voluminous data without condensing it in some form. The first step in the development of the LBS analysis suite would be to understand the data set by summarizing its main characteristics with the use of simple descriptive statistics and graphical visualization techniques. Thereafter the data will be explored in order to discover underlying patterns and trends. These results will form the basis for the routine monitoring and presentation of a few well-chosen summary measures which will be discussed in the following sub-sections.
8.1.1 Contextualizing SA banks’ international banking activities
The analysis commences with a review of the evolution of SA banks’ gross foreign assets and liabilities and the resultant net foreign asset/liability position. Figure 8.1 depicts the total claims as well as liabilities of SA banks, distinguishing between domestic and foreign/non-resident positions, since end-2009.
Figure 8.1 – SA banks’ resident and non-resident positions 2009 – 2015
By operating within the global financial system, the balance sheets of SA banks comprise of both assets and liabilities vis-à-vis non-residents as well as positions denominated in domestic and foreign currencies. The activities of SA banks are traditionally more domestically orientated with less international activity than some other national banking systems, with their international assets and liabilities accounting for merely 13,1 per cent of their total assets and 9,2 per cent of their total
15
liabilities as at end December 2015. This is significantly smaller than that of a country such as the UK where non-resident assets and liabilities constituted 40,6 and 44,0 per cent respectively of their total assets and liabilities as at end December 2015. As illustrated in figure 8.1, SA banks’ non-resident assets mostly exceeded non-resident liabilities from 2009 to 2015 resulting in a positive non-resident net asset position, which is completely offset by a negative resident net asset position. In general, SA banks tend to have diverse funding structures based on their operational models and strategic views and these structures remain relatively constant over the short to medium term. The larger banks generally raise excess Rand denominated funding (largely in the form of deposits), in the domestic market which is then swapped into foreign currency, mostly US dollar, and placed abroad (mainly in the form of deposits with and loans and advances to non-residents bank- and non-financial corporate sectors).
As mentioned, SA banks are less internationally active than their international counterparts. In spite of this, “data on cross-border exposure can greatly benefit the assessment and understanding of bank systemic risk by providing a benchmark vis-à-vis other countries in terms of both overall market share as well as categorisation such as lending and borrowing sectors and maturity and currency composition, provided in the data. In addition, it serves as a powerful tool for spotting economic trends that other banking statistics fail to capture” (de Beer, 2015, p. 15). LBS data affords the analyst the possibility to simultaneously ascertain the nationality of banking groups; the location of the groups' offices; and the residence of their counterparties. This integrated view enables deeper analysis of the endogenous or exogenous shock transmission across countries via the banking channel.
To further investigate the analytical possibilities of the LBS data, the second step in the study will be to decompose net foreign assets in order to identify the main components which will form the basis for the analysis.
8.1.2 Analysis of LBS components
The analysis of the different components of the LBS data mainly hinges on four divergent but interlinked components – residency and nationality; counterparty analysis; instrument breakdown; and currency composition. The following sub-sections will provide more detail on the relevance of each of these components.
8.1.2.1 Residency and nationality
The LBS are particularly useful to analyze the geography of international banking activity given that it provides information on the country of residence of the reporting banks’ counterparties as well as the residence and nationality of the reporting banks. The locational by residency statistics focus on counterparty information for all resident banking offices with cross-border positions, whilst the locational by nationality statistics focus on the nationality of the reporting banks or the country of controlling nationality. The LBS by nationality show the claims and liabilities of banks resident in a reporting country, by the nationality of the headquarters of the reporting bank office, against counterparties in all other countries combined. The latter is thus a re-grouping of the residency-based data according to the nationality of the controlling parent institution and it provides useful information on who is controlling the resident banking activity.

16
From the LBS by residency data presented in table 8.1 below, we see that the South African banking system has the largest international asset positions vis-à-vis the main financial centres, notably the UK, United States and Isle of Man. Together, these positions account for a significant portion of the SA banks’ total net international asset position.
International Assets
International Liabilities
Net International asset position
R bill Value in
R bill % of Int. assets
Value in R bill
% of Int. liabilities
Total 749,9 100 654,9 100 95,0Of which: United Kingdom 310,5 41,4 299,6 45,7 10,9 United States 73,7 9,8 39,6 6,0 34,1 Isle of Man 63,3 8,4 62,8 9,6 0,5 Nigeria 31,3 4,2 8,7 1,3 22,6France 30,0 4,0 20,4 3,1 9,6 Developing Africa and Middle East 119,9 16,0 71,9 11,0 48,0
Rest of the countries 121,2 16,2 151,9 23,2 -30,7 Table 8.1 – SA Banks’ International financial position by location as at end December 2015
Over the past few years, there has been an increase in South African sourced funding destined for business activity in the rest of Africa. Foreign asset exposure to Africa rose by 50,3 per cent between December 2014 and December 2015, while liability exposure to Africa rose by 40,8 per cent over the same period. Figure 8.2 shows SA banks’ non-resident asset and liability exposure to Developing Africa and Middle East since end-2009. Despite a continuous upward trend in growth, when expressed as a ratio of South Africa’s total International Investment Position (IIP) asset position at the end of 2015, it only represents 1,9 per cent, which is relatively insignificant.
Figure 8.2 – SA banks’ non-resident asset and liability exposure to Developing Africa and Middle East 2009 – 2015

17
From the LBS by nationality data in figure 8.3, we see that South African controlled banks have the largest share of SA banks’ total non-residents assets and liabilities, accounting for 70,0 and 67,8 per cent of the total respectively at end December 2015. This is followed by British, American and Chinese banks.
Figure 8.3 – SA banks’ non-resident assets and liabilities by nationality as at end December 15
Upon analyzing the longitudinal data in table 8.2, it is evident that almost all SA banks’ non-resident asset and liability positions increased, with parent company’s headquartered in South Africa increasing the most.
Nationality of reporting bank:
Non-resident assets (Value in R billions)
Non-resident liabilities (Value in R billions)
Dec 13 Dec 14 Dec 15 Year-
on-year change
Dec 13 Dec 14 Dec 15 Year-on-
year change
United Kingdom 87.3 95.2 117.9 22.7 59.2 70.6 100.0 29.4 Switzerland 0.0 0.0 0.0 0.0 0.4 0.5 0.5 0.0 South Africa 372.1 410.5 525.2 114.7 257.8 366.2 443.8 77.6 Portugal 0.2 0.4 0.5 0.1 0.1 0.2 0.5 0.3India 1.2 2.5 3.6 1.1 2.1 3.7 5.6 1.9 France 0.9 1.3 7.2 5.9 1.2 2.2 7.5 5.3 China 0.1 0.1 0.3 0.2 0.6 1.1 1.0 -0.1 Bahrain 0.0 0.0 0.0 0.0 0.0 0.0 0.0 0.0Luxembourg 0.0 0.0 0.0 0.0 0.1 0.1 0.0 -0.1 United States 19.6 20.7 59.8 39.1 19.0 30.3 44.3 14.0 Germany 8.0 5.8 9.9 4.1 11 10 13 3.0 Greece 0.0 0.1 0.2 0.1 1 1 1 0.0 China 12.6 16.4 25.3 8.9 6 12 38 26.0
Table 8.2 – SA Banks’ international assets and liabilities by nationality since end 2013

18
Monitoring of LBS by nationality statistics is especially important from a risk perspective as it provides insight into who is making the underlying decision, who is taking on the risk and who needs to hold sufficient capital to cover global potential losses. The next section investigates the LBS counterparty data in more detail by specifically looking at the sector breakdown.
8.1.2.2 Understanding SA banks’ counterparties
There is a focused and growing importance of detailed counterparty requirements in official statistics. The LBS data provides detailed information on the countries in which SA banks' counterparties reside as seen in the previous section, as well as their sectors of activity which allows for a thorough risk build-up analysis - specifically within the non-bank private sector. The recent financial crisis highlighted the importance of not only focusing on counterparty countries, but also on counterparty sectors. For example, even if a specific economy shows no apparent vulnerabilities, sector weaknesses can still be channelled off-shore via cross-border bank exposures. The latter could have wider systemic implications for financial stability. For this reason it is worthwhile to conduct an analysis of the net positions (assets minus liabilities) per counterparty sector as depicted in figure 8.4.
Figure 8.4 – SA banks’ net positions per counterparty sector as at end December 2015
As illustrated in figure 8.4, SA banks were net lenders to non-financial institutions, households, government and the rest of the world (ROW), whilst relying significantly on net borrowings from other banks and financial sector counterparties. At the end of December 2015, the ROW sector accounted for 13,3 per cent of the total financing obtained by SA banks compared with 11,7 per cent over the same period in 2014. Extra elucidation is provided by viewing the top net lending and borrowing countries broken down by counterparty country sector for the non-resident counterparty as illustrated in table 8.3.

19
R billions
Country
Net lending(+)/
Net borrowing(-)
By counterparty sector:
Banks Non-bank financial Non-financial
United States 34,1 17,9 -0,1 16,3 Nigeria 22,7 13,9 -1,3 10,1 Ghana 15,1 -0,6 1,5 14,2 Zambia 11,1 -1,1 -0,1 12,2 United Kingdom 10,9 18,2 -9,5 2,2 Saudi Arabia -14,1 -14,1 -0,9 0,0 China -11,2 -12,1 -0,8 1,7 United Arab Emirates -7,4 -10,9 0,8 2,7 Bahrain -6,2 -5,7 -0,5 0,0 Hong Kong -5,5 -5,5 -0,1 0,1
Table 8.3 – Top 5 net lending and borrowing countries by counterparty sector as at end December 2015
From these types of analyses, it is possible to obtain detailed information on the counterparties involved in international banking activities vis-à-vis SA banks which is crucial in the monitoring of risk build-up. The next section looks at SA banks international banking activity broken down by instrument category.
8.1.2.3 Instrument breakdown: Monitoring sources of funding
The LBS instrument breakdown provides longitudinal data for the main instrument categories namely deposits/loans; debt securities; and other assets/liabilities, which is well-suited for studying the non-resident lending/funding behaviour of SA banks. Figure 8.5 illustrates SA banks’ non-resident assets and liabilities, broken down by instrument.
Figure 8.5 – SA banks’ non-resident assets and liabilities per instrument 2013 - 2015

20
From the graphs in figure 8.5 it is evident that within the three reported asset categories, growth in SA banks’ aggregate cross-border claims from December 2013 to December 2015 has predominantly been driven by an increase in loans to and deposits with non-residents and more recently other assets. This was the same case on the liability side, where foreign liabilities increased by 31,5 per cent on an annual basis, mostly on account of the same instruments. As is evident, the LBS liability data provide extremely useful information on the funding model of SA banks. It is very important to monitor it as an increasing reliance on non-traditional sources of funding i.e. funding other than deposits, can often serve as an indication of a build-up of risk (Hahm, Shin & Shin, 2013). Banks resident in South Africa rely mainly on deposit and loan funding, while other funding instruments are more homogenous across both resident and non-resident banks.
Another useful extension is to view South African banks’ relative asset/liability position against non-residents for the deposit/loan instrument category. At the end of December 2015, the share of deposits/loans from non-residents as a percentage of SA banks’ total liabilities to non-residents amounted to 66,6 per cent. However, despite the fact that there has been a gradual increase in deposits/loans from non-residents, the magnitude of loans extended to/deposits with non-residents surpassed that of non-resident deposits with/loans to SA banks, resulting in a marginal positive loan-to-deposit gap vis-à-vis non-residents, as depicted in figure 8.6.
Figure 8.6 – Non-resident loan-to-deposit ratio since end-2009
Figure 8.6 also provides elucidation on the main driving component/s of the time series progression, for example the significant spikes in the non-resident loan-to-deposit ratio for the periods 2011 and 2013 were mainly driven by growth in loans to/deposits with non-residents. This stood in contrast to the 2012 and 2014 declines which were mainly driven by growth in deposits/loans from non-residents. The contribution of changes in these two categories was almost equal between 2014 and 2015, resulting in the marginally positive 2015 loan-to-deposit gap.

21
In conclusion of this section, the analysis of the LBS instrument breakdown provides a valuable overview of SA banks aggregate lending/funding by broad instrument type, which is particularly useful in monitoring the funding models of SA banks from a risk perspective. The next section will look at the fourth component in the LBS analysis, which is the foreign currency composition.
8.1.2.4 Monitoring foreign currency exposure
One of the unique features of the LBS data is the currency breakdown, which allows for a detailed currency source and use analysis. It serves as a useful tool in analysing possible imbalances in funding markets i.e. the extent to which some banks invest in one currency whilst securing funding in another. It is however important to note that whilst such funding imbalances could potentially lead to liquidity risk exposure, it does not automatically imply associated currency risk due to the fact that banks generally hedge currency mismatches in asset and liability compositions. The LBS data unfortunately does not provide detail on these hedges as it only covers on-balance sheet asset and liability positions. The breakdown by currency shows that SA banks’ total assets and liabilities are predominantly rand denominated, followed by the US dollar. Figure 8.7 provides a breakdown of SA banks’ total assets and liabilities per currency.
Figure 8.7 – SA banks’ total assets and liabilities per currency since 2013
A major advantage of the LBS currency breakdown is that it allows for an analysis of various dimensions of global banking e.g. the importance of major international currencies in cross-border banking activity and currency exposures of reporting banks. It furthermore allows for an analysis of currency mismatches, which is covered in more detail in section 8.3.1 of this work project.
In the aforementioned sections we have identified the four main components on which the work project will base its analysis of LBS data namely residency and nationality; counterparty analysis; instrument breakdown; and currency composition. We have also explained its importance from an

22
analytical perspective. In the subsequent section we will discuss the main methods that will be utilized to monitor and study the developments in these components.
8.1.2.5 Assessing and explaining developments in LBS data
In this part of the work project, trend analysis will be used as the main method to analyse data movement patterns over time and to identify trend anomalies that causes deviations from the pattern or large fluctuations. Although conclusions cannot be mechanically drawn from such an analysis, it serves as a good initial measure of short-term developments in the data. Thus, the evolution of growth in certain variables over time and possible anomalies observed might be the first sign to warrant deeper and more specialised analysis.
The key growth rate for measuring the developments in LBS data will be the annual growth rates of the relevant variables because their use holds several advantages, namely they:
Serve as a natural comparison for international statistics; Attract significant attention in public debate; Avoid the need for seasonal adjustments.
It is however important to differentiate between transactional growth and valuation effects. This is especially true for a country like South Africa which has a very liquid currency which can be prone to periods of volatility associated both with domestic as well as international developments.
Furthermore, simultaneous comparison of different growth rates will ensure that underlying data trend changes are detected timeously. This would also lessen the problem of differentiating between base effect movements and genuine developments when analysing changes in growth rates. Annual growth rate analysis will be augmented by shorter-term growth rates and nominal level analysis (quarter-on-quarter changes in values) in order to determine the medium-term character of the LBS data.
A first step towards explaining developments in the LBS data (components and counterparts) will be to link the movements in these variables to factors which are either occasionally or systematically driving these developments. The developments in the data will be supplemented by discussions throughout the statistical value chain between the data providers and compilers in order to obtain a better understanding of the business developments underlying the data. This intelligence insight, together with the results of the analysis, will be reflected in a quarterly LBS report.
8.1.2.6 Publication and dissemination of analysis results
The dissemination of official statistics is an essential feature of statistics. Therefore the results from the LBS analysis will be converted into a quarterly report, which will form part of the ERSD’s current series of internal statistical analysis reports. A draft version of the proposed quarterly report is attached as Appendix I.
This report will serve as a valuable source of information regarding the growth dynamics of the main LBS data outputs. It will also provide a timeous and thorough view of the main determinants behind LBS developments and whether there is longevity in recent developments or whether new ones are emerging parallel or in place of previous ones.

23
This concludes section 8.1, where the main characteristics of the LBS have been summarised and explored to illustrate how underlying patterns and trends in the data can be investigated. The outcomes of the results are presented in a quarterly report, which will form the basis for the routine monitoring of a few well-chosen summary measures.
8.2 ENSURING INTERNAL AND EXTERNAL DATA CONSISTENCY AND QUALITY AND CONTEXTUALIZING
THE LBS DATA WITHIN OTHER MACRO-ECONOMIC DOMAINS
This part of the work project augments the previous analysis by identifying further uses of the LBS. The section is subdivided in line with two possible main auxiliary uses of the BIS data namely 1) serving as a quality assurance tool in the statistical compilation process and 2) complementing the existing macro-economic datasets compiled within the central bank. Each of these is discussed in the following sub-sections.
8.2.1 Ensuring consistency and quality
Good quality statistics form the head cornerstone of any type of analysis or research and ultimately serves as the basis for decision making. Therefore, data compilers have a direct responsibility to ensure the integrity and quality of the statistics they produce. One of the ways in which central banks can improve the quality of their datasets is by using other available data sources for cross validation purposes. The following two sections will investigate the use of the LBS data, firstly to validate against external data providers namely the BIS reporting countries (the so called “mirror exercises”) and secondly against internal data sources within the Bank.
8.2.1.1 Mirror exercises
In order to reconcile the data reported to the BIS by the various reporting agencies with that reported by the Bank, the Global LBS database can be utilised to perform mirror exercises which can serve as an additional measure to control for consistency and quality of data between BIS reporting agencies. These exercises are based on the principle that a debt (liability) to a borrower is an asset to a creditor. This implies that the stock of interbank liabilities of the banking system of country A vis-à-vis the banking system of country B must be the mirror of the stock reported in the asset side of country B versus country A. In principle, in the case of an instrument such as deposits/loans it should be relatively straightforward to determine a one-on-one relationship between the asset position of one country (country A) vis-à-vis the liability of another country (country B).
This exercise can be conducted by downloading mirror data on the bank sector’s deposits/loans for counterparty countries from the BIS online facility2. Access to this facility is obtained through participation as contributing reporting agency. Table 8.4 provides an example of such a comparison for South Africa using the UK as counterparty country as at the end of December 2015.
2 https://dbsonline.bis.org/

24
US$ millions Bank sector
Total Bank sector
Of which: Inter-office Bank sector
Of which: Central BankBank sector,
Derived Interbank South African liabilities, deposits vis-à-vis UK counterparties:
$7 045 $2 611 $0 $4 434 UK assets, loans/deposits vis-à-vis South African counterparties:
$8 698 $3 350 $11 $5 337 Difference $903
Table 8.4 – Mirror data for SA banks’ deposits/loans vis-à-vis UK as at December 2015, Source: BIS database
The first step in the exercise involves a calculation in order to obtain the interbank positions as the bank sector in the BIS data also includes inter-office and central bank positions. This can be done by simply subtracting the latter sub-sectors from the total bank sector data. As indicated in table 8.4.5 there is a difference of $903 million in the data for December 2015 that is being reported by the respective countries. The next step in the process would involve the scrutiny of the data contribution for South Africa to determine whether there are any reporting errors. Should this step reveal no obvious reporting errors and omissions, the next step would be to liaise with the UK’s LBS reporting agency personnel directly in an attempt to resolve the reporting inconsistency.
These types of exercises will contribute to the overall quality and consistency of the LBS data and will ensure that the LBS data that is being used for research and decision making purposes are reliable.
8.2.1.2 LBS as quality assurance mechanism for source data
Up to 2009, SA banks’ on-balance sheet exposures were measured using one main source of data, namely the BA900 survey. The BA900 statistics3 are used to compile the national monetary and credit aggregates, the balance sheet of the Monetary and Financial Institutions (MFI) sector and it also feeds into the sector accounts for the country. The monetary data makes it possible to continuously review monetary and credit developments through the calculation of money supply and its counterparts and this information is crucial for the conduct of monetary policy and it also plays an important role in monitoring the stability of the financial system. The introduction of the LBS returns in 2009 provided an additional source of balance sheet data for the South African banking system and with it the possibility to expand on the existing outputs. Table 8.5 provides a comparison of the main characteristics of these two data sources.
Relationship between sources of SA banks’ balance sheet data
Reported breakdowns: LBS data Monetary data
1. Target population
All South African registered banks - Excluding mutual banks
All South African registered banks - Including mutual banks
2. Reporting basis Unconsolidated data Including inter-office positions Excluding non-financial assets
Unconsolidated data Including inter-office positions Including non-financial assets
3 for convenience, hereafter referred to as ‘monetary data’

25
Relationship between sources of SA banks’ balance sheet data
Reported breakdowns: LBS data Monetary data
3. Reported positions
Cross-border and domestic financial assets and liabilities of all South African registered banks by type of reporting bank: - Domestic banks - All branches of foreign banks - All subsidiaries of foreign
banks. Also available by nationality of bank.
Cross border and domestic assets and liabilities of all South African registered banks.
4. Vis-à-vis country Total residents Total non-residents with a
breakdown of 230+ individual countries
Total residents Total non-residents
5. Currencies Domestic and Foreign with specific provision for USD, EUR, JPY, GBP, CHF and other.
Domestic and Foreign
6. Counterparty sector
Banks including monetary authorities;
Non-bank financial corporations;
Other non-banks*: - Government; - Non-financial corporations;
and - Households
Banks including monetary authorities;
Non-bank financial corporations; Other non-banks*:
- Government; - Non-financial corporations;
and - Households
7. Type of instrument
Loans/deposits Debt-securities:
- Total; and - Short-term
Other assets/liabilities - Of which derivatives
Breakdown limited to above instruments
Loans/deposits Debt-securities:
- Total; and - Short-term
Other assets/liabilities More granular breakdown of
other type of instruments also available
Table 8.5 - Relationship between different data sources of SA banks’ balance sheet data
Source data is routinely assessed either as a part of the data compilation process or as part of the general statistical quality control process. Both the monetary and LBS data sets are transmitted to the Bank’s database using a secure application that automatically processes and validates the files by performing basic first-level checks such as format, type of information reported, reference period, etc. In addition to the automatic validations, non-automatic validations are also conducted as part of the quality assessment and control process.

26
Three main approaches are followed for manual validation of data:
Internal validation
The methodology used to compile the balance sheet statistics is in compliance with the methods and sources described in the System of National Accounts (SNA) 2008 manual, Monetary and Financial Statistics Manual and Compilation Guide (MFSMCG) and the Guide to the International Banking Statistics. In turn, the rules and guidelines applicable to the compilation of the information as well as the concepts and classification and sectorization (currencies, instruments, maturities, institutional sectors, etc.) underlying the compilation of these statistics are laid down in the Regulations relating to banks as published in Government Gazette No 35950 of 2012 (amended from time to time). During this validation approach, data consistency is ensured through the internal validation of concepts, definitions and classifications in line with the prescribed manuals, regulations and guidelines.
Temporal validation
This process includes an analysis of developments over time. All reporting institutions - in this case each bank’s - short-term data trends are studied and compared to identify outliers. Respondents are requested to validate any anomalous values and to provide explanations for variances in short-term data trends.
External validation
The last approach involves cross-checking against other sources of data that are also being reported to the ERSD by the reporting institutions e.g. data reported for supervisory purposes. In this final approach, it is possible to cross-check source data reported in the scope of balance sheet statistics against information on the data reported for: (i) supervisory purposes and (ii) BOP.
The results generated from each of the aforementioned steps are incorporated together with the explanations and clarifications provided by the reporting entities and stored in a central application. This final step in the validation process serves as the certification that the data fullfills the necesssary requirements and is suitable for official statistical use.
Due to the significant similarities as depicted in table 8.5 between the two data sources, it is possible to use the LBS returns as a cross-check mechanism during the external validation process to validate the monetary data and vice versa. One of the aims of this work project is to optimally utilise the LBS data by creating automatic cross link reports between the two data sources which can improve and ensure the quality of data reported in both data sets. Refer to Appendix II for a high-level comparability outline. These reports will then automatically form part of the external validation process and if any discrepancies are detected during this phase, the reporting institution will be notified and requested to revise their data in cases where a one-on-one comparison is possible, or alternatively to provide explanations for mismatches.
8.2.2 LBS as supplementary data source for other macro-economic datasets
Another goal of this work project is to offer practical advice on how a central bank can utilise the LBS data to complement the existing macro-economic datasets by using the available LBS data to obtain
27
substantial auxiliary information in a relatively short period of time. The following sub-sections will elaborate on the benefits of using the LBS as auxiliary information source for specific users.
8.2.2.1 Expanding the monetary and credit aggregates
One way in which the LBS statistics can be utilised to facilitate the extension of monetary and credit aggregates is by providing data on banks’ cross-border and foreign currency positions. Conventional definitions of monetary aggregates include only deposits of residents denominated in domestic and foreign currency held in domestic banks, whilst deposits held by residents in banks located in foreign countries are excluded. Through the use of LBS data on banks’ cross-border liabilities to non-residents, extended measures of the monetary stock can be compiled and monitored as part of the monetary analysis process (Monticelli, 1993). From a credit perspective domestic credit aggregates generally include only loans and debt securities of banks vis-à-vis resident counterparties whilst the LBS data provides useful auxiliary information on cross-border borrowing by non-bank residents. By using this data, cross-border credit and foreign currency credit measures can be compiled and monitored. The different combination of breakdowns allows for an enriched analysis of the credit exposures of the domestic banking sector in terms of regions, counterparty sectors, financial instruments, currency and funding sources.
Although each of these data sets can individually be used to explore particular aspects of SA banks’ exposures, they can provide a much more detailed assessment of the risks facing the South African banking system when combined.
8.2.2.2 Developing links between LBS and external account data4
Banking sector data together with data on external account positions, transactions and revaluations form the foundation of central bank statistical data suites. The interrelationship between external transactions and domestic monetary developments has long been at the core of monetary analysis, among both theoreticians and central bank practitioners (Bê Duc, Mayerlen & Sola, 2008). The relevance of this statement has gained greater significance with the increased pace of globalization, especially the deepening financial linkages between national economies. This increased co-dependence also highlights the need to continually develop the suite of data and validation sources which underlies the external account data. Due to the fact that the LBS data is compiled on a resident basis which links to the methodology underlying the external account data, it makes sense to investigate and where appropriate exploit all the possible synergies and cross-pollination obtainable from LBS data to augment the existing external account data suite. As is already the case in various national statistical agencies, the LBS data can be used to enhance various BOP estimates. This strain of thought received further impetus with the advent of the global financial crisis of 2008 which accelerated the requirement for better data on major banking systems’ funding and lending patterns. In line with this reasoning and in order to establish possible synergies between the LBS and external account data for South Africa, there has to be a focus on the potential uses of the LBS data from an external account perspective – which will be discussed in this section.
One of the immediate and main advantages that accrue to the external account data suite would be the holistic view of the SA banking sector provided by the LBS dataset – it allows macroeconomic
4 In the context of this study the term external account refers to both the BOP and IIP datasets

28
statisticians to view the full value chain from lender to borrower, across instruments, sectors and national economies. The banking sector is a pivotal gateway through which large capital flows enter and leave a country and this sector is a key contributor to the country’s external account data. In South Africa’s case there has up to now been a relatively limited development of the geographic, instrument and sector footprint of the functional classifications contained in the South African external account data set. The SA banking sector plays a major role in the facilitation of liquidity within South Africa and also in cross-border flows and therefore obtaining additional information on these positions could significantly enhance the understanding of the development in the external accounts.
One of the main drivers behind the LBS data suite development was in fact the need to provide more detailed information on the role of banks in the intermediation of international capital flows and to measure lending flow breakdown of the banks’ resident as well as non-resident asset and liability positions. Figure 8.8 provides an overview of the detailed breakdown provided by the South African LBS database and how it could potentially augment existing external account data.
Figure 8.8 - Links between LBS and external account data
Households
Banks
Non-bank financial
institutions
Non-financial
institutions
Government
Loans (includes
all types of loans)
Debt securities (bought = asset; sold = liability)
Other assets/
liabilities
Asset and liability stock
position at end of each
quarter
Broken down by residency
South African
ROW
Broken down per
instrument
Broken down per
sector
Exte
nsiv
e Co
untr
y br
eakd
own
per
inst
rum
ent -
Cou
ld
poss
ibly
be
used
in
quar
terly
IIP
com
pila
tion
LBS data could serve as a cross-check for
foreign debt data
Coul
d be
use
d to
exp
and
deriv
ativ
e se
ctor
and
cou
ntry
br
eakd
own
for u
se in
qua
rter
ly
IIP
Of which: derivatives

29
The main advantage lies in the combination of variables contained within the LBS data – residency (geographic delineation), sector, instrument and currency. In the pre-crisis period it was primarily important for emerging market economies to manage their domestic economies prudently in order to attract the necessary capital flows to cover their increasing capital account deficits, with global systemic imbalances and risks receiving less attention. The advent of the crisis radically altered the statistical requirements – whilst the attraction of capital flows still remained a high priority, the global linkages within which national economies are bound has become of paramount importance. It is still a necessary but no longer a solely sufficient condition to attract capital – now it has also become important to identify from which country funding was obtained, in what currency, from which counterparty sector and with what instrument – the reason being that all of these factors aggravate or mitigate risks for the national economy. Insofar banking data is concerned the LBS data goes a long way in filling this increased statistical requirement.
There are various enriching data dimensions to be obtained from the South African LBS data set. As previously mentioned, one of the most rewarding characteristics of the LBS data is the detailed geographical breakdown that it provides. The breakdown is particularly suitable to assist in a quarterly compilation of a geographical breakdown of banking positions in the external accounts data for South Africa. Having this additional dimension in the South African external account data could provide additional insight into the economies from which South Africa attract its capital flows into the domestic banking sector and also to (and through) which economies SA banks direct their outward flows. Having deeper insight into this network of international banking linkages could potentially play a crucial role in understanding the systemic stability risks facing the South African banking sector.
The current LBS instrument breakdown – although more limited than required in the IIP – could also provide broad reference proxies for bank data contained within the existing IIP. Furthermore, the currency breakdown provided by the South African LBS dataset could assist with the calculation of revaluation estimates for the external account data. The external account data covers various instruments and currencies. The LBS data connects the assets and liabilities relating to non-residents and also provides a detailed breakdown of the composition. Thus currency revaluation estimation can be constructed based on a basket of currencies vis-à-vis the South African rand which is much more accurate than the currency breakdown obtained from the normal monetary survey from which the external accounts data vis-à-vis the South African banking sector is sourced.
The derivative data which is an “of which” component within the other asset and liability data of the LBS data could also provide supplementary elucidation on the size and currency dispersion of the South African OTC derivative market which is highly concentrated within the banking sector in South Africa. This could provide additional validation of the structure of this market, the currency dispersion and the volatility.
In addition to the LBS data compiled by the Bank, the Global LBS data set compiled by the BIS provides quarterly creditor information on loans and deposits of banks and non-banks by country - refer to figure 8.9.

30
= =
Global BIS Databse
ROW DTC
LiabilitiesAssets
SA Domestic Sector'
Liabiities
SA Domestic Sector' Assets
Households/ Private
NFC
Households/ Private
NFC
Figure 8.9 - Global BIS database breakdown
South African external account compilers can utilise the data on loans and deposits, debt securities and other instruments in relation to various domestic sectors’ (e.g. non-financial corporations, households, etc.) asset and liability positions to supplement their existing external account data sources for these sectors. The data provide information on claims and liabilities by South African resident sectors vis-à-vis non-resident banks and is a valuable additional source of information as to the exposure that South African sectors have with non-resident banks. This Global LBS data base is specifically relevant for improving the external account data on households. Using the LBS mirror data allows for the estimation of deposits (assets) vis-à-vis the ROW for the South African household sector. This would also be true in the instance where South African households obtain loans from foreign LBS reporting banks. The Global LBS BIS database could further augment the confirmation of the external account data obtained directly by the South African external account compilers – where discrepancies become apparent between the Global LBS database and that reported by a specific South African sector it could warrant the double-checking of the domestic respondent data.
The BOP Division of the ERSD is also responsible for the compilation of South Africa’s official external debt position. The dataset mentioned above could also provide additional cross-references for the different South African sectors’ foreign debt position against non-resident banks. Furthermore, the external debt position of the SA banking sector could be expanded with geographical dimension from South Africa’s LBS data.
Although direct flows are not contained explicitly within the LBS data, the actual liabilities and assets of the banking sector are contained within the stock positions and thus the movement between quarters contain both actual flows as well as valuation adjustments. Future development work could involve the development of a revaluation platform for the LBS data – with the currency breakdown being provided in the LBS statistics, it is possible to derive a proxy for transaction flows after a
31
currency valuation is computed. It will however only be able to serve as a proxy as actual valuation computations may vary due to different asset prices being used.
8.2.2.3 Financial Balance Sheet and Accumulation Accounts
Apart from the advantages discussed in the previous section, the usefulness of the LBS data suite similarly extends to the South African sector accounts. The usefulness specifically relates to the deeper analysis of the counterparty sector within the ROW sector as well as the utilization of the rich currency breakdown of the LBS data suite. One of the shortcomings of the SNA is the way in which the ROW is treated as an aggregate in the national accounts framework. From an analytical viewpoint it does add immense value to differentiate between the countries composing the ROW aggregate and, thereafter to be able to differentiate, within each of these countries, between their various sectors. This is a consequence of the fact that an analysis limited to national financial accounts can reduce the understanding of how financial flows are integrated at a global level. Indeed, sometimes the data provided by foreign reporting entities such as banks can be very useful, and of a better quality, for assessing the financial positions of resident units that may be difficult to capture in the SNA framework. Thus, a main advantage provided by the LBS data suite is the additional source of information it provides for South African sector accounts. This benefit is closely linked to the benefits derived for the external account data set because it provides the bulk of the input for the ROW sector account. The South African LBS dataset allows for the further breakdown of the ROW sector counterparty of the South African Deposit Taking Corporation (DTC) sector within the sector accounts. It is the case for both asset and liability positions – which can be broken down by national economy and sector within that economy. This allows for deeper insight regarding the destination economies and sectors into which South African DTC’s invest their funds – either through deposits, loans, uptake of foreign sector debt securities or other investments.
The second main advantage obtained from the South African LBS data suite in the detailed currency breakdown per instrument class. This data set can be used to provide the currency split for a revaluation model used within the South African sector accounts. It allows for the quarterly update of the currency basket composition in the sector accounts which assists with more accurate estimation of revaluation and transaction data.
8.2.2.4 Improved sector decomposition for South African sectors
The detailed domestic sector split produced by the South African LBS dataset could provide additional elucidation to the domestic sector compilers regarding their asset and liability position vis-à-vis the South African banking sector.
This concludes section 8.2 of the work project which has identified several ways in which the LBS can serve as a quality assurance tool in the broader statistical compilation process and how it can be utilized to complement other existing macro-economic datasets compiled within the central bank. The next section will focus on the use of LBS to identify indicators of vulnerability.
8.3 IDENTIFYING INDICATORS OF VULNERABILITY
While the banking sector’s exposures to non-residents or their positions denominated in foreign currency may be of less relevance for monetary policy, this data - specifically the breakdowns by currency, sector and instrument, can be most useful for financial stability analysis. Data on cross-

32
border exposure can greatly benefit the assessment and understanding of bank systemic risk by providing a benchmark vis-à-vis other countries in terms of both overall market share as well as categorization provided in the data; such as lending and borrowing sectors and maturity and currency composition (Aminudin et al., 2014). In addition, it serves as a powerful tool for identifying economic trends that other banking statistics cannot capture. Apart from the sector wide view which the analysis provides, individual bank-level analysis can also be performed in a similar manner which could be of benefit from a banking supervision perspective. The main focus area of this part of the study will relate to the application of LBS from a financial stability risk perspective in order to identify indicators of vulnerability as described in the subsectors hereafter.
8.3.1 Currency breakdowns and mismatches
The rapid expansion of cross-border investment positions means that currency movements can potentially have large balance sheet effects. The impact of this will vary across countries, depending on the scale of its international balance sheet, its net IIP as well as the currency composition of its assets and liabilities. Research done by Tille (2003), Gourinchas & Rey (2007) and Lane & Milesi-Ferretti (2007) have highlighted the fact that the foreign liabilities of the United States are mostly denominated in US dollars while there is a substantial non-dollar component in its foreign assets. Accordingly, unanticipated dollar depreciation improves the net IIP of the United States by increasing the US dollar value of its foreign assets relative to its foreign liabilities. By contrast, many emerging markets have historically issued significant amounts of foreign-currency debt — for these countries currency depreciation has had an adverse impact on their net foreign asset position. This part of the work project will focus on analyzing the composition of the foreign currency exposure of SA banks and determining whether currency mismatches exist through the use of LBS data. It should however again be noted that LBS do not provide data on hedging activities of the banking sector.
SA banks are integrated in the global financial system and their balance sheets consist of assets and liabilities with non-residents, the majority of which are denominated in in foreign currency. However, as mentioned in section 8.1.1 the non-resident component represents a relatively small portion of their overall balance sheets, accounting for 13,1 per cent of their total assets and 9,2 per cent of their total liabilities as at end December 2015. The LBS data features a detailed breakdown of SA banks' international positions into five major foreign currencies (US dollar, Euro, Japanese Yen, Pound Sterling and Swiss Franc), with a residual category for “other currencies”.
Figure 8.10 illustrates that there has been a firm expansion in the foreign assets of SA banks denominated in foreign currency from December 2009 to December 2015, with growth amounting to 125 per cent over this period compared to 60 per cent growth in foreign assets denominated in rand. Foreign currency-denominated liabilities against foreign counterparts recorded even more significant growth over this period, expanding by 139 per cent compared to 65 per cent growth in foreign rand-denominated liabilities. Nonetheless, the foreign currency component of total foreign liabilities remains lower than the foreign currency component of total foreign assets. Non-resident foreign currency-denominated liabilities constituted 64 per cent of total foreign liabilities as at December 2014, whereas foreign currency-denominated assets of non-residents constituted 71 per cent of total foreign assets.

33
Figure 8.10 - Foreign assets and liabilities of SA banks 2009 - 2015
The increased pace of global financialisation, coupled with the increased liquidity of many emerging market currencies have placed a greater focus on the currency composition of the financial assets and liabilities of these economies. The sensitivity of foreign positions to exchange rate movements is important due to the fact that the currency composition of foreign assets and liabilities can often be highly asymmetric. Currency mismatches usually occur when the bulk of a borrower’s liabilities are denominated in foreign currency, whilst their assets are denominated in domestic currency. Any sudden unforeseen and severe depreciation of the exchange rate could influence these borrowers’ ability to repay their creditors. Currency mismatches are not only limited to differences between domestic and foreign currencies, but can also arise between different foreign currencies. For example, a firm may borrow “strong” currencies at low yields with the purpose to invest in “weak” currencies which offer higher returns.
Of particular interest in this context is the composition of SA banks’ foreign currency exposure. As seen in figure 8.11 their total holdings of foreign currency-denominated assets exceed their foreign currency liabilities - thus resulting in an overall net foreign currency-denominated asset position. The consequence being that a depreciation of the South African rand will reduce the size of SA banks' overall net foreign liability position due to the increasing rand value of foreign currency assets relative to the foreign currency liabilities and vice versa. It will however depend on the specific foreign currency basket composition of the assets and liabilities. SA banks’ total holdings of foreign assets continue to exceed their foreign liabilities resulting in a positive net asset position. As depicted in figure 8.11, the net asset position widened from a low of R60 billion in December 2009 to a high of R175 billion in December 2013, after which it narrowed somewhat to R108 billion in December 2015.

34
Figure 8.11 - Net foreign asset position in foreign currency 2009 - 2015
Due to the relatively symmetric currency basket composition both the foreign currency denominated assets and liabilities of banks are subject to similar valuation changes, it contributes to a natural foreign currency hedge position. However this margin has recently been declining from 31 per cent in December 2013 to 11 per cent in December 2015. Figure 8.12 shows the developments in SA banks’ FX hedge position from December 2009 to December 2015.
Figure 8.12 - SA banks’ FX hedge position 2009 - 2015
Although foreign currency mismatches do not necessarily pose a significant problem at an aggregate level, it is possible that the total net foreign currency asset position could be masking the existence of net foreign currency liability positions for individual counterpart sectors, which could be important

35
from a financial stability perspective. Table 8.6 provides an overview of the net position per non-resident sector as at the end of 2015.
R billions Non-resident sector
breakdown Financial assets Financial liabilities
Net foreign currency exposure*
Bank sector 348 346 2
Financial corporate sector 37 41 -4
Non-financial institutions 109 16 93
Government 31 2 29
Households 4 2 2
Other non-resident sector 1 14 -13
Total 530 421 109 *Before accounting for hedging activities
Table 8.6 - SA banks’ foreign currency exposure vis-à-vis non-resident sectors, end December 2015
From table 8.6 it is evident that the majority of the non-resident sectors have a generally well balanced net foreign currency position, with both non-financial institutions and the government sector having sizeable net asset foreign currency positions. This has remained fairly constant over time as illustrated in figure 8.13.
Figure 8.13 – Net foreign currency exposure of non-resident sectors 2013 - 2015
Given the above analysis, it is clear that SA banks do not face material currency mismatches as these are generally funded through and hedged in the FX swap market and any risks associated in terms of overall currency exposure are monitored by banks on a continuous basis. Although they have managed to maintain a healthy net foreign currency asset position, the global economy has been experiencing a period of financial turmoil since the financial crises which have recently been

36
exacerbated by various volatile market developments. These events could potentially result in severe currency movements, which in turn could have adverse effects on the balance sheets of SA banks. From a financial stability perspective, it is therefore of utmost importance that these developments are monitored on a continuous basis and the LBS data should serve as a useful tool in this regard.
8.3.2 Assessment of structural vulnerabilities through the use of ratio analysis
In the previous sections the LBS data was explored by analyzing the absolute values, but in order to evaluate the structural vulnerabilities of SA banks within an international context it is also important to study the data in relative terms. This section of the work project will explore ratio analysis such as the size of the banking sector relative to GDP ratio; foreign lending ratio; and borrower concentration ratio to analyze their usefulness in determining the potential impact of banking sector problems on economic activity. The vulnerability of the national banking sector to cross-country spill-over effects and the diversification of banks’ foreign exposure across other countries will also be examined as indicator of banks’ vulnerability to first-round contagion effects (Bonollo & Riccaboni, 2014). For this purpose, the nationally compiled LBS data supplemented by LBS data sourced from the BIS online facility for the fourth quarter of 2015 are used to construct three ratios, each of which will be discussed in the following sub-sections.
8.3.2.1 Relative size of banking sector ratio
This part of the project will commence with the calculation of the “relative size of the banking sector” ratio i.e. the size of the banking industry relative to Gross Domestic Product (GDP).
Calculated as:
Total bank assets of country i
GDP of country i5
It is calculated by taking total bank assets over nominal GDP for selected BIS reporting countries. The aim is to measure the potential impact of banking sector volatility on economic activity. A large ratio indicates that banking sector problems within a specific country have the potential to severely affect the economic activity of that country. The latest experience from the financial crises demonstrated that countries with a relatively large banking sector compared to the size of their GDP were significantly more vulnerable. Figure 8.14 compares the size of the different BIS reporting countries’ banking sectors in relation to their GDP.
From figure 8.14 it is evident that traditional financial hubs such as the UK and Switzerland have substantially higher ratios - making them more vulnerable to financial shocks and the volatility of this sector. At this point it should however also be noted that literature has suggested that while size can be an important measure, it is the resilience of the banking system that is the vital key for financial stability.
5 Data was obtained from IMF’s website.

37
Figure 8.14 – Relative size of the banking sectors compared to their GDP as at end December 2015, Sources: IMF and BIS databases
Similar to its emerging market peers such as Brazil and India, SA banks’ play a significant role in the economy with total assets relative to GDP amounting to 103 per cent as at the end of December 2015.
8.3.2.2 Foreign lending ratio
The foreign lending ratio allows for the quantification of a national banking sector’s vulnerability to cross-country spill-over effects.
Calculated as:
Total foreign loans of banking sector i
Total bank assets of country i
It is largely an indication of how dependent the national banking system of a specific country is on cross-border activities. A large ratio implies that foreign exposure write-downs could have a significant effect on the stability of the national banking system. Factors such as the competitiveness of the national banking sector, a limited home market and trade openness could all contribute towards a higher ratio.
If the previously selected BIS reporting countries are ranked according to their foreign lending ratios as shown in figure 8.15 - British, Irish, Austrian and Swiss banks are in the top positions with emerging market countries such as India and Brazil featuring at the bottom of the list.

38
Figure 8.15 – Foreign lending ratios as at end December 2015, Source BIS database
Although South Africa seems to have a slightly higher foreign lending ratio compared to its emerging market peers, it still remains relatively small at around 9 per cent.
8.3.2.3 Borrower concentration ratio
In analyzing the vulnerability of the national banking system to first-round contagion effects, the “borrower concentration ratio” can serve as a valuable tool. This measure identifies those countries that have concentrated their lending on specific regions or countries.
Calculated as:
Exposure of banking sector vis-à-vis country j
Total foreign loans of banking sector i
The risk of contagion may be greater for a banking sector that is highly exposed to a single or few other countries, opposed to a country that has diversified its foreign lending exposure. As indicated in table 8.7, the top three countries contributed to approximately 50 per cent of South Africa’s borrower concentration ratio, indicating possible vulnerability should these countries experience financial instability. South Africa had a borrower concentration ratio of 55 per cent at the end of December 2015 and the banking system was highly exposed to the UK at 27,9 per cent.
2

39
Foreign loans of
SA banks vis-à-vis: US dollar Millions
As percentage of total foreign loans of SA banks
United Kingdom 8,5 27,9
Isle of Man 4,1 13,4
United States 2,6 8,7
Nigeria 2,1 6,8
Ghana 1,0 3,3
Germany 1,0 3,2
China 0,9 2,9
France 0,9 2,9
Zambia 0,9 2,8
Mauritius 0,8 2,5
Table 8.7 – South Africa’s exposures against top ten countries as at end December 2015
This ratio can also serve as a useful tool from a micro banking supervision perspective in the measurement of banks’ risk concentration.
8.3.3 Network analysis
Financial stability analysis typically involves the assessment of risks and vulnerabilities within the financial system as well as the identification of potential triggers which could result in instability within the system. The recent global financial crises has demonstrated that financial stability should further be directed at identifying links between channels and sectors within the financial sector, as shocks in the aforementioned could potentially result in wider contagion within the system. In recent times, network analysis has gained increasing popularity as a powerful methodological tool for representing interactions between economic role players and for assessing systemic risks within financial systems. Through the use of LBS within a network perspective, the financial system can be represented as a network of interlinked exposures which can serve as a model to map financial interconnectedness from which implications for system stability can be drawn (Bernanke, Bertaut, DeMarco, & Kamin 2011; DasGupta & Kaligounder, 2014; and Bruno & Shin, 2015a & 2015b). This section of the work project will apply methods from the rapidly expanding line of research on network analysis methods and tools in order to describe the South African LBS data in a network context and to capture bilateral relationships.
The study commences with the establishment of a network of BIS reporting countries where after an assessment of their mutual dependencies will follow. The LBS data are well suited for studying temporal patterns in financial linkages across countries as it provides bilateral data on the country of residence and the sector of the reporting banks’ counterparties as well as the residence and nationality of reporting banks. In the network analysis applied in this work project we will consider 43 BIS reporting countries listed in Table 8.8 below, for which the data sourced from the BIS are complete and reliable.
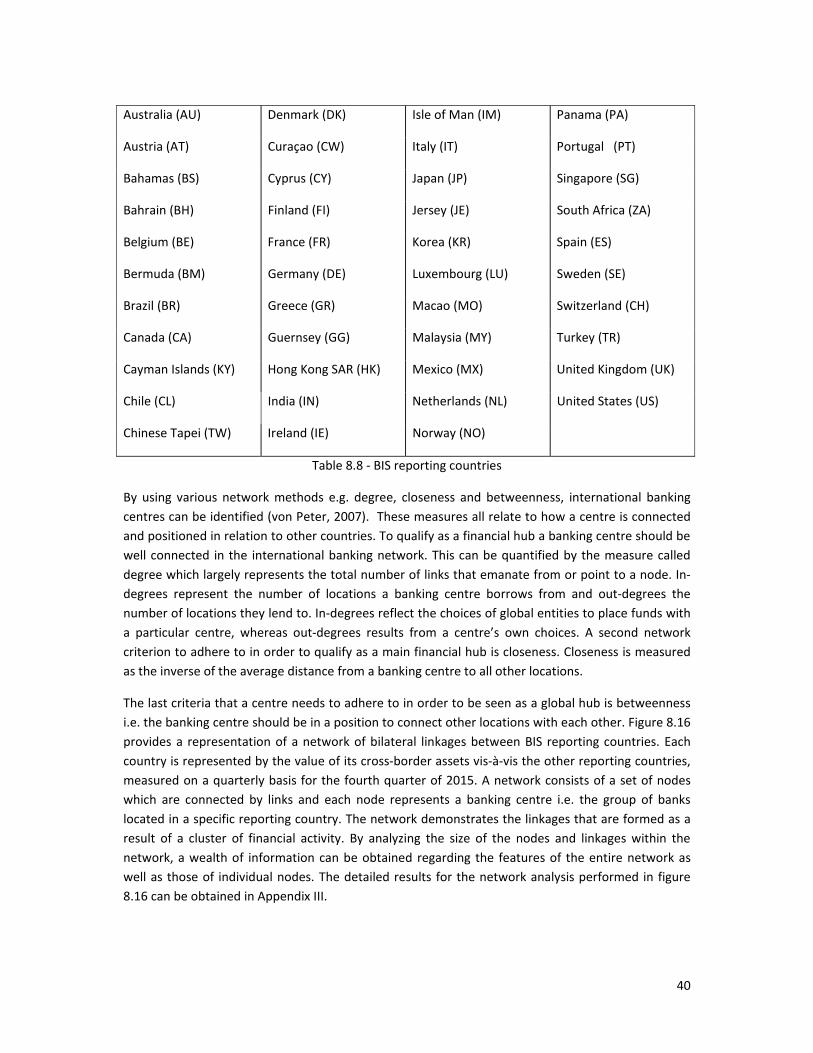
40
Australia (AU) Denmark (DK) Isle of Man (IM) Panama (PA)
Austria (AT) Curaçao (CW) Italy (IT) Portugal (PT)
Bahamas (BS) Cyprus (CY) Japan (JP) Singapore (SG)
Bahrain (BH) Finland (FI) Jersey (JE) South Africa (ZA)
Belgium (BE) France (FR) Korea (KR) Spain (ES)
Bermuda (BM) Germany (DE) Luxembourg (LU) Sweden (SE)
Brazil (BR) Greece (GR) Macao (MO) Switzerland (CH)
Canada (CA) Guernsey (GG) Malaysia (MY) Turkey (TR)
Cayman Islands (KY) Hong Kong SAR (HK) Mexico (MX) United Kingdom (UK)
Chile (CL) India (IN) Netherlands (NL) United States (US)
Chinese Tapei (TW) Ireland (IE) Norway (NO)
Table 8.8 - BIS reporting countries
By using various network methods e.g. degree, closeness and betweenness, international banking centres can be identified (von Peter, 2007). These measures all relate to how a centre is connected and positioned in relation to other countries. To qualify as a financial hub a banking centre should be well connected in the international banking network. This can be quantified by the measure called degree which largely represents the total number of links that emanate from or point to a node. In-degrees represent the number of locations a banking centre borrows from and out-degrees the number of locations they lend to. In-degrees reflect the choices of global entities to place funds with a particular centre, whereas out-degrees results from a centre’s own choices. A second network criterion to adhere to in order to qualify as a main financial hub is closeness. Closeness is measured as the inverse of the average distance from a banking centre to all other locations.
The last criteria that a centre needs to adhere to in order to be seen as a global hub is betweenness i.e. the banking centre should be in a position to connect other locations with each other. Figure 8.16 provides a representation of a network of bilateral linkages between BIS reporting countries. Each country is represented by the value of its cross-border assets vis-à-vis the other reporting countries, measured on a quarterly basis for the fourth quarter of 2015. A network consists of a set of nodes which are connected by links and each node represents a banking centre i.e. the group of banks located in a specific reporting country. The network demonstrates the linkages that are formed as a result of a cluster of financial activity. By analyzing the size of the nodes and linkages within the network, a wealth of information can be obtained regarding the features of the entire network as well as those of individual nodes. The detailed results for the network analysis performed in figure 8.16 can be obtained in Appendix III.

41
Figure 8.16 – Linkages in the international banking system as at end December 2015, Source: BIS database
The network can be described as being directed, as a link from South Africa to the UK is different from a link in the opposite direction and the direction serves as an indication of which location is holding the claims (i.e. liabilities of the other location). For the sake of clarity, only links with a value above a certain threshold are drawn. The threshold is determined in order to ensure that the networks can be displayed in a clearly arranged manner. Although, the underlying data provide the possibility of viewing all bilateral relations, a threshold of above 2 per cent allows the simplification of the graphical representation of the network. The size of each node is proportional to the sum of in-degrees (number of edges pointing towards the vertex of interest) and out-degrees (number of edges that the vertex of interest points towards) and represented by the following colours in figure 8.16:
Olive: 0 to 14 in-degrees;
Blue: 15 to 28 in-degrees; and
Red: 29 to 42 in-degrees.

42
Bilateral linkages vary significantly between country pairs. As illustrated in figure 8.16, countries DE, GB, and US are centered and have the highest in-degrees and out-degrees. Countries represented by the olive nodes are more peripheral. The network shows well-known relationships between countries for example the United States and the UK are clearly identified as the global financial centres. The US and the UK are borrowing from many other countries and a considerable portion of their lending activity takes place between each other. The network graph provides a clear visual distinction between countries that have a strong linkage and those with a weaker linkage.
If we look at the network graph from a South African perspective, it is evident that the bulk of the external claims of South African registered banks are dominated by developed countries, in particular the UK. South Africa has a well-developed and regulated banking system with multiple links to the UK. Some of the country’s largest banking groups either have headquarters or parent companies located in the UK. In addition, various SA banks obtain offshore funding from the UK. As a result, significant changes to the UK’s financial services sector will inevitably have spillover effects on South Africa’s financial services sector. The network analysis perspective is thus a very useful tool for developing an overview of mutual interlinkages; to uncover less obvious interdependencies and to determine which countries are most central and, therefore, most subject to contagion.
This concludes section 8.3 of the work project where the main focus was to apply the LBS from a financial stability perspective in order to identify several indicators of vulnerability which was done in the form of currency mismatch analysis, structural vulnerability assessment using ratio analysis and network analysis.
8.4 DISSEMINATION STRATEGY AND ANALYTICAL RESEARCH OUTPUTS
Official statistics producers have a responsibility to deliver high quality statistics and in the dissemination of this data, readily available access is a key requirement for the users of the statistics. As discussed in section 8.1.2.6 of this work project, one of the objectives is to provide ERSD users with the highlights and a broad overview of the LBS developments in the format of a quarterly report. The collection and compilation of the LBS is a laborious task and compilers can hardly be expected to identify all the research questions that could be addressed using the LBS data. For this reason all the LBS data will be made available through the ERSD’s internal time series database to provide other researchers within the organization with the opportunity and flexibility to identify interaction and relationships between phenomena covered in the LBS in order to produce a diversity of quality research outputs from this rich data source. The comprehensive LBS time series will be established and maintained on the ERSD database by the compilers of the LBS. In addition, relevant topics of interest can be studied on an ad-hoc basis and short news flashes can be compiled and distributed as part of the current news flash series. Furthermore, notes on concepts, sources and methods can be added to facilitate user interpretation and maximization of the use of LBS.

43
9. LIMITATIONS AND RECOMMENDATIONS FOR FUTURE WORK
Although the LBS are arguably one of the best data sources available to monitor and analyze developments in global banking, as it captures positions of banking offices located in 43 reporting countries vis-à-vis counterparties resident in over 200 countries, there are some limitations to the data which should be mentioned:
The availability of data for some of the analyses, for example ratio and network analyses is limited and restricted to the BIS reporting countries. Data for non-reporting BIS countries can be included in a derived format e.g. if these countries are treated as borrowers and not lenders;
Banks report only stock data, not flows. However, banks do report the currency in which their claims and liabilities are denominated which enables the calculation of quarterly flow data through the adjustment of outstanding stocks for currency movements during the period. It should however be noted that exchange rate adjusted changes in outstanding stocks are not a perfect substitute for data on flows as the actual flows may have taken place at different exchange rates. Nonetheless, it provides a much better approximation opposed to unadjusted changes in stocks;
LBS currently include only balance sheet information and there is no data available from profit or loss statements. More detailed off-balance sheet information e.g. hedging activity would be helpful in the assessment of risk exposures;
Some important G20 countries such as Argentina, Russia and Saudi Arabia, are not yet participating in the LBS framework. The classification of some of the banks in these countries as Global Systemically Important Banks (G-SIBs) by the Financial Stability Board makes their inclusion as reporting banks in the LBS statistically significant.
Despite these minor limitations, the data remains one of the richest and most useful sources of cross-border banking activity and the conclusions drawn from the study remain significant and useful in the South African context. The LBS houses a vast source of potential and its exploration stretches much further than the scope of this work project. Some suggestions for subsequent development phases, which will not be covered in this work project, include the following:
Conducting peer group analysis to identify sector concentrations in lending for particular types of banks e.g. domestic banks, branches of foreign banks and subsidiaries;
Investigate the consolidation of the monetary and LBS surveys. Due to the close relationship between the type of information contained within the LBS and monetary surveys, consideration should be given to consolidate these two returns and to merge them into one single survey. SA banks are currently requested to deliver very similar information in somewhat different formats at different frequencies. This notably increases the reporting burden on banks and places increased pressure on resources devoted by the Bank in terms of the collection, checking and analysis of the source data. The ERSD should exploit all existing information synergies with the aim to ensure an efficient data collection system.

44
This will allow cost minimization and better allocation of available resources and will also facilitate the circulation of information to the interested stakeholders thereby enhancing the decision-making process;
Extending the network analysis by applying various network centrality measures such as degree, closeness and betweenness in order to characterize the importance of banking locations in relation to South Africa;
Consider the reporting of Consolidated Banking statistics (CBS) for South Africa within the broader IBS framework. CBS measures worldwide consolidated claims of banks headquartered in the reporting country, including claims of their own foreign affiliates but excluding inter-office positions, as well as a breakdown of banks’ funding by broad instrument type. CBS are reported on immediate and ultimate risk basis. Although it is not currently regarded as a priority due to cost and capacity constraints and the fact that South African banking institutions play only a minor role in the global system, it is something that should be considered in the future;
Extending the mirror exercises by using data from the Coordinated Portfolio Investment Survey (CPIS) and the IIP. The CPIS data set mainly focuses on the geographical distribution of portfolio assets (equity, long-term debt, and short-term debt securities). Thus, participating countries can use the CPIS data to obtain mirror information on their portfolio liabilities. Such information can be difficult to collect since the resident issuer of traded securities is often not in a position to identify the beneficial owner of its securities and may therefore be unaware whether the creditor is a resident or non-resident counterparty. The CPIS data can therefore be used to compare the debt security issues on the liability side of LBS reporting banks with the debt security assets held by other countries vis-à-vis the South African bank sector. In a similar fashion the IIP data of various countries can also be used to conduct mirror data analysis against the South African LBS data. For those countries that disaggregate their IIP asset data by counterparty country and non-resident sector it would serve a useful purpose as comparison tool against the LBS liabilities of SA banks.
Investigating the possibility of releasing the South African LBS data for public inspection and using the Web and associated technologies in the dissemination of LBS to enable the widest possible use of the statistics.
From the above aspects, it is clear that a useful extension of this study can be conducted.

45
10. CONCLUSION
This final chapter attempts to draw conclusions and give recommendations based on the results obtained in the previous chapter. The aim of the work project was to investigate the key analytical uses of the LBS data from a national central bank perspective in order to develop an analysis strategy. Based on an extensive review of literature, the work project developed a suite of analysis, which currently does not exist in South Africa.
The analysis commenced with an introductory overview of the structure of the LBS. Thereafter the main characteristics of the statistics were investigated in order to provide a better understanding of the LBS’s advantages for analysis. The results revealed that since the LBS shows the country of residence and sector of the reporting banks’ counterparties as well as the residency and nationality of the reporting banks it is particularly useful for the analysis of the geography of international banking and the interconnections at country level. The work project proposed a framework for short-term structural analysis of LBS data in the format of a quarterly report. The study furthermore highlighted how the LBS data can be utilized as a quality assurance tool in the statistical compilation process and also to supplement other statistical domains such as the external accounts.
The work project furthermore highlighted how the LBS data can be used most effectively to identify and monitor potential threats to financial stability. One of the major advantages of the LBS is the inclusion of a currency breakdown, which allows for the analysis of various dimensions of global banking, including currency exposures and mismatches. The results of the work project also indicate how structural vulnerabilities can be explored by applying ratio analysis to the LBS data. Lastly, it demonstrated how network analysis can be deployed to provide a bird’s eye view of bilateral interconnectedness.
From the results obtained in chapter 8 of this work project it is evident that the LBS data source has been under-utilized in the Bank as the focus thus far has largely been on the collection and compilation of these statistics. Therefore in order to ensure the most efficient use of existing resources and knowledge deployed in the LBS data compilation and to keep abreast with international developments in this field it is recommended that the ERSD implements the comprehensive suite of analysis proposed in this work project. This would not only expand the benefits of the LBS, but would greatly increase the interest and demand for the statistics in the ERSD and the Bank as a whole.

46
11. BIBLIOGRAPHY
Allen, F., Beck, T., Carletti, E., Lane, P. R., Schoenmaker, D., & Wagner, W. (2011). Cross-Border Banking in Europe: Implications for Financial Stability and Macroeconomic Policies. London, United Kingdom: Centre for Economic Policy Research.
Aminudin, U., Gadanecz, B., & Tissot, B. (2014). Indicators to support monetary and financial stability analysis: Overview of the seventh IFC conference. IFC bulletin, 39.
Avdjiev, S., Upper, C., & Vause, N. (2011). Highlights of the BIS international statistics. BIS Quarterly Reviews, (June), 13–28.
Baba, N., McCauley, R., & Ramaswamy, S. (2009). US dollar money market funds and non-US banks, BIS Quarterly Review, (March), 65–81.
Bê Duc, L., Mayerlen, F. & Sola, P. (2008). The monetary presentation of the Euro Area Balance of Payments. ECB Occassional paper series, (96).
Bernanke, B. S., Bertaut, C. C., DeMarco, L., & Kamin, S. B. (2011). International capital flows and the return to safe assets in the United States 2003-2007. International Finance Discussion Papers, (1014). Retrieved from http://www.federalreserve.gov/pubs/IFDP/2011/1014/ifdp1014.pdf
BIS. (2000). Guide to the international banking statistics, Basel, July. Retrieved from http://www.bis.org/publ/bppdf/bispap16.htm
BIS. (2015). Reporting requirements for the locational banking statistics, Basel. Retrieved from https://www.bis.org/statistics/bankstatsguide_repreqloc.pdf
BIS. (n.d.). About BIS. Retrieved from https://www.bis.org/about/index.htm.
BIS Committee on the Global Financial System. (2007). CGFS: Research on global financial stability: the use of BIS international financial statistics. BIS CGFS Papers, 29.
BIS Committee on the Global Financial System. (2010). CGFS: Research on global financial stability: the use of BIS international financial statistics. BIS CGFS Papers, 40.
BIS Committee on the Global Financial System. (2014). CGFS: EME banking systems and regional financial integration. BIS CGFS Papers, 51.
Bonollo, M., & Riccaboni, M. (2014). Systemic Importance of Financial Institutions: From a Global to a Local Perspective? A Network Theory Approach. IMT Lucca EIC Working paper series, 09/2014.
Bruno, V., & Shin, H. S. (2015a). Cross-border banking and global liqudity. Review of economic studies, 82 (2), 535-564.
Bruno, V., & Shin, H. S. (2015b). Capital flows and the risk taking channel of monetary policy. Journal of monetary economics, 71, pp119-132.
Buch, C., Driscoll, J., & Ostergaard, C. (2005). Cross-border diversification in bank asset portfolios, ECB Working Papers, 429.

47
Caruana, J. (2012). Interconnectedness and the importance of international data-sharing. Speech at 3rd Swiss National Bank-International Monetary Fund conference on the international monetary system, Zurich, (May).
Cerutti, E., Claessens, S., & McGuire, P. (2011). Systemic Risks in Global Banking: What available data can tell us and what more data are needed? IMF Working Papers, 1–26. Retrieved from http://doi.org/10.3386/w18531
Coates, D., Everett, M., McNeill, J. & Moloney, A. (2015). Interpreting data for Ireland in international banking statistics. Economic Letter Series. Retrieved from https://www.centralbank.ie/news-media/press-releases/economic-letter-interpreting-data-for-ireland-in-international-banking-statistics.
DasGupta, B., & Kaligounder, L. (2014). On global stability of financial networks. Journal of Complex Networks, 2(3), 313–354. Retrieved from http://doi.org/10.1093/comnet/cnu004
de Beer, B. (2015). South Africa's experience with capital flows since the financial crisis - from measurement to analysis. Proceedings of the IFC satelite meeting organized with the Central Bank of Brazil and CEMLA in Rio de Janeiro: Assessing International Capital Flows after the crisis, IFC bulletin, 42.
Dembiermont, C., Drehmann, M., & Muksakunratana, S. (2013). How much does the private sector really borrow - a new database for total credit to the private non-financial sector? BIS Quarterly Review, (March), 65–81. Retrieved from http://ideas.repec.org/a/bis/bisqtr/1303h.html
Domanski, D., & McGuire, P. (2011). Assessing global liquidity - BIS Quarterly Review, part 5, (December), 57–71.
ECB (2012). Central bank statistics as a servant of two separate mandates – price stability and mitigation of systemic risk, Sixth ECB conference on statistics, (April). Retrieved from https://www.ecb.europa.eu/press/pr/date/2012/html/pr120803_1.en.html
Fender, I., & McGuire, P. (2010). Bank structure, funding risk and the transmission of shocks across countries: concepts and measurement. BIS Quarterly Review (September), 63-79.
Gourinchas, P.O., & Rey, H. (2007). International financial adjustment. Journal of political economy, 115(4), 665-703.
Gray, D. E. (2014). Theoretical perspectives and research methodologies. Doing Research in the Real World, Retrieved from http://www.uk.sagepub.com/books/Book239646#tabview=toc
Hahm, J. H., Shin, H. S., & Shin, K. (2013). Noncore Bank Liabilities and Financial Vulnerability. Journal of Money, Credit and Banking, 45, 3-36.
Hawkins, J., & Marc, K. (2000). Measuring potential vulnerabilities in emerging market economies. BIS Working Papers, 91.
Iazzetta, C., & Manna, M. (2009). The topology of the interbank market: developments in Italy since 1990. Bank of Italy - Working Paper, 711.
48
Lane, P.R., & Milesi-Ferretti, G.M. (2007). The external wealth of nations II: Revised and extended estimates of foreign assets and liabilities, 1970-2004. Journal of International Economics, 73(2), 223-250.
Lane, P.R., & Shambaugh, J. (2009). The long or short of it: Determinants of foreign currency exposure in external balanche sheets. NBER working paper. Retrieved from http://www.nber.org/papers/w14909
McCauley, R. N., Ruud, J. S., & Woodridge, P. D. (2002). Globalising international banking. BIS Quarterly Review, (March), 41–51.
McGuire, P., & Tarashev, N. (2006). Tracking International Bank Flows. BIS Quarterly Review, 27–40.
McGuire, P., & Tarashev, N. (2008). Global monitoring with the BIS international banking statistics. BIS Working Papers, 244.
McGuire, P., & von Peter, G. (2009). The US dollar shortage in global banking. BIS Quarterly Review, (March), 47-63.
Monticelli, C. (1993). All the Money in Europe? An investigation of the Economic Properties of EC-wide Extended Monetary Aggregates. BIS working paper, 19. Retrieved from http://www.bis.org/publ/work19.htm
O’Connor, P. (2004). Developments in UK international banking statistics. Retrieved from http://www.bankofengland.co.uk/statistics/Documents/ms/articles/art2feb04.pdf
Tille, C. (2003). The impact of exchange rate movements on US foreign debt. Current issues in Economic and Finance, 9(1), 1.
Tukey, J. W. (1977). Exploratory Data Analysis. Retrieved from http://scholar.googleusercontent.com./scholar?q=cache:C2 KvBmzpRSoJ:scholar.google.com/+exploratory+data+analysis+john+w+tukey+download&hl=en&as_sdt=0,5&as_vis=1
Von Peter, G. (2007). International Banking Centres: a Network Perspective. BIS Quarterly Review, 12(4), 33–45. Retrieved from http://doi.org/10.2139/ssrn.1075205
Weistroffer, C., & Möbert, J. (2010). Monitoring cross-border exposure, A primer on how to exploit the BIS banking statistics. Deutsche bank research, 26. Retrieved from www.dbresearch.com/mail/dbr_internet_en_prod/prod0000000000266643.pdf
Wooldridge, P. D. (2002). Uses of the BIS statistics: an introduction. BIS Quarterly Review, (March), 75. Retrieved from http://www.bis.org/publ/qtrpdf/r_qt0203h.pdf

49
12. APPENDICES
12.1 APPENDIX I: EXAMPLE OF A PROPOSED QUARTERLY REPORT PROVIDING THE MAIN
HIGHLIGHTS OF THE LBS
Due to a sharp depreciation of the rand, banks experienced a sizeable narrowing of their net external position in the fourth quarter of 2015 From September to December 2015, the international liabilities of South African banks
increased by R155 billion, exceeding the increase in foreign assets which contributed to a notable narrowing of their positive net external position.
The rapid depreciation of the exchange rate of the rand had a significant impact on the value of banks’ derivative portfolios, resulting in marked increases in both other assets and other liabilities.
Table 1: Counterparty countries with which SA banks have the largest net external positions R billions
Country International assets
International liabilities
Net international
position
Top 5 countries with positive net external position
United States 73,7 39,6 34,1
Nigeria 31,3 8,7 22,7
Ghana 18,0 2,9 15,1
Zambia 13,5 2,4 11,1 United Kingdom 310,5 299,6 10,9 Top 5 countries with negative net external position
Saudi Arabia 0,9 15,0 -14,1
China 15,7 26,9 -11,2 United Arab Emirates 3,8 11,1 -7,4
Bahrain 0,0 6,2 -6,2
Hong Kong 1,4 6,8 -5,5
All countries 750 655 95

50
Analysis Graph 1 illustrates that South African banks’ total holdings of foreign assets continue to exceed their foreign liabilities. In December 2015 banks’ assets exceeded their liabilities by R95 billion, a noticeable decline from the net value of R174 billion recorded in September. By country, banks’ net positive exposure to the United Kingdom moved back into the top five list in the quarter under review. SA banks’ exposure to Mauritius and the Netherlands moved out of the top 5 group of positive net asset positions over the same period and was replaced by Ghana and Zambia. Despite recording an overall positive net international asset position, there were some instances where South African banks’ individual country liability positions exceeded their asset positions in the fourth quarter of 2015 as depicted in table 1.
Graph 2: SA banks’ net positions per counterparty sector
SA banks are mainly net lenders to both the domestic and foreign non-financial sector and foreign banks, whilst relying significantly on net borrowings from the domestic and foreign financial sector. At the end of December 2015, the ROW sector accounted for 13,3 per cent of the total financing obtained by South African banks, compared with 11,7 per cent over the same period in 2014.
Foreign assets Aggregate cross-border claims of banks resident in South Africa expanded significantly during the past year, amounting to R750 billion at the end of the fourth quarter of 2015, an increase of R197 billion for the year as a whole. This was substantially higher than the increase of R51 billion recorded for 2014. The latest quarterly increase of R76 billion lifted the annual growth rate of claims to 35,6 per cent, compared with 25,7 per cent in the previous quarter.

51
Table 2: Total international assets – Top 5 individual counterparty countries as well as Africa (excluding South Africa) R billions
Country R billion Per cent of total foreign assets
United Kingdom 310,5 41,4
United States 73,7 9,8
Isle of Man 63,3 8,4
Nigeria 31,3 4,2
France 30,0 4,0
Developing Africa and Middle East 119,9 16,0
The expansion in cross-border claims during the fourth quarter of 2015 was primarily driven by an increase in the foreign assets of the branches of foreign banks, which was further supported by an increase in foreign assets of domestic banks. Domestic banks continue to hold the largest share of South Africa’s external bank assets, accounting for 70 per cent of the total as at the end of December 2015. This was slightly lower than the 74 per cent recorded in September 2015.
The majority of the cross-border assets of South African registered banks are held vis-à-vis developed countries. In the fourth quarter of 2015, SA banks’ exposure to a single country continued to be dominated by the United Kingdom, with the United States of America, Isle of Man, and Nigeria also featuring in the top counterparty countries, as did exposure to the rest of Africa. France replaced Mauritius in the top 5 list of counterparty countries in the fourth quarter of 2015.
Within the three reported asset categories, growth in the fourth quarter of 2015 was predominantly driven by an increase in other assets. Other assets amounted to R236 billion at the end of December 2015, reflecting a quarterly increase of R67 billion. Growth in other assets mainly stemmed from the sharp depreciation of the rand against major currencies which resulted in significant valuation adjustments on derivative transactions. The level of total foreign deposits made and/or loans extended grew modestly from R448 to R454 billion in the fourth quarter of 2015, representing an increase of R6 billion. Holdings of debt securities amounted to R60 billion at the end of the fourth quarter, representing an increase of R3 billion over the same period.

52
Despite a gradual expansion in the non-resident assets of banks denominated in foreign currency, from R436 billion in December 2014 to R530 billion in December 2015, the contribution of foreign currency as a percentage of total assets declined from 79 per cent to 71 per cent over this period. The breakdown by currency shows that South African banks’ external assets continue to be mainly denominated in US dollars (56%), followed by the rand (29%) and the Euro (6%). The share of US dollar-denominated international assets declined from 60 per cent to 56 per cent over the past year, whilst that of the rand expanded from 23 per cent to 29 per cent.
The vast majority of SA banks’ international assets are held with foreign banks, with smaller exposures to non-resident non-bank financial and non-financial institutions. South African banks’ holdings of assets issued by foreign banks remained unchanged at 69 per cent of their total holdings of international assets in the fourth quarter of 2015.

53
Foreign liabilities
Partly due to the depreciation in the exchange value of the rand, the aggregate cross-border liabilities of South African banks recorded a significant increase of R155 billion from September to December 2015, bringing the outstanding amount of foreign liabilities to R655 billion at the end of the fourth quarter. As a result, the quarterly growth rate increased to 31,0 per cent, up from an increase of 7,9 per cent in the previous quarter.
Table 3: Total international liabilities – Top 5 individual counterparty countries as well as Africa (excluding South Africa) R billions
Country R billion Per cent of total foreign liabilities
United Kingdom 299,6 45,7
Isle of Man 62,8 9,6
United States 39,6 6,0
China 26,9 4,1
Germany 24,1 3,7
Developing Africa and Middle East 71,9 11,0
As was the case with international assets, the majority of the external liabilities of South African registered banks are also held vis-à-vis developed countries. In the fourth quarter of 2015, SA banks’ liabilities against a single country continued to be dominated by the United Kingdom, while the rest of the counterparty countries in the top 5 list remained unchanged from the previous quarter.

54
The strongest underlying components of the overall increase in international liabilities during the fourth quarter of 2015 were primarily other liabilities, as well as the deposits and loans received category. Other liabilities rose by R62 billion, mainly on account of an increase in the value of derivative instruments issued to the foreign sector, resulting from the depreciation of the exchange rate of the rand. The deposit and loan category expanded largely due to a combination of new syndicated, term and money-market loans entered into with non-resident banks and other financial counterparties, as well as an increase in inter-group deposits and other funding received from non-resident banks. The level of foreign loans and deposits (liabilities) increased from R345 billion to R394 billion in the fourth quarter of 2015, representing a quarterly increase of R49 billion. South African banks’ foreign liability exposure was dominated by the US dollar at 51 per cent, followed by the rand at 36 per cent, whilst exposure to the Euro amounted to 5 per cent of total liabilities. The foreign currency composition of South African resident banks’ external assets and liabilities is generally well matched, suggesting that banks aim to minimise their overall currency risk.
A notable rise in funding from foreign banks resulted in an increase in their contribution to total external liabilities from 77 per cent in the third quarter to 80 per cent in the fourth quarter of 2015. The sectoral breakdown of international liabilities indicates that South African banks’ continue to be predominantly funded by their foreign counterparts.
Outlook
During the period under review two macro-economic events were particularly relevant to the balance sheets of the South African banks. The first was the much anticipated increase in the federal funds rate by the US Federal Reserve in December 2015. This raised the funding costs of banks with significant exposure to dollar denominated debt. In the case of South African banks, this should however be limited due to the fact that their foreign currency-denominated debt levels - specifically debt denominated in US dollars - are relatively low. The second event was the developments in the rand exchange rate market which continued to experience a cycle of severe volatility during the period under review. Volatile exchange rate markets introduce added complexity to the business models followed by banks. Two specific categories of banks can be distinguished here - those banks that utilise their physical operations outside South Africa to grow lending and those that lend off their South African balance sheets. The larger South African banks with international linkages have different structures, business models and strategies with regards to their foreign currency denominated business suite. As a consequence, the effects of exchange-rate volatility impacted the balance sheets and income statements of banks in divergent ways. Some banks benefitted due to a stronger US dollar where their loan book outside South Africa is US dollar-denominated, while others experienced an element of earnings dilution resulting from a weaker rand. The uncertain exchange rate outlook over the short-term will continue to be a critical focus area for the domestic banks as they devise strategies to manage their foreign currency risk.

55
12.2 APPENDIX II: HIGH-LEVEL COMPARABILITY OUTLINE BETWEEN LBS AND MONETARY DATA
CL01 - Assets: Total Assets: All currencies, Rand Thousands
December, 2015
Institution BA900 (R'000) Item 194 Column
1
BA900 (R'000)
Item 194
Column 3
BA900 (R'000)
Item 245
Column 1
BA900 (R'000)
Item 245
Column 3
BA900 (R'000) Item
277 Column 1
BA900 (R'000)
Item 277 Column 3
Less: BA900 (R'000)
Item 258 Column 1
Less: BA900 (R'000)
Item 258
Column 3
BA900 Total BA941 (R'000) Item 1 Column 1
Difference (R'000) (BA941
less BA900)
Bank 1 11,823,532 36,418 39,031 0 827,899,072 98,627,038 12,843,648 0 925,581,443 925,581,443 0 Bank 2 18,732,639 0 0 0 57,885,311 0 586,571 0 76,031,379 75,781,173 -250,206 Bank 3 Bank 4 26,075 0 0 0 5,026,469 0 93,362 0 4,959,182 4,959,182 0 Bank 5 19,275 0 0 0 2,259,193 9,331 966 0 2,286,833 2,286,833 0 Bank 6 402,329 16,677 0 0 23,015,143 12,628,017 13,659 0 36,048,507 36,048,507 0 Bank 7 2,697 0 0 0 478,494 0 394 0 480,797 480,796 -1 Bank 8 23,246 0 0 0 1,338,464 253,303 1,039 0 1,613,974 1,613,977 3 Bank 9 9,628 0 0 0 5,408,404 608,806 2,056,211 0 3,970,627 3,970,627 0 Bank 10 0 0 0 0 8,910,815 5,588,101 6,802 0 14,492,114 14,492,114 0 Bank 11 953 0 0 0 399,761 0 1,572 0 399,142 399,142 0 Bank 12 4,669,613 0 0 0 61,970,135 0 1,254,252 0 65,385,496 65,385,495 -1 Bank 13 82,386 0 0 0 19,985,105 12,635,886 137,027 0 32,565,527 32,566,350 823 Bank 14 144,042 0 0 0 50,013,285 26,498,118 86,324 0 76,569,122 76,569,122 0 Bank 15 22,981 0 0 0 12,851,567 9,903,693 727 0 22,777,514 22,777,515 1 Bank 16 13,254,155 205,870 0 0 880,299,088 99,620,528 13,057,097 0 980,322,544 980,322,544 0

56
Institution BA900 (R'000) Item 194 Column
1
BA900 (R'000)
Item 194
Column 3
BA900 (R'000)
Item 245
Column 1
BA900 (R'000)
Item 245
Column 3
BA900 (R'000) Item
277 Column 1
BA900 (R'000)
Item 277 Column 3
Less: BA900 (R'000)
Item 258 Column 1
Less: BA900 (R'000)
Item 258
Column 3
BA900 Total BA941 (R'000) Item 1 Column 1
Difference (R'000) (BA941
less BA900)
Bank 17 28,746 0 0 0 11,265,333 0 11,464 0 11,282,615 11,278,968 -3,647 Bank 18 4,830 0 0 0 1,275,615 42,549 6,653 0 1,316,341 1,316,340 -1 Bank 19 14,531 0 0 0 4,384,221 28,751 17,237 0 4,410,266 4,410,266 0 Bank 20 0 0 0 0 250,000 0 0 0 250,000 250,000 0 Bank 21 1,185,215 0 0 0 311,417,009 65,628,802 343,574 0 377,887,452 377,887,450 -2 Bank 22 121,912 0 0 0 23,764,376 33,271,420 22,664 0 57,135,044 57,158,262 23,218 Bank 23 59,465 0 0 0 9,152,692 487,335 231,478 0 9,468,014 9,468,014 0 Bank 24 10,778,278 0 0 0 752,548,087 56,171,192 12,094,945 0 807,402,612 807,402,615 3 Bank 25 38,691 0 0 0 5,407,128 138,333 75,614 0 5,508,538 5,508,537 -1 Bank 26 0 0 0 0 10,094,918 1,630,875 11,421 0 11,714,372 11,714,371 -1 Bank 27 324,128 0 0 0 30,854,332 7,565,695 388,322 0 38,355,833 38,355,832 -1 Bank 28 19,410 0 0 0 3,438,484 3,556,532 3,581 0 7,010,845 7,010,845 0 Bank 29 13,580 0 0 0 38,134,282 11,671,537 10,096 0 49,809,303 49,809,304 1 Bank 30 136,652 0 0 0 2,263,204 246,966 83,852 0 2,562,970 2,646,822 83,852 Bank 31 17,514,323 16,613 0 0 911,241,190 302,286,923 28,123,298 0 1,202,935,751 1,203,267,980 332,229 Bank 32 324,055 0 0 0 4,690,884 0 116,836 0 4,898,103 4,898,103 0 Total LBS Banks 79,777,367 275,578 39,031 0 4,077,922,061 749,099,731 71,680,686 0 4,835,432,259 4,835,618,529 186,270

57
CL09 - Liabilities: Total liabilities: All currencies, Rand Thousands
December, 2015
Institution
BA900 (R'000) Item 95 Column
4
BA900 (R'000) Item 96
Column 1
BA900 (R'000) Item 194 Column 5
BA900 (R'000) Item 245 Column 5 BA900 Total
BA941 (R'000) Item 941 Column 1
Difference (R'000) (BA941
less BA900) Bank 1 869,270,227 57,255,883 11,859,950 39,031 938,425,091 938,425,091 0Bank 2 50,419,037 7,466,274 18,732,639 0 76,617,950 76,801,352 183,402Bank 3 Bank 4 4,441,113 585,356 26,075 0 5,052,544 5,052,544 0Bank 5 2,022,211 246,313 19,275 0 2,287,799 2,287,799 0Bank 6 31,464,510 4,178,651 419,006 0 36,062,167 36,062,166 -1Bank 7 199,128 279,366 2,697 0 481,191 481,190 -1Bank 8 1,289,468 302,299 23,246 0 1,615,013 1,615,013 0Bank 9 3,789,568 2,227,642 9,628 0 6,026,838 6,026,838 0Bank 10 13,862,348 636,568 0 0 14,498,916 14,498,916 0Bank 11 132,115 267,646 953 0 400,714 400,714 0Bank 12 48,913,724 13,056,412 4,669,613 0 66,639,749 66,639,747 -2Bank 13 31,003,608 1,617,383 82,386 0 32,703,377 32,703,380 3Bank 14 71,388,112 5,123,291 144,042 0 76,655,446 76,655,446 0Bank 15 21,321,901 1,433,355 22,981 0 22,778,237 22,778,237 0Bank 16 904,393,562 75,526,054 13,460,025 0 993,379,641 993,379,641 0Bank 17 10,429,788 835,546 28,746 0 11,294,080 11,290,432 -3,648Bank 18 1,208,701 109,463 4,830 0 1,322,994 1,322,994 0Bank 19 4,089,517 323,455 14,531 0 4,427,503 4,427,503 0Bank 20 0 250,000 0 0 250,000 250,000 0Bank 21 352,780,579 24,265,229 1,185,215 0 378,231,023 378,231,021 -2Bank 22 53,788,923 3,246,873 121,912 0 57,157,708 57,180,928 23,220Bank 23 7,601,482 2,038,545 59,465 0 9,699,492 9,699,492 0

58
Institution
BA900 (R'000) Item 95 Column
4
BA900 (R'000) Item 96
Column 1
BA900 (R'000) Item 194 Column 5
BA900 (R'000) Item 245 Column 5 BA900 Total
BA941 (R'000) Item 941 Column 1
Difference (R'000) (BA941
less BA900) Bank 25 4,658,759 886,703 38,691 0 5,584,153 5,584,154 1Bank 26 11,058,957 666,836 0 0 11,725,793 11,725,793 0Bank 27 34,731,129 3,688,896 324,128 0 38,744,153 38,744,155 2Bank 28 5,987,443 1,007,573 19,410 0 7,014,426 7,014,426 0Bank 29 45,886,507 3,919,312 13,580 0 49,819,399 49,819,401 2Bank 30 2,253,368 256,799 136,652 0 2,646,819 2,646,822 3Bank 31 1,127,327,864 86,200,249 17,530,936 0 1,231,059,049 1,231,610,272 551,223Bank 32 4,171,666 519,217 324,055 0 5,014,938 5,014,938 0Total LBS Banks 4,470,921,117 356,100,663 80,052,945 39,031 4,907,113,756 4,907,867,964 754,208
The monetary data is collected through the BA900 form and the LBS data through the BA94* series forms. The yellow highlighted cells indicate differences which should be followed-up with the reporting institutions.
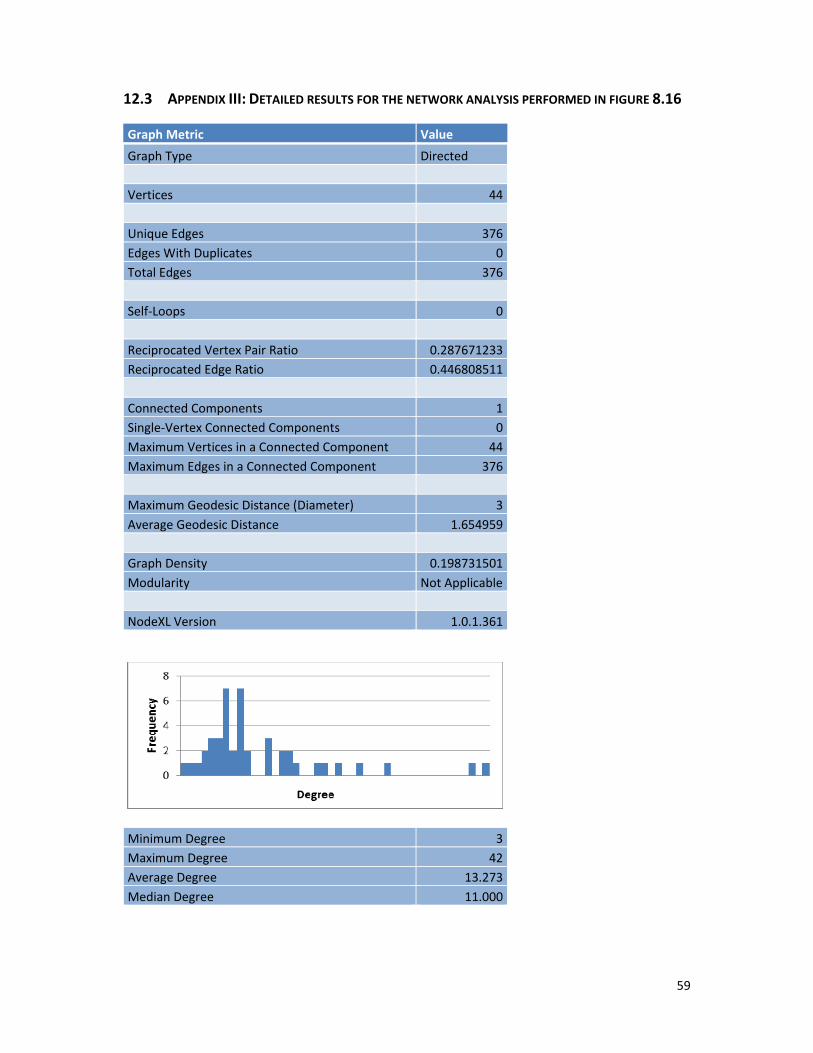
59
12.3 APPENDIX III: DETAILED RESULTS FOR THE NETWORK ANALYSIS PERFORMED IN FIGURE 8.16
Graph Metric Value Graph Type Directed Vertices 44 Unique Edges 376Edges With Duplicates 0Total Edges 376 Self-Loops 0 Reciprocated Vertex Pair Ratio 0.287671233Reciprocated Edge Ratio 0.446808511 Connected Components 1Single-Vertex Connected Components 0Maximum Vertices in a Connected Component 44Maximum Edges in a Connected Component 376 Maximum Geodesic Distance (Diameter) 3Average Geodesic Distance 1.654959 Graph Density 0.198731501Modularity Not Applicable NodeXL Version 1.0.1.361
Minimum Degree 3Maximum Degree 42Average Degree 13.273Median Degree 11.000

60
Minimum In-Degree 0Maximum In-Degree 42Average In-Degree 8.545Median In-Degree 4.000
Minimum Out-Degree 3Maximum Out-Degree 14Average Out-Degree 8.545Median Out-Degree 9.000
Minimum Betweenness Centrality 0.133Maximum Betweenness Centrality 389.937Average Betweenness Centrality 29.818Median Betweenness Centrality 4.472

61
Minimum Closeness Centrality 0.012Maximum Closeness Centrality 0.023Average Closeness Centrality 0.014Median Closeness Centrality 0.013
Minimum Eigenvector Centrality 0.005Maximum Eigenvector Centrality 0.055Average Eigenvector Centrality 0.023Median Eigenvector Centrality 0.020
Minimum PageRank 0.356Maximum PageRank 2.962Average PageRank 1.000Median PageRank 0.832

62
Minimum Clustering Coefficient 0.185Maximum Clustering Coefficient 0.733Average Clustering Coefficient 0.476Median Clustering Coefficient 0.475

63
B. Reporting requirements for the locational banking statistics
B.1. General
The locational banking statistics (LBS) were designed to provide comprehensive and consistent quarterly data on international banking business conducted in the countries and other financial centres making up the LBS reporting area. The basic organizing principle underlying the reporting requirements is the residence of the reporting banking office. This conforms to balance of payments and external debt methodology. These offices report their own (unconsolidated) international banking business, including international transactions with any of their own affiliates (branches, subsidiaries or joint ventures).
International banking business comprises claims and liabilities vis-à-vis non-residents in any currency plus claims and liabilities vis-à-vis residents of the reporting country in foreign currencies. From the Q2 2012 reporting quarter, banks’ local currency claims and liabilities vis-à-vis residents of the reporting country are collected as well. Thus, the LBS cover all financial asset and liability positions of reporting banks located in the LBS reporting area.
The asset and liability positions of banking offices located in the LBS reporting countries are reported to the BIS with a full breakdown by either the residence of the counterparty (locational banking statistics by residence (LBS/R)) or the nationality of the reporting institution (locational banking statistics by nationality (LBS/N)). Conceptually, the LBS/N are a regrouping of the LBS/R according to the nationality of the controlling parent institution. From the Q2 2012 reporting quarter, the LBS/N incorporate elements of the LBS/R in that a (limited) breakdown by counterparty country is requested for several key bank nationalities (see Section B.4.2).
The reporting area and institutions for both the LBS/R and LBS/N are described in Section B.2 below. Sections B.3 and B.4 describe the specific reporting requirements for the LBS/R and the LBS/N, respectively. Other reporting conventions which apply to both the LBS and CBS are discussed in Section D. A list of frequently asked questions and examples of the reporting of specific transactions are provided in Section E.
B.2. Reporting area and institutions
B.2.1. Reporting area
To adequately cover all international banking activity, data should ideally be collected from internationally active banks in each and every country. However, data reported by a smaller number of countries capture at least one side of most international banking relationships, and thus provide some coverage of cross-border banking outside the LBS reporting area. Countries are asked to contribute to the LBS when their international banking business becomes substantial. The countries currently making up the LBS reporting area are listed in Table A2.
13. ANNEXURES
13.1 ANNEXURE I: REPORTING REQUIREMENTS FOR THE LBS AS PROVIDED BY THE BIS

64
B.2.2. Reporting institutions
Reporting institutions cover mainly internationally active banks.5 In particular, they cover institutions located in each reporting country whose business it is to receive deposits (and/or close substitutes for deposits) and to grant credits or invest in securities on their own account (“banks” or “banking offices” in these Guidelines).6 Thus, the reporting institutions include not only commercial banks but also savings banks, savings and loan associations, credit unions or cooperative credit banks, building societies, and post office giro institutions, other government-controlled savings banks and other financial institutions if they take deposits or issue close substitutes for deposits.7
B.3. The locational banking statistics by residence
The locational banking statistics by residence (LBS/R) provide quarterly information on all balance sheet positions (and some off-balance sheet positions in the area of trustee business) which represent financial claims or liabilities. As summarized in Table B1, banks’ positions should be fully broken down by instrument, counterparty country, counterparty sector, and currency. In addition, positions should be reported separately for each bank type.
B.3.1. Instrument breakdown
Banks’ assets, or claims, should be broken down into: (a) “loans and deposits”, which comprise interbank deposits and loans and advances (to banks or non-banks); (b) “holdings of securities”; and (c) “other claims”. Similarly, banks’ liabilities should be broken down into:
(a) “loans and deposits”, which comprise interbank loans received and deposits (from banks or non-banks); (b) “own issues of debt securities”; and (c) “other liabilities”. Arrears and accrued interest as well as principal in arrears should be included in the claims and liabilities under the respective instruments, whenever possible (see Section D.3).
B.3.1.1. Loans and deposits
Loans comprise those financial claims which are created through the lending of funds by a creditor (lender) to a debtor (borrower) and which are not represented by negotiable securities.8
On the claims side, banks should report as “loans and deposits” all loans granted, working capital to branches/subsidiaries and deposits with other banks, including those with their own affiliates (inter-office positions).9 On the liabilities side, “loans and deposits” should comprise
5 At present, no precise criteria are used to determine the set of internationally active banks. It is expected that all banking offices with substantial international business, i.e. cross-border positions and/or local positions in non-domestic currencies, would be included in the reporting population. In addition, all foreign-owned banking offices in a reporting country are also expected to be included in the reporting population, even if these banking offices do not have substantial international positions. This will help to ensure that those banking offices that are part of a consolidated group in the CBS are also covered in the LBS. 6 This definition of “banks” conforms to other widely used definitions, such as “Deposit-taking corporations, except the central bank” in the System of National Accounts (SNA) and in the Balance of Payments Manual (BPM6); “other (than central bank) depository institutions” in the IMF money and banking statistics; and “monetary financial institutions (other than central banks)” as defined by the ECB and used in the European System of Accounts (ESA 1995).

65
all claims on the reporting bank that reflect evidence of deposit, and borrowing (loans) from others. This includes borrowing from the bank’s own affiliates, head office or controlling parent institution, and working capital received from the head office or controlling parent institution (see Section B.3.4).
Several additional financial instruments should also be classified as “loans and deposits”. These include: repurchase transactions (repos) involving the sale of assets (e.g. securities or gold) with a commitment to repurchase the same or similar claims; financial leases; promissory notes; non-negotiable debt securities (e.g. non-negotiable CDs); endorsement liabilities arising from bills rediscounted abroad and subordinated loans (including subordinated non-negotiable debt securities); loans received and granted on a trust basis, or deposits received and placed on a trust basis (see below); and trade-related credits (see below).
7 Reporting institutions should not include money market funds. If money market funds are included in the reporting population, they should treat liabilities on account of shares and units as close substitutes for deposits and thus classify them as deposits. This is consistent with their treatment in monetary and financial statistics but not with that in BPM6. 8 Loans which have become negotiable de facto should be classified under debt securities (provided there is evidence of trading on a secondary market). 9 Overnight loans, repurchase agreements and other lending or deposits with agreed maturity between the controlling parent institution and/or head office vis-à-vis affiliates should be reported as instrument “loans and deposits”. Working capital received from the controlling parent institution or head office is not considered permanent capital and thus should be included in “loans and deposits”, and not in “other instruments” (BPM6: 6.28).

66
Borrowing and lending of securities and gold without cash collateral should not be reported as on-balance sheet banking business (see question 13 in Section E.1).
Banks’ holdings of notes and coins that are in circulation and commonly used to make payments should be recorded as claims in the form of loans and deposits (see question 3 in Section E.1).
Trustee business
It is recommended that trustee business be reported – be it on or off balance sheet – in the books of the reporting banks. The goal is consistency and completeness of reporting of banks’ positions, both directly and indirectly via trustee business. Funds received by banks on a trust basis should be classified as “loans and deposits” liabilities. Similarly, funds lent or deposited on a trust basis in the reporting bank’s own name, but on behalf of third parties, should be classified as “loans and deposits” claims. Securities issued by banks in their own name but on behalf of third parties, or funds invested on a trust basis in securities and held in the banks’ own name but on behalf of third parties, should be classified as “debt securities” claims and liabilities (or “other” claims and liabilities, as the case may be).
Foreign and domestic trade-related credit
Trade-related credits mainly take the form of buyer’s credit which is granted directly by a reporting bank to a foreign importer on the basis of a letter of credit issued by the importer’s bank. In contrast, a supplier’s credit is, in most cases, a contract by which an exporter is extending a credit to the buyer on the basis of a trade bill drawn on the latter. It may subsequently be acquired by the reporting bank.
These credits should be included in the LBS as a cross-border or local claim, depending on whether the residence of the drawee (who is the final debtor) or that of the presenter of the bill (who has guaranteed payment by endorsing the bill) is used as the criterion for geographical allocation. For the purposes of the locational banking statistics, it is recommended that suppliers’ credits be allocated according to the residence of the drawee of the relevant trade bills, as the drawee is the final recipient of the credit extended.
Banks may acquire external trade bills “à forfait” and “en pension”. An “à forfait” purchase is an outright purchase which absolves the seller/presenter of the bills from any obligation should the drawee fail to honour the bill when it matures. When the drawee is a non-resident, such bills should similarly be considered to be external claims, irrespective of the residence of the presenter.
An “en pension” acquisition involves a bank purchasing a foreign trade bill under a sale and repurchase agreement with the domestic exporter whereby the bank must or may return the bill to the exporter on, or prior to, the maturity date. If the return of the bill is optional, the bill is recorded in the balance sheet of the purchaser as a claim on the drawee. If the bill must be returned, the instrument remains on the balance sheet of the seller and the transaction can be regarded as an advance to the domestic exporter which should be included in the locational statistics as a domestic asset.

67
When a bank refinances an exporter’s open account without any collateral or trade bill, the facility extended cannot be identified as a foreign trade-related credit. The facility should be reported as a local claim if the exporting company is a resident or as a cross-border claim if the company is a non-resident.
B.3.1.2. Debt securities Holdings of debt securities
Banks’ holdings of debt securities comprise claims in all negotiable debt instruments, including negotiable CDs but excluding equity securities, investment fund units and warrants.10 Banks’ holdings of debt securities should include those held in their own name and those held on behalf of third parties as part of their trustee business (see Section B.3.1.1). It is recommended that holdings of debt securities are allocated to a counterparty country according to the residence (as opposed to nationality) of the issuer.
Debt securities held on a purely custodial basis for customers (that is, positions not in the banks’ own name), and debt securities acquired in the context of securities lending transactions without cash collateral, should not be included in holdings of debt securities. It is recognized that the borrowing of securities that are subsequently lent or sold to third parties (e.g. “short sales”) may result in a negative stock of holdings of securities.11
Own issues of debt securities
Banks’ own issues of debt securities comprise liabilities in all negotiable debt securities, including negotiable CDs, subordinated issues and issues in their own name but on behalf of third parties. From the Q4 2013 reporting period, separate data covering own issues of debt securities with a remaining maturity of up to and including 12 months should be reported as an “of which” item under debt securities liabilities.
It is often difficult to determine the current holder of a negotiable instrument. Thus, at a minimum, banks should report own issues of debt securities vis-à-vis the categories “unallocated by sector” and “unallocated by country”, with a currency breakdown. If the sector and residence of the current holders of own issues of debt securities are known to the reporting bank, then debt securities liabilities should be allocated to the appropriate counterparty sector and country.
B.3.1.3. Other instruments
Banks’ residual claims (i.e. those not included under “loans and deposits” and “debt securities”) mainly comprise equity securities (including mutual and investment fund units and holdings of shares in a bank’s own name but on behalf of third parties12), participations, derivatives instruments with positive market value and any other residual on-balance sheet financial claims. Banks’ residual liabilities comprise mainly equity issuance, derivatives instruments with negative market value and any other residual on-balance sheet liabilities.
10 Negotiable securities are those where legal ownership is readily capable of being transferred from one entity to another by delivery or endorsement (BPM6, paragraph 5.15). The instrument need not be traded on an exchange to be negotiable but it should be designed to be traded. 11 Under BPM6, short selling of debt securities is treated as a negative asset and thus can result in the reporting of negative stock amounts when multiple data dimensions are crossed. See question 8 in Section E.1.

68
Claims and liabilities arising from derivatives contracts, which in the past were mostly recorded off balance sheet, are increasingly reflected on the balance sheet as a result of the implementation of new national and international accounting standards. For the LBS, it is recommended that derivatives recorded on the balance sheet be included under “other instruments” for claims and liabilities, as appropriate (for more on the valuation of derivatives instruments, see Section D).
Retained earnings (positive amount) should be reported as other liabilities if they are reported by the banking subsidiary of a foreign bank in the reporting country and should be allocated to the country where the controlling parent institution is located. Negative retained earnings should be treated as claims vis-à-vis the controlling parent institution.
B.3.2. Bank type breakdown
From the Q4 2013 reporting period, the LBS/R should by disaggregated by four types of institutions depending on the nationality of the controlling parent institution. The bank type breakdown does not require additional information from reporting institutions; reporting countries need only aggregate reported data by bank type. The four types of institutions are summarized in Table B2.
B.3.3. Currency breakdown
Reporting countries are requested to provide a breakdown of positions into local (domestic) currency and individual foreign currencies. The minimum recommended currency breakdown covers the local (domestic) currency of the reporting country, US dollar, euro, yen, Swiss franc and pound sterling, plus a residual category. Reporting countries are encouraged to report a complete currency breakdown.13
12 “Off-balance sheet and non-trustee” related shares/funds that are held purely on a custodial basis should not be reported. 13 The currency dimension is useful in assessing banks’ use of individual currencies and their associated funding risks, and is used by the BIS to calculate quarterly changes in stocks net of exchange rate effects.

69
B.3.4. Counterparty-sector breakdown
From the Q4 2013 reporting period, the LBS will include a more detailed breakdown by sector of the counterparty. The members in the recommended breakdown are defined in Table B3, and are summarized below, with encouraged items in italics:
1. All sectors (= 2 + 3 + 4 + 5)
2. Banks of which:
a. Related offices (inter-office)
b. Central banks
3. Non-bank financial institutions
4. Non-financial sectors (= 4a + 4b + 4c)
a. General government
b. Non-financial corporations
c. Households including NPISHs
5. Unallocated by sector
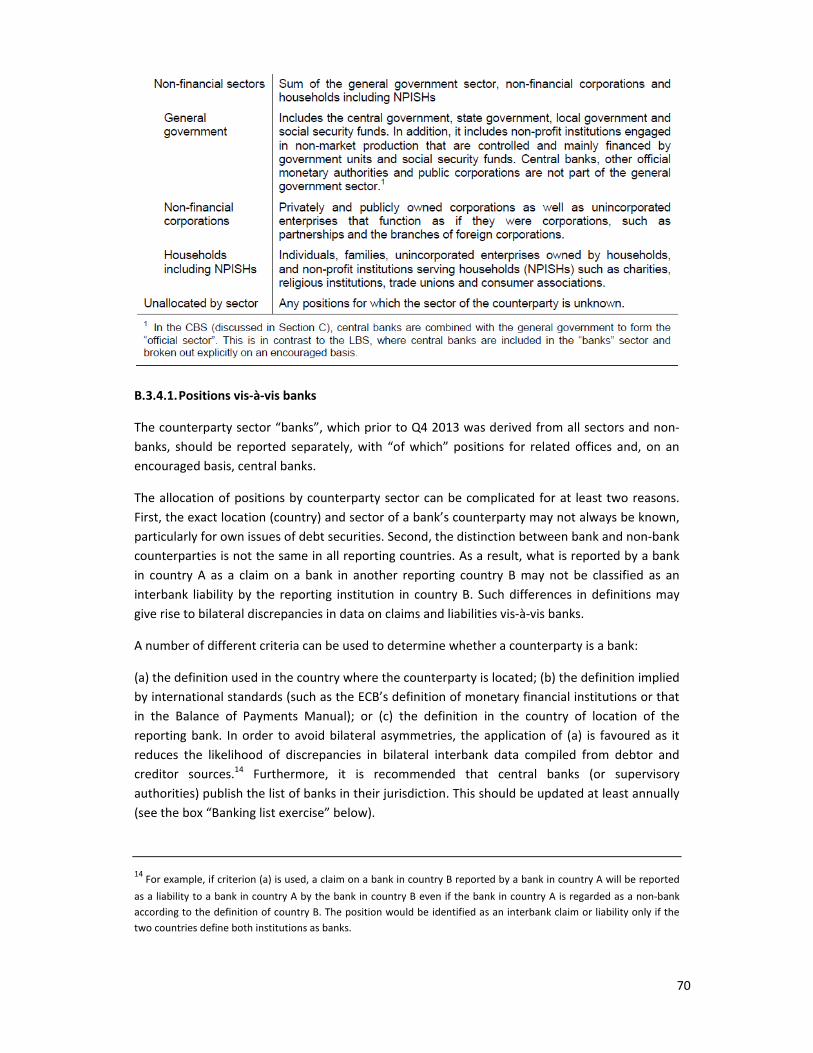
70
B.3.4.1. Positions vis-à-vis banks
The counterparty sector “banks”, which prior to Q4 2013 was derived from all sectors and non-banks, should be reported separately, with “of which” positions for related offices and, on an encouraged basis, central banks.
The allocation of positions by counterparty sector can be complicated for at least two reasons. First, the exact location (country) and sector of a bank’s counterparty may not always be known, particularly for own issues of debt securities. Second, the distinction between bank and non-bank counterparties is not the same in all reporting countries. As a result, what is reported by a bank in country A as a claim on a bank in another reporting country B may not be classified as an interbank liability by the reporting institution in country B. Such differences in definitions may give rise to bilateral discrepancies in data on claims and liabilities vis-à-vis banks.
A number of different criteria can be used to determine whether a counterparty is a bank:
(a) the definition used in the country where the counterparty is located; (b) the definition implied by international standards (such as the ECB’s definition of monetary financial institutions or that in the Balance of Payments Manual); or (c) the definition in the country of location of the reporting bank. In order to avoid bilateral asymmetries, the application of (a) is favoured as it reduces the likelihood of discrepancies in bilateral interbank data compiled from debtor and creditor sources.14 Furthermore, it is recommended that central banks (or supervisory authorities) publish the list of banks in their jurisdiction. This should be updated at least annually (see the box “Banking list exercise” below).
14 For example, if criterion (a) is used, a claim on a bank in country B reported by a bank in country A will be reported as a liability to a bank in country A by the bank in country B even if the bank in country A is regarded as a non-bank according to the definition of country B. The position would be identified as an interbank claim or liability only if the two countries define both institutions as banks.
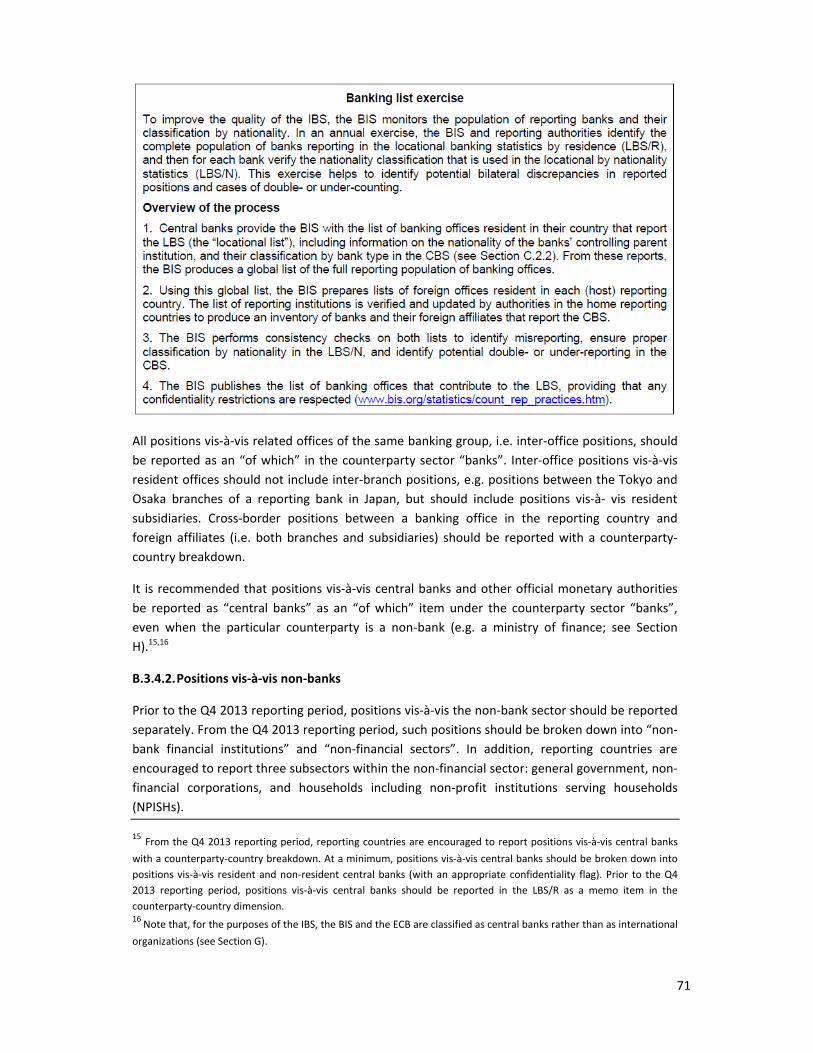
71
All positions vis-à-vis related offices of the same banking group, i.e. inter-office positions, should be reported as an “of which” in the counterparty sector “banks”. Inter-office positions vis-à-vis resident offices should not include inter-branch positions, e.g. positions between the Tokyo and Osaka branches of a reporting bank in Japan, but should include positions vis-à- vis resident subsidiaries. Cross-border positions between a banking office in the reporting country and foreign affiliates (i.e. both branches and subsidiaries) should be reported with a counterparty-country breakdown.
It is recommended that positions vis-à-vis central banks and other official monetary authorities be reported as “central banks” as an “of which” item under the counterparty sector “banks”, even when the particular counterparty is a non-bank (e.g. a ministry of finance; see Section H).15,16
B.3.4.2. Positions vis-à-vis non-banks
Prior to the Q4 2013 reporting period, positions vis-à-vis the non-bank sector should be reported separately. From the Q4 2013 reporting period, such positions should be broken down into “non-bank financial institutions” and “non-financial sectors”. In addition, reporting countries are encouraged to report three subsectors within the non-financial sector: general government, non-financial corporations, and households including non-profit institutions serving households (NPISHs).
15 From the Q4 2013 reporting period, reporting countries are encouraged to report positions vis-à-vis central banks with a counterparty-country breakdown. At a minimum, positions vis-à-vis central banks should be broken down into positions vis-à-vis resident and non-resident central banks (with an appropriate confidentiality flag). Prior to the Q4 2013 reporting period, positions vis-à-vis central banks should be reported in the LBS/R as a memo item in the counterparty-country dimension. 16 Note that, for the purposes of the IBS, the BIS and the ECB are classified as central banks rather than as international organizations (see Section G).
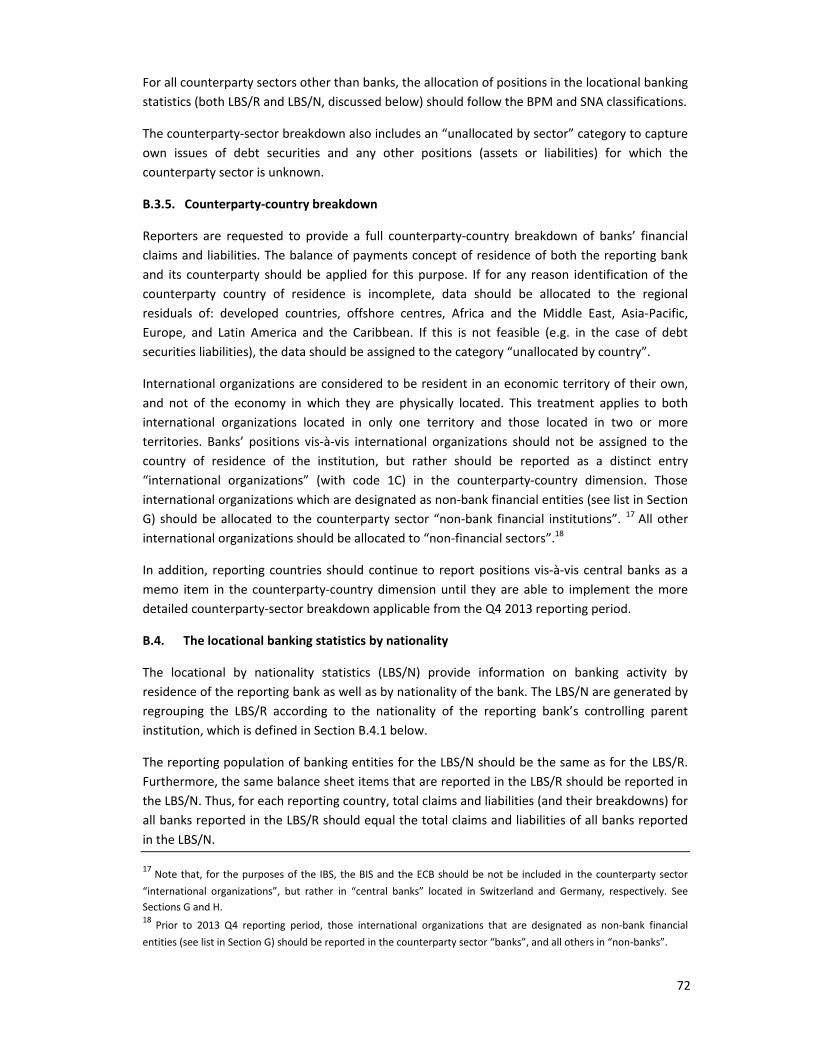
72
For all counterparty sectors other than banks, the allocation of positions in the locational banking statistics (both LBS/R and LBS/N, discussed below) should follow the BPM and SNA classifications.
The counterparty-sector breakdown also includes an “unallocated by sector” category to capture own issues of debt securities and any other positions (assets or liabilities) for which the counterparty sector is unknown.
B.3.5. Counterparty-country breakdown
Reporters are requested to provide a full counterparty-country breakdown of banks’ financial claims and liabilities. The balance of payments concept of residence of both the reporting bank and its counterparty should be applied for this purpose. If for any reason identification of the counterparty country of residence is incomplete, data should be allocated to the regional residuals of: developed countries, offshore centres, Africa and the Middle East, Asia-Pacific, Europe, and Latin America and the Caribbean. If this is not feasible (e.g. in the case of debt securities liabilities), the data should be assigned to the category “unallocated by country”.
International organizations are considered to be resident in an economic territory of their own, and not of the economy in which they are physically located. This treatment applies to both international organizations located in only one territory and those located in two or more territories. Banks’ positions vis-à-vis international organizations should not be assigned to the country of residence of the institution, but rather should be reported as a distinct entry “international organizations” (with code 1C) in the counterparty-country dimension. Those international organizations which are designated as non-bank financial entities (see list in Section G) should be allocated to the counterparty sector “non-bank financial institutions”. 17 All other international organizations should be allocated to “non-financial sectors”.18
In addition, reporting countries should continue to report positions vis-à-vis central banks as a memo item in the counterparty-country dimension until they are able to implement the more detailed counterparty-sector breakdown applicable from the Q4 2013 reporting period.
B.4. The locational banking statistics by nationality
The locational by nationality statistics (LBS/N) provide information on banking activity by residence of the reporting bank as well as by nationality of the bank. The LBS/N are generated by regrouping the LBS/R according to the nationality of the reporting bank’s controlling parent institution, which is defined in Section B.4.1 below.
The reporting population of banking entities for the LBS/N should be the same as for the LBS/R. Furthermore, the same balance sheet items that are reported in the LBS/R should be reported in the LBS/N. Thus, for each reporting country, total claims and liabilities (and their breakdowns) for all banks reported in the LBS/R should equal the total claims and liabilities of all banks reported in the LBS/N.
17 Note that, for the purposes of the IBS, the BIS and the ECB should be not be included in the counterparty sector “international organizations”, but rather in “central banks” located in Switzerland and Germany, respectively. See Sections G and H. 18 Prior to 2013 Q4 reporting period, those international organizations that are designated as non-bank financial entities (see list in Section G) should be reported in the counterparty sector “banks”, and all others in “non-banks”.

73
The data reported in the LBS/N should be a full crossing of the following dimensions:
(a) bank nationality, (b) currency and (c) counterparty sector. In addition, reporting authorities should provide a counterparty-country breakdown for a minimum set of bank nationalities. While no instrument breakdown for claims is requested, own issues of debt securities should be reported separately.
B.4.1. Bank nationality breakdown
Classifying banks according to their nationality is not a simple matter because it depends on the identification of a single controlling parent institution. While local branches of foreign banks always have an identifiable controlling parent located abroad, the treatment of other affiliates of foreign banks may at times be ambiguous. Subsidiaries are invariably incorporated under the laws of the host country, may be listed separately from their parent institution, and in principle (although not necessarily in practice) are fully autonomous. In some cases, notably consortium banks, there may be no clearly identifiable controlling parent.
For the purpose of identifying the controlling parent in the international banking statistics, the nationality of a reporting bank may be defined as the country where the bank’s group-level supervisor (or “home” supervisor) is located, regardless of whether the group itself is a banking or non-banking entity.19 What is relevant for the identification of the controlling parent is the highest level entity over which consolidated supervision is exercised by prudential authorities. The controlling parent institution may thus be the ultimate parent, or may be the head of a financial group that is a subset of a diversified conglomerate.20 Where control is unclear, a controlling interest may be assumed to exist if participation exceeds 50% of the subscribed capital of a bank. Complicated cases can be resolved by discussions among central banks, facilitated by the BIS (see the box “Banking list exercise”).
Banking entities located in each of the reporting (host) countries should be classified by nationality of the controlling parent institution according to the following rules:
• Reporting countries. Each BIS reporting country should be listed as a separate nationality, together with a residual item “unallocated BIS reporting countries”.
• Non-reporting countries. Banks with a controlling parent institution located in countries outside the reporting area should be grouped into the categories “non-reporting developed countries”, “non-reporting offshore centres”, “non-reporting Europe”, “non-reporting Latin America and Caribbean area”, “non-reporting Africa and Middle East” and “non-reporting Asia and Pacific”.
• Special cases. Two additional groupings have been defined for special cases, namely “consortium banks” and “unallocated non-BIS reporting countries”.
19 The group-level supervisor is responsible for all areas of group-wide supervision not covered by sectoral supervision (i.e. insurance, banking or securities supervision). The group-level supervisor is also responsible for coordination among the sectoral supervisors of a financial group, and typically carries out supervision of the largest part of the group. The details of the process for determining the group-level supervisor is likely to be jurisdiction specific. See Joint Forum, Principles for the supervision of financial conglomerates: final report, BIS, September 2012. Available at: www.bis.org/publ/joint29.htm.

74
The “unallocated BIS reporting countries” and “unallocated non-BIS reporting countries” groupings are used to cope with confidentiality restrictions arising in individual reporting countries. Data for “consortium banks” are requested separately because these institutions cannot generally be classified as having a well-defined nationality. B.4.2. Counterparty-country breakdown A granular counterparty-country breakdown for the claims and liabilities of the major bank nationalities operating in the reporting country is requested in the LBS/N. From the Q2 2012 reporting period, a counterparty-country breakdown should be reported for a minimum of 16 bank nationalities and preferably for all bank nationalities hosted in the reporting country.21 The minimum 16 nationalities that should be reported comprise: • banks with the nationality of the reporting country; • an agreed set of 12 globally important bank nationalities, specifically Belgium, Canada, France, Germany, Italy, Japan, the Netherlands, Spain, Sweden, Switzerland, the United
Kingdom and the United States; and • the next three largest bank nationalities in the reporting country, based on the size of total
claims and liabilities. For all other bank nationalities, claims and liabilities should, at a minimum, be separated into those vis-à-vis residents of the reporting country and non-residents. Positions that cannot be allocated by residence (e.g. debt securities liabilities) should be reported under “unallocated by country”. For each bank nationality, reporting authorities can choose to report a full counterparty- country breakdown covering 200+ territories. The requested counterparty-country breakdown comprises 76 countries, consisting of the following: • all countries reporting in the LBS, of which there are currently 44 (Table A2); • non-reporting European Union member countries (Bulgaria, the Czech Republic, Estonia,
Hungary, Latvia, Lithuania, Malta, Poland, Romania, Slovakia and Slovenia); • other regionally important countries (Argentina, China, Iran, Israel, Kuwait, Nigeria, Qatar,
Peru, the Philippines, Russia, Saudi Arabia, Thailand and the United Arab Emirates); • six other regional groupings (other developed, other offshore, other Europe, other Latin
America and Caribbean, other Africa and Middle East, other Asia and Pacific); and • one position for international organizations and one for “unallocated by country of
residence”. 20 The head is the entity that controls or exerts dominant influence over the financial group. For a bank that is part of a wider corporate conglomerate, the home country from a prudential perspective could differ from the country where the ultimate parent is located. For the purpose of the international banking statistics, the terms home country and parent country are used synonymously. 21 The list of bank nationalities for which a counterparty-country breakdown is requested will be reviewed every few years. Up to Q2 2012, the counterparty-country breakdown was limited to residents of the reporting (host) country and a total for all non-resident counterparties.

75
B.4.3. Currency breakdown All reporting countries are asked to provide the same currency breakdown as in the LBS/R. That is, the minimum recommended currency breakdown of positions covers the local (domestic) currency of the reporting country, US dollar, euro, yen, Swiss franc and pound sterling, plus a residual category. Reporting countries are encouraged to report a complete currency breakdown if possible. Prior to the Q2 2012 reporting period, Swiss franc- and sterling-denominated positions were not reported separately. B.4.4. Counterparty-sector breakdown Prior to the Q4 2013 reporting period, the counterparty breakdown was limited to banks, with “of which” items for related offices and central banks. From the Q4 2013 reporting period, reporting countries should provide the same counterparty-sector breakdown of financial claims and liabilities as reported in the LBS/R. Definitions and coverage of counterparty sectors are provided in Section B.3.4. B.4.5. Instrument breakdown In contrast to the LBS/R, the LBS/N do not contain a full breakdown of positions by instrument type. Prior to the Q4 2013 reporting period, LBS/N contained an instrument breakdown only for debt securities liabilities. From the Q4 2013 reporting period, banks are also asked to report a breakdown by remaining maturity “up to and including 12 months” for their debt securities liabilities. This should be crossed with bank nationality and currency, but without the counterparty-country or counterparty-sector breakdowns. That is, own issues of debt securities should be reported for each currency in the “unallocated by sector” and “unallocated by country” buckets.