exploring the urban heat island intensity of dutch cities
TRANSCRIPT

Alterra is part of the international expertise organisation Wageningen UR (University & Research centre). Our mission is ‘To explore the potential of nature to improve the quality of life’. Within Wageningen UR, nine research institutes – both specialised and applied – have joined forces with Wageningen University and Van Hall Larenstein University of Applied Sciences to help answer the most important questions in the domain of healthy food and living environment. With approximately 40 locations (in the Netherlands, Brazil and China), 6,500 members of staff and 10,000 students, Wageningen UR is one of the leading organisations in its domain worldwide. The integral approach to problems and the cooperation between the exact sciences and the technological and social disciplines are at the heart of the Wageningen Approach.
Alterra is the research institute for our green living environment. We offer a combination of practical and scientific research in a multitude of disciplines related to the green world around us and the sustainable use of our living environment, such as flora and fauna, soil, water, the environment, geo-information and remote sensing, landscape and spatial planning, man and society.
More information: www.alterra.wur.nl/uk L.W.A. van Hove, G.J. Steeneveld, C.M.J. Jacobs, B.G. Heusinkveld, J.A. Elbers, E.J. Moors and A.A.M. Holtslag
Alterra report 2170
ISSN 1566-7197
Assessment based on a literature review, recent meteorological observationsand datasets provided by hobby meteorologists
Exploring the Urban Heat Island Intensity of Dutch cities


Exploring the Urban Heat Island Intensity
of Dutch cities

The research was part of the project 'Region specific climate information Haaglanden and Rotterdam region'
(HSHL05/HSRR04/HSRR05) funded by the first phase of the Knowledge for Climate Program, Hoogheemraadschap van
Delfland, the Province South Holland, and the municipality of Rotterdam respectively. It is also part of the strategic research
program KBIV 'Sustainable spatial development of ecosystems, landscapes, seas and regions' which is funded by the Dutch
Ministry of Economic Affairs, Agriculture and Innovation, and carried out by Wageningen University Research centre.

Exploring the Urban Heat Island Intensity of Dutch cities
Assessment based on a literature review, recent meteorological observations
and datasets provided by hobby meteorologists
L.W.A. van Hove1,2, G.J. Steeneveld1, C.M.J. Jacobs3, B.G. Heusinkveld1, J.A. Elbers3, E.J. Moors3 and A.A.M. Holtslag1
1 Wageningen University, Meteorology and Air Quality 2 Wageningen University, Earth System Science 3 Wageningen UR, Alterra, Climate Change
Combined Wageningen University and Alterra report
Alterra report 2170 Alterra, part of Wageningen UR Wageningen, 2011

Abstract Van Hove, L.W.A., G.J. Steeneveld, C.M.J. Jacobs, B.G. Heusinkveld, J.A. Elbers, E.J. Moors and A.A.M. Holtslag, 2011. Exploring the Urban Heat Island Intensity of Dutch cities; Assessment based on a literature review, recent meteorological observations and datasets provided by hobby meteorologists. Wageningen, Alterra, Alterra report 2170. 60 pp.; 11 fig.; 13 tab.; 120 ref. In the present study, an up-to-date assessment of the current Urbana Heat Island (UHI)-intensity in urban areas in the Netherlands has been made. The underlying question is whether or not thermal comfort will be a critical issue considering urbanization and climate change in the next decades. This assessment is based on results from meteorological observations reported in the literature with particular focus on assessed relationships between maximum nocturnal UHI intensity (UHImax) and city features, such as city size and urban configuration and structure. Also results from recent meteorological observations in the urban canopy in Rotterdam and Arnhem have been used. Furthermore, historical datasets provided by hobby meteorologists have been analyzed to obtain a more nationwide coverage. All observational evidence available point to the existence of a considerable UHImax in densely built areas in the Netherlands under favorable meteorological conditions, i.e. under calm and clear (cloudless) conditions, with 95 percentile values ranging from 3 to 10 K. The assessed UHImax values for Dutch urban areas, are of the same order of magnitude as those reported for other cities in Europe. No clear effect of city size, defined as the logarithmic value of the number of inhabitants, on UHI intensity could be found suggesting that not only large settlements, but also smaller ones may show significant UHI-effects. Our results indicate that considering future developments in climate and urbanization, thermal comfort and heat stress will likely become a critical issue in many urban areas in the Netherlands. Keywords: urban climate, urban heat island (UHI, urban configuration and typology, urban geometry, urban green, urban surface water, anthropogenic heat, radiative and thermal properties urban materials
Photo cover: Bram van Kesteren, MAQ
ISSN 1566-7197 The pdf file is free of charge and can be downloaded via the website www.alterra.wur.nl (go to Alterra reports). Alterra does not deliver printed versions of the Alterra reports. Printed versions can be ordered via the external distributor. For ordering have a look at www.rapportbestellen.nl. © 2011 Alterra (an institute under the auspices of the Stichting Dienst Landbouwkundig Onderzoek) P.O. Box 47; 6700 AA Wageningen; The Netherlands, [email protected]
– Acquisition, duplication and transmission of this publication is permitted with clear acknowledgement of the source.
– Acquisition, duplication and transmission is not permitted for commercial purposes and/or monetary gain.
– Acquisition, duplication and transmission is not permitted of any parts of this publication for which the copyrights clearly rest
with other parties and/or are reserved. Alterra assumes no liability for any losses resulting from the use of the research results or recommendations in this report. Alterra report 2170 Wageningen, April 2011

Contents
Executive Summary 7
1 Introduction 11 1.1 Background 11 1.2 Objectives and research questions 11 1.3 Outline of the report 12
2 Some basic notions of Urban Heat Islands 13 2.1 Urban surface energy balance 13 2.2 Surface and atmospheric urban heat islands 13 2.3 Urban scales 14 2.4 Maximum Urban Heat Island (UHImax) 15
3 Past and projected trends in UHI intensity 17 3.1 Historical trends 17 3.2 Impact of climate change 17
4 Determinants of the Urban Heat Island intensity 19 4.1 City size 19 4.2 Urban design and structure 22
4.2.1 Typology 22 4.2.2 Urban green 23 4.2.3 Urban surface water 25 4.2.4 Urban geometry 26 4.2.5 Properties of urban materials 28
4.3 Anthropogenic heat 32
5 Assessment of UHI intensity in the Netherlands 33 5.1 Measurements in Rotterdam 33
5.1.1 Mobile traverse measurements 33 5.1.2 In situ measurements 35
5.2 Measurements in Arnhem 37 5.3 Meteorological observations from hobby meteorologists 37
5.3.1 Methodology 37 5.3.2 Preliminary results 39
5.4 Comparison between Dutch cities and other European cities 40 5.5 Future projections 41
6 Conclusions 43
References 45
Acknowledgements 53

Appendix A. Classification table of Oke (2006) 55
Appendix B. Maximum UHI intensities of European, North-American, and Asian cities obtained from meteorological observations 57

Alterra report 2170 7
Executive Summary
In contrast to many countries in the world, where urban meteorology has been studied for more than three decades, urban meteorology was not considered an issue in the Netherlands until recently. This view altered after the heat waves in 2003 and 2006, which made many people realize that also Dutch cities may be impacted by climate change. Thus there is now a sense of urgency to implement adaptation measures in order to cope with future climate threats on the livability in cities. In the present study, an up-to-date assessment of the magnitude of the current Urban Heat Island (UHI)-intensity in urban areas in the Netherlands has been made. The underlying question is whether or not thermal comfort will be a critical issue considering urbanization and climate change in the next decades. This assessment is based on results from meteorological observations reported in the literature with particular focus on assessed relationships between maximum nocturnal UHI intensity (UHImax) and city features, such as and city size and urban configuration and structure. Also results from recent meteorological observations in the urban canopy in Rotterdam and Arnhem have been used. Furthermore, historical datasets provided by hobby meteorologists have been analyzed to obtain a more nationwide coverage. The main research questions were: • What are the past and future trends in UHI intensity? • What are the quantitative relationships between UHI intensity and city features such as city size, urban
configuration and geometry? • Are the UHI intensities of Dutch cities of the same order of magnitude as those reported for other
European cities? In Chapter 2, first some basic of UHI are explained including the urban surface energy balance, surface and atmospheric urban heat islands, urban scales, and the concept of maximum urban heat island intensity (UHImax). Due to differences in land cover, surface characteristics, and level of human activity, surface energy budgets of urban areas are different from those of surrounding rural areas. Such differences can affect the generation and transfer of heat, which can lead to different surface and air temperatures in urban areas versus rural areas. The SEB for an urban area is described by (Oke, 1988):
SEHF QQQQ*Q ∆++=+
Where Q* is net all wave radiation, QF heat arising from anthropogenic activities, QH is the turbulent sensible heat flux, QE is the turbulent latent heat flux, and ∆QS is the net heat storage flux associated with heating/cooling of this mass. So, in principle, urban climate is driven by the urban SEB and radiation balance. Each energy balance term will be altered in the urban environment and contribute to the formation of the Urban Heat Island. A distinction between surface and atmospheric urban heat islands has to be made. Surface urban heat islands are typically present day and night, but tend to be strongest during the day when the sun is shining. Atmospheric urban heat islands (UHI) are often weak during the late morning and throughout the day and become more pronounced after sunset due to the slow release of heat from urban structures. To date, the vast majority of climatologic studies of UHI has been performed to assess the atmospheric UHI. In general, the UHI effect is determined by measuring air temperatures within the urban area and comparing the observations to nearby rural temperatures (i.e. air temperatures away from the city fabric).

8 Alterra report 2170
Atmospheric urban heat islands can be divided into two types of heat islands: – Urban canopy layer (UCL) heat island, i.e. in the layer of air where people live, from the ground to below
the tops of trees and roofs – Urban Boundary Layer (UBL) heat island, that start from the rooftop and treetop level and extend up to
the point where urban landscapes no longer influence the atmosphere. This region typically extends to a maximum of 1.5 km from the surface.
The UCL heat islands are the most commonly observed of the two types and are often referred to in discussions of UHIs. Past and projected trends in UHI intensity are dealt with in Chapter 3. Historical temperature data records for US metropolitan cities, London and South Korean cities show an upward trend in UHI intensity. For example, from long-term meteorological records for London, Wilby (2003) derived an increase in nocturnal UHI intensity of 0.131 and 0.120 °C per decade for spring and summer respectively. This can be attributed to an increase in population, energy consumption, and in anthropogenic heat production. Also a change in urban surface properties (e.g. more high-rise buildings, an increase in impervious surfaces) may be responsible for this increase (Stone, 2007; Wilby, 2003). Climate-change projections suggest that days with extreme temperatures will become more frequent and severe during this century, consistent with the observed trend of the past decades (Fischer and Schär, 2010). However, so far, relatively little research has been done on the impact of global warming on UHI intensity. Emphasis has been on the possible contamination of surface-air temperature records by urban heat advection (Brandsma et al., 2003; Parker, 2010; Van Weverberg et al., 2008). Recent model simulation studies, in which UHI projections have been downscaled from GCMs, point to a further intensification of the mean nocturnal heat island as result of global warming (Wilby, 2008; McCarthy et al., 2010). Wilby (2007) showed that London's nocturnal UHI could intensify by a further 0.5 K in summer by the 2050s. This translates into a 40% increase in the number of hot nights. Chapter 4 discusses important determinants of UHI intensity including city size, urban typology and geometry, and radiative and thermal properties of urban surfaces. Also attention is paid to the influence of anthropogenic heat production. For mid-latitude cities, Oke (1973) demonstrated a linear relationship between UHImax and the logarithm of population (log (P)), under the restriction of calm and clear (cloudless) weather conditions. Population has often been used as a convenient and widely available proxy for urban geometry. The assessed relationships are shown to hold remarkably well for North American settlements, and to a less extent, for West European cities. For comparable populations, European cities show in general smaller UHImax values than North American cities. Lower UHImax values have also been reported for Japanese and Korean settlements. However, the relationships assessed by Oke (1973) cannot be confirmed by more recent literature results. A different relationship for European cities has been found in the present study, while no relationship could be assessed for the results found for North American cities. The typology of a city district or neighbourhood has an influence on its local climate. For instance, intensely developed high density urban areas show a high UHI intensity. The presence of urban green may have a mitigating effect. Tall mature trees both provide shade and lower air temperature. The latter is due to the fact that vegetation converts solar energy into latent heat energy through evaporation of water. Bowler et al. (2010) reviewed literature data on the cooling effect of parks and the results of their meta-analysis show that, on average, air temperatures in an urban park during daytime are about 1 °C lower than in non-green sites. However, most studies on the cooling effect of urban green have been conducted for relatively small areas (<3 ha). The impact of larger greening interventions on the wider urban area, and whether the effects are due to greening alone, has yet to be demonstrated. In a model study, Gill et al. (2007) demonstrated that adding

Alterra report 2170 9
10% green cover to areas with little green, such as town centre and high-density residential areas, keeps maximum surface temperatures at or below the 1961-1990 baseline up to the 2050s. In summer, water bodies in urban areas such as ponds, canals and rivers may also have a cooling effect on the surrounding urban area. The cooling effect is caused by evaporation and by heat absorption. However, it should be noted that the cooling effect of water bodies may also be the result of the fact that a water body provides a free wind path (ventilation zone). So far, little quantitative information is available on the magnitude and effect range of water bodies on the surrounding built environment. Urban geometry influences wind flow, energy absorption and storage, and net emission of long-wave radiation. Therefore, it is a major factor determining microclimate differences within a city. A measure for urban geometry is the height-to-width (H/W) ratio which describes how buildings are spaced with respect to their heights. Oke (1981) found an empirical relationship between the observed maximum nocturnal UHImax at street level and the average H/W ratio calculated for the central areas of the towns and cities:
)89.0r()W/Hln(97.354.7UHI 2max =+=
Information on H and W was based on ground-level and aerial photos, as well as on data sets of building and street dimensions. A more appropriate measure of radiation geometry of a given site is the sky view factor (SVF) that is a dimen-sionless measure between 0 and 1, representing the openness of the sky to radiative transport. A value of 0 (complete obstruction) means that all outgoing radiation will be intercepted by obstacles, whereas a value of 1 (no obstruction) means that all radiation will propagate freely to the sky (Watson and Johnson, 1987). Dense canyons have SVF-values varying between 0.22 and 0.60, and open canyons between 0.63 and 0.82 (Svensson, 2004). The most traditional way to measure SVF is to take a 180° fisheye photograph (Chen and Black, 1991). For calm, cloudless nights in summer Oke (1981) found the following relationship between UHImax and SVF:
)88.0r(SVF*88.1327.15UHI 2max =−=
Above equations are based on observations for specific sites ('urban canyons') in the central areas of cities in North America, Europe and Australia. Strong relationships between UHImax and SVF have also been reported by Park (1987), for the central business districts of Japanese and Korean cities. However, less clear relationships have been found in more recent studies. Both strong and weak, or no significant relationships have been reported, even for the same urban areas. According to Unger (2004) it is better to base future research on area means of appropriately sized urban area in order to level out the influence of micro scale processes. The assessment of the proper scale will be an important next step in future research on this subject. Radiative and thermal properties of urban materials also influence urban heat island development, as they determine how the sun's energy is reflected, emitted, and absorbed. Urban areas typically have surface materials, such as roofing and paving, which have a lower albedo than those in rural settings. As a result, the built environment generally reflect less and absorb more of the sun's energy. This absorbed heat increases surface temperatures and contributes to the formation of surface and atmospheric urban heat islands. Several studies have quantified the ability of increases in albedo to mitigate the urban heat island and decrease cooling energy use. Generally, these studies have been conducted with mesoscale weather models applied to individual cities using large-scale albedo changes (i.e. changing the albedo of entire cities). These model

10 Alterra report 2170
studies show that large-scale increases in surface albedo may reduce the near-surface daytime summer air temperatures by 0.5 to 2 K (Sailor, 1995; Taha et al., 1999; Synnefa et al., 2008). The thermal behaviour of urban surfaces is largely determined by the density, specific heat capacity, thermal conductivity, and thermal admittance coefficients of the materials used. Many building materials, such as steel and stone, have higher heat capacities than rural materials, such as dry soil and sand. As a result, cities are typically more effective at storing the sun's energy as heat within their infrastructure. Downtown metropolitan areas can absorb and store twice the amount of heat compared to their rural surroundings during the daytime. The reported values for anthropogenic heat production vary greatly. Values of 5-35 W m-2 have been reported for European cities, 60-75 W m-2 for American cities, and 200-1590 W m-2 for Tokyo. It seems that depending on the area and its energy use the term could be significant or negligible and it could have varying diurnal, seasonal or even weekly trends. Within the Dutch Climate Changes Spatial Planning Programme and the Knowledge for Climate Research Programme, a start was made with data collection and exploration to estimate urban meteorology and climatology in the Netherlands (Van Hove et al., 2010). Chapter 5 discusses recent meteorological obser-vations carried out in Rotterdam and Arnhem. Furthermore, historical datasets for 19 towns and cities in the Netherlands provided by hobby meteorologists have been analyzed to obtain a more nationwide coverage. In the city of Rotterdam, different types of meteorological observations in the Urban Canopy Layer (UCL) have been performed1. To cover detection of temporal as well as spatial variations of the meteorological conditions in the urban canopy, long-term meteorological observations at fixed positions are combined with campaign-based observations at high spatial resolution. Results from 2009 and 2010 show that UHI was largest during the summer months (JJA), whereas only a small or no UHI effect was found in the winter period (DJF). The measured maximum temperature difference between the city centre and adjacent countryside amounted to more than 7 °C under favorable meteorological conditions in spring and summer, i.e. clear (cloudless) and calm conditions. The maximum UHI intensity (UHImax) is reached during the evening hours, and a minimum or sometimes even negative difference is observed after sunrise. This diurnal variation in UHI is often observed in summer. Large temperature differences were also measured for the city centre of Arnhem, a smaller, more in land located city. Furthermore, relatively large UHImax values were estimated from the weather amateur data under favorable meteorological conditions, with values ranging from 3 to 10 K (Van Hove et al., 2010). So, all observational evidence point to the existence of a substantial nocturnal UHImax in Dutch urban areas during clear and calm days in spring and summer. The assessed UHImax values are of the same order of magnitude as those reported for other European cities. However, no clear effect of city size, defined as the logarithmic value of the number of inhabitants, on UHI intensity could be assessed suggesting that other factors such as population density and/or city district or neighbourhood characteristics may be more important in determining the magnitude of the UHI intensity. It can be concluded from our results that considering future developments in climate and urbanization, thermal comfort and heat stress will likely become a critical issue in many urban areas in the Netherlands. As such more knowledge is needed on the impacts of land use and material use in (and around) urban areas on local weather and climate.
1 As part of the 'Heat Stress in the City of Rotterdam' project (HSRR05, 1st phase Knowledge for Climate Programme)

Alterra report 2170 11
1 Introduction
1.1 Background
In the last century, 38 heat waves occurred in Europe, of which eleven were after 1990 and six after 2000 (IPCC, 2007). Climate projections for the next 50 years show that the frequency and severity of heat waves will probably further increase (IPCC, 2007; Fischer and Schär, 2010). In urban areas, the consequences of global warming are extra felt because air and surface temperatures in urban areas are normally higher than in the surrounding rural areas. This so-called Urban Heat Island (UHI) effect is caused by the development and the changes in radiative and thermal properties of urban infrastructure as well as the impact buildings can have on the local micro-climate - for example tall buildings can slow the rate at which cities cool off at night. So, the UHI effect will exacerbate the effect of regional warming by increasing summer temperatures relative to outlying rural districts. Moreover, UHIs could even intensify with projected increases in solar radiation and lower wind speeds (Wilby, 2007). The projected trends could have significant consequences. Mortality is known to increase in hot weather especially amongst the elderly (Haines et al., 2006). As witnessed during the major European heat wave of 2003, urban centres such as Paris were particularly affected due to extreme day-time temperatures and by lack of relief from high nocturnal temperatures (Vandentorren et al., 2004). Thus, even in the absence of climate change, summer heat waves combined with the UHI effect can trigger major public-health crises in largely urbanized populations (Wilby, 2007). Moreover, heat waves often coincide with drought and summer smog (ozone) and increased levels of air pollutants. For several cities in the UK it has been analysed that between 21 to 38% of the victims were probably not caused by heat, but by smog and particulate matter (Stedman, 2006). For Europe, an excess mortality of 70,000 has been estimated for the heat wave of 2003 (EEA, 2007). Using present-day relationships between extreme heat and summer excess mortality for the Los Angeles metropolitan area, heat-related deaths were found to increase by up to seven times by the 2090s even with acclimatization (Hayhoe et al., 2004). In addition, the percentage of humans living in urban areas continues to grow worldwide. By 2030, more than 60% of the world population will be living in urban areas (80% for Europe) which may further increase the magnitude of the UHI intensity (Kim and Baik, 2004). 1.2 Objectives and research questions
In contrast to many countries in the world, where urban meteorology has been studied for more than three decades, urban meteorology was not an issue in the Netherlands until recently. The Urban Heat Island (UHI) was thought to be relatively unimportant for the Netherlands with its mild climate and its location close to the sea. This view altered after the heat waves in 2003 and 2006 causing an excess mortality between 1400 and 2200 (Haines et al., 2006) which is relatively high as compared to other European countries. Particularly in the cities excess mortality rates were high which made many people realize that also Dutch cities may be impacted. In addition, climate change projections indicate that also in the Netherlands number of hot days are likely to become more frequent in the next decades. Urbanization, particularly in the western part of the country, will continue in the next decades (Nijs et al., 2002). Hence, there is now a sense of urgency to implement adaptation measures in order to cope with future climate

12 Alterra report 2170
threats on the liveability in cities. Houses, buildings and infrastructure are usually designed and built for long time periods and we need now to ensure that newly developed urban areas are adequately 'climate proofed' for future conditions. However, knowledge is lacking and no systematic meteorological data records for towns and cities are available yet, which hampers the planning and design of suitable adaptation and mitigation strategies. In the present study we made an assessment of the magnitude of the current UHI effect for Dutch cities. In the first place, this assessment was based on a literature survey. We were particularly interested in reported quantitative relationships between maximum UHI intensities, obtained from meteorological observations, and city features such as city size, urban design and structure, and anthropogenic activities. Secondly, results from recent meteorological observations in the city of Rotterdam and Arnhem have been used for this assessment. Furthermore, datasets provided by hobby meteorologists were analyzed. As such, also a more nationwide coverage was obtained. The main research questions were: – What are the past and future trends in UHI intensity? – What are the quantitative relationships between UHI intensity and city features such as city size,
urban configuration and geometry? – Are the UHI intensities of Dutch cities of the same order of magnitude as those reported for other
European cities? 1.3 Outline of the report
In Chapter 2 first some basic notions of urban heat islands are explained including the urban surface energy balance, surface and atmospheric urban heat islands, urban scales, and the concept of maximum urban heat island intensity (UHImax). Chapter 3 discusses the past and projected trends in UHI intensity. An important aspect is the impact of climate change on the intensity of UHI and frequency of nocturnal hot nights. Chapter 4 discusses important determinants of UHI intensity such as city size, and urban design and structure related factors including urban typology and geometry (Sky View Factor), and radiative and thermal properties of urban surfaces. Also attention is paid to the effect of anthropogenic heat production. In Chapter 5, recent meteorological measurements carried out in the Urban Canopy of Rotterdam and Arnhem are discussed. To obtain a more nationwide coverage, historical datasets provided by hobby meteorologists were analyzed. The results thereof will be presented in this chapter. Finally, in Chapter 6, conclusions are presented.

Alterra report 2170 13
2 Some basic notions of Urban Heat Islands
2.1 Urban surface energy balance
Due to differences in land cover, surface characteristics, and level of human activity, surface energy budgets (SEB) of urban areas are different from those of surrounding rural areas. Such differences can affect the generation and transfer of heat, which can lead to different surface and air temperatures in urban areas versus rural areas. The SEB for an urban area is described by (Oke, 1988):
SEHF QQQQ*Q ∆++=+
(2.1)
Where Q* is net all wave radiation, QF heat arising from anthropogenic activities, QH is the turbulent sensible heat flux, QE is the turbulent latent heat flux, and ∆QS is the net heat storage flux associated with heating/cooling of this mass. So, in principle, urban climate is driven by the urban SEB and radiation balance. Each energy balance term will be altered in the urban environment and contribute to the formation of the Urban Heat Island effect (UHI). Urban surfaces, compared to vegetation and other natural ground cover, reflect less radiation back to the atmosphere. They instead absorb and store more of it, which raises the area's temperature. Thermal storage increases in cities in part due to the lower solar reflectance of urban surfaces, but it is also influenced by the thermal properties of construction materials and urban geometry. Urban geometry can cause some short-wave radiation - particularly within an urban canyon - to be reflected on nearby surfaces, such as building walls, where it is absorbed rather than escaping into the atmosphere. Similarly, urban geometry can impede the release of long-wave, or infrared, radiation into the atmosphere at night. Particularly densely built areas, with a low sky view factor, cannot easily release long-wave radiation to the cooler, open sky, and this trapped heat contributes to the urban heat island. Urban areas tend to have less evapotranspiration relative to natural landscapes, because cities retain little moisture. This reduced moisture in built up areas leads to dry, impervious urban infrastructure reaching very high surface temperatures, which contributes to higher air temperatures. An additional term that must be considered in the urban setting is the heat added by human activities. It can come from a variety of sources and is estimated by totaling all the energy used for heating and cooling, running appliances, transportation, and industrial processes. 2.2 Surface and atmospheric urban heat islands
A distinction between surface and atmospheric urban heat islands has to be made. These two differ in the ways they are formed, the techniques used to identify and measure them, their impacts, and to some degree, the methods available to mitigate them. Surface urban heat islands are typically present day and night, but tend to be strongest during the day when the sun is shining. Atmospheric urban heat islands (UHI) are often weak during the late morning and throughout the day and become more pronounced after sunset due to the slow release of heat from urban structure. The timing of this peak, however, depends on the properties of urban and rural surfaces, the season, and prevailing weather conditions. To date, the vast majority of climatologic studies of urban heat islands have been performed to assess the atmospheric UHI with in situ air temperature measurements and mobile traverse measurements. In recent years, with advances in remote sensing techniques, more satellite-based results on surface UHIs have become
14 Alterra report 2170
available. The main advantage is that a higher spatial resolution is obtained. However, the results are more difficult to interpret due the complexity of interactions of thermal infrared radiations with the atmosphere and urban surfaces. 2.3 Urban scales
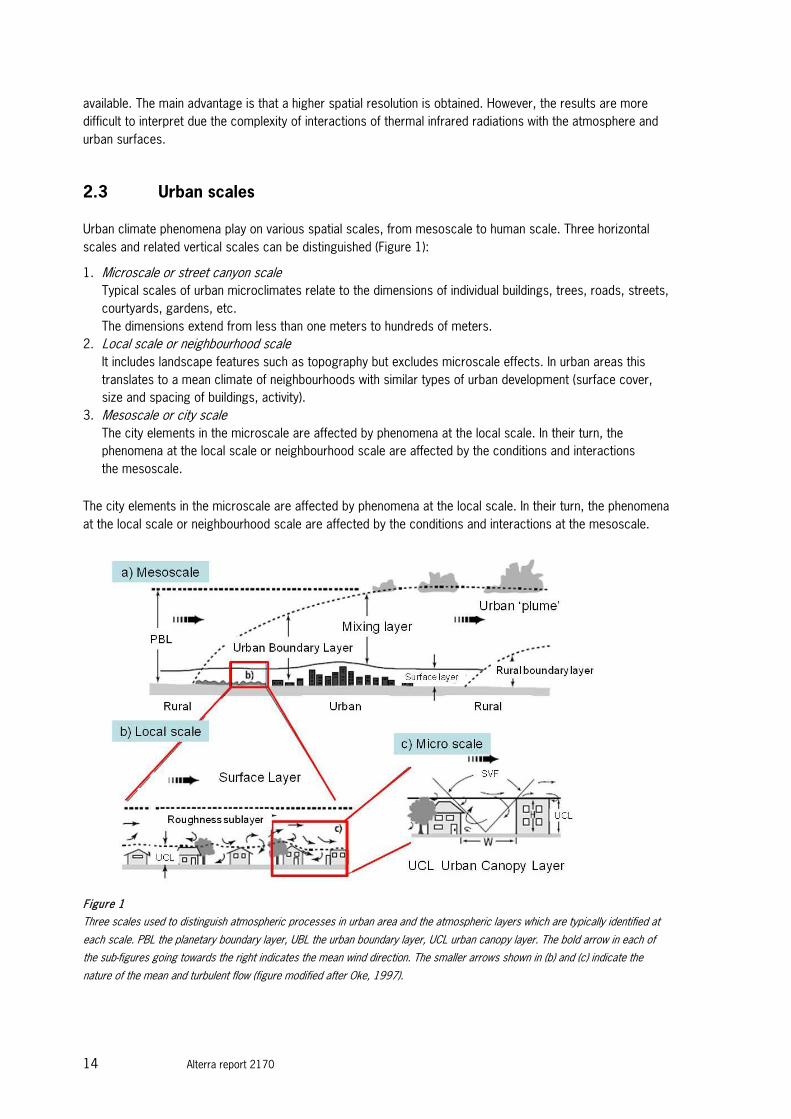
Urban climate phenomena play on various spatial scales, from mesoscale to human scale. Three horizontal scales and related vertical scales can be distinguished (Figure 1): 1. Microscale or street canyon scale
Typical scales of urban microclimates relate to the dimensions of individual buildings, trees, roads, streets, courtyards, gardens, etc. The dimensions extend from less than one meters to hundreds of meters.
2. Local scale or neighbourhood scale It includes landscape features such as topography but excludes microscale effects. In urban areas this translates to a mean climate of neighbourhoods with similar types of urban development (surface cover, size and spacing of buildings, activity).
3. Mesoscale or city scale The city elements in the microscale are affected by phenomena at the local scale. In their turn, the phenomena at the local scale or neighbourhood scale are affected by the conditions and interactions the mesoscale.
The city elements in the microscale are affected by phenomena at the local scale. In their turn, the phenomena at the local scale or neighbourhood scale are affected by the conditions and interactions at the mesoscale.
Figure 1
Three scales used to distinguish atmospheric processes in urban area and the atmospheric layers which are typically identified at
each scale. PBL the planetary boundary layer, UBL the urban boundary layer, UCL urban canopy layer. The bold arrow in each of
the sub-figures going towards the right indicates the mean wind direction. The smaller arrows shown in (b) and (c) indicate the
nature of the mean and turbulent flow (figure modified after Oke, 1997).

Alterra report 2170 15
So, roughly speaking, atmospheric urban heat islands can be divided into two types of heat islands: – Urban canopy layer (UCL) heat island, i.e. in the layer of air where people live, from the ground to below
the tops of trees and roofs – Urban Boundary Layer (UBL) heat island, that starts from the rooftop and treetop level and extend up to
the point where urban landscapes no longer influence the atmosphere. This region typically extends to a maximum of 1.5 km from the surface.
The UCL heat islands are the most commonly observed of the two types and are often referred to in discussions of UHIs. 2.4 Maximum Urban Heat Island (UHImax)
In general, the UHI effect is determined by measuring air temperatures within the urban area and comparing the observations to nearby rural temperatures (i.e. air temperatures away from the city). Because of the slow release of heat from urban structures after sunset, the UHI intensity is greatest at night. In addition, the mag-nitude of the UHI is dependent on the location within the city. For example, the city centre has more impact on the temperature than suburban areas due to the increased heat capacity of urban structures. As for ambient climatic conditions, wind speed and cloud cover also impact the magnitude of the UHI. High winds and/or cloud cover disrupt the cooling differences between the urban and rural areas and reduces the UHI effect, while calm conditions with clear skies are optimal for large UHI effects. So, a term had to be found for the UHI being quite independent from the period of time. The maximum urban heat island intensity abbreviated as UHImax represents this term. It is defined as the maximum hourly average temperature difference between urban area and nearby rural area during a 24 hr period, under most favourable weather conditions, such as few or no clouds and low winds.

16 Alterra report 2170

Alterra report 2170 17
3 Past and projected trends in UHI intensity
3.1 Historical trends
Historical temperature data show an upward trend in UHI intensity that can be attributed to an increase in population, energy consumption, and in anthropogenic heat production, and a change in urban surface properties (e.g. more high-rise buildings, an increase in impervious surfaces). In addition, there are indications that climate change caused an intensification of the UHI effect (Wilby, 2003). Stone (2007) analyzed temperature data from urban and proximate rural stations for 50 large US metropolitan areas between 1951 and 2000. He found a mean decadal rate of change in UHI intensity of 0.05 °C. Also long-term records of London show that its nocturnal UHI has become more intense since the 1960s (Table 1), especially during spring and summer (Wilby, 2003). This has been attributed to increased human energy production (HEP), increased urbanization, and changing frequency of weather patterns. Kim and Baik (2004) studied the change in daily maximum UHI in the six largest cities of South Korea during the period 1973-2001. From their results an average increase of 0.3 ± 0.1 (SE) per decade can be derived, which is rather high.
Table 1
Seasonal trends in London's daily urban heat island (UHI) intensity (°C per decade) 1959-1998 (source: Wilby, 2003).
Season Nocturnal ∆T(u-r)min
Daytime ∆T(u-r)max
Winter –0.023a –0.081** Spring +0.131** +0.015a Summer +0.120** +0.036* Autumn +0.077* –0.046*
a Not significant; * significant at p = 0.05; ** significant at p = 0.01.
3.2 Impact of climate change
To date, there has been relatively little research into climate change impacts on UHI intensity. So far, emphasis has been on the possible contamination of surface-air temperature records by urban heat advection (Parker, 2004, 2006; Van Weverberg et al., 2008). Recent model studies, in which UHI projections have been down-scaled from GCMs, point to a further intensification of the mean nocturnal heat island as result of global warming (Wilby, 2008; McCarthy et al., 2010). For example, using a statistical downscaling method, Wilby (2008) showed that London's nocturnal UHI could intensify by a further 0.5 °C in summer by the 2050s. This translates into a 40% increase in the number of nights with intense UHI episodes. These changes reflect sensitivity to variations in regional climate alone, so omit other factors such as changes in land use, emissions, climate feedbacks, or synergies between air quality and heat islands.

18 Alterra report 2170
Similar results have been reported by McCarthy et al. (2010) who studied the potential impact of a doubled atmospheric CO2 concentration on UHI intensity using an urban land-surface scheme within a Global Climate Model (GCM). Climate change increases hot days by similar amount for both urban and rural situations. However, rural and urban increases differ significantly with regard to the frequency of hot nights (defined as the frequency that Tmin for rural and urban surfaces exceed the 99th percentile of the Tmin temperature distribution over the local non-urban surface). For example, while Beijing as a rural surface has fourteen additional hot nights under the doubled CO2 concentration experiment, the urban surface has 26 additional hot nights. However, this is a conservative estimate since additional heat sources (from air conditioning, transportation etc.) were not included in the analysis. The inclusion of 60 W m-2 for these heat sources resulted into a further fifteen hot nights, making a total of 41 additional hot nights. For London, the results are three additional hot nights for the rural surface, five additional hot nights for the urban surface and a total of ten hot nights for the urban surface for the case of 60 W m-2. Although these changes are less extreme, they have to be set against a background of more persistent and intense heat waves over much of Europe (Fischer and Schär, 2010). The results of these simulations demonstrate the potential exposure of urban populations to climate change and how it is enhanced by local factors. For climate impacts and adaptation research it is important to under-stand and estimate risks of future climate stress, so it is essential to account not only for climate change, but also population dynamics, urbanization and energy use. The continued development of urban land‐surface schemes suitable for climate models will greatly assist in further developing our understanding of climate change in cities (Best, 2005; Masson, 2006; Oleson et al., 2008).

Alterra report 2170 19
4 Determinants of the Urban Heat Island intensity
The UHI intensity in a particular city is the result of the interaction of many factors, on different spatial and temporal scales. Latitude or climate zone, the topography and the distance to large water bodies determine the 'background' urban climate on the mesoscale while city size, urban design and structure related factors and population related factors (anthropogenic heat production, pollution) have an influence on the UHI intensity on the meso to micro scale. A distinction can be made, between controllable and uncontrollable or natural factors. In addition, a categorization can be made between temporary effects, such as wind speed and cloud cover, permanent effects such as green areas, building material, and geometry (sky view factor, aspect ratio), and cyclic effects such as solar radiation and anthropogenic heat sources. In this chapter, the impact of city size, urban design and structure related factors, and the influence of anthropogenic activities will be discussed in more detail, with emphasis on quantitative results. 4.1 City size
Urban Heat Islands have been measured worldwide for various climate regions across the globe. The major part of the literature deals with the UHI in mid-latitudes (between 40 °N or S and 60 °N or S). The available results indicate that UHI intensities are generally lower compared to those of temperate cities with comparable population (Wienert and Kuttler, 2005; Roth, 2007). Figure 2 gives an overview of UHImax (in K) versus population for cities in the various climatic regions. Herewith population is used as a convenient and widely available proxy for urban geometry. For mid-latitude cities, Oke (1973) demonstrated a linear relationship between UHImax and the logarithm of population (log (P), under the restriction of calm and clear (cloudless) weather conditions. The assessed relationships are shown to hold remarkably well for North American settlements, and to a less extent, for West European cities, as is shown in Table 2. For comparable populations, European cities show in general smaller UHImax values than North American cities. Oke (1973) attributed this result to factors as lower artificial energy flux densities, lower heat capacity of the urban fabric, or more evapotranspiration in European cities. Also lower UHImax values have been reported for Japanese and Korean settlements. Fukuoka (1983) and Park (1983) found that the relationships between UHImax and log(P) were represented by two lines, because the regression line bends around a population of 300,000. A similar result was obtained for South Korean cities. Park (1986) attributed this bending to differences in cities structure, anthropogenic activities and in surround-ing area between large and small cities. However, above relationships were assessed in the seventies and eighties of the last century. Therefore, it was examined whether the relationships also hold for more recent reported values for UHImax. Table 3 shows the UHImax values reported for European cities between 1987 and 2008. A more steep linear relationship was found for these values with a smaller correlation (see Table 2 and Figure 2).

20 Alterra report 2170
Table 2
Relationships between UHImax in the UCL and logarithm of population (log(P) ) of urban areas in various climatic regions.
Year Relationship for UHImax Reference
North America
1954 - 1972 2.96 log(P) - 4.61 (r2 = 0.96) Oke (1973) 1975 - 2004 No relationship Present paper
Europe
1929 - 1973 2.01 log(P) - 4.06 (r2 = 0.74) Oke (1973) 1987 - 2008 2.93 log(P) -11.95 (r2 = 0.59) Present paper
South Korea
1.46 log(P) - 5.93 (r2 = 0.98; pop. <300,000) 3.43 log (P) - 16.58 (r2 = 0.98; pop. >300,000)
Park (1986)
Japan 0.85 log (P) - 2.46 (r2 = 0.84; pop. <300,000 4.83 log (P) - 23.81 (r2 = 0.95; pop. >300,000)
Fukuoka (1983); Park (1986)
1992 - 2002 2.08 log(P) - 4.22 (r2 = 0.78) Sakakibara and Matsui (2005)
For North America, only a few recent results could be found. The UHImax values reported by Hawkins et al. (2004) and Runnalls and Oke (1998) for Phoenix and Vancouver respectively are in accordance with the relationship assessed by Oke (1973), whereas a comparatively low value (∼8 °C) has been reported by Gedzelman et al. (2003) for New York City. For Japanese cities Sakakibara and Matsui (2005) found higher UHImax values than those reported by Park (1986). They demonstrated that the relationship between UHImax and log(P) can be described well with a single straight regression line instead of two regression lines. The Netherlands has a widespread grid of medium-sized cities. The number of inhabitants of the 30 largest communities varies between 100,000 and 800,000. Assuming that Dutch cities can be compared with other European cities, it can be derived from Figure 2 that UHImax lies between 4-8 K.

Alterra report 2170 21
Figure 2
Maximum nocturnal urban heat island intensity in the UCL measured during clear and calm conditions (UHImax in °C) versus
population for cities in various climatic regions. Europe: (■) Oke (1973), (♦) results for 1987 - 2008 (present paper, Table 3).
North America: (■) Oke (1973), (♦) results for 1985 - 2004 (present paper). Japan: (▲) Fukuoka (1983) and Park (1985),
(x) Sakakibara and Kitahara (2003), Sakakibara and Matsui (2005). South Korea: (•) Park (1985).

22 Alterra report 2170
Table 3
UHImax reported for European cities.
City # inhabitants x 103
∆Tmax Approach Reference
Athens 3,203 4.6 Network weather stations Livada et al., 2002 Barcelona 4,795 8.2 Mobile traverse measurements Moreno-Garcia, 1994 Lisbon 600 4.0 Network weather stations Alcoforado and Andrade, 2006 Lodz 850 8.0 Network weather stations Klysik and Fortuniak, 1999 London 8,505 8.6 Network weather stations Kolokonitroni and Giridharan, 2008 Moscow 1,0654 9.8 Network air pollution monitoring sites Shahgedanova et al., 1997 Munich 1,263 8.2 Mayer and Höppe, 1987 Paris 9,820 8.0 Modelling + network weather stations Lemonsu and Masson, 2002 Rome 3,328 5.0 Modelling + network weather stations Bonacquisti et al., 2006 Szeged 160 2.6*
3.1* Mobile traverse measurements Unger et al., 2001
Bottyan et al., 2005
* Average UHImax for April-October, not plotted in Figure 2.
4.2 Urban design and structure
4.2.1 Typology
The typology of a city district or neighbourhood has an influence on its local climate. Watkins (2002) showed how the typology of an urban area affects its UHI intensity. He defined eight categories of urban geometry and 'greenness' (see Table 4). The nature of the surfaces at a site and the access to the sky for energy receipt and re-emission are critical factors. The eight categories represent increasing urbanization, i.e. increasing local heat capacity, and decreasing vegetation and sky view. The category of site was found to correlate with the measured temperature at the site - when adjusting for the distance of the site from the centre of the city. Figure 3 gives an example for a distance of two miles from the centre of London. The categorizations show the degree to which small variations in urban design can significantly affect the local heat island intensity. Up to category 5 (medium-density urban area) an increase in average daytime UHI intensity was found. In high-density built areas (category 6) the average daytime UHI intensity was lower than found in category 5 areas which might be due to increased shadowing effects.

Alterra report 2170 23
Table 4
Categories of urban configuration for London (Watkins, 2002).
Category H/W ratio of street x Surface Description
1 X = 0 Grass etc. Rural fields, or large parks, or trees 2 X = 0 Hard and grass Housing near park or field 3 X = 0 Hard Urban derelict or un-built area or car park 4 0 ≤ x <0.3 Hard, very wide gorge Low-density residential area 5 0.3 ≤ x <0.5 Hard, wide gorge Medium-density urban area 6 0.5 ≤ x <1 Hard, wide gorge High-density urban area; around focus 7 1 ≤ x <2 Hard, medium gorge City centre with tall buildings 8 X ≥ 2 Hard, narrow gorge Narrow 'back streets' with medium tall (six storey) buildings
Figure 3
The variation of mean local heat island intensity, dT, in London when measurements are grouped by site category, for a given radial
distance (Xr = two miles in this example) from the city centre. Summertime daytime data selected for periods that were relatively
calm, dry, and sunny (source: Watkins, 2002).
4.2.2 Urban green
The presence of vegetation may have a mitigating effect on UHI intensity. Tall mature trees both provide shade and reduce the air temperature in an urban area. The latter is due to the fact that vegetation covert solar energy into latent heat energy through evaporation of water. Most studies examined the air temperature within parks and beneath trees and are broadly supportive that green sites can be cooler than non-green sites. Figure 4 shows a typical example from a one-day test along a transect from a residential area in London through a park and on to another residential/shopping area (Watkins et al., 2002). The air temperature clearly reduces inside the park and, in line with the wind direction, the cooler air from the park appeared to be cooling the street gorge directly beyond the park (site-9 and site-10) for a distance of between 200 and 400 meters.

24 Alterra report 2170
(Site-7 was anomalous and the reason was not clear.) The measured cooling effects of vegetation have been reported in many other cities, e.g. Göteborg, Sweden (Upmanis and Chen, 1999), and in Mexico City (Jauregui et al., 1997).
Figure 4
The mean air temperature over thirteen hours at ten sites across a London park (source: Watkins et al., 2007).
Bowler et al. (2010) reviewed literature data on the cooling effect of parks and the results of their meta-analysis show that, on average, an urban park would be about 1 K cooler than a non-green site in the day. Comparing the temperatures of 61 parks during the summer at noon in Taipei City, Chang et al. (2007) found that parks over three ha were usually cooler than the surrounding urban area while the temperature difference was much more variable for parks less than three ha. Larger parks and those with trees could be cooler during the day. All vegetation reduces the air temperature, but only as long as there is a supply of water to match the evapotranspiration rate. If the supply is not maintained, e.g. during a hot dry period, vegetation, particularly grass, may die at the surface and lose its cooling value. The study of Teuling et al. (2010) reveals that grass- and cropland and forests behave differently during a heat wave period. Initially, grass- and cropland are more effective than forests in cooling the air temperature through evaporation of soil moisture. However, this process accelerates soil moisture depletion and consequently grass- and cropland dry out when the heat wave prolongs. Forests become more effective in cooling at that stage, because they evaporate less water in the initial phase of the heat wave and therefore can sustain a constant level of evapotranspiration over a longer period of time. Moreover, they also have deeper roots, which extend this effect further. An important issue to the value of parks is whether a park has any effect on the temperature of the wider surrounding area. Chen and Wong (2006) studied two large parks in Singapore and measured temperatures at increasing distance from the park up to approximately 500 m from the boundary. In a long-term study of three parks in Gothenburg, Upmanis et al. (1998) also demonstrated that the night-time cooling effect of a park could extend beyond the park boundary, particularly for the largest of the three parks studied (156 ha). For this park, the data suggested that the effect could reach up to one km from the park boundary. The maximum surface temperature in residential areas is very dependent on the proportion of green cover (Figure 5). This will become increasingly important in the future. In a model study, Gill et al. (2007)

Alterra report 2170 25
demonstrated that adding 10% green cover to areas with little green, such as the town centre and high-density residential areas keeps maximum surface temperatures at or below the 1961-1990 baseline temperatures up to the 2050s.
Figure 5
Maximum surface temperature for the 98th percentile summer day in high-density residential areas, with current form and when
10% green cover is added or removed. Dashed line shows the temperature for the 1961 -1990 current form case. The models
were run for the baseline 1961 - 1990 climate, as well as for the UKCIP02 low and high emissions scenarios for the 2020s,
2050s, and 2080s (Hulme et al., 2002) (source: Gill et al., 2007).
So far, evidence for the cooling effect of green space is mostly based on observational studies of small numbers of green sites. The impact of specific greening interventions on the wider urban area, and whether the effects are due to greening alone, has yet to be demonstrated. The current evidence does not allow specific recommendations to be made on how best to incorporate greening into an urban area. Further empirical research on the influence of size, structure, distribution and type of greening is necessary, in order to efficiently guide the design and planning of urban green space. In addition, it is important to know how people use and perceive urban green elements and value their impact on thermal comfort. 4.2.3 Urban surface water
In the summer, water bodies in urban areas such as ponds, canals and rivers may have a cooling effect on the surrounding area. Robitu et al. (2004) observed that a small pond (4x4 m) had a cooling effect of about 1 °C at a height of up to one meter and a distance of up to 30 m. The cooling effect is caused by evaporation and by heat absorption. However, it should be noted that the cooling effect of water bodies may also be the result of the fact that a water body provides a free wind path (ventilation zone). According to Sugawara et al. (2009) this effect may be even more effective. Streaming water has a larger cooling effect than still water, but dispersed water like a fountain may have the largest cooling effect. A study by Nishimura et al. (1998) shows that air temperatures on the leeward site of a fountain may be reduced by 3 °C.

26 Alterra report 2170
The magnitude of the cooling effect of water bodies strongly depends on the water temperature relative to the air temperature in adjacent urban areas. So far, little quantitative information is available on the effect range on the surrounding built environment and on the cooling efficiency during a prolonged warm period. Recent measurements in Rotterdam show that water temperature of the river Maas gradually increases during the summer period which lowers its cooling efficiency. Even a reverse effect may occur. Due to the high heat capacity of water, the river stays relatively warm during summer nights which may have a warming effect on the surrounding built area. In combination with an enchanced humidity, this may lead to a greater discomfort. 4.2.4 Urban geometry
Urban geometry refers to the dimensions and spacing of buildings within the built area of a city. It influences wind flow, energy absorption, and a given surface's ability to emit long-wave radiation back to space. In developed areas, surfaces and structures are often at least partially obstructed by objects, such as neighbouring buildings, and become large thermal masses that cannot release their heat very readily because of these obstructions. Especially at night, the air above urban centres is typically warmer than air over rural ar-eas. Night-time atmospheric heat islands can have serious health implications for urban residents during heat waves. Researchers often focus on an aspect of urban geometry called urban canyons, which can be illustrated by a relatively narrow street lined by tall buildings. During the day, urban canyons can have competing effects. On the one hand, tall buildings can create shade, reducing surface and air temperatures. On the other, when sunlight reaches surfaces in the canyon, the sun's energy is reflected and absorbed by building walls, which further lowers the city's overall albedo - the net reflectance from surface albedo plus urban geometry - and can increase temperatures. At night, urban canyons generally impede cooling, as buildings and structures can obstruct the heat that is being released from urban infrastructure. So, the 3D geometrical configuration of an urban area has a large influence on the intra-urban distribution of the UHI. Much research focuses on the relationship between UHI, building height and density. A measure for geometry of the urban canyon is the height-to-width (H/W) ratio which describes how densely buildings are spaced with respect to their heights. Oke (1981) assessed an empirical relationship between the observed maximum nocturnal UHImax at screen level and the average H/W ratio calculated for the central areas of the towns and cities:
(4.1)
Information on H and W was based on ground-level and aerial photos, as well as on data sets of building and street dimensions. A more appropriate measure of radiation geometry of a given site is the sky view factor (SVF) i.e. the fraction of the overlying hemisphere occupied by the sky. It is a dimensionless measure between 0 and 1, representing the openness of the sky to radiative transport. A value of 0 (complete obstruction) means that all outgoing radiation will be intercepted by obstacles, whereas a value of 1 (no obstruction) means that all radiation will propagate freely to the sky (Watson and Johnson, 1987). Dense canyons have SVF-values varying between 0.22 and 0.60, and open canyons between 0.63 and 0.82 (Svensson, 2004). For a point surrounded by close, very high buildings, or for a very narrow street, SVF may even approach a value of 0.1. The most traditional way to measure SVF is to take a 180° fisheye photograph (Chen and Black, 1991). Instead of taking photographs, sky view factor can also be determined with surveying techniques (e.g. theodolite), with an automatic plant canopy analyzer, with the aid of GPS receivers and satellite data
)89.0r()W/Hln(97.354.7UHI 2max =+=

Alterra report 2170 27
(Chapman et al., 2002), or computed from 3D urban morphology databases (Grimmond et al. 2001; Ratti and Richens, 2004; Matzarakis et al., 2007). Based on information on H/W ratios, Oke (1981) derived the following relationship between UHImax and SVF:
(4.2)
The equations (4.1) and (4.2) are based on observations in the central areas of 31 cities in North America, Europe and Australia, with a population range between 1,100 and 8,500,000. The air temperature data are for calm, cloudless nights in summer, gathered using automobile traverses through the city centre and into the surrounding rural area. Strong relationships between UHImax and SVF have also been reported by Park (1987), for the central business districts of Japanese and Korean cities (Table 5). He also derived different relationships for European and North American cities, from the results of Oke (1981). However, in contrast, Yamashita et al. (1986) found less pronounced relationships for five suburban cities in the West part of Tokyo (i.e. in the Tama river Basin) during the winter (r2 = 0.38 - 0.46). Table 5 gives an overview of the reported relationships between UHImax
and SVF. Preliminary measurements show that SVF of the central parts of Rotterdam varies between 0.4 and 0.7 which is comparable with values found for other European cities. Assuming that the relationship of Oke (1981) is also valid for Dutch cities, UHImax values between 5.6 and 9.7 K can be calculated. This would imply that SVF alone could already explain the UHImax values assessed for Rotterdam and other Dutch cities (see Chapter 5). However, more recent reported results on the relationship between SVF and nocturnal air temperature are less clear. Both strong and weak, or no significant relationships have been reported, even for the same urban areas (Unger, 2004). For example, in extensive studies in Goteborg (Sweden), Eliasson (1996) and Upmanis (1999) found no significant relationships between SVF and nocturnal air temperature for the central parts of the city, whereas fairly strong relationships have been reported by Svensson (2004). In many cases, a limited number of measurements have been carried out, for some selected sites. The strongest relationships between SVF and nocturnal air temperature have been found for urban areas belonging to the same category, e.g. urban dense (Svensson, 2004).
Table 5
Range in SVF and relationship between UHImax and SVF for European, North American, Japanese and South Korean cities.
SVF range Relationship for UHImax Reference
Europe Central parts in cities 0.40 - 0.75 13.20 - 10.00*SVF Oke(1981); Park (1987) North America Central parts in cities 0.28 - 0.86 16.34 - 15.00*SVF Oke (1981; Park (1987) Japan Five Japanese cities 0.40 - 0.85 4.11 - 1.00*SVF Yamashita et al. (1986) Central business district 0.26 - 0.78 10.15 - 12.00*SVF Park (1987) South Korea Central business district 0.36 - 0.84 12.23 - 14.00*SVF Park (1987)
)88.0r(SVF*88.1327.15UHI 2max =−=

28 Alterra report 2170
Results from Unger (2004) and Blankesteijn and Kuttler (2004) show that measured values at sites might show large variations due to the influence of micro-variations of the immediate environments. A nocturnal urban heat island on a microscale is not only affected by horizon obstructions, but also by the spatially variable thermal properties of materials (Blankesteijn and Kuttler, 2004). Hence, this could partly explain the large variation in results reported in literature. Moreover, measured temperature values can be affected by advection effects from the wider environment (source area). Advection diminishes site specific air temperature differences even during low winds. However, on the other hand, long wave radiation strongly depends on geometric factors and can be predicted well with the SVF. Furthermore, the large variation in results may be attributed to the lack of uniformity in methodology. For example, fish-eye photos have been taken at different heights above ground varying from ground level (0.25 m) to sensor level (∼ 2 m). It has been demonstrated by Svensson (2004) that this determines to a large extent the relationship between SVF and nocturnal air temperature. Unger (2004) carried out car traverses in the city of Szeged, Hungary, determining simultaneously air temper-ature and SVF using a 1.5 m high theodolite. To obtain a better correlation between air temperature and SVF, he averaged the measured values for defined grid cells along the measurement routes. He found a rather strong relationship between the intra-urban variations of these variables. The intra-urban variations in average UHI could for 47% be explained by variations in SVF. According to Unger (2004) it is better to base future research on area means of appropriate-sized urban areas in order to level out the influence of micro-scale processes. The assessment of the proper scale will be an important next step in future research on this subject. Also, examination of a sufficient number of appropriate-sized areas covering the largest part of a city or the entire city is needed to draw well-established conclusions on the relationship between UHI intensity and SVF. 4.2.5 Properties of urban materials
Radiative and thermal properties of urban materials also influence urban heat island development, as they determine how the sun's energy is reflected, emitted, and absorbed. Furthermore, most materials used in the urban environment are impermeable for moist. As a result, more energy is available for long-wave emission, sensible heat flux and conduction to the surface. 4.2.5.1 Radiative properties
Urban areas typically have surface materials, such as roofing and paving, which have a lower albedo than those in rural settings. As a result, the built environment generally reflects less and absorbs more of the sun's energy. This absorbed heat increases surface temperatures and contributes to the formation of surface and atmospheric urban heat islands. Table 6 gives an overview of the albedo of typical urban materials and areas. Although solar reflectance is the main determinant of a material's surface temperature, another radiative property called thermal emissivity, also plays a role (Table 7). Thermal emissivity (usually written ε or e) is a measure of a surface's ability to lose heat, or emit long-wave (infrared) radiation. It is a relative measure, i.e. the ratio of energy radiated by a particular material to energy radiated by a black body at the same temperature. A true black body would have an ε = 1, while any real object would have ε <1.

Alterra report 2170 29
Most materials show an emissivity of 0.85 and higher. Building brick, metals and some concrete mixes have relatively low values. Extensive use of these materials can reduce the overall urban emissivity which tends to increase net radiation levels in urban areas. Several studies have quantified the ability of increases in albedo to mitigate the urban heat island and decrease cooling energy use. Generally, these studies have been conducted with mesoscale weather models applied to individual cities using large-scale albedo changes (i.e. changing the albedo of entire cities). Sailor [1995] showed that increasing the albedo in Los Angeles decreased peak summertime temperatures by as much as 1.5 K. Taha et al. [1999] showed that large-scale increases in surface albedo for ten cities in the U.S. reduced the near-surface daytime summer air temperature by 0.5 to 1.5 K and decreased peak electricity demand by up to 10%. Synnefa et al. (2008) found that large-scale increases in roof albedo decreased the summer heat island intensity in Athens, Greece by 1-2 K on average. Table 6
Albedo of typical urban materials and areas (Bretz et al., 1992; Oke, 1987).
Surface Albedo
Streets Asphalt (fresh 0.05, aged 0.2) 0.05 - 0.2 Walls Concrete 0.10 - 0.35
Brick/stone 0.20 - 0.40 White washed stone 0.80 White marble chips 0.55 Light-coloured brick 0.30 - 0.50 Red brick 0.20 - 0.30 Dark brick and slate 0.20 Limestone 0.30 - 0.45
Roofs Smooth-surface asphalt (weathered) 0.07 Asphalt 0.10 - 0.45 Tar and gravel 0.08 - 0.18 Tile 0.10 - 0.35 Slate 0.10 Thatch 0.15 - 0.20 Corrugated iron 0.10 - 0.16 Highly reflective roof after weathering 0.60 - 0.70
Paints White, whitewash 0.50 - 0.90 Red, brown, green 0.20 - 0.35 Black 0.02 - 0.15
Urban areas Range 0.10 - 0.27 Average 0.15
Other High-coloured sand 0.40 - 0.60 Dry grass 0.30 Average soil 0.30 Dry sand 0.20 - 0.30 Deciduous plants 0.20 - 0.30 Deciduous forests 0.15 - 0.20 Cultivated soil 0.20 Wet sand 0.10 - 0.20 Coniferous forests 0.10 - 0.15 Wood (oak) 0.10

30 Alterra report 2170
These results suggest that increasing the albedo of roofs is an effective way of reducing the urban heat island. However, the degree to which the heat island decreases depends on the importance of roofs relative to the rest of the urban system (i.e., building walls and canyon floor) in generating the heat island. This approach to heat island mitigation is less effective in winter at higher latitudes. At these latitudes, any benefits gained from a reduction in the summertime heat island need to be considered in the context of increased heating costs in winter.
Table 7
Radiative properties of selected materials: Albedo (α) and emissivity (ε) are non-dimensional (Bretz et al., 1992; Oke, 1987).
Material α ε
Asphalt 0.05-0.20 0.95 Concrete 0.3 0.71-0.94 Red brick 0.3 0.90 Building brick - 0.45 Concrete tiles - 0.63 Wood (freshly planed) 0.4 0.90 White paper 0.75 0.95 Tar paper 0.05 0.93 White plaster 0.93 0.91 Bright galvanized iron 0.35 0.13 Bright aluminium foil 0.85 0.04 White pigment 0.85 0.96 Grey pigment 0.03 0.87 Green pigment 0.73 0.95 White paint on aluminum 0.80 0.91 Black paint on aluminum 0.04 0.88 Aluminum paint 0.80 0.27-0.67 Gravel 0.72 0.28 Sand 0.24 0.76 Grass: long to short 0.16-0.26 0.90-0.95 Soil: wet to dry 0.05-0.40 0.98-0.90 Urban areas 0.10-0.27 0.85-0.96
4.2.5.2 Thermal properties
Besides radiative properties, the thermal behavior of urban surfaces plays an important role in the UHI devel-opment. This behaviour is largely determined by the density, specific heat capacity, thermal conductivity, and thermal admittance coefficients of the materials used. Heat capacity (Cp in J kg-1 K-1) refers to material's ability to store heat, while thermal conductivity (k in ) is its ability to conduct heat. Both entities determine the thermal diffusivity of a material (symbol:α, but note that the symbols κ, D, and k are all commonly used) according to:
pCk
ρ=α
(4.3)

Alterra report 2170 31
where: – k : thermal conductivity (SI units: W m-1K-1) – ρ : density (kg m-3) – cp : specific heat capacity (J kg-1 K-1) The denominator of the thermal diffusivity expression above, ρCp, can be identified as the volumetric heat capacity (J m-3 K-1). Thermal diffusivity is an important indicator of how easily heat can penetrate into a material. High values of thermal diffusivity mean that heat reaches deeper into a material layer, and temperatures stay more constant over time. Lower values mean that a thinner layer is heated, and temperatures tend to fluctuate more rapidly. The ability of material to store and release heat is defined by the thermal admittance which is the product of thermal conductivity (k) and heat capacity (C):
µ = (k C)0.5 (4.4)
An overview of the thermal properties of typical 'urban surfaces' is given in Table 8. Many building materials, such as steel and stone, have higher heat capacities than rural materials, such as dry soil and sand. As a result, cities are typically more effective at storing the sun's energy as heat within their infrastructure. Downtown metropolitan areas can absorb and store twice the amount of heat compared to their rural surroundings during the daytime. For thin materials like roofing, which is typically placed over insulation, reflectance and emittance are the main properties to consider, as the heat capacity of a well insulated roof is low. For pavements and buildings, which are thicker than roofing products and are placed on top of the ground, which has its own set of thermal characteristics, designers and researchers need to consider a more complex set of factors that include radiative and thermal properties. Oke et al. (1991) show with model simulations that thermal properties have an important influence. Differences in thermal admittance between rural and urban areas alone can produce a heat (or cool) island. In contrast to differences in geometry, differences in thermal admittance are less clear and visible. Most researchers assume that the city has a higher thermal admittance but no strong evidence is presented for this. Simulations carried out by Montavez et al. (2007) show that the most favourable combination of geometry and thermal properties can produce a UHI intensity of 10 K, a magnitude in accordance with those in the real world.

32 Alterra report 2170
Table 8
Thermal propertiesa of artificial and natural surfaces (based on Oke, 1990; Hupfer and Kuttler, 1998; Zmarsly et al., 2002).
Materiala) Density
(kg m-3 x10³)
Specific heat capacity
(J kg-1 K-1 x 10³)
Volumetric heat capacity
(J m-3 K-1 x 10⁸)
Thermal conductivity
(W m-1 K-1)
Thermal diffusivity
(m2 s-1) x 10-6
Thermal admittance
(J m-2 s-0.5 K-1)
Asphalt 2.11 0.92 1.94 0.75 0.38 1,205 Concrete Gas concrete 0.32 0.88 0.28 0.08 0.29 150
Dense 2.40 0.88 2.11 1.51 0.72 1,785 Natural stone 2.68 0.84 2.25 2.19 4.93 2,220 Brick Average 1.83 0.75 1.37 0.83 0.61 1,065 Adobe Average 1.92 0.92 1.77 0.84 0.47 1,220 Wood Soft 0.32 1.42 0.45 0.09 0.20 200
Hard 0.81 1.88 1.52 0.19 0.13 535 Steel 7.85 0.50 3.93 53.3 13.6 14,475 Glass 2.48 0.67 1.66 0.74 0.44 1,110 Plaster-board Average 1.42 1.05 1.49 0.27 0.18 635 Insulation material Poly-styrene 0.02 0.88 0.02 0.03 1.50 25
Cork 0.16 1.80 0.29 0.05 0.17 120 Loamy soil (40% pore space)
Dry 1.60 0.89 1.42 0.25 0.18 600 Saturated 2.00 1.55 3.10 1.58 0.51 2,210
Water 4 °C unmoved 1.00 4.18 4.18 0.57 0.14 1,545 Air 10 °C unmoved 0.0012 1.01 0.0012 0.025 20.5 5
Turbulent 0.0012 1.01 0.0012 ≈ 125 10 . 106 390
a) Properties of all unities are temperature dependent.
4.3 Anthropogenic heat
Anthropogenic heat represents the heat generated from stationary and mobile sources in an area. This com-ponent has been modeled as the sum of heat generated by the buildings, vehicles and people (Sailor and Lu, 2004; Grimmond, 1992), or as the residual of other terms (Christen and Vogt, 2004). Table 9 shows that the reported values vary greatly. Christen and Vogt (2004) reported an annual average anthropogenic heat production of 5 - 20 W m-2 for Basel (Switzerland) while Offerle et al. (2005) and Steinecke (1999) found values of 32 and 35 Wm-2 for Lodz (Poland) and Reykjavik (Iceland), respectively. For six large cities in the USA, Sailor and Lu (2004) reported an average anthropogenic heat production of 60 W m-2 in the summer and 75 W m-2 in the winter. Very high values have been reported for Tokyo (Japan). For the most densely populated and energy intensive urban regions in Tokyo, Ichinose et al. (1999) found anthropogenic heat productions as high as 400 W m-2 in the summer and up to 1590 W m-2 in the winter. It can be concluded that depending on the area and its energy use anthropogenic heat production could be significant or negligible and it could have varying diurnal, seasonal or even weekly trends (Taha, 1997; Offerle et al., 2006). Table 9
Responses anthropogenic heats in various parts of the world.
City Reported anthropogenic heat (W m-2) Reference
Basel, Switzerland 5 - 20 Christen and Vogt, 2004 Lodz, Poland 32 Offerle et al., 2005 Reykjavik, Iceland 35 Steinecke, 1999 USA 60 - 75 Sailor and Lu, 2004 Tokyo, Japan 200 - 1590 Ichinose et al., 1999

Alterra report 2170 33
5 Assessment of UHI intensity in the Netherlands
With the exception of a study carried out in 1969-1970 on the UHI effect of Utrecht (Conrads, 1975) and a recent study to assess the long term validity of KNMI temperature time series (Brandsma et al., 2003), no systematic meteorological data records for towns and cities are available. In this chapter, we make an up-to-date assessment of the magnitude of the current UHI-intensity in urban areas in the Netherlands. This assess-ment is based upon new meteorological measurements in the urban canopy of Rotterdam and Arnhem, and on datasets provided by hobby meteorologists. 5.1 Measurements in Rotterdam
In the city of Rotterdam, different types of meteorological observations have been performed, linking the various spatial urban scales, as part of the 'Heat Stress in the city of Rotterdam' project (HSRR05, 1st phase Knowledge for Climate Program). The micro climates of different neighbourhoods have been characterized by mobile traverse measurements, in combination with in situ measurements. The microclimate observations are used for process understanding, for verification of airborne and satellite thermo graphic images, and to parameterize and validate simulation models for urban climate. 5.1.1 Mobile traverse measurements
In August 2009, the UHI intensity of Rotterdam was mapped for the first time. The measurements were performed using two cargo bicycles as a mobile platform, equipped specifically for urban meteorological measurements (Figure 6). The cargo bicycles allow manoeuvring easily through the narrow streets in the city. As such, the magnitude and range of effect of typical neighbourhood and street features on microclimate could be assessed. The cargo bikes are equipped with a thermometer, a humidity sensor, a 2-dimensional sonic anemometer and a set of radiation sensors to measure solar radiation and infrared radiation exchange from six directions. The data are recorded at 1 Hz, and connected with concurrent readings from a GPS device. The instruments are powered by a solar panel mounted on the baggage carrier. Measurements were performed along two previously determined routes through a number of characteristic urban districts, including an industrial area, an older residential area, a city park and the harbour area (Figure 7). The routes were photographed at fixed intervals from 50 cm above the ground with a fisheye lens pointing upwards to determine the Sky View Factor (SVF). The observations were carried out during four 1-2h time intervals on 6 August 2009, a warm day with a maximum temperature of nearly 30 °C. Data from the traverse measurements were compared with

34 Alterra report 2170
recordings from Zestienhoven (Rotterdam Airport), a nearby synoptic KNMI2 weather station in the urban area, north of Rotterdam.
Figure 6
Cargo bicycle equipped specifically for urban meteorological measurements (photo: Bert Heusinkveld).
Figure 7
Differences between the nocturnal air temperatures measured with the cargo bicycle and those measured at the reference station,
airport Zestienhoven (∆Tair = Tbicycle - Tr) along the north and south traverse route (Heusinkveld et al., 2010).
2 Royal Netherlands Meteorological Institute.

Alterra report 2170 35
In the early afternoon (14 - 16 LT), air temperatures in densely built areas in Rotterdam were 1-2 K higher than the temperatures measured at Zestienhoven (29.6 °C). In contrast, large differences were measured during the late evening (22 - 24 LT). The air temperature of the city centre was about 5 °C higher than Rotterdam airport (21 °C) and the difference between the city and countryside amounted to more than 7 °C during nocturnal hours. The results clearly demonstrate the existence of a considerable UHI in the city of Rotterdam. 5.1.2 In situ measurements
Since September 2009 in situ measurements have been performed with a small measuring network consisting of four Automatic Weather Stations: three of them are located in the urban area and one in the rural area, north of Rotterdam (i.e. the reference station). The characteristics of the locations are given in Table 10. The measurements are performed for a long-term period (>1 year), allowing sampling during a variety of weather conditions. In addition, the influence of the surrounding built environment can be assessed. The observations are available on line: www.climatexchange.nl/sites/rotterdam/index.htm
Table10
Characteristics of the monitoring sites in the city of Rotterdam and that of the rural, reference site according to the Urban Climate
Zone (UCZ) classification of Oke (2006).
Location Lat/Lon Description Roughness class
Aspect ratio
% built UCZ
City centre 51°55'24.18'N 4°28'10.35'O
Intensely developed urban area with detached close-set high-rise buildings
8 >2 >90 1
South 51°53'16.59'N 4°29'17.83'O
Intensely developed high density urban area with 2 - 5 storey, attached or very close-set buildings often of brick or stone
7 1.0-2.5 >85 2
East 51°55'31.41'N 4°32'54.13'O
Highly developed, low or medium density urban with row or detached but close-set houses, stores and apartments e.g. urban housing
7 0.5-1.5 70-85 3
Rural site 51°58'55.17'N 4°25'45.31'O
Scattered houses in agricultural area 4 >0.05 <10 7
UHI intensity was largest during the summer months (JJA). However, in contrast, only a small or no UHI effect was found in the winter period (DJF). Figure 8 shows the diurnal variation in air temperature and UHI intensity for a period with high daily temperatures. The maximum UHI intensity (UHImax) is reached during the evening hours, and a minimum or sometimes even negative difference is observed after sunrise. This diurnal variation in UHI is often observed in summer. On 27-29 June, a significant cooling in the rural area after sunset occurs resulting into large nocturnal UHI intensities for the city centre and south. On 2-3 July, nocturnal UHI intensities are smaller due to a significantly smaller cooling in the rural area.

36 Alterra report 2170
Figure 8
Upper panel: Air temperatures at the three measurement sites in Rotterdam and in the rural (reference) site for
the period 27 June to 4 July 2010, lower panel: air temperature differences between the urban sites and the rural site.
From all determined half-hourly values of UHI intensity for the summer period, the median and 95 percentile values were calculated. The same was done for the determined UHImax values. The result is shown in Table 11. Temperature differences between the urban and rural area are substantial. The location City Centre shows the largest UHI intensity followed by the locations South and East Rotterdam, respectively. Table 11
Median and 95 percentile values (95P) for half -hourly mean values of UHI intensity and for UHImax values for the summer of 2010
(JJA), for the monitoring locations Rotterdam City centre, East and South .
Location/coordinates UHI UHImax1
median 95P median 95P
City centre 1.4 5.9 4.7 7.9 East 0.6 3.2 3.2 4.8 South 1.3 5.1 4.5 6.9
1 One value per day (N=93).
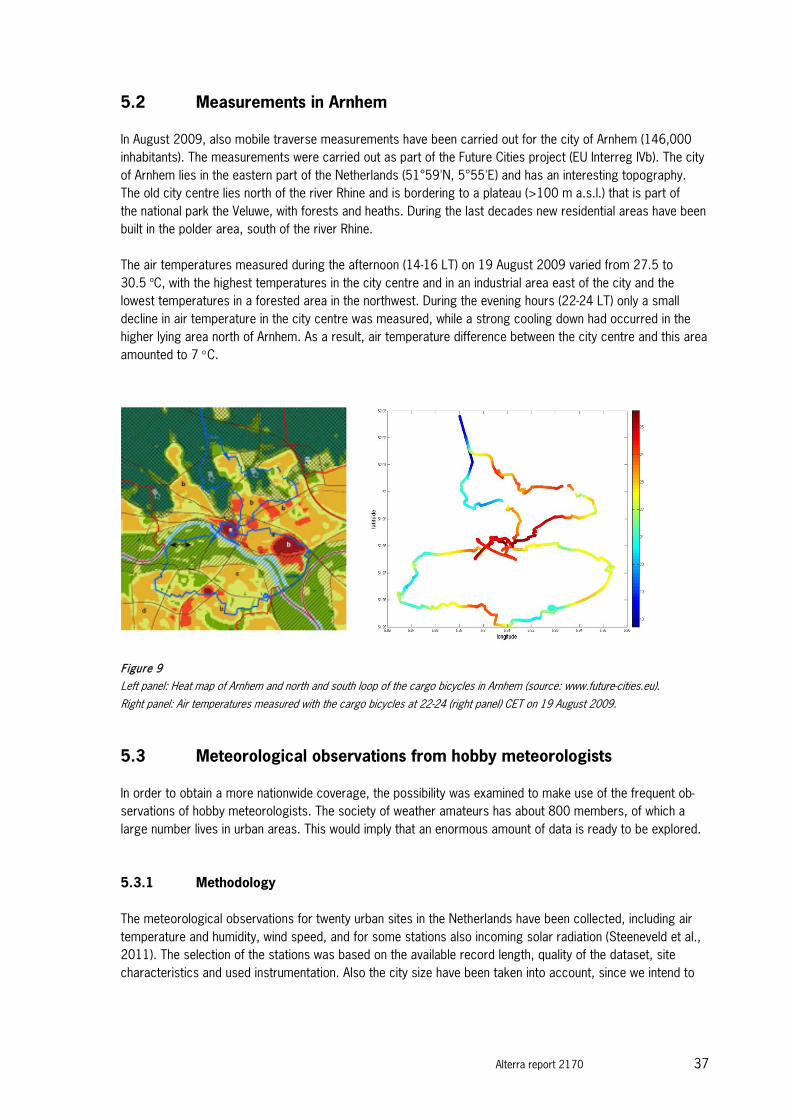
Alterra report 2170 37
5.2 Measurements in Arnhem
In August 2009, also mobile traverse measurements have been carried out for the city of Arnhem (146,000 inhabitants). The measurements were carried out as part of the Future Cities project (EU Interreg IVb). The city of Arnhem lies in the eastern part of the Netherlands (51°59'N, 5°55'E) and has an interesting topography. The old city centre lies north of the river Rhine and is bordering to a plateau (>100 m a.s.l.) that is part of the national park the Veluwe, with forests and heaths. During the last decades new residential areas have been built in the polder area, south of the river Rhine. The air temperatures measured during the afternoon (14-16 LT) on 19 August 2009 varied from 27.5 to 30.5 oC, with the highest temperatures in the city centre and in an industrial area east of the city and the lowest temperatures in a forested area in the northwest. During the evening hours (22-24 LT) only a small decline in air temperature in the city centre was measured, while a strong cooling down had occurred in the higher lying area north of Arnhem. As a result, air temperature difference between the city centre and this area amounted to 7 °C.
Figure 9
Left panel: Heat map of Arnhem and north and south loop of the cargo bicycles in Arnhem (source: www.future-cities.eu).
Right panel: Air temperatures measured with the cargo bicycles at 22-24 (right panel) CET on 19 August 2009.
5.3 Meteorological observations from hobby meteorologists
In order to obtain a more nationwide coverage, the possibility was examined to make use of the frequent ob-servations of hobby meteorologists. The society of weather amateurs has about 800 members, of which a large number lives in urban areas. This would imply that an enormous amount of data is ready to be explored. 5.3.1 Methodology
The meteorological observations for twenty urban sites in the Netherlands have been collected, including air temperature and humidity, wind speed, and for some stations also incoming solar radiation (Steeneveld et al., 2011). The selection of the stations was based on the available record length, quality of the dataset, site characteristics and used instrumentation. Also the city size have been taken into account, since we intend to

38 Alterra report 2170
cover the range of large cities (106 inhabitants) to small villages (103 inhabitants). Of each urban station, a description of the surroundings was made including (Google) maps at the meso to micro scale, photographs taken from cardinal directions of the instrument enclosure and of other instrument locations and towers. Also we noted aspects as shadowing of the sensors, surrounding distance to the closest object, sensor height and placement, ventilation of the weather station and instrument type and trademark. Furthermore, details on calibration and maintenance of the instruments have been noted. Figure 10 shows the geographical locations of the urban weather stations. A summary of the urban site properties is given in Table 12.
Figure 10
Locations of the urban weather stations.
Figure 10 shows that the selected stations cover the northern part of the country rather well, but long-term observations are lacking in the south. On the other hand the majority of the largest cities in the western part, i.e. Rotterdam, Delft, The Hague (and its suburbs), Leiden, Haarlem have been included. In order to detect the UHI, each urban station has been coupled to meteorological observations at the closest KNMI (Dutch weather service) rural station. The UHI has been determined as the city air temperature minus the rural air temperature at screen level, and has been recorded based on hourly data. The urban areas where the measuring stations are located, are classified according to a simplified classifica-tion system, the Urban Climate Zone (UCZ), developed by Oke (2006) (see Appendix A). Note that this classi-fication is different from that applied by Watkins (2002). To determine the UCZ of a distinct urban area, the source area or foot print of the sensors has been determined according to an adapted method of Schuepp et al. (1990).

Alterra report 2170 39
Table 12
Characteristics of the locations of the urban weather stations (B/G/W - % built environment/%-green/%-water; UCZ - Urban Climate
Zone class (Oke, 2006).
Urban station Lat Lon
Pop. (x103)
Rural station Start End B/G/W UCZ
1 Apeldoorn 52.200 5.933
160 Deelen 01/2008 06/2009 60/40/0 5
2 Assen 53.01 6.568
65 Eelde 01/2007 03/2009 85/15/0 3
3 Damwoude 53.291 5.978
5.5 Leeuwarden AP 01/2005 04/2009 35/65/0 5-7
4 Delft 51.98 4.34
97 Rotterdam AP 01/2007 03/2009 90/10/0 2-3
5 Doornenburg 51.890 6.00
2.7 Deelen 01/2009 06/2009 55/45/0 5
6 Groningen 53.216 6.567
198 Eelde 01/1999 03/2009 85/15/0 3
7 Haarlem 52.37 4.66
149 Schiphol 12/2005 02/2008 75/25/0 3
8 Heemskerk 52.499 4.683
39 Schiphol 01/2005 12/2005 80/20/0 3
9 Heerhugowaard 52.670 4.847
50 Berkhout 01/2005 04/2009 65/35/0 3-5
10 Houten 52.033 5.166
47 De Bilt 07/2006 04/2009 80/20/0 3
11 IJsselmuiden 52.570 5.928
12 Heino 07/2005 07/2009 75/25/0 3
12 Leeuwarden 53.206 5.81
94 Leeuwarden AP 01/2007 03/2009 40/60/0 3-5
13 Leiden 52.162 4.540
117 Valkenburg 03/2004 03/2009 50/35/15 3
14 Losser 52.255 7.00
23 Twente 01/2003 12/2008 60/40/0 3-5
15 Purmerend 52.49 4.93
79 Berkhout 01/2008 03/2009 80/20/0 3
16 Rotterdam 51.917 4.43
588 Rotterdam AP 12/2007 03/2009 75/20/5 2-3
17 Voorburg 52.08 4.35
40 Rotterdam AP 01/2006 12/2008 85/15/0 2
18 The Hague 52.04 4.24
483 Valkenburg 07/2007 04/2009 70/20/10 3-5
19 Wageningen 51.97 5.67
35 Wageningen UR 01/2008 03/2009 55/45/0 3-5
5.3.2 Preliminary results
Most urban weather stations are located outside the city centres and Table 12 shows that the source area of 15 out of 19 stations can be classified as UCZ ≥3 (Oke, 2006). The urban cover ranges from 35 to 90%. With a few exceptions, the weather stations are located in gardens and are well ventilated and shielded. This would imply that the reported air temperatures by the hobby meteo-rologists are lower than can be found in more densely developed city centres with UCZ classification of 1-2. For almost all stations the maximum UHI intensity is reached in the late afternoon and evening, whereas it is very low or even negative during the early morning hours (6 - 8 am).

40 Alterra report 2170
The highest UHI intensities are determined under clear skies and with little wind. Also, UHI intensity increases with the daily maximum air temperature. Furthermore, there is a seasonal effect (results not presented here): in May, June and July, the months with the largest sun radiation received by the Earth surface, UHImax values are larger than in November, December and January, the months with the lowest sun radiation. Above results are in accordance with those reported by Oke (1982) and with our own results obtained for Rotterdam and Arnhem. Table 13 shows the median values and the 95 percentile values of the UHImax in a diurnal cycle for the settlements. Large median and 95 percentile UHImax values are obtained for Rotterdam despite its location close to the coast. However, it should be noted that also for a small, more inland located settlement as Losser, relatively large median and 95P UHImax values are obtained.
Table 13
Median and 95 percentile (95P) values for the maximum urban heat island intensity (UHImax) in a diurnal cycle.
City Number of inhabitants (x1000)
UCZ1 UHImax
median 95P
1 Apeldoorn 160 5 2.9 6.2 2 Assen 65 3 1.8 4.0 3 Damwoude 5.5 5-7 1.3 3.2 4 Delft 97 2-3 1.7 4.8 5 Doornenburg 2.7 5 2.6 5.7 6 Groningen 198 3 1.5 3.1 7 Haarlem 149 3 2.5 5.7 8 Heemskerk 39 3 2.8 5.9 9 Heerhugowaard 50 3-5 2.4 6.2 10 Houten 47 3 1.2 3.0 11 IJsselmuiden 12 3 3.1 6.8 12 Leeuwarden 94 3-5 1.1 3.0 13 Leiden 117 3 3.2 5.6 14 Losser 23 3-5 2.9 6.8 15 Purmerend 79 3 2.5 4.6 16 Rotterdam 588 2-3 3.4 9.8 17 The Hague 483 3-5 2.2 5.3 18 Voorburg 40 2 2.4 5.6 19 Wageningen 35 3-5 2.4 5.6
5.4 Comparison between Dutch cities and other European cities
In Figure 11 the UHImax values reported in the literature for European cities and those found in the present study for Dutch cities have been plotted against the logarithm of population (log(P)). It can be concluded that the UHImax values assessed for Dutch cities are substantial and of the same order of magnitude as those found for other European cities. The UHImax values assessed from the weather amateur data might even be under-estimations, since most urban weather stations are located outside the city centre. From the in situ measure-ments in Rotterdam it can be derived that the difference in UHImax between city centre and a residential area classified as UCZ = 3 may be 1 - 2 °C. Similar differences have been mentioned by others (Unger, 2004; Ohashi et al., 2009). However, no significant relationship between UHImax and log(P) could be assessed. Even small settlements such as Losser and Doornenburg appear to have relatively large UHImax values. This suggests that other factors such

Alterra report 2170 41
as population density and and/or city district or neighbourhood characteristics may be more important in determining the magnitude of the UHI intensity.
Figure 11
UHImax (95 percentile values, in K) for Dutch cities compared with UHImax values reported for European cities. Dashed lines are
the linear regression lines calculated for the results of Oke (1973), for literature results 1987-2006 respectively (see Table 3),
and for Dutch cities (Table 13).
5.5 Future projections
Climate-change projections suggest that European summer heat waves will become more frequent and severe during this century, consistent with the observed trend of the past decades (Fischer and Schär, 2010). This will also be true for the Netherlands (Van den Hurk et al., 2006). The UHI effect will exacerbate the effect of regional warming by increasing summer temperatures in urban areas relative to outlying rural districts. In addition, urbanization in the Netherlands will continue in next decades. Future projections show a large expansion of the urban landscape in the next decades, up to 20% depending on the scenario applied (Nijs et al., 2002; MNP, 2002). So-called hot spots are: the western part of the country, i.e. around Amsterdam, Utrecht, The Hague and Rotterdam, the region Arnhem-Nijmegen and the region Eindhoven. Urban extension in these regions will lead to the formation of large agglomerations of more than one million people. Undoubtedly, this will cause a further increase in the magnitude of the UHI intensity. Moreover, this increase may be even more intense, because many isolated and growing urban clusters will start to influence each other. It can be concluded that considering future developments in climate and urbanization, outdoor thermal comfort and heat stress will likely become a critical issue in many urban areas in the Netherlands.

42 Alterra report 2170

Alterra report 2170 43
6 Conclusions
– Meteorological observations indicate that UHImax values for Dutch cities are substantial and of the same order of magnitude as those reported for other European cities.
– No clear effect of city size, defined as the logarithmic value of the number of inhabitants, on UHI intensity could be assessed confirming that other factors such as population density and and/or city district or neighbourhood characteristics may be more important in determining the magnitude of the UHI intensity.
– Considering future developments in climate and urbanization, thermal comfort and heat stress will likely become a critical issue in many urban areas in the Netherlands.
– Observational studies show that urban typology has a significant effect on UHI intensity. The UHI effect is
high in residential areas with no shading, no wind and no space for trees. This city configuration is commonly found in the central areas of north-European cities.
– The cooling effect of vegetation has been reported in many cities. In principle, all vegetation reduces the air temperature, provided that the water supply is sufficient to match the evapotranspiration rate. In the long term, trees may be more effective than grass during hot dry days; they prevent excess water loss by a more efficient regulation of the transpiration rate by their stomates. For small parks (<3 ha), the cooling effect of ∼ 1 K have been reported that is mostly limited to the park area itself. Large parks (>10 ha) are cooler and also may have a notable cooling effect on the surrounding built environment. The impact of specific greening interventions on the wider urban area has yet to be demonstrated. The current evidence does not allow specific recommendations to be made on how best to incorporate greening into an urban area. Further empirical research on the influence of size, structure, distribution, and type of greening is necessary in order to efficiently guide the design and planning of urban green space. In addition, it is important to know how people use and perceive urban green elements and value their impact on thermal comfort.
– Little quantitative information is available on the effect range of water bodies in urban areas on the surrounding built environment and on the cooling efficiency during a prolonged warm period.
– Urban geometry is probably a major factor determining microclimate differences within a city. A decrease
in SVF (or increase in H/W ratio) is inherently associated with an increase in UHI intensity of an urban area. However, more recent reported results on the relationship between SVF and nocturnal air temperature are less clear. More observational data for different categories of urban geometry are needed to obtain useful relationships between UHI intensity and SVF.
– Radiative and thermal properties have an important influence on the UHI intensity. For thin materials like roofing, reflectance (albedo) and emissivity are the main properties to consider, as the heat capacity is low. For thicker materials like pavements and buildings, both radiative and thermal properties have to be taken into account. However, because of the complexity of urban surfaces, the effect of surface properties on UHI intensity is difficult to quantify.

44 Alterra report 2170

Alterra report 2170 45
References
Alcoforado, M.-J. and H. Andrade, 2006. Nocturnal urban heat island in Lisbon (Portugal): main features and modelling attempts. Theor. Appl. Climatol. 84, pp. 151-159. DOI 10.1007/s00704-005-0152-1. Arnfield, A.J., 2003. Two decades of urban climate research: A review of turbulence, exchanges of energy and water, and the urban heat island. International Journal of Climatology 23, pp. 1-26. Best, M.J., 2005. Representing urban areas within operational numerical weather prediction models. Boundary Layer Meteorol. 114, pp. 91-109. doi: 10.1007/s10546-004-4834-5. Blankenstein, S. and W. Kuttler, 2004. Impact of street geometry on downward longwave radiation and air temperature in an urban environment. Meteorologische Zeitschrift 15, pp. 373-379. Bonacquisti ,V., G.R. Casale, S. Palmieri and A.M. Siani, 2006. A canopy layer model and its application to Rome. Science of the Total Environment 364, pp. 1-13. Bottyán, Z., and J. Unger, 2003. A multiple linear statistical model for estimating mean maximum urban heat island. Theor. Appl Climatol 75, pp. 233-243. Bowler, D.E., L. Buyung-Ali, T.M. Knight and A.S. Pullin, 2010. Urban greening top cool towns and cities: A systematic review of the empirical evidence. Landscape Urban Planning 97, pp. 147-155. Brandsma, T., G.P. Können and H.R.A. Wessels, 2003. Empirical estimation of the effect of urban heat advection on the temperature series of De Bilt (The Netherlands), Int. J. Clim. 23, pp. 829-845. Brandsma, T., 2010. Warmte-eilandeffect van de stad Utrecht. Zenit, pp. 500-504. Bretz, S., H. Akbari and A. Rosenfeld, 1998. Practical issues for using solar-reflective materials to mitigate urban heat islands. Atmospheric Environment 32 (1), pp. 95-101. 199S Chang, C.R., M.H. Li and S.D. Chang, 2007. A preliminary study on the local cool-island intensity of Taipeh city parks. Landscape Urban Planning 80, pp. 386-395. Chapman, L., J.E. Thornes and A.V. Bradley, 2001. Rapid determination of canyon geometry parameters for use in surface radiation budgets. Theor Appl Climatol 69, pp. 81-89. Chapman, L., J.E. Thornes and A.D. Bradley, 2002. Sky-view factor approximation using GPS receivers. Int. J. Climatol. 22, pp. 615-621. Chen, J.M., and T.A. Black, 1991. Measuring leaf area index of plant canopies with branch architecture. Agric. For. Meteorol. 57, pp. 1-12. Chen, Y. and N.H. Wong, 2006. Thermal benefits of city parks. Energy and Buildings 38, pp. 105-120.

46 Alterra report 2170
Christen, A and R. Vogt, 2004. Energy and radiation balance of a central European city. International Journal of Climatology 24, pp. 1395-1421. Conrads, L.A., 1975. Observations of meteorological urban effects. The heat island of Utrecht. PhD thesis University Utrecht. 84 p. EEA, 2008. Impacts of Europe's changing climate -2008 indicator-based assessment. Joint EEA-JRC-WHO report no 4. ISSN 1725-9177. 246 p. Eliasson, I., 1996. Urban nocturnal temperatures, street geometry and land use. Atmospheric Environment 30, pp. 379-392. Ek, M.B., K.E. Mitchell, Y. Lin, E. Rogers, P. Grunmann, V. Koren, G. Gayno and D. Tarpley, 2003. Implemen-tation of the Noah land surface model advances in the National Centers for Environmental Prediction operational mesoscale Eta model. J. Geophys. Res., 108 (D22), 8851, doi:10.1029/2002JD003296, 2003. Fischer, E.M. and C. Schär, 2010. Consistent geographical patterns of changes in high-impact European heatwaves. Nature Geoscience 1 - 6. Fukuoka, Y., 1983. Physical climatological discussion on causal factors of urban temperature. Memoirs Faculty Integrated Arts and Sciences, Hiroshima University 8, pp. 157-178. Gedzelman, S.D., S. Austin, R. Cermak, N. Stefano, S. Partridge, S. Quesenberry, and D. A. Robinson, 2003. Mesoscale aspects of the Urban Heat Island around New York City. Theor. Appl. Climatol., 75, pp. 29-42. Doi: 10.1007/s00704-002-0724-2 Gill, S.E., J.F. Handley, A.R. Ennos and S. Pauleit, 2007. Adapting cities for climate change: the role of the green infrastructure. Built Environment 33(1), pp. 115-133. Giridharan, R., S. Ganesan and S.S.Y. Lau, 2004. Daytime urban heat island effect in high-rise and high-density residential developments in Hong Kong. Energy and Buildings 36, pp. 525-534. Giridharan, R., S.S.Y. Lau and S. Ganesan, 2005. Nocturnal heat island effect in urban residential develop-ments of Hong Kong. Energy and Buildings 37, pp. 964-971. Grimmond, C.S.B., 1992. The suburban energy balance: Methodological considerations and results for a mid latitude west coast city under winter and spring conditions. International Journal of Climatology 12, pp. 481-497. Grimmond, C.S.B., S.K. Potter, H.N. Zutter and C. Souch, 2001. Rapid methods to estimate sky-view factors applied to urban areas. Int J Climatol 21, pp. 903-913. Haines, A., R.S. Kovats, D. Campbell-Lendrum and C. Corvalan, 2006. Climate change and human health: impacts, vulnerability and public health. Lancet 367, pp. 2101-2109. Hayhoe, K., D. Cayan, C.B. Field, P.C. Frumhoff, E.P. Maurer, N.L. Miller, S.C. Moser, S.H. Schneider, K.N. Cahill, E.E. Cleland, L. Dale, R. Drapek, R.M. Hanemann, L.S. Kalkstein, J. Lenihan, C.K. Lunch, R.P. Neilson, S.C. Sheridan and J.H. Verville, 2004. Emission pathways, climate change, and impacts on California. PNAS, 101 (34), pp. 12422 - 12427.
Alterra report 2170 47
Hawkins, T.W.B., A.J. Stefanov, W.L. Bigler, WL, Saffell EM. 2004. The role of rural variability in Urban Heat Island determination for Phoenix, Arizona. Journal of Applied Meteorology 43, pp. 476-486. Heusinkveld, B.G., L.W.A. van Hove, C.M.J. Jacobs, G.J. Steeneveld, J.A. Elbers, E.J. Moors, A.A.M. Holtslag 2010. Use of a mobile platform for assessing urban heat stress in Rotterdam. Proceedings of the 7the Conference on Biometeorology. Albert-Ludwigs-University of Freiburg, Germany, 12-14 April 2010. 433-438. http://www.meteo.uni-freiburg.de/forschung/publikatione/berichte/index.html. Hove, B. van, G.-J. Steeneveld, C. Jacobs, H. ter Maat, B. Heusinkveld, J. Elbers, E. Moors and B. Holtslag, 2010. Modelling and observing urban climate in the Netherlands. KvR 020/10. ISBN 978-90-8815-020-3. Hurk, B. van den, A. Klein Tank, G. Lenderink, A. van Ulden, G. J. van Oldenborgh, C. Katsman, H. van den Brink, F. Keller, J. Bessembinder, G. Burgers, G. Komen, W. Hazeleger and S. Drijfhout, 2006. KNMI Climate Change Scenarios 2006 for the Netherlands. KNMI Scientific Report WR 2006-01 Hulme, M., G. Jenkins, X. Lu, J. Turnpenny, T. Mitchell, R. Jones, J. Lowe, J., Murphy, D. Hassell, P. Boorman, R. McDonald and S. Hill, 2002. Climate Change Scenarios for the United Kingdom: The UKCIP02 Scientific Report. Norwich: Tyndall Centre for Climate Change Research, School of Environmental Sciences, University of East Anglia. Hupfer, P. and W. Kuttler, 1998. Witterung und Klima. 10. Aufl. B.G. Teubner, Stuttgart, Leipzig 413. Ichinose, T., K. Shimodozono and K. Hanaki, 1999. Impact of anthropogenic heat on urban climate in Tokyo. Atmospheric Environment 33, pp. 3897-3909. Jauregui, E., 1997. Heat island development in Mexico City. Atmospheric Environment 31, pp. 3821-3831. Kim, Y. and J. Baik, 2002. Maximum urban heat island intensity in Seoul. Journal of Applied Meteorology 41, pp. 651-659. Kim, Y. and J. Baik, 2004. Daily maximum urban heat island intensity in large cities of Korea. Theoretical and Applied Climatology 79, pp. 151-164. Kim, Y., and J. Baik, 2005. Spatial and temporal structure of the urban heat island in Seoul. Journal of Applied Meteorology 44, pp. 591-605. Klysik, K. and K. Fortuniak, 1999. Temporal and spatial characteristics of the urban heat island of Lodz, Poland. Atmospheric Environment 33, pp. 3885-3895. Kolokotroni, M, I. Giannitsaris and R. Watkins, 2006. The effect of the London Urban Heat Island on building summer cooling demand and night ventilation strategies. Solar Energy 80(4), pp. 383-392. Kolokotronim, M. and R. Giridharan, 2008. Urban heat island intensity in London: An investigation of the impact of physical characteristics on changes in outdoor air temperature during summer. Solar Energy 82, pp. 986-998. Koopmans, S., 2010. First assessment of the urban heat island in the Netherlands. Exploring urban heat and heat stress in the Netherlands, using observations from hobby meteorologists. BSc Thesis Wageningen University. 35 p.
48 Alterra report 2170
Kovats, R.S. and S. Hajat, 2008. Heat stress and public health: a critical review. Annual Review of Public Health 29, 41-55. Lemonsu, A. and V. Masson, 2002. Simulation of a summer urban breeze over Paris. Boundary-Layer Meteorology 104, pp. 463-490. Livada, I., M. Santamouris, K. Niachou, N. Papanikolaou and G. Mihalakou, 2002. Determination of places in the great Athens area where the heat island effect is observed. Theor. App. Climatol. 71, pp. 219-230. Masson, V, C.S.B. Grimmond and T.R. Oke, 2002. Evaluation of the town energy balance (TEB) scheme with direct measurements from dry districts in two cities. Journal of Applied Meteorology 41, pp. 1011-1026. Masson, V., 2006. Urban surface modeling and the meso-scale impact of cities. Theor.Appl.Climatol. 84, pp. 35-45, doi: 10.1007/s00704-005-0142-3. Matzarakis. A., F. Rutz and H. Mayer, 2007. Modelling radiation fluxes in simple and complex environments-application of the RayMan model. Int J Biometeorol 51, pp. 323-334. Mayer, H. and P. Höppe, 1987. Thermal comfort of man in different urban environments. Theor. App. Climatol. 38, pp. 43-49. Memon, R.A., D.Y.C. Leung and C.-H. Liu, 2009. An investigation of urban heat island intensity (UHII) as an indicator of urban heating. Atmospheric Research 94, pp. 491-500. McCarthy, M.P., M.J. Best, R.A. Betts, 2010. Climate change in cities due to global warming and urban effects. Geophys. Res. Lett. 37, L09705, doi: 10.1029/2010GL042845. Montavez, J.P., A, Rodriguez and J.I. Jimenez, 2000. A study of the urban heat island of Granada. International Journal of Climatology 20, pp. 899-911. Montávez, J.P., J.F. González-Rouco and F. Valero, 2008. A simple model for estimating the maximum intensity of nocturnal urban heat island. International Journal of Climatology 28, pp. 235-242. Moreno-Garcia, M.C., 1994. Intensity and form of the urban heat island in Barcelona. International Journal of Climatology 14, pp. 705-710 Morris, C.J.G, I. Simmonds and N. Plummer, 2001. Quantification of influences of wind and cloud on the nocturnal urban heat island of a large city. Journal of Applied Meteorology 40, pp. 169-182. Nijs, T. de, L. Crommentuijn, H. Farjon, H. Leneman, W. Ligtvoet, W. de Niet en K. Schotten, 2002. Vier scenario's van het landgebruik in 2030. Achtergrondrapport bij de Nationale Natuurverkenning 2, RIVM rapport 408764003, RIVM, Bilthoven. Nishimura, N, T. Nomura, H. Iyota and S. Kimoto, 1998. Novel water facilities for creation of comfortable urban meteorology. Solar Energy 64, Nos 4-6, pp. 197-207. Offerle , B., C.S.B. Grimmond and K. Fortuniak, 2005. Heat storage and anthropogenic heat flux in relation to the energy balance of a central European city centre. International Journal of Climatology 25, pp. 1405-1419.

Alterra report 2170 49
Offerle, B, C.S.B. Grimmond, K. Fortuniak, K. Klysik and T.R. Oke, 2006. Temporal variations in heat fluxes over a central European City Centre. Theoretical and Applied Climatology 84, pp. 103-11. Oke, T.R., 1973. City size and the urban heat island. Atmospheric Environment 7, pp. 769-779. Oke, T.R., 1981. Canyon geometry and the nocturnal urban heat island: comparison of scale model and field observations. J Climatol 1, pp. 237-254. Oke, T.R., 1982. The energetic basis of the urban heat island. Quarterly Journal of the Royal Meteorological Society 108, pp. 1-24. Oke, T.R., 1987. Boundary layer climates. London, Methuen. Oke, T.R., 1988. The urban energy balance. Progress in Physical Geography 12, pp. 471-508. Oke, T., 1990. Boundary layer climates, 2nd ed. Routledge, London, p. 435. Oke, T, G. Johnson, G, D. Steyn and I. Watson, 1991. Simulation of surface Urban heat island under 'Ideal' conditions. Part 2: diagnosis of causation. Boundary-Layer Meteorology 56, pp. 339-358. Oke, T.R., 1997. Urban environments. In Surface Climates of Canada, Bailey, W.G., T.R. Oke and W.R. Rouse, eds., McGill-Queen's University Press, Montréal, pp. 303-327. Oke, T.R., 2006. Initial guidance to obtain representative meteorological observations at urban sites. Instruments and observing methods, no. 81. Canada. World Meteorological Organization. Oleson, K.W., G.B. Bonan, J. Feddema and M. Vertenstein, 2008. An urban parameterization for a global climate model. 2. Sensitivity to input parameters and the simulated urban heat island in offline simulations. J. Appl. Meteorol. Climatol. 47, pp. 1061-1076, doi: 10.1175/2007JAMC1598.1. Oleson, K.W., G.B. Bonan and J. Feddema, 2010. The effects of white roofs on urban temperature in a global climate model. Geophys. Res. Lett. 37, L03701, doi:10.1029/2009GL042194. Park, H.-S.,1986. Features of the heat island in Seoul and its surrounding cities. Atmospheric Environment 20, pp. 1859-1866. Park, H.S.,1987. Variations in the urban heat island intensity affected by geographical environments. Environmental Research Center Papers 11, The University of Tsukuba, Ibaraki. Parker, D.E., 2004. Large-scale warming is not urban. Nature 432, p. 290. Parker, D.E., 2006. A Demonstration That Large-Scale Warming Is Not Urban. J. of Climate 19, pp. 2882-2895. Ratti, C. and P. Richens, Raster analysis of urban form. Environment and Planning B: Planning and Design 31(2), pp. 297-309. Roth, M., 2007. Review of urban climate research in (sub) tropical regions. Int. J. Climatol. 27, pp. 1859-1873. DOI: 10.1002/joc.1591.

50 Alterra report 2170
Runnalls, K.E. and T.R. Oke, 1998. The urban heat island of Vancouver, BC. Prepr. Second Urban Environment Symposium. November 2.-6. 1998, Albuquerque, USA, American Meteorological Society, pp. 84-87. Runnalls, K.E. and T.R. Oke, 2000. Dynamics and controls of the near-surface heat island of Vancouver, British Columbia. Physical Geography 21, 283-304. Sakakibara, Y., and E. Matsui, 2005. Relation between heat island intensity and city size indices/urban canopy characteristics in settlements of Nagaro Basin, Japan. Geographical review of Japan 78(12), pp. 812-824. Sailor, D.J., 1995. Simulated urban climate response to modifications in surface albedo and vegetative cover. J. Appl. Meteorol. 34, pp. 1694-1704. Sailor, D.J. and L. Lu, 2004. A top-down methodology for developing diurnal and seasonal anthropogenic heating profiles for urban areas. Atmospheric Environment, 38, pp. 2737-2748. Schuepp, P.H., M.Y. Leclerc, J.I. Macpherson and R.L. Desjardins, 1990. Footprint prediction of scalar fluxes from analytical solution of the diffusion equation. Boundary-Layer Meteorology 50, pp. 355-373. Shahgedanova, M,. T.P. Burt and T.D. Davies, 1997. Some aspects of the three-dimensional heat island in Moscow. Int. J. Climatol. 17, pp. 1451-1465. Steinecke, K, 1999. Urban climatological studies in the Reykjavik subarctic environment, Iceland. Atmospheric Environment 33, pp. 4157-4162. Synnefa, A., A. Dandou, M. Santamouris and M. Tombrou, 2008, On the use of cool materials as a heat island mitigation strategy. J. Appl. Meteorol. Climatol. 47, pp. 2846-2856. doi:10.1175/2008JAMC1830.1. Saitoh, T.S., T. Shimada and H. Hoshi, 1995. Modeling and simulation of the Tokyo urban heat island. Atmospheric Environment 30, pp. 3431-442. Stedman, J.R., 2004. The predicted number of air pollution related deaths in the UK during the August 2003 heat wave. Atmospheric Environment 38, pp. 1083-1085. Steeneveld, G.J., S. Koopmans, B.G. Heusinkveld, L.W.A. van Hove and A.A.M. Holtslag. 2011. Quantifying Urban Heat Island effects and outdoor human comfort in relation to urban morphology by exploring observations from hobby-meteorologists in the Netherlands. Submitted to J. Geophys. Res. Stone. B. Jr., 2007. Urban and rural temperature trends in proximity to large US cities: 1951-2000. Int. J. Climatol. 27, pp. 1801-180. DOI: 10.1002/joc.1555 Suckling, P.W., 1980. The energy balance microclimate of a suburban lawn. Journal of Applied Meteorology 19, pp. 606-608. Svensson, M.K., 2004. Sky view factor analysis - implications for urban air temperature differences. Meteorol. Appl. 11, pp. 201-211. Sugawara, H., K. Narita** and M.S. Kim, 2009. Cooling effect by urban river. The seventh International Conference on Urban Climate, 29 June - 3 July 2009, Yokohama, Japan.

Alterra report 2170 51
Taha, H., 1997. Urban climates and heat islands: Albedo, evapotranspiration, and anthropogenic heat. Energy and Buildings 25, pp. 99-103. Taha, H., St. Konopacki and S. Gabersek, 1999. Impacts of large-scale surface modifications on meteorological conditions and energy use: A 10-region modeling study. Theor. Appl. Climatol. 62, pp. 175-185. doi: 10.1007/s007040050082. Teuling, A.J., S.I. Seneviratne, R. Stöckli, M. Reichstein, E. Moors, Ph. Ciais, S. Luyssaert, B. van den Hurk, Ch. Ammann, Ch. Bernhofer, E. Dellwik, D. Gianelle, B. Gielen, Th. Grünwald, K. Klumpp, L. Montagnani, Ch. Moureaux, M. Sottocornola and G. Wohlfahrt, 2010. Contrasting response of European forest and grassland energy exchange to heatwaves. Nature Geoscience 3, pp. 722-727. Doi: 10.1038/NGEO950. Unger, J., Z. Sümeghy and J. Zoboki, 2001. Temperature cross-section features in an urban area. Atmospheric Research 58, pp. 117-127. Unger, J., 2004. 'Intra-urban relationship between surface geometry and urban heat island: review and new approach' Climate Research 27, pp. 253-264. United Nations, 2007, World Urbanization Prospects: The 2007 Revision, Dep. of Econ. and Soc. Affairs, U.N., New York. (Available at www.un.org/esa/population/publications/wup2007/2007wup.htm). Upmanis, H., 1999. Influence of parks on local climate. Earth Sciences Centre, Göteborg University, A43. Upmanis, H., I. Eliasson and S. Lindquist,1998. The influence of green areas on nocturnal temperatures in a high latitude city (Göteborg, Sweden). Int. J. Climatol. 18, pp. 681-700. Verville, J.H., 2004. Emissions pathways, climate change, and impacts on California. PNAS, vol. 101 (34), pp. 12422-12427. Weverberg, K. van, K. de Ridder and A. van Rompaey, 2008. Modeling the Contribution of the Brussels Heat Island to a Long Temperature Time Series. J.App. Meteor. and Climatol. 47, pp. 976-990. Doi: 10.1175/2007JAMC1482.1 Watkins, R., 2002. The Impact of the Urban Environment on the Energy used for Cooling Buildings. PhD thesis, Brunel University, UK. Watkins, R., J. Palmer and M. Kolokotroni, 2007. Increased temperature and intensification of the urban heat island: implications for human comfort and urban design. Built Environment 33 (1), pp. 85-96. Watson, I. and G. Johnson, 1987. Graphical estimation of sky view-factors in urban environments. J. Climatol. 7, pp. 193-197. Wienert, U. and W. Kuttler, 2005. The dependence of the urban heat island intensity on latitude - a statistical approach. Meteorologische Zeitschrift 14, pp. 677-686. Wilby, R.L., 2003. Past and projected trends in London's urban heat island. Weather, 58(7), pp. 251-260. Wilby, R.L., 2007. A review of climate change impacts on the built environment. Built Environment 33 (1), pp. 31-45.

52 Alterra report 2170
Wilby, R.L., 2008. Constructing climate change scenarios of urban heat island intensity and air quality. Environment and Planning B: Planning and Design 35, pp. 902-919 World Urbanization Prospectus, 2004. Department of Economic and Social Affairs United Nations. Retrieved 20 November 2006. www.un.org/esa/population/ publications/ wup2003/2003WUPHighlights.pdf. Yamashita, S., K. Sekine, M. Shoda, K. Yamashita en Y. Hara, 1986. On relationships between heat island and sky view factor in the cities of Tama river basin. Japan. Atmos. Environ. 20, pp. 681-686. Zmarsly, E., W. Kuttler and H. Pethe, 2002. Meteorologisch-klimatologisches Grundwissen. 2. Aufl. Verlag Eugen Ulmer, Stuttgart, 176.

Alterra report 2170 53
Acknowledgements
The authors acknowledge the hobby meteorologists who provided observations that made this study possible: – K. Piening – F. Bijlsma – M. van Maanen – H. Beek – R. Zwolsman – W. van der Velde – S. Rosdorff – R. Khoe – J. Spruijt – M. van der Hoeven – J. Kruijsen – H. Lankamp – M van der Molen – O. de Zwart – H. van der Heide – M. de Kleer – J. Effing – G. van t Klooster – M. Borgardijn – W. van Dijk – C. Pel – S. Roelvink – M. Peters – M. Gosselink – W. ter Haar Also we thank the Royal Netherlands Meteorological Institute for providing the observations for rural areas. Furthermore, we acknowledge Sytse Koopmans for his contribution to the analysis of the weather amateur data and, last but not least, we would like to thank Janette Bessembinder of the Royal Netherlands Meteorological Institute for guiding this study and for critical reviewing this manuscript.

54 Alterra report 2170

Alterra report 2170 55
Appendix A. Classification table of Oke (2006)

56 Alterra report 2170

Alterra report 2170 57
Appendix B. Maximum UHI intensities of European, North-American, and Asian cities obtained from meteorological observations
Table B.1
UHImax reported by Oke (1973) for European cities
City # inhabitants (x1000) ∆Tmax Reference
London 8500 10.0 Chandler, 1965 Berlin 4200 10.0 Grunow, 1936 Vienna 1870 8.0 Schmidt, 1927 Amsterdam 870 8.7 Conrads, 1975 Munich 822 7.0 Büdel and Wolf, 1933 Sheffield 500 8.0 Garnett and Bach, 1966 Utrecht 276 8.0 Conrads, 1975 Malmö 275 7.4 Lindqvist, 1972 Karlsruhe 160 7.0 Peppler, 1929 Reading 120 4.4 Parry, 1956 Uppsala 63 6.5 Sundborg, 1950 Lund 50 5.8 Lindqvist, 1972
Table B.2
UHImax reported for European cities (1987-2008)
City # inhabitantsx 103 ∆Tmax Approach Reference
Athens 3,203 4.6 Network weather stations Livada et al., 2002 Barcelona 4,795 8.2 Mobile traverse measurements Moreno-Garcia, 1994 Lisbon 600 4.0 Network weather stations Alcoforado and Andrade, 2006 Lodz 850 8.0 Network weather stations Klysik and Fortuniak, 1999 London 8,505 8.6 Network weather stations Kolokonitroni and Giridharan, 2008 Moscow 10,654 9.8 Network air pollution monitoring sites Shahgedanova et al., 1997 Munich 1,263 8.2 Mayer and Höppe, 1987 Paris 9,820 8.0 Modelling + network weather stations Lemonsu and Masson, 2002 Rome 3,328 5.0 Modelling + network weather stations Bonacquisti et al., 2006 Szeged 160 2.6*
3.1* Mobile traverse measurements Unger et al., 2001
Bottyan et al., 2005
* Average UHImax for April-October, not plotted in Figure 2.

58 Alterra report 2170
Table B.3
UHImax reported by Oke (1973) for North-American cities.
City # inhabitants (x1000) ∆Tmax Reference
Montreal, P.Q. 1100 12.0 Oke and East, 1971 Vancouver, B.C 426 10.2 Oke, 1971 San Francisco, Calif. 784 11.1 Duckworth and Sandberg, 1954 Winnipeg, Manitoba 534 11.6 Bell, 1972 Edmonton, Alta. 401 11.5 Daniels, 1965 Hamilton, Ont. 300 9.5 Oke and Hannell, 1970 San Jose, Calif. 101 7.7 Duckworth and Sandberg, 1954 Palo Alto, Calif. 33 6.9 Ibid. Corvallis, Oreg. 21 6.1 Hutcheon et al., 1967
Table B.4
UHImax reported for North-American cities (1998-2004).
City # inhabitants (x1000) ∆Tmax Approach Reference
New York City 8300 8.0 Weather station data Gedzelman et al., 2003 Phoenix, Arizona 1568 12.9 Weather station data Hawkins et al., 2004 Vancouver 578 8.9 1991-1994 data Runnalls and Oke, 1998
Table B.5
UHImax reported by Sakakibara and Matsui (2005) for Japanese cities
City # inhabitants (x1000) ∆Tmax Period
Asahikawa 362 9.0 1998 Koshigaya 292 5.5 1992/1993 Matsumoto 208 6.1 1999/2001 Nozawa & Nakagome 2303 3.8 1998/1999 Iwamurada 13 5.0 1998/1999 Obuse 11.8 5.4 1996/1997 Hakuba 9.6 4.1 2000/2001 Asashina 3.5 2.7 1998/1999 Akaiwa&Tokida 2.2 2.6 1998/1999 Tomono 1.2 1.7 1998/1999 Koundai 0.8 3.2 1998/1999 Nagano 364 8.0 2001/2002 Suzaka 54.1 5.7 2001/2002 Obuse 11.8 4.8 2001/2002 Toyono 10.2 4.4 2001/2002 Wakahowatauchi 6.1 2.5 2001/2002 Wkahokawada 3.5 2.1 2001/2002

Alterra report 2170 59
Table B.5
UHImax reported for Asian cities.
City # inhabitants (x1000) ∆Tmax Reference
Hong Kong 10000 10.5 Memon et al., 2009 Tokyo 8100 8.1 Saitoh et al., 1995
Table B.6
UHImax in 1973 and 2001 reported by Kim and Baik (2004) for South Korean cities.
City # inhabitants (x1000) ∆Tmax Difference
1973 2001 1973 2001
Seoul 6470 10060 3.25 3.40 0.15 Icheon 910 2560 2.25 2.63 0.38 Daejeon 610 1420 1.5 3.18 1.68 Daegu 1450 2540 2.2 3.74 1.54 Gwangju 710 1400 1.8 3.18 1.38 Busan 2390 3720 1.98 2.36 0.38

60 Alterra report 2170

Alterra is part of the international expertise organisation Wageningen UR (University & Research centre). Our mission is ‘To explore the potential of nature to improve the quality of life’. Within Wageningen UR, nine research institutes – both specialised and applied – have joined forces with Wageningen University and Van Hall Larenstein University of Applied Sciences to help answer the most important questions in the domain of healthy food and living environment. With approximately 40 locations (in the Netherlands, Brazil and China), 6,500 members of staff and 10,000 students, Wageningen UR is one of the leading organisations in its domain worldwide. The integral approach to problems and the cooperation between the exact sciences and the technological and social disciplines are at the heart of the Wageningen Approach.
Alterra is the research institute for our green living environment. We offer a combination of practical and scientific research in a multitude of disciplines related to the green world around us and the sustainable use of our living environment, such as flora and fauna, soil, water, the environment, geo-information and remote sensing, landscape and spatial planning, man and society.
More information: www.alterra.wur.nl/uk L.W.A. van Hove, G.J. Steeneveld, C.M.J. Jacobs, B.G. Heusinkveld, J.A. Elbers, E.J. Moors and A.A.M. Holtslag
Alterra report 2170
ISSN 1566-7197
Assessment based on a literature review, recent meteorological observationsand datasets provided by hobby meteorologists
Exploring the Urban Heat Island Intensity of Dutch cities