export diversification and growth: a case of ethiopia …
TRANSCRIPT

EXPORT DIVERSIFICATION AND GROWTH: A CASE OF ETHIOPIA
By
Abdurahman Mohammed Hussien
THESIS
Submitted to
KDI School of Public Policy and Management
in partial fulfillment of the requirements
for the degree of
MASTER OF PUBLIC POLICY
2014

EXPORT DIVERSIFICATION AND GROWTH: A CASE OF ETHIOPIA
By
Abdurahman Mohammed Hussien
THESIS
Submitted to
KDI School of Public Policy and Management
in partial fulfillment of the requirements
for the degree of
MASTER OF PUBLIC POLICY
2014
Professor Kim Ji-Hong


i
ABSTRACT
EXPORT DIVERSIFICATION AND GROWTH: A CASE OF ETHIOPIA
By
Abdurahman Mohammed Hussien
The role of export diversification as a developmental tool to enhance economic
growth for developing economies like Ethiopia has received substantial concern during
the recent decades. This study explores the pattern of Ethiopia’s export diversification
(i.e., vertical and horizontal) and identifies its relationship with total export growth and
investigates the factors that constrained export growth. A regression model is applied to
examine the effect of horizontal and vertical diversifications on total export growth.
Nominal exchange rate, world demand and FDI are used as control variables.
The study identified the pattern of export diversification, estimated the number of
jobs created by the export sector, and discussed export concentrations using the HHI
Index. The empirical findings show vertical diversification has a statistically significant
impact on total export growth. Interestingly, the empirical evidence revealed horizontal
diversification has no positive relationship with export growth in the long-run. Eventually,
policy recommendations that help bring a balanced and sustainable export diversification
and growth are drawn. These include: enhancing infrastructure development, facilitating
export trade finance, adopting an effective foreign exchange regime, improving private
sector development, expansion of trading across borders, and attracting and diversifying
FDI inflows.

ii
ACKNOWLEDGMENTS
First of all, I am grateful to God Almighty for granting me the opportunity to
develop my academic career. Secondly, I am highly indebted to the KDI School for
offering me a scholarship and having an advanced level educational experience in South
Korea. Also, I would like to thank faculty members and staff of Academic Affairs
Division of the KDI School for their unreserved support throughout my stay at the School.
Similarly, my special appreciation goes to my thesis advisors (Prof. Kim, Ji-Hong and
Prof. Yoo, Jungho) and Advanced Research Seminar professor (Choi, Changyong) for
their valuable advice and remarks on the thesis, which otherwise could not have taken
this final structure without their insightful guidance. Finally, I would also appreciate the
supports and encouragements received from my family, fellow friends, and colleagues at
the Ethiopia Commodity Exchange (ECX).

iii
TABLE OF CONTENTS
LIST OF TABLES .............................................................................................................. v
LIST OF FIGURES ........................................................................................................... vi
LIST OF ABBREVIATIONS ........................................................................................... vii
1. CHAPTER ONE: INTRODUCTION ......................................................................... 1
1.1 Background .......................................................................................................... 1
1.2 Statement of the Problem ..................................................................................... 3
1.3 Objectives of the Study ........................................................................................ 4
1.4 Research Questions/Hypothesis ........................................................................... 5
1.5 Scope of the Study................................................................................................ 5
1.6 Significance of the Study ..................................................................................... 6
1.7 Limitation of the Study ........................................................................................ 6
1.8 Organization ......................................................................................................... 7
2. CHAPTER TWO: LITERATURE REVIEW.............................................................. 8
2.1 Theoretical Literature ........................................................................................... 8
2.2 Dimensions of Export Diversification................................................................ 10
2.3 Empirical Literature ........................................................................................... 12
2.4 Key Policies to Promote Export Diversification ................................................ 13
3. CHAPTER THREE: PROFILE OF ETHIOPIA’S EXPORT POLICY,
STRUCTURE, AND PERFORMANCE .......................................................................... 17
3.2 Export Diversification Policy in Different Regimes of Ethiopia ....................... 17
3.3 Structure of Ethiopian Exports and Performance ............................................... 21
3.4 Performance in Export Diversification .............................................................. 28
3.5 Binding Factors for Low Level of Export Growth ............................................. 30

iv
4. CHAPTER FOUR: EMPIRICAL ANALYSIS ON ETHIOPIA’S EXPORT
GROWTH AND DIVERSIFICATION ............................................................................ 35
4.1 Methodology ...................................................................................................... 35
4.2 Data Sources and Types ..................................................................................... 35
4.3 Definition of Key Variables ............................................................................... 35
4.4 Model Specification ........................................................................................... 37
4.5 Stationarity Test ................................................................................................. 38
4.6 Major Findings ................................................................................................... 40
5. CHAPTER FIVE: CONCLUSIONS AND POLICY IMPLICATIONS ................... 43
5.1 Conclusions ........................................................................................................ 43
5.2 Policy Implications and Recommendations ....................................................... 45
BIBLIOGRAPHY ............................................................................................................. 48

v
LIST OF TABLES
Table 1: Exports of Goods and Services % of GDP, East African Countries 22
Table 2: Exports of Goods and Services % Growth Rate, East African Countries 24
Table 3: Estimated Number of Export Sector Jobs in Ethiopia 26
Table 4: Comparison of Annual Growth of Exports and Export Sector Jobs 27
Table 5: Results of Stationarity Test Using ADF Values 39
Table 6: Outcome of Regression Analysis on Effects of Vertical and Horizontal
Diversification on Export Growth 40
vi
LIST OF FIGURES
Figure 1: Comparison of Annual Exports and Imports of Ethiopia 22
Figure 2: Annual Export of Goods and Services % of GDP 23
Figure 3: Annual % growth of Export of Goods and Services 25
Figure 4: Pattern of Export Growth and Export Sector Jobs 27
Figure 5: Trend of Ethiopian Export Diversification: HHI Index 29
Figure 6: Pattern of Ethiopian Coffee Exports versus Non-Coffee Exports 30
Figure 7: Trend of Real Effective Exchange Rate of Ethiopia 31

vii
LIST OF ABBREVIATIONS
ADF Augmented Dickey Fuller
AGOA Africa Growth Opportunity Act
COMESA Common Market for East and South Africa
EBA Everything But Arms
ECX Ethiopia Commodity Exchange
EEA Ethiopian Economics Association
EPRDF Ethiopian People’s Revolutionary Democratic Front
ERCA Ethiopian Revenue and Customs Authority
ETI Enabling Trade Index
FDI Foreign Direct Investment
GCI Global Competitiveness Index
GDP Gross Domestic Product
HEXDIV Horizontal Export Diversification
HHI Herfindahl-Hirschman Index
IMF International Monetary Fund
ITC International Trade Center

viii
LDCs Least Developed Countries
LPI Logistics Performance Index
NBE National Bank of Ethiopia
NER Nominal Exchange Rate
ODA Official Development Assistance
OECD Organization for Economic Cooperation and Development
PPP Purchasing Power Parity
SAP Structural Adjustment Program
SITC Standard International Trade Classification
SMEs Small and Medium Sized Enterprises
TNCs Trans National Companies
UNCTAD United Nations Conference on Trade and Development
USD United States Dollar
VEXDIV Vertical Export Diversification
WB World Bank
WDI World Development Indicators
WDD World Demand
WTO World Trade Organization

1
1. CHAPTER ONE: INTRODUCTION
1.1 Background
The Ethiopian economy depends highly on agriculture, which accounted for 43%
of GDP, according to data from the National Bank of Ethiopia (NBE) in 2013. During the
same period, service and industry sectors accounted for 45% and 12%, respectively of the
country’s GDP. The agricultural sector contributes to 85% of export earnings and
employs 83% of the labor force. According to data from the World Development
Indicators (WDI 2013), Ethiopia’s GDP per capita, PPP (i.e., USD 1109) is one of the
lowest in the Sub-Sahara Africa. Despite being a developing economy with least per
capita income, Ethiopia, in recent years, has been one of the fastest growing economies in
Africa. In terms of annual percentage growth, the Ethiopian economy showed a year-on-
year average growth rate of 10.4% from 2002 to 2013 fiscal years. The driving force for
the robust and rapid growth has been mainly ascribed to improved public investment in
infrastructures, increased private sector investment, commercialization of agriculture, and
growth in non-traditional exports (Africa Economic Outlook, 2013). Although the share
of the agricultural sector to the national GDP indicated a recurrent falling tendency over
the last three decades, the sector remained to have a paramount contribution to the
country’s employment creation and hard currency earnings.
Stability of export sector performance has been critical for the economic
development of many developing countries such as Ethiopia. In recent decades, export
diversification has gained increased concern among these countries aimed at augmenting
export revenues, reducing instability in export earnings, and improving growth.

2
Although Ethiopia follows an export-led growth strategy, it has not achieved satisfactory
performance in terms of export revenue generation and diversification. This is mainly due
to the fact that the over three-fourth of the country’s export revenue is obtained from few
merchandise exports that are raw materials in nature. The country’s foreign trade
performance trends show that exports have been registering moderate growth, averaging
about 10% per annum since 1982. The country earned all time high export revenue of
USD 3.3 billion in 2013. Similarly, Ethiopia’s imports have revealed an average growth
rate of 12 percent each year to reach USD 12.8 billion in 2013. This resulted in a trade
deficit of USD 9.2 billion in the same period. On the other hand, total exports of goods to
GDP ratio have improved to 14.0% in 2012 from 7.6% in 1981. In spite of the deficits in
the balance of trade, the improved exports to GDP ratio indicates the economy is
gradually becoming open to international trade, which could have positive impacts on the
national economy in general and the export sector in particular.
Similar to other economies in Sub-Sahara Africa, the structure of Ethiopian exports
shows that few primary agricultural products constitute the lion’s share of its export
basket. The country’s coffee, which is nicknamed as “green gold”, is still the major
export commodity, which generates one-third of the total foreign exchange earnings of
the country. Other important merchandize exports include: oilseeds, Khat1, cut flowers,
live animals, pulses, meat and meat products, fruit and vegetables. These merchandize
exports combined with coffee accounted for 75 percent of the total export earnings of the
country. In contrast, the contribution of manufacturing exports (such as leather and
leather products and textiles) to total exports is very small. Although the share of
1 ‘’Khat is a shrub (Catha edulis) cultivated in the Middle East and Africa for its leaves and buds
that are the source of a habituating stimulant when chewed or used as a tea’’ (Online Webster Dictionary).
3
traditional exports is declining as a result of fast growth of non–traditional exports such
as cut flowers, fruits and vegetables, generally there is high dependence on a few primary
agricultural commodities. Therefore, it’s highly imperative for least developing
economies like Ethiopia to focus on structural and policy dimensions to bring about a
sustainable and balanced diversification and export growth.
1.2 Statement of the Problem
Despite the modest growth of Ethiopia’s total exports averaging 10% from 1981 to
2013, the country’s export sector remains underdeveloped in terms of trade/GDP ratio
(i.e., 14%), total earnings (with exports of USD 3.3 billion) and diversification (having
few primary exports). During the study period, Ethiopia’s trade deficit has been rising by
an average rate of 21% and the value of deficits reached USD 9.2 billion in 2013.
Furthermore, the structure of Ethiopia’s exports is built on a narrow base of non-
manufacturing and traditional exports. Although emerging non-traditional exports (for
example, cut flowers) are showing promising growth, few primary commodities, mainly
coffee, khat, oilseeds, pulses, and hides and skin still have supremacy in the country’s
export basket.
The heavy reliance on primary commodity exports indicates the narrow-base of the
country’s export structure having high concentration of few traditional exports. In effect,
the sustained presence of highly concentrated export-base would pose a serious threat to
export growth and further development of the country. Even though Ethiopia adopted
various policies aiming at diversification with a framework of an export led growth
strategy, the outcomes are still inadequate compared to country’s potential. This study
explores the pattern of export diversification (i.e., vertical and horizontal) and identifies

4
its relationship with total export growth. In the same token, the study investigates factors
that constrained Ethiopia’s export performance and diversification endeavors.
First, the prevailing high dependence on primary exports makes the country more
exposed to external adversities as argued in a number of literatures; instability and
volatility of foreign exchange earnings in the short-run and erratic deterioration terms of
trade in the long-run. This exogenous factor has been clearly apparent in Ethiopia’s case
where international prices of primary commodities (such as coffee and oilseeds) were
highly volatile and adversely affecting export revenues. Second, traditional exports have
a low level of backward and forward linkage with the rest of the economy as they are
exported without value-addition activities. Therefore, export diversification would
stabilize export proceeds and speed up export growth, which in turn can instigate further
economic growth for the country. Hence, the above facts and figures indicate that there
should be a cautious review of the country’s export trade structure and policies related to
diversification. Thus, trade policies, strategies, export structure and performance, and
dimensions of export diversification are the main focal points of this study.
1.3 Objectives of the Study
The study assesses Ethiopia’s export diversification patterns focusing on measuring
the effects of both vertical and horizontal export diversification in general. In particular,
the research tries to address the following specific objectives:
Analyze Ethiopia’s external trade policies and strategies towards export
diversification.
Examine the structure and performance of Ethiopia’s exports.
Measure Ethiopia’s export diversification trends.

5
Identify and analyze major challenges for export diversification and growth.
Propose key policy recommendations derived from findings of the study.
1.4 Research Questions/Hypothesis
The study will address the following research questions:
What is the linkage between horizontal and vertical export diversification and
total export growth in Ethiopia?
What are the binding constraints for export growth in Ethiopia?
Hypothesis: an improvement in the diversification rate of manufactured export products
(vertical diversification) would have more significant effect on growth of Ethiopia’s
exports compared to the effect of horizontal diversification ( expansion of number of
export sectors).
1.5 Scope of the Study
The scope of the study is limited to scrutinizing the effect of vertical and horizontal
export diversification on export growth in Ethiopia for the period covering from 1982 to
2013. The study analyzes the structure, policy, strategy, and export sector performance.
Furthermore, the study also examines binding constraints for export growth and possible
dimensions of export diversification. The study leaves aside to make further investigation
of the determinants of Ethiopia’s export diversification, which is another potential area of
research.

6
1.6 Significance of the Study
The role of export diversification as a developmental tool to enhance economic
growth for developing economies has received substantial thought during the recent
decades. Generally, it’s thought that diversification would help to reduce instability in
export revenues and foster overall growth in developing countries. Consequently, various
studies have empirically proved the positive relationship and causality between export
growth and overall economic growth. While in the case of Ethiopia, most previous
studies focused on exploring the overall export performance with an inadequate emphasis
on diversification.
However, to the best of my knowledge, a few practical studies have so far assessed
the separate effect of vertical and horizontal export diversification on overall export
growth, which is the primary interest of this research. Therefore, this study in general will
contribute to add new insights to the existing knowledge of effects of horizontal and
vertical diversification dimensions on export growth with a practical assessment on the
case of Ethiopia. In particular, the study will provide insights on the relationship between
export diversification (vertical and horizontal) and overall export growth. And, it
provides additional input to policy makers by analyzing the binding constraints for export
growth and potential dimensions of export diversification. Furthermore, the outcomes of
this study will serve as a reference and basis for further research on the subject.
1.7 Limitation of the Study
The study is limited with respect to obtaining quality and extensive data series from
relevant sources. In addition, the research has a shortcoming in accessing time series data
where the study period covers only three decades from 1982 to 2013. Moreover, the study
7
has drawbacks to use trade weighted real GDP of trading partners of Ethiopia. Instead,
the nominal GDP of major trading partners has been used to estimate in the regression
equation as a control variable.
1.8 Organization
The entire research is organized into five main sections. Section one deals with the
introductory chapter as discussed above. Section two presents surveys of theoretical and
empirical literatures on export diversification and growth. Section three assesses
Ethiopia’s export policy, structure and performance followed by section four that
discusses research methodology and empirical findings. Finally, section five draws
concluding remarks and policy implications based on the research findings.

8
2. CHAPTER TWO: LITERATURE REVIEW
2.1 Theoretical Literature
Export diversification is described as alteration of the composition of a country’s
prevailing export commodities or destination markets or as the expansion of exportable
products across many economic sectors. Diversification intends to set up a broader array
of exports having better overseas market potential and not susceptible to related volatility
in the global market prices. Export diversification in various developing economies is
perceived as the advancement from traditional to non-traditional export products integral
to their “export-led-growth strategy” (Samen 2010).
In various trade literatures, two different types of arguments on export
diversification are found. The traditional view argues that developing economies with a
narrow base of exports have a higher index of export earning instability compared to
developed economies with a broader export base (Bamou 2002). This orthodox view of
export diversification is based on its importance in reducing variability of export
revenues triggered by periodic volatility of commodity prices in global market. The
nexus of this argument lies in the idea of export product concentration and the
incapability to counterbalance the volatility in the principal commodity exports by
offsetting the variability and/or stability in the export of other commodities (Lakew,
2003).
According to Wilson (1984), a country’s foreign exchange position would
frequently be risky if it has dependence on just a single export product. Massel (1964)
further demonstrated that the presence of concentrated and a very few range of exports is
a major cause of volatility in a country’s export revenue. He presented two African

9
countries: Ghana and Sudan (Ghana known for cocoa and Sudan for cotton) as examples
of “mono crop countries” and claimed the potential for diversification to attain superior
export earnings strength. Similarly, James (1983) contended the consequence of export
commodity concentration on export earnings volatility and noted the need for
diversification in line with development of industrial products.
Samen (2010) argued that diversification provides increased benefits beyond the
traditional view of export earnings stability. By having a larger export base,
diversification can improve value-addition and enhance growth through different ways. It
can expand capacity of technological adoption through comprehensive, systematic and
practical training as well as ‘learning by doing’; it also enables forward and backward
linkages. He also acclaimed that diversification can create advanced markets, economies
of scale and externalities, and exchange of commodities with progressive price trends for
those with deteriorating price patterns.
In contrast, the new argument for export diversification focuses on dynamic
comparative advantage. According to classical trade theories founded by Adam Smith
and David Ricardo, every economy has a “comparative advantage” in manufacturing
output, in having certain export products, and that “specialization” in these export
commodities will produce “gains from trade”. The longstanding notion of comparative
advantage generally suggests that what fundamentally important is “how good an
economy is at producing a commodity compared with another commodity.”
Samen (2010) noted that comparative advantage is normal and equally inert for
natural resources and agricultural goods; however it can be encouraged and vigorous for
most manufacturing, scientific, and service sectors. Overall, it is also believed that
specialization patterns noticeably differ from one economy to another. “The process of
10
export diversification could appear contradictory to the concept of comparative advantage.
Based on trade theory arguments, the more a country actively engages in international
comparative markets, the more it require to a country to become specialized in exports.
Although specialization leads to a greater degree of allocative efficiency, at the same time,
in a narrow export based economies, it may be accompanied by costs associated with
specialization in terms of higher instability or external shocks in export revenue. This
could be causing severe shocks in the economy of emerging countries. The more
diversified are a countries export earnings, the better its potential to stabilize economic
performance and promote growth by increasing foreign exchange sources. However, this
achievement might be at the expense of advantages associated with specialization (Ali et
al., 1991).
2.2 Dimensions of Export Diversification
According to various trade literatures, export diversification has many dimensions
and can be scrutinized at different levels such as farm, plant, region or country. At each
level, emphasis could be given to various forms of diversification. However, in the trade
literature, two basic types or dimensions of export diversification have been widely
discussed: horizontal and vertical diversifications. “Horizontal diversification occurs
within a similar sector (primary or secondary or tertiary sector). And it involves
alterations in the mix of a country’s exports by increasing new commodities on prevailing
export base within the same sector, aimed at tackling adverse economic (to offset
worldwide price volatility) and political risks” (Samen 2010).
On the other hand, vertical diversification involves a transformation from the
primary to the secondary or tertiary sector. It requires bringing further uses for prevailing

11
products through enhancing value addition activities such as processing, marketing or
other services. Major benefits of vertical diversification include expansion of market
openings for natural resources or raw materials, and improve the growth and stability
since value added products usually have lesser price swings than raw products.
Illescas and Carlos (2011) defined traditional and non-traditional exports of Peru
based on developments by time period. He described traditional exports as those Peruvian
products that have been produced and exported since longer historical periods; indicating
its “comparative advantage associated to the relative abundance of resources”. On the
other hand, non-traditional exports include those that have been introduced more lately
and” having comparative advantage or based on relative resource abundance.”
According to Samen (2010), conditions for fruitful diversification (horizontal or
vertical) can differ substantially based on capital, technology, executive capabilities, and
marketing skills. Robust and healthy export growth entails both dimensions of
diversification: horizontal (e.g. bring up new commodities in the current list of exports),
and vertical (e.g. enter into value addition of raw materials through processing and
manufacturing).
From the preceding discussion, a narrow base of primary export commodities for
hard currency earnings have been a challenging issue faced by least developed countries.
As a result of a secular and unpredictable declining trend in international price of these
agricultural exportable products that in turn, leads to unstable export earnings. Such large
volatility in export earnings has a significant adverse impact on the economy. In order to
minimize the excessive dependence on primary commodities for generating export
earnings, to enter into world market and to promote growth, the least developed
economies need to diversify their export commodities.

12
2.3 Empirical Literature
As regards to the relationship between export diversification and export growth,
the empirical evidences show that there is mixed outcome. Illescas (2011) noted that
quite “a few studies have found out that export concentration is associated to lower
growth.” For instance, (Ali et al., 1991) analyzed the export performance of three Sub-
Saharan African countries, namely Malawi, Zimbabwe, and Tanzania employing various
measures of horizontal export diversification. And, the study found that there is no clear
relationship between the degree of export diversification and export performance for the
three African economies.
Hassan and Toda (2004) conducted a comprehensive study on the association
between export diversification and export growth for three LDCs: Bangladesh, Nepal,
and Myanmar. The researchers found out mixed result for the captioned developing
countries. For Bangladesh and Nepal, vertical diversification into non-traditional exports
has more significant effect on total export growth than that of horizontal diversification
into traditional exports. In contrast, in the case of Myanmar the study found absence of
any association between export diversification and total export growth. According to the
study, the momentum for export growth in Bangladesh and Nepal originated mainly from
vertical diversification towards non-traditional products such as ready-made garments,
footwear and miscellaneous manufactured products for Bangladesh and carpets and
clothing for Nepal.
On the other hand, DeRosa (1992) utilized correlation analysis to examine the
relation between export diversification and export growth using a data series of 42
developing economies. The findings revealed the presence of strong positive correlation

13
between export diversification and export growth. Furthermore, Al-Marhubi (2000)
explored the positive link between diversification and growth employing cross-sectional
regressions of growth of countries. Mold and Prizzon (2008) conducted a comprehensive
study on 48 African economies and the result shows that export diversification has a
positive effect on total export growth.
In sum, the above empirical literatures provided mixed results on the impact of
export diversification on total export growth. Moreover, the foregoing studies highlighted
the possibility of having different outcomes in applying different dimension of
diversification on export growth.
2.4 Key Policies to Promote Export Diversification
According to the UNCTAD 2011 report, policies to promote export
diversification should be selected based on a thorough analysis of the country’s specific
situations. These include: “its status in the worldwide division of labor, its position in the
overseas supply chain, and global demand scenarios.” In general, the policy reforms
necessary to foster export diversification require a multi-faceted approach covering trade,
investment and industrial policies, and institutional reforms. Specific measures to
promote export diversification are discussed below.
2.4.1 Investment and Industrial Policy
This kind of national policies would help cultivate possibly innovative sectors that
have comparative advantage. Under this framework, countries should identify and set up
enabling environments required by domestic companies to obtain access to overseas
markets. Enhancing access to market commonly comprises a lessening of trade barriers
for exporting companies; the establishment of firms engaged in marketing and

14
distribution to local manufacturers with the essential knowledge to increase access to
global markets. Besides, regulatory and institutional frameworks; improved infrastructure
and ICT, and investment in infrastructure, would enhance productivity, export
diversification, and enable local firms to compete in international markets.
Access to Finance for Export Diversification: a well-thought out export
diversification strategy need to avail financing services for export-based companies with
important priority. This is because, insufficient or lack of trade finance is one of the main
limitations for prospective exporters, especially SMEs that have not access to finance or
obtain credits at excessively high interest rates. For example, government could convince
privately owned commercial banks to provide export financing at fair interest rates. A
more advanced financial industry enables more bankrolling prospects for new and
pioneering entrepreneurs who could have the capability to launch new export
commodities.
Development of Infrastructure: Well-organized infrastructure is a prerequisite
to achieve better export performance. To confirm that goods reach timely, in good order
and with the least waiting and delivery time, streamlined transport infrastructure and port
facilities are a critical component of a fruitful export diversification policy. The
insufficient operation of infrastructure could deter export companies in several ways: by
hindering manufacturing operations, suspending the transport and delivery of export
goods. This, in turn, would result in higher trading costs and the export sector becomes
less competitive in the global market.
Communication and Technological Infrastructure: this is another major
driving factor to flourish a diversified and more competitive export sector. Building up of
a suitable and reachable communication infrastructure expands productivity and helps to

15
have fast and effective communication with the global trading community and is vital for
the realization of successful export companies.
2.4.2 Institutional and Regulatory Framework
This environment in a country could either stimulate or deter export
diversification efforts. A very complex or burdensome procedures, rules and regulations
governing exports may threaten determinations to diversify exports. Moreover, studies on
trade support services in Africa showed that inadequate policies and structure in trade
policy obstructs development of export sector. Easy and coordinated export guidelines
are therefore essential to stimulate export diversification (Bonaglia and Fukasaku 2003).
2.4.3 Investing in Human Capital Development
Many empirical researches have shown the correlation between diversified export
portfolio and well-educated labor-force. Further studies also attested that lack of skilled
manpower is a major impeding factor on the capacity of a country to diversify its exports.
‘In order to diversify exports and increase export sector’s productivity, appropriate
policies on technology acquisition, adoption, adaptation, development, and diffusion
should be crafted. As a result, employee productivity and production efficiency could
improve enabling export firms to obtain competitive edge and to thrive in the
international market. In addition, “funding from private and public sectors could help
skill development training programs.”
2.4.4 Integration into Global Value Chains
Trans National Companies (TNCs) are progressively subcontracting portions of
their value chains to intensify efficiency and competitiveness and offer options with the
lowest international price. In numerous cases, this integration involves outsourcing of
industrial or service sectors to be efficient and low-cost in developing economies.

16
Engaging in worldwide value chains needs a capability to produce specialized goods or
services at the required quality and quantity and within tough delivery schedules. These
burdens have made it problematic for many developing economies to assimilate into
international value chains and to engage at downstream sectors as suppliers of raw
materials.
2.4.5 Designing Incentive Systems
Incentive systems could be designed to enhance “flows of FDI into manufacturing
sector or the production of new primary export products” or boost quality of prevailing
exports. In this setting, Official Development Assistance (ODA) can be essential to
uphold export diversification through capacity and infrastructure development of export
sectors in developing economies. “Aid agencies could help to develop a more efficient
trade and investment support networks by sharing their expertise and by allowing access
to trade data and regulations.”
2.4.6 Trade Facilitation
Trade facilitation is vital for promoting exports and decreasing transaction costs
involved in import-export trade. According to WTO definition, trade facilitation means
“simplification and harmonization of international trade procedures, where trade
procedures are the activities, practices and formalities involved in collecting, presenting,
communicating and processing data required for the movement of goods in international
trade.” Extra unnecessary procedures bring added transaction costs to traders. A study
conducted by the OECD revealed that “each one percent of savings in trade-related
transaction costs yields a worldwide benefit of USD 43 billion (OECD 2003).’’
17
3. CHAPTER THREE: PROFILE OF ETHIOPIA’S EXPORT POLICY,
STRUCTURE, AND PERFORMANCE
3.2 Export Diversification Policy in Different Regimes of Ethiopia
The export diversification policy in Ethiopia can be reviewed based on three
various regimes that have ruled the country. These three regimes are: the Imperial era
(periods before 19974), the military regime (19974-1991), and the EPRDF regime
(periods after 1991). The governments during the three regimes put into effect different
set of policies aimed at augmenting the export sector and sustaining performance beyond
traditional exports. The export policies pursued during the Imperial regime were mainly
in-ward oriented, which had adverse effects on the export sector competitiveness. In
contrast, the prevailing government- EPRDF regime- abandoned the command type
policies of the Military regime and emerged with market-oriented policies. A brief
assessment of the export policies of the three regimes is discussed as follows.
3.1.1 Policies of the Imperial Era (Pre 1974)
In this period, the export sector was administered by a fairly free market-oriented
policy, where the private sector played a foremost role in foreign trade. The major
strategy followed during the imperial period was towards import substitution. The export
policies crafted under the country’s development plan were designed into the following
three phases.
I. The First Five Year Development Plan (1957-1962): this plan emphasized
infrastructure development, industry support and import substitution strategies.
Promotion of exports did not receive adequate concern. Nevertheless, the plan stressed
that level of demand for three dominant exports (i.e., coffee, hides and skins, and

18
oilseeds) as well as price movements of the respective commodities highly dictate the
country’s export volume, revenue, and balance of payments. Accordingly, it drew its
attention on diversifying the country’s exports by capitalizing on the huge potential of
livestock and agro-industries to grow exports by 9% per annum.
II. The Second Five Year Development Plan (1962-1967): major focus was made
on export diversification to raise foreign exchange revenue through structural change.
The plan urged for manufacturing and mining sectors to play considerable role in
developing exports. Importantly, target was set to decrease the share of agricultural
exports to 72.3% from 93.6 % in between the plan period and to lift up the proportion of
manufacturing exports to 24.2% from 5.2%. Tax holidays and easing of export licenses
were used as incentives to private sector engaged in the production of non-traditional
exports. The yearly average export growth rate was projected to reach at11%. The main
policies formulated during this period include: setting up foreign trade enterprises,
adjusting tariff rates to protect local producers and enhance exports, exports credit
schemes and subsides.
III. The Third Five-Year Development Plan (1962 to 1967): the expansion of non-
agricultural exports and geographic market diversification of primary export commodities
were priority areas during this period. In general, the export share of traditional
commodities was targeted to decrease to 75% from 85%. In particular, coffee export
share was envisaged to reduce to 40% from 55% in the period under review. The key
policy actions taken were controlling foreign exchange and over-valuation the forex rate,
raising tariff rates, levying of non-tariff barriers by imposing a higher export tax and

19
restrictions. Despite such policy measures, the anticipated outcome of export
diversification could not be achieved owing to structural bottlenecks facing the economy.
3.1.2 Policies of the Military Regime (1974-1991)
A command type of economic policy was adopted during this period. The military
junta or the regime devised policies that impaired the participation of the private sector.
The policies were inclined towards the development of state-owned enterprises or
government parastatals. On the other hand, privately run companies were restricted and
their involvement in the development endeavors of the country was set to the lowest
degree. A seemingly inward-oriented strategy was pursued with prohibitive tariff and
quantitative restrictions.
Under a 10 Year Perspective Plan (1985/86-1994/95), the military regime
envisioned to streamline the export structure by promoting high value-added goods,
growing the share of manufacturing exports, and increasing foreign exchange revenues.
The plan granted special emphasis on state-run export enterprises and geographic
diversification towards communist countries and bordering African countries. Moreover,
total exports were projected to grow on average by 15.4% per annum, where state-run
companies were anticipated to contribute 90% in the export sector.
As disclosed in the perspective plan, the export share of four primary export
products namely, coffee, hides and skins, pulses, and oilseeds were intended to reduce to
53.2% from 73.5%. In addition, other traditional exports such as live animals, fruits and
vegetables, spices were estimated to increase to 4.8% from 26.5% in a span of the ten
year plan. The second-half of the plan also aimed at expanding new export products in
20
the mining and manufacturing sectors such as marble, cooper, and potash and leather
products, respectively.
The policy tools that were put in place to achieve the plan consists of offering tax
and tariff incentives, enhancing variety, quality, and quantity of exports, dissemination of
market information such as world prices of commodities to local suppliers and exporters.
Last bust not least, in 1989/90, the government circulated a directive that banned the
export of unprocessed hides and skins to meet the objective of export diversification.
3.1.3 Policies of the EPRDF Regime (Post 1990/91)
The incumbent governing party—Ethiopian People’s Revolutionary Democratic
Front (EPRDF)—ousted the Military regime in 1991. Afterwards, a free market economic
policy was adopted. A series of economic reforms were made and outward-oriented
policies were pursued as a development strategy. The policies aimed at diversifying the
narrow base of Ethiopia’s exports and easing the dearth of hard currency in line with a
free market system. Subsequently, the role of government enterprise in export business
was reduced and instead private sector participation was actively supported. Some of the
major policy tools put into effect comprise: devaluation of the local currency, gradual
liberalization of the forex market, restructuring the foreign trade licensing system,
lowering tariffs and removing export taxes and subsidies to parastatal corporations.
The Ethiopian government went through a Structural Adjustment Program (SAP)
with the support of the International Monetary Fund (IMF) and the World Bank in 1992.
The aim of the SAP was to improve the ailing economy arising from macro-economic
imbalances. Under this policy endeavors, efforts were made to keep opening up the
economy to international competition in order to take advantage of market expansion.

21
Besides, the government devised export development strategy and set up
institutions that would render export support services. To achieve the objective of export
diversification, specific incentive system for the export sector were put into action. The
export-targeted incentive schemes include: foreign exchange retention, duty drawback,
voucher system, bonded manufacturing warehouse, export credit guarantee, and external
loan scheme.
3.3 Structure of Ethiopian Exports and Performance
As discussed earlier, Ethiopia’s export structure is dominated by few primary
agricultural export products. Not only primary exports capture the export structure, but
also a high level of market concentration is observed. The top export products such as
coffee, oilseed, pulses, and hides and skins accounted for 75% of total exports, where
coffee alone had an average share of 6% in the country’s GDP. Moreover, the country
remained unable to fully finance its import needs through its earnings from the export
sector registering a trade deficit of USD 9.2 billion during 2013. Further trend analysis
also attests the deteriorating terms of trade of the country with its export value index
(2000 = 100) and import value index (200=100) standing at an average of 253 and 419,
respectively. The ensuing chart illustrates the annual export and import values of the
country.

22
Figure 1: Comparison of Annual Export and Imports of Ethiopia
Source: World Bank, World Development Indicators (WDI) 2013
The Table below shows a cross-country comparison of the average annual ratio of
Exports to GDP for six East African economies.
Table 1: Exports of Goods and Service % of GDP, East African Countries
1982-
1986
1987-
1991
1992-
1996
1997-
2001
2002-
2006
2007-
2011
2012-
2013
Burundi 10.7 10 9.4 7.5 6.9 6.1 8.9
Ethiopia 6.7 5.6 7 12 14 11.6 14
Kenya 26.1 2.9 32 21.6 26.4 26.6 27.3
Rwanda 11.9 6.6 5.6 7.5 9.9 12 13.2
Sudan 7.9 4.4 5.3 9.6 16.08 20.07 35.1
Tanzania n.d 11.4 19 14.3 19.8 25.8 29.6
Source: Own Computations, World Bank, WDI 2013 (n.d= no data available)
Considering non-oil based economies, the export/GDP ratio indicates that
Ethiopia attained the second highest ratio improved by nearly seven percentage points
during the last three decades (from 6.7% in 1982-1986 to 14.0% in 2012-2013). Except

23
Tanzania, which recorded the highest improvement, the other regional economies either
had maintained their status quo or exhibited declining ratio of exports to GDP during the
review period. Since Sudan is an oil based economy, comparison has not been made with
the rest of East African economies.
A further analysis is also made to show trend of Ethiopia’s aggregate export to
GDP ratio for the period covering 1982-2013. Besides, an attempt is made to compare
the export/GDP ratio of Ethiopia with other Sub-Saharan African countries. The
following chart depicts the same trends.
Figure 2: Annual Export of Goods and Services % of GDP
Source: World Bank, World Development Indicators (WDI) 2013
From the above line chart, it can be observed that the ratio of exports to GDP
steadily increased from the beginning of 1992 to 2007 following the series of economic
reforms under the free-market economic system.
Private sector participation in the export business was encouraged and the
government initiated various incentive schemes and strategies to make exports as an

24
engine of growth. Table below illustrates the average annual aggregate exports growth
rate for five east African countries in the last three decades.
Table 2: Exports of Goods and Service % Growth Rate, East African Countries
1982-1986 1987-1991 1992-1996 1997-2001 2002-2006 2007-2012
Ethiopia 0.9 (7.2) 30.9 10.0 13.7 11.0
Kenya 3.7 7.1 5.3 (0.3) 7.9 5.6
Rwanda 8.8 (7.0) (7.3) 18.5 17.0 19.0
Sudan (1.5) (12.0) 7.2 34.4 18.0 n.d
Tanzania n.d n.d 20.4 9.8 9.2 17.5
Source: Own Computations, World Bank, WDI 2013 (n.d= no data available)
The data evidently indicate that Ethiopia revealed a notable annual growth of
exports, except during 1987-1991. The decline in this period was mainly attributed to the
downfall of the military regime (absence of well-functioning government while in power
transition), intensified conflicts, and huge spending on defense. Nevertheless, the highest
growth rate of exports (i.e., 13.7%) was witnessed in the 2002-2006 period. The
expansion of non-traditional exports such as flourishing cut flowers industries has
enabled the export sector to grow during this period. Furthermore, annual exports
continued to grow, though at declining rates during 2007-2013 following the global
economic recession and massive coffee export crises2 in the domestic economy.
2 The Ethiopian government charged prominent coffee exporters for stockpiling coffee in expectation of price increases in the world market. Consequently, the government confiscated 17,000 metric tons of coffee and revoked their business licenses in 2009. This crisis had adversely affected the countries overall export performance during the period.

25
The ensuing chart depicts the year-on-year growth rate of aggregate exports of
Ethiopia and other Sub-Sahara African economies for the periods covering 1980-2013.
The annual trend shows that the export growth rate follows a cyclical fluctuation as
mostly is triggered by volatility in international commodity prices. Accordingly, during
the last thirty years, the lowest and highest growth rates were observed in year 1991 and
1993, respectively as discussed earlier.
Figure 3: Annual % growth of Export of Goods and Services
Source: World Bank, World Development Indicators (WDI), 2013
Export Growth versus Export-Sector Jobs:
A further assessment of Ethiopia’s export performance is made with respect to job
creation in the export sector. Analysis on export growth and job growth in the export
sector reveals that the latter follows the growth pattern of the country’s overall exports.
Although official data on employment generation of the export sector is unavailable, an
indirect method of computation is used to estimate the figures. The annual value of total
26
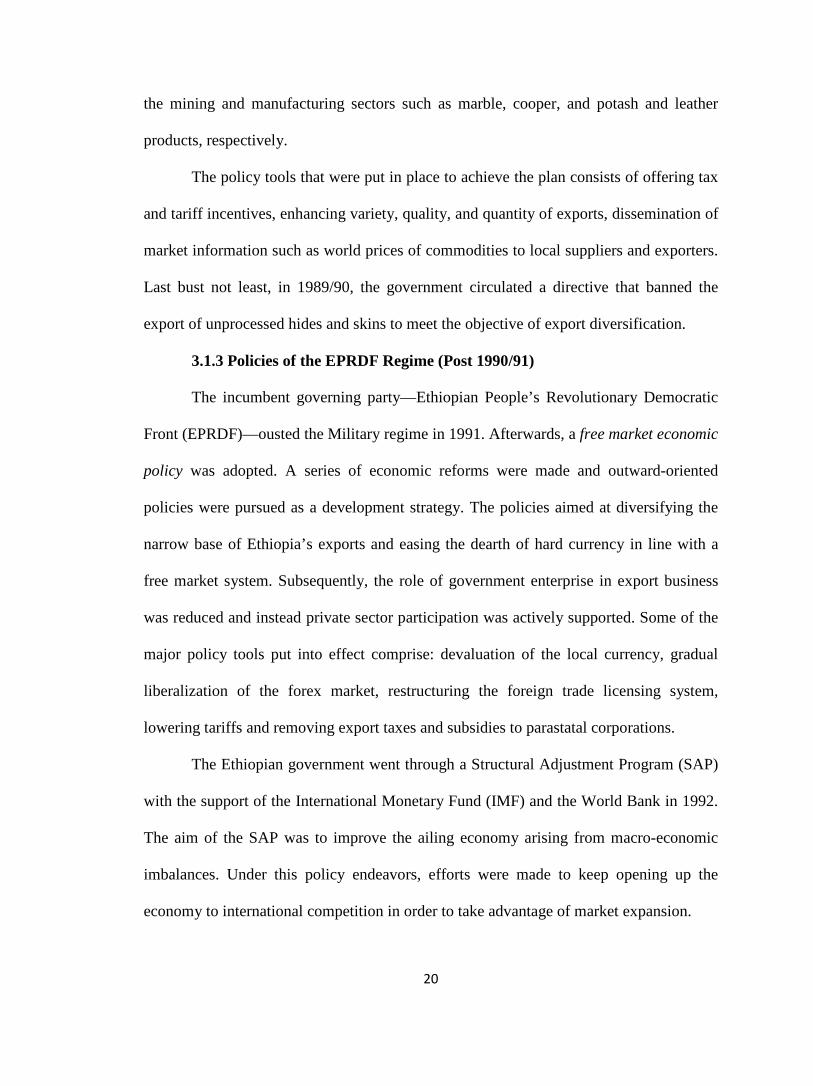
exports, total labor force, rate of unemployment, GDP, and GDP per worker is used in the
computation.
Assumption: Rate of unemployment is assumed to be 8% in 1981 and 17.5% in 21012
based on UNDP estimate.
Estimation Methodology:
• GDP/Labor force is computed by dividing Real GDP by size of labor force.
• GDP/Labor force gives us the yearly average income that supports to employ a
single worker.
• Then, the number of employment created by the export sector is computed by
dividing the country’s annual export value by the average income of a worker.
• The following table summarizes the indirect method of computation used to
estimate the number of export sector jobs.
Table 3: Estimated Number of Export Sector Jobs in Ethiopia: 1981 and 2012
Variables 1981 2012
a. GDP (2005 Constant US Dollar) 5,607,927,671 24,662,742,422
b. Export Value (2005 Constant US Dollar) 380,000,000 2,962,735,439
c. Number of Labor force 14,485,906 42,036,456
d. Unemployment (8% & 17.5%)*c 1,158,872 7,356,380
e. Actual Labor force =c-d 13,327,034 34,680,076
f. GDP/Actual Labor force (US Dollar) =a/e 421 711
g. Export value/ GDP per actual labor force =b/f 903,056 4,166,118
h. Estimated Number of Export Sector Jobs= g 903,056 4,166,118
Own Computation, Data from WDI

27
A total of 903,056 jobs were estimated to be generated by the export business
during 1981. However, in 2012 this figure is estimated to reach 4.17 million jobs, which
has shown a dramatic upward growth of more than four folds or 461%.
Table 4: Comparison of Cumulative Growth of Exports and Export sector Jobs
Source: Own Compuattion Using,World Bank, WDI 2013
Figure 4: Pattern of Export Growth and Export Sector Jobs
Source: Own Computation, using World Bank, WDI 2013
Period
Cum. Growth Rate of
Exports
Cum. Growth Rate of Export Sector Jobs
1981-1985 -2.2% n.d
1986-1990 0.7% n.d
1991-1995 14.3% 15.5%
1996-2000 3.6% 1.9%
2001-2005 16.2% 13.2%
2006-2012 19.6% 15.4%

28
3.4 Performance in Export Diversification
Even though the performance of Ethiopia’s aggregate exports revealed some
improvements during the study period, an important concern that needs a careful scrutiny
is diversification in the range of export goods. In this section, effort is made to analyze
the diversification or concentration index of the country’s exports. In this study, export
diversification is measured using the Herfindahl Index (HI), which is the most frequently
applied measure of trade and commodity concentration. It is also known as Herfindahl-
Hirschman Index (HHI). The measure accounts of export values across a given range of
products or sectors.
, where
The Herfindahl index Si, t for country i at year t is computed as follows:
Xk i.t = is country i’s export of good k in year t
J= is the total number of industries in the country’s economy
Ski,t = is the share of export of good k in country i’s total export
The HHI index takes values from 0 to 1, while higher value show greater
concentration and values closer to 0 indicate greater diversification.
The UNCTAD database provides export concentration index of countries using the
HHI. In this study, the trends of actual HHI indices are adapted from the UNCTAD
database. The HHI indices for Ethiopia indicate that the export concentration index
improved to 0.31 in 2013 from 0.67 in 1982. Similarly, the total number of export

29
products by major classification —Standard International Trade Classification (SITC) at
the three digit level -- increased from 20 products in 1982 to 150 products in 2013. The
total number of export products consists of a broader list of merchandise exports (such as
coffee, oilseeds, pulses, hides and skin, fruits and vegetables, etc). The trend of HHI
index is depicted on the ensuing chart.
Figure 5: Trend of Ethiopian Export Diversification: HHI Index
Source: Data from UNCTAD, 2013
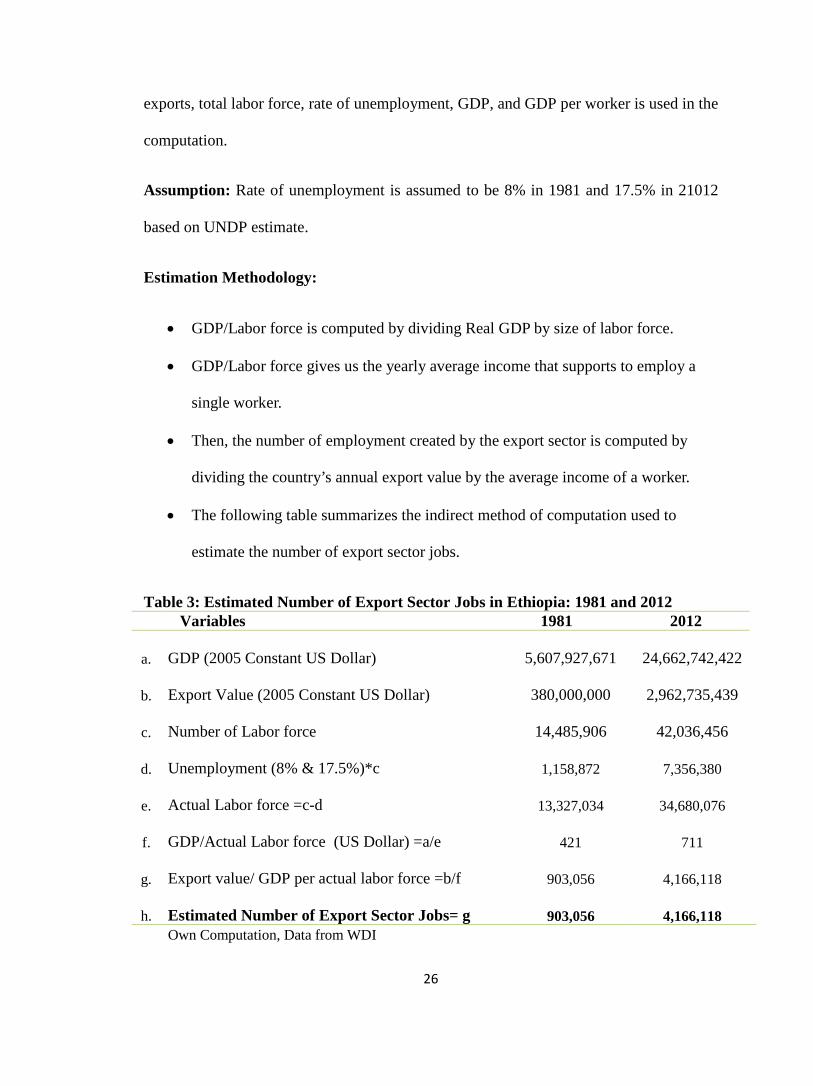
Coffee vs Non-coffee Exports
Another essential analysis of diversification across Ethiopian coffee and non-coffee
export products reveals that the share of coffee export steadily declined from 60% in
1981 to 26% in 2012. On the other hand, that of non-coffee export increased from 40% to
74% in the same period.
30
Figure 6: Pattern of Ethiopian Coffee Exports versus Non-Coffee Exports
Source: Own graph, data from UNCOM Trade and National Bank of Ethiopia, 2013
3.5 Binding Factors for Low Level of Export Growth
As discussed earlier, Ethiopia has pursued various trade development policies and
strategies such as import substitutions and protection of infant industries in the imperial
era; highly state-controlled foreign trade system in the military regime; and free-market
system during recent periods. Despite the different strategies, each regime integrated an
objective of export diversification polices to lessen reliance on few cash crops dominated
export structure into a wider export portfolio. Even, in the recent periods, policies and
strategies that fairly support exports have been designed. However, Ethiopia still suffers
from limited export diversification and growing trade deficits with deteriorating terms of
trade, which had negatively impacted its capability to finance its import needs.
In this context, the binding constraints for the unfavorable export performance are
analyzed based on demand and supply driven factors. The demand related factors could

31
be tackled through external policies aimed at increasing trade negotiations. While the
supply-side factors could be mitigated by focusing on realistic domestic policy mixes.
Exchange Rate Policy: exchange rate has been used as an ‘external anchor’ in a
view to stabilize domestic prices during the last decade. As a result, the real effective
exchange rate has shown a sharp rise, which in turn, affected export competitiveness and
import-competing industries in the economy. According a recent report released in July
2014 by the World Bank, the real exchange rate of Ethiopia should be devaluated by 10%.
The empirical finding of the report revealed that “a 10 percent lower real exchange rate
could increase export growth in Ethiopia by more than five percentage points per year
and increase economic growth by more than two percentage points.” The estimated
positive effect of the real exchange rate variable is grounded on the fact that Ethiopia’s
export basket is predominantly filled with basic commodities that compete more on price
than on quality.
Figure 7: Trend of Real Effective Exchange Rate of Ethiopia
Source: UNCTAD Database

32
In addition, the demand for foreign currency surpasses its supply and there are frequent
times that the country’s foreign currency reserves are depleted, which affected the foreign
trade sector as investors couldn’t obtain hard currency up to six months or more to import
basic goods.
Poor Infrastructure: although Ethiopia is currently undergoing a massive
infrastructure development, availability of transport and communications infrastructure
has been yet at its infancy stage, which in turn has adversely impacted its trade enabling
environment. According to the 2012 World Economic Forum’s Enabling Trade Index
(ETI) that benchmarked 131 global economies, Ethiopia ranked 121th and 93rd places,
respectively, in terms of availability and quality of transport infrastructure and
availability and quality of transport services. Similarly, the country ranked 128th place
with regard to availability and use of ICT. Therefore, poor infrastructure has been one of
the serious deterring factors for unsatisfactory export performance in the country.
High Trading Costs: being a landlocked country with a low level of
infrastructures, Ethiopia is ranked as one of the least favorable country in terms of
engaging in world trade. According to World Bank’s 2013 Survey Report of Trade
Logistics in the Global Economy, Ethiopia ranked 141 out of 155 economies in terms of
trade Logistics Performance Index (LPI). In addition, in terms of international shipments
and logistics competence score, Ethiopia ranked 129th and 139th, respectively, out of 155
economies. Furthermore, according to the World Bank’s Doing Business Report of 2014,
total cost to export in US dollars per container in Ethiopia was USD 2,180 compared to
USD 450 recorded by Malaysia as the global best performer. This relatively higher
trading cost of Ethiopia is mainly attributed to poor infrastructure such as transportation
and complex customs procedures.

33
Weak Private Sector: the structure of industry in Ethiopia is mainly characterized
by the presence of a relatively small number of state-run enterprises, low competitive
environment, and high bureaucratic procedures and entry bottlenecks. For example,
according to the World Economic Forum’s Global Competitiveness Index (GCI) report of
2013-2014, Ethiopia ranked 127th out of 148 economies, recording 3.5 index score (the
highest index being seven points and one point being the lowest). During the same period,
Switzerland ranked as the world’s most competitive economy with an index score of 5.7.
Further review of the World Bank report (2014) on goods market efficiency such as
“intensity of local competition,” “extent of market dominance,” and “effectiveness of
anti-monopoly policy,” the country ranks below average, at 133rd, 144th and 131st,
respectively. In addition, WDI data indicates that the country’s annual average ratio of
private sector gross fixed capital formation to GDP from 1982 to 2012 stands at12%.
Weak Access to Finance: this has been one of the impeding factors for the low
level of exports diversification and growth. Due to underdeveloped financial sector,
export financing is one of the major constraints. The problem of access to finance has
been the second most hindering factor for export business in general and the private
sector in particular, after infrastructure problem. According to WDI database, the average
ratio of domestic credit to private sector (% of GDP) from 1982-2012 reach 15%.
Similarly, the yearly average ratio of domestic credit provided by the Ethiopian financial
sector (% of GDP) during the captioned periods was only 25%. These figures are by far
lower compared to other neighboring countries in East Africa (such as Kenya and
Uganda).

34
Low Level of Border Trade: Ethiopia’s track record in trading with neighboring
regional countries is found to be relatively low owing to absence of adequate
infrastructure that links border trade partners. The World Bank’s Doing Business Report
of 2014 disclosed that Ethiopia ranked 166th out of 189 countries in overall trading across
borders. In the same period, Ethiopia ranked 35th out of 47 countries in trading across
border among Sub-Saharan countries; and 23rd out of 40 landlocked countries.
According to the World Bank report (2014), “weak regional integration of
countries like Ethiopia limits the country’s potentials for growth and diversification
because there exist large trading opportunities within Africa in food products, basic
manufactures, and services.” The report further argues that Ethiopia has underperformed
in boosting export volume by using the various trade preferences in the US, Europe, and
other trading partners. The country lagged behind other countries (that don’t have
preferential treatment) in terms of the potential volume of exports it could be exporting
duty-free. For instance, “Ethiopia is exporting less than US$3 billion worth of
merchandise when an identically populous Vietnam is exporting US$120 billion while
facing higher tariffs both in the EU and U.S.“ In addition, considering market size and
proximity of neighboring economies, Ethiopia’s bilateral trade performance with
neighboring regional partners is slightly over one-fifth of the total expected value of half
a billion US dollars.

35
4. CHAPTER FOUR: EMPIRICAL ANALYSIS ON ETHIOPIA’S EXPORT
GROWTH AND DIVERSIFICATION
4.1 Methodology
In this section, the research methodology is briefly discussed. Accordingly, source
and type of data employed, definition of key variables, and specification of applied model
is presented as follows. A simple regression model is applied to examine the effect of
horizontal and vertical diversification on total export growth.
4.2 Data Sources and Types
The study employed secondary data sources. A time series data on annual export
volume and value were collected and analyzed across export commodities. Relevant data
sources used in the study include: Ethiopian Revenue and Customs Authority (ERCA),
National Bank of Ethiopia (NBE), Ethiopia Economics Association (EEA), UNCom
Trade, World Bank (WB), UNCTAD, and other relevant databases and publications.
Based on these sources, the data are analyzed by employing both quantitative and
qualitative methods.
4.3 Definition of Key Variables
The basic variables to be defined here include export diversification and two
important dimensions of export diversification: vertical and horizontal. In this study,
export diversification is defined as “change in the composition of a country’s existing
export product mix.” (Semen 2010). And, export diversification is analyzed at country
level. Horizontal diversification reflects an alteration of the country’s traditional export
commodities and vertical diversification represents the discovery of new areas of non-
traditional export products through processing, value addition or marketing efforts.

36
The following approaches are discussed to define the horizontal diversification
(traditional) and vertical diversification (non-traditional products).
1. Time Factor: traditional exports constitute those commodities that have been
prevailing since the ‘colonial era’ such as coffee, cotton, and tea. In contrast, non-
traditional exports comprise those that have been developed ‘after the colonial period
‘such as processed foods (Bamou, 2002). However, since Ethiopia is the only country
in Africa that had never been colonized, it’s difficult to put a cutoff period to classify
traditional and non-traditional products based on time factor.
2. Trade Value: in this definition, traditional exports include 10 largest three digit
commodity groups accounting for 75 percent of total export value. If those 10
commodities do not account for at least 75 percent, more three-digit groups are added
to reach at 75 percent. By implication, non-traditional exports entail all the remaining
export groups (World Bank, 1997).
3. Ratio of Manufactured Exports to Total Exports: this ratio would represent vertical
diversification (non-traditional exports) as a country moves to diversify its export
portfolio from primary products (mainly raw materials) to secondary products (mostly
through value addition). The ratio is computed by dividing value of manufactured
exports by total value of exports of a country (Yokoyama et al (2009).
4. Number of Export Products: using this approach horizontal diversification
(traditional exports) can be measured on the basis of Standard International Trade
Classifications (SITCs) at three-digit products classification level. The approach
measures extensive margins which indicate the number of exports products of a
country over a certain period. (Yokoyama et al (2009).

37
In this study, approach 3 and 4 are used to define and measure both vertical and
horizontal export diversifications as explained above.
4.4 Model Specification
A simple econometric analysis is applied to carry out the empirical analysis of
impact of horizontal and vertical diversification on total export growth. The study partly
replicates the model used Yokoyama et al (2009). The model estimates export growth as
measured using variables such as the growth rate of manufactured exports as a percentage
of total exports --representing vertical diversification (VEXDIV) and the number of
export products at the three digit level--reflecting horizontal diversification (HEXDIV).
Besides, three other macro-economic variables: nominal exchange rate (NER), world
demand (WDD), and inward stock of FDI are used as control variables to capture
exogenous factors in the export sector. World demand is represented by the aggregate
nominal GDP of the country’s main trading partners. Thus, the relationship of these
variables with the growth rate of total exports (GRTEX) will be empirically analyzed.
The empirical study expects that all these variables will have positive signs.
Based on the above definition, the effect of vertical and horizontal diversifications
on the growth rate of total export is estimated using the following regression equation:
GRTEX = a + b1VEXDIV + b2 HEXDIV + b3NER + b4WDD + b5FDI + U, where
GRTEX = is the growth rate of value of total exports.
VEXDIV = is vertical diversification index represented by the ratio of
manufactured exports to total exports.
HEXDIV = is horizontal diversification index proxied by the number of export
products based on Standard International Trade Classifications (SITC) at the
three-digit products classification.

38
NER=the nominal exchange rate, which is the average bilateral nominal exchange
rate between the Ethiopian Birr (ETB) and the US Dollar.
WDD= is the world demand represented by the aggregate nominal GDP of major
trading partners of Ethiopia. (GDP of 48 trading partners, which account for 98%
of export revenue, is considered for the period covering 1982-2012).
FDI= is the inward stock of foreign direct investment into the exporting country.
a= is constant or intercept term
U= error term
b1, b2, b3, b4, and b5 = are the coefficients to be estimated
VEXDIV = (TVMEX) / (TEX) ………………………………...1
Where, VEXDIV is the index of vertical diversification, TVMEX is value of total
manufactured exports, and TEX is value of total exports. Similar to the works of
Yokoyama et’al (2009), horizontal diversification (HEXDIV) in this study has been
proxied by the number of export sectors classified by the Standard International Trade
Classification (SITC) at the three-digit level.
4.5 Stationarity Test
Based on empirical literatures, a unit root test is applied to ascertain stationarity of
variables used in a time series data. The unit root test aids in examining if a particular
variable used is stationary or static. Thus, for our purpose the commonly used technique,
i.e., Augmented Dickey Fuller (ADF) has been applied to detect the stationarity of
variables in the empirical analysis. These variables are: GRTEX, VEXDIV, HEXDIV,
NER, WDD, and FDI. A higher negative value of ADF represents staionarity of data

39
series used. The underlying hypothesis tested shows that non-stationarity in the data
series do exist. The following table summarizes the ADF test and critical values.
Table 5: Results of Stationarity Test using ADF Values
Variables ADF Value
VEXDIV -3.6725 HEXDIV -2.3594 NER -4.057825 WDD -1.521487 FDI -3.22841
According to table 4 above, the test results revealed that the variables used in the
regression model are stationary. This means that the null hypothesis is rejected at a
significance level of one percent and ten percent. Thus, the test result indicates that it’s
meaningful to undertake estimation of the long-run regression. Therefore, the next move
is to measure the long-run effect of vertical diversification (VEXDIV) and horizontal
diversification (HEXDIV) diversification on total export growth (GRTEX).
40
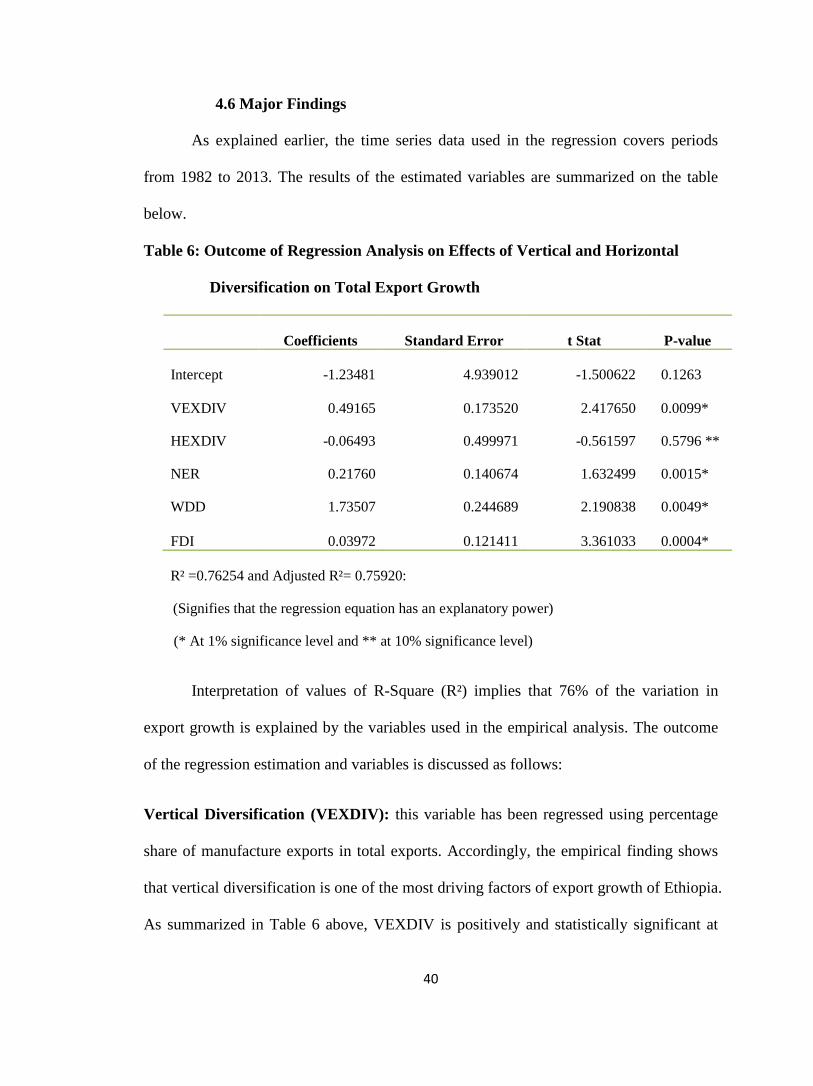
4.6 Major Findings
As explained earlier, the time series data used in the regression covers periods
from 1982 to 2013. The results of the estimated variables are summarized on the table
below.
Table 6: Outcome of Regression Analysis on Effects of Vertical and Horizontal
Diversification on Total Export Growth
Coefficients Standard Error t Stat P-value
Intercept -1.23481 4.939012 -1.500622 0.1263
VEXDIV 0.49165 0.173520 2.417650 0.0099*
HEXDIV -0.06493 0.499971 -0.561597 0.5796 **
NER 0.21760 0.140674 1.632499 0.0015*
WDD 1.73507 0.244689 2.190838 0.0049*
FDI 0.03972 0.121411 3.361033 0.0004*
R² =0.76254 and Adjusted R²= 0.75920:
(Signifies that the regression equation has an explanatory power)
(* At 1% significance level and ** at 10% significance level)
Interpretation of values of R-Square (R²) implies that 76% of the variation in
export growth is explained by the variables used in the empirical analysis. The outcome
of the regression estimation and variables is discussed as follows:
Vertical Diversification (VEXDIV): this variable has been regressed using percentage
share of manufacture exports in total exports. Accordingly, the empirical finding shows
that vertical diversification is one of the most driving factors of export growth of Ethiopia.
As summarized in Table 6 above, VEXDIV is positively and statistically significant at

41
one percent level. This implies that a one percent rise in the share of manufactured
exports in total exports would result in a 0.49 percent increase in total export growth.
Thus, vertical diversification will have a greater significant effect on the growth rate of
total exports in the long run. Similar to other empirical findings, this result proved that
developing countries like Ethiopia should re-focus their policies and strategies towards
augmenting manufactures based exports to bring significant changes to its export
structure and economic transformation.
Horizontal Diversification (HEXDIV): this is measured using the number of export
products at the three digit level in SITC. The empirical evidence on Ethiopia’s case
indicates that horizontal diversification is not positively correlated with export growth in
the long-run. The coefficient of the regression HEXDIV (i.e., -0.065) indicates that it’s
not statistically significant. This finding shows that increasing the number of export
sectors in the long-run doesn’t have a significant impact to enhance export growth in
Ethiopia.
Nominal Exchange Rate (NER): the coefficient of NER reveals that foreign exchange
rate and export growth of Ethiopia have positive correlation. This outcome attests the
anticipation that depreciation of the local currency (ETB) against US Dollar will make
Ethiopian exports more competitive in the global market. Accordingly, in the empirical
study, the NER was presented in local currency per unit of the US Dollar. Thus, the NER
coefficient of 0.22 indicates that a depreciation of the local currency by one percentage
point would trigger exports to grow up by 0.22 percent.
World Demand (WDD): this variable has been regressed using aggregate nominal GDP
of major trading partners of Ethiopia. The GDP of 48 trading partners, which account for

42
98% of Ethiopia’s export revenue, is taken into account. During the study period,
Germany, Saudi Arabia, and China were the top three trading partners of Ethiopia having
a cumulative trade share of 23%. The empirical finding of the coefficient of world
demand (i.e., 1.74) shows the variable is statistically significant at one percent level. Thus,
it can be inferred that when world income rises by a percentage point, the total exports
would expand by 1.74 percent in the long run. Hence, similar to the empirical evidences
for other countries, income elasticity has significant positive impact on export growth.
Foreign Direct Investment (FDI): the outcome of the regression analysis shows FDI has
also a positive relationship with export growth of Ethiopia, though it’s the least variable
in terms of statistical significance compared to the other estimated variables. A
percentage increase in the stock of FDI inflows will result in 0.04 percent increase in
export growth. In fact, the result is consistent with the low level of FDI into Ethiopia that
should be further developed to bring a significant effect on the country’s export growth
through accumulation of capital.
In general, the outcome of the empirical findings is a very fascinating one as it
offers insightful results on the patterns of export diversification and driving factors for
export growth in Ethiopia. Eventually, the empirical finding enables to identify sources of
vertical and horizontal diversifications and their significance to the country’s export
growth and pertinent policy implications.

43
5. CHAPTER FIVE: CONCLUSIONS AND POLICY IMPLICATIONS
5.1 Conclusions
The study analyzed the pattern of Ethiopia’s export diversification and growth by
reviewing the country’s external trade policies, strategies, export structure, and
performance during the last three decades. Moreover, attempts are made to highlight and
discuss the various policies implemented by three different regimes that have ruled the
country and the impeding blocks for growth in the export sector. Ethiopia adopted
different export diversification policies with the framework of an export-led economic
growth strategy. Though a satisfactory performance was not achieved, various export
focused policies and strategies have been put in place during the imperial era, military
regime, and the incumbent EPRDF government.
In the imperial period, the policy and strategy adopted had an orientation towards
import substitution and private sector development. Also, the importance of export
diversification was stressed under three major five-year development plans to attain a
diversified and stable export earnings through curtailing dependence on few primary
agricultural exports and expanding export destinations. Establishment of foreign trade
enterprises, raising tariff rates, introducing export credit schemes and subsides,
controlling foreign exchange, and over-valuation the forex rate, and levying of non-tariff
barriers were among the policy actions taken in the period.
During the military regime, a ten year plan was developed to address export
diversification and growth in the export sector. However, the inward-oriented policies
pursued by the regime had a leaning towards the expansion of state-owned enterprises.

44
This, in effect, destroyed the private sector and privately run companies were crippled
with prohibitive tariff and quantitative restrictions.
Under the current EPRDF regime, a series of economic reforms were made with a
framework of a free market economy and outward-oriented policies as the main growth
strategy. Concerted efforts and measures have been made to boost export diversification
and growth with the participation of the private sector. Devaluation of the local currency,
gradual liberalization of the forex market, restructuring the foreign trade licensing system,
lowering tariffs, and removing export taxes and subsidies were among the major policy
tools implemented in this period.
The study has also tried to identify the pattern of export diversification and
estimate the number of jobs created by the export sector as well as to measure export
concentrations. The export sector played a crucial role in creating employment
opportunities besides its significant contribution to the country’s hard currency earnings.
The study estimated that by the year 2012, the export sector created 4.17 million jobs,
which dramatically increased by 461% from 903,056 jobs in 1981. With regard to export
concentration, HHI index is used to measure the concentration of exports. The result
adapted from UNCTAD database indicated that the HHI index improved to 0.31 in year
2013 from 0.67 in 1982. Similarly, based on the SITC classification, the total number of
export products reached 150 in year 2013 compared to 20 products during 1982.
Another important finding of the study is also the pattern of vertical and
horizontal diversification and its effects on overall export growth. Using a linear
regression model, the research found out that vertical diversification has greater
statistically significant impact on total export growth. Besides, the empirical evidence

45
showed that vertical diversification has no positive relationship with export growth of
Ethiopia in the long-run. Other controllable macro-economic variables such as nominal
exchange rate (NER), world demand (WDD), and FDI were used in the estimation
equation and all variables are found to have positive effect on export growth. Statistically
speaking, a one percent progressive change in the share of manufactured exports in total
exports generates a 0.49 percent improvement in aggregate export growth. Similarly, the
regression outcome indicated that NER, WDD, and FDI are significant in driving export
growth, with coefficients of 0.23, 1.74, and 0.03, respectively.
Despite implementation of various policies and strategies, the performance in
export diversification and growth has been yet at a lower level. The country still has a
narrow base of export structure with growing trade deficits and deteriorating terms of
trade, which had adversely affected its ability to finance its imports. The study has also
revealed that the major deterring factors for a low level of export growth include:
unsound foreign exchange policy, poor infrastructure, high transaction costs, under
developed private sector, poor access to trade finance, and low level of border trade.
Generally, the outcomes of the study show that the challenges facing export
diversification and growth in Ethiopia have structural, institutional, and policy
perspectives.
5.2 Policy Implications and Recommendations
Based on the foregoing discussion, analysis, and empirical findings, the study
draws the following policy implications and recommendations to bring a balanced and
sustainable export diversification and growth in the Ethiopia.

46
Improve Infrastructure Development: there should be increased public investment
in the development of energy, transport, communications, and information technology
infrastructures to build an efficient trade logistics system and reduce transaction costs.
It’s also vital to develop business incubators and special export processing zones. By
doing so, Ethiopia can increase the market competitiveness of its export products in
the global market.
Facilitate Export Trade Financing: the government should ensure sufficient access
to finance for export firms in order to grow the sector. Besides to internal sources of
finance, other external means of financing schemes, for example venture capital
should be sought. As there is no currently any export-import bank that specializes in
financing foreign trade in Ethiopia, it’s also commendable to set up a dedicated
Export-Import Bank through a public-private partnership or other suitable platforms.
Adopt Sound Foreign Exchange Policy: the country should periodically evaluate
the reliability of its foreign currency regime as part of having a healthy macro-
economic policy in general and improved growth in the export sector. As the recent
World Bank empirical study indicates, the real exchange rate in Ethiopia is
overvalued; this favors imports but hurts exports. Thus, policy makers should ensure
to implement a competitive real exchange rate.
Enhance Private Sector Development: there has to be clear policies and strategies
to build a competitive and vibrant private sector that would play a significant role in
the export sector. This involves designing incentive systems, renovating the business
environment, reducing complex procedures, bureaucratic hurdles, and corruptions.
Expand Trading Across Border: the government should speed up the WTO
accession process and carry out bilateral trade agreements to expand export trade.

47
Most importantly, the country should be able to maximize quota and duty free export
entry benefits from various trade development programs and regional partnerships
such as the African Growth Opportunity Act (AGOA), Common Market for East and
South Africa (COMMESA), and Everything but Arms (EBA).
Capacity Building and Support Services: the private sector and export businesses
should obtain capacity building, awareness programs, and trainings on improved
production systems, technologies, and knowledge sharing activities. Moreover,
various export support services such as market linkages, trade fairs, exhibitions, and
expos should be provided on a continual basis.
Attract and Diversify FDI Inflows: Ethiopia should make use of its comparative
advantage of the availability of cheap and trainable labor, land, and natural resources
to attract inbound FDI, discover new export products, boost hard currency earnings,
expand capital accumulation, and enable technology transfer. It’s highly imperative to
diversify the primary agricultural exports, to induce manufacturing based exports, and
to intensify vertical diversification through value addition activities and forward and
backward linkages in the economy. In addition, the highly concentrated FDI stock
inflows from China, Turkey, and India should be diversified by attracting FDI inflows
from other potential countries to avoid possible political and market risks.
******

48
BIBLIOGRAPHY
Agosin, Manuel R. (2007). “Export Diversification and Growth in Emerging Economies,” Working Paper No. 233, Departmento de Economia, Universidad de Chile, Santiago.
Al-Marhubi, Fahim (2000). “Export Diversification and Growth: An Empirical
Investigation,” Applied Economics Letters, Taylor and Francis Journals, Vol.7, page 520-542, September.
Ali, Alwang and Siegel (1991): “Is export Diversification the Best Way to Achieve
Export Growth and Stability? A Look at Three African Countries”, World Bank Working Papers No. 729, 1991.
Amurgo-Pacheco A. and Pierola Martha (2008). “Patterns of Export Diversification in
Developing Countries: Intensive and Extensive Margins.” Policy Research Working Paper 4473, International Trade Department, the World Bank.
Bamou L. T. (2002), “Promoting Export diversification in Cameroon: Toward Which
Products?” African Economic Research Consortium Paper No. 114, Nairobi. Berhanu, Lakew (2002). “Prospects For Export Diversification in Ethiopia”, Economic
Research Department, National Bank of Ethiopia (NBE), Addis Ababa. Bonaglia, Federico, and Kiichiro Fukasaku (2003). “Export Diversification in Low-
Income Countries: An International Challenge after Doha,” Working Paper No.209, OECD Development Centre.
Cadot, Oliver, Céline Carrère and Vanessa Strauss-Khan (2007). “Export Diversification:
What’s Behind the Hump?” CEPR Discussion Paper No. 6590. Ciuriak D. and Preville Claudius. “Ethiopia’s Trade and Investment: Policy Priorities for
the New Government,” Addis Ababa, Ethiopia, September 25, 2010.ries DeRosa, D. A. (1991),” Increasing Export Diversification in Commodity –Exporting
Countries: A Theoretical Analysis”, IMF Working Paper WP/91/105, Washington, DC: IMF.
Economic and Social Commission for Asia and the Pacific-ESCAP (2004): “Export
Diversification and Economic Growth: the experience of Selected Least Developed Countries,” Development Papers No. 24, United Nations, New York.
Emilo J. (2000), “Is the Export-Led Growth hypothesis valid for Developing countries? A
Case Study of Costa Rica”, Policy Issues I International Trade and

49
Commodities, University of Essex, UK and Universities de Carbobob, Venezuela.
Ezezew, Wondemhunegn (2004).”Ethiopia’s Reforms and Export Performance.”
Unpublished Paper.
Ferdous, Farazi Binti (2011). “Pattern and Determinants of Export Diversification in East Asian Economies,” Graduate School of Asia Pacific Studies, Waseda University, Tokyo.
Hasan A.M. and Toda H. (2004), “Export Diversification and Economic Growth: The
Experience of Selected Least Developed Countries,” Development Paper No. 24, New York.
Illescas J. and Carlos Felipe (2011). “ Export Growth and Diversification: The Case of
Peru, “ Policy Research Working Paper No. 5868, the World Bank. Imperial Government of Ethiopia. “The First Five-Year Development Plan, 1957-1961,”
Addis Ababa. ____________________________.”The Second Five-Year Development Plan, 1962-
1967,” Addis Ababa. ____________________________.”The Third Five-Year Development Plan, 1968-
1973,” Addis Ababa. International Trade Center (ITC). “Ethiopia's Export Strategy: Key Features and Major
Influencing Factors. A Presentation at the Regional Executive Forum on National Export Strategies,” Nairobi, 26-28 November, 2001.
Lim J, Saborowski Christian (2011). “Export Diversification in a Transitioning Economy
and the Case of Syria,” Policy Research Working Paper 5811, the World Bank. Mold A. and Prizzon Annalisa (2008). “Explaining Africa’s Recent Export Performance
and the Limited Gains from the Commodity Boom,” OECD Development Centre, March 2008.
Nega, Tsega (2005). Export Performance and the Case for Diversification in Ethiopia.
Addis Ababa University, diss., Addis Ababa. Massel, Benton F (1964). “Export Concentration and Fluctuations in Export Earnings: A
Cross Section Analysis,” American Economic Review, Vol. 11, page 750-790, March.
Matadeen , Sanjay (2011). “Export Diversification and Economic Growth: Case Study of
a Developing Country Mauritius,” Middlesex University, Mauritius.

50
Matthee M, and Naudé Wim (2007). “Export Diversity and Regional Growth: Empirical Evidence from South Africa,” Research Paper No.11, United Nations University, Maastricht.
Matthee M, and Naudé Wim (2008). “Export Diversity and Regional Growth in a
Developing Country Context: Empirical Evidence,” North-West University, Potchefstroom, and United Nations University, Maastricht.
Menji, Sisay. (2010). “Export Performance and Determinants in Ethiopia,” MPRA Paper
No. 29427, Munich. Samen, Salomon (2010). “A Primer on Export Diversification: Key Concepts,
Theoretical Underpinnings and Empirical Evidence,” Growth and Crisis Unit, World Bank Institute.
Tekaligne, Yishak (2009). “Determinants of Ethiopia's Export Performance: A Gravity Model Analysis,” Working Paper No. 01, Munich. Se
Transitional Government of Ethiopia (TGE). “Ethiopia's Economic Policy during the
Transition Period,” Addis Ababa, 1991. United Nations Conference on Trade and Development (UNCTAD). “Economic
Development in Africa: Trade Performance and Commodity Dependence,” New York and Geneva: United Nations, 2011.
United Nations Economic Commission for Africa-UNECA. “Diversification: Towards a New Paradigm for Africa’s Development,” Work in progress No. 35, African Trade Policy Centre, 2006
United Nations Economic Commission for Africa (UNECA). “Diversification and growth.
Economic Report on Africa 2007: Accelerating Africa’s Development through Diversification,” Economic commission for Africa, 2007.
Wilson, Rodney J.A. (1984), “Egypt's Export Diversification: Benefits and Constraints,
in the developing Economic,” Vol. 22, No. 1, page 86-101. Wolde, Kagnew (2004). “Export Performance and Economic Growth in Ethiopia,”
Awarded Theses, the World Bank. Yokoyama, Kenji Y. and Alemu M. (2009). “The Impact of Vertical and Horizontal
Export Diversification on growth: An Empirical Study on Factors Explaining the Gap between Sub-Sahara Africa and East Asia’s Performances,” Ritsumeikan International Affair, Vol 7, Page 1-43, Institute of International Relations and Area Studies, Ritsumeikan University.
Websites:

51
African Economic Outlook (2013). http://www.uneca.org/publications/african-economic-outlook-2013
Ethiopian Revenue and Customs Authority (2013).
http://www.erca.gov.et/index.jsp?id=import_export_info National Bank of Ethiopia (2013).
http://www.nbe.gov.et/publications/annualreport.html The UN comtrade Data Base (2013).
http://comtrade.un.org/db/ The World Bank (2013).
http://data.worldbank.org/data-catalog/world-development-indicators