export performance in high tech goods - european trade study
TRANSCRIPT
1
OCCASIONAL PAPER SERIES
High tech export performance: which role for diversification? ∗
Anna M. Ferragina Researcher, University of Salerno,
Research fellow, ISSM-CNR Via Ponte Don Melillo, 84084
Fisciano - Salerno Tel 0696623457/3495870721
email: [email protected]
Francesco Pastore Assistant Professor, Seconda Università di Napoli
Research fellow, IZA Bonn Palazzo Melzi, Piazza Matteotti, 81055,
Santa Maria Capua Vetere (Caserta) Tel/Fax: +390815495276 email: [email protected]
∗ This paper is part of the World Bank regional research on “Economic Discovery and Export Diversification” carried out by Anna Ferragina with Claudia Nassif, MNSED, World Bank. I am very grateful to Claudia Nassif and Giulia Nunziante (University of Tor Vergata) for insightful discussions and help with the data.

2
Abstract
In this paper we analyse the link between patterns of concentration/diversification of the export structure and patterns of exports of technologically advanced goods. The broad although controversial literature on the bilateral link between production (and export) diversification and growth provided the background for our analysis. According to Feenstra and Kee (2004) increases in export product variety improve country productivity and growth. Another argument often put forward is that diversification may favour growth by reducing the country’s vulnerability to idiosyncratic sectoral shocks (Acemoglu and Zilibotti, 1997). However, there are also arguments in the opposite direction: productive specialization, and therefore an increase in production (export) concentration, are deemed to enhance sectoral productivity growth through learning by doing mechanisms. This productivity effect may be further enhanced by the exposure of firms to international competition (Weinhold and Rauch, 1997). Another research strand has investigated upon the reverse causation, i.e. upon the link between production concentration and growth, as measured by per capita income, showing a non monotonic pattern (Imbs and Wacziarg, 2003; Martincus and Estevadeordal, 2005; Faini, 2006). The relationship between diversification and growth of high technology exports, the object of this paper, is less investigated in the literature. The recent literature has mostly focused on the link between innovation and diversification. Klinger & Lederman (2006) provide evidence that the innovation performance of countries is consistently negatively correlated with their level of export diversification, i.e. we observe more innovation in lower income countries with less specialized export baskets. This is in line with the notion that higher income countries show relatively less frequency of innovation and are more specialised, and with Imbs and Wacziarg (2003) findings, whereby countries diversify up to a certain income level and then specialize again with higher incomes. However, in our opinion, the investigation of the impact of export diversification on high technology exports might carry to similar results. Change in exports of high tech goods may be positively affected by export diversification if export product variety improve the ability of firms to minimise the high risks associated to invest and to enter export market in productions characterised by higher barriers to entry and high sunk costs, as is mostly the case for productions in advanced sectors. On the other hand, an increase in the technology content of a product through way of increased competitiveness, leads to an increase in exports of the improved product. This in turn can contribute to a more balanced product mix, if this product was among those with relatively low shares in exports. To test these hypotheses, we carry out some econometric analysis on the relationship between high technology exports and export diversification (measured by the Hirschman-Herfindahl index of export concentration) using several additional control variables (macroeconomic stability, trade and exchange rate policy, domestic and foreign investment, human capital, governance) in a sample of developed and developing countries (84), over the period 1994-2003. As in the simplest empirical model of trade, the volume of high tech exports are modelled as a function of foreign demand and of price competitiveness, measured by exchange rate and trade regime, and following the new trade and endogenous growth theories (Krugman, 1983, 1989; Grossman and Helpman, 1991, 1995), factors other than price competitiveness such as the human capital as well as technological advances are also considered using as proxy fixed capital formation, TFP, human capital and R&D expenditure. We also look at survey data on the quality of institutions and on investment climate. These latter provide measures of factors that may ultimately feed into export performance such as money market regulations, tax and trade regimes, legal structures, regulatory framework and property rights. Equations are estimated using a sample of cross-section and time series data. We use the panel data econometric methodology. Tests of fixed and random effects are conducted to select the most adequate models. By the different estimations carried out we select a preferred specification from which we calculate potential high tech exports relative to observed for all the countries in the sample. We also focus in particular on a sub-samples of 14 countries from the MENA region whose high tech exports are vastly smaller than those from other sub-regions with similar populations and resource endowments. The structure of the paper is as follows. After a short introduction, a brief theoretical analysis of the main determinants of diversification, innovation and high tech exports is carried out in section 1. In section 2 we analyse the patterns of export structure providing a short description of the main trends and changes occurred in export concentration and in high tech exports over the 1980s and 1990s across the main regions of the world. Section 3 contains the econometric analysis through a discussion of main issues, methodology, results. A short conclusion follows.
3
Introduction In this paper we analyse the link between patterns of concentration/diversification of the export structure and patterns of exports of technologically advanced goods. The broad although controversial literature on the bilateral link between production (and export) diversification and growth provided the background for our analysis. Feenstra and Kee (2004) show that increases in export product variety improve country productivity. Another argument often put forward is that diversification may favour growth by reducing the country’s vulnerability to idiosyncratic sectoral shocks (Acemoglu and Zilibotti, 1997). However, there are also opposite arguments stressing how productive specialization, and therefore an increase in production (export) concentration, may enhance sectoral productivity growth through learning by doing mechanisms. This productivity effect may be further enhanced by the exposure of firms to international competition (Weinhold and Rauch, 1997). A recent literature has also focused on the link between innovation (discovery) and diversification. Klinger & Lederman (2006) provide evidence that the innovation performance of countries i.e. the frequency of discovery is a non linear function of the level of development (inverted u-shaped relationship) i.e. as income rises the frequency of discoveries declines especially at high level of income when economies experience rising specialisation. Therefore, there is a consistently negative correlation of discovery with export concentration, i.e. we observe more innovation in less advanced countries with less specialized export baskets. We wish to concentrate our attention upon a neglected issue so far: the technology pattern of exports in relation to export or production concentration. To test this relationship, we carry out some econometric tests on the relationship between high technology exports and export diversification (measured by the Hirschman-Herfindahl index of export concentration) using several additional control variables (macroeconomic stability, trade and exchange rate policy, domestic and foreign investment, human capital, governance indicators) in a sample of developed and developing countries (84), including 14 MENA economies, over the period 1994-2003. As in the simplest empirical model of trade, the volume of high tech exports are modelled as a function of foreign demand and of price competitiveness, measured by exchange rate and trade regime, and following the new trade and endogenous growth theories (Krugman, 1983, 1989; Grossman and Helpman, 1991, 1995), factors other than price competitiveness such as the human capital as well as technological advances are also considered using as proxy fixed capital formation, TFP, human capital and R&D expenditure. We also look at survey data on the quality of institutions and the investment climate. These latter provide measures of factors that may ultimately feed into export performance such as money market regulations, tax and trade regimes, legal structures, regulatory framework and property rights. Equations are estimated using a sample of cross-section and time series data. We use the panel data econometric methodology. Tests of fixed and random effects are conducted to select the most adequate models. By the different estimations carried out we select a preferred specification from which we calculate potential high tech exports relative to actual. Therefore, the econometric framework developed is exploited to explain the deficiency of high tech trade of some countries of our sample and to check what are the biggest under-performers. We focus especially on a sub-samples of 14 countries from the MENA region, whose tech exports are vastly smaller than those from other sub-regions with similar populations and resource endowments. This paper contributes to the existing literature in several ways. First of all, it checks whether the investigation of the impact of export diversification on high technology exports carries to similar results as the analysis by Klinger-Lederman on the impact of diversification on innovation (discovery) activities where they show that innovation activities are negatively associated with higher productive specialisation. We expect to also find a negative relationship based on the suggestion that export

4
products variety improve the ability of firms to minimise the high risks associated to invest and to enter export market. This should be crucial for productions in advanced sectors which are characterised by higher barriers to entry and high sunk costs. Also the opposite link leads to the same consideration. Increase in the technology content of a product through way of increased competitiveness leads to an increase in exports of the improved product. This in turn can contribute to a more balanced product mix, if this product was among those with relatively low shares in exports. Investigation of the link between high tech exports and diversification therefore complements the large attention devoted recently to the investigation of the link between diversification and growth and innovation and diversification. We also wish to control for other important factors affecting high tech exports. The first factor is trade restrictions. These should lead to a shift out of exportables and into of importables. However, the impact on export diversification and high tech exports may go either way. Supposing, as in Melitz (2003), that export activities carry out a fixed cost, under a protectionist trade regime, the export sector will be underdeveloped. Accordingly, only a relatively limited number of firms will be able to afford the fixed costs of exporting, which might lead to less export diversification and lower shares of high tech exports in the country’s pattern. We also check for the role of real exchange rate. As argued by Martincus and Estevadeordal (2005), real exchange misalignment is also likely to have an impact. For instance, a highly appreciated real exchange rate could depress export profitability and force many firms out of export markets, with a negative impact on export variety and possibly also on export success in high tech goods. An appreciated real exchange rate in particular should lead to a disproportionate expansion of imports and induce a concentration of productions in those sectors where the country’s comparative advantage is strongest: higher concentration and lower probability of catching up in high tech sectors. Further, we check for the role of domestic and foreign investment. The impact on export diversification and technology content is again a priori ambiguous. If FDI is mainly directed to the exploitation of natural resources, it should lead to lower technology export structure for the host country. Also with market seeking FDI, multinational corporations will cater mainly to the domestic markets of the host country. The impact on export diversification and high tech exports should be nil or even negative, if domestic costs rise as a consequence of the foreign capital inflows and displacement. Conversely, with vertical FDI, foreign firms may become more likely an engine of production and export upgrading, through spillovers, as argued for instance by Brambilla (2005). Empirical evidence suggest that, during the nineties, vertical FDI has expanded rapidly, spurred by globalization and falling trade barriers (Faini, 2004). The predominance of vertical inward FDI in developing countries and the growing role of trade in components should imply that investment by multinational corporations should be associated with a more diversified and high quality export structure. The structure of the paper is as follows. A brief theoretical analysis of the main determinants of diversification, innovation, growth and high tech exports is reviewed in section 1. We then analyse in section 2 the patterns of export structure providing a short description of the main trends and changes occurred in export concentration and in high tech exports over the 1980s and 1990s across the main regions of the world. Section 3 contains the econometric analysis carried out dealing with main issues, methodology, results. Some conclusions follow.
1. A brief analysis of the main determinants of diversification, innovation and high tech exports It is difficult to establish the relationship between innovation and export diversification. Intuition would tell us that innovation contributes to export diversification. Per simple definition, innovation can
5
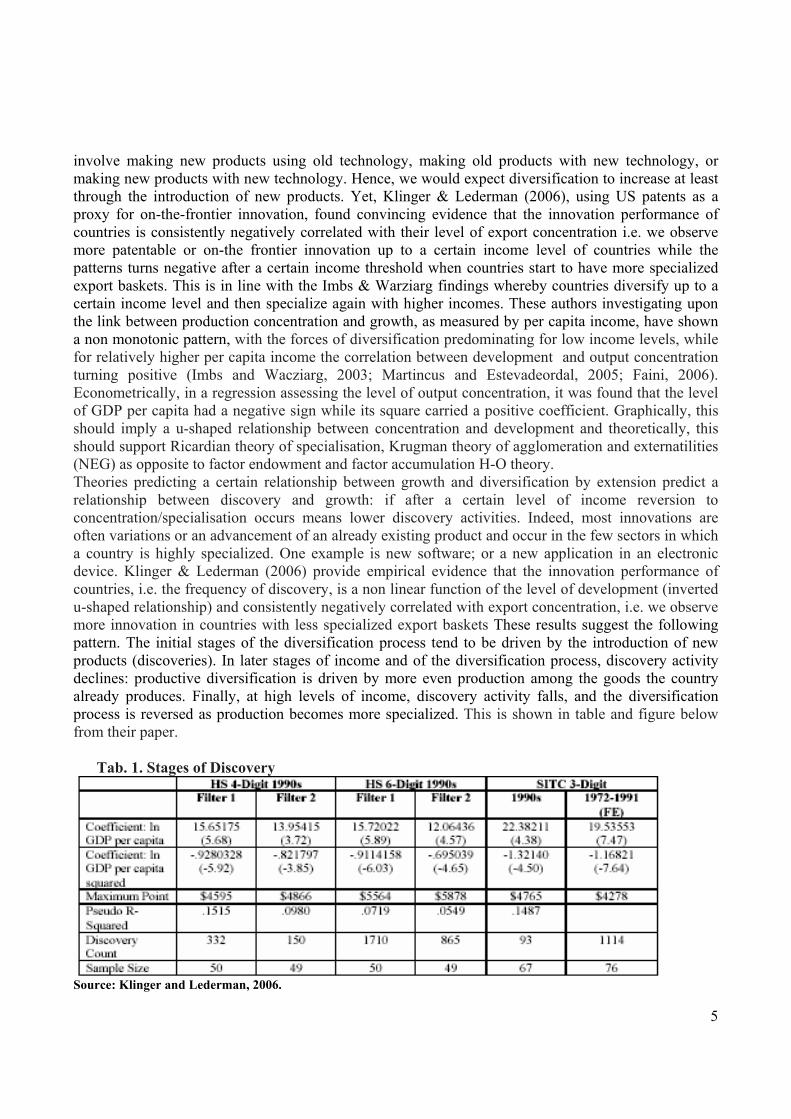
involve making new products using old technology, making old products with new technology, or making new products with new technology. Hence, we would expect diversification to increase at least through the introduction of new products. Yet, Klinger & Lederman (2006), using US patents as a proxy for on-the-frontier innovation, found convincing evidence that the innovation performance of countries is consistently negatively correlated with their level of export concentration i.e. we observe more patentable or on-the frontier innovation up to a certain income level of countries while the patterns turns negative after a certain income threshold when countries start to have more specialized export baskets. This is in line with the Imbs & Warziarg findings whereby countries diversify up to a certain income level and then specialize again with higher incomes. These authors investigating upon the link between production concentration and growth, as measured by per capita income, have shown a non monotonic pattern, with the forces of diversification predominating for low income levels, while for relatively higher per capita income the correlation between development and output concentration turning positive (Imbs and Wacziarg, 2003; Martincus and Estevadeordal, 2005; Faini, 2006). Econometrically, in a regression assessing the level of output concentration, it was found that the level of GDP per capita had a negative sign while its square carried a positive coefficient. Graphically, this should imply a u-shaped relationship between concentration and development and theoretically, this should support Ricardian theory of specialisation, Krugman theory of agglomeration and externatilities (NEG) as opposite to factor endowment and factor accumulation H-O theory. Theories predicting a certain relationship between growth and diversification by extension predict a relationship between discovery and growth: if after a certain level of income reversion to concentration/specialisation occurs means lower discovery activities. Indeed, most innovations are often variations or an advancement of an already existing product and occur in the few sectors in which a country is highly specialized. One example is new software; or a new application in an electronic device. Klinger & Lederman (2006) provide empirical evidence that the innovation performance of countries, i.e. the frequency of discovery, is a non linear function of the level of development (inverted u-shaped relationship) and consistently negatively correlated with export concentration, i.e. we observe more innovation in countries with less specialized export baskets These results suggest the following pattern. The initial stages of the diversification process tend to be driven by the introduction of new products (discoveries). In later stages of income and of the diversification process, discovery activity declines: productive diversification is driven by more even production among the goods the country already produces. Finally, at high levels of income, discovery activity falls, and the diversification process is reversed as production becomes more specialized. This is shown in table and figure below from their paper.
Tab. 1. Stages of Discovery
Source: Klinger and Lederman, 2006.

6
Fig. 1. Discovery Events (HS 4-Digit)
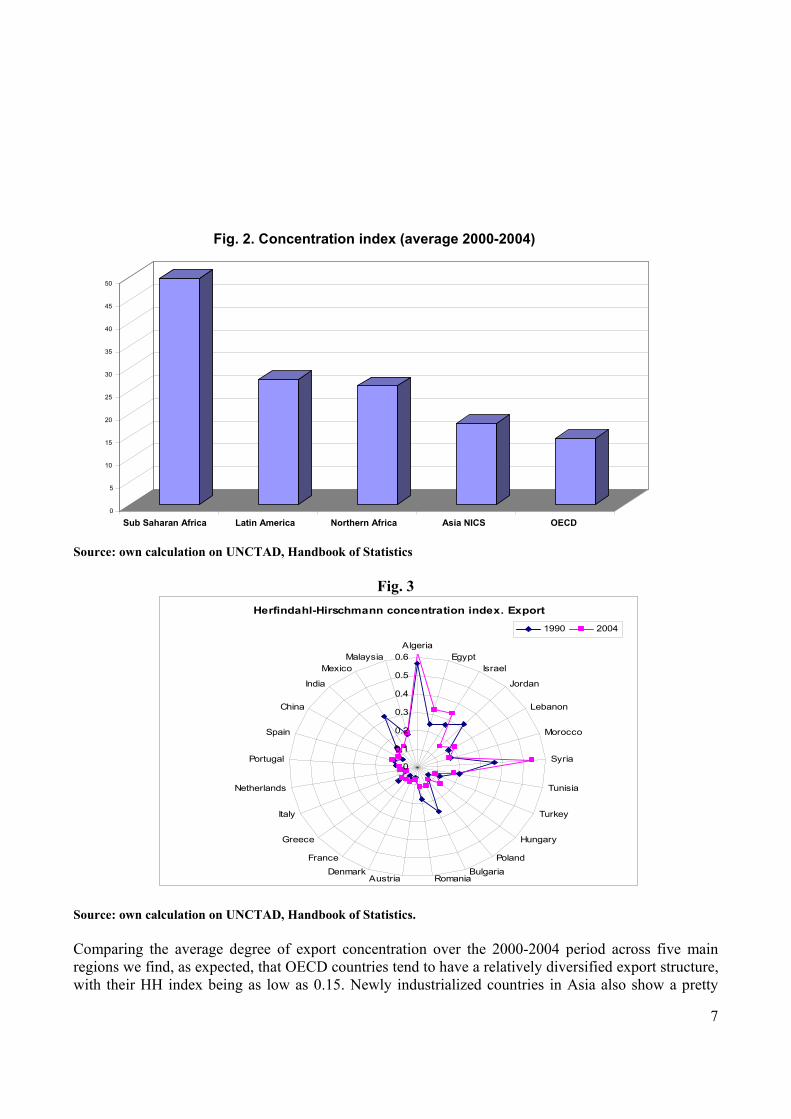
Source: Klinger and Lederman, 2006. The quoted literature focussed on the link between trade concentration, innovation and GDP. But how high technology exports are associated with export diversification? We expect to find a positive relationship based on the suggestion that export products variety improve the ability of firms to minimise the risks associated to invest and to enter export market which are high for productions in advanced sectors as these are characterised by higher barriers to entry and high sunk costs. On the other hand, an increase in the technology content of a product through way of increased competitiveness, leads to an increase in exports of the improved product. This in turn can contribute to a more balanced product mix, if this product was among those with relatively low shares in exports. In section 3, a regression analysis which correlates high technology exports as an indicator for technological change with a concentration measure (Hirschman-Herfindahl index) carries out this analysis also checking whether there is a monotonic pattern between high technology exports and concentration. The results give apt to believe that lower levels of export concentration is associated with more high-technology exports in a linear way. 2. The patterns of export structure: main trends and changes occurred in export concentration / diversification and in exports of high tech goods The degree of concentration differs considerably across regions. We can measure export concentration by the Herfindahl-Hirschmann (HH) index at the 4 digit level SITC classification (see figure 2 and 3).
7
Source: own calculation on UNCTAD, Handbook of Statistics
Fig. 3 Source: own calculation on UNCTAD, Handbook of Statistics. Comparing the average degree of export concentration over the 2000-2004 period across five main regions we find, as expected, that OECD countries tend to have a relatively diversified export structure, with their HH index being as low as 0.15. Newly industrialized countries in Asia also show a pretty
Herfindahl-Hirschmann concentration index. Export
0
0.1
0.2
0.3
0.4
0.5
0.6Algeria
EgyptIsrael
Jordan
Lebanon
Morocco
Syria
Tunisia
Turkey
Hungary
PolandBulgaria
RomaniaAustriaDenmark
France
Greece
Italy
Netherlands
Portugal
Spain
China
India
MexicoMalaysia
1990 2004
0 5
10 15 20 25 30 35 40 45 50
Sub Saharan Africa Latin America Northern Africa Asia NICS OECD
Fig. 2. Concentration index (average 2000-2004)

8
similar degree of concentration, just marginally above that of OECD countries. Latin American and Northern African countries are in a intermediate position. However, we observe that in 2004 MENA countries’ exports were generally more concentrated than in 1990. Although extreme values are only reached by oil producing countries such as Algeria and Syria (almost 0.6), the figures are quite high (between 0.2 and 0.6) for all MENA countries. This value is very high both if compared to EU countries and to developing countries such as China, India, Mexico, Malaysia and Eastern European countries (around 0,1 in 2004). Only Jordan shows a big reduction from a relatively high value (from 0.3 to 0.1), while Morocco and Tunisia are stable (around 0.3) and Egypt, Lebanon, like many others in this area (Israel, Algeria and Syria), on the contrary, have further increased export concentration. It is quite a different trend with respect to competitors such as Turkey, India, Mexico, Bulgaria and Romania, where there is a strong decrease in concentration from already lower level. Figure 4 presents the evolution of the technological structure of exports from 1990 to 2004 across the main regions of the world, using the Lall classification of products according to the technological intensity (resource-based or RB, low technology or LT, medium technology or MT, high technology or HT) 1 . We got results in line with received trade theory which predicts that developing countries will have the strongest comparative advantages in LT and the weakest in HT products. Again, we observe that the performance of some MENA countries in terms of manufactured exports structure by technology intensity are vastly smaller than those from other group of countries with similar populations and resource endowments. The five MENA (Tunisia, Egypt, Lebanon. Jordan and Morocco) export structure although not stagnant shows a quite slow rate of upgrading and a lag with respect to other regions substantially unchanged especially due to a weakness in MT. In Latin America, high and medium technology products almost reach 37% compared to only 23-25% of the five MENA. EU15, South East Asia and the new EU members, reach more than 55% of exports from MT and HT products. In 2004 nearly 80% of Egypt manufactured exports are accounted for by resource based (RB) and another 14% by low technology (LT) products. Medium and high tech (MT and HT) products together only contribute 6.2% of its exports. The remaining four MENA have also low shares in MT and HT. The pace of structural change in some exporters, particularly the dynamic new EU members (from 27 to 48%), East and Southeast Asian economies (from 32 to 50%) and Latin America (from 12 to 34%) progress has been impressive. Conversely, MENA countries have not been able to move away from a specialisation based on the exploitation of natural resources and towards a strategy to develop trade structures more diversified and more based on higher technological complexity. In view of the rapid changes in the structure of world trade and the growing importance of technology-intensive products, this relative structural stagnation is a major weakness. There are reasons to believe that export structures dominated by technology intensive products have better growth prospects than do others and enhance export competitiveness, know how improvement and attraction of FDI. The argument are various: the most dynamic products in world trade use complex and fast-moving technologies; technology-intensive activities are less vulnerable to entry by competitors compared to low technology activities where scale, skill and technology requirements are low; a low technology export structure over time can sustain export growth only by taking shares from other low technology exporters; technology-intensive activities have a higher learning potential, lead to faster growth in capabilities and higher quality capabilities (assembly of electronic components is more valuable for learning than assembly of garments); capabilities in technology-intensive activities are less sensitive to technological and market trends; a technology-intensive structure is likely to have larger spillovers to other activities and to the national technology system.
1 Sanjaya Lall (2004), Turkish Performance in Exporting Manufactures: A Comparative Structural Analysis, QEH Working Paper Series , Working Paper Number 47, 2000.

9
Recent economic research has shown that open economies tend to adjust more rapidly from primary-intensive to manufactures-intensive exports and trade policy reforms can increase the share of manufactured exports in GDP (Sachs and Warner, 1995; Sekkat and Varoudakis, 2002 specifically on MENA). Similar conclusion were reached by Achy and Sekkat (2003), and by Nabli and Véganzonès-Varoudakis (2003), regarding the impact of exchange rate policy in the MENA countries. The MENA region’s poor export performance has been related to the prolonged application of inward-looking strategies based on import-substitution (Nabli and De Kleine, 2000), strategies which were abandoned by a number of countries in other regions during the 1980s, as part of their process of economic reform. These countries achieved a greater outward orientation, and created a favourable climate for trade, by lowering trade barriers, privatizing many industries, and reforming the foreign-exchange market. The MENA countries are also implementing some of the same reforms, but at a slower pace (Nabli and Véganzonès-Varoudakis, 2004).
Figure 4. Evolution of the Technological Structure of Exports
Exports (share of total, %)
0
10
20
30
40
50
60
70
80
90
Resource based 61,7 61,6 66,3 58,1 42,7 29,1 46,2 76,4 28,6 49,2 79,2 39,0 49,0 38,3 29,1 25,0 21,0 49,5 19,2 34,5
Low Tech 33,5 13,3 22,1 26,8 41,2 22,4 24,4 9,6 36,1 26,7 14,6 34,5 25,7 37,6 47,6 19,2 27,0 12,9 26,8 41,5
M edium Tech 1,7 14,1 5,8 10,1 8,7 32,6 20,0 10,4 11,1 17,9 4,2 12,1 17,0 10,0 7,4 32,5 28,9 18,3 12,5 13,2
High Tech 3,2 11,0 5,7 4,9 7,4 15,9 9,3 3,5 24,3 6,2 2,0 14,4 8,4 14,1 16,0 23,2 23,0 19,3 41,5 10,8
Egypt Jordan Lebanon M oroccoTunisia EU15 New 10 EUDevelopi South Ea South EaEgypt* Jordan Lebanon*M oroccoTunisia EU15* New 10 EUDevelopi South Ea South Ea
1990 2004
1990 2004
Source: own calculation on UNCTAD, Handbook of Statistics. To sum up, MENA countries have not been able to move away from a specialisation based on the exploitation of natural resources and to develop trade structures more diversified and more based on higher technological complexity. Therefore, these countries are unlikely to sustain rapid growth now that the with the removal of the MFA trade has been fully liberalised. The textile and clothing exports are unlikely to be the driving force of export growth as in the past. While producers have improved their equipment and quality significantly, and are investing in design capabilities, they do not have a

10
marked competitive edge over leading producers in East Asia. Therefore, there is an urgent need of addressing the barriers to diversification, to integrate into global production chains and to attract more FDI which are both a crucial fuel of expansion of output and exports of more advanced manufactures.
3. The Empirical Analysis We focus on the interpretative model on the relationship between technology and external trade and we present an econometric analysis explaining the growth of export as the result of both supply side factors – technological competitiveness and capital stock – and price factors – terms of trade, exchange rates and exchange parities. We first start our estimates by conditioning high technology exports on domestic production, foreign demand, price-related factors that affect price competitiveness, which are usually among the most important determinants of trade. Therefore, we introduce in our equation as exogenous variables: per capita incomes (as a proxy for overall skills and institutional endowments that influence the capacity to export higher quality goods), foreign demand and some measure of price competitiveness selected taking into account that the prices of tradable goods and services are strongly affected by tariff levels and non-tariff barriers as well as by real effective exchange rates and by terms of trade. We also take into account for this analysis whether the exporter is an oil producing country to check whether natural resource endowments affect negatively the development of advanced manufacturing2. However, while in the simplest empirical model of trade, the volume of exports was modelled as a function of demand and relative prices, in the new trade and endogenous growth theories developed by Krugman (1983, 1989) and Grossman and Helpman (1991, 1995), foreign demand and price competitiveness explain only part of export behaviour of countries: factors other than price competitiveness also play a pivotal role in explaining export upgrading. For instance, export flows upgrading is increasingly affected by the globalisation of production as well as by rapid technological advance. Against this background, the aim of this paper is to discuss and evaluate how other factors, which we broadly define as non-price competitiveness factors, may help to explain export performance. We move from the consideration of the role of investment in the technological upgrading, using as proxy fixed capital formation and TFP. Then, following a brief overview of the literature on the relationship between innovation and product quality3, we assess the evolution over time of various 2 Although Lall (2000) noticed that countries with comparable resource endowment often follow different diversification path depending on the degree of exposure of the country to world markets competition. 3 Grossman and Helpman acknowledge the role of innovation in the development of new varieties of a horizontally differentiated product, but they also stress the importance of innovation in developing new products that are of higher quality than similar goods available on the market. Spending more on innovation enhancing activities, such as R&D, enables firms to improve the products and thereby move up the quality ladder relative to competitors. Consequently, in a framework of monopolistic competition, it is possible that a country can shift its export demand curve outwards by innovating which, in turn, increases the quality of the goods it produces. At the industry level, numerous econometric studies have found evidence of a positive impact of innovation – proxied by factors such as patenting activity and R&D expenditure – on trade performance (see, for example, Fagerberg, 1988; Oliveira-Martins, 1993; Ioannidis and Schreyer, 1997). Oliveira-Martins (1993) and Ioannidis and Schreyer (1997) find that R&D expenditure and patenting activity are far more important factors in the demand curves for trade in the medium and higher-technology intensity sectors than for the low-tech sectors.
11
proxies for technological competitiveness – such as patenting activity and R&D expenditure – for the MENA area and major competitors, as well as their possible relationship with developments in export performance. We also look at some structural indicators of competitiveness such as educational attainment and survey data on the quality of institutions and the investment climate. The latter provide measures of factors that may ultimately feed into export performance such as labour market regulations, tax and trade regimes, legal structures, regulatory framework and property rights. We also expect that lower levels of export diversification impact negatively and significantly on the technology intensity of exports as diversification is associated to the adoption of new processes, which tend to increase, on average, the possibility of spillovers to other sectors. Lower degrees of diversification is expected to have a negative and significant impact on the technology content of exports of a country. Finally, integration into global production chains and attraction of more FDI are all a crucial fuels of expansion of output and exports of more advanced manufactures. The model explains high technology exports as a percentage of manufactured exports (HTEXP) in logarithmic form first by using a set of variables related to demand and price competitiveness: - the world GDP (WGDPi,t), which may have a “pulling” role in high tech exports; -the domestic per capita GDP (GDPPC) as a proxy for overall endowments that influence the capacity to export higher quality goods); - the terms of trade (NBTTi,t), the improvement of which increases the profitability of production for exports; - the volatility in relative prices, approximated by the volatility of the RER (ERV) and calculated as the coefficient of variation of the RER over a five- year period (RER volatility increase uncertainty regarding the profitability of producing tradable goods); -tariff measures such as customs and other import duties as a percentage of tax revenue (TARRIFA) and MFN rate on manufactured goods (TARRIFB) Then we introduce the remaining technological and structural non price competitiveness variables which are: - the logarithm of the gross fixed capital formation to GDP (CAPITAL2), which is conducive to an increase in overall production capacity, and thus to an increase in technology export capacity; - total factor productivity (TPF) - research and development expenditure as % of GDP (RD) -infrastructures endowment measured by road paved (as % of total road) and telephone mainline (per 1000 inhabitants); - the availability of human capital, approximated by the logarithm of secondary school enrolment ratio on net enrolment (HUMANi,t ), by the percentage of physicians on 1000 people (HUMANBi,t ) and by literacy rates (HUMANAi,t ); - current and capital account restrictions (CURRENT and CAPITAL); - the “institutional quality” and political environment were drawn from a standardised sum of the six World Bank Governance Indicators by Kaufman, Kray and Mastruzzi (2005) (GOVA); - alternatively, one of the investment climate indicators House of Freedom (the scale awards the highest value to the lowest risk, and the lowest value to the highest risk) and Fraser index (HF1 and FI) (see box 1 for further explanations of these indices); - the export concentration index (CONCit); - foreign direct investment (FDI). A more detailed explanation of the variables is contained in tab. 1 in Appendix where there is also in Table 2 a the list of countries in the sample and a box on the Institutional variables considered (box 1).

12
In addition, we control for the heterogeneity of the sample by considering country and region dummy variables. These variables reflect differences in the quality of institutions or different endowments in natural resources—which can be the origin of large discrepancies in the natural propensity to export. Table 3 in appendix also reports the mean value of the variables used in the estimate with respect to three macro regions: EU, ten Central and East European countries and 10 South Mediterranean countries. Equations are estimated using a sample of cross-section and time series data. The sample includes annual data from 1994 to 2003 and covers some 84 mostly middle-income countries (including all the MENA countries).. We use the panel data econometric methodology. Tests of fixed and random effects are conducted to select the most adequate models. By the different estimations carried out we select a preferred specification from which we calculate high tech exports relative to potential. Therefore, the econometric framework developed is exploited to explain the deficiency of high tech trade and to check what are the biggest under-performers among MENA countries and whether all the MENA countries are under-performers. For the MENA countries we expect that high tech exports are, on average, much below their predicted levels with only Jordan and Morocco possibly having exports close to what would be predicted. 3.1 Estimation results: estimate of high tech exports as a function of demand, price and non price competitiveness factors For the purpose of this study we have conducted a preliminary regression analysis, exploring the role played by export diversification, research and development, degree of protection of intellectual property rights, FDI, governance, investment climate, human capital in the promotion of export technology intensity. Table 4 in appendix reports the estimation results. There are 12 specifications: most regressions incorporates basic variables related to World GDP, per capita GDP, terms of trade and tariff barriers. This is the basic model to which the other non price competitiveness technological, structural and institutional variables are added in each equation separately (R&D, FDI, TPF, fixed capital and human capital, institutional quality indicators, concentrations index of exports). They are introduced separately on top of the basic specification otherwise we would end up with a very limited number of observations as there is a problem of missing observations for many variables, especially the exchange rate variables but also the additional variables related to R&D, human capital, TPF. Equation 1 and 2 add to the basic variables real exchange rate and volatility of exchange rate. The coefficients are all significant except for volatility of exchange rate and have the expected sign. Tariff barriers, expressed in specification 1 and 2 as tariff revenues in percentage of tax revenue, and in specification 3 and 4 as most favoured nation rate on manufactured goods, is a very robust variable highly negative and significant in all the specifications adopted and its coefficient level is broadly consistent and similar across specifications. Clearly, a high degree of trade protection has a negative impact on high technology exports, while terms of trade and national wealth provide an incentive to developing this kind of exports. However, international evidence suggests that companion policies aimed at strengthening the investment climate would be needed to further increase the capability of a country for technology upgrading. Controlling for the level of development and exporter fixed effects, first, the availability of adequate human capital can be seen as a necessary condition for it due to its complementarities with it. Finally, sound political environment and economic policies due to the role they play in lowering profit
13
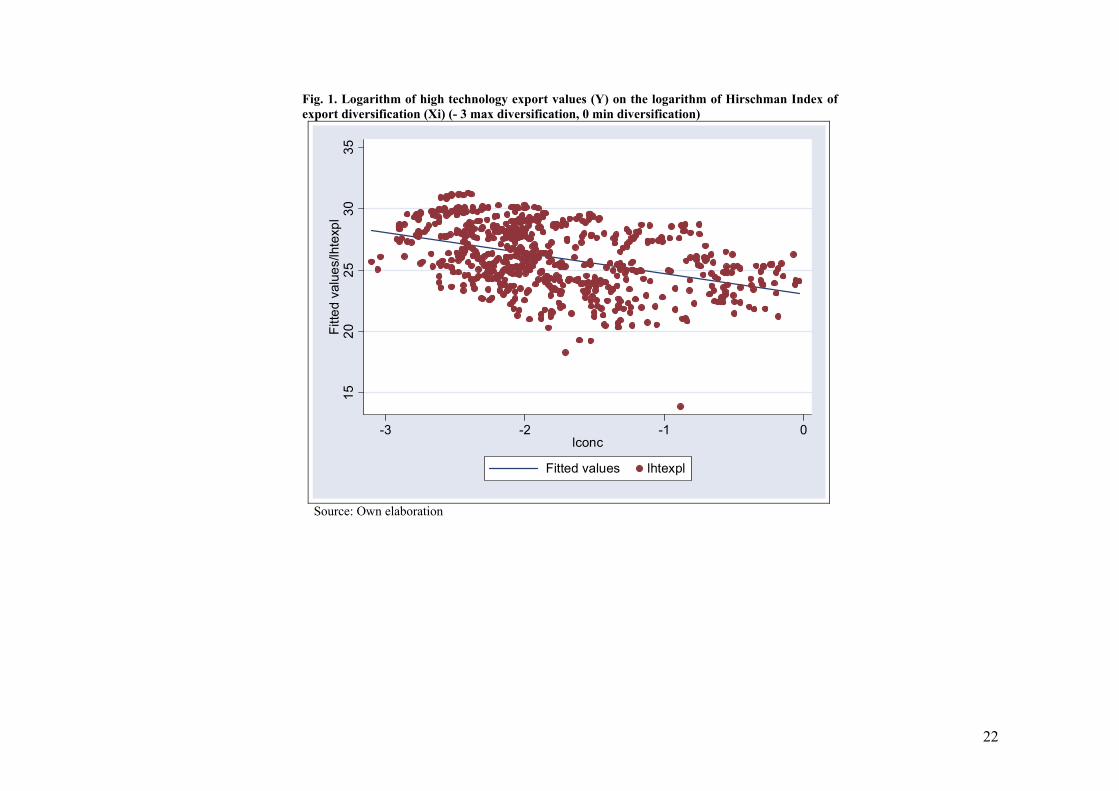
uncertainty are encouraging factors for facing higher added value activities on export market which require large scale investment, high sunk costs and know how. To disentangle the role of these various determinants, we augmented and re-estimated equation 1, using separate indicator for each determinant. In equation 5 R&D is added and also the significance appears quite high. The same happens with total factor productivity (equ. 7), human capital (equ. 9), concentration of exports and institutional quality variables (eq. 11). Conversely, neither FDI net inflows nor gross fixed capital formation in % of GDP (equation 6 and 8) play a significant role in enhancing high technology exports. Our results confirm that a friendly business climate complements trade and foreign exchange reforms in enhancing exports quality. The additional indicators were also introduced simultaneously in a final equation (Equation 12) which partially confirmed the previous results. When additional determinants are introduced simultaneously, the coefficient of human capital and of governance become insignificant – possibly due to co-linearity. One can, therefore, observe that trade and foreign exchange liberalization still play a prominent role once other determinants are taken into account. As expected, also lower levels of export diversification impact negatively and significantly on the technology intensity of exports. Fixed effect regressions on a world-level panel show that, along with the level of development (gdppc) increased diversification (measured through the Hirschman index) leads to higher levels of high-tech exports on total exports (see fig. 2 in Appendix). Why is diversification leading to increased technology of exports? One possible explanation is that diversification is associated to the adoption of new processes, which tend to increase, on average, the possibility of spillovers to other sectors. Increased quality in the export product mix opens up new possibilities to expand and improve the overall export performance, and diversification appears to be a tool for quality improvement. Our results also highlight that total high tech exports are positively influenced by the GDP of the trade partners and by the physical and human infrastructure (measured using respectively, as proxies, the length of roads and the ratio of secundary education enrolment on total enrolment of the population). The pulling effect of the trade partners’ GDP and also of per capita GDP is particularly strong (coefficient above 1). This result goes in the direction expected—the income elasticity being higher than 1 for high tech products than for other exports in the economy. The same conclusions can be drawn for human infrastructure which improves the competitiveness of manufactured exports. Education is a key factor for manufacturing competitiveness in the developing world. Manufactured exports of technology goods are also, however, sensitive to improvement in terms of trade, which amelioration could have provided an incentive to produce for the tradable sector. Exchange rate policy does not show to be associated with losses in high tech manufactured exports. Our estimations also fail to show a significant impact of RER volatility on high technology manufactured exports. This finding does differ from the empirical results reached by several studies for different groups of economies on overall manufactured exports (Ghura and Grennes, 1993; Grobar, 1993; Cushman, 1993; Gagnon 1993). Preliminary results from a panel analysis at the world level provide evidence that technology intensity has a positive and significant effect on overall export performance. Controlling for the level of development and exporter-specific fixed effects, increased export quality leads to improved export performance through higher exports (World Bank, 2006). In this study in order to further ground first results on the positive role of increased technological content on export performance the variable on high-tech intensity of exports have been instrumented with data on higher education of labor force, net inflows of FDI and expenditure on R&D. These controls confirm that a higher share in high tech exports leads to increased exports and to an improved export performance.
14
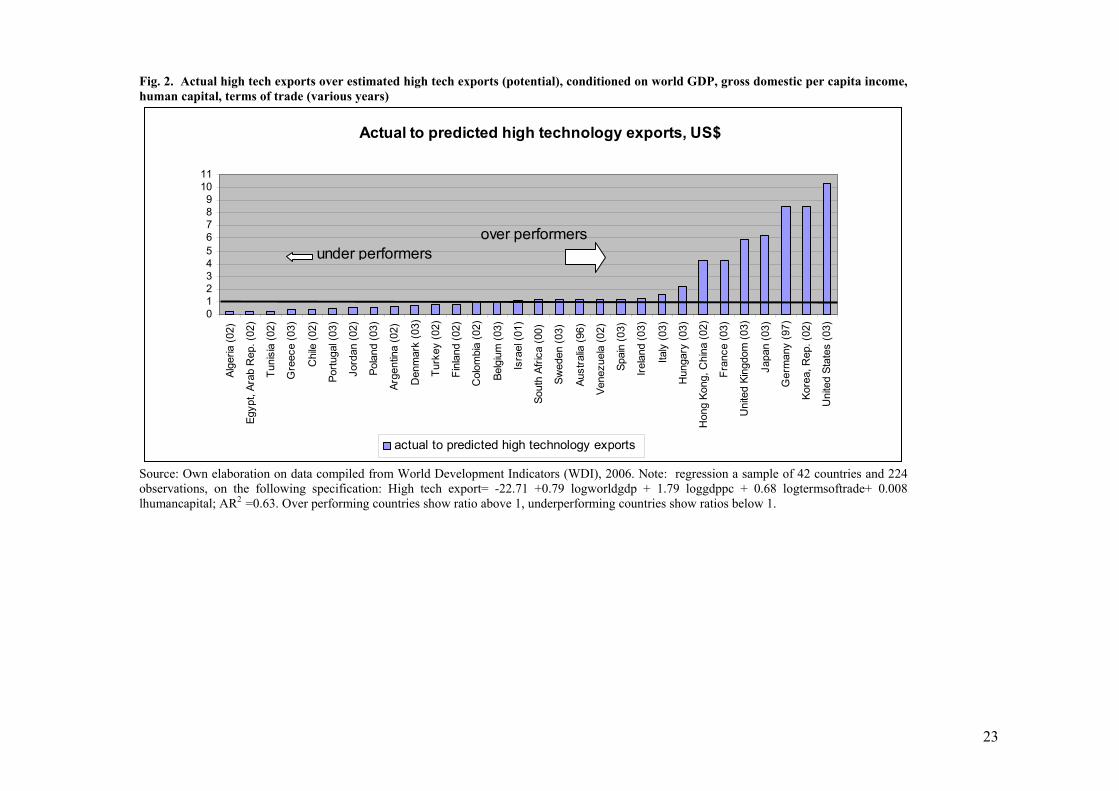
3.2 Estimation results II: actual to potential high tech exports. The econometric framework developed above was exploited to explain the deficiency of high tech trade and to check the biggest under-performers among the countries considered (graf. 1 in Appendix). For the MENA countries we expect that high tech exports are, on average, much below their predicted levels, with only Jordan and Morocco possibly having exports close to what would be predicted. To this purpose, we calculated the ratio between actual high tech exports relative to predicted on the basis of a model specification which incorporate only some demand factors (world GDP), supply factors (gross domestic per capita income, human capital as a proxy for overall skills and institutional endowments that influence the capacity to export) and price factors (terms of trade) for the most recent years for which we could obtain an estimated value (not always the final year due to missing observations). For 42 mostly middle-income countries (including some MENA countries), the results suggest a strong positive association of high technology exports on all these variables considered. That is expected, since higher skills endowments should support higher technology exports. For the MENA countries, their high technology exports are much below their predicted levels. Only Jordan and Morocco had exports close to what would be predicted. The two biggest under-performers in the sampler are two MENA countries (Algeria and Egypt), and the other MENA countries considered are all under-performers.
Conclusion In this paper, we have shown, for a panel of 84 countries studied during the period 1994-2003, the positive and monotonic impact of a lower degree of concentration of exports on technological upgrading of exports. We also found that trade and foreign exchange liberalization constitutes a key factor for the technological upgrading of a country’s exports and that trade protection and exchange rate misalignment have a highly negative effect on the technology intensity of exports. This result is robust to the indicator of trade and foreign exchange liberalization and the specification used. The addition of structural, technological and institutional variables– such as human capital, physical capital, infrastructures, R&D, total factor productivity, political and macroeconomic conditions such as monetization of the economy, level of governance development and degree of economic freedom – reinforced our findings. In addition to trade and macroeconomic policy, the results suggest that more investments into R&D, higher total factor productivity, stronger human capital, a better investment climate and IT infrastructure as well as well the better quality of institutions would reinforce high-technology exports. Our findings also confirm the role of non-traditional determinants of exports – such as the investment climate – which have not been systematically taken into consideration up to now. Conversely, neither FDI net inflows nor gross fixed capital formation in % of GDP play a significant role for upgrading exports. This is similar to the findings we had in the regression presented earlier on the determinants of export diversification. Again, we tested for the significance of the results for the subset of MENA countries and find that the same results hold. The econometric framework was used to predict levels of high tech exports conditioned on world average GDP (indicating potential demand), GDP per capita income, secondary school enrolment, and terms of trade (indicating supply and price factors). For the MENA countries we expect that high tech exports are, on average, much below their predicted levels, with only Jordan and Morocco possibly having exports close to what
15
would be predicted as they have both have relatively high levels of high-tech exports. And, indeed, for the five MENA countries, high technology exports were much below their predicted levels. Only Jordan and Morocco had exports close to what the prediction. The two biggest under-performers in the sample is Egypt. However, we can observe an underperformance also for some of the comparator countries such as Chile and Poland. As far as MENA is concerned, the weak technology performance of the region can be explained by the lack of economic reforms. This is the case for trade and foreign exchange liberalization, which – despite some progress in the 1990s – has been insufficient compared to the more successful economies of East Asia and Latin America. Even if some economies, such as Tunisia, Morocco, Jordan can be considered leaders in the field of trade and foreign exchange reforms, progress needs to be made by other MENA countries if they want to make a progress along the technological ladder. The same conclusions can be drawn for physical and social infrastructures, for which the gap compared to East Asia has contributed to the deficit in high technology exports. All MENA countries need to make a substantial effort to improve their social infrastructure endowment. Similarly, progress in the political environment and the macroeconomic conditions would have a substantial impact.

16
References Acemoglu D. and F. Zilibotti (1997), Was Prometheus unbound by chance? Risk, diversification, and growth, Journal of
Political Economy, 105, 4, 709-51. Achy, Lahcen. and Khalid Sekkat (2003), “The European single currency and MENA's exports to Europe”, Review of
Development Economics 7 (4). Brambilla I. (2006), Multinational technology and the introduction of varieties of goods, NBER Working Paper n. 12217.
Cushman, D. O. (1985). Real Exchange Rate Risk, Expectations, and the Level of Direct Investment. The Review of Economics and Statistics, Vol. 67.
Cushman, D. O. (1993). The Effects of Real Exchange Rate Risk on International Trade. Journal of International Economics, Vol. 15.
Faini R. (2005), Trade liberalization on a globalizing world, in f. Bourguigon and B. Pleskovic (eds.), Lessons from experience, Annual Bank Conference in Development Economics, Oxford University Press.
Feenstra R. and H.L. Kee (2004), Export variety and country productivity, Policy Research Working paper n. 3412, the World Bank, Washington.
Finger J. and M. Kreinin (1979), A measure of export similarity and its possible use, Economic Journal, 89, 905-912. Gagnon, J. E. (1993). Exchange Rate Variability and the Level of International Trade. Journal of International Economics, Vol. 34, no. 3-4 (May).
Ghura, D. and T. J. Grennes (1993). The Real Exchange Rate and Macroeconomic Performances in Sub- Saharan Africa. Journal of Development Economics, Vol. 42.
Goldberg, L. S. and C. D. Kolstad (1995). Foreign Direct Investment, Exchange Rate Variability and Demand Uncertainty. International Economic Review, Vol. 39, no. 4 (November).
Grobar, L. M. (1993). The Effect of Real Exchange Rate Uncertainty on LDC Manufactured Exports. Journal of Development Economics, Vol. 14.
Haddad, M. (2000), “Export competitiveness: where does the Middle East and North Africa region stand?”, paper prepared for the ERF 7th Annual Conference, Amman, Jordan.
Im K., H. Pesaran, and Y. Shin (2003), Testing for unit roots in heterogeneous panels, Journal of Econometrics. Imbs J. and R. Wacziarg (2003), Stages of diversification, American Economic Review, 93, 1 63-86. Iqbal, F. and M. K.Nabli (2004), “Trade and Foreign Direct Investment and Development in the Middle East and North
Africa”, paper presented for the Conference The MENA regions: the challenges of growth and globalisation, April 7-8, 2004.
Khalid Sekkat and Marie-Ange Véganzonès-Varoudakis (2004), Trade and Foreign Exchange Liberalization, Investment Climate and FDI in the MENA Countries, September , The World Bank.
Lall Sanjaya (2000), Turkish Performance in Exporting Manufactures: A Comparative Structural Analysis, QEH Working Paper Series , Working Paper Number 47.
Lall, S. (2000), The Technological Structure and Performance of Developing Country Manufactured Exports, 1985-1998, Queen Elizabeth House, Oxford University, June..
Landesmann, M.A. and R. Stehrer (2001), “Convergence Patterns and Switchovers in Comparative Advantages”, Structural Change and Economic Dynamics, Vol.12, pp. 399-423.
Laursen, K. (2000), “Do Export and Technological Specialisation Patterns Co-evolve in Terms of Convergence or Divergence?”, Journal of Evolutionary Economics, Vol.10, pp.415-436.
Lipsey R. E., Weiss M.Y. (1981), “Foreign production and exports in manufacturing industries”, Review of Economics and Statistics, 63: 488-494.
Martincus C. and A. Estevadeorbal (2005), Specialization and diverging manufacturing structures: the aftermath of trade policy reform in developing countries, mimeo. Méon, P. and K. Sekkat (2004), “Does the Quality of Institutions Limit the MENA’s Integration in the World Economy?”,
The World Economy, Vol. 27, Issue 9, pp. 1475-1498. Nabli, M. and A. I. De Kleine (2000), “Managing global integration in the Middle East and North Africa”. In B. Hoekman
and H. Kheir-El-Din (eds.), Trade Policy Developments in the Middle East and North Africa. Washington, D.C., The World Bank.
Nabli, M.K. and M.A. Véganzonès-Varoudakis (2003), “Exchange rate regime and competitiveness of manufacture exports: the case of the MENA countries”, In H. Hakimian and J.B Nugent (eds.), Trade Policy and Economic Integration in the Middle East and North Africa: Economic Boundaries in Flux. London: Curzon-Routledge London.

17
Sachs, J. and A. Warner (1995), Economic Reform and the Process of Global Integration, Brookings Papers on Economic Activity 1, Washington, D.C.
Sekkat, K. and M. Véganzonès-Varoudakis (2004), “Trade and Foreign Exchange Liberalization, Investment Climate, and FDI in the MENA Countries”, World Bank Working Paper Series, No. 39, September.
Soars, P. (1999). Algeria: The Real Exchange Rate, Export Diversification, and Trade Protection. IMF Working Paper, no. 99/49 (April).
Stehrer, R and J. Wörz (2001), “Technological Convergence and Trade Patterns”, WIIW, WP No.19, Wien. Weinhold D. and J. Rauch (1997), Openness, specialization, and productivity growth in less developed countries, NBER
Working Paper n. 6131, Cambridge, MA World Bank (2006), Quality Improvement and Diversification: Past Challenges and Future Opportunities of Export
Competitiveness in the MENA Region, Draft. Zaghini, A. (2003), “Trade advantages and specialisation dynamics in acceding countries”, European Central Bank, WP n.
249, August.
18
Appendix
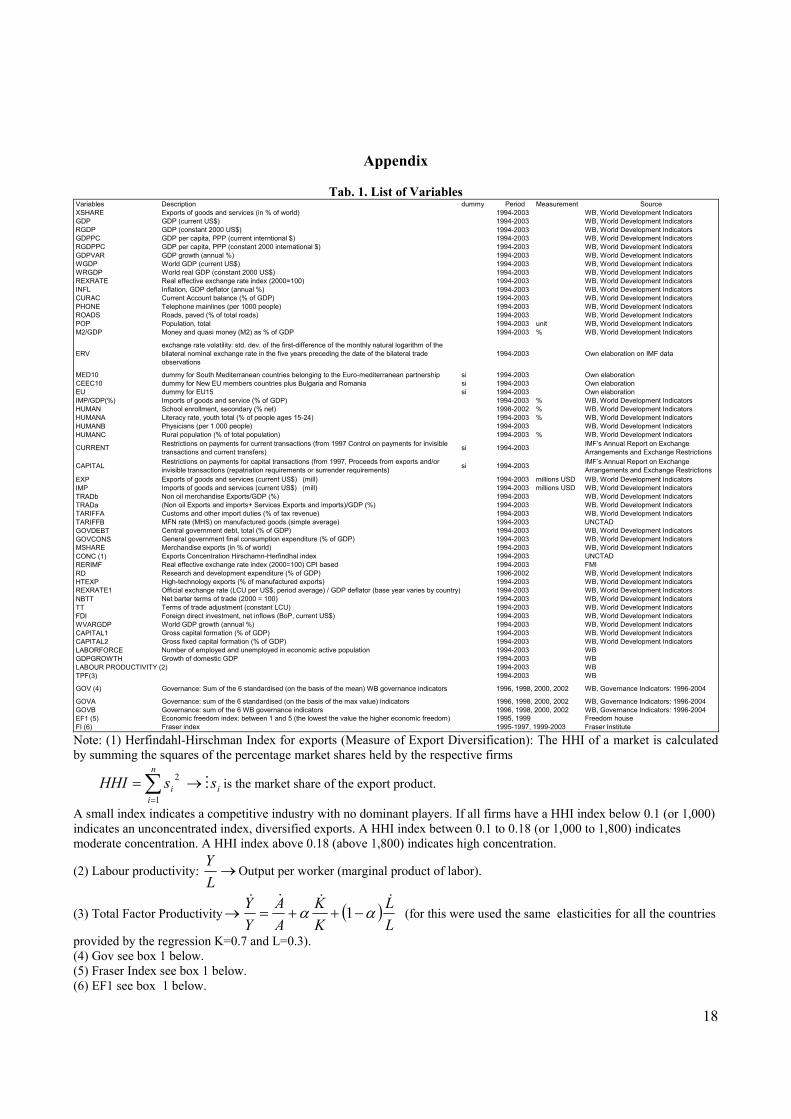
Tab. 1. List of Variables Variables Description dummy Period Measurement SourceXSHARE Exports of goods and services (in % of world) 1994-2003 WB, World Development IndicatorsGDP GDP (current US$) 1994-2003 WB, World Development IndicatorsRGDP GDP (constant 2000 US$) 1994-2003 WB, World Development IndicatorsGDPPC GDP per capita, PPP (current interntional $) 1994-2003 WB, World Development IndicatorsRGDPPC GDP per capita, PPP (constant 2000 international $) 1994-2003 WB, World Development IndicatorsGDPVAR GDP growth (annual %) 1994-2003 WB, World Development IndicatorsWGDP World GDP (current US$) 1994-2003 WB, World Development IndicatorsWRGDP World real GDP (constant 2000 US$) 1994-2003 WB, World Development IndicatorsREXRATE Real effective exchange rate index (2000=100) 1994-2003 WB, World Development IndicatorsINFL Inflation, GDP deflator (annual %) 1994-2003 WB, World Development IndicatorsCURAC Current Account balance (% of GDP) 1994-2003 WB, World Development IndicatorsPHONE Telephone mainlines (per 1000 people) 1994-2003 WB, World Development IndicatorsROADS Roads, paved (% of total roads) 1994-2003 WB, World Development IndicatorsPOP Population, total 1994-2003 unit WB, World Development IndicatorsM2/GDP Money and quasi money (M2) as % of GDP 1994-2003 % WB, World Development Indicators
ERVexchange rate volatility: std. dev. of the first-difference of the monthly natural logarithm of the bilateral nominal exchange rate in the five years preceding the date of the bilateral trade observations
1994-2003 Own elaboration on IMF data
MED10 dummy for South Mediterranean countries belonging to the Euro-mediterranean partnership si 1994-2003 Own elaborationCEEC10 dummy for New EU members countries plus Bulgaria and Romania si 1994-2003 Own elaborationEU dummy for EU15 si 1994-2003 Own elaborationIMP/GDP(%) Imports of goods and service (% of GDP) 1994-2003 % WB, World Development IndicatorsHUMAN School enrollment, secondary (% net) 1998-2002 % WB, World Development IndicatorsHUMANA Literacy rate, youth total (% of people ages 15-24) 1994-2003 % WB, World Development IndicatorsHUMANB Physicians (per 1.000 people) 1994-2003 WB, World Development IndicatorsHUMANC Rural population (% of total population) 1994-2003 % WB, World Development Indicators
CURRENT Restrictions on payments for current transactions (from 1997 Control on payments for invisible transactions and current transfers) si 1994-2003 IMF’s Annual Report on Exchange
Arrangements and Exchange Restrictions
CAPITAL Restrictions on payments for capital transactions (from 1997, Proceeds from exports and/or invisible transactions (repatriation requirements or surrender requirements) si 1994-2003 IMF’s Annual Report on Exchange
Arrangements and Exchange RestrictionsEXP Exports of goods and services (current US$) (mill) 1994-2003 millions USD WB, World Development IndicatorsIMP Imports of goods and services (current US$) (mill) 1994-2003 millions USD WB, World Development IndicatorsTRADb Non oil merchandise Exports/GDP (%) 1994-2003 WB, World Development IndicatorsTRADa (Non oil Exports and imports+ Services Exports and imports)/GDP (%) 1994-2003 WB, World Development IndicatorsTARIFFA Customs and other import duties (% of tax revenue) 1994-2003 WB, World Development IndicatorsTARIFFB MFN rate (MHS) on manufactured goods (simple average) 1994-2003 UNCTADGOVDEBT Central government debt, total (% of GDP) 1994-2003 WB, World Development IndicatorsGOVCONS General government final consumption expenditure (% of GDP) 1994-2003 WB, World Development IndicatorsMSHARE Merchandise exports (in % of world) 1994-2003 WB, World Development IndicatorsCONC (1) Exports Concentration Hirschamn-Herfindhal index 1994-2003 UNCTADRERIMF Real effective exchange rate index (2000=100) CPI based 1994-2003 FMIRD Research and development expenditure (% of GDP) 1996-2002 WB, World Development IndicatorsHTEXP High-technology exports (% of manufactured exports) 1994-2003 WB, World Development IndicatorsREXRATE1 Official exchange rate (LCU per US$, period average) / GDP deflator (base year varies by country) 1994-2003 WB, World Development IndicatorsNBTT Net barter terms of trade (2000 = 100) 1994-2003 WB, World Development IndicatorsTT Terms of trade adjustment (constant LCU) 1994-2003 WB, World Development IndicatorsFDI Foreign direct investment, net inflows (BoP, current US$) 1994-2003 WB, World Development IndicatorsWVARGDP World GDP growth (annual %) 1994-2003 WB, World Development IndicatorsCAPITAL1 Gross capital formation (% of GDP) 1994-2003 WB, World Development IndicatorsCAPITAL2 Gross fixed capital formation (% of GDP) 1994-2003 WB, World Development IndicatorsLABORFORCE Number of employed and unemployed in economic active population 1994-2003 WBGDPGROWTH Growth of domestic GDP 1994-2003 WBLABOUR PRODUCTIVITY (2) 1994-2003 WBTPF(3) 1994-2003 WB
GOV (4) Governance: Sum of the 6 standardised (on the basis of the mean) WB governance indicators 1996, 1998, 2000, 2002 WB, Governance Indicators: 1996-2004
GOVA Governance: sum of the 6 standardised (on the basis of the max value) indicators 1996, 1998, 2000, 2002 WB, Governance Indicators: 1996-2004GOVB Governance: sum of the 6 WB governance indicators 1996, 1998, 2000, 2002 WB, Governance Indicators: 1996-2004EF1 (5) Economic freedom index: between 1 and 5 (the lowest the value the higher economic freedom) 1995, 1999 Freedom houseFI (6) Fraser index 1995-1997, 1999-2003 Fraser Institute Note: (1) Herfindahl-Hirschman Index for exports (Measure of Export Diversification): The HHI of a market is calculated by summing the squares of the percentage market shares held by the respective firms
∑=
=n
iisHHI
1
2isM→ is the market share of the export product.
A small index indicates a competitive industry with no dominant players. If all firms have a HHI index below 0.1 (or 1,000) indicates an unconcentrated index, diversified exports. A HHI index between 0.1 to 0.18 (or 1,000 to 1,800) indicates moderate concentration. A HHI index above 0.18 (above 1,800) indicates high concentration.
(2) Labour productivity: →LY
Output per worker (marginal product of labor).
(3) Total Factor Productivity ( )LL
KK
AA
YY &&&&
αα −++=→ 1 (for this were used the same elasticities for all the countries
provided by the regression K=0.7 and L=0.3). (4) Gov see box 1 below. (5) Fraser Index see box 1 below. (6) EF1 see box 1 below.
19
Box 1. Measuring institutional quality
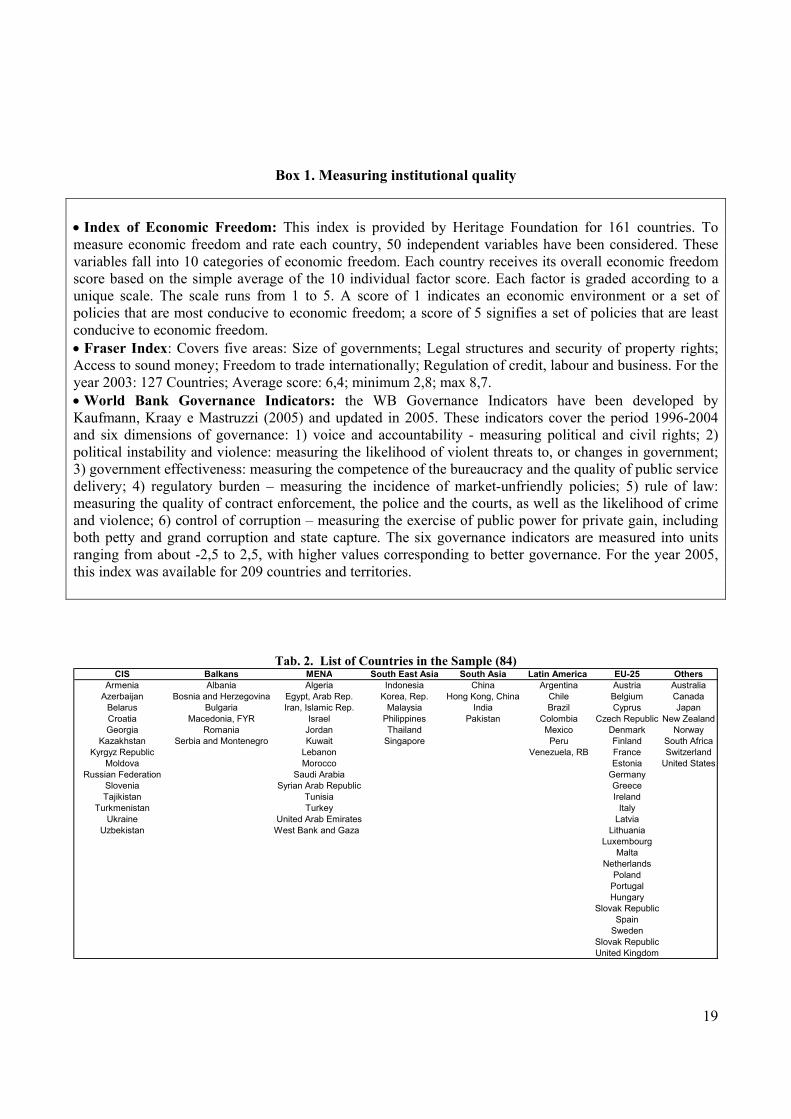
• Index of Economic Freedom: This index is provided by Heritage Foundation for 161 countries. To measure economic freedom and rate each country, 50 independent variables have been considered. These variables fall into 10 categories of economic freedom. Each country receives its overall economic freedom score based on the simple average of the 10 individual factor score. Each factor is graded according to a unique scale. The scale runs from 1 to 5. A score of 1 indicates an economic environment or a set of policies that are most conducive to economic freedom; a score of 5 signifies a set of policies that are least conducive to economic freedom. • Fraser Index: Covers five areas: Size of governments; Legal structures and security of property rights; Access to sound money; Freedom to trade internationally; Regulation of credit, labour and business. For the year 2003: 127 Countries; Average score: 6,4; minimum 2,8; max 8,7. • World Bank Governance Indicators: the WB Governance Indicators have been developed by Kaufmann, Kraay e Mastruzzi (2005) and updated in 2005. These indicators cover the period 1996-2004 and six dimensions of governance: 1) voice and accountability - measuring political and civil rights; 2) political instability and violence: measuring the likelihood of violent threats to, or changes in government; 3) government effectiveness: measuring the competence of the bureaucracy and the quality of public service delivery; 4) regulatory burden – measuring the incidence of market-unfriendly policies; 5) rule of law: measuring the quality of contract enforcement, the police and the courts, as well as the likelihood of crime and violence; 6) control of corruption – measuring the exercise of public power for private gain, including both petty and grand corruption and state capture. The six governance indicators are measured into units ranging from about -2,5 to 2,5, with higher values corresponding to better governance. For the year 2005, this index was available for 209 countries and territories.
Tab. 2. List of Countries in the Sample (84) CIS Balkans MENA South East Asia South Asia Latin America EU-25 Others
Armenia Albania Algeria Indonesia China Argentina Austria AustraliaAzerbaijan Bosnia and Herzegovina Egypt, Arab Rep. Korea, Rep. Hong Kong, China Chile Belgium Canada
Belarus Bulgaria Iran, Islamic Rep. Malaysia India Brazil Cyprus JapanCroatia Macedonia, FYR Israel Philippines Pakistan Colombia Czech Republic New ZealandGeorgia Romania Jordan Thailand Mexico Denmark Norway
Kazakhstan Serbia and Montenegro Kuwait Singapore Peru Finland South AfricaKyrgyz Republic Lebanon Venezuela, RB France Switzerland
Moldova Morocco Estonia United StatesRussian Federation Saudi Arabia Germany
Slovenia Syrian Arab Republic GreeceTajikistan Tunisia Ireland
Turkmenistan Turkey ItalyUkraine United Arab Emirates Latvia
Uzbekistan West Bank and Gaza LithuaniaLuxembourg
MaltaNetherlands
PolandPortugalHungary
Slovak RepublicSpain
SwedenSlovak RepublicUnited Kingdom

20
Tab. 3. Mean value of variables used in the regressions for EU, south Mediterranean countries and Central and East European countries.
Variable | Type Obs Mean Variable | Type Obs Mean [9 Variable | Type Obs Mean [9-------------+-------------------------------------------- -------------+----------------------------------------------------------+--------------------------------------------- gdppc | Arithmetic 148 25232.5 gdppc | Arithmetic 110 11355.57 gdppc | Arithmetic 90 6315.01 5-------------+-------------------------------------------- -------------+----------------------------------------------------------+--------------------------------------------- btt | Arithmetic 129 102.2424 1 btt | Arithmetic 20 101.8728 10 btt | Arithmetic 73 97.07281 93-------------+-------------------------------------------- -------------+----------------------------------------------------------+--------------------------------------------- rexrate | Arithmetic 148 103.828 rexrate | Arithmetic 80 97.23214 rexrate | Arithmetic 40 97.02017 9-------------+-------------------------------------------- -------------+----------------------------------------------------------+--------------------------------------------- tariffa | Arithmetic 33 .5444271 -. tariffa | Arithmetic 63 5.63483 4. tariffa | Arithmetic 57 17.39596 14-------------+-------------------------------------------- -------------+----------------------------------------------------------+--------------------------------------------- tariffb | Arithmetic 148 0 tariffb | Arithmetic 48 6.275417 4 tariffb | Arithmetic 40 14.4905 10-------------+-------------------------------------------- -------------+----------------------------------------------------------+--------------------------------------------- rd | Arithmetic 99 1.866132 1 rd | Arithmetic 77 .7056128 .6 rd | Arithmetic 30 1.426536 .78-------------+-------------------------------------------- -------------+----------------------------------------------------------+--------------------------------------------- fdi | Arithmetic 139 2.22e+10 1 fdi | Arithmetic 109 1.52e+09 1 fdi | Arithmetic 88 7.14e+08 5.2-------------+-------------------------------------------- -------------+----------------------------------------------------------+--------------------------------------------- tpf | Arithmetic 138 1.49e+10 1 tpf | Arithmetic 90 1.61e+09 1. tpf | Arithmetic 98 1.86e+09 1.4-------------+-------------------------------------------- -------------+----------------------------------------------------------+--------------------------------------------- capital2 | Arithmetic 148 20.48378 capital2 | Arithmetic 109 22.49101 capital2 | Arithmetic 100 22.9648 2-------------+-------------------------------------------- -------------+----------------------------------------------------------+--------------------------------------------- human | Arithmetic 96 88.07034 human | Arithmetic 72 82.451 human | Arithmetic 41 61.49476 -------------+-------------------------------------------- -------------+----------------------------------------------------------+--------------------------------------------- conc | Arithmetic 138 .1080145 conc | Arithmetic 120 .2094333 conc | Arithmetic 94 .3072447 .-------------+-------------------------------------------- -------------+----------------------------------------------------------+--------------------------------------------- gov | Arithmetic 148 26.66966 gov | Arithmetic 120 8.0505 5 gov | Arithmetic 100 -4.1758 -6.-------------+-------------------------------------------- -------------+----------------------------------------------------------+--------------------------------------------- ef1 | Arithmetic 148 8.004527 ef1 | Arithmetic 110 6.155636 5 ef1 | Arithmetic 80 5.505 5.21-------------+-------------------------------------------- -------------+----------------------------------------------------------+--------------------------------------------- fi | Arithmetic 148 7.702162 7. fi | Arithmetic 110 6.184818 6 fi | Arithmetic 80 5.759875 5.5------------------------------------------------------------------------ ---------------------------------------------------------------------------------------------------------
MEDIA EU MEDIA CEEC10 MEDIA MED10
Source: Author compuations. Definition of the variables: domestic per capita GDP (GDPPC); terms of trade (BTT); real exchange rate (REXRATE); tariff measures such as customs and other import duties as a percentage of tax revenue (TARRIFA) and MFN rate on manufactured goods (TARRIFB); research and development expenditure as % of GDP (RD); FDI inflow in current US dollars; total factor productivity (TPF); the logarithm of the gross fixed capital formation to GDP (CAPITAL2);); the availability of human capital, approximated by the logarithm of secondary school enrolment ratio on net enrolment (HUMAN); the export concentration index (CONCit); the “institutional quality” and political environment were drawn from a standardised sum of the six World Bank Governance Indicators by Kaufman, Kray and Mastruzzi (2005) (GOVA); one of the investment climate indicators House of Freedom (the scale awards the highest value to the lowest risk, and the lowest value to the highest risk) and Fraser index (HF1 and FI) (see box 1 for further explanations of these indices).

21
Tab. 4. Trade, foreign exchange liberalisation, FDI, human and physical capital, productivity and R&D, business and macroeconomic environment, export concentration (dependent variable logarithm of high technology exports as % of manufactured exports). Table 1. Trade, foreign exchange liberalisation, FDI, human and physical capital, productivity and R&D, business and macroeconomic environment, export concentration.(dependent variable logarithm of high technology exports as % of manufactured exports)Specifications variables Eq. 1 Eq. 2 Eq. 3 Eq. 4 Eq. 5 Eq. 6 Eq. 7 Eq. 8 Eq. 9 Eq. 10 Eq.11 Eq.12World gdp (in log) 0.159 0.58 0.83* 1.02**** 1.79*** 2.74*** 1.43** 4.46*** -0.29 1.17*** 0.59 0.61
(0.15) (-0.52) (1.87) (2.34) (3.03) (3.12) (2.05) (6.15) (-0.48) (1.53) (1.15) (1.06)GDP per capita (in log) 2.30*** 2.05** 1.45*** 1.29*** 1.57*** 2.41*** 1.53*** 1.22*** 1.24**
(3.35) (-2.87) (5.9) (5.28) (5.12) (4.96) (4.14) (3.80) (3.57)Terms of trade (in log) 0.80* 0.77* 0.61** 0.53** 0.04 0.45 0.80*** 0.61** 0.88*** 0.91*** 1.37** 1.28**
(1.88) (1.77) (2.5) (2.23) (0.15) (0.98) (2.59) (1.91) (3.42) (2.75) (2.50) (2.07)Real exchange rate (in log) 0.62 0.8* 0.29 0.55** 0.98
(1.38) (1.69) (1.10) (2.01) (1.97)Volatility of real exchange rate 0.58 0.72*** 1.09**
(1.24) (3.42) (1.97)Tariffs revenues (as % of tax revenue) -0.03*** -0.03*** -0.03*** -0.04*** -0.03*** -0.04*** -0.02** -0.03**** -0.04*** -0.02**
(-2.94) (-2.48) (-3.60) (-3.10) (-2.95) (-4.10) (-1.99) (-3.10) (-3.90) (-1.96)MFN rate on manufactured goods -0.02*** -0.02***
(- 3.28) (- 3.12)R&D expenditure (% GDP) 0.65***
(2.63)FDI (in log) -0.01 0.01
(-0.18) (0.43)Total Factor Productivity (in log) .29** 0.25***
(1.62) (1.65)Gross fixed capital formation on GDP (%) (in log) .52
(1.52)Human capital (% secondary school enrolment) 0.007**
(1.93)M2/GDP (in log) 0.53*
(1.78)Export concentration (Hirschman-Herfindhal) (in log) -0.62*** -0.55***
(-3.00) (-2.44)World Bank governance indicators (Kaufman and Kray) (in log) 0.08* 0.05
(1.74) (0.65)Index of economic freedom (House of (in log) -2.24*** -2.13***
(-2.67) (-2.06)Investment climate (Fraser Index) (in log) 0.26
(0.74)Number of countries 37 27 32 32 32 27 35 37 32 29 26 24Number of observations 196 134 246 246 114 131 189 191 100 169 103 98AR2 0.43 0.44 0.5 0.53 0.41 0.37 0.42 0.44 0.62 0.44 0.6 0.59Fixed effects F(5,154)=24,51 F(26,101)=85,61 F(5,209)=42.52 F(6,208)=39,20 F(4,78)=13,86 F(6,98)=9,61 F(5,149)=23.69 F(4,50)=24.87 F(5,63)=20.90 F(5,135)=21.32 F(7,70)=15.70 F(10,64)=9,89Random effects CHISQ (5)=146,7CHISQ (6)=97.83 CHISQ (5)=244,04 CHISQ (6)=263,33CHISQ (4)=73.86 CHISQ (6)=61.71 CHISQ (5)=142.40 CHISQ (4)=107.50 CHISQ (5)=126.70 CHISQ (5)=125.54 CHISQ (7)=100,7CHISQ (10)=95.8 Source: Author estimations. Data have been compiled from: World Development Indicators (WDI), 2006; World Bank Governance Indicators 2005; IMF, International Financial Statistics, 2006; UNCTAD; IMF Annual report on exchange rate arrangements and exchange restrictions; Freedom House; Fraser Institute. Notes: T-student in brackets. ***significant at 1% (99% level of significance); ** significant at 5% (95% level of significance); * significant at 10% (90% level of significance).
22
Fig. 1. Logarithm of high technology export values (Y) on the logarithm of Hirschman Index of export diversification (Xi) (- 3 max diversification, 0 min diversification)
1520
2530
35Fi
tted
valu
es/lh
texp
l
-3 -2 -1 0lconc
Fitted values lhtexpl
Source: Own elaboration
23
Fig. 2. Actual high tech exports over estimated high tech exports (potential), conditioned on world GDP, gross domestic per capita income, human capital, terms of trade (various years)
Actual to predicted high technology exports, US$
0123456789
1011
Alge
ria (0
2)
Egyp
t, Ar
ab R
ep. (
02)
Tuni
sia
(02)
Gre
ece
(03)
Chi
le (0
2)
Portu
gal (
03)
Jord
an (0
2)
Pola
nd (0
3)
Arge
ntin
a (0
2)
Den
mar
k (0
3)
Turk
ey (0
2)
Finl
and
(02)
Col
ombi
a (0
2)
Belg
ium
(03)
Isra
el (0
1)
Sout
h Af
rica
(00)
Swed
en (0
3)
Aust
ralia
(96)
Vene
zuel
a (0
2)
Spai
n (0
3)
Irela
nd (0
3)
Italy
(03)
Hun
gary
(03)
Hon
g Ko
ng, C
hina
(02)
Fran
ce (0
3)
Uni
ted
King
dom
(03)
Japa
n (0
3)
Ger
man
y (9
7)
Kore
a, R
ep. (
02)
Uni
ted
Stat
es (0
3)
actual to predicted high technology exports
under performersover performers
Source: Own elaboration on data compiled from World Development Indicators (WDI), 2006. Note: regression a sample of 42 countries and 224 observations, on the following specification: High tech export= -22.71 +0.79 logworldgdp + 1.79 loggdppc + 0.68 logtermsoftrade+ 0.008 lhumancapital; AR2 =0.63. Over performing countries show ratio above 1, underperforming countries show ratios below 1.