export study - sidf.gov.sa subject export study has been conducted by ecu which relates to the...
TRANSCRIPT
Marketing Consultancy Division (MCD)
Export Consultancy Unit (ECU)
______________________________________________________________
Export Study
Global Study on Cement
Safar, 1429H (March, 2008)
��
EXECUTIVE SUMMARY The subject Export Study has been conducted by ECU which relates to the global cement market. The study aims at investigating the current position and the developments of the Cement industry in the global market. In addition, it will explore and identify the potential export markets. The findings of the study are also hoped to be helpful and supportive in formulating the Fund�s future loan policy in this sector.
In general, most of the world Cement producers, characterize the Cement industry, as a capital and energy intensive industry, low labor intensity, homogenous product and heavy & mature product.
As for the KSA Cement industry, there are 10 local Cement companies in operation, which are strategically located in 10 different cities with an annual capacity of 33.2 million tons of Cement production. Local sales of Cement rose from 15.6 million tons in 2000 to over 27.1 million tons in 2007. In 2007, the quantity directed to the local market constitutes 88.4% of the total sales while the remaining i.e. 11.6% were exported. The installed capacity had increased massively during 2005-2007 period by around 52% due to the new capacity expansions for the existing projects and the entrance of new plants which started production in 2007.
The total cement capacity expansions amount to about 21.813 million tons, thus, KSA total Cement capacity will reach 49.4 million tons by 2009. With projected 7.5% annual growth in Cement demand, Cement industry will experience an overcapacity situation by 17.3 million tons in 2009. The actual local demand of Cement reached a level of 27.8 million tons in 2007 and expected to reach 32.1 million tons in 2009.
KSA total Cement exports in 2007 reached 3.56 million tons i.e. an increase of about 104% in volume from previous level. The exported quantities were basically targeted to some neighboring countries i.e. Bahrain (42%), Iraq (34%), Qatar (11%), Yemen (11%), Kuwait (1.2%), Jordan (0.21%) and UAE (0.01%).
The exports capabilities of Saudi Cement companies are very modest and needs to be developed to enhance the export performance of these companies. So far only one Saudi company has developed its exporting capability by developing a cement exporting terminal.
III
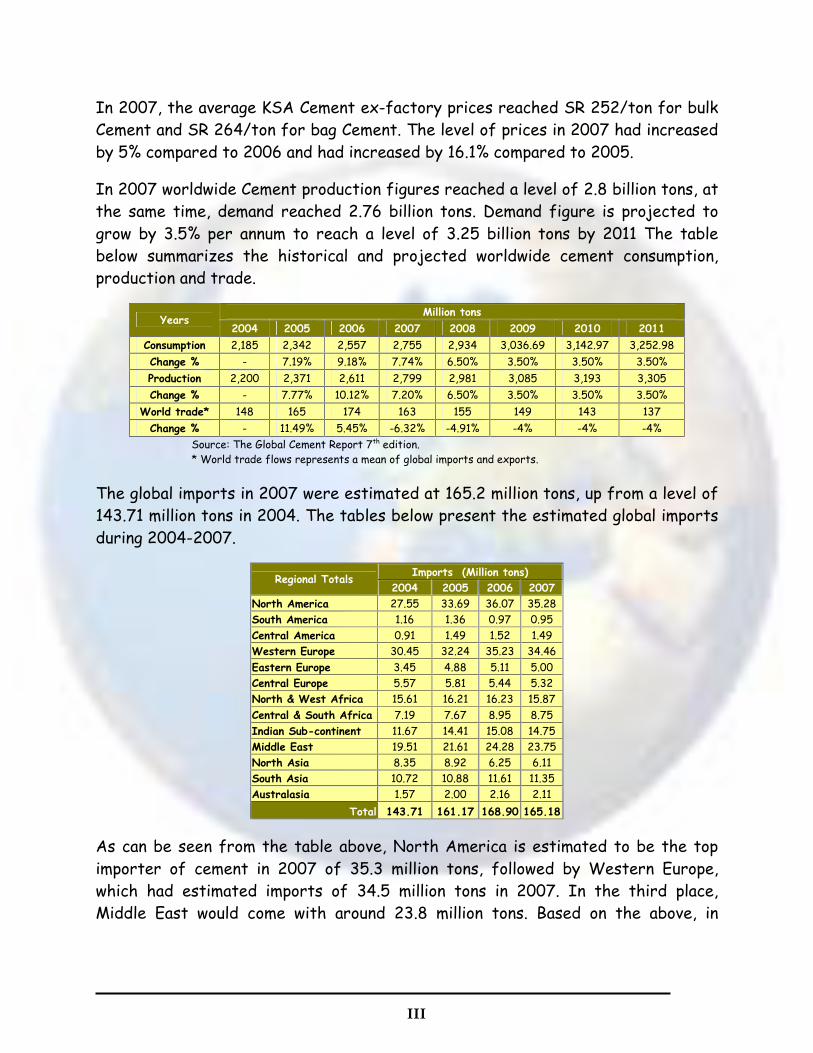
In 2007, the average KSA Cement ex-factory prices reached SR 252/ton for bulk Cement and SR 264/ton for bag Cement. The level of prices in 2007 had increased by 5% compared to 2006 and had increased by 16.1% compared to 2005.
In 2007 worldwide Cement production figures reached a level of 2.8 billion tons, at the same time, demand reached 2.76 billion tons. Demand figure is projected to grow by 3.5% per annum to reach a level of 3.25 billion tons by 2011 The table below summarizes the historical and projected worldwide cement consumption, production and trade.
Million tons Years
2004 2005 2006 2007 2008 2009 2010 2011
Consumption 2,185 2,342 2,557 2,755 2,934 3,036.69 3,142.97 3,252.98
Change % - 7.19% 9.18% 7.74% 6.50% 3.50% 3.50% 3.50%
Production 2,200 2,371 2,611 2,799 2,981 3,085 3,193 3,305
Change % - 7.77% 10.12% 7.20% 6.50% 3.50% 3.50% 3.50%
World trade* 148 165 174 163 155 149 143 137
Change % - 11.49% 5.45% -6.32% -4.91% -4% -4% -4%
Source: The Global Cement Report 7th edition. * World trade flows represents a mean of global imports and exports.
The global imports in 2007 were estimated at 165.2 million tons, up from a level of 143.71 million tons in 2004. The tables below present the estimated global imports during 2004-2007.
Imports (Million tons) Regional Totals
2004 2005 2006 2007 North America 27.55 33.69 36.07 35.28 South America 1.16 1.36 0.97 0.95 Central America 0.91 1.49 1.52 1.49 Western Europe 30.45 32.24 35.23 34.46
Eastern Europe 3.45 4.88 5.11 5.00 Central Europe 5.57 5.81 5.44 5.32 North & West Africa 15.61 16.21 16.23 15.87
Central & South Africa 7.19 7.67 8.95 8.75 Indian Sub-continent 11.67 14.41 15.08 14.75 Middle East 19.51 21.61 24.28 23.75 North Asia 8.35 8.92 6.25 6.11 South Asia 10.72 10.88 11.61 11.35 Australasia 1.57 2.00 2.16 2.11
Total 143.71 161.17 168.90 165.18
As can be seen from the table above, North America is estimated to be the top importer of cement in 2007 of 35.3 million tons, followed by Western Europe, which had estimated imports of 34.5 million tons in 2007. In the third place, Middle East would come with around 23.8 million tons. Based on the above, in

IV
addition of distance advantages, both Middle East and North & West Africa and regions could be seen as promising markets for Saudi cement companies.
Screening for potential export markets have been conducted to find out the top 10 potential markets, namely Spain, UAE, Sir Lanka, Singapore, Malaysia, Kuwait, Iraq, Ghana, Syria and Turkey. A full analysis of above markets has been included in this study. The table below presents the imports of those markets.
The imports of targeted markets (Million tons) Countries
2004 2005 2006 2007* 2008* 2009* 2010* Spain 8.84 10.72 11.5 10 9 8.1 7.29 UAE 4.4 3.5 5.5 5.3 5.3 0.5 0.5
Sri Lanka 2.6 3.1 3.5 3.7 4.1 5 5.5
Singapore 3.2 3.1 3.1 3.4 3.8 4.2 4.5
Malaysia 1.29 1.46 2.27 3 3 3 3 Kuwait 1.4 1.8 2.1 2.4 2.8 1.3 1.7
Iraq 3 3.3 2.5 2 1.7 0.74 1.69
Ghana 2.1 2.2 2.25 2.4 2.4 2.68 2.84
Syria 1.24 1.66 2.26 2.31 2.23 2.68 3.2 Turkey 0 0.25 2 2 2 2 2
* Estimated
Cement is a costly product to transport relative to its price. The cost of transporting cement from one country to another can exceed the value of its production. For years, cement was considered a local product, unfeasible to export due to the high cost of land transportation. However, with the development of marine shipping and the savings it introduced to the global transportation industry, regional markets for cement started to evolve, with cement being transported between neighboring countries at an economically feasible cost. The following tables present the land and ocean transportation costs, per ton, in SR.
Regarding fright rates, it is usually determined based on several parameters such as loading and discharging rate. However, the following table presents the average fright rates from KSA to different destinations at 4,500 ton/day loading and discharging rate.
Destination USD/Ton GCC states 22-18 India 50-40 China 60-70
(SR/Ton) From / To
UAE Qatar Kuwait Oman Bahrain Yemen Lebanon Iraq Jordan Syria RUH 140 80 80 180 72 180 244 140 208 232
JED 260 192 184 300 172 140 224 236 184 212
DAM 120 52 52 160 48 224 290 112 235 280

V
South Asia 60-70
Eastern Europe 50-60
Western Europe 80-90 North America 100-130 South America 120-140 West Africa 90-100 East Africa 50-60 South Africa 70-80 North Africa 40-50 Australia & New Zealand 100-120
With regards to the landed prices, the table below illustrates the average landed prices in targeted markets.
Countries USD/ton Spain 107.03 UAE 80 Sir Lanka 112 Singapore 59.14 Malaysia 67.90 Kuwait 75 Iraq 107 Ghana 107.62 Syria 130 Turkey 75.6
CONCLUSION
The Kingdom�s Cement industry is operating at near full capacity, with the domestic demand comprising 88.4% of the total supplies and exports representing around 11.6% (3.6 million tons). Bahrain and Iraq are considered the biggest export markets as they imports around 42% and 34% of total Saudi export respectively. The total local installed capacity is expected to reach more than 49 million tons in 2009, an increase of 49% in comparison with 2007.
Overall, although there are potential export markets for Saudi cement, exporting cement seems to be difficult due to number of export barriers. Firstly, the Saudi ports do not have cement export terminals, which are very crucial to increase the loading rate of cement and, consequently, reducing the shipping costs. Secondly, Saudi cement companies lack of experiences and relationships with international cement trading companies, which are aware of cement imports orders and manage/arrange shipping and delivering throughout the world. Unfortunately, such companies are fully dominated by international cement company�s cartel such as Lafarge and Italicement. Furthermore, increasing the fright rates of shipping costs, which is attributed to the increasing of oil prices, war risk insurance and depreciation of USD value. Finally, most of Saudi cement companies do not develop
VI
their vision of international expansion strategies such as installing grinding plants in neighborhood markets.
RECOMMENDATION
Based on the current market situation of the local market and challenges existing in export markets, exporting cement seems to be difficult due to the lacking of enough export capability within the existing Saudi cement companies. Local cement companies should jointly consider establishing a cement trading company, which could act as the export arm for the Saudi cement companies in overseas markets. The best legal form for such company is to be owned by all Saudi cement companies. The main objectives of this company could be summarized as follows:-
To develop export port terminals in the major coasts of KSA. To explore export opportunities and identify promising export markets. To establish worldwide networks of contacts with the cement trading
companies as so to receive export orders. To manage the surpluses of cement in KSA and to prevent future
strangulations in the local market. To establish contacts with shipping companies and arrange shipping process
with the lowest cost.
Furthermore, exporters should be encouraged to contact local export insurance and credit institutions in order to utilize the available facilities for export credit & insurance programs towards risky countries. �The Saudi Export Program� from the Saudi Fund for Development will help local manufactures in increasing their market share and expanding their export activities to more countries with the lowest possible risk. This is a good omen as Saudi Arabia has joined WTO.
GLOBAL STUDY ON CEMENT TABLE OF CONTENTS
Sections Page
1 INTRODUCTION ................................................................................. 1 1.1 Research Objectives ......................................................................................................................................1 1.2 Data Collection Methods and Sources .....................................................................................................2 1.3 Cement Conferences ......................................................................................................................................2
2 PRODUCT DESCRIPTION ........................................................................ 3 2.1 General Background........................................................................................................................................3 2.2 Cement................................................................................................................................................................3 2.3 Cement Manufacturing Process..................................................................................................................4 2.4 Major Characteristics of the Cement Industry ...................................................................................5
3 WORLD CEMENT MARKET....................................................................... 6 3.1 Highlight on Regional Consumption/Production Situation ..................................................................7 3.2 International Trade Flows ...........................................................................................................................8 3.3 Major Cement consuming countries ..........................................................................................................9 3.4 Leading cement and clinker exporters................................................................................................... 10 3.5 Leading cement and clinker importers ....................................................................................................11 3.6 Leading International cement companies .............................................................................................. 13
4 HIGHLIGHTS ON KSA CEMENT INDUSTRY.................................................. 15 4.1 Demand............................................................................................................................................................. 15 4.2 Supply ............................................................................................................................................................... 16 4.3 Imports ............................................................................................................................................................ 17 4.4 Export sales.................................................................................................................................................... 17 4.5 Views of local cement producers on cement exporting .................................................................... 18 4.6 Advantage/Disadvantage of exporting .................................................................................................. 19 4.7 Exporting Capability & Requirements of exporters........................................................................... 19
5 POTENTIAL CEMENT EXPORT MARKETS..................................................... 20 5.1 Potential markets for Saudi Cement companies..................................................................................20 5.1.1 Spain .................................................................................................................................................................20 5.1.2 UAE ...................................................................................................................................................................23 5.1.3 Sir Lanka..........................................................................................................................................................26 5.1.4 Singapore.........................................................................................................................................................29 5.1.5 Malaysia ........................................................................................................................................................... 31 5.1.6 Kuwait ...............................................................................................................................................................34 5.1.7 Iraq ...................................................................................................................................................................36 5.1.8 Ghana ................................................................................................................................................................39 5.1.9 Syria..................................................................................................................................................................40 5.1.10 Turkey ..............................................................................................................................................................42
6 TRANSPORTATION ............................................................................. 45 6.1 Land Transportation Cost...........................................................................................................................45 6.2 Ocean Transportation Cost........................................................................................................................45
7 INSURANCE ..................................................................................... 48 8 CONCLUSION ................................................................................... 49 9 RECOMMENDATION ............................................................................ 50
Global Study on Cement, 2008.
1
1 INTRODUCTION
The subject report has been conducted by ECU which relates to the Global Cement Industry. The study aims at investigating the current position and the developments of the Cement industry in the global markets. In addition, it will explore the potential export markets for Saudi Cement companies. The findings of the study are also hoped to be helpful and supportive in formulating the Fund�s future loan policy in this sector. Therefore, the following sections will provide an insight on the historical & the expected market situation. In addition, it will include ECU overall assessment of those markets at present.
1.1 Research Objectives
The aim and the principle of this present study are to provide a perspective on the current position and the level of developments of the Cement industry in the global market. Accordingly, the subject study intends to achieve the following research objectives:-
To determine the Cement product classifications and characteristics. In addition, identifying what changes are taking place in the product in terms of technology, features and quality that could affect the complete competitive situation for the Saudi Cement exporters.
To provide a glance on the global cement market in terms of market size, capacity, major players and market trends/developments.
To provide a glance on the Saudi cement market in terms of market size, capacity and market trends/developments.
To identify current situation of cement market worldwide and assess the supply/demand situation in light of any recent developments.
To screen international markets as so to identify potential markets for Saudi cement manufacturers based on certain selected criteria.
To measure the historical market of the potential export markets by identifying their production capacity, imports and exports. Also, investigating the imports� contribution to their overall markets.
To determine the latest available average CIF prices, in addition to explore the competitiveness of the Saudi Cement prices compared to other competitors prices in potential export markets.
To identify the requirements of Saudi cement exporters in order to increase their export performance.
To describe the competition environment in potential export markets and to determine the key success factors of those markets.

Global Study on Cement, 2008.
2
To provide the current fright rates of ocean transportation and the current quotations of land transportation to different destinations.
1.2 Data Collection Methods and Sources
Having identified the study objectives, the next step is to seek the data required for the fulfillment of those objectives. For the purpose of this industry both primary and secondary sources were required. All relevant secondary data on the global Cement market, from SIDF existing reports, imports statistics from United Nations Statistics Division � Commodity Trade Statistics Database (CO MILLION TONS RADE), the Global Cement Report (seventh edition), INTERCEM Dubai 2007 Conference, Middle East Cement conference Doha 2007, Cement industry in the GCC done by HSBC, internet sources and field survey with Saudi exporting companies, have been used to fulfill the study objectives. Compiling secondary data has built up an initial understanding of the global Cement industry characteristics before conducting the analysis.
1.3 Cement Conferences
2nd Cement Trade Middle East/Africa, 4-5 December 2007, Doha, Qatar
The conference was attended as a step to prepare and collect information for this study. CMT�s 2nd CemenTrade Mideast/Africa Conference aims to provide an update of the market dynamics in the Middle East and Africa. Besides cement and construction markets updates including Saudi Arabia, UAE, Qatar, Iraq, Iran, Bahrain, South Africa, East Africa, Egypt and South Asia, the conference also examined climate change & environmental issues and cementitious materials utilization. The conference was a good opportunity to get acquainted with new changes in cement industry and discuss the current situation of international cement industry and market with experts in cement industry.
The most interesting presentation was about Iraq market, which gave a detailed analysis about the outlook of cement consumption in Iraq market. However, unfortunately, some papers that had presented in the INTERCEM Dubai 2007 Conference were presented again in this conference with the same information.
Cemtech Dubai 16-19 February 2008
The conference held at the Grand Hyatt Hotel, the meeting attracted an impressive 300 delegates from 49 countries, all keen to gain insights into recent Middle East cement market developments. Conference proceedings featured a

Global Study on Cement, 2008.
3
variety of market-based reports including a look at what lies ahead for the Middle East cement sector in a changing world, the outlook for UAE cement and construction markets, plus overviews of expansion projects in the buoyant markets of Saudi Arabia and Iran.
2 PRODUCT DESCRIPTION
2.1 General Background
Having illustrated the objectives and research methodology of this study, it is therefore appropriate firstly to discuss the product types and its specifications.
Concrete is the most widely used man-made product in the world and is second only to water as the world�s most utilized substance. In its simplest form, concrete is a mixture of Cement paste and aggregates. As Cement being a basic ingredient of concrete, it has been around for at least 12 million years.
When the earth itself was undergoing intense geologic changes natural, Cement was being created. It was this natural Cement that humans first put to use. Eventually, they discovered how to make Cement from other materials. The Assyrians and Babylonians used clay. Later, the Egyptians advanced to the discovery of lime and gypsum mortar as a binding agent for building such structures as the Pyramids. The Greeks made further improvements and finally the Romans developed Cement that produced structures of remarkable durability.
2.2 Cement
Cement and concrete might be synonymous as household terms, but are by nature different. Concrete is a material used in building construction, as signature material in driveways, patios, basements and a host of other household items. It consist of a hard, chemically inert particulate substance, known as an aggregate (usually made from different types of sand and gravel), that is bonded together by Cement and water.
Cement is the basic ingredients of concrete and mortars. It is an artificial hydraulic binder which binds the particles of sand and aggregates together. Others, define it as, an ultra-fine gray powder, binds sand and rocks into a mass or matrix of concrete.
There are 27 types of common Cement which can be grouped into 5 general categories (Portland, Portland composite, blast furnace/slag, pozzolanic and

Global Study on Cement, 2008.
4
composite Cement & others) and 3 strength classes (ordinary, high and very high). Portland Cement, the most widely used Cementitious ingredient in today�s concrete, which currently accounts for more than three-quarters of all Cement sales worldwide, is comprised of phases that consist of atoms of calcium, silicon, aluminum, iron and oxygen. In addition, some special Cement exists like sulphate resisting Cement, low heat Cement and calcium aluminate Cement.
2.3 Cement Manufacturing Process
Cement plants are usually located closely either to hot spots in the market or to areas with sufficient quantities of raw materials. The aim is to keep transportation costs at low levels. Basic constituents for Cement (limestone and clay) are taken from quarries in these areas.
Basically, Cement is produced in two steps: first, clinker is produced from raw materials. In the second step, Cement is produced from Cement clinker. The first step can be a dry, wet, semi-dry or semi-wet process according to the state of the raw material.
The raw materials are delivered in bulk, crushed and homogenized into a mixture which is fed into a rotary kiln. This is an enormous rotating pipe of 60 to 90 m long and up to 6 m in diameter. This huge kiln is heated by a 2000°C flame inside of it. The kiln is slightly inclined to allow for the materials to slowly reach the other end, where it is quickly cooled to 100-200°C.
Four basic oxides in the correct proportions make Cement clinker: calcium oxide (65%), silicon oxide (20%), alumina oxide (10%) and iron oxide (5%). These elements mixed homogeneously (called �raw meal� or slurry) will combine when heated by the flame at a temperature of approximately 1450°C. New compounds are formed: silicates, aluminates and ferrites of calcium. Hydraulic hardening of Cement is due to the hydration of these compounds. The final product of this phase is called �clinker�. These solid grains are then stored in huge silos which is the end of phase one.
The second phase is handled in a Cement grinding mill, which may be located in a different place to the clinker plant. Gypsum (calcium sulphates) and possibly additional Cementitious (such as blast furnace slag, coal fly ash, natural pozzolanas, etc.) or inert materials (limestone) are added to the clinker. All constituents are ground leading to a fine and homogenous powder which is the end of phase two. The

Global Study on Cement, 2008.
5
Cement is then stored in silos before being dispatched either in bulk or bagged forms.
2.4 Major Characteristics of the Cement Industry
The following highlights the main characteristics of the Cement industry in general, as viewed by world Cement producers.
A process, capital intensive industry: The cost of a new Cement plant is usually above US$ 300 million. The cost of a new Cement plant is equivalent to around 3 years of turnover, which ranks the Cement industry among the most capital intensive industries. Long time periods are therefore needed before investments can be recovered and plant modifications have to be carefully planned and must take account of the long-term nature of the industry.
An energy intensive industry: Each tone of Cement produced requires 60 to 130 kilogram�s of fuel oil or its equivalent, depending on the Cement variety and the process used, and an average of 110 KWh of electricity. The energy bill represents over 25% of total production costs in the Cement industry.
An industry with low labor intensity: The growing use of computer technology and automated manufacturing techniques has allowed Cement companies minimize the number of workers needed. A modern plant is usually manned by less than 150 people.
An industry with a homogeneous product: Although produced from natural raw materials, which vary from plant to plant, Cement can be considered a standard product. There are only a few classes of Cement and in each class products from different producers can generally be interchanged. Therefore, price is the most important sales parameter next to customer service; quality premiums exist but are rather limited.
A heavy product: Land transportation costs are significant and it used to be said that Cement could not be economically hauled beyond 200 or at most 300km. The price of long road transportation may even be higher than the cost of the product. Bulk shipping has changed that, however, it is now cheaper to cross the Atlantic Ocean with 35,000 tones of cargo than to truck it 300km. In large countries, transportation costs normally cluster the markets into regional areas, with the exception of a few long-distance transfers (where, for example, sea terminal facilities exist).
A mature product: Demand for Cement (which was first produced in the early 1800s) increased considerably in the 20th century, reflecting the development of industry and growing urbanization. Consumption in the industrialized

Global Study on Cement, 2008.
6
countries multiplied 6 to 8 times following World War II. Other than a few ups and downs in both the United States and Europe in the intervening years, growth continued until the 1975 oil crisis - with a subsequent decline of 20 to 40 percent in mature markets. However, over the last 25 years, some European countries have doubled or even tripled their consumption (Greece, Portugal, Spain and Turkey), since these countries have experienced significant growth over the last 10 years.
Market parameters: Consumption of Cement is closely linked to both the state of economic development in any given country or region and to the economic cycle. In mature markets, such as Europe, where Cement consumption per capita still varies considerably from one country to another, Cement sales are dependent on evolution and habits in the construction sector, a sector that itself following very closely (usually after a brief delay) the evolution of the economy in general.
3 WORLD CEMENT MARKET
Global cement consumption has surpassed all forecasts, with worldwide demand rising from 2.185 billion tons in 2004 to stand at 2.755 billion tons in 2007 and, on present indicators, likely to rise to 2.934 billion tons in 2008. Demand figure is projected to grow by 3.5% per annum to reach a level of 3.25 billion tons by 2011 The table below summarizes the historical and projected worldwide cement consumption, production and trade.
Table 1 Million tons
Years 2004 2005 2006 2007* 2008* 2009* 2010* 2011*
Consumption 2,185 2,342 2,557 2,755 2,934 3,036.69 3,142.97 3,252.98
Change % - 7.19% 9.18% 7.74% 6.50% 3.50% 3.50% 3.50% Production 2,200 2,371 2,611 2,799 2,981 3,085 3,193 3,305
Change % - 7.77% 10.12% 7.20% 6.50% 3.50% 3.50% 3.50%
World trade 148 165 174 163 155 149 143 137
Change % - 11.49% 5.45% -6.32% -4.91% -4% -4% -4%
Source: The Global Cement Report 7th edition. * Estimated
As can be seen, the consumption of cement has increased and will increase�further during the current year. The average growth rate of consumption is around 7.7%. Nonetheless, this increase of consumption is expected to be supplied by local production as its growth rate increase in parallel with the consumption growth rate. Contrarily, world trade (imports and exports) is expected to decline due to
Global Study on Cement, 2008.
7
increasing of the local demand in most of top exporting country such as India, which starts to direct its exports to satisfy the local demand.
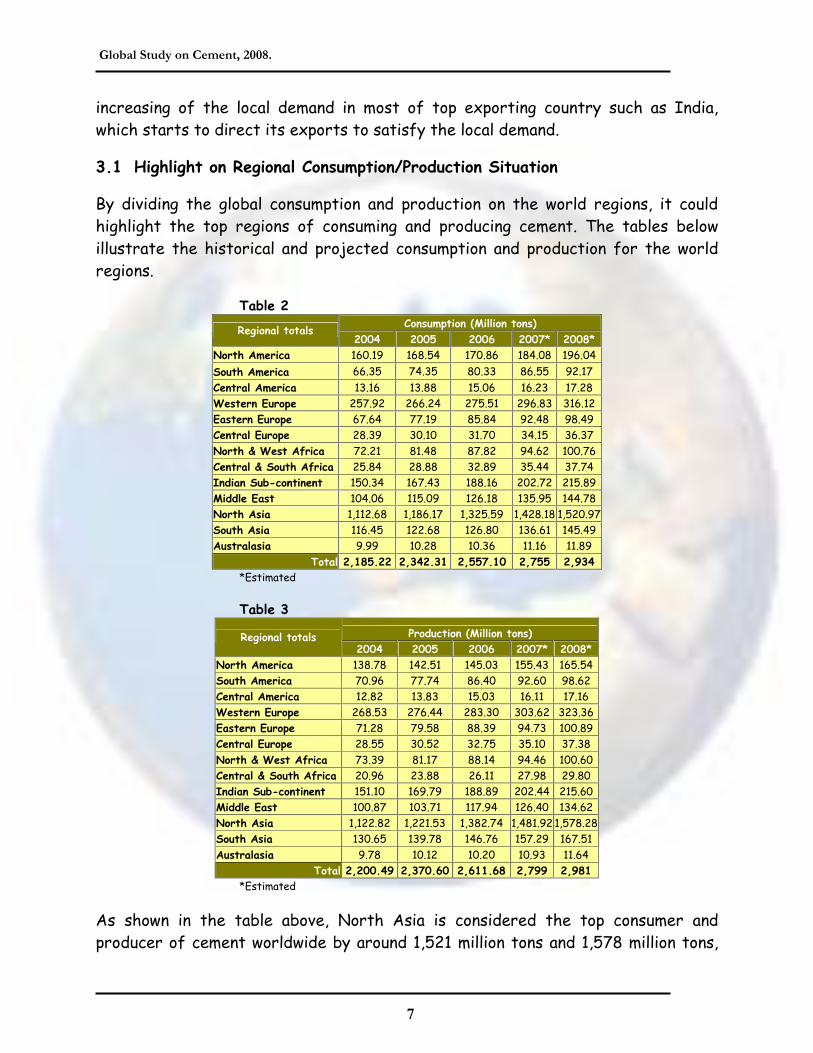
3.1 Highlight on Regional Consumption/Production Situation
By dividing the global consumption and production on the world regions, it could highlight the top regions of consuming and producing cement. The tables below illustrate the historical and projected consumption and production for the world regions.
Table 2 Consumption (Million tons)
Regional totals 2004 2005 2006 2007* 2008*
North America 160.19 168.54 170.86 184.08 196.04
South America 66.35 74.35 80.33 86.55 92.17
Central America 13.16 13.88 15.06 16.23 17.28 Western Europe 257.92 266.24 275.51 296.83 316.12 Eastern Europe 67.64 77.19 85.84 92.48 98.49 Central Europe 28.39 30.10 31.70 34.15 36.37 North & West Africa 72.21 81.48 87.82 94.62 100.76 Central & South Africa 25.84 28.88 32.89 35.44 37.74 Indian Sub-continent 150.34 167.43 188.16 202.72 215.89 Middle East 104.06 115.09 126.18 135.95 144.78 North Asia 1,112.68 1,186.17 1,325.59 1,428.18 1,520.97 South Asia 116.45 122.68 126.80 136.61 145.49 Australasia 9.99 10.28 10.36 11.16 11.89
Total 2,185.22 2,342.31 2,557.10 2,755 2,934 *Estimated
Table 3
Production (Million tons) Regional totals 2004 2005 2006 2007* 2008*
North America 138.78 142.51 145.03 155.43 165.54 South America 70.96 77.74 86.40 92.60 98.62 Central America 12.82 13.83 15.03 16.11 17.16 Western Europe 268.53 276.44 283.30 303.62 323.36 Eastern Europe 71.28 79.58 88.39 94.73 100.89 Central Europe 28.55 30.52 32.75 35.10 37.38 North & West Africa 73.39 81.17 88.14 94.46 100.60 Central & South Africa 20.96 23.88 26.11 27.98 29.80 Indian Sub-continent 151.10 169.79 188.89 202.44 215.60 Middle East 100.87 103.71 117.94 126.40 134.62 North Asia 1,122.82 1,221.53 1,382.74 1,481.92 1,578.28 South Asia 130.65 139.78 146.76 157.29 167.51 Australasia 9.78 10.12 10.20 10.93 11.64
Total 2,200.49 2,370.60 2,611.68 2,799 2,981 *Estimated
As shown in the table above, North Asia is considered the top consumer and producer of cement worldwide by around 1,521 million tons and 1,578 million tons,

Global Study on Cement, 2008.
8
respectively. In the second place, Western Europe comes with around 316 million tons as estimated consumption in 2008 and approximately 323 million tons as estimated cement production in 2008. Regarding Middle East, it is anticipated to consume roughly 145 million tons and produce 135 million tons in 2008. Such gap between consumption and production (10 million tons) in the Middle East region would be considered as export opportunities for Saudi cement companies.
3.2 International Trade Flows
The international trade flows show the imports and exports of cement among world regions. The tables below present the historical and projected imports and exports for the world regions.
Table 4 Imports (Million tons)
Regional totals 2004 2005 2006 2007* 2008*
North America 27.55 33.69 36.07 35.28 31.22 South America 1.16 1.36 0.97 0.95 0.84 Central America 0.91 1.49 1.52 1.49 1.32 Western Europe 30.45 32.24 35.23 34.46 30.49 Eastern Europe 3.45 4.88 5.11 5.00 4.42 Central Europe 5.57 5.81 5.44 5.32 4.71 North & West Africa 15.61 16.21 16.23 15.87 14.05 Central & South Africa 7.19 7.67 8.95 8.75 7.75 Indian Sub-continent 11.67 14.41 15.08 14.75 13.05 Middle East 19.51 21.61 24.28 23.75 21.01 North Asia 8.35 8.92 6.25 6.11 5.41 South Asia 10.72 10.88 11.61 11.35 10.05 Australasia 1.57 2.00 2.16 2.11 1.87
Total 143.71 161.17 168.90 165.18 146.18 *Estimated
As can be seen from the table above, North America is estimated to be the top importer of cement in 2008 of around 31.22 million tons, followed by Western Europe, which is expected to import about 30.5 million tons. In the third place, Middle East would come with around 21 million tons. Regarding North & West Africa, it is estimated to be the top fourth imported region with around 14 million tons. Based on the above, in addition of distance advantages, both North & West Africa and Middle East regions could be seen as promising markets for Saudi cement companies.
Table 5 Exports (Million tons)
Regional totals 2004 2005 2006 2007* 2008*
North America 7.20 7.71 8.94 8.58 8.18 South America 6.17 6.41 6.86 6.58 6.28 Central America 1.11 1.28 1.57 1.51 1.44
Global Study on Cement, 2008.
9
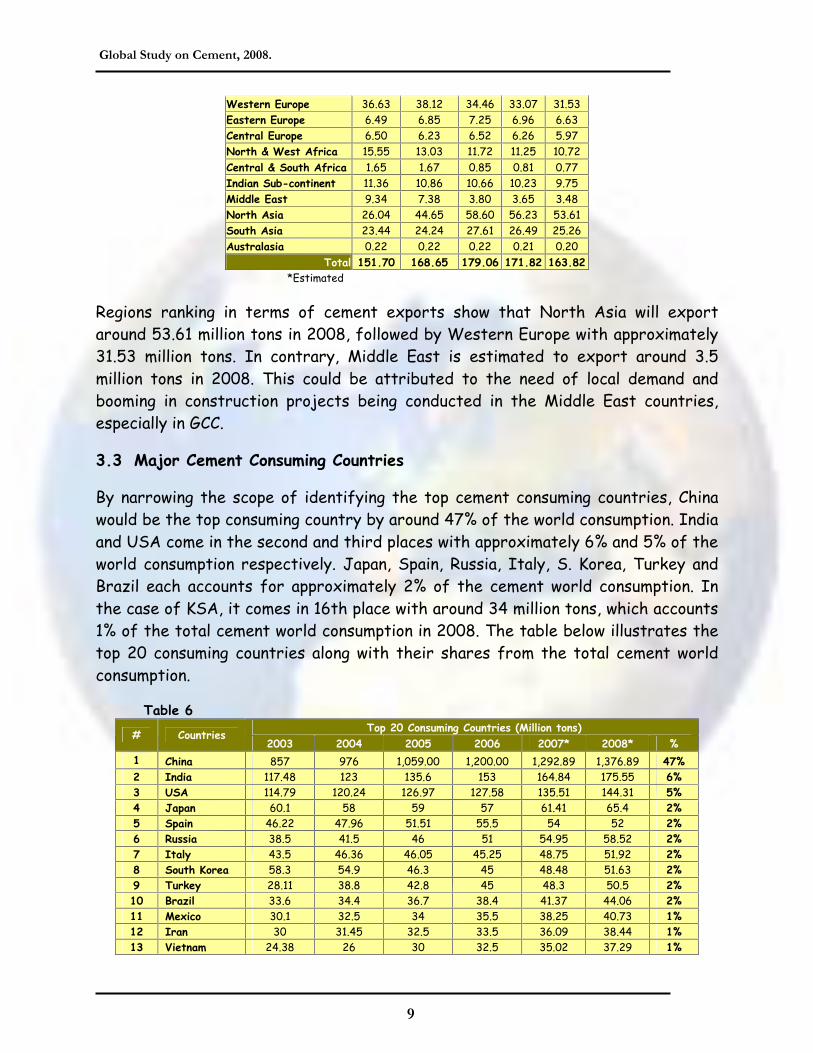
Western Europe 36.63 38.12 34.46 33.07 31.53 Eastern Europe 6.49 6.85 7.25 6.96 6.63 Central Europe 6.50 6.23 6.52 6.26 5.97 North & West Africa 15.55 13.03 11.72 11.25 10.72 Central & South Africa 1.65 1.67 0.85 0.81 0.77 Indian Sub-continent 11.36 10.86 10.66 10.23 9.75 Middle East 9.34 7.38 3.80 3.65 3.48 North Asia 26.04 44.65 58.60 56.23 53.61 South Asia 23.44 24.24 27.61 26.49 25.26 Australasia 0.22 0.22 0.22 0.21 0.20
Total 151.70 168.65 179.06 171.82 163.82 *Estimated
Regions ranking in terms of cement exports show that North Asia will export around 53.61 million tons in 2008, followed by Western Europe with approximately 31.53 million tons. In contrary, Middle East is estimated to export around 3.5 million tons in 2008. This could be attributed to the need of local demand and booming in construction projects being conducted in the Middle East countries, especially in GCC.
3.3 Major Cement Consuming Countries
By narrowing the scope of identifying the top cement consuming countries, China would be the top consuming country by around 47% of the world consumption. India and USA come in the second and third places with approximately 6% and 5% of the world consumption respectively. Japan, Spain, Russia, Italy, S. Korea, Turkey and Brazil each accounts for approximately 2% of the cement world consumption. In the case of KSA, it comes in 16th place with around 34 million tons, which accounts 1% of the total cement world consumption in 2008. The table below illustrates the top 20 consuming countries along with their shares from the total cement world consumption.
Table 6 Top 20 Consuming Countries (Million tons)
# Countries 2003 2004 2005 2006 2007* 2008* %
1 China 857 976 1,059.00 1,200.00 1,292.89 1,376.89 47% 2 India 117.48 123 135.6 153 164.84 175.55 6% 3 USA 114.79 120.24 126.97 127.58 135.51 144.31 5% 4 Japan 60.1 58 59 57 61.41 65.4 2% 5 Spain 46.22 47.96 51.51 55.5 54 52 2% 6 Russia 38.5 41.5 46 51 54.95 58.52 2% 7 Italy 43.5 46.36 46.05 45.25 48.75 51.92 2% 8 South Korea 58.3 54.9 46.3 45 48.48 51.63 2% 9 Turkey 28.11 38.8 42.8 45 48.3 50.5 2% 10 Brazil 33.6 34.4 36.7 38.4 41.37 44.06 2% 11 Mexico 30.1 32.5 34 35.5 38.25 40.73 1% 12 Iran 30 31.45 32.5 33.5 36.09 38.44 1% 13 Vietnam 24.38 26 30 32.5 35.02 37.29 1%

Global Study on Cement, 2008.
10
14 Indonesia 27.54 30.2 31.45 32.1 34.58 36.83 1% 15 Egypt 26.6 23.6 28.5 30.1 32.43 34.54 1% 16 Saudi Arabia 22.26 24.1 26.51 29.7 32 34.08 1% 17 Thailand 23.45 26.3 28.1 27.6 29.74 31.67 1% 18 Germany 29.03 29.02 26.93 27.4 29.52 31.44 1% 19 France 20.68 21.94 22.52 23.5 25.32 26.96 1% 20 Pakistan 12.3 12.52 14.79 16.87 18.18 19.36 1%
Others 367.75 387.78 418.36 451.80 493.37 531.88 18% Total 2,011.69 2,186.57 2,343.59 2,558.30 2,755 2,934 100%
*Estimated
3.4 Leading Cement and Clinker Exporters
By narrowing the scope of identifying the top cement exporters, China would be the top exporting country by around 20% of the world exports. Thailand and Japan come in the second and third places with approximately 8% and 6% of the world exports, respectively. In the fourth and fifth places, Turkey and India comes with around 8.9 and 8 million tons respectively. Egypt, Turkey, Taiwan and Indonesia each accounts for approximately 4% of the cement world exports. The table below illustrates the top 20 exporting countries along with their share from the total cement world exports.
Table 7 Top 20 Cement Exporters (Million tons)
# Countries 2003 2004 2005 2006 2007* 2008* %
1 China 5.22 6 22.15 35 33.59 32.02 20% 2 Thailand 12.2 11.24 13.8 14 13.43 12.81 8% 3 Japan 9.6 10.2 9.5 10.7 10.27 9.79 6% 4 Turkey 10.25 10.67 10.52 7.5 8.5 8.9 5% 5 India 8.89 10.06 9.19 8.8 8.44 8.05 5% 6 Egypt 7.4 12.4 9.5 7.5 7.2 6.86 4% 7 Taiwan 5 5.74 7 7 6.72 6.4 4% 8 Indonesia 7.3 7.62 5.01 6.7 6.43 6.13 4% 9 South Korea 3.14 4 5.9 5.8 5.57 5.31 3% 10 Germany 5.7 6.19 6.24 5.7 5.47 5.22 3% 11 Greece 4.35 4.89 5.7 5.5 5.28 5.03 3% 12 Canada 6.37 5.76 5.49 5.04 4.84 4.61 3% 13 Malaysia 2.54 3.02 2.84 4.39 3.7 3.7 2% 14 Belgium 2.2 3.06 3.15 3.3 3.17 3.02 2% 15 Italy 2.26 2.01 2.43 2.75 2.64 2.52 2% 16 Mexico 2.4 1.44 2.22 2.5 2.4 2.29 1% 17 Philippines 1.66 1.52 2.54 2.48 2.38 2.27 1% 18 Colombia 2.37 2.09 2.16 2.13 2.04 1.95 1% 19 Russia 2.3 2.1 2.1 2 1.92 1.83 1% 20 Ukraine 1.5 1.68 1.63 2 1.92 1.83 1%
Others 48.3 40.0 39.6 38.3 35.9 33 20% Total 150.95 151.69 168.64 179.05 171.82 163.81 100%
*Estimated

Global Study on Cement, 2008.
11
However, according to Comtrade Database, the statistics of top cement exporters reveals different ranking for top exporting countries. China is the top exporting country by around 19% of the world exports. Thailand and Japan came in the second and third places with approximately 7% of the world exports, for each. In the fourth place, Germany came with around 4.56 million tons (5%). India, Canada and South Korea each accounts for approximately 4% of the cement world exports. The table below illustrates the top 20 exporting countries, according to Comtrade Database, during years 2004 -2006 along with their share from the total cement world imports.
Table 8 Top 20 Cement Exporters (Million tons)
# Countries 2004 2005 2006 %
1 China 5.84 11.19 19.03 19%
2 Thailand 4.70 6.20 7.04 7%
3 Japan 5.34 6.09 6.82 7%
4 Germany 3.45 3.82 4.56 5%
5 India 2.83 3.95 4.04 4%
6 Canada 4.75 4.38 4.03 4%
7 South Korea 2.75 4.07 3.95 4%
8 Turkey 7.10 6.26 3.18 3%
9 Greece 2.63 3.34 2.77 3%
10 Russia 1.66 2.26 2.77 3%
11 Malaysia 1.76 2.65 3%
12 Egypt 1.50 1.66 2.46 2%
13 Saudi Arabia 1.32 1.62 2.28 2%
14 Mexico 1.44 2.22 2.11 2%
15 Italy 1.84 2.37 2.05 2%
16 Colombia 2.00 2.15 1.84 2%
17 Belgium 1.60 1.72 1.81 2%
18 Pakistan 0.72 1.90 1.81 2%
19 Indonesia 1.88 2.02 1.77 2%
20 Ukraine 1.35 1.39 1.36 1%
Others 24.48 26.35 20.86 21%
Total 80.94 94.98 99.19 100%
As can be seen from the two tables above, there is a clear discrepancy between the statistics of Global Cement Report and Comtrade Database. Such discrepancy could be attributed to the non-availability of trade statistics of some countries in the Comtrade Database. Hence, it is advised to stick to the Global Cement Report� statistics, as it cover most countries and contain credible information.
3.5 Leading Cement and Clinker Importers
By narrowing the scope of identifying the top cement importers, USA would be the top importing country by around 21% of the world imports. Spain and Bangladesh

Global Study on Cement, 2008.
12
come in the second and third places with approximately 6% and 5% of the world imports, respectively. In the fourth place, UAE comes with around 5.3 million tons (4%). Italy, Sir Lanka and Singapore each accounts for approximately 3% of the cement world imports. The table below illustrates the top 20 importing countries along with their share from the total cement world imports.
Table 9 Top 20 Cement Importers (Million tons)
# Countries 2003 2004 2005 2006 2007* 2008* %
1 USA 23.63 26.67 32.81 35.18 34.73 30.73 21% 2 Spain 8.15 8.84 10.72 11.5 10 9 6% 3 Bangladesh 6.4 5.54 7.5 8 7.82 6.92 5% 4 UAE 1 4.4 3.5 5.5 5.3 5.3 4% 5 Italy 4.5 5 5 4.9 4.79 4.24 3% 6 Sri Lanka 1.5 2.63 3.09 3.48 3.7 4.13 3% 7 Singapore 3.75 3.17 3.11 3.12 3.4 3.8 3% 8 Netherlands 3.1 3.77 3.74 3.85 3.77 3.33 2% 9 Vietnam 3.5 4.1 4.2 3.5 3.42 3.03 2% 10 Malaysia 1.2 1.29 1.46 2.27 3 3 2% 11 France 2.45 2.56 2.92 3.45 3.37 2.99 2% 12 Kuwait 0.3 1.4 1.84 2.13 2.43 2.8 2% 13 South Korea 1.87 3.6 3.4 3.2 3.13 2.77 2% 14 Iraq 2.3 3 3.3 2.5 2.8 2.5 2% 15 Ghana 2.18 2.1 2.2 2.25 2.4 2.4 2% 16 Syria - 1.24 1.66 2.26 2.31 2.23 2% 17 Turkey 0.01 - 0.25 2 2 2 1% 18 Afghanistan 1.4 1.6 2.05 2.3 2.25 1.99 1% 19 Kazakhstan 0.45 0.85 1.7 2.2 2.15 1.9 1% 20 Nigeria 0.2 7.4 7.72 8.33 2.67 0.5 0.3%
Others 58.6 54.55 59 56.98 59.75 50.62 35% Total 126.49 143.71 161.17 168.9 165.19 146.18 100%
*Estimated
However, according to Comtrade Database, the statistics of top cement importers reveals different ranking for top importing countries. USA is the top importing country by around 40% of the world imports. South Korea and Spain came in the second and third places with approximately 4% of the world imports, for each. In the fourth place, Singapore came with around 2.82 million tons (4%). Syria and Kazakhstan each accounts for approximately 3% of the cement world imports. The table below illustrates the top 20 importing countries, according to Comtrade Database, during years 2004 -2006 along with their share from the total cement world imports.

Global Study on Cement, 2008.
13
Table 10 Top 20 Cement Importers (Million tons)
# Countries 2004 2005 2006 %
1 USA 24.18 28.83 30.95 40%
2 South Korea 3.42 3.40 3.18 4%
3 Spain 2.33 2.68 2.90 4%
4 Singapore 2.94 2.83 2.82 4%
5 Syria 0.55 1.28 2.58 3%
6 Kazakhstan 0.98 1.66 2.46 3%
7 Netherlands 1.23 1.41 1.74 2%
8 Yemen 1.40 1.48 1.68 2%
9 Sudan 1.73 1.92 1.63 2%
10 Italy 2.09 1.99 1.45 2%
11 France 1.01 1.15 1.36 2%
12 Hong Kong 2.05 1.77 1.35 2%
13 Indonesia 0.06 1.01 1.20 2%
14 Qatar 0.55 1.43 1.18 2%
15 Albania 1.02 1.43 1.12 1%
16 Japan 0.82 0.91 1.05 1%
17 Germany 0.95 0.98 0.97 1%
18 Czech Rep. 0.89 0.85 0.90 1%
19 Belgium 0.87 0.70 0.81 1%
20 China 0.05 0.81 0.76 1%
Others 19.83 18.59 15.82 20%
Total 68.97 77.10 77.88 100%
As can be compared between the two tables above, there is a clear discrepancy between the statistics of Global Cement Report and Comtrade Database. Such discrepancy could be attributed to the non-availability of trade statistics of some countries in the Comtrade Database such as UAE, Iraq and Kuwait. Hence, it is advised to stick to the Global Cement Report� statistics, as it cover most countries and contain credible information.
3.6 Leading International Cement Companies
There are six leading cement companies in the world i.e. Buzzi Unicem, Holcim, Lafarge, Cemex, Heidelberg Cement. These companies have adopted strong expansion strategies such as acquiring or establish green field project to produce and distribute in several oversea countries. Furthermore, all of them have developed their exporting capabilities to ship and distribute cement in overall world. In general, the expansion strategies of theses companies can be summarized in the following points:-
Acquisition and establishment of cement factories in potential markets. Establishing trade cement companies to market and distribute the surplus
of cement production.

Global Study on Cement, 2008.
14
Investing in building and developing export terminals in sea ports� of targeted countries.
Froward integration toward establishing ready-mix and pre-cast factories.
The following lines will present a glance about each company and its installed capacities.
Buzzi Unicem is the market leader in Luxembourg and the second largest cement producer in Italy, Germany and the Ukraine as well as fifth largest in the United States. In 2005, Buzzi Unicem cement sales increased by one per cent to 32.2 million tons and group turnover rose by 6.5% to �2,941.4 million. Ready-mixed concrete deliveries were 2.7 per cent higher at 15.6 millions m3.
Holcim is market leader in cement in Latin America, North America, Switzerland, Slovakia and, through a joint venture, in Australia. It also enjoys strong market positions in Europe and in Asia. Holcim increased cement and clinker volume by 8.3% to 11 0.6 million tons in 2005, with ready-mixed concrete deliveries rising by 30.4% to 38.2 million m3. Group turnover advanced by 39.8 per cent to CHF 18,468 million (�11,914 million), cement and clinker representing 55.8 per cent, or CHF11, 361 million (�7,459 million).
Lafarge is market leader in cement in France, Great Britain, Greece, Austria, North America plus several developing markets. Group turnover rose by 10.6 % to �15,969 million tons in 2005, with the strongest growth being achieved in the Mediterranean area and in Latin America. Cement deliveries rose by 3.2 % to 123.2 million tons, with turnover from cement, including sales to other parts of the group, increasing by 12.3% to �8,314 millions. Moreover, in January, 2008, Lafarge acquired Orascom Construction Industries (�OCI�), which has cement plants in divergent countries such as Egypt, Algeria, Syria, Sudan and Pakistan.
Cemex is by far the leading cement producer in Mexico and is also market leader in Spain, Venezuela and in a number of Central American and Caribbean countries, plus Croatia and Latvia. The group is number two in Colombia and number three in the US and Great Britain.
Heidelberg Cement is market leader in Germany, The Netherlands, Belgium, Sweden, Norway, Estonia, Poland, the Czech Republic, Hungary, the Ukraine, and Bosnia as well as in a number of African markets.
Italcementi is group market leader in cement in Italy, Bulgaria and, since 2005, Egypt, number two in France and Morocco as well as number three in Belgium, Greece and Kazakhstan. Italcementi increased cement sales by 17 per cent to
Global Study on Cement, 2008.
15
56.3 million tons 2005, while group turnover advanced by 10.4 % to �4,999.6 million.
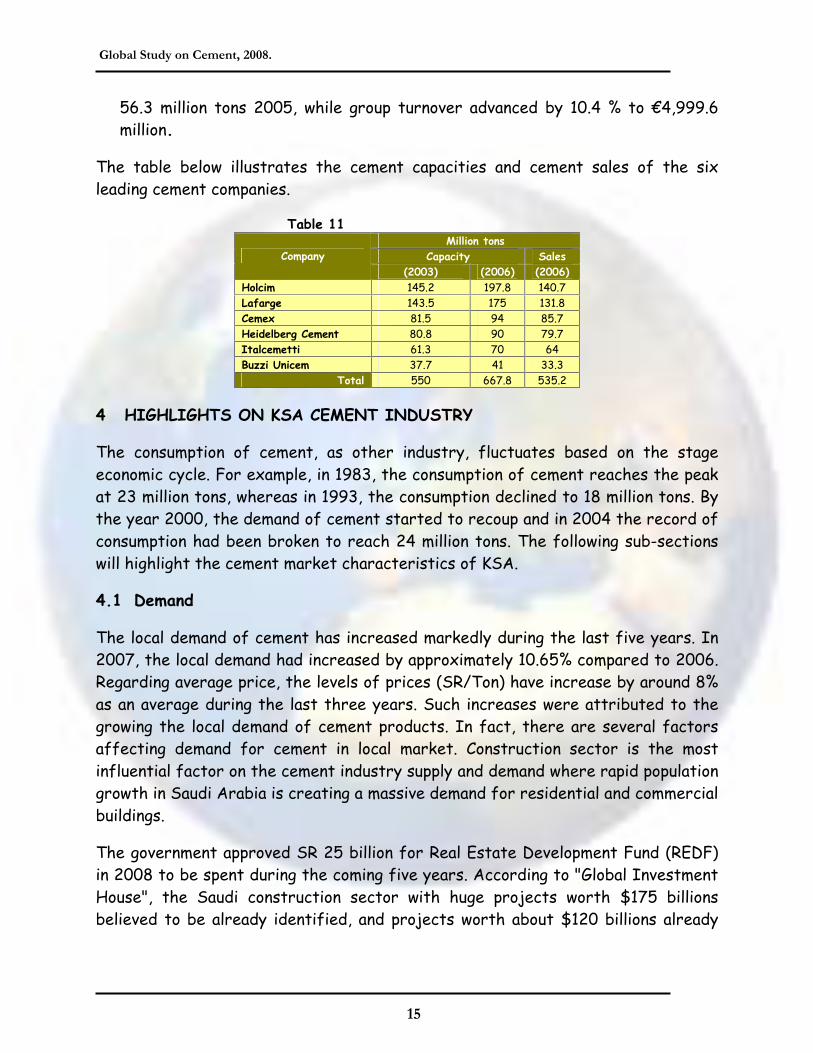
The table below illustrates the cement capacities and cement sales of the six leading cement companies.
Table 11 Million tons
Sales Capacity (2006) (2006) (2003)
Company
140.7 197.8 145.2 Holcim 131.8 175 143.5 Lafarge 85.7 94 81.5 Cemex 79.7 90 80.8 Heidelberg Cement 64 70 61.3 Italcemetti
33.3 41 37.7 Buzzi Unicem 535.2 667.8 550 Total
4 HIGHLIGHTS ON KSA CEMENT INDUSTRY
The consumption of cement, as other industry, fluctuates based on the stage economic cycle. For example, in 1983, the consumption of cement reaches the peak at 23 million tons, whereas in 1993, the consumption declined to 18 million tons. By the year 2000, the demand of cement started to recoup and in 2004 the record of consumption had been broken to reach 24 million tons. The following sub-sections will highlight the cement market characteristics of KSA.
4.1 Demand
The local demand of cement has increased markedly during the last five years. In 2007, the local demand had increased by approximately 10.65% compared to 2006. Regarding average price, the levels of prices (SR/Ton) have increase by around 8% as an average during the last three years. Such increases were attributed to the growing the local demand of cement products. In fact, there are several factors affecting demand for cement in local market. Construction sector is the most influential factor on the cement industry supply and demand where rapid population growth in Saudi Arabia is creating a massive demand for residential and commercial buildings.
The government approved SR 25 billion for Real Estate Development Fund (REDF) in 2008 to be spent during the coming five years. According to "Global Investment House", the Saudi construction sector with huge projects worth $175 billions believed to be already identified, and projects worth about $120 billions already
Global Study on Cement, 2008.
16
announced, in additional to about $27 billions for King Abdullah Economic City has, obviously, positive implications for the country's cement sector.
Moreover, the Ministry of Education is planning to build a total of 8,927 (5,035 and 3,892 for girls and boys respectively) of school and administrative buildings in the Kingdom during the current decade 1420 to 1430. The objective is to replace currently rented school buildings throughout the Kingdom. Moreover, current expansion projects of the two holy mosques in Makkah and Al Medina with an expected finishing period of 10-15 years. Another factor is related to Saudi Arabian General Investment Authority (SAGIA) where it is responsible for all the foreign and joint venture investment projects. The investment act covers four areas of investment; industry, agriculture, mining and service. It gives the foreign investors an attractive package of concession and facilities including free land, soft government loans, tax exemption, etc.
In addition, ARAMCO will introduce 4 huge projects for investment in Kharsaniah, Shaibah, Khrais and Al-Hawiah. The expected period to contract these projects is during 2006-2008. As for housing units, it is estimated that in the short run, there is demand for an additional 2 million housing units around the country, with over 600,000 in Riyadh alone (according to a study prepared by NCB); however, assuming Saudi population to reach 33.44 million by 2020 with a family size of 5.3 person, it is estimated that 2.32 million new housing units to be built in the Kingdom. Therefore, demand of cement is expected to increase in the next following years.
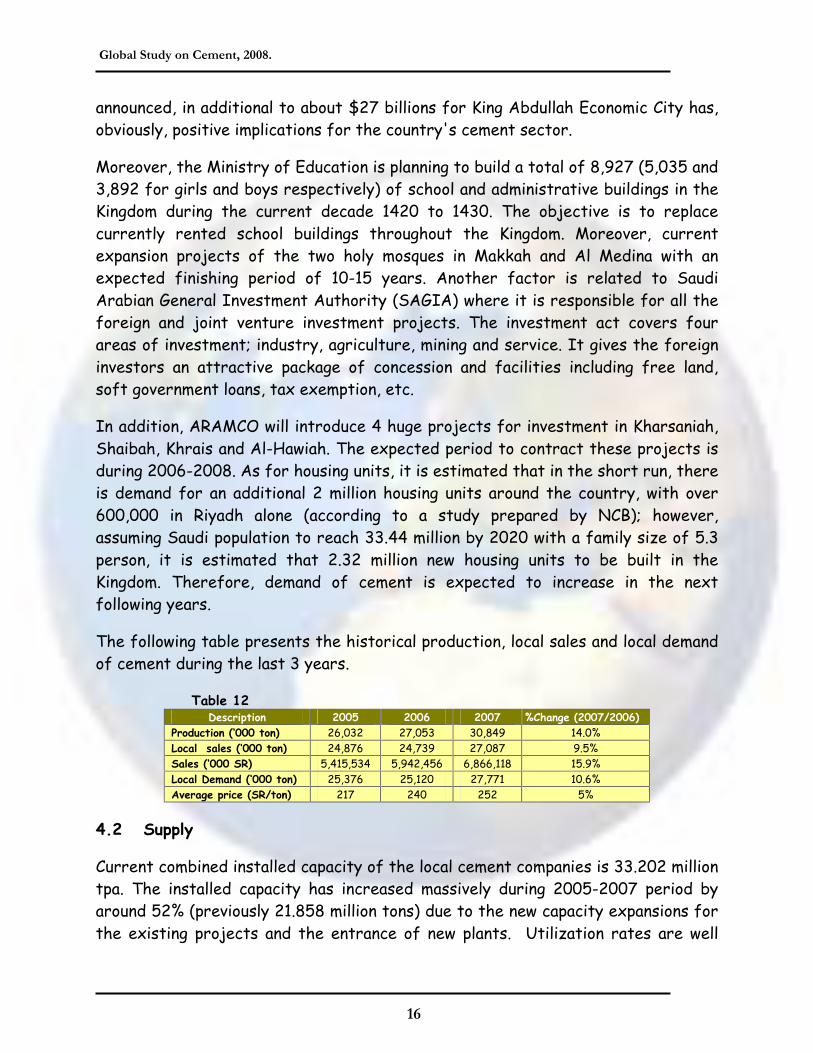
The following table presents the historical production, local sales and local demand of cement during the last 3 years.
Table 12 Description 2005 2006 2007 %Change (2007/2006)
Production (�000 ton) 26,032 27,053 30,849 14.0% Local sales (�000 ton) 24,876 24,739 27,087 9.5% Sales (�000 SR) 5,415,534 5,942,456 6,866,118 15.9% Local Demand (�000 ton) 25,376 25,120 27,771 10.6% Average price (SR/ton) 217 240 252 5%
4.2 Supply
Current combined installed capacity of the local cement companies is 33.202 million tpa. The installed capacity has increased massively during 2005-2007 period by around 52% (previously 21.858 million tons) due to the new capacity expansions for the existing projects and the entrance of new plants. Utilization rates are well
Global Study on Cement, 2008.
17
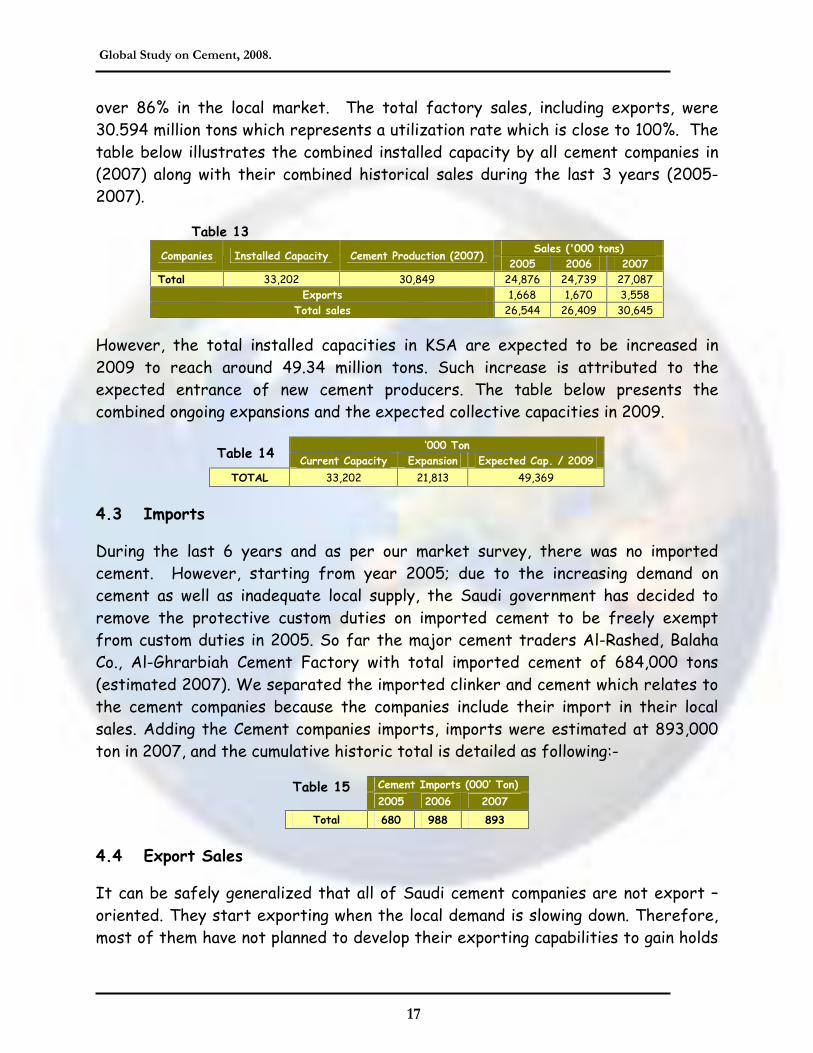
over 86% in the local market. The total factory sales, including exports, were 30.594 million tons which represents a utilization rate which is close to 100%. The table below illustrates the combined installed capacity by all cement companies in (2007) along with their combined historical sales during the last 3 years (2005-2007).
Table 13 Sales ('000 tons)
Companies Installed Capacity Cement Production (2007) 2005 2006 2007
Total 33,202 30,849 24,876 24,739 27,087 Exports 1,668 1,670 3,558
Total sales 26,544 26,409 30,645
However, the total installed capacities in KSA are expected to be increased in 2009 to reach around 49.34 million tons. Such increase is attributed to the expected entrance of new cement producers. The table below presents the combined ongoing expansions and the expected collective capacities in 2009.
�000 Ton Table 14
Current Capacity Expansion Expected Cap. / 2009
TOTAL 33,202 21,813 49,369
4.3 Imports
During the last 6 years and as per our market survey, there was no imported cement. However, starting from year 2005; due to the increasing demand on cement as well as inadequate local supply, the Saudi government has decided to remove the protective custom duties on imported cement to be freely exempt from custom duties in 2005. So far the major cement traders Al-Rashed, Balaha Co., Al-Ghrarbiah Cement Factory with total imported cement of 684,000 tons (estimated 2007). We separated the imported clinker and cement which relates to the cement companies because the companies include their import in their local sales. Adding the Cement companies imports, imports were estimated at 893,000 ton in 2007, and the cumulative historic total is detailed as following:-
Cement Imports (000� Ton) Table 15 2005 2006 2007
Total 680 988 893
4.4 Export Sales
It can be safely generalized that all of Saudi cement companies are not export �oriented. They start exporting when the local demand is slowing down. Therefore, most of them have not planned to develop their exporting capabilities to gain holds
Global Study on Cement, 2008.
18
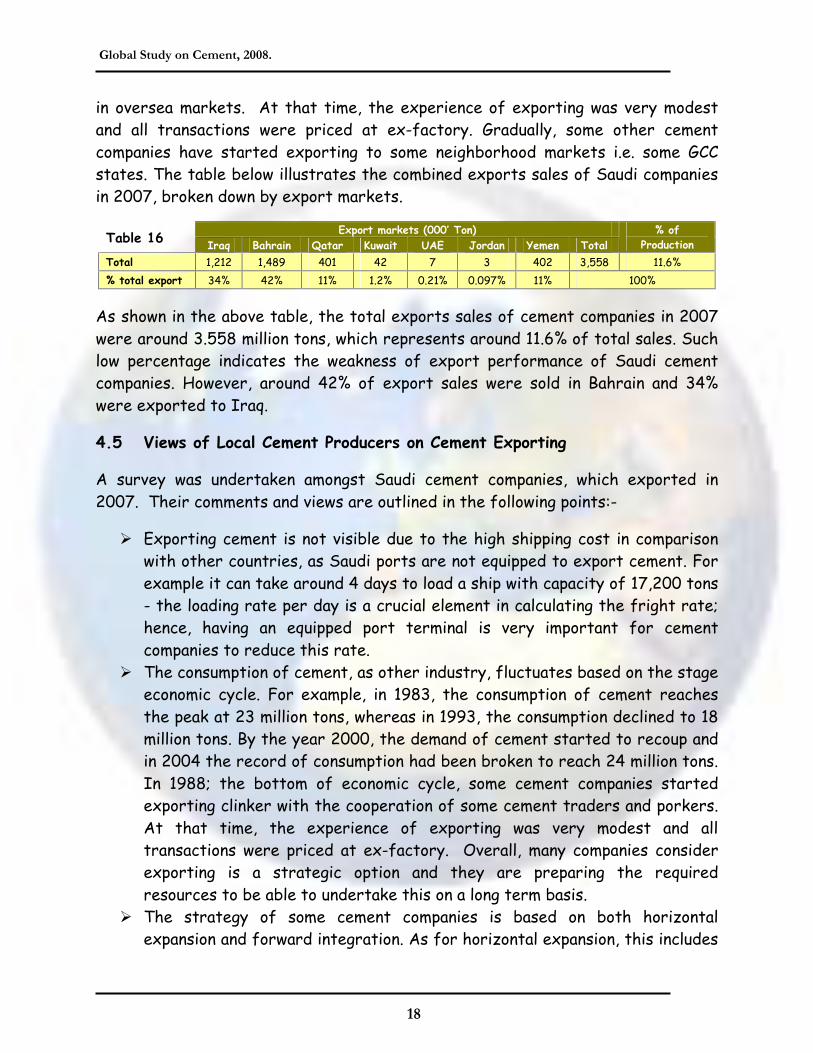
in oversea markets. At that time, the experience of exporting was very modest and all transactions were priced at ex-factory. Gradually, some other cement companies have started exporting to some neighborhood markets i.e. some GCC states. The table below illustrates the combined exports sales of Saudi companies in 2007, broken down by export markets.
Export markets (000� Ton) Table 16
Iraq Bahrain Qatar Kuwait UAE Jordan Yemen Total % of
Production
Total 1,212 1,489 401 42 7 3 402 3,558 11.6%
% total export 34% 42% 11% 1.2% 0.21% 0.097% 11% 100%
As shown in the above table, the total exports sales of cement companies in 2007 were around 3.558 million tons, which represents around 11.6% of total sales. Such low percentage indicates the weakness of export performance of Saudi cement companies. However, around 42% of export sales were sold in Bahrain and 34% were exported to Iraq.
4.5 Views of Local Cement Producers on Cement Exporting
A survey was undertaken amongst Saudi cement companies, which exported in 2007. Their comments and views are outlined in the following points:-
Exporting cement is not visible due to the high shipping cost in comparison with other countries, as Saudi ports are not equipped to export cement. For example it can take around 4 days to load a ship with capacity of 17,200 tons - the loading rate per day is a crucial element in calculating the fright rate; hence, having an equipped port terminal is very important for cement companies to reduce this rate.
The consumption of cement, as other industry, fluctuates based on the stage economic cycle. For example, in 1983, the consumption of cement reaches the peak at 23 million tons, whereas in 1993, the consumption declined to 18 million tons. By the year 2000, the demand of cement started to recoup and in 2004 the record of consumption had been broken to reach 24 million tons. In 1988; the bottom of economic cycle, some cement companies started exporting clinker with the cooperation of some cement traders and porkers. At that time, the experience of exporting was very modest and all transactions were priced at ex-factory. Overall, many companies consider exporting is a strategic option and they are preparing the required resources to be able to undertake this on a long term basis.
The strategy of some cement companies is based on both horizontal expansion and forward integration. As for horizontal expansion, this includes

Global Study on Cement, 2008.
19
developing plans to develop new cement types, such as plastering cement in order to meet customer requirements. In terms of forward integration, some companies are considering entering the ready-mix sector, etc.
Some companies have no real plans to export but are concentration more on developing their local market.
4.6 Advantage/Disadvantage of Exporting
Advantages
Improvement of the overall utilization rates. Hence, more volume are sold. When prices of cement in the export market are higher than the home market, profitability will improve.
Maintaining presence in the export market should help reducing total dependence on home market.
Gaining reputation of quality products among other competing brands in those exported markets. This can only be obtained if quality standards are achieved.
Disadvantages
Being a home industry, cement shipping costs reduces profitability, particularly when there is a gap between local market prices and prices in targeted market higher than the shipping costs.
The longer the distance that cement shipped to can cause shortages of the product shelf life. Hence, this may negatively affect the quality of cement being exported to a distance area.
A clear disadvantage, where transportation is required, particularly for those cement companies located in distance from coastal areas. Coastal areas are those equipped with suitable terminals for exporting cement.
Cement is considered a heavy product, which would require large fleet/ships for transporting to export market. In this case, time of delivery could be a major disadvantage of exporting cement.
4.7 Exporting Capability & Requirements of Exporters
As implied earlier, the exports capabilities of Saudi Cement companies are very modest and needs to be developed to enhance the export performance of these companies. Hence, there is a solid concurrence among existing cement exporters about attributing the low of exporting cement to several points as follows:

Global Study on Cement, 2008.
20
The non- readiness of exports infrastructure in terms of railways and sea ports (exporting terminals).
The increase of ports fees for cement products. The fees of packed cement are SR22/Ton, whereas the fees of bulk cement is SR4/Ton.
Regarding the fees of exported cement, Saudi Cement companies suggest to eliminate any export fees in order to provide incentives for cement companies to start exporting.
5 POTENTIAL CEMENT EXPORT MARKETS
In this section, screening has been conducted on the top worldwide cement importers to identify export markets for Saudi cement companies. This screening had been conducted based on three criteria i.e. market demand, transportation distances from KSA and previous experiences of Saudi cement companies in those markets. The results of this screening come up with 10 potential export markets. In the following section, glances of local market for each targeted country will be provided.
5.2 Potential Markets for Saudi Cement Companies
The most potential export markets identified for Saudi cement companies are Iraq, Spain, Malaysia, Ghana, Kuwait, Syria, UAE, Sir Lanka, Singapore, and Turkey. For each country, information about market overview, existing players and landed prices are discussed in the following sub-sections.
5.2.1 Spain
Market Overview
Cement consumption in Spain rose, by 7.4 % from 47.97 million tons in 2000 to 51.51 million tons in 2005 and is estimated to end 2007 around 54 million tons , representing 7.6% expansion. The country remains the largest cement market in Europe and the per capita consumption has reached a new record of 1229kg.The strongest growth in cement consumption was seen in central Spain, which includes Madrid and Castilla-La Mancha, with an increase of 23.2%. Catalonia was in second place with an increase of 7.3%, followed by Castilla y Leon. Valencia and the Can-tabria area were the only regions of show declining cement consumption, in each case by around 0.2 %. In terms of overall consumption, Andalusia is the largest cement market in Spain and accounted for 20.3% of consumption in 2005, followed by Catalonia with 13.4%, the greater Madrid market with 11.7% and Valenciana with

Global Study on Cement, 2008.
21
11.3%. Between them, the four biggest markets represented 56.6% of the total Spanish cement consumption.
Bulk cement increased its share of market to 82% in 2005 compared with 81% two years earlier. The civil engineering industry accounted for 45% of cement consumption. Road projects and ports accounted for 24% and 22%, respectively. Building represented 55% of cement consumption, with house building accounting for 69% of this, commercial and industrial buildings for 20% and repair & maintains for 11%.
Local Production
There are now nine major cement producers left in Spain that have a production capacity of at least 1.5million tons, eight of which produce clinker, in addition to which there are a number of independent grinding stations. The nine leading producers control a combined cement capacity of 47.3 million tons at 43 plants.
There are now a number of independent grinding centers, following in the footsteps of the Valencia-based Cementos La Union, most of which have been established within the past six to eight years, and include cement producers such as Orascom and Nuh Cementos among their shareholders. The top three cement producers, Cementos Portland, Cemex and Holcim , between them account for roughly 50% of the Spanish cement consumption. The table below illustrates the 9 local cement manufacturers along with their capacities.
Table 17 Company (Million tons) Number of Plants
Cementos Portland 12.8 9 Cemex (Spanish) 11.2 10 Holcim (Spanish) 5.8 6 Lafarge Asland 5.2 4 Cimpor 3.8 6 Financieria Minera (Italcementi) 2.8 3 Tudela Veguin 2.6 3 Cementos Molins 1.6 1 Cementos Especiales de las 1.5 1
Trade
Exports were essentially and declined by 4.9 % in 2005 to 1.45 million tons. Cement produced in Spain is exported to the United States, France, Great Britain and Ireland and, in the case of white cement, to a wide range of countries, notably further to Africa.
Global Study on Cement, 2008.
22
Cemex Espana is the leading exporter of white cement, while the majority of the grey cement exports originate in the northeast of the country. Uniland has recently occupied the top slot in terms of exports, but with the change of ownership, some of the export business is likely to be shifted to the ports on the Bay of Biscay which is further removed from the main domestic markets. Imports of cement and clinker rose by 21.3 % in 2005 to a new record of 10.72 million tons.
The increase of 2.8 million tons, came from within the European Union, mainly from Portugal (1.14 million tons), Italy (O.7 million tons) and Greece (0.63 million tons), with both Italy and Greece more than doubling their shipments, while supplies from Portugal declined by 18.5%. China, which supplied less than 1000 tons in 2004, suddenly became the biggest source of imports in 2005, with deliveries of 2.45 million tons. Shipments from Egypt, which had reached 3.47 million tons in 2004, declined by 33.2 % in 2006 to 2.32 million tons. Turkey supplied 1.42 million tons, an increase of 11.7 % and Russia provided 13.2 % more at 0.82 million tons. Imports from India declined for the second year in a row and emerged 11.8 % lower at 0.28 million tons. These eight countries represented 90.4 % of the total imports in 2005, with France, Germany, Morocco and Tunisia each supplying between 0.1-0.2 million tons that year. Regarding Clinker, Spain imports are around 7.4 million tons by the end of 2005 and came from China, Egypt, India, Morocco and Croatia, while the main sources of cement were Russia, Italy, Turkey and Greece.
Prices
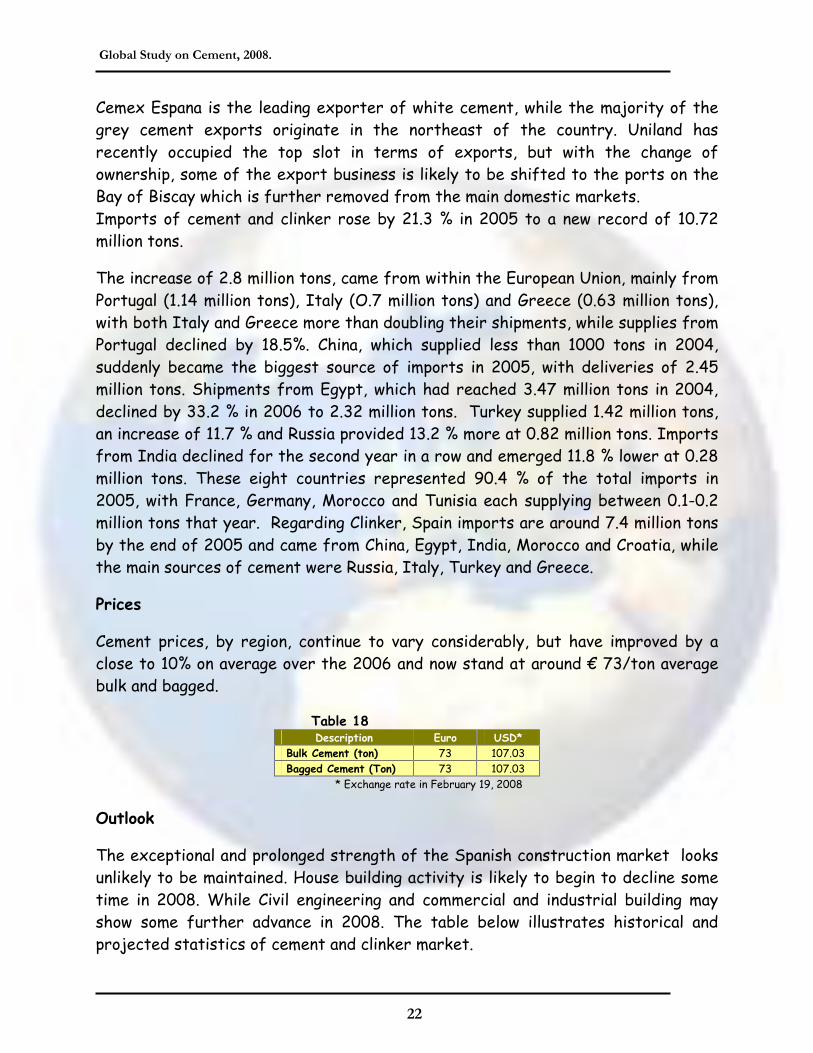
Cement prices, by region, continue to vary considerably, but have improved by a close to 10% on average over the 2006 and now stand at around � 73/ton average bulk and bagged.
Table 18 Description Euro USD*
Bulk Cement (ton) 73 107.03 Bagged Cement (Ton) 73 107.03
* Exchange rate in February 19, 2008
Outlook
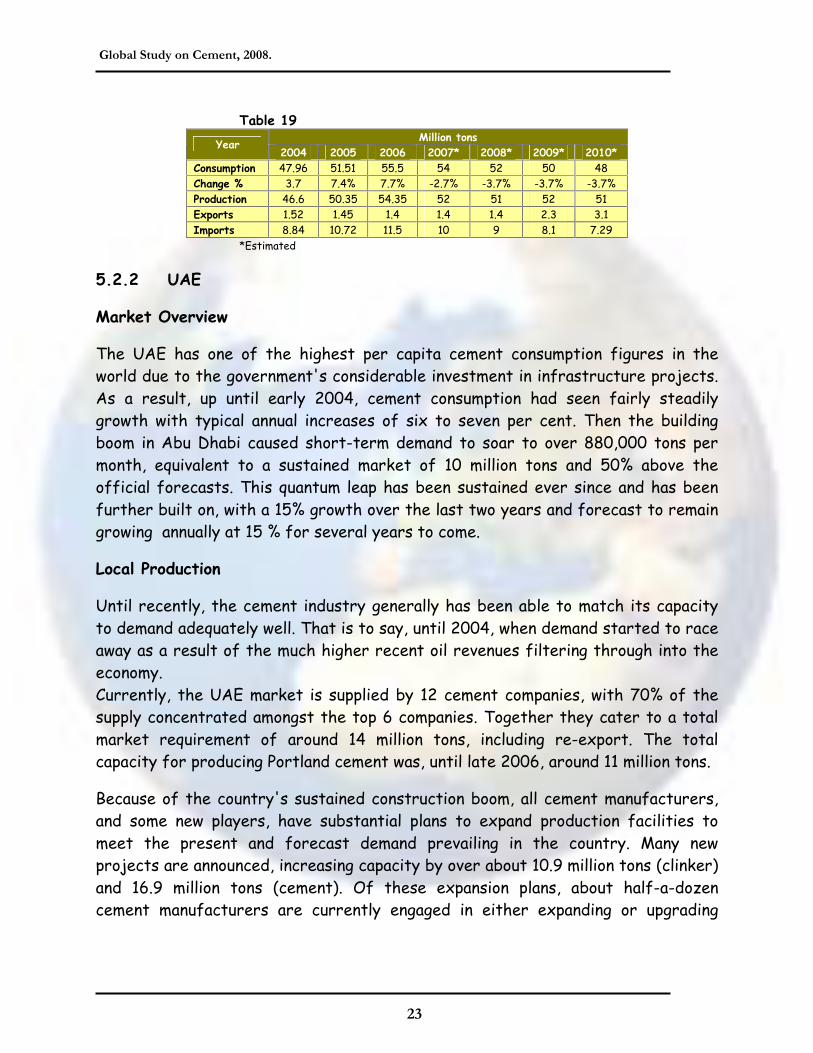
The exceptional and prolonged strength of the Spanish construction market looks unlikely to be maintained. House building activity is likely to begin to decline some time in 2008. While Civil engineering and commercial and industrial building may show some further advance in 2008. The table below illustrates historical and projected statistics of cement and clinker market.
Global Study on Cement, 2008.
23
Table 19 Million tons
Year 2004 2005 2006 2007* 2008* 2009* 2010*
Consumption 47.96 51.51 55.5 54 52 50 48 Change % 3.7 7.4% 7.7% -2.7% -3.7% -3.7% -3.7% Production 46.6 50.35 54.35 52 51 52 51 Exports 1.52 1.45 1.4 1.4 1.4 2.3 3.1 Imports 8.84 10.72 11.5 10 9 8.1 7.29
*Estimated
5.2.2 UAE
Market Overview
The UAE has one of the highest per capita cement consumption figures in the world due to the government's considerable investment in infrastructure projects. As a result, up until early 2004, cement consumption had seen fairly steadily growth with typical annual increases of six to seven per cent. Then the building boom in Abu Dhabi caused short-term demand to soar to over 880,000 tons per month, equivalent to a sustained market of 10 million tons and 50% above the official forecasts. This quantum leap has been sustained ever since and has been further built on, with a 15% growth over the last two years and forecast to remain growing annually at 15 % for several years to come.
Local Production
Until recently, the cement industry generally has been able to match its capacity to demand adequately well. That is to say, until 2004, when demand started to race away as a result of the much higher recent oil revenues filtering through into the economy. Currently, the UAE market is supplied by 12 cement companies, with 70% of the supply concentrated amongst the top 6 companies. Together they cater to a total market requirement of around 14 million tons, including re-export. The total capacity for producing Portland cement was, until late 2006, around 11 million tons.
Because of the country's sustained construction boom, all cement manufacturers, and some new players, have substantial plans to expand production facilities to meet the present and forecast demand prevailing in the country. Many new projects are announced, increasing capacity by over about 10.9 million tons (clinker) and 16.9 million tons (cement). Of these expansion plans, about half-a-dozen cement manufacturers are currently engaged in either expanding or upgrading
Global Study on Cement, 2008.
24
their plants, adding approximately 6 million tons of clinker and 9 million tons of cement with an investment of over US$ 1 billion, all by the end of 2006.
Projects include Al Ruya Industry's 3.6 million tons new plant in the Hamriya Free Zone by 2008 and Gulf Cement, which has a 7500 ton/day clinker line (2.5 million tons cement) due on-line by the end of 2007, in line with the company�s announcement in December 2004. In addition, National Cement Factory (NCF) has 2 million tons came in the first quarter of 2007. Hakim took a 25% interest in the company in February 2006 and will manage the plant.
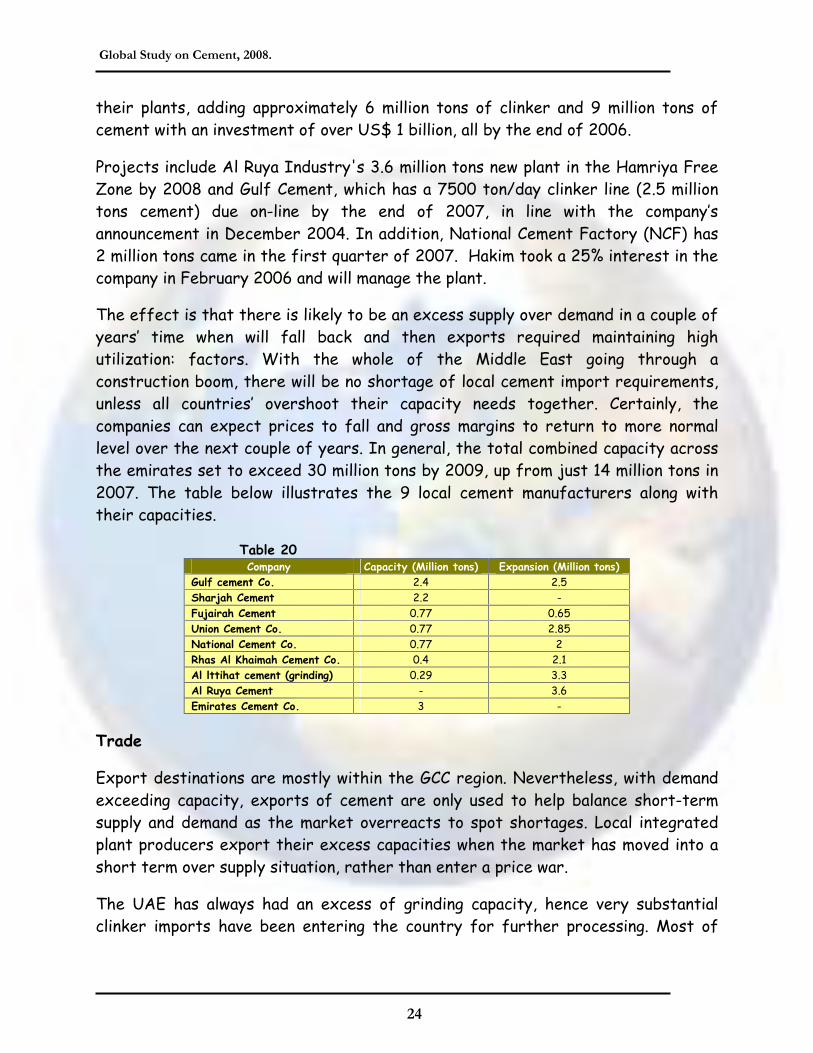
The effect is that there is likely to be an excess supply over demand in a couple of years� time when will fall back and then exports required maintaining high utilization: factors. With the whole of the Middle East going through a construction boom, there will be no shortage of local cement import requirements, unless all countries� overshoot their capacity needs together. Certainly, the companies can expect prices to fall and gross margins to return to more normal level over the next couple of years. In general, the total combined capacity across the emirates set to exceed 30 million tons by 2009, up from just 14 million tons in 2007. The table below illustrates the 9 local cement manufacturers along with their capacities.
Table 20 Company Capacity (Million tons) Expansion (Million tons)
Gulf cement Co. 2.4 2.5 Sharjah Cement 2.2 - Fujairah Cement 0.77 0.65 Union Cement Co. 0.77 2.85 National Cement Co. 0.77 2 Rhas Al Khaimah Cement Co. 0.4 2.1 Al lttihat cement (grinding) 0.29 3.3 Al Ruya Cement - 3.6 Emirates Cement Co. 3 -
Trade
Export destinations are mostly within the GCC region. Nevertheless, with demand exceeding capacity, exports of cement are only used to help balance short-term supply and demand as the market overreacts to spot shortages. Local integrated plant producers export their excess capacities when the market has moved into a short term over supply situation, rather than enter a price war.
The UAE has always had an excess of grinding capacity, hence very substantial clinker imports have been entering the country for further processing. Most of

Global Study on Cement, 2008.
25
this grinding capacity is in the Ras Al Khaimah port district. Up to1.8 million tons have been imported recently, mainly from Iran, Pakistan, India and the Philippines.
Prices
Prices were around US$87 in June 2006, but they have proved to be very volatile in the present situation of high market growth rates and as new capacity come on-line. Only a month before, in May 2006, spot prices leapt 200 per cent to U5$150/ton as supplies fell short. But, because of this shortage, panic or entrepreneurial importing has led to a low price in October 2006 that has led to a major share price fall as the industry tried to push through fuel based price rises that government resisted - all within five months of a high.
As new lines come on line, the typical median prices are likely to fall back to the mid U5$60s and if capacity gets seriously out of line, then a price war could break out. In a few years time, when the Middle Eastern countries scale back their investment plans, there is likely to be a large excess capacity that may hang around and mimic the scenarios of long standing excess capacities of over 50% in Thailand and Japan have had in the past, prompting the need to find large export markets in order to survive.
Outlook
After over two years of sustained growth, per capita cement consumption in the UAE has doubled to 3000kg, no doubt one of the highest in the world, reflecting the government's continuing investment in the country's infrastructure. This level would not normally be sustainable, but with huge increases in oil and gas revenues that are likely to remain historically very high for the foreseeable future, the economy is likely to continue to grow at over five per cent annually for many years to come.
With 13 player in the market and new ones joining in, there maybe some price wars once capacity exceeds demand, or at least when the clinker capacity exceeds demand. When this occurs, some consolidation is likely and the multinational could well move in to help rationalize capacity within the region through better marrying of group capacity utilization and local cross border trade.
The new planned additional capacity of 10.9 million tons of clinker and 16 million tons of cement, tabled in response to the recent shortage would seem to be a recipe for disaster since this would represent a per capita consumption 4600kg of

Global Study on Cement, 2008.
26
clinker or 8000 kg of cement. The table below illustrates historical and projected statistics of cement market.
Table 21 Million tons
Year 2004 2005 2006 2007* 2008* 2009* 2010*
Consumption 10.2 11.56 13.3 15.3 17.6 20.2 23.3 Change % 48.8% 13% 15% 15% 15% 15% 15% Production 9.8 10.3 12.9 14.8 17 30 30 Exports 0.4 0.8 0 0.8 0.8 10.3 7.2 Imports 4.4 3.5 5.5 5.3 5.3 0.5 0.5
*Estimated
5.2.3 Sir Lanka
Market Overview
Cement consumption in Sir Lanka has shown consistent growth each year over the last 5 years, growing at compound annual growth rate of 8.2% between 2001 and 2006. In 2006, demand remained strong with double �digit growth in excess of 10% for the second year in a row and overall consumption recorded at 4.05 million tons. Per capita consumption has been rising quickly and now stands at 204kg, though this level is still below the global average. Nevertheless the cement market is in good shape, and a positive growth trajectory supported by consistent demand from small homebuilders using cement for renovations and extensions. The rise in per capita income levels and strong growth in the property sector makes homebuilders the main driver for cement consumption. Over 100,000 housing units are being added annually and it is estimated that there is a shortage of around 400,000 housing units, a situation made worse by the tsunami disaster. Tax incentives and the increased availability of housing finance have raised demand for housing, but land scarcity (especially in urban areas) and the difficulty of obtaining clear title deeds remain constraints, limiting market growth.
Sri Lanka continues to see a high and increasing level of Gross Fixed Investment (GFI). As a percentage of GDP, GFI continues to rise and stood at an estimated 28.2 % in 2006, up from 26.4% in 2005. GFI is estimated to increase to 28.9 % in 2007, equivalent of US$9.0bn (at current market prices).
Local Production
There are six primary suppliers of cement in Sri Lanka, though only two - Hokim Lanka Ltd and Tokyo Cement - operate production facilities. Hokim (Lanka) Ltd operates the islands only integrated cement plant at Puttalam in the west of the

Global Study on Cement, 2008.
27
country, where capacity was upgraded to 1 million tons in 2005. The company also operates the 0.425 million tons Ruhunu grinding facility located in Galle, in the south of Sri Lanka, and also owns a bulk import terminal and packing plant at Galle port. The company has seen its market share declined from 34% in 2001 to 27% in 2006, when total sales reached 1.l million tons. Hokim (Lanka) Ltd generated annual revenues of approximately 102 millions USD in 2006.
However, the competitive landscape is changing in Sri Lanka following Holcim Group�s 2006 acquisition of Gujarat Ambuja Cements (GAC) in India. Holcim (Lanka) Ltd will see its combined market share boosted by around nine per cent to 35.5 per cent. Management of GAC�s Sri Lankan subsidiary, Ambuja Cement, will be merged with Holcim, and it is likely that Holcim will opt to merge brands in line with its historical corporate policy.
While Hokim is the dominant force in the Western Province where consumption is the highest, Holcim has been unable to penetrate the north of the island where Tokyo Cement is dominant. In the past the company has considered relocating its Galle packing facilities to Trincomalee in the north of Sri Lanka in order to extend coverage to the north east of the island from which it is effectively excluded at present, but this move seems to have been hampered by the difficult political environment and lack of government approval.
Tokyo Cement Co (Lanka) is a joint venture between Mitsui Mining Ltd, Japan and the privately held St. Anthony�s Consolidated Ltd, Sri Lanka, each of whom hold a 27.5% stake in the company. The company operates a dedicated grinding plant at Trincomalee in northeast Sri Lanka, with a cement capacity of 0.9 million tons, and import operations via its subsidiary, Tokyo Cement Colombo Terminal (Pvt) Ltd, located in Colombo port. Tokyo Cement is able to supply 1.5 million tons cement to the market annually. The company is currently upgrading its grinding operations with an investment of approximately US$12.9 million and including the installation of a new 1l0 tph Vertical Roller Mill. The new mill, which came online in March 2007, would increase annual capacity by 1 million tons, bringing total supply capabilities to 2.5 million tons. Tokyo Cement was the leading cement company in terms of sales volume in 2006 with annual sales reaching a record l.2 million tons, raising market share by half a per cent to 29.5%. Since 2001, the company has increased its market share from 19 %, partly at the expense of its competitors but also due to the doubling of demand in the North-Eastern province which the company successfully captured.
Global Study on Cement, 2008.
28
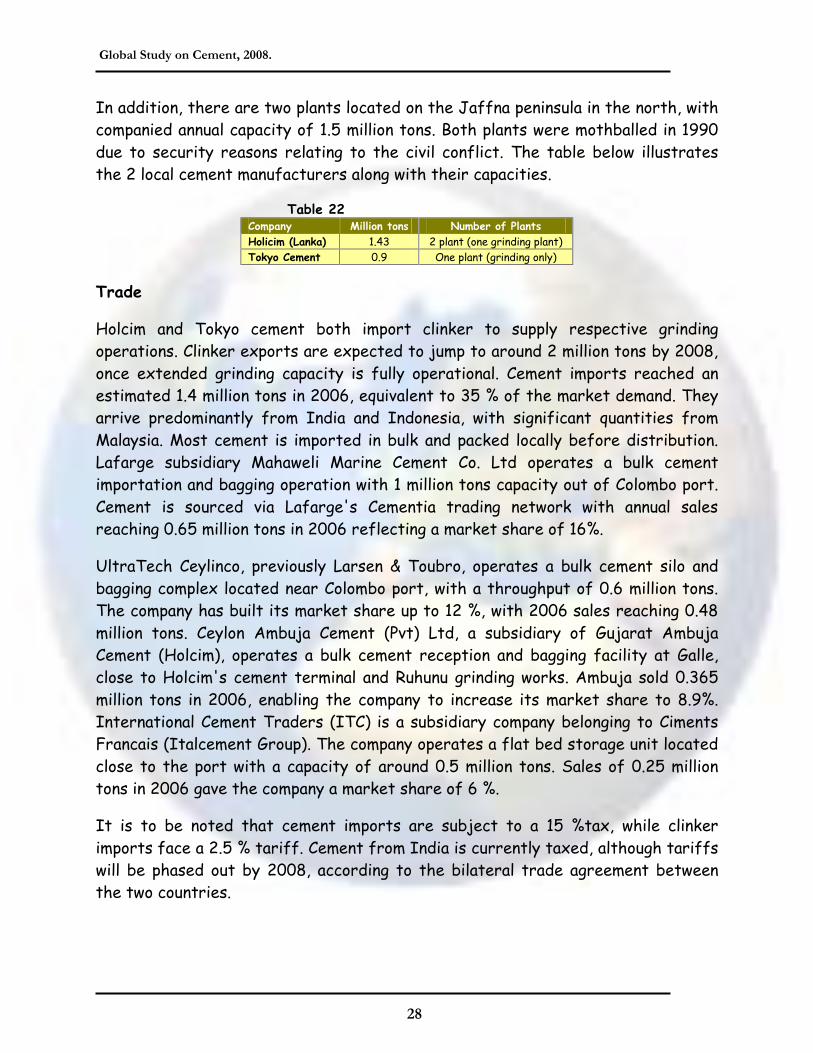
In addition, there are two plants located on the Jaffna peninsula in the north, with companied annual capacity of 1.5 million tons. Both plants were mothballed in 1990 due to security reasons relating to the civil conflict. The table below illustrates the 2 local cement manufacturers along with their capacities.
Table 22 Company Million tons Number of Plants Holicim (Lanka) 1.43 2 plant (one grinding plant) Tokyo Cement 0.9 One plant (grinding only)
Trade
Holcim and Tokyo cement both import clinker to supply respective grinding operations. Clinker exports are expected to jump to around 2 million tons by 2008, once extended grinding capacity is fully operational. Cement imports reached an estimated 1.4 million tons in 2006, equivalent to 35 % of the market demand. They arrive predominantly from India and Indonesia, with significant quantities from Malaysia. Most cement is imported in bulk and packed locally before distribution. Lafarge subsidiary Mahaweli Marine Cement Co. Ltd operates a bulk cement importation and bagging operation with 1 million tons capacity out of Colombo port. Cement is sourced via Lafarge's Cementia trading network with annual sales reaching 0.65 million tons in 2006 reflecting a market share of 16%.
UltraTech Ceylinco, previously Larsen & Toubro, operates a bulk cement silo and bagging complex located near Colombo port, with a throughput of 0.6 million tons. The company has built its market share up to 12 %, with 2006 sales reaching 0.48 million tons. Ceylon Ambuja Cement (Pvt) Ltd, a subsidiary of Gujarat Ambuja Cement (Holcim), operates a bulk cement reception and bagging facility at Galle, close to Holcim's cement terminal and Ruhunu grinding works. Ambuja sold 0.365 million tons in 2006, enabling the company to increase its market share to 8.9%. International Cement Traders (ITC) is a subsidiary company belonging to Ciments Francais (Italcement Group). The company operates a flat bed storage unit located close to the port with a capacity of around 0.5 million tons. Sales of 0.25 million tons in 2006 gave the company a market share of 6 %.
It is to be noted that cement imports are subject to a 15 %tax, while clinker imports face a 2.5 % tariff. Cement from India is currently taxed, although tariffs will be phased out by 2008, according to the bilateral trade agreement between the two countries.
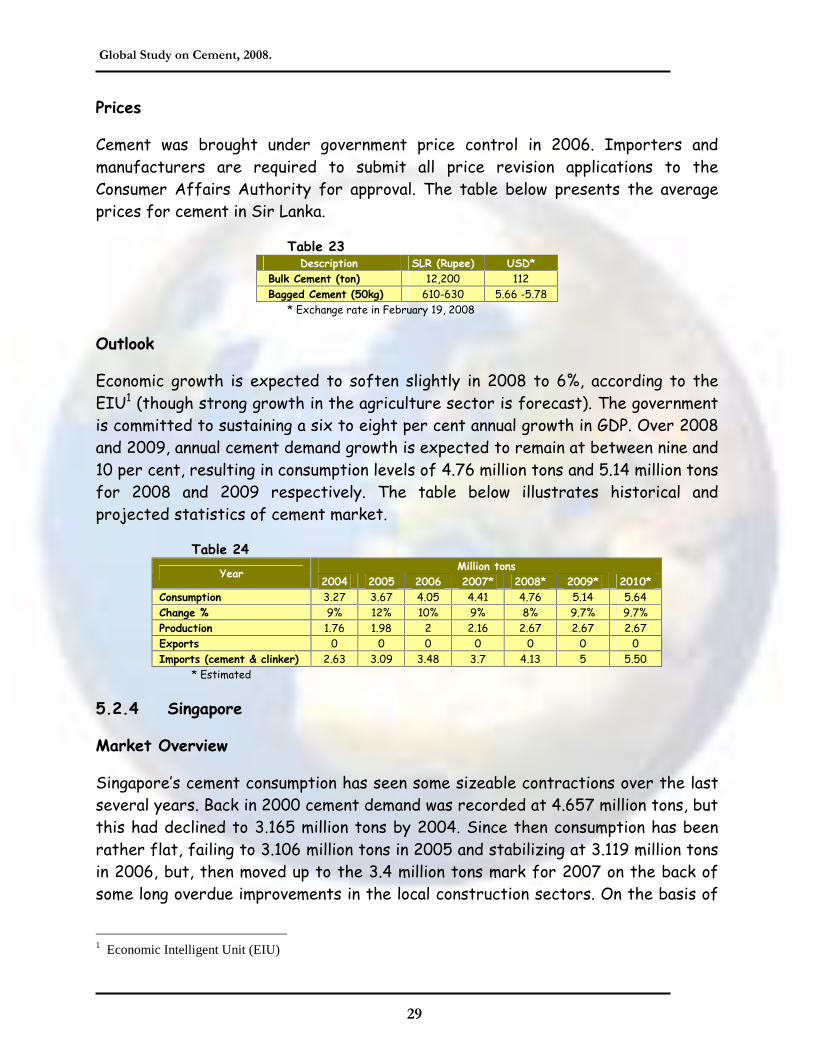
Global Study on Cement, 2008.
29
Prices
Cement was brought under government price control in 2006. Importers and manufacturers are required to submit all price revision applications to the Consumer Affairs Authority for approval. The table below presents the average prices for cement in Sir Lanka.
Table 23 Description SLR (Rupee) USD*
Bulk Cement (ton) 12,200 112 Bagged Cement (50kg) 610-630 5.66 -5.78
* Exchange rate in February 19, 2008
Outlook
Economic growth is expected to soften slightly in 2008 to 6%, according to the EIU1 (though strong growth in the agriculture sector is forecast). The government is committed to sustaining a six to eight per cent annual growth in GDP. Over 2008 and 2009, annual cement demand growth is expected to remain at between nine and 10 per cent, resulting in consumption levels of 4.76 million tons and 5.14 million tons for 2008 and 2009 respectively. The table below illustrates historical and projected statistics of cement market.
Table 24 Million tons
Year 2004 2005 2006 2007* 2008* 2009* 2010*
Consumption 3.27 3.67 4.05 4.41 4.76 5.14 5.64 Change % 9% 12% 10% 9% 8% 9.7% 9.7% Production 1.76 1.98 2 2.16 2.67 2.67 2.67 Exports 0 0 0 0 0 0 0 Imports (cement & clinker) 2.63 3.09 3.48 3.7 4.13 5 5.50
* Estimated
5.2.4 Singapore
Market Overview
Singapore�s cement consumption has seen some sizeable contractions over the last several years. Back in 2000 cement demand was recorded at 4.657 million tons, but this had declined to 3.165 million tons by 2004. Since then consumption has been rather flat, failing to 3.106 million tons in 2005 and stabilizing at 3.119 million tons in 2006, but, then moved up to the 3.4 million tons mark for 2007 on the back of some long overdue improvements in the local construction sectors. On the basis of
1 Economic Intelligent Unit (EIU)

Global Study on Cement, 2008.
30
current higher construction estimates, Singapore should be expected to consume about 3.8 million tons of cement in 2008 representing a 12 %gain over 2007 levels.
Local Production
After one of the highest regional concentrations of grinding facilities and capacity over the past quarter centuries, Singapore is left with one remaining grinding mill operated by C&W Industries which has a capacity to produce some 500,000 tpa but in reality manufactures about 150,000 tpa of cement from imported Chinese and Indonesian clinker. In effect, the local production base is comprised entirely of importers and distributors, most of which are linked to local ready-mix and concrete producers.
Most of this incoming cement is handled at the purpose-built Palau Damar Laut complex in Jurong port in what is rightly claimed as the world's largest common-user cement facility. Six local cement operators use this facility, namely, Singapore Cement, United Cement, Asia Cement, Lafarge (formerly Pan Malaysia), Engro Corporation (formerly Ssangyong) and Jurong Cement. Altogether, some 300,000 tons of storage capacity is maintained with unloading facilitated by three Siwertell unloading units, each rated at 800 tons per hour.
Holcim also operates the former 40,000 tons capacity National Cement facilities just outside Jurong port, fed by a 300 meter conveyor from separate receiving facilities within Jurong port, unloading by IBAU and Kovako unloaders. Sin Heng Chan has its own separate 25,000 tons storage and unloading complex within Jurong port and reportedly handles around 180,000 tons of imported cement, primarily for its own ready-mix and concrete operations.
Trade
Most cement (well over 90%) entering Singapore does so via the facilities located in Jurong port and much of this cement continues to originate from Japan, with over 50% of incoming shipments, followed by Malaysia at close to 20% and Taiwan at just under 20%. Some other shipments arrive in trucks which will transit the causeway between Malaysia and Singapore and originate from grinding facilities just across the border in Malaysia operated by Holcim and Lafarge. A smaller flat storage import and distribution terminals still operational close to the Sembawang shipyard on the north of the island which takes in around 100,000 ton of cement mainly sourced from Indonesia.

Global Study on Cement, 2008.
31
Some export trades are also recorded but these are extremely low, no more than 50,000tpa at best, and will include some containerized bagged and bulk shipments sold to traders in the Indian and Pacific oceans.
Prices
As most of consumed cement is imported, prices have been influenced by significant shipping freight costs which local cement companies have in part been able to pass on to consumers. Back in 2004, market prices for OPC grade cement were recorded at about SGD70 for bulk cement. By end-2005 prices had moved up to SGD87.4 for bulk and SGD96.6 for bagged sales in the local market. The table below presents the average prices for cement in Singapore.
Table 25 Description SGD USD*
Bulk Cement (ton) 83.5 59.14 Bagged Cement (50kg) 4.4 3.12
* Exchange rate in February 19, 2008
Outlook
The Economic Intelligence Unit forecasted a healthy growth of 4.5 per cent in 2008. The construction sector is set to grow further, with SGDl7 billion to SGDl9 billion worth of contracts expected for 2008. On this basis, Singapore�s cement demand is expected to move from 3.4 million tons in 2007 to 4.55 million tons in 2010. The table below illustrates historical and projected statistics of cement market.
Table 26 Million tons
Year 2004 2005 2006 2007* 2008* 2009* 2010*
Consumption 3.17 3.11 3.12 3.4 3.8 4.25 4.55 Change % -16.6% -1.9% 0.3% 9% 12% 7.0% 9.3% Production 0.2 0.15 0.15 0.15 0.15 0.15 0.15 Exports 0.04 0.05 0.04 0.04 0.04 0.04 0.04 Imports 3.17 3.11 3.12 3.4 3.8 4.25 4.55
*Estimated
5.2.5 Malaysia
Market Overview
The present market consumption has recovered to 625kg, per capita, from its 1998-99 slide into the abyss, when demand fell from 813kg in 1997 to 430kg two years later. Today, the picture looks much more positive, entering a growth period

Global Study on Cement, 2008.
32
as infrastructure and housing projects associated wit the Ninth Malaysian Plan begin to come on-stream and its population continues to grow at just under 2% annually.
Local Production
The production base is made up from a nominal 13 companies controlling seven integrated plants, five dedicated grinding units and one plant where only clinker is produced. The demands on clinker-making are such that the plants are running at near to full capacity of 17.8 million tons. It is to be noted that Lafarge is the biggest manufacture in Malaysia with 44 % of the market. It has just launched Avancrete that it sells at 20% premium but claims a 25% improvement in performance in return. Lafarge announced in mid-2006 that it has outline plan to increase its production (clinker) capacity from 8 million tons to 12 million tons.
The South KoreJn Group (YTL) is the lowest cost producer in Malaysia and has made good profits during the recent long four-year period when its competitors lost money. YTL has controlling interests in PahJng Cement (PCSB) and Perak Hanjoong Simen (PHS) that combined make up a 24% share of the market. YTL has recently raised its holding in PCSB to 64.8%. In 2005, YTL also acquired 21% in the ailing Jurong Cement td in Singapore.
Cement Industries of Malaysia Bhd (CIMA) and Tasek control 16% and 13% of the market, respectively. The table below illustrates the 13 local cement manufacturers along with their capacities.
Table 27 Company (Million tons) Number of Plants
Malayan Cement Industries 6.12 One plant Associated Pan Malaysia cement 6.06 One plant Perak-Hanjong Simen Sdn 3.4 One plant Tasek Corporation 2.3 One plant Cement Industries of Malaysia 2 One plant CMS Cement 1.75 One plant-grinding only Negeri Sembilan Cement 1.4 One plant Pahang Cement 1.3 One plant Holcim (Malaysia) 1.3 One plant-grinding only Slag Cement 1 One plant-grinding only Cement Industries (Sabah) 0.9 One plant-grinding only Southern Cement Industries 0.77 One plant-grinding only Sarawak Clinker 0.6 Clinker production only

Global Study on Cement, 2008.
33
Trade
Cement exports have been wherever they can be obtained. Roughly 0.2 million tons typically is trucked by road to Singapore, which imports around 4 million tons in total of clinker to grind locally from a number of countries. Lafarge's Kedah plant is particularly well-placed with its own terminals and seven vessels. Furthermore, Hokimss Tenggara grinding plant is also a large exporter of cement and is particularly positioned well to serve the Singapore area. With YTL�s investment in Singapore�s Jurong Cement, more Malaysian cement may be exported to Singapore.
Cement imports were historically nil because the accreditation of imported cement is almost impossible as local producers must approve of the accreditation. This restriction appears to have gone with imports at over 1 million tons and growing fast as local demand recovers. Recent cement imports came from Indonesia and Thailand while clinker was imported from Indonesia, Japan Philippines, Taiwan and Thailand.
Holcim is probably the major clinker importer to meet its need to feed its 1.3 million tons Tenggara Cement manufacturing grinding plant at Pasir Cudang, situated at the southern tip of the Malaysian peninsular and with a port that can accept vessels up to 60,000 dwt2. Much of this cement is likely to be exported into Singapore and to its surrounding area.
Prices
The Malaysian market had a price war in May 2005 when prices fell to US$ 33 per ton below the cost of production. Malaysian cement prices are the lowest in the region as a result of its oversupply situation. In addition, the government has placed a typical local maximum price of US$ 54 per ton to keep building costs down. However, this government controlled maximum price can be as high as US$ 75 per ton in remotest area. However the prices in 2007 for bulk and bagged cement are as follows:-
Table 28 Description Ringgit (MYR) USD* Bulk Cement (ton) 218 67.90 Bagged Cement (50kg) 10.9 3.4
* Exchange rate in February 19, 2008
2
Deadweight (often abbreviated as DWT for deadweight tons) is the displacement at any loaded condition minus the lightship weight. It
includes the crew, passengers, cargo, fuel, water, and stores. Like Displacement, it is often expressed in long tons or in metric tons.
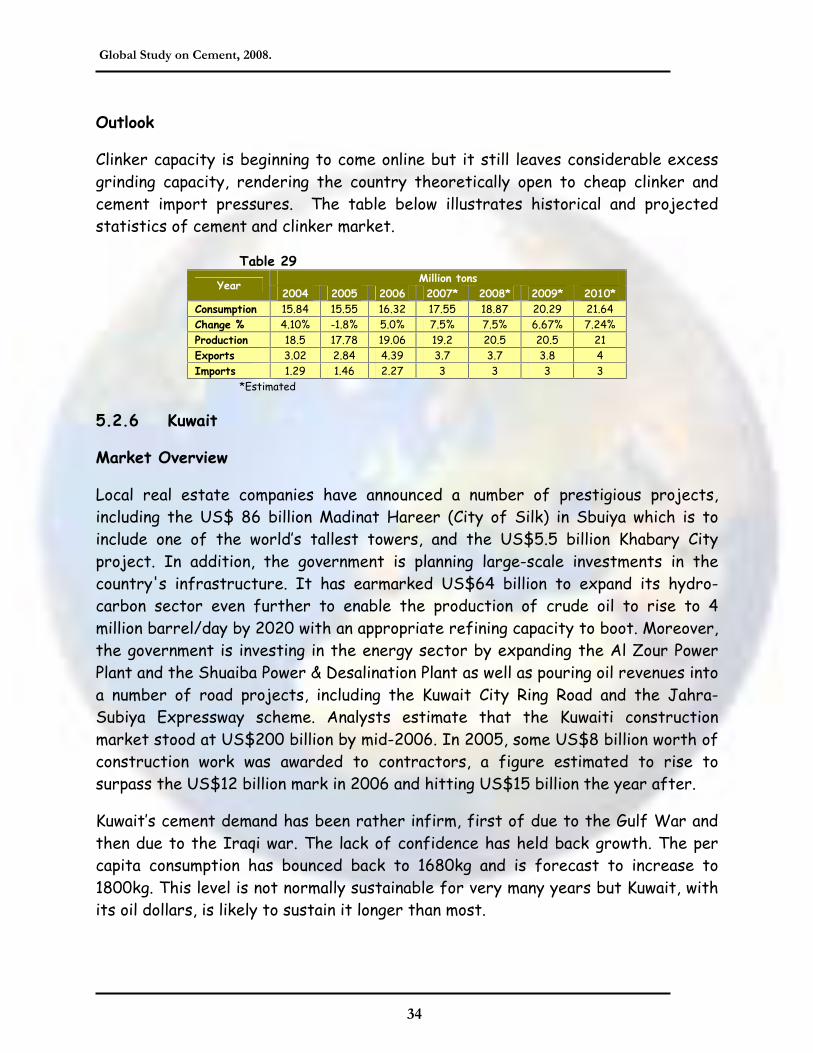
Global Study on Cement, 2008.
34
Outlook
Clinker capacity is beginning to come online but it still leaves considerable excess grinding capacity, rendering the country theoretically open to cheap clinker and cement import pressures. The table below illustrates historical and projected statistics of cement and clinker market.
Table 29 Million tons
Year 2004 2005 2006 2007* 2008* 2009* 2010*
Consumption 15.84 15.55 16.32 17.55 18.87 20.29 21.64 Change % 4.10% -1.8% 5.0% 7.5% 7.5% 6.67% 7.24% Production 18.5 17.78 19.06 19.2 20.5 20.5 21 Exports 3.02 2.84 4.39 3.7 3.7 3.8 4 Imports 1.29 1.46 2.27 3 3 3 3
*Estimated
5.2.6 Kuwait
Market Overview
Local real estate companies have announced a number of prestigious projects, including the US$ 86 billion Madinat Hareer (City of Silk) in Sbuiya which is to include one of the world�s tallest towers, and the US$5.5 billion Khabary City project. In addition, the government is planning large-scale investments in the country's infrastructure. It has earmarked US$64 billion to expand its hydro-carbon sector even further to enable the production of crude oil to rise to 4 million barrel/day by 2020 with an appropriate refining capacity to boot. Moreover, the government is investing in the energy sector by expanding the Al Zour Power Plant and the Shuaiba Power & Desalination Plant as well as pouring oil revenues into a number of road projects, including the Kuwait City Ring Road and the Jahra-Subiya Expressway scheme. Analysts estimate that the Kuwaiti construction market stood at US$200 billion by mid-2006. In 2005, some US$8 billion worth of construction work was awarded to contractors, a figure estimated to rise to surpass the US$12 billion mark in 2006 and hitting US$15 billion the year after.
Kuwait�s cement demand has been rather infirm, first of due to the Gulf War and then due to the Iraqi war. The lack of confidence has held back growth. The per capita consumption has bounced back to 1680kg and is forecast to increase to 1800kg. This level is not normally sustainable for very many years but Kuwait, with its oil dollars, is likely to sustain it longer than most.
Global Study on Cement, 2008.
35
Local Production
Kuwait has no indigenous cement raw materials and therefore, has to import all its requirements on long-term contracts from its neighbors; the UAE and Iran, and so is content to see substantial imports coming in to meet its demand. As a result, there are three companies operating in Kuwait; one integrated producer and two importers. The Kuwait Cement Company operates a new integrated 1.8 million tons clinker line that produces 2.24 million tons of cement. There was a report that the company had plans in place to expand its clinker making capacity by a further 0.7 million tons to 2.5 million tons, lifting site capacity to over 3 million tons. However, there are no further reports on this project. The two import terminals are oper-ated by Halil Cement and Kuwait Portland Cement, which controls about 30% of the market and presently sources imports primarily from Saudi Arabia.
In late 2006, the Kuwaiti-Jordan Holding-company (KJHC) - with a 60% Kuwait-based stake ,and 40% Jordanian stake - had announced, their intention to build a US$230 million, 1.8 million tons new cement plant. Capacity could be on-line by late 2008.
Trade
Kuwait has to import the majority of its raw materials from the UAE and Iran. In addition, there are increasing levels of imports coming in to feed the demand for cement as the government funds a series of major structure projects. One of the major exporters to Kuwait is Saudi Arabia due to the short distance between the two countries. For instance, Eastern province Cement Co. (EPCC) factory is considered the nearest factory to borders of Kuwait (around 200 km), which gives EPCC a location advantage over other cement producers in Kuwait and Iraq markets.
Furthermore, the importing facilities have subject of a major upgrading, each unit by up to 300 %, over the last few years so there is ample capacity to handle to forecast levels of imports. In general, with no indigenous raw materials, there is little pressure to reduce clinker imports other than those being traded by non Kuwaiti registered companies.
Prices
The government control prices of cement and support the prices for Kuwaiti nationals. The table below illustrates the prices for Kuwaiti national and others.

Global Study on Cement, 2008.
36
Table 30 Description Dinar (KWD) USD* Free market price (ton) 21.21 75 Supported price (ton) 13.73 50
* Exchange rate in February 19, 2008
Outlook
With oil prices and ,hence, oil revenues going through an all time high, the Kuwaiti government has carried out a major infrastructure investment programme. This means that the forecast cement demand is good with levels increasing at 14% and dropping back to 7 % annually, equivalent to an increase of 1 million tons in over three years. The table below illustrates historical and projected statistics of cement market.
Table 31 Million tons
Year 2004 2005 2006 2007* 2008* 2009* 2010*
Consumption 3.57 4.08 4.37 4.67 5 5.35 5.73 Change % - 14.3% 7.1% 6.9% 7.1% 7% 7% Production 2.24 2.24 2.24 2.24 2.24 4.04 4.04 Exports 0 0.02 0 0 0 0 0 Imports 1.4 1.84 2.13 2.43 2.8 1.31 1.69
*Estimated
5.2.7 Iraq
Market Overview
Iraq's economy is dominated by the oil sector which it has traditionally provided about 95 per cent of foreign exchange earnings. The war events in 2003 resulted in the shutdown of much of the central economic administrative structure, but with the loss of only a comparatively small amount of capital plant. The rebuilding of oil, electricity, and other facilities started in 2004 with foreign support. A joint UN and World Bank report released at the end of 2003 estimated that Iraq�s key reconstruction needs would cost US$ 55 billion. The actual cement consumption to support the rebuilding of Iraq is difficult to determine. Cement is in short supply in spite of 50% being imported. Local demand is therefore outstripping supply. The domestic supply is still only operating at 25% of its nominal capacity.
Local Production
Iraq's 14 cement factories were built between 1964 -1978 with a combined capacity of 14 million tons and have old and obsolete technology by today standards. These factories have been operating since the war at no higher than

Global Study on Cement, 2008.
37
25% of capacity and have shown no indication of increasing above this production level. The government has decided that most of those are not worth rehabilitating and have issued licenses for the building of 20 new cement plants at accost of US$ 4 billion in late 2005. If they all go ahead, these plants will add 25 million tons of new capacity. By adding the present capacity of 3.5 million tons to the proposed new capacity, the total local combined capacity would be 28.5 million tons. In fact, there are two private factories, which will start commercial operations i.e. Al-Summaoah and Fasolia with an estimated capacity of each is 6,000 tons daily (1.98 million tons annually). Moreover, Orascom, the Egyptian company, (recently merged with Lafarge) completed a US$70 million rehabilitation of the 2.3 million tons of Tasluja plant, Suleimaniyah in Kurdistan, Northern Iraq. Also Orascom is committed to a new 3 million tons green-field site at Bazian. When those come on line, Orascom anticipate producing 5 million tons of cement in Iraq in 2008.
In addition, Inekon Group of the Czech Republic has taken an order related to the expansion of a Northern Iraq cement plant from 1 million to 2 million tons. The owner is said to be S J Company, a private Iraqi investor company. Iran also agreed in September 2006 to a US$1 billion investment plan in Iraq that includes a new cement plant.
Trade
With Iraq's indigenous cement plants incapable of meting her needs; about half the consumption is presently being met by imports, roughly 3.5 million tons. These imports are chiefly originating from Turkey, Saudi Arabia, Pakistan, Ukraine, Iran, and Kuwait. As matter of fact, most of cement coming from Kuwait is a re-export of Saudi cement as there is an agreement between Iraq and Kuwait, which give exclusive rights for Kuwaiti trucks to enter Iraq through Safwan (point of entry). This encourages Kuwaiti carriers to transport directly from Saudi Cement factories to Iraq. It is to be noted that there is only one entry point; Judaidat Arar, between KSA and Iraq, which is not yet opened. In the case of Kuwait, there are two entry points between KSA and Kuwait i.e. Al Rugai and Al Khafji.
According to cement traders in Iraq, there is an auction plaza in Safwan, where most imported cement sold to wholesalers and retailers. In an average, there are around 400 trucks conveying around 10,000 tons entering daily through Safwan point. The imported cement comes from different countries i.e. KSA, Pakistan, India and Ukrainian. Moreover, there are around 120 trucks conveying around 3,000 tons coming via Iran-Iraq point of entry. The Iranian cement is mostly used by bricks manufacturers as it is bagged in polypropylene woven bags.

Global Study on Cement, 2008.
38
Overall, imports into the country are likely to be significant until such a time as the new and refurbished plants come on-stream. Given its current under produc-tion, it is unsurprising that there are no known exports out of Iraq.
Prices
Local prices are largely determined by cement availability and importing costs. Post-war prices into Baghdad were initially around US$ 60-65 per ton. According to MCD survey, the current landed prices in Iraq for a number of countries is presented in the table below.
Table 32 Source USD/Ton SR/Ton
Lucky Cement (Pakistan) 116 435 Abu AL-Assad (Pakistan) 115 431 Ukrainian Cement 90 338 Saudi Cement 115 431 Eastern Cement 128 480 Riyadh Cement 90 338 Yamamah Cement 100 375 Qassim Cement 130 488 City Cement 80 300 Average Price 107 402
Outlook
The government predicts that demand could reach 30 million tons and has issued licenses to meet 25 million tons of this demand with new capacity. At this rate, the government is anticipating a per capita consumption of around 1000kg. However, in the short term, as the internal, quasi civil war breaks out, the short-term position is difficult to predict. If civil war does breaks out, demand in the near-term could plummet but leave behind an even greater need for cement.
The two Orascom (recently merged with Lafarge) projects in Kurdistan are being realized and should bring 5 million tons of modern, updated cement capacity on-line by the end of 2007. With another 18 projects being granted licenses, we can expect some of these to go ahead and begin to contribute to the overall indigenous production from 2008 onwards.
Once the new capacity comes online, prices should begin to fall back towards the general typical Middle Eastern price of US$60/Ton - US$70/Ton. This would give demand a considerable boost and hence the forecast of demand increasing to 9 million tons, or a per capita of 312kg is reasonably conservative, yet it is still way
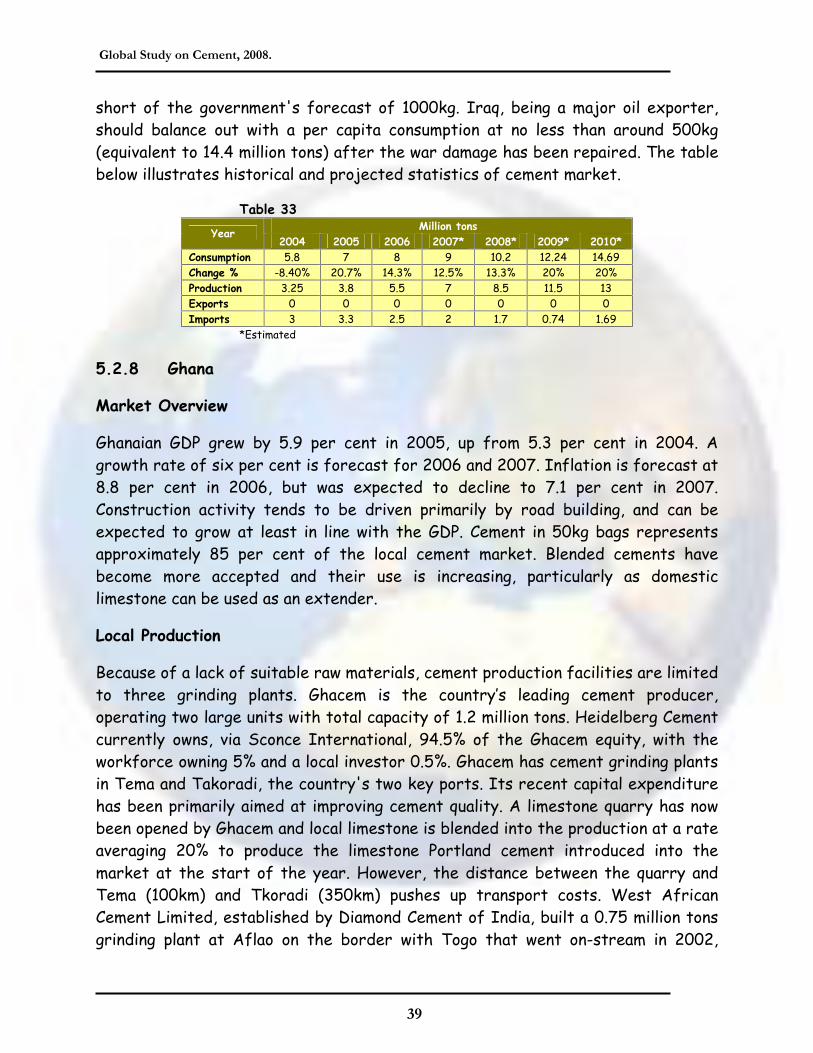
Global Study on Cement, 2008.
39
short of the government's forecast of 1000kg. Iraq, being a major oil exporter, should balance out with a per capita consumption at no less than around 500kg (equivalent to 14.4 million tons) after the war damage has been repaired. The table below illustrates historical and projected statistics of cement market.
Table 33 Million tons
Year 2004 2005 2006 2007* 2008* 2009* 2010*
Consumption 5.8 7 8 9 10.2 12.24 14.69 Change % -8.40% 20.7% 14.3% 12.5% 13.3% 20% 20% Production 3.25 3.8 5.5 7 8.5 11.5 13 Exports 0 0 0 0 0 0 0 Imports 3 3.3 2.5 2 1.7 0.74 1.69
*Estimated
5.2.8 Ghana
Market Overview
Ghanaian GDP grew by 5.9 per cent in 2005, up from 5.3 per cent in 2004. A growth rate of six per cent is forecast for 2006 and 2007. Inflation is forecast at 8.8 per cent in 2006, but was expected to decline to 7.1 per cent in 2007. Construction activity tends to be driven primarily by road building, and can be expected to grow at least in line with the GDP. Cement in 50kg bags represents approximately 85 per cent of the local cement market. Blended cements have become more accepted and their use is increasing, particularly as domestic limestone can be used as an extender.
Local Production
Because of a lack of suitable raw materials, cement production facilities are limited to three grinding plants. Ghacem is the country�s leading cement producer, operating two large units with total capacity of 1.2 million tons. Heidelberg Cement currently owns, via Sconce International, 94.5% of the Ghacem equity, with the workforce owning 5% and a local investor 0.5%. Ghacem has cement grinding plants in Tema and Takoradi, the country's two key ports. Its recent capital expenditure has been primarily aimed at improving cement quality. A limestone quarry has now been opened by Ghacem and local limestone is blended into the production at a rate averaging 20% to produce the limestone Portland cement introduced into the market at the start of the year. However, the distance between the quarry and Tema (100km) and Tkoradi (350km) pushes up transport costs. West African Cement Limited, established by Diamond Cement of India, built a 0.75 million tons grinding plant at Aflao on the border with Togo that went on-stream in 2002,

Global Study on Cement, 2008.
40
operating with clinker from a Togo sister company. The company is believed to have achieved a market share approaching 40 per cent.
Trade
Although there are neglible amounts of exports, trade is mostly imports. In the case of West African Cement all clinker comes from Togo, while Ghacme tends to source from within the Heidelberg Cement Group, but has also bought clinker from Togo. Until recently, cement imports were mainly of specialty products, such as white cement and import volumes were fairly modest at around 50,000 tpa. More recently, an independent importer has appeared on the scene in the form of Green View Cement, which has a Tema cement terminal, came on-stream in 2006.
Prices
Table 34 Description GHC (Cedi) USD*
Bulk Cement (ton) 1,050,000 107.62 Bagged Cement (50kg) 53,475 - 55,775 5.5 -5.7
* Exchange rate in February 19, 2008
Outlook
Increasing roads and housing expenditure should underpin construction growth for some years to come with a broadly stable annual cement demand growth of around six per cent. An additional supplier and the trend towards more blended cement may just push up the growth rate slightly. The table below illustrates historical and projected statistics of cement market.
Table 35 Million tons
Year 2004 2005 2006 2007* 2008* 2009* 2010*
Consumption 2.45 2.6 2.7 2.9 3.05 3.23 3.43 Change % 4.3% 6.1% 3.9% 7.4% 5.2% 6% 6% Production 2.35 2.5 2.55 2.65 2.7 2.7 2.7 Exports 0 0 0 0 0 0 0 Imports 2.1 2.2 2.25 2.4 2.4 2.68 2.84
*Estimated
5.2.9 Syria
Market Overview
In 2006, the Syrian Internal Trade organization for Metals and building Materials, the state-owned institution, in charge of the distribution of cement and other building materials produced by public sector of 4.85 million tons with total sales revenue reaching US$ 555.4 million. This figure, which is composed of 4.617 million

Global Study on Cement, 2008.
41
tons of locally produced cement and imported 0.228 million tons to cover shortages, theoretically represents total cement consumption in Syria.
However, this figure does not tack into account the large volume of cement smuggled into the country each year. Some analyst argue that real cement demand in 2006 reached at least 7 million tons, and was perhaps as high as 8 million tons due to unreported imports. One estimate puts total demand at 6.74 million tons in 2006, driven by increased public sector spending. The Syrian General Company public transport, for example, spent US$ 139.53 millions on road projects.
Local Production
Syria�s production base is made up of eight plants operated by seven individual state-owned companies that are overseen by the General Organization for Cement and Building Materials (GOCBM) which markets its products through state distributor; OMRAN.
The installed clinker capacity of all the plants is 4.83 million tons, and in 2006 the GOCBM reported a net profit of US$ 10.4 million on output of 4.15 million tons clinker and 4.51 million tons cement. In order to meet increase domestic demand, the GOCBM had set out an ambitious expansion plan to double national capacity to 10 million tons in co-operation with private, foreign companies. The table below illustrates the 7 local cement manufacturers along with their capacities.
Table 36 Company (Million tons) Number of Plants
Tartous Cement Co. 1.64 Two plant Al-Shahba Cement Co. 0.89 One plant Adra Cement Co. 0.77 One plant Arabian Cement Co. 0.77 One plant Syrian Cement Co. 0.4 One plant Military Housing Establishment 0.29 One plant Al-Rastan Cement 0.12 One plant
Trade
Cement imported into Syria have surged in recent years as demand has outstripped domestic supply. Syria imported estimated 2.26 million tons cement in 2006, equivalent of 34 % of total demand. Official trade is controlled by Omran, which reported imports of 0.233 million tons in 2006 from Lebanon, down from 0.442 million tons imported in 2005 from Jordan, Lebanon and Turkey. Omran, however, intends to boost imports to 1 million tons in 2008. There is a significant level of unreported imports, notably from Lebanon where there is a surplus of cement and

Global Study on Cement, 2008.
42
prices are lower at US$65-75/ton. A US$30/ton customs fee is imposed on ce-ment imported from Lebanon by the Syrian government.
Prices
The Syrian Ministry of Economy and Trade raised the retail price for bulk, normal grade Portland cement to US$ 124.5 per ton in January 2006, while prices were reported in 2007 at US$ 130 per ton. However, prices on the Syrian black market reached US$ 191.6 per ton in 2007.
Outlook
Demand is expected to continue growing, by 5.8%which should bring consumption over the 7 million tons. Ongoing projects include the 60km remaining of the Damascus ring road, US$ 100 million on sewerage and water treatment plants in the rural Damascus area by 2010, potentially the US$ 3 billion reconstruction of the Hajaz railway is being considered. The table below illustrates historical and projected statistics of cement market.
Table 37 Million tons
Year 2004 2005 2006 2007* 2008* 2009* 2010*
Consumption 6 6.36 6.74 7.21 7.63 8.1 8.6 Change % 9% 6% 6% 7% 5.8% 6% 6% Production 4.76 4.7 4.48 4.9 5.4 5.4 5.4 Exports 0 0 0 0 0 0 0 Imports 1.24 1.66 2.26 2.31 2.23 2.68 3.2
*Estimated
5.2.10 Turkey
Market Overview
Domestic cement consumption, which rose by 9.1% in 2004, improved by a further 14.4% in 2005 to 35.1 million tons, beating the previous record of 34.1 million tons established in 1998. Bulk cement deliveries accounted for 56.5% compared with 51.4% in 2004 and bagged cement for 43.5%. However, the regional variations are considerable, with bulk deliveries accounting for 67.6% in the Aegean area and 65.3% in the Marmara region, which includes Istanbul, but only 27.4 % in southeast Anatolia.
Cement deliveries to the ready mixed concrete industry rose by 25.3 % last year to 14.0 million tons. Ready-mixed concrete deliveries actually increased by 27.5 % to 26.8 million tons and there were 267 batching plants at the end of 2005. A

Global Study on Cement, 2008.
43
notable increase is expected in ready-mixed concrete deliveries in 2006 as the product rapidly gains wider acceptance. Cement supplies to pre-cast concrete producers rose sharply in 2005, with a jump of 25.3 % to 14 million tons.
Local Production
In 2005, clinker production rose by 11% to 36.4 million tons and cement production increased by 10.3% to 42.8 million tons. The use of slag cement is very modest at around two per cent. Currently, there are 59 integrated cement plants, which are owned by 17 companies working in Turkish cement market. The table below illustrates the major 17 local cement companies along with their capacities.
Table 38 Company (Million tons) Number of Plants
Oyak 10.05 5 Akcansa (Heidelberg Cement) 6.5 3 Sabanci 5.7 4 Cimentas 5 4 Yibitas and Lafarge 4.2 8 Set Cimento (Italcementi) 4.1 5 Nuh Cimento 4.1 1 Vicat 3.7 2 Limak 3.3 3 Baticim Bati Anadolu Cimento 3 2 Goltas Goller Bolgesi Cimento 2.92 1 Bursa 2.9 3 Denizli 2.32 2 Turkeler 1.74 2 Qimko Cement (Sanko) 1.37 2 Askale 1.12 2 Orascom 0.55 1
Trade
Taken together, Turkish cement and clinker exports have been fairly steady at around 10.5 million tons over the past four years, but it declined by around 3 million tons in 2006 in response to the strong growth in domestic demand. Current estimates suggest exports to decline by around 2.2 million tons in respect of cement and by 0.8 million tons for clinker, down by some 40%. As additional manufacturing capacity becomes available, both clinker and cement exports could increase by around 0.5 million tons in 2007. In 2005, cement exports declined by 6.1% to 7.74 million tons, but clinker exports rose by 13% to 2.79 million tons.
Iraq is by far the most important market for Turkish cement exports, amounted to 2.76 million tons in 2005 or 35.7 % of the total. In terms of clinker exports, Spain

Global Study on Cement, 2008.
44
(1.09 million tons) and Italy (1.01 million tons) are the leading markets followed by Ivory Coast with 0.21 million tons.
Until 2006, there have been no cement imports to speak of, and clinker imports have been relatively modest. Bulgaria was the main source of imports in 2005, accounting for 159,920 tons, followed by Egypt with 62,305 tons and Greece with 25,070 tons. This is now changing, with the growth in demand and changing trading patterns. Cement imports reached 0.5 million tons in 2006 and clinker imports are estimated at 1.5 million tons, with similar volumes envisaged for 2007.
Prices
Turkish cement prices have recovered considerably over the past two years but remain low by international standards. That is unlikely to change dramatically in the short term, though while the global cement market has tightened, the Turkish cement market remains fragmented and capacity keeps going up. However, presently demand is strong and prices are now some 15% higher in local currency than they were at the beginning of the year. The value of the Turkish currency, though, has fallen and in Euro terms and prices are only � 2-3/ton better than a year ago, averaging around �51/ton.
Outlook
Turkish cement demand is set to show further strong growth in 2008. These positive longer-term prospects have encouraged buyers to pay high prices for the plants being auctioned off following the demise of Rumeli, that have added a further two companies to the list of Turkish cement producers. Orascom (recently merged with Lafarge), one of the new entrants, certainly has ambitions to become a stronger force in the Turkish cement market, either through adding capacity or through acquisitions and possibly both. The market remains fragmented and con-tains a number of groups whose main interests lie outside the cement, or even construction, industry. Over time, these can be expected to sell out, but there is nothing to indicate that this will happen in the next couple of years. The table below illustrates historical and projected statistics of cement market.
Table 39 Million tons
Year 2004 2005 2006 2007* 2008* 2009* 2010*
Consumption 33.67 38.5 39.5 42.3 44.84 47.53 50.38 Change % 9.10% 14% 3% 7% 6% 6% 6% Production 38.8 42.8 45 48.3 50.5 50.5 50.5 Exports 10.67 10.52 7.5 8.5 8.9 4.97 2.12 Imports 0 0.25 2 2 2 2 2
*Estimated

Global Study on Cement, 2008.
45
6 TRANSPORTATION
Cement is a costly product to transport relative to its price. The cost of transporting cement from one country to another can exceed the value of its production. For years, cement was considered a local product, unfeasible to export due to the high cost of land transportation. However, with the development of marine shipping and the savings it introduced to the global transportation industry, regional markets for cement started to evolve, with cement being transported between neighboring countries at an economically feasible cost. In the following sub-sections land and ocean transportation cost will be discussed.
6.2 Land Transportation Cost
Cement could be transported via trucks in a form of bulk or bag. Bagged cement is transported by flat bed trailers, while bulk cement is transported by Bulker, which is a specialized truck designed to carry bulk shipment such as Cement, seeds etc. Currently, Saudi cement companies are using land transportation for export to neighborhood countries i.e. GCC states, Yemen, Iraq, Syria, Jordan, Lebanon. Actually, all of exported cement is, in form of bulk cement, except Iraq which imports mostly bagged cement. However, it is to be noted that exporting to some countries such as Syria seems to be very expensive for some companies, especially those located in the middle and east of KSA. For instance, exporting 25 tons of cement could cost SR 6,500 while transportation the same in a truck of 25 tons to Syria would cost around SR 7,000. The table below presents the average cost per ton of bulk cement from Riyadh, Dammam and Jeddah to different destinations.
Table 40
6,2 Ocean Transportation Cost
Cement is a heavy and low-cost product that is expensive to ship, particularly by land, with a need for on-time delivery to construction sites. Thus, cement manufactures operations tend to be located near centers of demand.
The norm of exporting/importing Cement is through shipping companies either in container or bulk. Humidity is an important factor that needs to be taken into
(SR/Ton) From / To
UAE Qatar Kuwait Oman Bahrain Yemen Lebanon Iraq Jordan Syria RUH 140 80 80 180 72 180 244 140 208 232
JED 260 192 184 300 172 140 224 236 184 212
DAM 120 52 52 160 48 224 290 112 235 280
Global Study on Cement, 2008.
46
consideration while exporting Cement. However, now day�s ships are equipped to stand firm humidity with high protection that would stand long distance voyage. Thus, Cement is usually shipped in bulks to the targeted markets whereas few orders are shipped in a form of Jumbo Bags, which equals 1.5 tons/each. Others are shipped as selling bags which equal about 2 tons.
Bulk carriers (bulkers) is designed to carry loose goods which constitute about 70% of all the shipments carried by sea; speed - 14 - 16 knots, carrying capacity - varies (there are ships with 30,000 tons and others with 150,000 tons. Bulkers are usually one-decked, with an engine room in the stern and a deckhouse above it. The holds are constructed with longitudinal and cross walls (called "bulkheads") and the cargo is easily stowed according to them. Bulk-carriers do not have cargo-handling gear aboard and have their goods loaded/unloaded by means of port devices. That's why all the space before the deckhouse is vacant to make load operations easier. There is an exception for some bulkers that work on a self-unloading principle.
Heavy bulk-carriers usually transport ore, coal and coke, building materials, such as Cement and gravel. Light bulkers carry grain, salt and sugar. Unfortunately, goods such as ores and grain cannot simply be dumped in the hold of the ship without taking any precautions. Any careless maintenance of this cargo may result in damage of the ship.
Each shipment should raise the requirement documents for the destination country. In general, these documents are as following:
Certificate of Origin: that proves the origin of goods. Bill of Lading: a document supplied to the exporter by the shipping company that is transporting the goods to their foreign destination, listing, item by item, the goods being shipped. It serves three basic purpose:
To acknowledge receipt by the carrier of the exporter's goods. To indicate the carrier's contractual obligation to transport the
goods to their destination in exchange for payment. To record transfer of title (or ownership) from the seller to
the buyer when payment for the goods takes place.
Commercial Invoice: It shows the value of shipments for estimation custom purposes. Some companies as a good service issue this document instead of exporter.
Global Study on Cement, 2008.
47
Authorization letter: to authorize a customs clearness office to deal all custom clearness procedures.
Backing list: it contains the number of the containers, the number of leaden seal and the contents of each container.
Insurance Policy: is an Insurance certificate for the shipment. It is optional document.
The Saudi Ports authority imposes charges for handling imports and exports. The handling consists of discharging and loading from ships, then, inspections and storing of shipments. After joining WTO, Ports authority stop giving Saudi exports any exception in terms of ports charges. As known, one of the main principles of WTO is to equal between export and imports in terms of treatments and charges. However, there are few exemptions for Saudi exports such as storage period exemption for exports and container charges. With regard to containers charges, the Ports authority collect all charges of handling and storage of container from importer and that allows exporter to export its shipments in the same containers without charges. The charges of Saudi ports that collected from exporter for example, bagged Cement is SR 22/ton and for bulk Cement is SR 4/ton.
Regarding the fright rate, it is usually determined based on several parameters as follows:
Cargo Quantity and type: The quantities of cement intended to be shipped and are they bulk or bagged cement.
Load Port: The port of loading for instance Islamic Jeddah Port or King Abdul-Aziz Port (Dammam).
Load Rate: It is the quantity of cement could be loaded to the ship per one day e.g. 45000 ton/day. The loading rate per day is a crucial element in calculating the fright rate; hence, having an equipped port terminal is very important for cement companies to reduce this rate.
Discharge Port: The destination port of the shipment e.g. Port Sudan or Port of Dina (Sudan).
Discharge Rate: It is the rate per day of discharging cement from a ship e.g. 4500 ton/day.
According to the above, it seems difficult to calculate the actual fright rate without determining the above parameters. However, the following table presents the average fright rates from KSA to different destinations at 4,500 ton/day loading and discharging rate.

Global Study on Cement, 2008.
48
Table 41 Destination USD/Ton GCC states 22-18 India 50-40 China 60-70 South Asia 60-70
Eastern Europe 50-60
Western Europe 80-90 North America 100-130 South America 120-140 West Africa 90-100 East Africa 50-60 South Africa 70-80 North Africa 40-50 Australia & New Zealand 100-120
7 INSURANCE
The insurance fees would be determined based on several elements including value of shipment, type of packaging (containerized or non-containerized), nature of shipment and the destination country. Moreover, the nature of goods play major role in determining the kind of insurance. For instance, no insurance company would give comprehensive insurance if the goods are fragile or perishable.
The cargo insurance is arranged by either the buyer or the seller and normally follows one of the internationally accepted standards conditions, as well as the agreed terms of sale. There are many important advantages to arranging cargo insurance locally in the Kingdom, including the following: -
The need to deal with unknown overseas insurers and/or laws and regulations are avoided.
The policy may be written in SR or in any other currency and any possible problems with overseas exchange controls are eliminated.
The insurance arrangements including the required coverage, the sum insured and the rate of premium can be negotiated & conducted locally.
Promptness in adjusting and settlement of claims locally. Thus, avoiding the possible harassment and/or complications and delays, which could result from insuring abroad?
If there are many shipments to or from various countries, then, one open policy can cover all such shipments.
Retaining the insurance premiums within the Kingdom. Affording better protection to the rights to the insured under the Saudi laws and jurisdictions.

Global Study on Cement, 2008.
49
The sum insured in a cargo policy is based on an �agreed value� representing usually the cost of the goods and the freight charges plus a margin of 10 � 20% to cover other incidental and additional expenses. According to the National Company for Cooperative Insurance (NICE), the norm of calculating an insurance cost would be multiplying the price of (Y) good by 10% which will equal an (X) amount. This (X) amount, if in US $ should be transferred to (SR) by multiplying it by (3.75). Then, the transferred (X) amount to be multiplied by (0.30 � 0.35) for containers and (0.75) for bulk, which will result in the cost of insurance.
8 CONCLUSION
This study has covered several, yet, important issues in fulfilling its main objective which relates to identifying the potential export markets in the world. The demand, production and international trade flows of Cement have also been highlighted. The world market, in terms of local production, imports, exports and consumption, has been discussed. The current Cement prices along with the transportation & insurance costs have also been presented. Finally, 10 of potential export markets along with a full description of consumption, trade, local production, prices and outlook of each market were discussed.
The Kingdom�s Cement industry is operating at near full capacity, with the domestic demand comprising 88.4% of the total supplies and exports representing around 11.6% (3.6 million tons). Bahrain and Iraq are considered the biggest export markets as they imports around 42% and 34% of total Saudi export respectively. The total local installed capacity is expected to reach more than 49 million tons in 2009, an increase of 49% in comparison with 2007.
Overall, although there are potential export markets for Saudi cement, exporting cement seems to be difficult due to number of export barriers. Firstly, the Saudi ports do not have cement export terminals, which are very crucial to increase the loading rate of cement and, consequently, reducing the shipping costs. Secondly, Saudi cement companies lack of experiences and relationships with international cement trading companies, which are aware of cement imports orders and manage/arrange shipping and delivering throughout the world. Unfortunately, such companies are fully dominated by international cement company�s cartel such as Lafarge and Italicement. Furthermore, increasing the fright rates of shipping costs, which is attributed to the increasing of oil prices, war risk insurance and depreciation of USD value. Finally, most of Saudi cement companies do not develop their vision of international expansion strategies such as installing grinding plants in neighborhood markets.
Global Study on Cement, 2008.
50
9 RECOMMENDATION
Based on the current market situation of the local market and challenges existing in export markets, exporting cement seems to be difficult due to the lack of enough export capability within the existing Saudi cement companies. Hence, local cement companies should consider establishing a cement trading company, which would act as their export arm in overseas markets. The best legal form for such company is to be owned by all Saudi cement companies. The main objectives of this company could be summarized as follows:-
To develop export port terminals in the major coasts of KSA. Such development should comprise the following:-
o Installing cement and clinker warehousing tanks. o Installing pipes, hoses and conveyor belts in order to load a ship of
cement and clinker. o Expanding wharfs of terminal in order to increase the loading
capacity. o Deepening the wharfs to be capable to receive huge ships. As a matter
of facts, piers would have 16 depth meters to be ready to receive huge cement ships with total weight of 70,000 dwt.
o Installing Cranes and Winches. To explore export opportunities and identify promising export markets. To establish worldwide networks of contacts with the cement trading companies as so to receive export orders.
To manage the surpluses of cement in KSA and to prevent future strangulations in the local market.
To establish contacts with shipping companies and arrange shipping process with the lowest cost.
Furthermore, exporters should be encouraged to contact local export insurance and credit institutions in order to utilize the available facilities for export credit & insurance programs towards risky countries. �The Saudi Export Program� from the Saudi Fund for Development will help local manufactures in increasing their market share and expanding their export activities to more countries with the lowest possible risk. This is a good omen as Saudi Arabia has joined WTO.