exports in india. export in india what do you mean by exports ? why exports ?
TRANSCRIPT
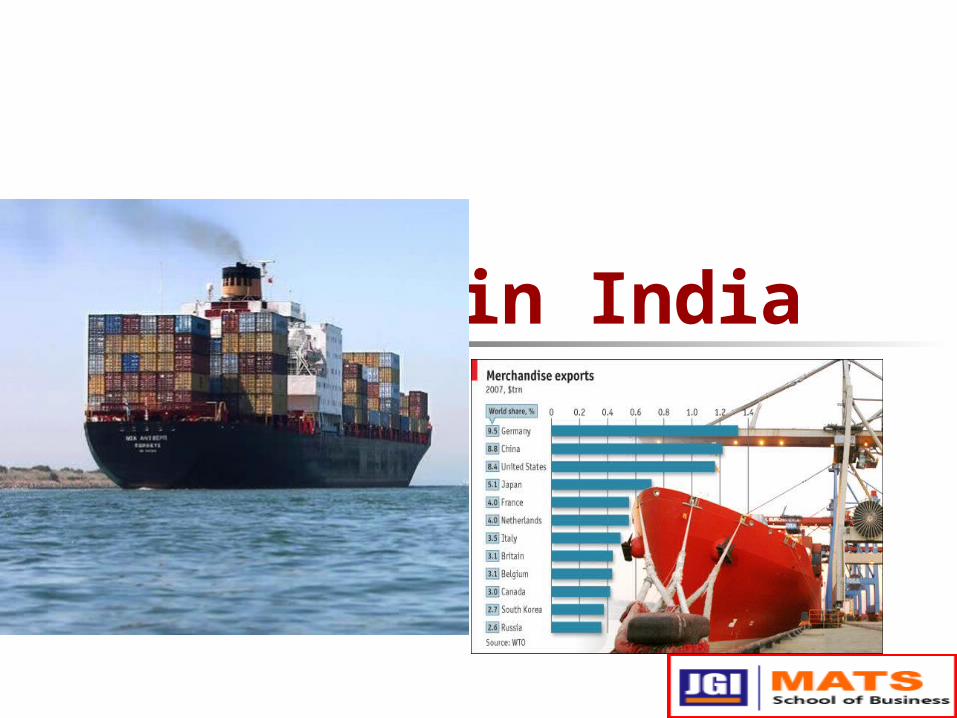
Exports in India
Export in India
What do you mean by Exports ? Why Exports ?
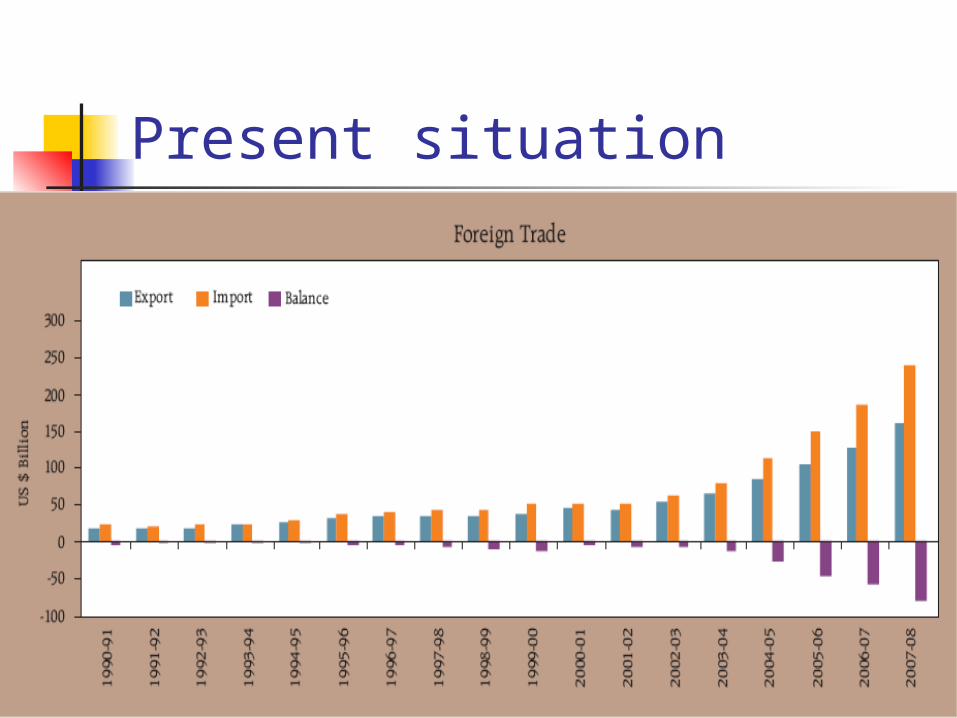
Present situation
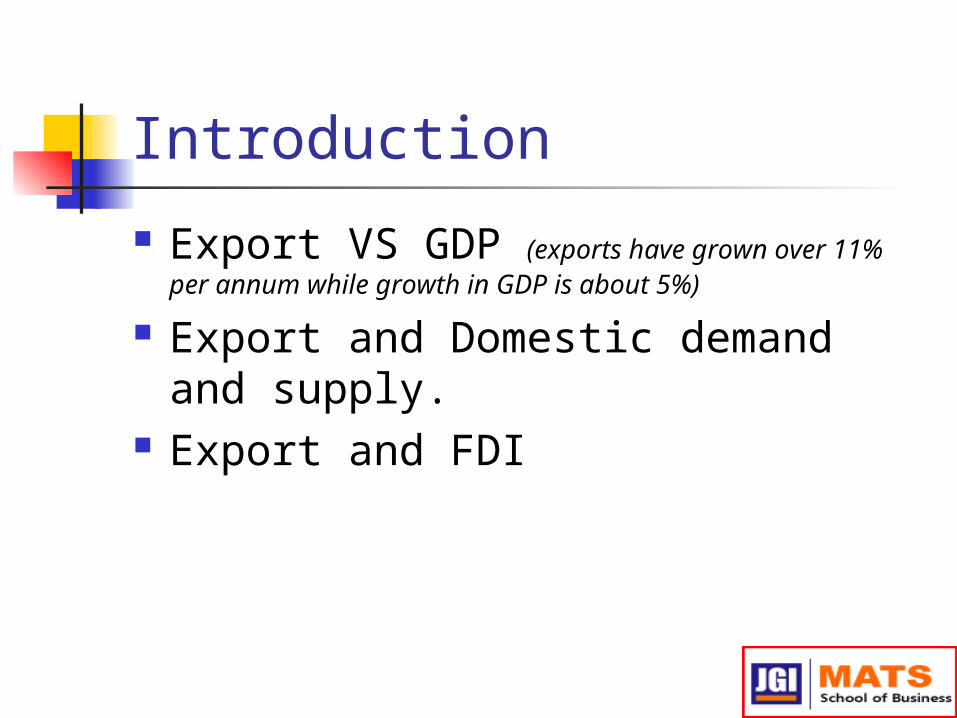
Introduction
Export VS GDP (exports have grown over 11% per annum while growth in GDP is about 5%)
Export and Domestic demand and supply.
Export and FDI
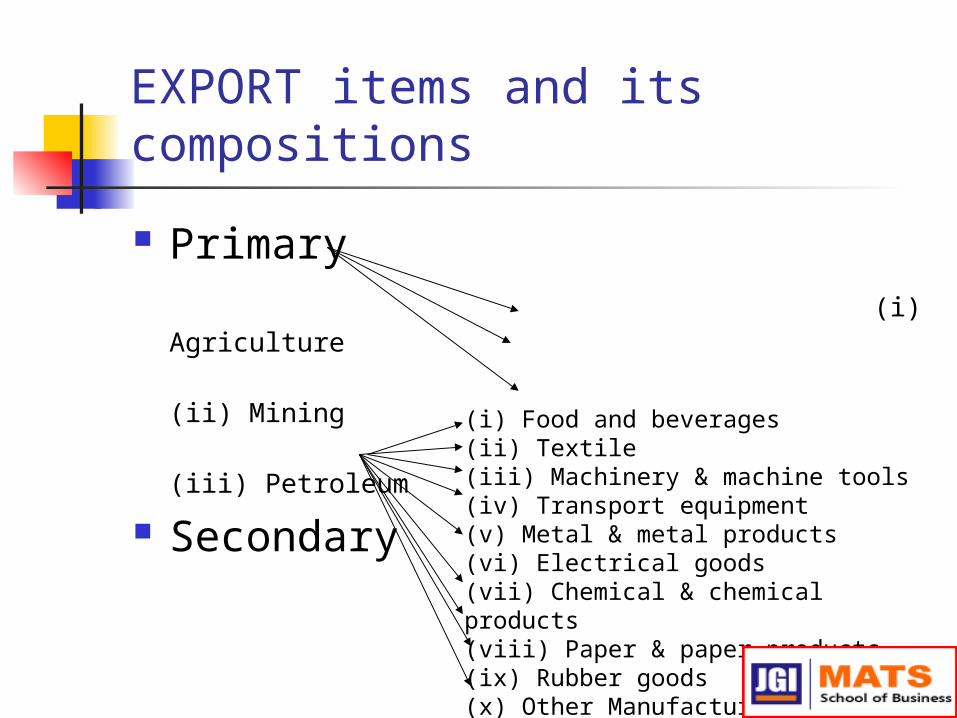
EXPORT items and its compositions
Primary (i) Agriculture
(ii) Mining (iii) Petroleum
Secondary (i) Food and beverages (ii) Textile (iii) Machinery & machine tools (iv) Transport equipment (v) Metal & metal products (vi) Electrical goods (vii) Chemical & chemical products(viii) Paper & paper products (ix) Rubber goods (x) Other Manufacturing
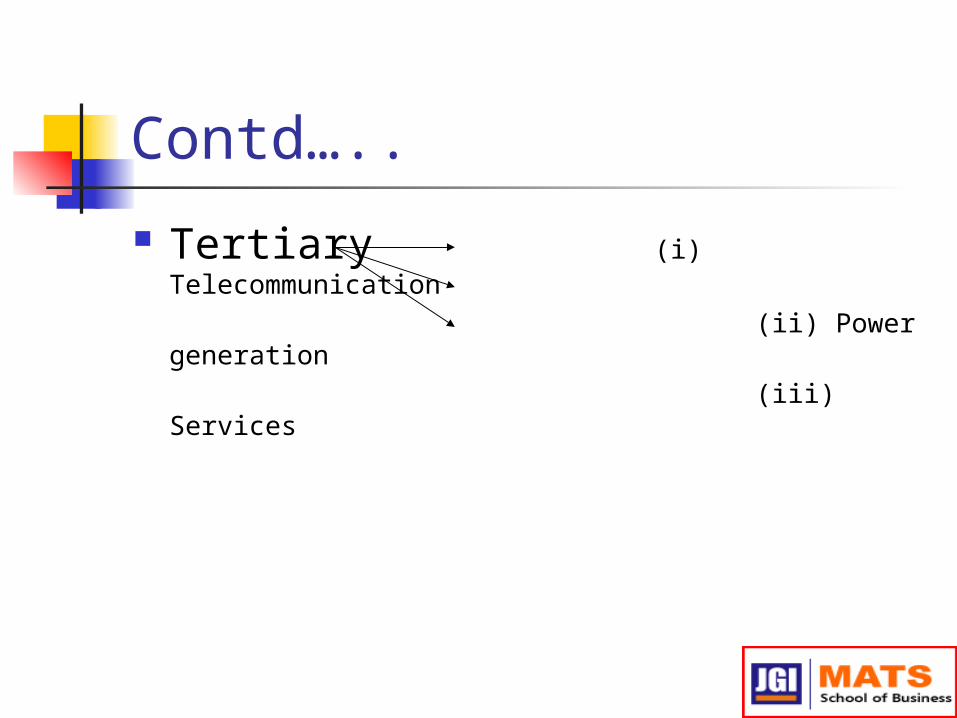
Contd…..
Tertiary (i) Telecommunication
(ii) Power generation (iii) Services
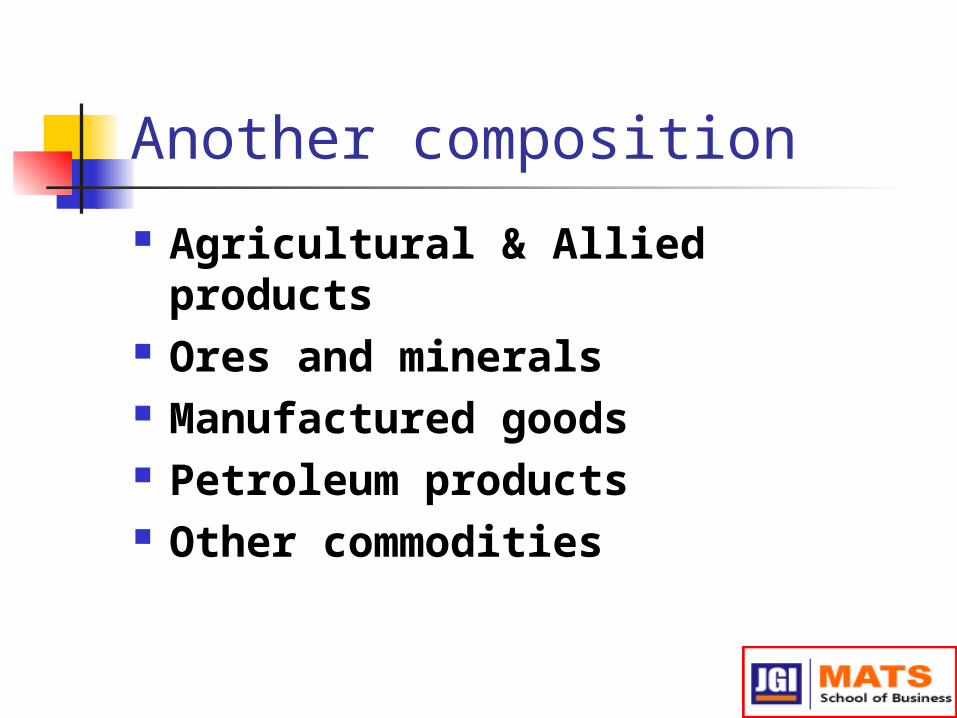
Another composition
Agricultural & Allied products Ores and minerals Manufactured goods Petroleum products Other commodities
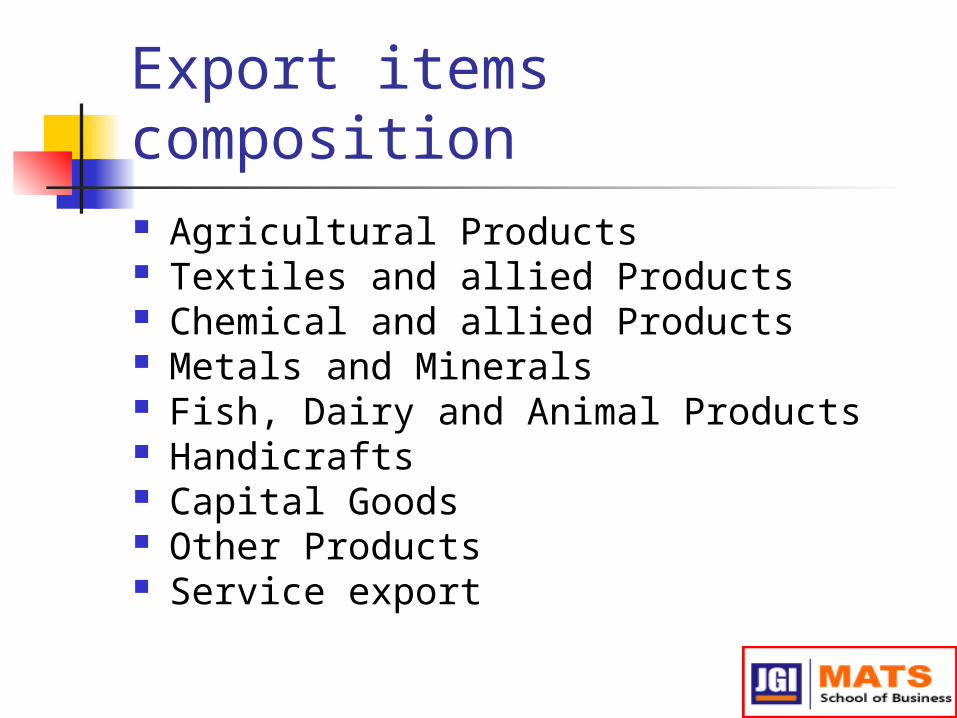
Export items composition Agricultural Products Textiles and allied Products Chemical and allied Products Metals and Minerals Fish, Dairy and Animal Products Handicrafts Capital Goods Other Products Service export
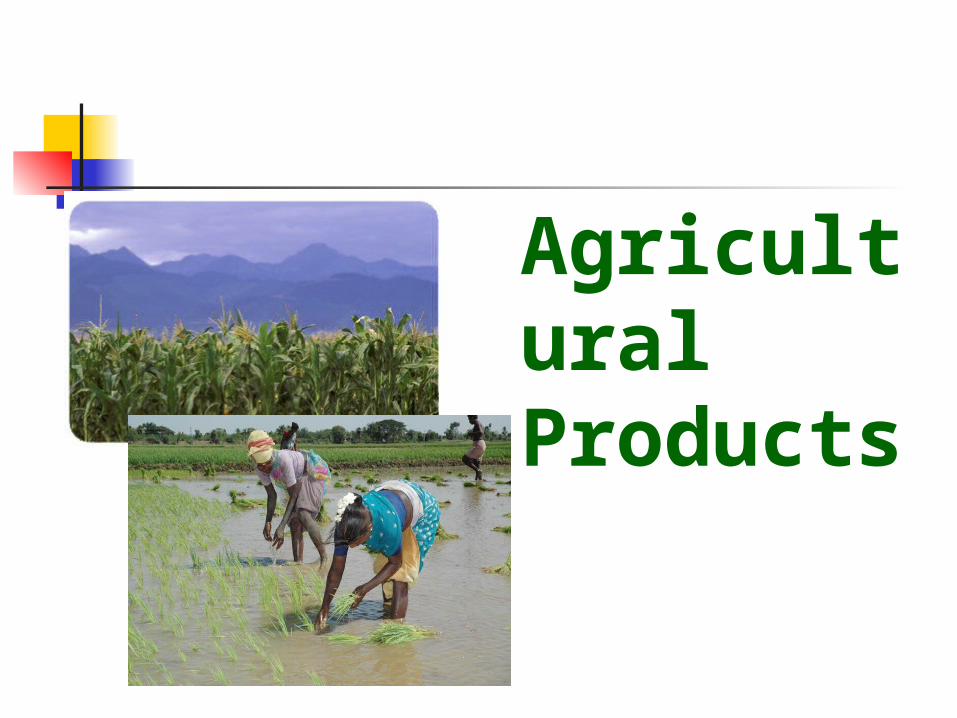
Agricultural Products
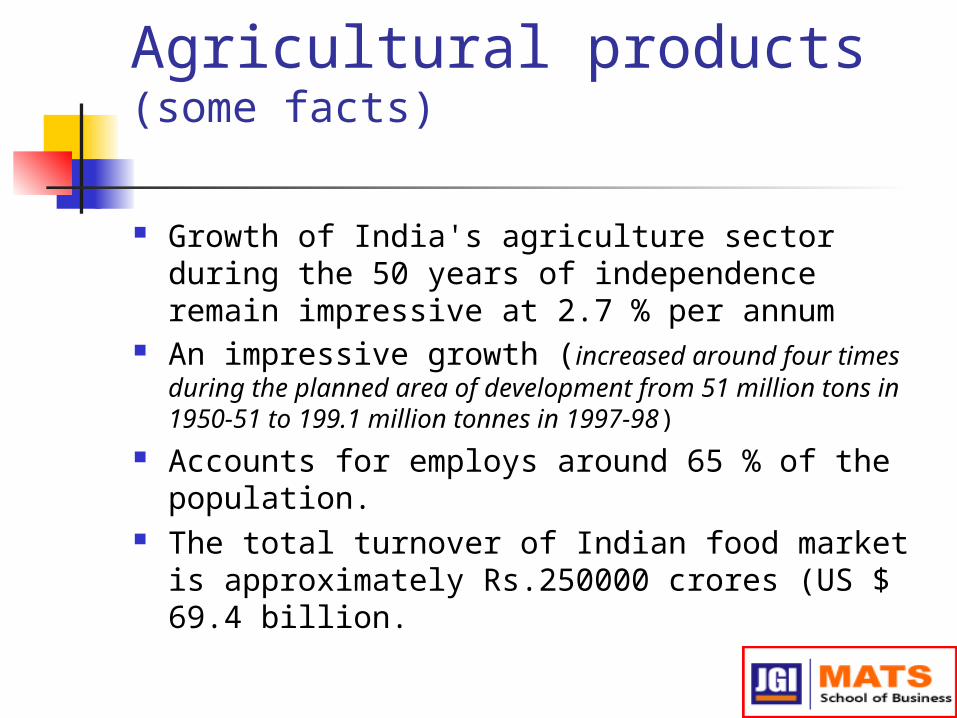
Agricultural products (some facts)
Growth of India's agriculture sector during the 50 years of independence remain impressive at 2.7 % per annum
An impressive growth (increased around four times during the planned area of development from 51 million tons in 1950-51 to 199.1 million tonnes in 1997-98)
Accounts for employs around 65 % of the population.
The total turnover of Indian food market is approximately Rs.250000 crores (US $ 69.4 billion.
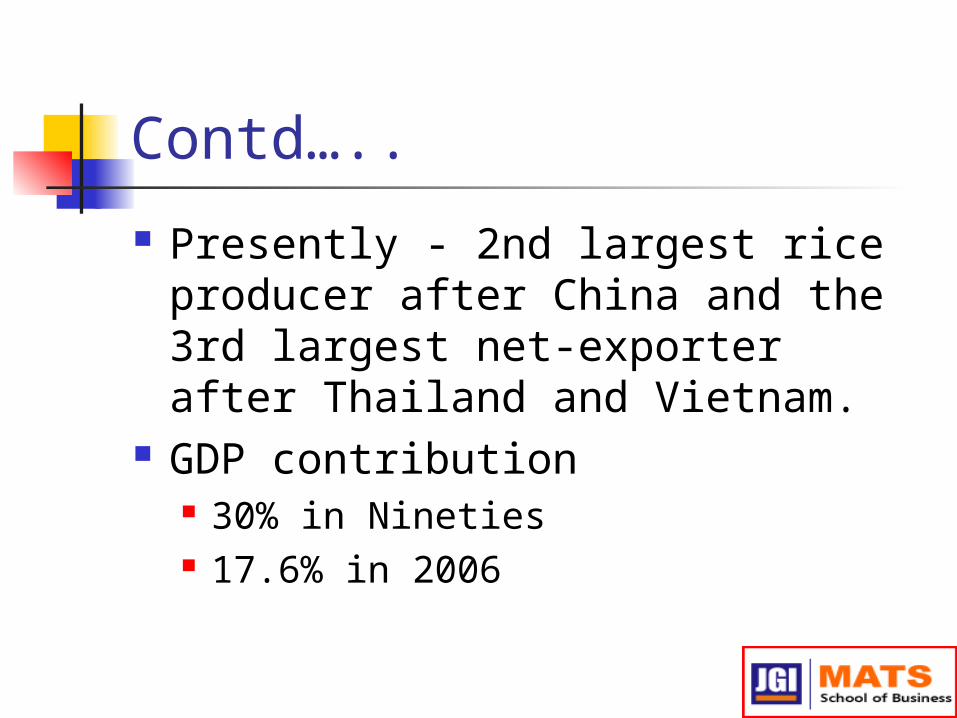
Contd…..
Presently - 2nd largest rice producer after China and the 3rd largest net-exporter after Thailand and Vietnam.
GDP contribution 30% in Nineties 17.6% in 2006
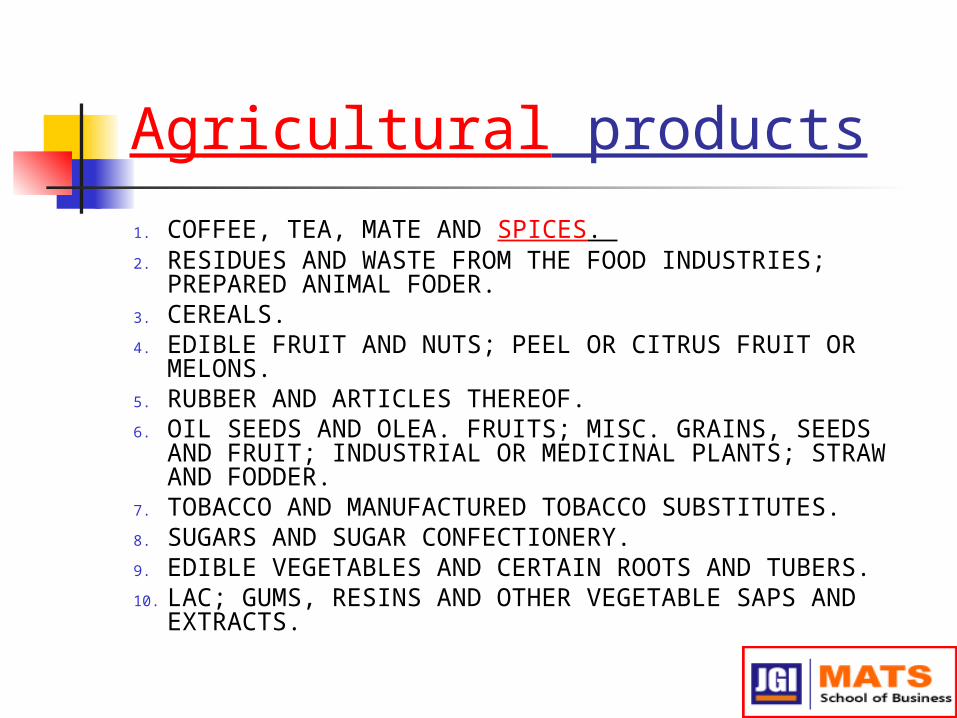
Agricultural products1. COFFEE, TEA, MATE AND SPICES. 2. RESIDUES AND WASTE FROM THE FOOD INDUSTRIES;
PREPARED ANIMAL FODER. 3. CEREALS. 4. EDIBLE FRUIT AND NUTS; PEEL OR CITRUS FRUIT OR
MELONS. 5. RUBBER AND ARTICLES THEREOF. 6. OIL SEEDS AND OLEA. FRUITS; MISC. GRAINS, SEEDS AND
FRUIT; INDUSTRIAL OR MEDICINAL PLANTS; STRAW AND FODDER.
7. TOBACCO AND MANUFACTURED TOBACCO SUBSTITUTES. 8. SUGARS AND SUGAR CONFECTIONERY. 9. EDIBLE VEGETABLES AND CERTAIN ROOTS AND TUBERS. 10. LAC; GUMS, RESINS AND OTHER VEGETABLE SAPS AND
EXTRACTS.
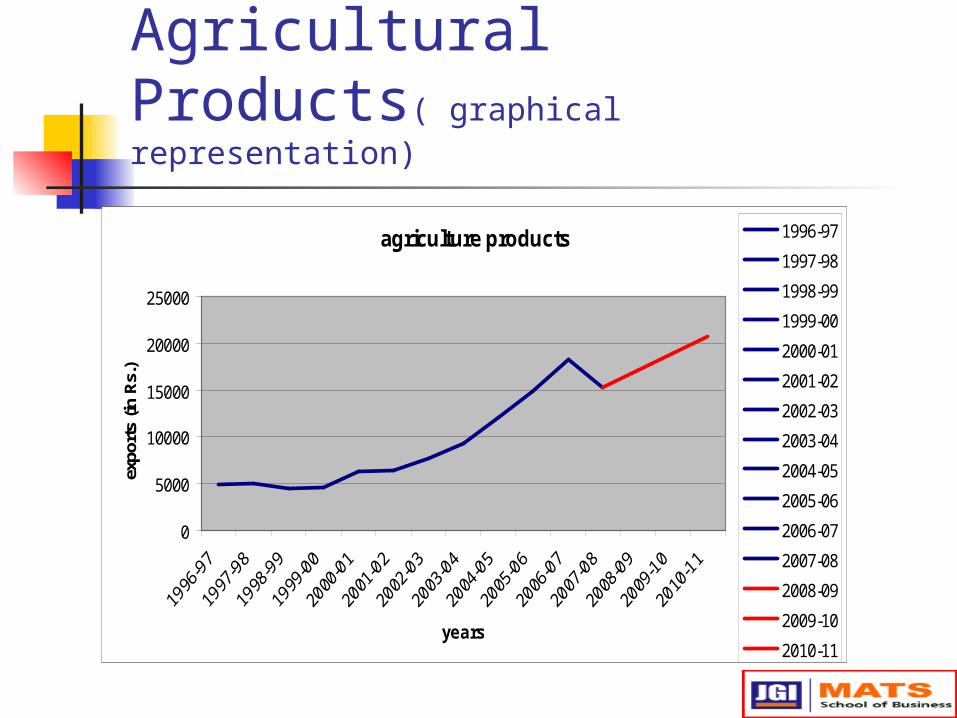
Agricultural Products( graphical representation)
agriculture products
0
5000
10000
15000
20000
25000
years
expo
rts
(in R
s.)
1996-97
1997-98
1998-99
1999-00
2000-01
2001-02
2002-03
2003-04
2004-05
2005-06
2006-07
2007-08
2008-09
2009-10
2010-11
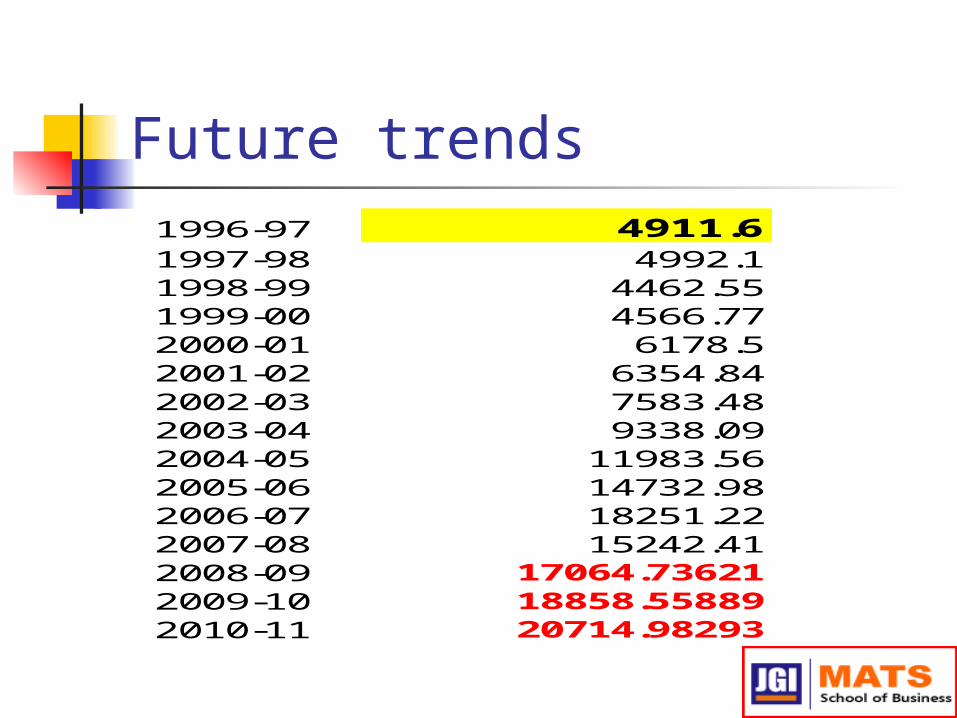
Future trends 1996-97 4911.61997-98 4992.11998-99 4462.551999-00 4566.772000-01 6178.52001-02 6354.842002-03 7583.482003-04 9338.092004-05 11983.562005-06 14732.982006-07 18251.222007-08 15242.412008-09 17064.736212009-10 18858.558892010-11 20714.98293
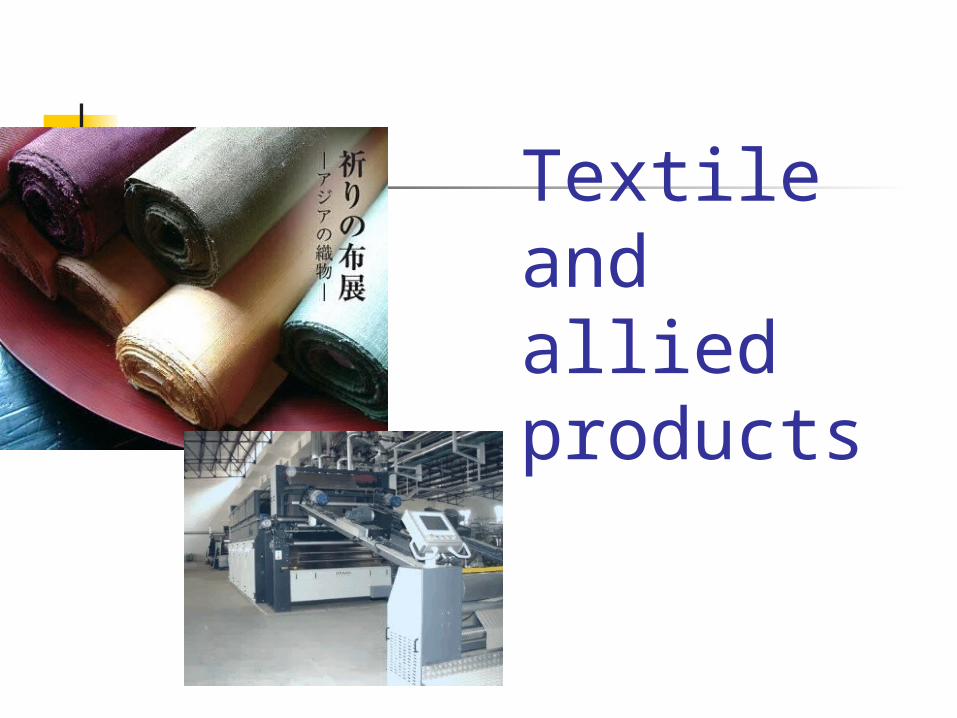
Textile and allied products
Textile and allied Products Exports increased from US$ 14 million (2004-05)
to US$ 17 million (2005-06) – 21.77 % increase. With continuing growth, the total exports has
increased to – US$ 19.62 billion (2006-07). Current share in world export of textiles – 3.5 - 4
%. Current share in world clothing export – 3 %. Major export market – Europe (22% share in
textiles & 43% share in apparel). Single largest buyer – US ( 10% share in textiles
and 32.65 share in apparel).
Contd….. Other major export markets include - UAE,
Saudi Arabia, Canada, Bangladesh, China, Turkey and Japan.
Largest export segment – Readymade Garments (45% share in textile exports and 8.25% share in India's total exports).
Exports of readymade garments - expected to US$ 14.5 billion with a cumulative annual growth rate of 18-20%.
Indian Leather Exports
India is the largest livestock holding country - 21% large animals and 11% small animals
A source for 10% world leather requirement About 2.50 million workforce (30% women) Annual production value is over U$ 4 billion Annual export value is over U$ 2 billion Export growth CAGR 8.20% (2000-04) Promising technology inflow and FDI High priority to occupational safety and work
environment Compliance to environmental standards Immense potential for future growth (domestic as well
as export)
Metals and Minerals
Metals and Minerals 89 minerals
4 fuel minerals 11 metallic 52 non-metallic 22 minor minerals
India is the world's largest producer of mica blocks and mica splittings.
India ranks third rank among the chromite producers of the world
India ranks 3rd in production of coal & lignite and barytes .
Contd….. India ranks 4th in iron ore India ranks 6th in bauxite and
manganese ore 10 in aluminium and 11 th in crude steel
in the World
Metals and Minerals IRON AND STEEL ARTICLES OF IRON OR STEEL ORES, SLAG AND ASH. MINERAL FUELS, MINERAL OILS AND
PRODUCTS OF THEIR DISTILLATION; BITUMINOUS SUBSTANCES; MINERAL WAXES.
ALUMINIUM AND ARTICLES THEREOF. SALT; SULPHUR; EARTHS AND STONE;
PLASTERING MATERIALS, LIME AND CEMENT. ARTICLES OF STONE, PLASTER, CEMENT,
ASBESTOS, MICA OR SIMILAR MATERIALS. COPPER AND ARTICLES THEREOF.
Chemicals and allied products
Chemicals and allied Products
7 % of the Indian GDP Worth of Indian chemicals industry
during 2005-06 was US$30.59 Growing at an average rate of 12.5% The industry presently produces around
70,000 commercial products, which range from toiletries and cosmetics, to plastics and pesticides.
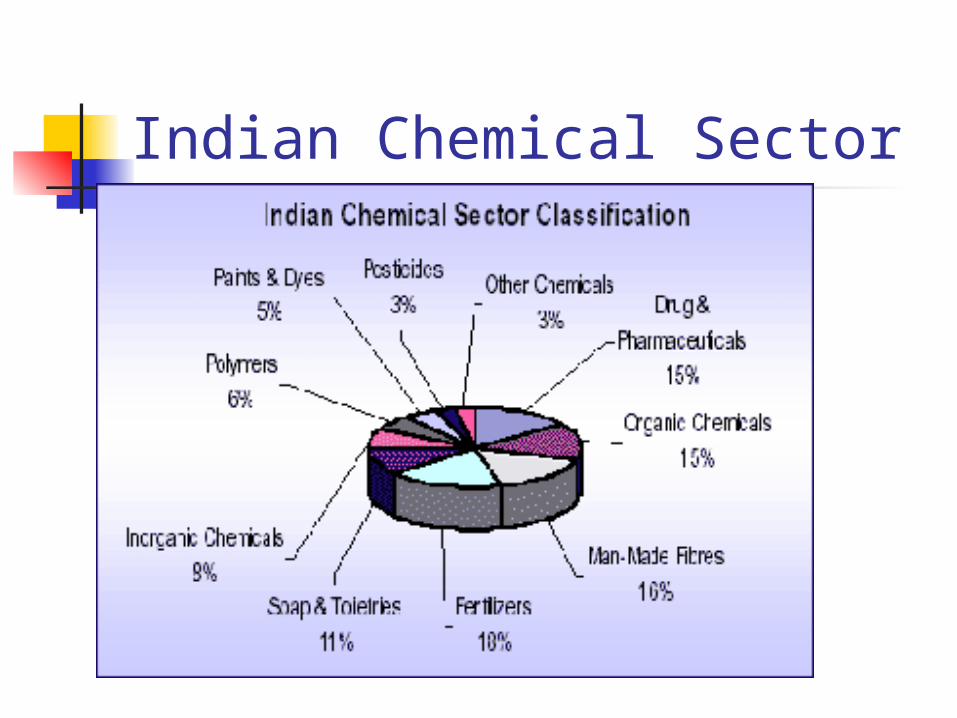
Indian Chemical Sector
Chemical Products Composition ORGANIC CHEMICALS PHARMACEUTICAL PRODUCTS TANNING OR DYEING EXTRACTS; TANNINS AND THEIR
DERI. DYES, PIGMENTS AND OTHER COLOURING MATTER; PAINTS AND VER; PUTTY AND OTHER MASTICS; INKS.
MISCELLANEOUS CHEMICAL PRODUCTS. SOAP, ORGANIC SURFACE-ACTIVE AGENTS, WASHING
PREPARATIONS, LUBRICATING PREPARATIONS, ARTIFICIAL WAXES, PREPARED WAXES, POLISHING OR SCOURING PREP.
FERTILISERS. INORGANIC CHEMICALS; ORGANIC OR INORGANIC
COMPOUNDS OF PRECIOUS METALS, OF RARE-EARTH METALS, OR RADI. ELEM. OR OF ISOTOPES.
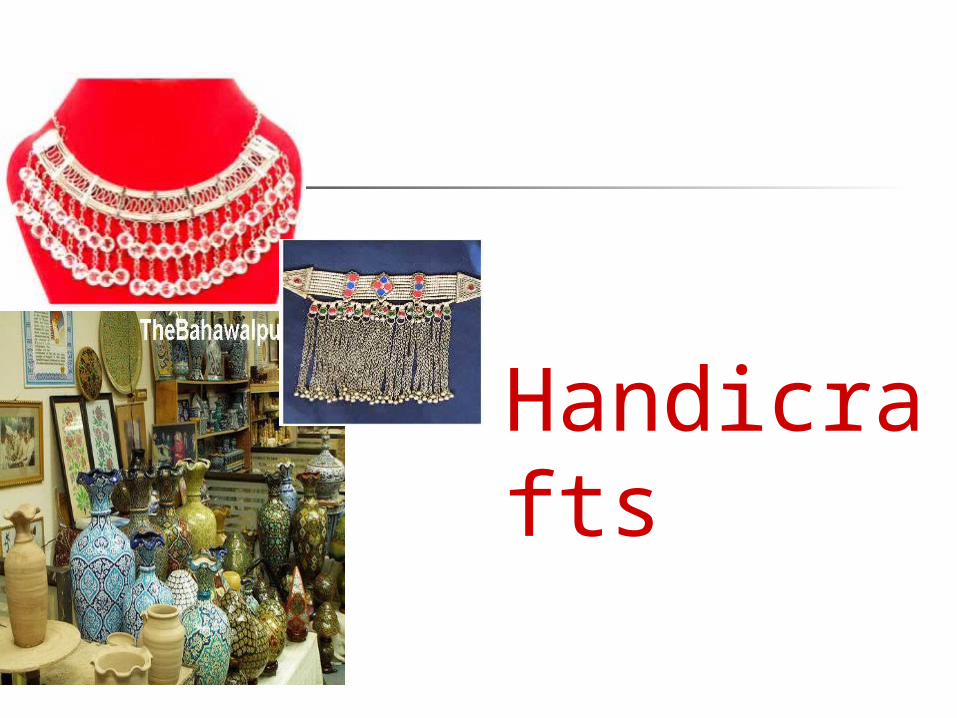
Handicrafts
Handicrafts (Gems and jewellery)
leading foreign exchange earner US$ 13.5 billion 11 % in the 5 year period employment to more than 1.3
million people directly and indirectly supported by Government policies
and the banking sector (50 banks providing about US$ 3 billion credit to the Indian diamond industry )
Handicrafts and Gifts highly labor intensive and
decentralized as the second largest employment-
generating sector after agriculture offers employment to over 6 million
artisans a perfect example of assimilation
between the traditional designs and modern techniques
Handicraft products composition
NATURAL OR CULTURED PEARLS PRECIOUS OR SEMIPRECIOUS
STONES PRE.METALS,CLAD WITH
PRE.METAL AND ARTICLES,COIN. HANDICRAFTS AND GIFTS
Fish, Dairy and Animals Products
Fish, Dairy and Animal products
FISH AND CRUSTACEANS, MOLLUSCS AND OTHER AQUATIC INVERTABRATES.
DAIRY PRODUCE; BIRDS' EGGS; NATURAL HONEY; EDIBLE PROD. OF ANIMAL ORIGIN, NOT ELSEWHERE SPEC. OR INCLUDED.
ANIMAL OR VEGETABLE FATS AND OILS AND THEIR CLEAVAGE PRODUCTS; PRE. EDIBLE FATS; ANIMAL OR VEGETABLE WAXEX.
MEAT AND EDIBLE MEAT OFFAL. RAW HIDES AND SKINS (OTHER THAN
FURSKINS) AND LEATHER
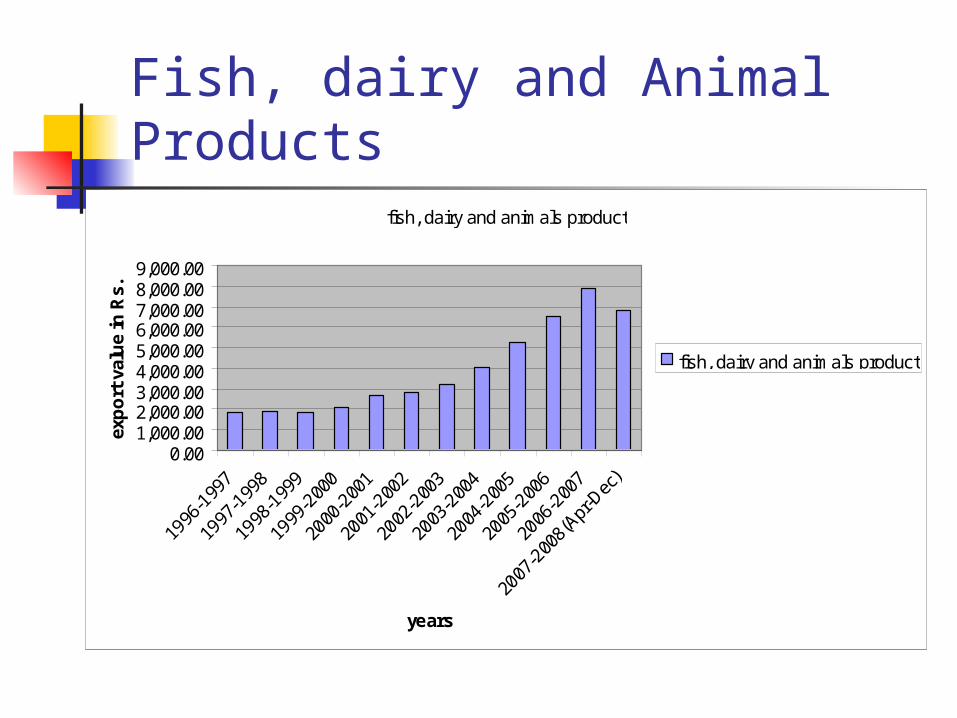
Fish, dairy and Animal Products
fish, dairy and animals product
0.001,000.002,000.003,000.004,000.005,000.006,000.007,000.008,000.009,000.00
years
exp
ort
val
ue
in R
s.
fish, dairy and animals product
Capital Goods
Capitals Goods NUCLEAR REACTORS, BOILERS,
MACHINERY AND MECHANICAL APPLIANCES; PARTS THEREOF.
ELECTRICAL MACHINERY AND EQUIPMENT AND PARTS THEREOF; SOUND RECORDERS AND REPRODUCERS, TELEVISION IMAGE AND SOUND RECORDERS AND REPRODUCERS,AND PARTS.
VEHICLES OTHER THAN RAILWAY OR TRAMWAY ROLLING STOCK, AND PARTS AND ACCESSORIES THEREOF.

Capital Goodscapital goods
0.00
2,000.00
4,000.00
6,000.00
8,000.00
10,000.00
12,000.00
years
exp
ort
s va
lue
in R
s.
capital goods
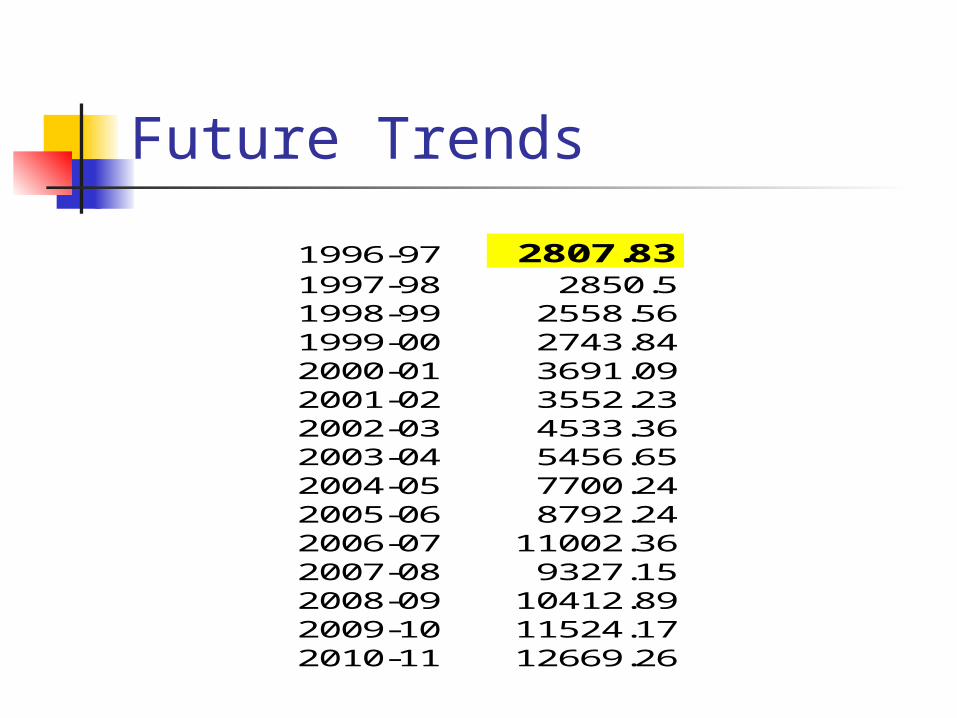
Future Trends
1996-97 2807.831997-98 2850.51998-99 2558.561999-00 2743.842000-01 3691.092001-02 3552.232002-03 4533.362003-04 5456.652004-05 7700.242005-06 8792.242006-07 11002.362007-08 9327.152008-09 10412.892009-10 11524.172010-11 12669.26

Service industry…
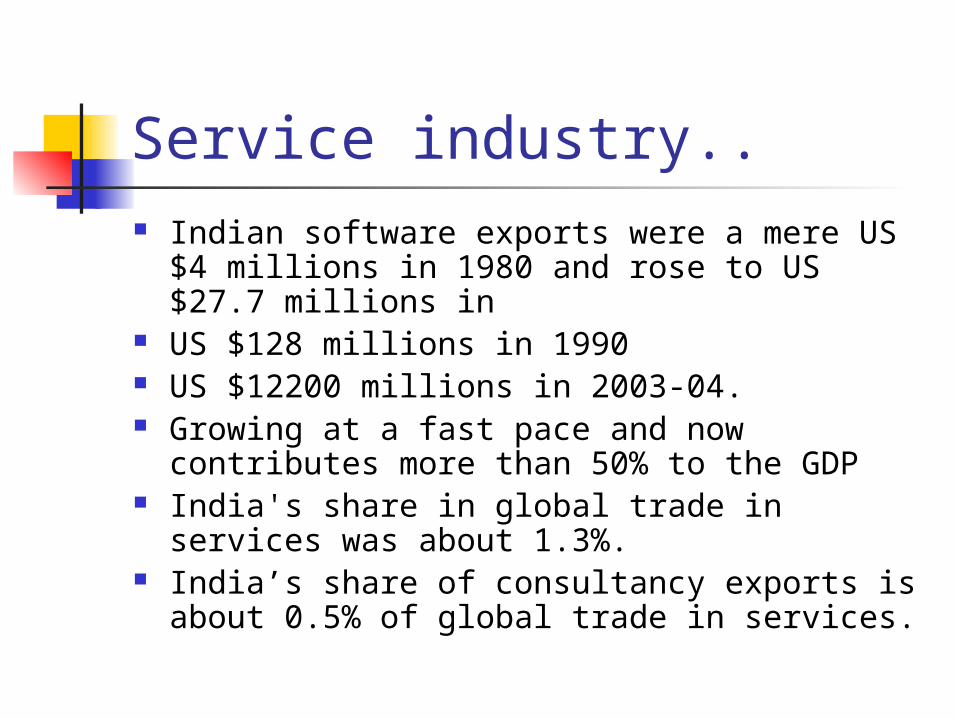
Service industry.. Indian software exports were a mere US $4
millions in 1980 and rose to US $27.7 millions in
US $128 millions in 1990 US $12200 millions in 2003-04. Growing at a fast pace and now contributes
more than 50% to the GDP India's share in global trade in services was
about 1.3%. India’s share of consultancy exports is about
0.5% of global trade in services.