exposing errors related to weak memory in gpu …afd/homepages/papers/pdfs/2016/pldi.pdfexposing...
TRANSCRIPT

Exposing Errors Related to Weak Memory in GPU Applications
Tyler SorensenImperial College London, [email protected]
Alastair F. DonaldsonImperial College London, UK
AbstractWe present the systematic design of a testing environmentthat uses stressing and fuzzing to reveal errors in GPU appli-cations that arise due to weak memory effects. We evaluateour approach on seven GPUs spanning three Nvidia archi-tectures, across ten CUDA applications that use fine-grainedconcurrency. Our results show that applications that rarely ornever exhibit errors related to weak memory when executednatively can readily exhibit these errors when executed inour testing environment. Our testing environment also pro-vides a means to help identify the root causes of such errors,and automatically suggests how to insert fences that hardenan application against weak memory bugs. To understandthe cost of GPU fences, we benchmark applications withfences provided by the hardening strategy as well as a moreconservative, sound fencing strategy.
Categories and Subject Descriptors D.1.3 [ProgrammingTechniques]: Concurrent Programming; D.2.5 [Software En-gineering]: Testing and Debugging
Keywords GPU, CUDA, Nvidia, weak memory, stress test-ing, memory fences, synchronisation, concurrency
1. IntroductionGeneral purpose programming languages for graphics pro-cessing units (GPUs), e.g. CUDA [38] and OpenCL [24],allow applications from a wide spectrum of domains to takeadvantage of the computational power and energy efficiencyoffered by these devices (see [45, pp. 8-10] for an overview).
GPU applications are prone to concurrency bugs, whichare notoriously difficult to reproduce and fix due to the sheernumber of possible instruction interleavings. Worse, GPUs
have been shown to implement weak memory models, so thatbehaviours beyond those obtained from straightforward inter-leavings are possible [8], making GPU application debuggingeven more challenging.
It has been argued, through hand analysis, that certaindeployed CUDA applications can exhibit weak memory bugsin theory [8], but we are not aware of any existing practicalmethod for exposing witnesses to weak memory bugs inGPU applications, i.e. demonstrating erroneous outcomesfrom actually running the application on current GPUs. Ourfocus in this work is on investigating (a) whether GPU weakmemory bugs can be provoked when running real-worldapplications on state-of-the-art hardware, (b) whether suchbugs can be provoked into occurring frequently (to aid intesting and debugging), and (c) the performance cost ofadding fences to harden GPU applications against such bugs.
We make three main contributions:
1. We develop a novel testing environment designed to revealweak memory behaviours in real-world GPU applications.This environment uses a sophisticated memory stressingstrategy, inspired by prior work on GPU litmus testing [8],systematically tuned per chip using results from nearlyhalf a billion micro-benchmark executions. Applying thetesting environment requires no prior knowledge of theapplication under test (Sec. 3).
2. We evaluate our approach on seven GPUs spanning threeNvidia architectures, across ten application case-studies,showing that we can provoke errors related to weak mem-ory and discovering previously unknown weak memoryissues in two applications (Sec. 4). Our experiments showthat two straightforward methods for memory stressingare not effective at exposing weak memory bugs, whilein contrast our novel test environment (tuned per chip) isoften highly effective.
3. We use our testing environment as a fence placementmechanism, to help understand the root causes of weakmemory bugs, and to harden applications against suchbugs (Sec. 5); we also benchmark the overhead (in termsof runtime and energy) associated with inserting fences toharden applications (Sec. 6).

Table 1: The seven Nvidia GPUs that we study
chip architecture short name releasedGTX 980 Maxwell 980 2014Quadro K5200 Kepler K5200 2014GTX Titan Kepler Titan 2013Tesla K20 Kepler K20 2013GTX 770 Kepler 770 2013Tesla C2075 Fermi C2075 2011Tesla C2050 Fermi C2050 2010
Unlike previous works for checking applications under weakmemory (see Sec. 7), our technique does not require a formalmemory model description, and requires no modifications tothe compiler or scheduler.
We begin with a high-level overview of our approach.
Running example We use the CUDA code of Fig. 1, ex-tracted from the dot product case study from [45, ch. A1.2]which we dub cbe-dot, to illustrate our approach. (Back-ground on CUDA is provided in Sec. 2.) The application in-corporates a spinlock, and correctness depends on the sourcecode ordering between the atomic operations on the lock(lines 19, 22) and the memory operations in the critical sec-tion (line 15) being preserved. Reordering these operationscan lead to an incorrect dot product value being computed.However, no erroneous behaviour is observed when conduct-ing 1000 executions of the application on a Tesla K20 GPU. Adeveloper who is not suspicious about weak memory effectsmight conclude that the application is correct.
Testing environment We present in Sec. 3 a testing environ-ment for provoking weak behaviours in applications acrossa range of Nvidia GPUs, given in Tab. 1.1 Under our testingenvironment, errors (due to weak memory) appear in 102 outof 1000 executions of cbe-dot on the K20.
The key part of our testing environment is a memorystressing strategy that targets a completely disjoint regionof memory from the application data (called a scratchpad)using extra GPU threads disjoint from the threads that executethe application (the extra threads are called stressing threads).Because the stressing threads and memory are disjoint fromapplication threads and data, the set of possible behaviours aprogram can exhibit remains the same.
Using nearly half a billion micro-benchmark executions,the stressing strategy is tuned per GPU to identify whereto stress within the scratchpad, which instructions to applyduring stressing, and how many memory locations to stressin parallel. Parameters for these values are selected basedon how many weak behaviours they expose in the micro-benchmarks. For example, micro-benchmarking shows thatfor K20 it is effective to apply stress to two memory locationsin parallel, each aligned at 32-word boundaries.
1 We restrict to Nvidia GPUs because the majority of available applicationsthat exhibit fine-grained concurrency are written using Nvidia’s CUDA.
1 __global__2 void dot(int *mutex, float *a, float *b, float *c) {3 int tid = threadIdx.x + blockIdx.x * blockDim.x;4 int cacheIndex = threadIdx.x;5 float temp = 0;67 while (tid < N) {8 temp += a[tid] * b[tid];9 tid += blockDim.x * gridDim.x; }
1011 // local computation code omitted1213 if (cacheIndex == 0) {14 lock(mutex);15 *c += cache[0];16 unlock(mutex); } }1718 __device__ void lock(int *mutex) {19 while (atomicCAS(mutex, 0, 1) != 0 ); }2021 __device__ void unlock(int *mutex) {22 atomicExch(mutex, 0); }
Figure 1: CUDA code for the cbe-dot application
Weak behaviours in applications We evaluate our testingenvironment on ten GPU application case-studies that im-plement fine-grained concurrency idioms, e.g. mutexes andconcurrent data-structures (Sec. 4). On each of the sevenGPUs of Tab. 1, we executed each application repeatedly forone hour under our testing environment. For comparison, wealso tested the applications under two more straightforwardstressing environments that are not tuned per chip.
Our results show that our testing environment is able toprovoke erroneous outcomes in 55 out of 70 chip/applica-tion combinations, leading to the discovery of previouslyunknown weak memory issues in two applications. Becauseerrors are easier to debug when they occur frequently, wealso measure the effectiveness of the testing environment, i.e.,how frequently bugs are provoked. If a bug appears in morethan 5% of the executions associated with a chip/applicationcombination, we say the testing framework is effective. Outof the 55 of applications we observed errors for, our testingmethod is effective for 43 of them.
We evaluate our tuned stress against several other straight-forward stressing methods. We observe these methods areconsiderably less able to expose weak behaviours, the mostcapable method revealing erroneous runs 13 out of 70 chip/ap-plication combinations (and effective for only 6).
Hardening applications against weak memory bugs Un-like in the case of e.g. C11, there is currently no agreedformal memory for CUDA. Consequently, it is not possibleto provide formal correctness guarantees about CUDA ap-plications that use fences to eliminate weak memory bugs.As a pragmatic alternative, we employ our testing methodto suggest a minimal set of memory fences that suffice tosuppress weak memory bugs under our aggressive test envi-ronment (Sec. 5). This empirical fence insertion starts with afence instruction inserted after memory access and repeatedlyattempts to remove fences, using our testing environment to

assess, empirically, whether each removal introduces a bug.The process converges to a minimal set of fences such thatremoving any single fence exposes erroneous behaviours.
While clearly providing no guarantees, the suggestedfences can aid developers in understanding the causes of weakmemory defects, and can aid in hardening the applicationagainst weak memory defects by, at a minimum, making themless likely to occur. In cbe-dot for K20, the fence insertionsuggested adding a single fence after line 15, suggestingan error in the unlock function. Prior work, through handanalysis, identified the same issue and prescribed a fence atthe beginning of the unlock function; this is logically thesame fence identified by our fence insertion.
Evaluating the cost of fences To understand the cost ofadding fences to applications, we benchmark both the run-time and energy usage of our application case studies (Sec. 6).We consider three fencing strategies: removing all fences(unsafe), adding a fence after every memory access (safe,but conservative), and adding fences suggested by empiricalfence insertion (hardened, but not guaranteed to be safe). Thisallows us to investigate the overhead associated with hard-ening applications via empirical fence insertion, providing alower bound on the cost of eliminating weak memory defects,vs. conservatively guaranteeing absence of weak behavioursby adding fences after all memory accesses, providing anupper bound on the cost. The results of cbe-dot for K20shows that adding fences via empirical fence insertion incursa small runtime/energy cost (less than 3%), in comparisonto full fence insertion, which incurs a 145% runtime and a173% energy cost.
Related GPU memory model testing work Previous workhas applied weak memory testing to GPUs in the context ofshort idiomatic tests (i.e. litmus tests) with the tool GPULITMUS [8]. GPU LITMUS implements a memory stressheuristic that inspired this work. However, the method andaims of [8] are fundamentally different to ours. Specifically,the aim in [8] was simply to show the existence of weakbehaviours, using carefully crafted tests. In contrast, our aimis to test applications in a black box manner, with no a prioriknowledge about the application, e.g. the communicationidioms used in the application.
Our aim is also bolder: to be able to provoke errorsfrequently, rather than merely show the existence of errors.Hence optimising for frequency of weak behaviours observed,with respect to idioms that have classically caused bugs, is atthe heart of our novel stressing strategy.
2. BackgroundWe provide necessary background on memory models andlitmus tests, and a brief overview of the CUDA programmingmodel including details of memory fences in CUDA.
Memory models For a given architecture and concurrentprogram, a memory model determines the values that load
Message Passing (MP)
init: x = 0, y = 0
T1 T2x← 1;y← 1;
r1← y;r2← x;
weak behaviour:r1 = 1 ∧ r2 = 0
Load Buffering (LB)
init: x = 0, y = 0
T1 T2r1← x;y← 1;
r2← y;x← 1;
weak behaviour:r1 = 1 ∧ r2 = 1
Store Buffering (SB)
init: x = 0, y = 0
T1 T2x← 1;r1← y;
y← 1;r2← x;
weak behaviour:r1 = 0 ∧ r2 = 0
Figure 2: MP, LB, and SB weak memory litmus tests
instructions are allowed to return [46, ch. 1]. The strongestmemory model, sequential consistency, only allows execu-tions that correspond to an interleaving of thread instruc-tions [25]. Many architectures (e.g. x86, ARM, Nvidia GPUs)provide weak memory models [7, 8, 46], whereby executionsmay not correspond to such an interleaving. We say suchexecutions exhibit weak behaviour. Weak behaviours can bedisallowed (at a performance cost) by placing memory fencesbetween memory accesses [6–8, 46].
Weak behaviours can be illustrated by litmus tests: shortconcurrent programs with a query about the final state. Threewell-known litmus tests, discussed throughout the paper,are presented in Fig. 2. The message passing (MP) testillustrates a handshake protocol where thread 1 writes data tomemory location x and then sets a flag in memory locationy, while thread 2 reads the flag value and then reads the data.The test exhibits weak behaviour if thread 2 can observea set flag (y= 1) but see stale data (x= 0). The weakbehaviour illustrated by the load buffering (LB) test checkswhether load instructions are allowed to be buffered afterstore instructions. Store buffering (SB) similarly checkswhether store instructions are allowed to be buffered afterload instructions. These weak behaviours are all allowed onARM and IBM Power CPUs, and Nvidia GPUs. The SBweak behaviour (but not MP nor LB) is also allowed underthe x86 TSO memory model.
We use communication idiom to refer to a configurationof threads, locations and instructions that could lead to aweak behaviour, and communication locations/communica-ting threads to refer to the memory locations/threads involvedin a communication idiom. For example, the MP test ofFig. 2 describes a communication idiom over communicationlocations x and y, with two communicating threads.
The CUDA programming model In the CUDA program-ming model [38], a program consists of host code that ex-ecutes on the CPU of the machine, and device code thatexecutes on the GPU. The device code is called a kernel, andis executed by many threads in a single instruction, multiplethreads (SIMT) manner. A thread is a basic unit of computa-tion that executes the kernel. Threads are grouped in disjointsets of size 32, called warps, that execute in lock-step: theysynchronously execute the same instruction and share a pro-gram counter. Warps are grouped into disjoint sets calledblocks; the number of threads (and by extension, warps) in

a block is a parameter of the kernel. Collectively, the blocksthat execute a kernel form a grid; the grid size is also a param-eter of the kernel. Threads may query their thread id within ablock, their block id within the grid, the number of threadsper block and the number of blocks in the grid, using CUDAprimitives.
Threads in the same block can synchronise at a barrier.Each thread in the block waits at the barrier until everythread in the block has reached the barrier, at which pointmemory consistency is guaranteed between threads in theblock. Execution of a CUDA barrier has undefined behaviourunless all threads in a block execute the barrier; violation ofthis condition is known as barrier divergence [38, p. 98].
Threads in the same block can communicate using sharedmemory, and a single global memory region is accessible toall threads in the grid.
Memory fences in CUDA In CUDA, weak behaviours forcommunication idioms where communicating threads are inthe same block (resp. different blocks) can be disabled usingblock level fence (resp. device level fence) instructions [38,ch. B.5]. In this work we focus exclusively on inter-blockcommunication idioms because we did not encounter appli-cations that use communication idioms for which communi-cating threads are in the same block.
3. The Design of Our Stressing StrategyHere we describe the systematic development of our memorystressing strategy, inspired by work in [8] and based on resultsof micro-benchmarks, designed to be effective at revealingweak behaviours. By targeting a scratchpad memory regionusing stressing threads, completely disjoint from the memoryand threads of the application, our stressing strategy doesnot modify the possible behaviours of the application. Weadditionally want our stressing strategy to be agnostic to thecommunication idioms (including communicating threadsand locations) inside the application, thus allowing for blackbox application testing.
We partition threads into stressing threads and applicationthreads at the block level (rather than allowing a single blockto contain both kinds of threads) to avoid introducing barrierdivergence (see Sec. 2). We refer to a block of stressingthreads as a stressing block.
We conducted pilot experiments applying different mem-ory stress to three applications, the cbe-ht, cbe-dot and ct-octree applications presented in Sec. 4, running on two GPUs,Titan and C2075 (see Tab. 1). Our findings indicated thatstressing could be effective at provoking erroneous execu-tions due to weak behaviours, but that the effectiveness ofmemory stress is highly dependent on a number of param-eters. Specifically, the added scratchpad memory providesmany possible locations that can be stressed, stressing can beapplied to many different location combinations, and thereare many choices for the instruction sequences that can beused to stress these memory locations. We refer to these as
memory stress parameters, and refer to the extent to whicha set of memory stress parameters is able to provoke weakbehaviours running on a particular GPU as effectiveness.
When stressing, we do not consider the base address ofthe scratchpad because GPUs use virtual memory addressing(reported in [31]) and we are unaware of any method forobtaining the physical address from the virtual address. Thus,we cannot control the distance between the physical locationsof the scratchpad and the memory used by the applicationunder test. Because of this, we design our stress so as not torely on this distance.
We detail the micro-benchmark design and results usedto obtain effective parameters per chip, guided by insightsgained through our pilot experiments. We present full detailsusing precise notation to enable others to reproduce ourapproach in future work, e.g. for CPU or next-generationGPU application testing.
3.1 Focusing on Litmus TestsOur overall aim is to provoke weak behaviours in an appli-cation without knowledge of the fine-grained idioms that theapplication might rely on. Weak behaviours of the MP, LBand SB tests (Fig. 2) are known sources of bugs; e.g. MPand LB weak behaviours were shown (via hand analysis)to be problematic in GPU applications [8], and SB weakbehaviours cause issues in an implementation of Dekker’salgorithm [46, p. 20]. All weak memory bugs we are awareof relate to one of these idioms.
Hypothesising that memory stress parameters tuned ac-cording to these litmus tests are likely to be effective in ex-posing practical weak memory bugs, we assess the fitness ofmemory stress parameters based on their effectiveness at pro-voking weak behaviours in these litmus tests. While we focuson the MP, LB and SB tests, our stress may be tuned to anyset of litmus tests. If, in the future, weak memory model bugsare discovered that correspond to communication idioms notcovered by these three tests, our stress can be re-tuned.
Recall from Fig. 2 that each of the litmus tests involvestwo communication locations, x and y. In an application thatimplicitly uses one of these idioms, the relative addresses ofcommunication locations depends on the data layout of theapplication. For a litmus test T ∈ {MP, LB,SB}, we thusconsider a variety of test instances, Td, where d is a non-negative distance indicating the number of memory wordsseparating the communication locations. We seek memorystress parameters capable of provoking weak behavioursin litmus tests for a range of distances, to account for theunknown distance between relevant locations in applications.
Because we consider applications with inter-block commu-nication, tests are configured with x and y in global memory,and communicating threads in distinct blocks.
3.2 Identifying Effective Locations to StressIn our pilot experiments, we found that the choice of whichscratchpad locations to stress greatly influenced the extent of

d = 0
MP
LB
d = 32
MP
LB
d = 64
MP
0 32 64 96 128 160 192 224 256
LB
scratchpad location stressed
(a) GTX Titan shows patch size 32
d = 0
MP
LB
d = 64
MP
LB
d = 128
MP
0 32 64 96 128 160 192 224 256
LBscratchpad location stressed
(b) Tesla C2075 shows patch size 64
d = 0
MP
LB
d = 64
MP
LB
d = 128
MP
0 32 64 96 128 160 192 224 256
LB
scratchpad location stressed
(c) GTX 980 shows patch size 64
Figure 3: Patch-finding results for MP and LB
observed weak behaviours. On Titan we found it was roughlyequally effective to stress any one of the first “patch” of 32scratchpad (word-sized) locations, equally effective to stressany one of the next patch of 32 scratchpad locations, and soon, but that the effectiveness varied between patches.
We now explain our empirical method for discoveringwhether a chip naturally exhibits a patch size, so as to avoidredundantly stressing multiple locations in the same patch.
Let 〈Td, l〉 denote test instance Td with memory stress ap-plied at scratchpad location l. For example, 〈LB0, 5〉 denotesan instance of LB with contiguous communication locationsand stressing applied at scratchpad location 5. Let D and Ldenote a maximum distance and scratchpad location to beconsidered, respectively, and let C be an execution limit. Foreach T ∈ {MP, LB,SB}, 0 ≤ d < D and 0 ≤ l < L, weconduct C executions of test 〈Td, l〉, recording the number oftimes that 〈Td, l〉 yields weak behaviour.
We chose D = 256, L = 256 and C = 1000, leading to∼196.6M test executions per GPU. Each execution employsa random number of stressing threads such that the totalnumber of threads executing the kernel is 50% to 100% of themaximum threads that can run concurrently on the GPU. Eachstressing thread executes a loop where, on every iteration, thethread stores to and then loads from location l.
The plots of Fig. 3a illustrate the results of our experimentsfor Titan (Kepler architecture). Results for the MP and LBtests are shown; the results for SB are very similar to thosefor LB and are omitted. We show plots for three valuesof d: 0, 32 and 64. The x axis is divided into L = 256segments. For each segment position x, a vertical bar isplotted. The height of the bar indicates the number of weakbehaviours that were observed during C = 1000 executionsof test 〈Td, x〉 (to avoid cluttering the figure we do notnumber the y axis for these plots). In many cases no baris visible, indicating that no weak behaviours were observed.The plots of Figs. 3b and 3c show similar data for C2075
(Fermi) and 980 (Maxwell) chips, respectively, for d ∈{0, 64, 128}. The raw data and graphs for all experimentalresults can be found at http://multicore.doc.ic.ac.uk/projects/gpuwmmtesting/.
The Titan and C2075 results (Figs. 3a and 3b, respectively)exhibit similar characteristics: no weak behaviour is observedwhen communication locations are contiguous (d = 0); ourfull data shows that this is the case for all d < 32 (Titan)and d < 64 (C2075). After this, patches of weak behaviouremerge: for d = 32 and d = 64, Fig. 3a shows that the rate ofweak behaviours exhibited by Titan is fairly consistent whenstressing within 32-word contiguous scratchpad regions, butvaries between different regions. For 33 ≤ d < 64, our fulltest data shows visually similar plots to the d = 32 plot ofFig. 3a, with stressing exposing weak behaviour in the sameregions. These regions change at d = 64, remain constant for65 ≤ d < 96, change again at d = 96, etc. Similar resultsare found for C2075, (Fig. 3b) but the patch size is 64.
Results clearly indicating a patch size are observed forall chips, with the exception of the recent 980 (Maxwell).Fig. 3c shows that for 980, we consistently observe a smallnumber of MP weak behaviours for all stressing locations,even with d = 0; we see LB weak behaviours universallyfor 64 ≤ d < 128 (the figure shows the d = 64 case), andpatches of length 64 emerge for LB at d = 128. We observeonly noise levels of MP weak behaviour for d ≤ 256, but afterrunning some extra experiments on this chip we found thatmore significant MP weak behaviours emerge from d = 256(not depicted in the figure), showing a patch size of 64.
The plots of Figs. 3a and 3b provide intuition for theidea that a GPU exhibits a natural patch size, which candiffer between architectures. The 980 results of Figs. 3c alsoindicate that a minimum threshold of weak behaviour mayneed to be considered to identify the patch size for a chip.
We now formalise our method for determining the patchsize of a chip empirically. Let T ∈ {MP, LB,SB} be a test,

Table 2: Stressing parameters and time spent tuning
chip c. patch size sequence spread ~time (mins)980 64 ld4 st 2 1731K5200 32 ld3 st ld 2 3069Titan 32 ld st2 ld 2 3115K20 32 ld st2 ld 2 4215770 32 st2 ld2 2 1831C2075 64 ld st 2 2145C2050 64 ld st 2 1996
and ε a non-negative noise threshold. A maximal contiguoussequence of P locations, l1, . . . , lP , for which each 〈Td, li〉yields more than ε weak behaviours, is called an ε-patch ofsize P . A test may exhibit multiple ε-patches for a given P .If all of MP, LB and SB agree on the value of P for whichthe largest number of ε-patches of size P are observed, wecall P the critical patch size for the GPU (w.r.t. to ε).
In our experiments we used a noise threshold of 3. Wefound that each GPU exhibited a critical patch size of either32 or 64; specifically, 32 for Kepler chips, and 64 for Fermichips. For Maxwell (980), critical patches for MP did notappear except in our special additional tests (whereD > 256).Because of this, we say the critical patch size for 980 is 64,based on the patterns observed in the extra tests and the patchsizes observed for LB. The critical patch sizes for all chipsare summarised in Tab. 2.
For brevity, we henceforth omit ε when discussing criticalpatch sizes.
3.3 Identifying Effective Access SequencesWe now turn to deriving an effective sequence of instructionsto be issued by stressing threads; our pilot experiments indi-cated that this could influence exposure of weak behaviour.
Letting ld and st denote load and store instructions, re-spectively, we assess the effectiveness of stressing using avariety of access sequences. We do this by instantiating theloop body executed by the stressing threads with each ac-cess sequence σ matching the regular expression (ld|st)+,up to some maximum length N . For a litmus test T , accesssequence σ, distance d (0 ≤ d < D) and stressing locationl (0 ≤ l < L), let 〈Td, σ@l〉 denote the test T instantiatedwith distance d between communication locations, and withaccess pattern σ used to apply memory stress at location l.
Suppose P is the critical patch size for the GPU ofinterest. Because stressing multiple locations in a patch isnot worthwhile, we consider stressing each location in the set{l : 0 ≤ l < L ∧ P |l}, i.e. the first location in each criticalpatch-sized region. For each such location l, we count thenumber of weak behaviours observed during C executions of〈Td, σ@l〉, for each test T , distance d and access sequence σ.
The total number of weak behaviours observed for testT with access sequence σ, summed over all distances andstressing locations, allows us to order the effectiveness of theaccess sequences with respect to T . An access sequence σ
Table 3: Snippet of σs and scores for Titan
MP LB SBrank σ score rank σ score rank σ score1 ld3 st ld 153k 1 st2 ld3 98k 1 st2 ld 138k2 st ld2 140k 2 st ld3 st 96k 2 ld st2 128k3 ld st ld 131k 3 ld3 st2 93k 3 ld2 st3 125k... ... ... ... ... ... ... ...17 ld st2 ld 104k 17 ld st2 ld 64k 21 ld st2 ld 93k... ... ... ... ... ... ... ...61 st 342 61 st5 126 61 st3 67462 st3 266 62 st2 108 62 st4 52063 st5 232 63 st3 90 63 st5 348
is maximally effective for a set of GPU test data if no othersequence σ′ is observed to be more effective than σ withrespect to all three litmus tests; that is, σ is Pareto optimalover the litmus tests. In our experiments we occasionallyobserved two distinct access sequences were maximallyeffective; we were able to break such ties by selectingthe sequence that was most effective for two out of thethree litmus tests. After tie-breaking, we have a single mosteffective access sequence for the GPU.
In our experiments we chose N = 5 as the maximumaccess sequence length (leading to 2n+1 − 1 = 63 possibleaccess sequences), and D = 256, L = 256 and C = 1000 asbefore. With three litmus tests this required running∼387.1Mtests for a GPU with critical patch size P = 32 (∼193.5Mwith critical patch size P = 64).
Table 2 shows the most effective sequences for our GPUs,based on our experimental findings (where ldx denotes asequence of x loads, stx is similar). The most effectivesequences match for both Fermi chips (C2075, C2050). Fortwo of our four Kepler chips (Titan, K20) the most effectivesequence is ld st2 ld, which is equivalent under rotation tost2 ld2, the most effective sequence for one of the otherKepler chips (770). We observe that all of the most effectivesequences involve a combination of loads and stores.
In Tab. 3 we give a snapshot of results for Titan. Forthe given σ, score shows the number of weak behavioursobserved for the associated test using σ, over all distancesand stressed locations. We show the top- and bottom-threeσs for each test (ranked by score). The disparity betweenhigh and low scores provides evidence that σ influences thestressing effectiveness. The most effective sequence for thechip (shown in the middle) is not especially highly ranked forany one test, but is orders of magnitude more effective thanthe lowest-ranked σs. For most chips, the lowest ranked σsconsist exclusively of stores.
Because access sequences are executed in a loop, wehypothesised that it might be redundant to test two σs that areequivalent under rotation, e.g. (ld st) and (st ld). However,our results show that two σs that are equivalent under rotationcan yield remarkably different amounts of weak behaviour.For example, on Titan, σ = (ld st) gave a score of 79K, whileσ = (st ld) gave a score of 91K. These differences may be

due to interference from loop boundary instructions. Thus, weopted to test all instruction permutations and did not considerrotational equivalence.
3.4 Identifying How Many Locations to StressOur patch testing results show that some critical patch-sizedregions yield no weak behaviour while others yield a lot ofweak behaviour, varying between distances. Because applica-tions may exhibit arbitrary distances between communicationlocations, it may be sensible to select multiple regions tostress, to increase the probability of stressing a region that iseffective for the application.
Our pilot experiments showed that simultaneously stress-ing a spread of 2–8 randomly chosen locations in differentregions worked well, varying between chips. We now con-sider how to systematically derive an effective spread.
Let T be a test, σ an access sequence, d a distanceand L a set of scratchpad locations. We use 〈Td, σ@L〉 todenote the litmus test T instantiated with distance d betweencommunication locations, and with memory stress appliedsimultaneously at each location in L with respect to accesssequence σ. The number of stressing threads is chosenrandomly, as before, but at least |L| threads are used, andthe threads are assigned evenly (modulo rounding) to thelocations in L.
To identify an effective spread, we consider a scratchpadof size P ·M , where P is the critical patch size of the GPUunder consideration, and M is a positive maximum spread.This yields M distinct critical patch-sized regions to whichstressing can be applied. The set M = {l : 0 ≤ l <P ·M ∧ P |l} provides the first location in each region.
Let D denote the maximum distance between communi-cation locations, as before, and let σ be the most effectiveaccess sequence for the GPU under consideration. For eachtest T and spread m (1 ≤ m ≤ M) we execute C tests ofthe form 〈Td, σ@Lm〉, where for each test Lm is a randomlyselected subset ofM with size m, so that stressing is appliedto m distinct critical patch-sized regions.
We use score for spread m to refer to the number of weakbehaviours observed for test T with spread m, summed overall distances. A spread m is maximally effective for a setof GPU test data if it is Pareto optimal with respect to theidioms (i.e., if no other spread m′ was observed to have ahigher score than m with respect to all three litmus tests).Our experiments identified a single maximally effective mfor each GPU, with no tie-breaking required.
In our experiments we chose M = 64 as the maximumspread, and D = 256 and C = 1000 as before. With threelitmus tests, this required running ∼49.2M tests per chip.
Table 2 shows that 2 is the most effective spread for all theGPUs we tested. Figure 4 illustrates spread-finding results inmore detail for 980 and K20, plotting spread on the x-axisand score on the y-axis. For 980 we see that 2 is clearly themost effective spread. The U-shape for K20 is less striking,yet the highest scores remain with a spread of 2.
0 100 200 300 400 500 600 700 800 900
1000 1100
0 16 32 48 64
spread
GTX 980score
MPLBSB
0 1000 2000 3000 4000 5000 6000 7000 8000 9000
10000
0 16 32 48 64
spread
Tesla K20score
MPLBSB
Figure 4: Spread finding for 980 and K20
3.5 Thread RandomisationTo amplify the effectiveness of memory stressing, we apply astraightforward adaption of the thread randomisation heuris-tic, originally presented in [8]. Previously used exclusively inthe context of litmus testing, we extend thread randomisationto apply to black box application testing.
In this heuristic, the GPU thread ids are randomised, butconstrained to honour the GPU programming model. Namely,randomisation must respect block membership: if two threadsshare a common block before randomisation, they must sharea common (but possibly different) block after randomisation.This is vital if the application uses barriers, as placing pre-viously co-located threads into different blocks can inducebarrier divergence. Randomisation must also respect warpmembership, as applications may exploit implicit intra-warpsynchronisation to prevent what might otherwise be erro-neous interleavings (e.g. [32] exploits this implicit intra-warpsynchronisation).
For our case studies, we evaluate the effectiveness ofthread randomisation at revealing weak memory bugs whenapplied in isolation and in conjunction with memory stress.
Summary We used nearly half a billion micro-benchmarkexecutions to identify the critical patch size, an effectiveaccess sequence, and the best number of critical patch-sizedregions to stress simultaneously, for each GPU. Results of ourfindings for the GPUs of Tab. 1 are given in Tab. 2, and fullexperimental data is given in our companion material. Whilewe focused on the MP, LB and SB tests in this work, our stresscan be tuned to other litmus tests. For litmus tests that also usetwo communication locations, our approach applies directly.For litmus tests with additional communication locations,tuning would need to consider multiple distance parameters.While conceptually straightforward, the tuning time for testswith more distance parameters may become expensive.
Combined with thread randomisation, we now evaluatethe effectiveness of this test environment at provoking weakbehaviours in real-world GPU applications.
4. Provoking Weak Behaviours in the WildWe evaluate the testing environment of Sec. 3 w.r.t. ten GPUapplications that are known to use fine-grained concurrency.

We detail the applications (Sec. 4.1), describe our experimen-tal setup (Sec. 4.2) and present our findings (Sec. 4.3).
4.1 Application Case StudiesWe undertook a thorough, best-effort search for CUDA appli-cations that might be subject to weak behaviours, selectingapplications that met three criteria: (1) their source code isavailable, (2) they do not rely on non-portable assumptions,(3) they appear to exhibit fine-grained concurrency.
We omit applications described in [20, 47] due to sourcecode unavailability, and some applications of [12, 37, 49] asthey use a non-portable global barrier that depends on preciseoccupancy; adding extra stressing blocks and applying threadrandomisation to this construct causes deadlock.
We assess criterion (3) according to whether applicationsuse mutexes or concurrent data-structures (with which weakbehaviours are often associated, e.g. [26, 36]), or includefence instructions (an explicit acknowledgment of memoryconsistency issues). Most CUDA applications do not meetthis criterion and exhibit no communication between threadblocks, as they use barriers for intra-block communication;thus they are not prone to weak behaviours. In these cases,our approach would provide no benefit. The subset of relevantapplications is small, but the applications are important, andas interest in the use of fine-grained concurrency increaseswe expect the set of relevant applications to grow.
Our approach requires each application to be equippedwith a user-supplied functional post-condition, to checkwhether an execution is erroneous; because applicationsmay exhibit nondeterminism it is not sufficient to checkfor repeated computation of an identical result. We omittedseveral candidate applications for which, as outsiders, wecould not easily derive suitable post-conditions. For example,GPU hashtables in [2, 35] drop items if collisions exceeda certain threshold; we found it hard to formulate a robustpost-condition to capture the intended behaviour. Other suchexamples were found in [22, 33].
The evaluated applications are summarised in Tab. 4, atotal of ten applications derived from seven code bases (withthree variants obtained by removing existing fences). We de-tail the application source, the nature of communication, andthe post-condition used to check correctness. All applicationsexcept for ct-octree, tpo-tm and ls-bh were provided witha testing harness containing a post-condition. For ct-octreeand tpo-tm, meta-data were gathered during the executionand used to implement post-condition checks. For ls-bh, weobtained a reference solution from the conservatively fencedvariation of the application (see Sec. 5). The post-conditioncompares the computed values with the reference.
While our environment was developed to expose bugs dueto weak behaviours, other types of bugs were uncovered inour case studies: improper memory initialisation in ct-octreeand out-of-bounds queue accesses in ct-octree and tpo-tm.Our experiments are performed on patched versions of theseapplications, not showing these issues.
The applications ls-bh-nf , cub-scan-nf , and sdk-red-nf aremanufactured from ls-bh, cub-scan, and sdk-red respectively.The original applications contained fence instructions whichwe removed to create the -nf (no fence) variants. This allowsus to test if the provided fences are (a) experimentallyneeded to disallow errors and (b) sufficient to disallow weakbehaviour bugs in the application.
4.2 Experimental SetupTesting environments We evaluate the effectiveness of oursystematically designed memory stressing strategy, sys-str, byconsidering two straightforward memory stressing strategiesto compare against. In the first strategy, rand-str, stressingthreads repeatedly execute a load or store (at random) toa random location in the scratchpad (using curand [42] togenerate random numbers in CUDA). The second strategy,cache-str, allocates a scratchpad the size of the GPU L2cache, and each stressing block then repeatedly performs aload and store to each location in the scratchpad. The L2cache-sized scratchpad is an attempt to exploit a hardwareparameter of the chip that we speculate may be relevant fortriggering weak behaviours. For example, reading and writingto a scratchpad of this size may cause cache thrashing, whichwe hypothesised might encourage weak behaviours to appear.We also consider no-str: the application is executed natively,without any memory stress.
To evaluate thread randomisation, we experiment witheach stressing strategy both with thread randomisation en-abled and disabled, indicated by a + (enabled) or - (disabled)at the end of the stressing strategy name. For example, sys-str+ denotes systematic stressing with thread randomisationenabled. This leads to a total of eight testing environments.
Testing parameters Natively, we find that application ex-ecutions terminate within 8 seconds across all our GPUs,dominated by initialisation of the CUDA framework withkernel execution itself accounting for a small fraction of to-tal time. To catch timeout errors (due to weak behavioursaffecting the termination condition of an application), weset a timeout limit of 30 seconds per application execution.When memory stress is enabled, we randomly set the numberof stressing blocks to a value between 15% and 50% of thenumber of thread blocks launched by the original application.To ensure that stressing is applied for at least as long as akernel would normally execute, we configure the number ofstressing loop iterations on a per application basis so that thestressing threads execute for roughly 10 times as long as thekernel takes to execute. Because kernel execution accountsfor only a fraction of total execution time for an application,this has little impact on overall execution time.
For each combination of GPU (Tab. 1), application (Tab. 4)and testing environment, we repeatedly execute the applica-tion for one hour and record the number of erroneous runsobserved. The number of executions varies between combina-

Table 4: The ten case studies we consider, derived from seven distinct applications
short name description communication post-condition
cbe-htConcurrent hashtable given in the bookCUDA by Example [45, ch. A1.3]
Concurrent hashtable insertion pro-tected by custom mutexes
All elements inserted into thehashtable are in the final hashtable
cbe-dotDot product routine given in the bookCUDA by Example [45, ch. A1.2]
Global final reduction across blocksprotected by a custom mutex
GPU result matches a CPU referenceresult
ct-octreeOctree partitioning routine by Ceder-man and Tsigas [22, ch. 37]
Concurrent access to non-blockingqueues
All original particles are in final octree
tpo-tmDynamic task management frameworkby Tzeng, Patney, and Owens [48]
Concurrent access to queues protectedby custom mutexes
Expected number of tasks are executed
sdk-red *Reduction routine from the CUDA 7SDK [39]
Last block (via atomic counter) com-bines block-local results
GPU result matches a CPU referenceresult
cub-scan *Prefix scan from the CUB GPU li-brary [37]
Blocks communicate partial results us-ing MP-style handshake
GPU result matches a CPU referenceresult
ls-bh *Barnes-Hut N-body simulation fromthe Lonestar GPU benchmarks [12]
Various instances across three kernelsFinal particle positions match resultsfrom reference implementation
*These apps. contain fence instructions; we also consider variants without fences, using the names sdk-red-nf, cub-scan-nf, and ls-bh-nf
tions, ranging from 160 for Titan/ct-octree/sys-str+ to 10,907for 980/cbe-dot/no-str.
4.3 ResultsThe results of running combinations of environments, chips,and applications are summarised in Tab. 5. For each chip andenvironment, a/b means that we could observe erroneousruns for b applications, and that in a of these cases weobserved errors in more than 5% of the executions, in whichcase we say that the environment is effective in exposingerrors for the application and chip. We highlight in bold themost effective strategy for each chip. For example, sys-str+is the most effective strategy for K20, observing errors foreight applications, and exceeding the effectiveness thresholdfor seven.
Observed errors We observed weak behaviour in all appli-cations except sdk-red and cub-scan. Because we observeweak behaviours in the fenceless versions of these applica-tions (sdk-red-nf and cub-scan-nf ), it appears that the fencesincluded in the original applications do prevent errors. In con-trast, we observed errors in both ls-bh and ls-bh-nf , showingthat the fences included in ls-bh are insufficient.
We observe errors natively (no-str-) only for 3 chip-application combinations: 770-cbe-ht, K5200-cub-scan-nfand C2075-ls-bh. Only Titan, using the sys-str- environmentwas effective at exposing errors in sdk-red-nf
Comparing strategies Environments with sys-str stress arealways more capable (show errors in more applications andare effective in more applications) than any of the otherstressing strategies. In many cases, other stressing strategiesare only able to reveal weak behaviours in fewer than twoapplications, and are only effective for one application: cbe-ht.We did not find any applications for which cache-str, rand-stror no-str were able to reveal (or effectively reveal) errors notrevealed by sys-str.
With the exception of Titan, sys-str+ is the most effectiveenvironment for every chip. For Titan, the sys-str- strategyis more effective than sys-str+ for one application. On allchips except 980, sys-str+ revealed weak behaviours in everyapplication for which any environment could reveal weakbehaviours, and is effective for most applications.
Effectiveness of thread randomisation Thread randomisa-tion led to modest increases in effectiveness in most cases;although there were several exceptions, e.g. 980/rand-str.
Reported bugs The errors for ct-octree, cbe-dot, and cbe-htprovide empirical witnesses for the bugs reported via handanalysis in [8]. The unreported errors in ls-bh and tpo-tm havebeen acknowledged by the authors.
5. Program HardeningWe now turn to the problem of experimentally suppressingweak memory bugs by adding memory fences. While insert-ing fences to disallow weak memory bugs has been studiedfor CPUs (Sec. 7), these methods require a formal mem-ory model (e.g. as provided by the GPU languages OpenCL2.0 [24] and HSA [21]). Though foundations of a model forPTX [44] (the intermediate representation underlying CUDA)have been proposed [8], there is no agreed memory model forCUDA. Thus we have no means of formally validating thenecessity of fences. As a pragmatic alternative, we employour testing to suggest a minimal set of fences that sufficeto disallow weak memory bugs under our aggressive testingenvironment, a process we call empirical fence insertion; asdiscussed in Sec. 1 this can aid in understanding weak mem-ory bugs, and in hardening applications against such bugs.In future, the suggested fences could be used as a startingpoint for a verification effort if a suitable memory model (andaccompanying verification technique) become available.
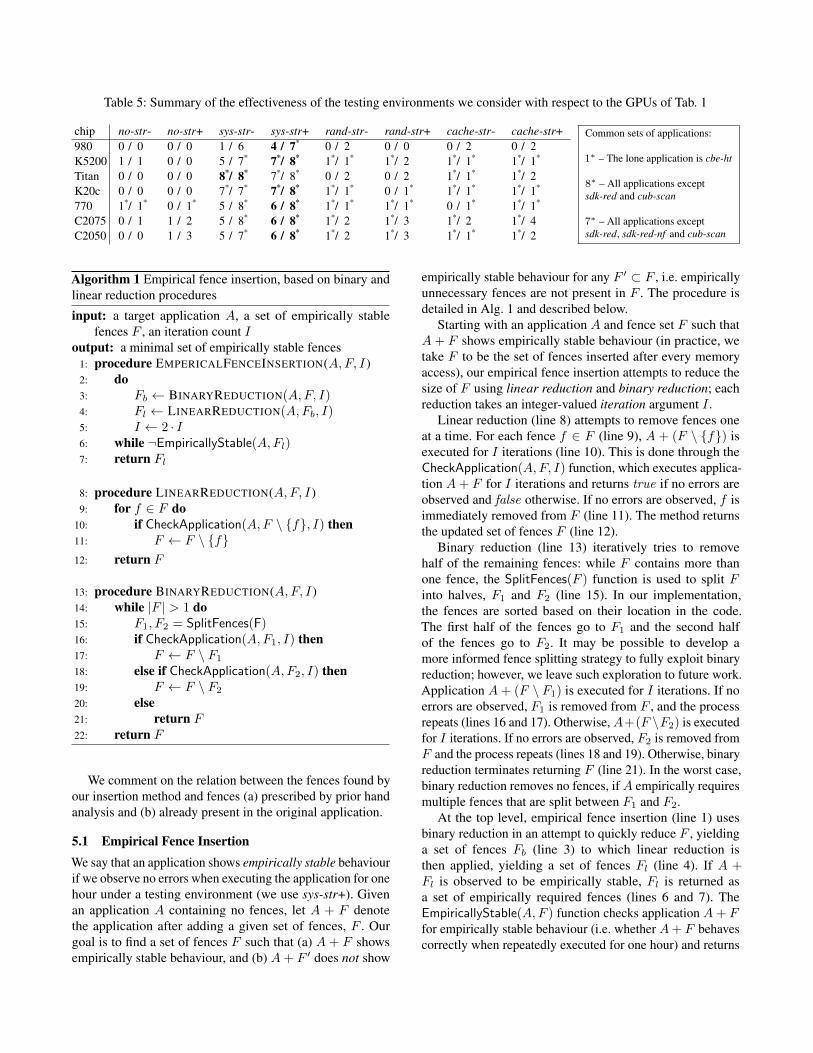
Table 5: Summary of the effectiveness of the testing environments we consider with respect to the GPUs of Tab. 1
chip no-str- no-str+ sys-str- sys-str+ rand-str- rand-str+ cache-str- cache-str+980 0 / 0 0 / 0 1 / 6 4 / 7* 0 / 2 0 / 0 0 / 2 0 / 2K5200 1 / 1 0 / 0 5 / 7* 7*/ 8* 1*/ 1* 1*/ 2 1*/ 1* 1*/ 1*
Titan 0 / 0 0 / 0 8*/ 8* 7*/ 8* 0 / 2 0 / 2 1*/ 1* 1*/ 2K20c 0 / 0 0 / 0 7*/ 7* 7*/ 8* 1*/ 1* 0 / 1* 1*/ 1* 1*/ 1*
770 1*/ 1* 0 / 1* 5 / 8* 6 / 8* 1*/ 1* 1*/ 1* 0 / 1* 1*/ 1*
C2075 0 / 1 1 / 2 5 / 8* 6 / 8* 1*/ 2 1*/ 3 1*/ 2 1*/ 4C2050 0 / 0 1 / 3 5 / 7* 6 / 8* 1*/ 2 1*/ 3 1*/ 1* 1*/ 2
Common sets of applications:
1∗ – The lone application is cbe-ht
8∗ – All applications exceptsdk-red and cub-scan
7∗ – All applications exceptsdk-red, sdk-red-nf and cub-scan
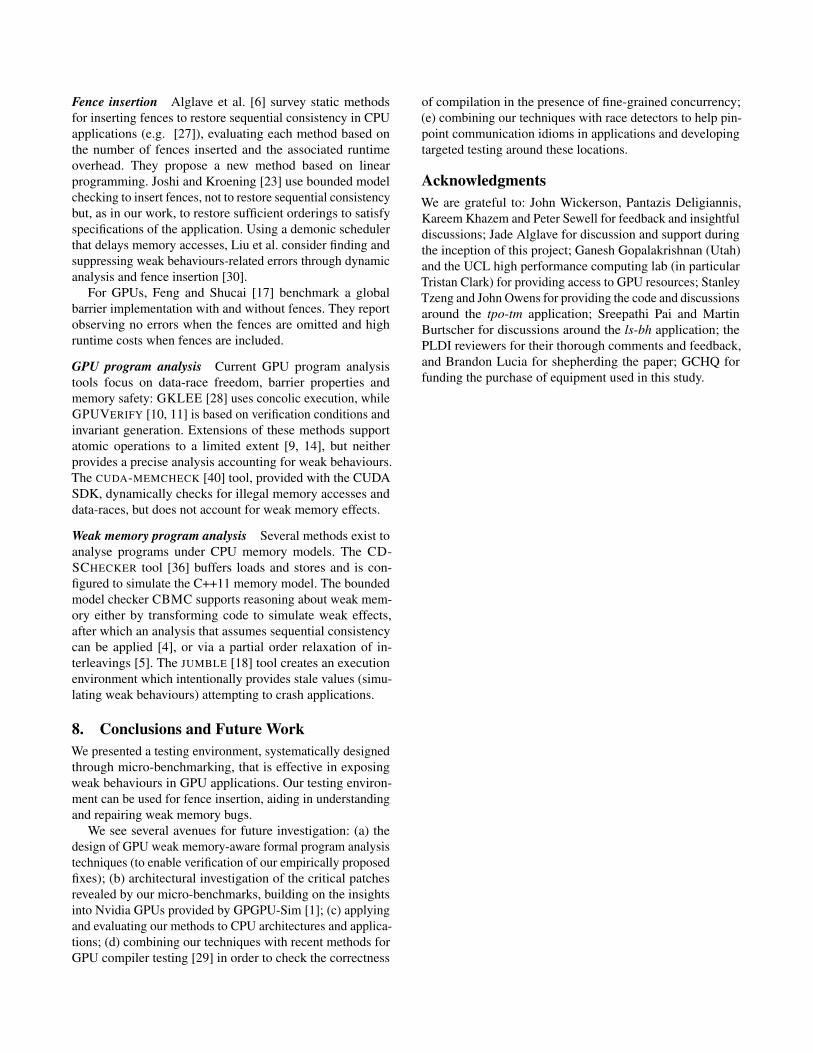
Algorithm 1 Empirical fence insertion, based on binary andlinear reduction procedures
input: a target application A, a set of empirically stablefences F , an iteration count I
output: a minimal set of empirically stable fences1: procedure EMPERICALFENCEINSERTION(A,F, I )2: do3: Fb ← BINARYREDUCTION(A,F, I)4: Fl ← LINEARREDUCTION(A,Fb, I)5: I ← 2 · I6: while ¬EmpiricallyStable(A,Fl)7: return Fl
8: procedure LINEARREDUCTION(A,F, I )9: for f ∈ F do
10: if CheckApplication(A,F \ {f}, I) then11: F ← F \ {f}12: return F
13: procedure BINARYREDUCTION(A,F, I )14: while |F | > 1 do15: F1, F2 = SplitFences(F)16: if CheckApplication(A,F1, I) then17: F ← F \ F1
18: else if CheckApplication(A,F2, I) then19: F ← F \ F2
20: else21: return F22: return F
We comment on the relation between the fences found byour insertion method and fences (a) prescribed by prior handanalysis and (b) already present in the original application.
5.1 Empirical Fence InsertionWe say that an application shows empirically stable behaviourif we observe no errors when executing the application for onehour under a testing environment (we use sys-str+). Givenan application A containing no fences, let A + F denotethe application after adding a given set of fences, F . Ourgoal is to find a set of fences F such that (a) A + F showsempirically stable behaviour, and (b) A+ F ′ does not show
empirically stable behaviour for any F ′ ⊂ F , i.e. empiricallyunnecessary fences are not present in F . The procedure isdetailed in Alg. 1 and described below.
Starting with an application A and fence set F such thatA+ F shows empirically stable behaviour (in practice, wetake F to be the set of fences inserted after every memoryaccess), our empirical fence insertion attempts to reduce thesize of F using linear reduction and binary reduction; eachreduction takes an integer-valued iteration argument I .
Linear reduction (line 8) attempts to remove fences oneat a time. For each fence f ∈ F (line 9), A + (F \ {f}) isexecuted for I iterations (line 10). This is done through theCheckApplication(A,F, I) function, which executes applica-tion A+ F for I iterations and returns true if no errors areobserved and false otherwise. If no errors are observed, f isimmediately removed from F (line 11). The method returnsthe updated set of fences F (line 12).
Binary reduction (line 13) iteratively tries to removehalf of the remaining fences: while F contains more thanone fence, the SplitFences(F ) function is used to split Finto halves, F1 and F2 (line 15). In our implementation,the fences are sorted based on their location in the code.The first half of the fences go to F1 and the second halfof the fences go to F2. It may be possible to develop amore informed fence splitting strategy to fully exploit binaryreduction; however, we leave such exploration to future work.Application A+ (F \ F1) is executed for I iterations. If noerrors are observed, F1 is removed from F , and the processrepeats (lines 16 and 17). Otherwise,A+(F \F2) is executedfor I iterations. If no errors are observed, F2 is removed fromF and the process repeats (lines 18 and 19). Otherwise, binaryreduction terminates returning F (line 21). In the worst case,binary reduction removes no fences, if A empirically requiresmultiple fences that are split between F1 and F2.
At the top level, empirical fence insertion (line 1) usesbinary reduction in an attempt to quickly reduce F , yieldinga set of fences Fb (line 3) to which linear reduction isthen applied, yielding a set of fences Fl (line 4). If A +Fl is observed to be empirically stable, Fl is returned asa set of empirically required fences (lines 6 and 7). TheEmpiricallyStable(A,F ) function checks application A+ Ffor empirically stable behaviour (i.e. whether A+ F behavescorrectly when repeatedly executed for one hour) and returns

Table 6: Empirical fence insertion results
inserted fences agreeing red. time (mins.)app. init. red. (Titan) chips min med maxcbe-ht 10 1 5 80 106 127cbe-dot 4 1 5 62 63 65ct-octree 33 1 5 67 69 735tpo-tm 28 1 4 63 67 124sdk-red-nf 6 1 4 63 72 258cub-scan-nf 51 2 4 90 116 1407ls-bh-nf 90 4 0 235 343 t.o
true if no errors are observed, and false otherwise. If theempirical stability check fails, then the iteration count Iused during reduction was not large enough. In this case,the reduction process restarts with the original fence set Fand iteration count 2 · I (line 5).
The role of iteration argument I is to attempt to acceleratefence insertion. Each call to CheckApplication could bereplaced by a call to EmpiricallyStable, which does not usethe iteration count I . Using CheckApplication may lead tofaster convergence because it runs for I iterations, whereasEmpiricallyStable always runs for one hour. The call toEmpiricallyStable at line 6 of Alg. 1 ensures that the final setof fences returned by the algorithm is empirically stable; if thecandidate fence set is not stable then the insertion procedureessentially restarts with a larger iteration count.
The fences returned by empirical fence insertion are de-pendent on the effectiveness of the testing environment andthe order in which fences are removed. If the fences are con-sidered deterministically (i.e. binary reduction splits the fenceset deterministically and linear reduction iterates through thefences set in a strict order), and if CheckApplication is deter-ministically able to find bugs, then empirical fence insertionwill deterministically return the same set of fences if appliedmultiple times to an application on a given GPU. However,because CheckApplication is based on testing, and is thusnon-deterministic, the empirically stable fence set returnedby empirical fence insertion may not be deterministic.
5.2 ResultsWe experiment with the applications that contain no fences(i.e. omitting sdk-red cub-scan and ls-bh). We use I = 32initially and sys-str+ as the testing environment (chosenbased on its effectiveness in Sec. 4), using a 24h timeoutper application.
For each application, Tab. 6 shows how many fenceswere provided in the initial state, i.e., when inserted afterevery memory access, and how many fences remained afterthe reduction methods converged on Titan (which oftenrevealed errors most frequently). We show the number ofcases (maximum of six) where fence insertion on other chipsfound the same fences as on Titan, as different chips mayfind different fences depending on how often testing revealserrors. The minimum, median, and maximum times (over
the results for all GPUs) for the reduction processes areshown. Due to the large amount of time required to run theseexperiments, we did not perform multiple runs per GPU forthis experiment.
In the case of all applications except cub-scan-nf and ls-bh-nf , insertion yielded a single fence on Titan. In most cases, thereduced fences found on other chips agree with the reducedfences found on Titan, showing that our method yields similarresults across chips. The outlier chip is 770, which neverfound fences that agreed with Titan, often finding fencesimmediately following (in program order) the fences foundon Titan. For example, in the cbe-dot application (Fig. 1),empirical fence insertion on the 770 placed the fence in thelock function (after line 19). All other chips placed thelock immediately prior to the unlock function (line 15). Ifwe consider the lock and unlock functions inlined, thetwo fencing solutions are a single memory instruction apart(line 15). The fence solution found by 770 is incorrect basedon the memory model proposed in [8], as a fence betweenthe critical section access (line 15) and the unlock operation(line 22) is required to ensure that the next thread enteringthe critical section observes up-to-date values. We have nohypothesis for why 770 finds such fences and attribute it to aquirk of the chip.
The other chip that found different fences from the major-ity was 980, which found no fences for sdk-red-nf and onlyone of the two fences for cub-scan-nf . The outlier applicationis ls-bh-nf , on which insertion for all chips timed out excepton Titan and K20. The K20 solution is a subset of the Titansolution, differing by one fence.
In six of the applications, at least half of the chips found areduced solution within two hours (median), and the fastesttook just over an hour (recall that one hour is required in orderto check for empirical stability). However we observed caseswhere the insertion method was inefficient. The timeouts inls-bh-nf are due to both the large number of initial fencesand the location of required fences (found by Titan)—binaryreduction was unable to remove fences at a course level ofgranularity.
Evaluating reduced results Here we discuss the fencesfound by empirical fence insertion (on Titan) and how theyrelate to existing hand analysis and fences existing in theoriginal application.
Prior hand analysis prescribed two fences for cbe-htand cbe-dot [8]. The inserted fence corresponds to one ofthese fences; the other prescribed fence is redundant witha dependency and was not found by insertion. The samehand analysis prescribed four fences for ct-octree, one ofwhich corresponds to the inserted fence. The other prescribedfences were either redundant with dependencies or involveda sequence of data-structure operations not occurring in theactual application.
The two inserted fences for cub-scan-nf correspond ex-actly to the provided fences in cub-scan, giving us high confi-

dence in the empirical solution. The reduced fence for sdk-red-nf does not correspond to the provided fence in sdk-red;this solution may be consistent with a temporally boundedmodel [34] where extra instructions in one communicatingthread can make up for the lack of fences in the other. Thereduced fences for ls-bh-nf are a superset of the fences inls-bh (as ls-bh showed errors with provided fences).
Because empirical fence insertion only hardens applica-tions, it may give even empirically unsound results; e.g. 770observes errors for sdk-red-nf (Tab. 5), but due to the in-frequency of observed errors, empirical fence insertion sug-gested no fences.
6. The Cost of FencesTo better understand the performance cost associated withfences in GPU applications, we benchmark the applications ofSec. 5 when run natively (i.e., without a testing environment)under two fencing configurations. We compare the runtimeand energy overhead w.r.t. the application containing nofences. Runtime is measured using CUDA events [41, p.56]. For energy, NVML [43] is used to query GPU powerusage throughout the execution. The average power readingis multiplied by the kernel runtime to estimate energy usage.Only K5200, Titan, K20, and C2075 support power queries.There are known inaccuracies when measuring GPU powerthis way [13, 16], thus we emphasise that our energy resultsare estimates. Results are averaged over 100 runs.
The two fencing strategies we consider are: a conservativefence strategy where a fence is placed after every memoryaccess (cons fences) and the fences found during empiricalfence insertion (emp fences). We consider emp fences ona per GPU basis, that is, a given GPU uses the fences itfound during empirical fence insertion. Thus, for a givenapplication, emp fences may be different across GPUs. Wecompare an application with these fencing strategies appliedto the application without fences (no fences). We recordperformance results only if the application passes the post-condition, otherwise the run is discarded and not counted aspart of the 100 runs. Because applications rarely exhibit weakbehaviours when run naively (see Sec. 4), this was not anissue.
Figure 5 shows two scatter plots (logarithmic scale): theleft graph shows energy consumption (in J) and the rightgraph shows runtime (in ms). Each point on the graph isa chip/application combination. A cross (resp. dot) withcoordinates (x, y) indicates that execution consumed anestimated x J (left) or took xms (right) with no fences, and anestimated y J (left) or y ms (right) with emp fences (resp. consfences). The distance between a point (above the diagonal)and the diagonal represents the cost of the fencing strategy.Points close to the diagonal indicate a low cost associatedwith inserting fences, while points further away indicate thatfences carry a higher cost.
102
103
104
102 103
{em
p.,c
ons.
} fe
nces
ene
rgy
(J)
no fences energy (J)
cons. fencesemp. fences
101
102
103
104
101 102
{em
p.,c
ons.
} fe
nces
run
time
(ms)
no fences runtime (ms)
cons. fencesemp. fences
Figure 5: Cost of reduced vs. {no, conservative} fences
There are a total of 93 and 54 data points for runtime andenergy respectively. The graphs omit ten outlier points forruntime and three for energy. Unsurprisingly, we see no pointsbelow the diagonal, showing fences never decrease cost. Wesee that generally cons fences cost more than emp fences,given that dots appear further from the diagonal than thecrosses. Runtime costs corresponds closely to energy costs(consistent with findings in, e.g. [50] for CPU systems). Wecomment on extreme cases for runtime comparisons (energycomparisons are similar) and give the median for both runtimeand energy costs.
Comparing the cost of cons fences to no fences, we ob-serve some dramatic results. The highest chip-applicationruntime cost is 35,120% for C2075/cbe-ht. In fact, for thethree oldest chips (770, C2075 and 2050) we observe simi-larly high costs in several applications. The newer chips showa less dramatic cost, the highest being 843% for K20/cbe-ht.The median runtime and energy costs are 174% and 171%respectively.
Comparing the cost of emp fences to no fences, we observesubstantially lower costs, which is to be expected given thatemp fences are a subset of cons fences. The highest cost is7052% for 770/cbe-ht. Like the previous comparisons, theoldest three chips have fairly extreme results; excluding thesechips the highest cost is 131% for K20/cbe-ht. The medianruntime and energy cost of emp fences are both very small(less than 3%). This can be seen on the graphs of Fig. 5 asmany crosses are very close to the diagonal.
7. Related WorkMemory model testing Testing for weak behaviours onhardware has largely been for litmus tests. The ARCHT-EST [15] tool and TSOTOOL [19] ran tests on systems withthe TSO memory model (e.g. x86 CPUs). The LITMUStool [3] runs tests on x86, IBM Power, and ARM chips. Lit-mus testing has recently been applied to GPUs with the toolGPU LITMUS [8]. Our work is inspired by GPU LITMUS;the relation between this work and GPU LITMUS is detailedat the end of Sec. 1.
Fence insertion Alglave et al. [6] survey static methodsfor inserting fences to restore sequential consistency in CPUapplications (e.g. [27]), evaluating each method based onthe number of fences inserted and the associated runtimeoverhead. They propose a new method based on linearprogramming. Joshi and Kroening [23] use bounded modelchecking to insert fences, not to restore sequential consistencybut, as in our work, to restore sufficient orderings to satisfyspecifications of the application. Using a demonic schedulerthat delays memory accesses, Liu et al. consider finding andsuppressing weak behaviours-related errors through dynamicanalysis and fence insertion [30].
For GPUs, Feng and Shucai [17] benchmark a globalbarrier implementation with and without fences. They reportobserving no errors when the fences are omitted and highruntime costs when fences are included.
GPU program analysis Current GPU program analysistools focus on data-race freedom, barrier properties andmemory safety: GKLEE [28] uses concolic execution, whileGPUVERIFY [10, 11] is based on verification conditions andinvariant generation. Extensions of these methods supportatomic operations to a limited extent [9, 14], but neitherprovides a precise analysis accounting for weak behaviours.The CUDA-MEMCHECK [40] tool, provided with the CUDASDK, dynamically checks for illegal memory accesses anddata-races, but does not account for weak memory effects.
Weak memory program analysis Several methods exist toanalyse programs under CPU memory models. The CD-SCHECKER tool [36] buffers loads and stores and is con-figured to simulate the C++11 memory model. The boundedmodel checker CBMC supports reasoning about weak mem-ory either by transforming code to simulate weak effects,after which an analysis that assumes sequential consistencycan be applied [4], or via a partial order relaxation of in-terleavings [5]. The JUMBLE [18] tool creates an executionenvironment which intentionally provides stale values (simu-lating weak behaviours) attempting to crash applications.
8. Conclusions and Future WorkWe presented a testing environment, systematically designedthrough micro-benchmarking, that is effective in exposingweak behaviours in GPU applications. Our testing environ-ment can be used for fence insertion, aiding in understandingand repairing weak memory bugs.
We see several avenues for future investigation: (a) thedesign of GPU weak memory-aware formal program analysistechniques (to enable verification of our empirically proposedfixes); (b) architectural investigation of the critical patchesrevealed by our micro-benchmarks, building on the insightsinto Nvidia GPUs provided by GPGPU-Sim [1]; (c) applyingand evaluating our methods to CPU architectures and applica-tions; (d) combining our techniques with recent methods forGPU compiler testing [29] in order to check the correctness
of compilation in the presence of fine-grained concurrency;(e) combining our techniques with race detectors to help pin-point communication idioms in applications and developingtargeted testing around these locations.
AcknowledgmentsWe are grateful to: John Wickerson, Pantazis Deligiannis,Kareem Khazem and Peter Sewell for feedback and insightfuldiscussions; Jade Alglave for discussion and support duringthe inception of this project; Ganesh Gopalakrishnan (Utah)and the UCL high performance computing lab (in particularTristan Clark) for providing access to GPU resources; StanleyTzeng and John Owens for providing the code and discussionsaround the tpo-tm application; Sreepathi Pai and MartinBurtscher for discussions around the ls-bh application; thePLDI reviewers for their thorough comments and feedback,and Brandon Lucia for shepherding the paper; GCHQ forfunding the purchase of equipment used in this study.

References[1] T. M. Aamodt and W. W. Fung. GPGPU-Sim 3.x man-
ual, 2015. http://gpgpu-sim.org/manual/index.php/GPGPU-Sim_3.x_Manual.
[2] D. A. F. Alcantara. Efficient Hash Tables on the GPU. PhDthesis, University of California, Davis, 2011.
[3] J. Alglave, L. Maranget, S. Sarkar, and P. Sewell. Litmus: Run-ning tests against hardware. TACAS, pages 41–44. Springer,2011.
[4] J. Alglave, D. Kroening, V. Nimal, and M. Tautschnig. Soft-ware verification for weak memory via program transformation.In ESOP, pages 512–532. Springer, 2013.
[5] J. Alglave, D. Kroening, and M. Tautschnig. Partial orders forefficient bounded model checking of concurrent software. InCAV, pages 141–157. Springer, 2013.
[6] J. Alglave, D. Kroening, V. Nimal, and D. Poetzl. Don’t siton the fence - A static analysis approach to automatic fenceinsertion. In CAV, pages 508–524. Springer, 2014.
[7] J. Alglave, L. Maranget, and M. Tautschnig. Herding cats:Modelling, simulation, testing, and data mining for weakmemory. ACM Trans. Program. Lang. Syst., 36(2):7:1–7:74,2014.
[8] J. Alglave, M. Batty, A. F. Donaldson, G. Gopalakrishnan,J. Ketema, D. Poetzl, T. Sorensen, and J. Wickerson. GPUconcurrency: Weak behaviours and programming assumptions.In ASPLOS, pages 577–591. ACM, 2015.
[9] E. Bardsley and A. F. Donaldson. Warps and atomics: Beyondbarrier synchronization in the verification of GPU kernels. InNFM, pages 230–245. Springer, 2014.
[10] A. Betts, N. Chong, A. Donaldson, S. Qadeer, and P. Thomson.GPUVerify: A verifier for GPU kernels. In OOPSLA, pages113–132. ACM, 2012.
[11] A. Betts, N. Chong, A. F. Donaldson, J. Ketema, S. Qadeer,P. Thomson, and J. Wickerson. The design and implementationof a verification technique for GPU kernels. ACM Trans.Program. Lang. Syst., 37(3):10, 2015.
[12] M. Burtscher, R. Nasre, and K. Pingali. A quantitative study ofirregular programs on GPUs. In IISWC, pages 141–151. IEEE,2012.
[13] M. Burtscher, I. Zecena, and Z. Zong. Measuring GPU powerwith the K20 built-in sensor. GPGPU, pages 28–36. ACM,2014.
[14] W. Chiang, G. Gopalakrishnan, G. Li, and Z. Rakamaric.Formal analysis of GPU programs with atomics via conflict-directed delay-bounding. In NFM, pages 213–228. Springer,2013.
[15] W. W. Collier. Reasoning About Parallel Architectures.Prentice-Hall, Inc., 1992. ISBN 0-13-767187-3.
[16] J. Coplin and M. Burtscher. Power characteristics of irreg-ular GPGPU programs. Workshop on Green Programming,Computing, and Data Processing (GPCDP), 2014.
[17] W. Feng and S. Xiao. To GPU synchronize or not GPUsynchronize? In International Symposium on Circuits andSystems (ISCAS), pages 3801–3804, 2010.
[18] C. Flanagan and S. N. Freund. Adversarial memory fordetecting destructive races. PLDI, pages 244–254. ACM, 2010.
[19] S. Hangal, D. Vahia, C. Manovit, and J.-Y. J. Lu. Tsotool:A program for verifying memory systems using the memoryconsistency model. ISCA ’04. IEEE Computer Society, 2004.
[20] B. He and J. X. Yu. High-throughput transaction executionson graphics processors. Proc. VLDB Endow., 4(5):314–325,2011.
[21] V. . HSA Foundation. HSA programmer’s reference manual,July 2015. http://www.hsafoundation.com/html/Content/PRM/Topics/PRM_title_page.htm.
[22] W.-m. W. Hwu. GPU Computing Gems Jade Edition. MorganKaufmann, 2011.
[23] S. Joshi and D. Kroening. Property-driven fence insertionusing reorder bounded model checking. In FM, pages 291–307.Springer, 2015.
[24] Khronos Group. OpenCL: Open Computing Language. http://www.khronos.org/opencl.
[25] L. Lamport. How to make a multiprocessor computer that cor-rectly executes multiprocess programs. IEEE Trans. Comput.,pages 690–691, Sept. 1979.
[26] N. M. Lê, A. Pop, A. Cohen, and F. Zappa Nardelli. Correctand efficient work-stealing for weak memory models. PPoPP’13, pages 69–80. ACM, 2013. ISBN 978-1-4503-1922-5.
[27] J. Lee and D. A. Padua. Hiding relaxed memory consistencywith a compiler. IEEE Trans. Comput., 50(8):824–833, Aug.2001.
[28] G. Li, P. Li, G. Sawaya, G. Gopalakrishnan, I. Ghosh, and S. P.Rajan. GKLEE: concolic verification and test generation forGPUs. In PPoPP, pages 215–224. ACM, 2012.
[29] C. Lidbury, A. Lascu, N. Chong, and A. F. Donaldson. Many-core compiler fuzzing. In PLDI, pages 65–76, 2015.
[30] F. Liu, N. Nedev, N. Prisadnikov, M. Vechev, and E. Yahav.Dynamic synthesis for relaxed memory models. In PLDI,pages 429–440, 2014.
[31] X. Mei and X. Chu. Dissecting GPU memory hierarchythrough microbenchmarking. CoRR, abs/1509.02308, 2015.URL http://arxiv.org/abs/1509.02308.
[32] D. Merrill, M. Garland, and A. Grimshaw. Scalable GPU graphtraversal. In PPoPP, pages 117–128. ACM, 2012.
[33] P. Misra and M. Chaudhuri. Performance evaluation of concur-rent lock-free data structures on GPUs. ICPADS, pages 53–60.IEEE, 2012.
[34] A. Morrison and Y. Afek. Temporally bounding TSO for fence-free asymmetric synchronization. In ASPLOS 2015, pages45–58. ACM.
[35] M. Nießner, M. Zollhöfer, S. Izadi, and M. Stamminger. Real-time 3D reconstruction at scale using voxel hashing. ACMTrans. Graph., 32(6):169:1–169:11, 2013.
[36] B. Norris and B. Demsky. CDSchecker: Checking concurrentdata structures written with C/C++ atomics. In OOPSLA, pages131–150. ACM, 2013.
[37] Nvidia. CUB, April 2015. http://nvlabs.github.io/cub/.
[38] Nvidia. CUDA C programming guide, version 7, March2015. http://docs.nvidia.com/cuda/pdf/CUDA_C_Programming_Guide.pdf.
[39] Nvidia. CUDA Code Samples, 2015. https://developer.nvidia.com/cuda-code-samples.
[40] Nvidia. CUDA-memcheck, 2015. https://developer.nvidia.com/CUDA-MEMCHECK.
[41] Nvidia. CUDA runtime API, March 2015. http://docs.nvidia.com/cuda/pdf/CUDA_Runtime_API.pdf.
[42] Nvidia. cuRAND, version 7, March 2015. http://docs.nvidia.com/cuda/pdf/CURAND_Library.pdf.
[43] Nvidia. NVML reference manual, March 2015.http://docs.nvidia.com/deploy/pdf/NVML_API_Reference_Guide.pdf.
[44] Nvidia. Parallel thread execution ISA: Version 4.2, March2015. http://docs.nvidia.com/cuda/pdf/ptx_isa_4.2.pdf.
[45] J. Sanders and E. Kandrot. CUDA by Example: An Introductionto General-Purpose GPU Programming. Addison-WesleyProfessional, 2010.
[46] D. J. Sorin, M. D. Hill, and D. A. Wood. A Primer on MemoryConsistency and Cache Coherence. Synthesis Lectures onComputer Architecture. Morgan & Claypool Publishers, 2011.
[47] J. A. Stuart and J. D. Owens. Efficient synchronizationprimitives for GPUs. CoRR, abs/1110.4623, 2011. URLhttp://arxiv.org/abs/1110.4623.
[48] S. Tzeng, A. Patney, and J. D. Owens. Task management forirregular-parallel workloads on the GPU. In HPG, pages 29–37,2010.
[49] S. Xiao and W. Feng. Inter-block GPU communication via fastbarrier synchronization. IPDPS, pages 1–12. IEEE, 2010.
[50] T. Yuki and S. Rajopadhye. Folklore confirmed: Compiling forspeed = compiling for energy. In Languages and Compilersfor Parallel Computing, pages 169–184. Springer, 2014.