extended overview of the living labs for information retrieval
TRANSCRIPT

Extended Overview of the Living Labs for InformationRetrieval Evaluation (LL4IR) CLEF Lab 2015
Anne Schuth1, Krisztian Balog2, and Liadh Kelly3
1 University of Amsterdam, The Netherlands2 University of Stavanger, Stavanger, Norway
3 ADAPT Centre, Trinity College, Dublin, [email protected], [email protected], [email protected]
Abstract. In this extended overview paper we discuss the first Living Labs forInformation Retrieval Evaluation (LL4IR) lab which was held at CLEF 2015.The idea with living labs is to provide a benchmarking platform for researchersto evaluate their ranking systems in a live setting with real users in their naturaltask environments. LL4IR represents the first attempt to offer such experimentalplatform to the IR research community in the form of a community challenge. Forthis first edition of the challenge we focused on two specific use-cases: productsearch and web search. Ranking systems submitted by participants were experi-mentally compared using interleaved comparisons to the production system fromthe corresponding use-case. In this paper we describe how these experiments wereperformed, what the resulting outcomes are, and provide a detailed analysis of theuse-cases and a discussion of ideas and opportunities for future development.
Keywords: Information retrieval evaluation, living labs, product search, web search.
1 Introduction
Evaluation is a central aspect of information retrieval (IR) research. In the past fewyears, a new evaluation paradigm known as living labs has been proposed, where theidea is to perform experiments in situ, with real users doing real tasks using real-worldapplications [13]. This type of evaluation, however, has so far been available only to(large) industrial research labs [16, 25]. Our main goal with the Living Labs for IREvaluation (LL4IR) CLEF Lab is to provide a benchmarking platform for researchersto evaluate their ranking systems in a live setting with real users in their natural taskenvironments. The lab acts as a proxy between commercial organizations (live envi-ronments) and lab participants (experimental systems), facilitates data exchange, andmakes comparison between the participating systems. This initiative is a first of its kindfor IR.
The first edition of the lab focuses on two use-cases and one specific notion of whata living lab is (with a view to expanding to other use-cases and other interpretations ofliving labs in subsequent years). Use-cases for the first lab are: product search (on ane-commerce site) and web search (through a large commercial web search engine). Foreach of the two use-cases, challenge participants receive a set of frequent queries along

with candidate documents for each of these queries. For the product search use-case,each document represents a product with attributes. This use-case also has actual querystrings and historical click log data. The other use-case, web-search, only provides fea-ture vectors. There is no content for documents nor query strings. The web-search use-case represents a typical learning to rank setting [17].
Given the queries and documents, participants produce rankings for each query andupload these rankings through an API. These rankings are evaluated online, on realusers, using an interleaved comparison method [20]. Interleaving performs a pairwisecomparison by presenting each user with a result list that is a combination of the rank-ings from the participant and the production systems. The results of these evaluations(interleaving outcomes) are made available to the participants, again, through an API.During the training period, participants are free to update their rankings using this feed-back information. It is not allowed to make changes to the rankings during the testphase. Using a shared API but considering two different application scenarios allows usto study how well online evaluation techniques generalize across domains.
The official CLEF evaluation round took place between May 1 and May 15, 2015.The positive feedback and growing interest from participants motivated us to organizea subsequent second evaluation round, from Jun 1 to Jun 15, 2015. We will refer tothese as Round #1 and Round #2 of the LL4IR Challenge, respectively. It is plannedthat further challenge rounds will be organized continuously (2 weeks every month) sothat participants do not have to wait for an annual event to test their developments.4
In the next section we provide a brief background on online evaluation. In Section 3we describe the LL4IR Challenge operation and give extensive details on our architec-ture. We then describe each of the two use-cases of the first edition of the lab in turn inSections 4 and 5, and provide details and analysis of the submissions received. Finally,in Section 6, we conclude the paper.
2 Background
In this section we firstly introduce related ideas regarding living labs in general. Wethen provide background on evaluation, and in particular on online evaluation.
2.1 Living Labs
Ideas for living labs for IR instances have been proposed over the last few years [2, 14].In particular, Azzopardi and Balog [2] describe in great detail what is need to go from amore traditional IR setting to a full fledged living lab scenario. Their setup bears manysimilarities to our setup, but differences can be found in that we restrict ourself to headqueries and that we view our living labs infrastructure purely as a proxy. Kelly et al.[14] focused more on a living lab setting as a solution to the evaluation of personalsearch. We do not have this focus.
The need for more realistic evaluation, involving real users, was reiterated at severalrecent IR workshops [1, 3, 12]. The Living Labs for Information Retrieval Evaluation
4 See http://living-labs.net/challenge/ for details on the continuous challenge.

(LL’13) workshop at CIKM two years ago was a first attempt to bring people, bothfrom academia and industry, together to discuss challenges and to formulate practicalnext steps. The workshop was successful in identifying and documenting possible fur-ther directions [3]. Our main goals now are to continue our community building effortsaround living labs for IR and to pursue the directions set out at LL’13. The first Liv-ing Labs for Information Retrieval Evaluation Challenge (LL4IR) lab at CLEF 20155
contributes towards this goal. Having a community benchmarking platform with sharedtasks is a key catalyst in enabling people to make progress in this area. Towards de-veloping the challenge for the CLEF lab, we dedicated a separate event in 2014, theLiving Labs Challenge (LLC) workshop6, to the testing and further development of ourchallenge platform.
Our initiative is a first of its kind for IR. CLEF Newsreel [6]7 is a similar initiative,but for a different problem domain: news recommendation. By contrast we are focus-ing on the very different space of information retrieval, which contains its own uniqueuse-cases, approaches, challenges, and researchers. Major differences between the labsinclude the presence of a query and, importantly, that our API lifts the real time pro-cessing requirements on the part of participants, lowering the participation thresholdsignificantly.
2.2 Evaluation
Evaluation has always played an important role in IR research. Traditionally, evalua-tion was performed offline following the Cranfield paradigm, using static test collec-tions [21]. This paradigm ensures reproducibility, however, real user satisfaction is notalways accurately reflected by this way of evaluating systems [27, 28]. An explanationfor the discrepancy is that the relevance judgments used in these static test collectionscome from expert annotators, not from the users themselves. This is one of the majorreasons for performing online evaluation: evaluation with users in the loop. It is alsoone of the main reasons for initiating our living labs for IR initiative. Initially, user in-teractions with IR systems were observed and metrics such as the click through rateand time to click were computed. These metrics then served as a means of comparingtwo systems. However, more recently, interleaved comparisons were shown to be twoorders of magnitude more sensitive than other ways of performing online evaluationsuch as A/B testing [7, 25]. This means that far fewer query impressions are requiredto make informed decisions on which ranker is better. In our living labs, we use inter-leaved comparisons as the main evaluation metric. Below we provide details on howinterleaving works.
Interleaved comparisons Many interleaving approaches have been proposed over thepast few years (for instance [9, 11, 19, 20, 23, 24]). By far the most frequently usedinterleaving algorithm to date is Team Draft Interleaving (TDI) [20] which is also whatis used in our living labs. Given a user query q, TDI produces an interleaved result list
5 See http://living-labs.net/clef-lab.6 See http://living-labs.net/llc.7 See http://www.clef-newsreel.org.

as follows. The algorithm takes as input two rankings. One ranking from the participantr′ = (a1, a2, . . .) and one from the production system r = (b1, b2, . . .). The goal is toproduce a combined, interleaved ranking L = (a1, b2, . . .). This is done analogue tohow sports teams may be constructed in a friendly sports match. The two team captainstake turns picking players. They can pick available documents (players) from the top ofthe rankings r′ and r, these top ranked document are deemed to be the best documents.Documents can only be picked once (even if they are listed in both r and r′). And theorder in which the documents are picked determines ranking L. In each round, the teamcaptains flip a coin to determine who goes first. The algorithm remembers which teameach document belongs to. If a document receives a click from a user, credit is assignedto the team the document belongs to. The team (participant or production system) withmost credit wins the interleaved comparison. This process is repeated for each query.For more details see the original paper describing TDI by Radlinski et al. [20] and alarge scale comparison of interleaving methods by Chapelle et al. [7].
3 The Living Labs Architecture
Our livings labs evaluation methodology heavily depends on a novel architecture whichwe describe in this section. We start with an overview, we then introduce the organiza-tion of our challenge, and we finish with implementation details.
3.1 Overview
For each of the use-cases, described in Sections 4 and 5, challenge participants takepart in a live evaluation process. For this they use a set of frequent queries as trainingqueries and a separate set of frequent queries as test queries. Candidate documents areprovided for each query along with historical information associated with the queries.When participants produce their rankings for each query, they upload these through theprovided LL4IR API. The commercial provider then interleaves a given participant’sranked list with their own ranking, and presents the user with the interleaved resultlist. Participants take turns in having their ranked list interleaved with the commercialprovider’s ranked list. This process of interleaving a single experimental system with theproduction system at a time is orchestrated by the LL4IR API, such that each participantgets about the same number of impressions. The actions performed by the users ofthe commercial provider’s system are then made available to the challenge participant(whose ranking was shown) through the API; i.e., the interleaved ranking, resultingclicks, and (aggregated) interleaving outcomes.
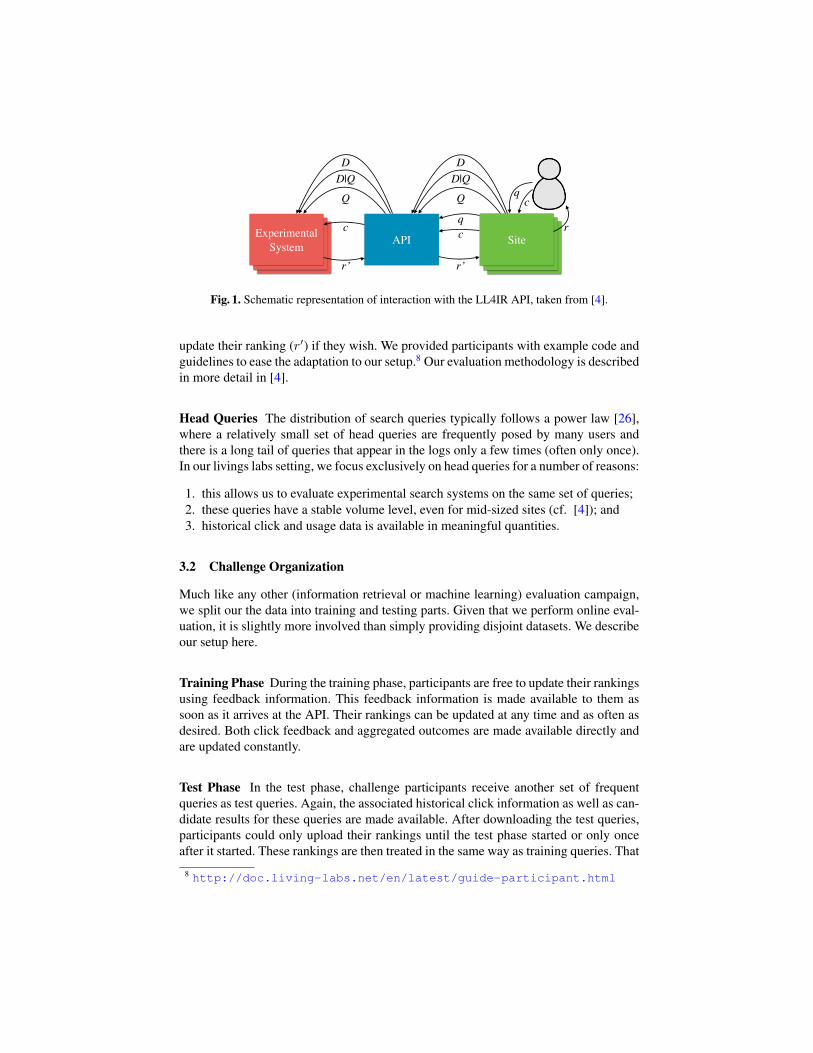
Figure 1 shows the Living Labs architecture and how the participant interacts withthe use-cases through the LL4IR provided API. As can be seen, frequent queries (Q)with candidate documents for each query (D|Q) are sent from a site through the APIto the experimental systems of participants. These systems upload their rankings (r′)for each query to the API. When a user of the site issues one of these frequent queries(q), then the site requests a ranking (r′) from the API and presents it interleaved withr to the users. Any interactions (c) of the user with this ranking are sent back to theAPI. Experimental systems can then obtain these interactions (c) from the API and
ParticipantParticipant SiteSiteAPI SiteExperimental System
q
rq
r’r’
Q
D|QD
c
cc
Q
D|QD
Fig. 1. Schematic representation of interaction with the LL4IR API, taken from [4].
update their ranking (r′) if they wish. We provided participants with example code andguidelines to ease the adaptation to our setup.8 Our evaluation methodology is describedin more detail in [4].
Head Queries The distribution of search queries typically follows a power law [26],where a relatively small set of head queries are frequently posed by many users andthere is a long tail of queries that appear in the logs only a few times (often only once).In our livings labs setting, we focus exclusively on head queries for a number of reasons:
1. this allows us to evaluate experimental search systems on the same set of queries;2. these queries have a stable volume level, even for mid-sized sites (cf. [4]); and3. historical click and usage data is available in meaningful quantities.
3.2 Challenge Organization
Much like any other (information retrieval or machine learning) evaluation campaign,we split our the data into training and testing parts. Given that we perform online eval-uation, it is slightly more involved than simply providing disjoint datasets. We describeour setup here.
Training Phase During the training phase, participants are free to update their rankingsusing feedback information. This feedback information is made available to them assoon as it arrives at the API. Their rankings can be updated at any time and as often asdesired. Both click feedback and aggregated outcomes are made available directly andare updated constantly.
Test Phase In the test phase, challenge participants receive another set of frequentqueries as test queries. Again, the associated historical click information as well as can-didate results for these queries are made available. After downloading the test queries,participants could only upload their rankings until the test phase started or only onceafter it started. These rankings are then treated in the same way as training queries. That
8 http://doc.living-labs.net/en/latest/guide-participant.html

is, they are interleaved with the commercial providers’ rankings for several weeks. Asfor the training phase, in the test phase each challenge participant is given an approxi-mately equal number of impressions. A major difference is that for the test queries, theclick feedback is not made available. Aggregated outcomes are provided only after thetest phase ends.
As detailed before, the official CLEF evaluation phase took place between May 1and May 15, 2015. The positive feedback and growing interest from participants moti-vated us to organize a subsequent second evaluation round, from Jun 1 to Jun 15, 2015.We will refer to these as Round #1 and Round #2 of the LL4IR Challenge, respectively.It is planned that further challenge rounds will be organized continuously (2 weeksevery month) so that participants do not have to wait for an annual event to test theirdevelopments.
3.3 Evaluation Metric
The overall evaluation of challenge participants is based on the final system perfor-mance, and additionally on how the systems performed at each query issue. The primarymetric used is aggregated interleaving outcomes, and in particular we are interested inthe fractions of winning system comparisons.
Interleaved comparisons In Section 2.2 we provided details on how interleaving,and in particular Team Draft Interleaving (TDI) [20], works. TDI is used by both ouruse-cases. There are two reasons for using interleaved comparisons. Firstly, interleavedcomparisons were shown to be two orders of magnitude more sensitive than other waysof performing online evaluation such as A/B testing [7, 25]. Secondly, interleaved com-parisons ensure that at least half the ranking shown to users comes from the productionsystem. This reduces the risk of showing bad rankings to users.
Aggregated Outcomes We report the following aggregated interleaving metrics, whereOutcome serves as the primary metric for comparing participants rankings. These ag-gregations are constantly updated for training queries. For the test phase they are onlycomputed after the phase is over.
#Wins is defined as the number of wins of the participant against the production sys-tem, where a win is defined as the experimental system having more clicks on re-sults assigned to it by TDI than clicks on results assigned to the production system;
#Losses is defined as the number of losses against the production system;#Ties is defined as the number of ties with the production system;#Impressions is the total number of times when rankings (for any of the test queries)
from the participant have been displayed to users of the production system; andOutcome is defined as the fraction of wins, so #Wins/(#Wins+#Losses).
An Outcome value below the expected outcome (typically 0.5) means that the partici-pant system performed worse than the production system (i.e., overall it has more lossesthan wins). Significance of outcomes is tested using a two-sided binomial test whichuses the expected outcome; p-values are reported.

Table 1. Overview of API endpoints with a short description. For a full descrip-tion including examples, please see http://doc.living-labs.net/en/latest/api-participant.html.
Method Endpoint Description
GET /api/participant/query/(key) Obtain the query set. Each query is markedwith its type.
GET /api/participant/doclist/(key)/(qid) Retrieve the document list for a query. Thisdoclist defines the set documents that are re-turnable for a query.
GET /api/participant/doc/(key)/(docid) Retrieve the actual content of a single doc-ument.
PUT /api/participant/run/(key)/(qid) Submit a run (ranking) for a specific query.GET /api/participant/feedback/(key)/(qid)/(runid) Obtain feedback for a query. Only feedback
for runs by the given participant will be re-turned.
GET /api/participant/outcome/(key)/(qid) Obtain outcomes. Outcome will be aggre-gated per site and for test and train queries.
Note that using these metrics, we are in theory only able to say something aboutthe relationship between the participant’s system and the production system. However,Radlinski et al. [20] show experimentally that it is not unreasonable to assume transitiv-ity. This allows us to also draw conclusions about how systems compare to each other.Ideally, instead of interleaving, we would have used multileaved comparison meth-ods [23, 24] which would directly give a ordering over rankers by comparing them allat once for each query. However, multileaved comparisons could potential impact usersmore than they would be impacted by interleaving. Moreover, multileaved comparisonmethods are not yet as established as an evaluation method.
3.4 Implementation
Our living labs API, as shown in Figure 1 and described in Section 3.1, is a middlemanfor queries, rankings and clicks. The API talks to both sites (the use-cases) and partici-pants (the researchers). In this paper, we only describe how it interacts with participants.The interaction with sites is described in detail in the documentation.9
Our API is implemented as a REST-full service, meaning that communication usesthe HTTP protocol and that URLs describe resources. All communication is encodedin JSON. Table 1 lists all the endpoints participants can communicate with. Below wedescribe them in some more detail.
Queries Participants would typically start by downloading the head queries for eachuse-case. They can do so using this endpoint:
GET /api/participant/query/(key)
9 For our documentation, see http://doc.living-labs.net.

The only parameter the participant needs to provide is the key which is their API key.Note that participants will only receive queries for the use-case they signed up for.
Each query is marked with its type. A query can be a “train” or “test” query indicat-ing the phase they belong to, see Section 3.2. The default query type is “train”. Querieshave an identifier (qid) and, depending on the use-case, an actual query string (qstr).Participants should regularly update their query set. An example output would look likethis:
{"queries": [
{"creation_time": "Mon, 10 Nov 2014 17:42:24 -0000","qid": "S-q1","qstr": "jaguar","type": "train"
}, ...]}
Candidate documents Secondly, for each query, a set of candidate documents is pro-vided. In order to obtain these, this endpoint is used:
GET /api/participant/doclist/(key)/(qid)
The set of documents is provided as a list of document identifiers. This list can changeover time as new documents arrive or old documents go stale. See the example output:
{"qid": "S-q22","doclist": [
{"docid": "S-d3" },{"docid": "S-d5"},{"docid": "S-d10"}, ...]
}
Note that depending on the use-case, relevance signals may also be provided for eachdocument. See Section 5 for details.
Documents details Lastly, participants will need the actual content of documents. Theendpoint we provide for this purpose is:
GET /api/participant/doc/(key)/(docid)
An example document would look like this:
{"content": {"description": "Lorem ipsum dolor",
"short_description" : "Lorem", ...}"creation_time": "Sun, 27 Apr 2014 23:40:29 -0000","docid": "S-d1",

"title": "Document Title","site_id": "S"
}
The content of the document can be a simple string, or potentially it can have structure.In which case it would be a JSON object. Note that depending on the use-case, thesedocuments may be empty, again see Section 5 for details.
Run After the participant obtains queries, candidate document sets and the content ofdocuments, runs (rankings) can be prepared. These runs can then be uploaded by theparticipant to the API using this endpoint:
PUT /api/participant/run/(key)/(qid)
An example run would look like this:
{"qid": "S-q22","runid": "82""creation_time": "Wed, 04 Jun 2014 15:03:56 -0000","doclist": [
{"docid": "U-d4"},{"docid": "U-d2"}, ... ]
}
This run provides the query for which it is a ranking (qid) and it provides a runid.Note that the runid is only for the participants own bookkeeping. It could be anystring, for instance a timestamp or the version of the ranker.
Once uploaded, the run is displayed to users (interleaved with the commercial pro-vider’s results) when the given query is issued. If other participants also uploaded aranking for this query, the run to show to the given user is sampled uniformly from theavailable runs.
Note that for test queries (cf., Section 3.2) the runs can only be submitted before atest phase starts. Our API will reject runs for test queries during the testing phase.
Feedback Once runs are submitted and exposed to users, their interactions are logged.The interactions with their own runs can be retrieved by participants using the feedbackendpoint:
GET /api/participant/feedback/(key)/(qid)/(runid)
An example of feedback returned by our API would look like this:
{"feedback": [
{"qid": "S-q1","runid": "baseline","type": "tdi",

"doclist": [{
"docid": "S-d1","clicked": false,"team": "site",
},{
"docid": "S-d4","clicked": true,"team": "participant",
},]
}, ...]}
In this feedback, the ranking that was shown to the user is provided for train queries (cf.,Section 3.2). The runid is simply the run identifier provided by the participant. Theranking in the above example was a TDI ranking (cf., Section 2.2), an interleaving ofthe participant’s run with the production ranking from the site. The team field shows towhich team each document was assigned. The clicked field simply indicates whetherthe document was clicked. This feedback is per impression, so not aggregated. Note thatthere can be multiple feedbacks for the same runid. Participants can use the feedbackas they see fit, but typically one would compute whether the site or the participant wonthe interleaved comparisons, see Section 2.2 for details on how to do this.
Outcome Finally, all interactions of users with the runs from participants can be ag-gregated into outcomes. These aggregated results are provided as an API endpoint at:
GET /api/participant/outcome/(key)/(qid)
An example outcome would look like this:
{"outcomes": [
{"type": "test","test_period": {
"start": "Fri, 01 May 2015 00:00:00 -0000""end": "Sat, 16 May 2015 00:00:00 -0000","name": "CLEF LL4IR Round #1",
},"impressions": 10,"losses": 3,"ties": 5,"wins": 2"outcome": "0.4",
}, ...]}

In this example, we see the aggregation of outcomes over 10 impressions of the runsfrom a single participant for a single query; the participant lost more impressions thanit won. The query identifier qid can be omitted in which case the outcome wouldbe aggregated over all queries. Outcomes are split out per train and test phase (cf.,Section 3.2). In case the participant participated in multiple test phases with the samequery, multiple aggregations are shown.
4 Use-case 1: Product Search
4.1 Task and Data
The product search use-case is provided by REGIO Jatek (REGIO Toy in English), thelargest (offline) toy retailer in Hungary with currently over 30 stores. Their webshop10
is among the top 5 in Hungary. The company is working on strengthening their on-line presence; improving the quality of product search in their online store is directedtowards this larger goal. An excerpt from the search result page is shown in Figure 2.
As described in Section 3, we distinguish between training and test phases. Queriesare sampled from the set of frequent queries; these queries are very short (1.18 terms onaverage) and have a stable search volume. For each query, a set of candidate products(approximately 50 products per query) and historical click information (click throughrate) is made available. For each product a structured representation is supplied (seebelow). The task then is to rank the provided candidate set.
Product Descriptions For each product a fielded document representation is provided,containing the attributes shown in Table 2. The amount of text available for individualproducts is limited (and is in Hungarian), but there are structural and semantic annota-tions, including:
– Organization of products into a two-level deep topical categorization system;– Toy characters associated with the product (Barbie, Spiderman, Hello Kitty, etc.);– Brand (Beados, LEGO, Simba, etc.);– Gender and age recommendations (for many products);– Queries (and their distribution) that led to the given product.
Candidate Products The candidate set, to be ranked, contains all products that wereavailable in the (recent) past. This comprises all products that are considered by thesite’s production search engine (in practice: all products that contain any of the queryterms in any of their textual fields). One particular challenge for this use-case is that theinventory (as well as the prices) are constantly changing; however, for challenge partic-ipants, a single ranking will be used throughout the entire test period of the challenge,without the possibility of updating it. The candidate set therefore also includes productsthat may not be available at the moment (but might become available again in the fu-ture). Participating systems were strongly encouraged to consider all products from the
10 http://www.regiojatek.hu/

Fig. 2. Screenshot of REGIO, our product search use-case.
provided candidate set. Those that were unavailable at a given point in time were notdisplayed to users of the REGIO online store. Further, it may happen (and as we showin Section 4.3 it indeed does happen) during the test period that new products arrive;

Table 2. Fielded document representation of products in the product search use-case.
Field Description
age max Recommended maximum age (may be empty, i.e., 0)age min Recommended minimum age (may be empty, i.e., 0)arrived When the product arrived (first became available); only for products that
arrived after 2014-08-28available Indicates if the product is currently available (1) or not (0)bonus price Provided only if the product is on sale; this is the new (sales) pricebrand Name of the brand (may be empty)category Name of the (leaf-level) product categorycategory id Unique ID of the (leaf-level) product categorycharacters List of toy characters associated with the product (may be empty)description Full textual description of the product (may be empty)main category Name of the main (top-level) product categorymain category id Unique ID of the main (top-level) product categorygender Gender recommendation. (0: for both girls and boys (or unclassified);
1: for boys; 2: for girls)photos List of photos about the productprice Normal priceproduct name Name of the productqueries Distribution of (frequent) queries that led to this product (may be
empty)short description Short textual description of the product (may be empty)
experimental systems are not able to include these in their ranking (this is the samefor all participants), while the production system might return them. This can poten-tially affect the number of wins against the production system (to the advantage of theproduction system), but it will not affect the comparison across experimental systems.
4.2 Implementation
While we do not want to get into technical details here, there are three specific issuesworth mentioning regarding the interleaving implementation at the site’s end. First,search typically involves a pipeline of components: query analysis (including, e.g., spellcorrection), ranking, filtering (e.g., considering facets), and finally presenting the SERP(with pagination, etc.). It is important that interleaving takes place in the ranking com-ponent, before any filtering is applied. Second, the rankings submitted by participantsmay include products that are currently not available. These need to be removed be-fore the interleaving is performed. Finally, the same user should be presented with thesame (interleaved) ranking for a given query throughout her session (in case the queryis issued multiple times); this caching mechanism needs to be implemented by the site.
4.3 Inventory Changes
One peculiarity of the product search use-case is that the inventory is subject to fre-quent changes. Not all products that are part of the candidate set are available at all

New arrivalBecame availableBecame unavailable
Days
#Pro
duct
s
−40
−20
020
4060
80−
40−
200
2040
6080
05−01 05−03 05−05 05−07 05−09 05−11 05−13 05−15
Fig. 3. Inventory changes during Round #1 of the challenge.
times. Also, new products may arrive over time that are not available to experimentalsystems but do get returned by the production system (and hence get clicked by users).We further note that new arrivals are displayed distinctively in the webshop, which mayalso introduce a bias. Figure 3 displays the number of new arrivals (in green), and theproducts that became available (blue) or unavailable (red) from the day before. Onlyproducts that are candidates for any of the queries (either training or test) are consid-ered. This figure shows absolute numbers. It is apparent that changes do occur, and inparticular a great number of new products arrive. (This is actually the least desired typeof change, as there is no easy way of dealing with it in our current platform.) An evenmore revealing statistic would be to measure the ratio of products that were unavailableat a given day, compared to all candidate products that were ever available during thetest phase. This is shown in Figure 4. Note that unavailability ratio is specific to a givenranking; the reported numbers are computed for the organizers’ baseline. To keep thingssimple, we use a single value, the average unavailability ratio of all submitted rankings,which is 44%.
If all products were available, the expected probability of winning an interleavedcomparison (assuming a randomly clicking user) would be 0.5. However, on average,44% of the products were actually unavailable. During Round #1, these products wereonly ever present in the participants ranking (the site’s ranking never considered them).And, only after interleaving were these products removed from the resulting interleavedlist. We note that this is undesired behavior, as they should have been filtered out beforeinterleaving. The necessary adjustments were made to the implementation for Round #2of the challenge. As for interpreting the Round #1 results, this means that the chancesfor products from the participants ranking to be clicked were reduced. We believe that

● ● ● ● ● ● ● ● ● ● ● ● ● ● ●
Days
Una
vaila
bilit
y ra
tio
05−01 05−03 05−05 05−07 05−09 05−11 05−13 05−15
0.3
0.4
0.5
0.6
Fig. 4. Unavailability ratio for the organizers’ baseline during Round #1 of the challenge.
this in turn reduces the expected probability to win to:
P (participant > site) = (1− 0.44) · 0.5 = 0.28.
Consequently, if a participant’s system wins more than in 28% of the impressions, thenthis is more than expected. And thus the participant’s system can be said to be betterthan the site’s system if the outcome is (significantly) more than 28%. Importantly, thisapplies only to Round #1. For Round #2, the probability of winning an interleavingcomparison is 50%, therefore an outcome above 0.5 is needed to beat the productionsystem.
4.4 Submissions
Two organizations submitted a total of four runs for Round #1. For Round #2, threeorganizations submitted five runs in total. In addition, a simple baseline provided bythe challenge organizers is also included for reference. Table 3 presents an overview ofparticipating teams.
Team GESIS [22] downloaded the entire products’ metadata set and associatedclick-through-rate provided by the lab’s API. All available metadata was indexed field-based into a fresh Solr installation. They applied no language specific configurationsfor stemmers or stop word lists, as these are not available for Hungarian in the standardconfiguration of Solr (in fact there is a Hungarian stemmer, but it did not provide dif-ferent results to the general one). Using the original query strings and ids they obtaineda Solr-ranked list of documents for each query. These results were re-ranked using his-torical click rates. The re-ranking is a linear combination of a boosted search on thedocument id and the vector space-based relevance score of the query string. This is atypical “the rich are getting richer” approach where formally successful products are
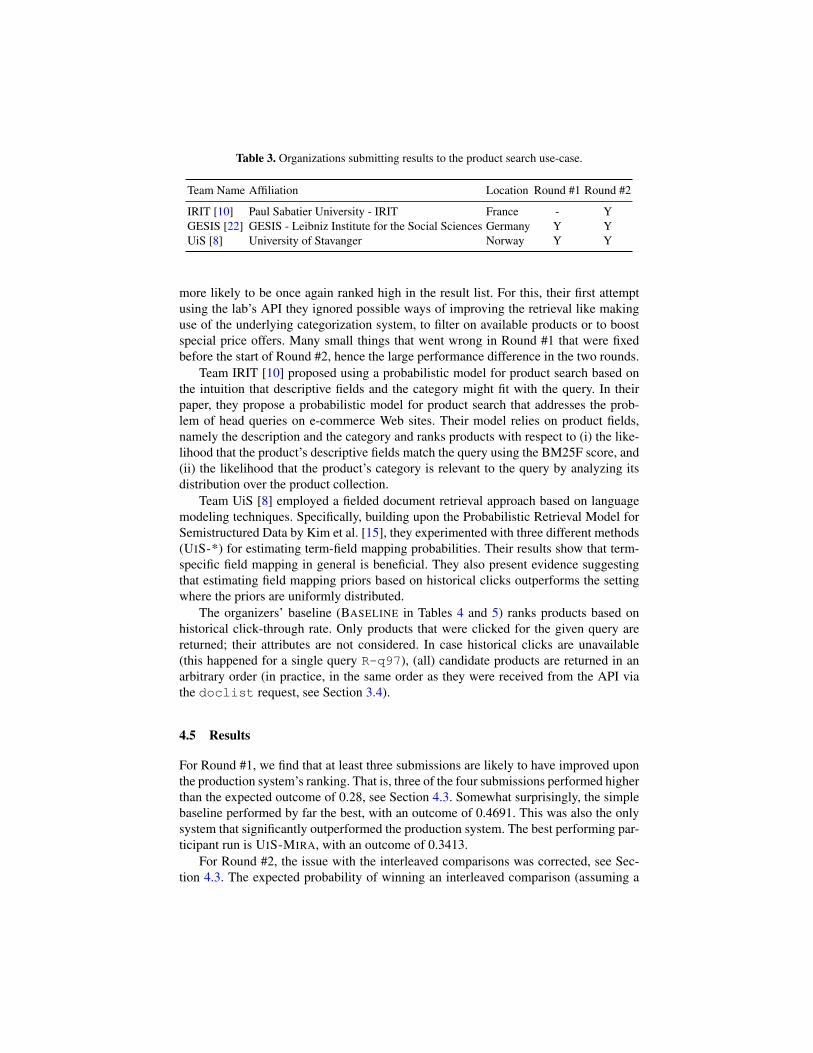
Table 3. Organizations submitting results to the product search use-case.
Team Name Affiliation Location Round #1 Round #2
IRIT [10] Paul Sabatier University - IRIT France - YGESIS [22] GESIS - Leibniz Institute for the Social Sciences Germany Y YUiS [8] University of Stavanger Norway Y Y
more likely to be once again ranked high in the result list. For this, their first attemptusing the lab’s API they ignored possible ways of improving the retrieval like makinguse of the underlying categorization system, to filter on available products or to boostspecial price offers. Many small things that went wrong in Round #1 that were fixedbefore the start of Round #2, hence the large performance difference in the two rounds.
Team IRIT [10] proposed using a probabilistic model for product search based onthe intuition that descriptive fields and the category might fit with the query. In theirpaper, they propose a probabilistic model for product search that addresses the prob-lem of head queries on e-commerce Web sites. Their model relies on product fields,namely the description and the category and ranks products with respect to (i) the like-lihood that the product’s descriptive fields match the query using the BM25F score, and(ii) the likelihood that the product’s category is relevant to the query by analyzing itsdistribution over the product collection.
Team UiS [8] employed a fielded document retrieval approach based on languagemodeling techniques. Specifically, building upon the Probabilistic Retrieval Model forSemistructured Data by Kim et al. [15], they experimented with three different methods(UIS-*) for estimating term-field mapping probabilities. Their results show that term-specific field mapping in general is beneficial. They also present evidence suggestingthat estimating field mapping priors based on historical clicks outperforms the settingwhere the priors are uniformly distributed.
The organizers’ baseline (BASELINE in Tables 4 and 5) ranks products based onhistorical click-through rate. Only products that were clicked for the given query arereturned; their attributes are not considered. In case historical clicks are unavailable(this happened for a single query R-q97), (all) candidate products are returned in anarbitrary order (in practice, in the same order as they were received from the API viathe doclist request, see Section 3.4).
4.5 Results
For Round #1, we find that at least three submissions are likely to have improved uponthe production system’s ranking. That is, three of the four submissions performed higherthan the expected outcome of 0.28, see Section 4.3. Somewhat surprisingly, the simplebaseline performed by far the best, with an outcome of 0.4691. This was also the onlysystem that significantly outperformed the production system. The best performing par-ticipant run is UIS-MIRA, with an outcome of 0.3413.
For Round #2, the issue with the interleaved comparisons was corrected, see Sec-tion 4.3. The expected probability of winning an interleaved comparison (assuming a

Table 4. Round #1 results for the product search use-case ordered by Outcome. The expectedoutcome under a randomly clicking user for is 0.28, see Section 4.3. P-values are computed usinga binomial test.
Submission Outcome #Wins #Losses #Ties #Impressions p-value
BASELINE 0.4691 91 103 467 661 < 0.01UIS-MIRA [8] 0.3413 71 137 517 725 0.053UIS-JERN [8] 0.3277 58 119 488 665 0.156UIS-UIS [8] 0.2827 54 137 508 699 0.936Expected Outcome 0.28GESIS [22] 0.2685 40 109 374 523 0.785
Table 5. Round #2 results for the product search use-case ordered by Outcome. The expectedoutcome under a randomly clicking user for is 0.5. P-values are computed using a binomial test.
Submission Outcome #Wins #Losses #Ties #Impressions p-value
BASELINE 0.5284 93 83 598 774 0.498Expected Outcome 0.5UIS-JERN [8] 0.4795 82 89 596 767 0.646GESIS [22] 0.4520 80 97 639 816 0.229UIS-MIRA [8] 0.4389 79 101 577 757 0.117UIS-UIS [8] 0.4118 84 120 527 731 0.014IRIT [10] 0.3990 79 119 593 791 0.005
randomly clicking user) in this round then was 0.5. In this round no submission out-performed the production system. However, the baseline, still somewhat surprisingly,performed the best albeit not significantly better than the production system. Given thatthe corrected outcome in Round #1 is only an estimate (that might be biased in favor ofthe submissions), we regard the Round #2 results a more accurate reflection of systemperformance.
Apart from the fact that none of the submission systems outperformed the produc-tion system in this round, their relative performance also changed. Where UIS-JERNcame second in Round #1, it won in Round #2, which is more in line with the expecta-tion of the team that submitted this system and the one it overtook. Even more strikinglyis the large jump in relative system performance for GESIS. This can most likely beexplained by numerous fixes to problems encountered in Round #1. Other than thisit is hard to draw any conclusions from these differences as almost all of them haveextremely high p-values. We would require more data in order to obtain more stableresults before we can draw any conclusions.

18
Fig. 5. Screenshot of Seznam, our web search use-case.
5 Use-case 2: Web Search
5.1 Task and Data
The web search use-case is provided by Seznam,11 a very large web search engine inthe Czech Republic. See Figure 5 for a screenshot of the user interface.
Seznam serves almost half the country’s search traffic and as such has very highsite traffic. Queries are the typical web search queries, and thus are a mixed bag oftransactional, navigational and transactional [5]. In contrast to the product search use-case, apart from the scale and the query types, Seznam does not make raw documentand query content available, rather features computed for documents and queries. Thisis much like any learning to rank dataset, such as Letor [18]. Queries and documentsare only identified by a unique identifier and for each query, the candidate documentsare represented with sparse feature vectors. Seznam provided a total of 557 features.These features were not described in any way. The challenge with this use-case then isa learning to rank challenge [17].
As described in Section 3, the web search use-case also consists of a training andtest phase. For the test phase, there were 97 queries. For the training phase 100 querieswere provided. On average, for each query there were about 179 candidate documents.In total, there were 35,322 documents.
11 http://search.seznam.cz

19
5.2 Implementation
Every time one of the selected queries is issued by a user for the first time, Seznammakes a call to our API while simultaneously calling the production rankers. When ourAPI responds too slow (> 100ms) it is ignored completely and the production rankingis shown. When our API does respond in time, the participants’ ranking is interleavedwith the production ranking. Seznam implemented Team Draft Interleaving (TDI) [20]themselves. Users are always provided with stable rankings, so if a user issues the samequery twice, a cached results is shown. Seznam implements this caching mechanism.
5.3 Results
The web search use-case attracted 6 teams that submitted runs for the training queries.However, none of these teams submitted runs for the test queries. Therefore, we canonly report on two baseline systems, provided by the challenge organizers. Baseline 1,titled EXPLOITATIVE BASELINE in Tables 6 and 7, uses the original Seznam rankingand was therefore expected to produce an outcome of 0.5.12 Baseline 2, titled UNIFORMBASELINE in Tables 6 and 7, assigned uniform weights to each feature and ranked bythe weighted sum of feature values. This baseline was expected to not perform well.
Over the past months, there have been over 480K impressions on Seznam throughour Living Labs API. On average this amounts to 2,428 impressions for each query. Ap-proximately 6% of all impressions were used for the testing period. As can be seen inTable 6, the EXPLOITATIVE BASELINE outperformed the production system. An out-come (outcome measure described in Section 3) of 0.5527 was achieved, with 3,030wins and 2,452 losses against the production system, and 19,055 ties with it. As ex-pected, the UNIFORM BASELINE lost many more comparisons than it won. Both out-comes were statistically significant according to a binomial test.
Results for Round #2 are qualitatively the same as for Round #1. There were ap-proximately the same number of impressions during this period and again one baselineis better and one worse than the expected outcome. Both significantly so. Both baselinesdid improve upon themselves though. This is a rather surprising result as the baselinesdid not update their rankings after Round #1 and therefore it is likely that some docu-ments whet stale while other new documents were not included at all. This should haveresulted in reduced performance. We do not yet have a good explanation for why thismay be the case.
6 Discussion and Conclusions
The living labs methodology offers great potential to evaluate information retrieval sys-tems in live settings with real users. The Living Labs for Information Retrieval Evalua-tion (LL4IR) CLEF Lab represents the first attempt at a shared community benchmark-ing platform in this space. The first edition of LL4IR focused on two use-cases, product
12 If use-cases uploaded their candidate documents in the order that represented their own rank-ing, then this was available to participants. We plan to change this in the future.

Table 6. Round #1 results for the web search use-case. The expected outcome under a randomlyclicking user is 0.5. P-values were computed using a binomial test.
Submission Outcome #Wins #Losses #Ties #Impressions p-value
EXPLOITATIVE BASELINE 0.5527 3030 2452 19055 24537 < 0.01Expected Outcome 0.5UNIFORM BASELINE 0.2161 430 1560 1346 3336 < 0.01
Table 7. Round #2 results for the web search use-case. The expected outcome under a randomlyclicking user is 0.5. P-values were computed using a binomial test.
Submission Outcome #Wins #Losses #Ties #Impressions p-value
EXPLOITATIVE BASELINE 0.6035 3128 2055 18055 23238 < 0.01Expected Outcome 0.5UNIFORM BASELINE 0.2547 435 1273 1053 2761 < 0.01
search and web search, using a commercial e-commerce website, REGIO, and a com-mercial web search engine, Seznam. A major contribution of the lab is the developmentof the necessary API infrastructure, which is made publicly available.
The LL4IR CLEF Lab attracted interest from dozens of teams. There were 12 activeparticipants, but only 3 teams ended up submitting results for the official evaluation (ex-cluding the baseline systems, provided by the organizers). We found that, while manyresearchers expressed and showed their interest in the lab, our setup with an API, in-stead of a static test collection, was a hurdle for many. We plan to ease this processof adapting to this new evaluation paradigm by providing even more examples and byorganizing tutorials where we demonstrate working with our API.
Overall, we regard our effort successful in showing the feasibility and potentialof this form of evaluation. For both use-cases, there was an experimental system thatoutperformed the corresponding production system significantly. It is somewhat unfor-tunate that in both cases that experimental system was a baseline approach provided bythe challenge organizers, nevertheless, it demonstrates the potential benefits to use-caseowners as well. One particular issue that surfaced and needs addressing for the productsearch use-case is the frequent changes in inventory. This appears to be more severe thanwe first anticipated and represents some challenges, both technical and methodological.
The API infrastructure developed for the LL4IR CLEF Lab offers the potential tohost ongoing IR evaluations in a live setting. As such, it is planned that these “chal-lenges” will continue on an ongoing basis post-CLEF, with an expanding number ofuse-cases as well as refinements to the existing use-cases.13 In fact, a third round ofour evaluation challenge is already underway at the time of writing, with some mod-ifications to the initial setup. Moreover, this third round has already attracted moreparticipants, in particular for the web search use case.
13 See http://living-labs.net/challenge/ for details.

Acknowledgements
We would like to acknowledge the support of (in alphabetical order): the CLEF Ini-tiative; the Dutch national program COMMIT; the ESF ELIAS network program; theREGIO Jatek online toy store; and Seznam commercial search engine. We would alsolike to thank the participants for their submissions and interest in the lab.
Bibliography
[1] J. Allan, B. Croft, A. Moffat, and M. Sanderson. Frontiers, challenges, and oppor-tunities for information retrieval: Report from SWIRL 2012 the second strategicworkshop on information retrieval in lorne. SIGIR Forum, 46(1):2–32, 2012.
[2] L. Azzopardi and K. Balog. Towards a living lab for information retrieval researchand development. A proposal for a living lab for product search tasks. In CLEF’11,2011.
[3] K. Balog, D. Elsweiler, E. Kanoulas, L. Kelly, and M. D. Smucker. Report on theCIKM workshop on living labs for information retrieval evaluation. SIGIR Forum,48(1):21–28, 2014.
[4] K. Balog, L. Kelly, and A. Schuth. Head first: Living labs for ad-hoc searchevaluation. In CIKM’14, 2014.
[5] A. Broder. A taxonomy of web search. SIGIR Forum, 36(2):3–10, Sept. 2002.ISSN 01635840.
[6] T. Brodt and F. Hopfgartner. Shedding light on a living lab: The CLEF NEWS-REEL open recommendation platform. In IIiX’14, 2014.
[7] O. Chapelle, T. Joachims, F. Radlinski, and Y. Yue. Large-scale validation andanalysis of interleaved search evaluation. ACM Transactions on Information Sys-tems (TOIS), 30:1–41, 2012.
[8] A. B. Ghirmatsion and K. Balog. Probabilistic field mapping for product search.In CLEF 2015 Online Working Notes, 2015.
[9] K. Hofmann, S. Whiteson, and M. de Rijke. A probabilistic method for inferringpreferences from clicks. In CIKM’11, page 249, 2011.
[10] L. B. Jabeur, L. Soulier, and L. Tamine. IRIT at CLEF 2015: A product searchmodel for head queries. In CLEF 2015 Online Working Notes, 2015.
[11] T. Joachims. Evaluating retrieval performance using clickthrough data. InJ. Franke, G. Nakhaeizadeh, and I. Renz, editors, Text Mining, pages 79–96. Phys-ica/Springer, 2003.
[12] J. Kamps, S. Geva, C. Peters, T. Sakai, A. Trotman, and E. Voorhees. Report onthe SIGIR 2009 workshop on the future of IR evaluation. SIGIR Forum, 43(2):13–23, 2009.
[13] D. Kelly, S. Dumais, and J. O. Pedersen. Evaluation challenges and directions forinformation-seeking support systems. Computer, 42(3):60–66, 2009.
[14] L. Kelly, P. Bunbury, and G. J. F. Jones. Evaluating personal information retrieval.In ECIR’12, 2012.
[15] J. Kim, X. Xue, and W. B. Croft. A probabilistic retrieval model for semistructureddata. In ECIR’09, 2009.

[16] R. Kohavi. Online controlled experiments. In SIGIR’13, 2013.[17] T.-Y. Liu. Learning to rank for information retrieval. Found. Trends Inf. Retr., 3
(3):225–331, 2009.[18] T.-Y. Liu, J. Xu, T. Qin, W. Xiong, and H. Li. LETOR: Benchmark dataset for
research on learning to rank for information retrieval. In LR4IR’07, 2007.[19] F. Radlinski and N. Craswell. Optimized interleaving for online retrieval evalua-
tion. In WSDM’13, 2013.[20] F. Radlinski, M. Kurup, and T. Joachims. How does clickthrough data reflect
retrieval quality? In CIKM’08, 2008.[21] M. Sanderson. Test Collection Based Evaluation of Information Retrieval Sys-
tems. Foundations and Trends in Information Retrieval, 4(4):247–375, 2010.[22] P. Schaer and N. Tavakolpoursaleh. GESIS at CLEF LL4IR 2015. In CLEF 2015
Online Working Notes, 2015.[23] A. Schuth, F. Sietsma, S. Whiteson, D. Lefortier, and M. de Rijke. Multileaved
comparisons for fast online evaluation. In CIKM’14, 2014.[24] A. Schuth, R.-J. Bruintjes, F. Buttner, J. van Doorn, C. Groenland, H. Ooster-
huis, C.-N. Tran, B. Veeling, J. van der Velde, R. Wechsler, D. Woudenberg, andM. de Rijke. Probabilistic multileave for online retrieval evaluation. In SIGIR’15, 2015.
[25] A. Schuth, K. Hofmann, and F. Radlinski. Predicting search satisfaction metrics with interleaved comparisons. In SIGIR’15, 2015.
[26] A. Spink, D. Wolfram, M. B. J. Jansen, and T. Saracevic. Searching the web: The public and their queries. J. Am. Soc. Inf. Sci. Technol., 52(3):226–234, 2001.
[27] J. Teevan, S. Dumais, and E. Horvitz. The potential value of personalizing search. In SIGIR’07, pages 756–757, 2007.
[28] A. Turpin and F. Scholar. User performance versus precision measures for simple search tasks. In SIGIR’06, pages 11–18, 2006.