extending functional dependency to detect abnormal …swat.cse.lehigh.edu/pubs/yang11d.pdf ·...
TRANSCRIPT

Extending Functional Dependency to DetectAbnormal Data in RDF Graphs
Yang Yu and Jeff Heflin
Department of Computer Science and Engineering. Lehigh University19 Memorial Drive West, Bethlehem, PA 18015
{yay208,heflin}@cse.lehigh.edu
Abstract. Data quality issues arise in the Semantic Web because datais created by diverse people and/or automated tools. In particular, erro-neous triples may occur due to factual errors in the original data source,the acquisition tools employed, misuse of ontologies, or errors in ontol-ogy alignment. We propose that the degree to which a triple deviatesfrom similar triples can be an important heuristic for identifying errors.Inspired by functional dependency, which has shown promise in databasedata quality research, we introduce value-clustered graph functional de-pendency to detect abnormal data in RDF graphs. To better deal withSemantic Web data, this extends the concept of functional dependencyon several aspects. First, there is the issue of scale, since we must con-sider the whole data schema instead of being restricted to one databaserelation. Second, it deals with multi-valued properties without explicitvalue correlations as specified as tuples in databases. Third, it uses clus-tering to consider classes of values. Focusing on these characteristics, wepropose a number of heuristics and algorithms to efficiently discover theextended dependencies and use them to detect abnormal data. Experi-ments have shown that the system is efficient on multiple data sets andalso detects many quality problems in real world data.
Keywords: value-clustered graph functional dependency, abnormal datain RDF graphs
1 Introduction
Data quality (DQ) research has been intensively applied to traditional formsof data, e.g. databases and web pages. The data are deemed of high quality ifthey correctly represent the real-world construct to which they refer. In the lastdecade, data dependencies, e.g. functional dependency (FD) [1] and conditionalfunctional dependency (CFD) [2, 3], have been used in promising DQ researchefforts on databases. Data quality is also critically important for Semantic Webdata. A large amount of heterogeneous data is converted into RDF/OWL formatby a variety of tools and then made available as Linked Data1. During thecreation or conversion of this data, numerous data quality problems can arise.
1 http://linkeddata.org
2 Y. Yu, J. Heflin
Some works [4–6] began to focus on the quality of Semantic Web data, but suchresearch is still in its very early stages. No previous work has utilized the factthat RDF data can be viewed as a graph database, therefore we can benefitfrom traditional database approaches, but we must make special considerationsfor RDF’s unique features. Since the Semantic Web represents many points ofview, there is no objective measure of correctness for all Semantic Web data.Therefore, we focus on the detection of abnormal triples, i.e., triples that violatecertain data dependencies. This in turn is used as a heuristic of a potential dataquality problem. We recognize that not all abnormal data is incorrect (in fact,in some scenarios the abnormal data may be the most interesting data) and thusleave it up to the application to determine how to use the heuristic.
A typical data dependency in databases is functional dependency [7]. Givena relation R, a set of attributes X in R is said to functionally determine anotherattribute Y , also in R, (written X → Y ), if and only if each X value is associatedwith precisely one Y value. An example FD zipCode → state means, for anytuple, the value of zipCode determines the value of state.
RDF data also has various dependencies. But RDF data has a very differentorganization and FD cannot be directly applied because RDF data is not or-ganized into relations with a fixed set of attributes. We propose value-clusteredgraph functional dependency (VGFD) based on the following thoughts. First,FD is formally defined over one entire relation. However RDF data can be seenas extremely decomposed tables where each table is a set of triples for a singleproperty. Thus we must look for dependencies that cross these extremely de-composed tables and extend the concept of dependency from a single databaserelation to a whole data set. Second, the correlation between values is triviallydetermined in a database of relational tuples. But in RDF data, it is non-trivialto determine the correlation, especially for multi-valued properties. For example,in DBPedia, the properties city and province do not have cardinality restrictions,and thus instances can have multiple values for each property. This makes sense,considering that some organizations can have multiple places. Yet finding the cor-relation between the different values of city and province becomes non-trivial.Third, traditionally value equality is used to determine FD. However, this isnot appropriate for real world, distributed data. Consider (1) for floating pointnumbers, rounding and measurement errors must be considered. (2) Sometimesdependencies are probabilistic in nature, and one-to-one value correspondencesare inappropriate. For example, the days needed for processing an order beforeshipping for a certain product is usually limited to a small range but not an ex-act value. (3) Sometimes certain values can be grouped to form a more abstractvalue.
In sum, our work makes the following contributions.
– we automatically find optimal clusters of values– we efficiently discover VGFDs over clustered values– we use the clusters and VGFDs to detect outliers and abnormal data– we conducts experiments on three data sets that validate the system
Extending Functional Dependency to Detect Abnormal Data in RDF Graphs 3
The rest of the paper is as follows. Section 2 discusses related work. Section 3describes how to efficiently discover VGFDs while Section 4 discusses categoriz-ing property values for their use. Sections 5 and 6 give the experimental resultsand the conclusion.
2 Related Work
Functional dependencies are by far the most common integrity constraints fordatabases in the real world. They are very important when designing or analyzingrelational databases. Most approaches to find FD [8–10] are mainly based onthe concept of an agree set [11]. Given a pair of tuples, the agree set is allthe attributes for which these tuples have the same values. Since the searchfor FDs occurs over a given relation and each tuple has at most one value foreach attribute, then each tuple can be placed into exactly one cluster where alltuples in the cluster have the same agree set with all other tuples. Agree setsare not very useful when applied to the extensions of RDF properties, whichare equivalent to relations with only two attributes (i.e. the subject and objectof the triple). Furthermore, many properties in RDF data are multi-valued andso the correlation between values of different properties becomes more complex.Finally, since most RDF properties are designed just for a subset of instances inthe data set, an agree set-based approach will partition many instances basedon null values is common.
RDF graphs are more like graph database models. The value functional de-pendency (VFD) [12] defined for the object-oriented data model can have multi-valued properties on the right-hand side, e.g. title → authors. However the de-pendencies we envision can have multi-valued properties on both sides and oursystem can determine the correlation between each value in both sets. The pathfunctional dependency (PFD) [13] defined for semantic data models consideredmultiple attributes on a path, however the PFD did not consider multi-valuedattributes. FDXML is the FD’s counterpart in XML [14] where its left-hand sideis a path starting from the XML document root which essentially is anotherform of a record in a database. Hartmann et al. [15] generalized the definitionsof several previous FDs in XML from a graph matching perspective.
As mentioned previously, the basic equality comparison of values used in FDis limited in many situations. Algebraic constraints [16, 17] in database relationsare about the algebraic relation between two columns in a database and are oftenused for query optimization. The algebraic relation can be +,−,×, /. Howeverthese works are limited to numerical attribute values and the mapping functioncan only be defined using several algebraic operators. The reason is that numer-ical columns are more often indexed and queried over as selective conditions indatabases than strings. In contrast, we try to find a general mapping functionbetween the values of different properties, both numbers and strings. Addition-ally, for the purpose of query optimization, they focus on pairs of columns withtop ranked relational significance, the major parts in each of these pairs and the

4 Y. Yu, J. Heflin
data related to dependencies that is often queried over, rather than all possiblepairs of properties and all pairs of values existing in the data set.
Data dependencies have recently shown promise for data quality managementin databases. Bohannon et al. [1] focuses on repairing inconsistencies based onstandard FDs and inclusion dependencies, that is, to edit the instance via mini-mal value modification such that the updated instance satisfies the constraints.A CFD [2, 3] is more expressive than a FD because it can describe a dependencythat only holds for a subset of the tuples in a relation, i.e., those that satisfy somecondition. Fan et. al [2] gave a theoretical analysis and algorithms for computingimplications and minimal cover of CFDs; Cong et al. [3], similar to Bohannon etal., focused on repairing inconsistent data. The CFD discovery problem has highcomplexity; it is known to be more complex than the implication problem, whichis already coNP-complete [2]. In contrast to them, we are trying to both auto-matically find fuzzy constraints, i.e. those that hold for most of the data, andreport on exceptional data for applications. Our work incorporates advantagesfrom both FD and CFD, i.e. fast execution and the ability to tolerate exceptions.
With respect to data quality on the Semantic Web, Sabou et al. [4] evaluatesemantic relations between concepts in ontologies by counting the similar axioms(both explicit and entailed) in online ontologies and their derivation length. Forinstance data, previous evaluations mainly focused on two types of errors: explicitinconsistency with the syntax of the ontologies and logical inconsistency that canbe checked by DL reasoners. However, many Linked Data ontologies do not fullyspecify the semantics of the terms defined, and OWL cannot specify axioms thatonly hold part of the time. Our work focuses on detecting abnormal semanticdata by automatically discovering probabilistic integrity constraints (IC). Tao etal. [6] proposed an IC semantics for ontology modelers and suggested that it isuseful for data validation purposes. But the precursor problem of how to discoverthese ICs is not addressed. Furber et al. [5] also noticed that using FD could behelpful for data quality management on the Semantic Web, but do not give anautomatic algorithm to find such FDs and, more importantly, direct applicationof FD to RDF data may not capture the unique characteristics of RDF data.
3 Discovering VGFDs
We begin with some definitions.
Definition 1 An RDF graph is G := ⟨I, L,R,E⟩, where three sets I, L and Rare instance, literal and relation identifiers and the set of directional edges isE ⊆ I × R × (I ∪ L). Let G be the set of all possible graphs and G ∈ G. LetR− = {r−|r ∈ R}.
Definition 2 A Path c in graph G is a tuple ⟨I0, r1, I1, ..., rn, In⟩ where Ii ∈I, ri ∈ R ∪ R−, and ∀i, 0 6 i < n, if ri ∈ R then (Ii, ri+1, Ii+1) ∈ E or ifri+1 ∈ R− then (Ii+1, ri+1, Ii) ∈ E; ∀j, if i = j then Ii = Ij.
Paths are acyclic and directional, but can include inverted relations of theform r−.
Extending Functional Dependency to Detect Abnormal Data in RDF Graphs 5
Definition 3 A Composite Property (Pcomp) r◦ in graph G is r1 ◦r2...rn, where
∃I0, ..., In and ⟨I0, r1, I1, ..., rn, In⟩ is a Path in G. Let R◦ be all possible Pcomps.Given r◦ ∈ R◦, Inst(r◦, G) = {⟨I0, r◦, In⟩|⟨I0, r1, I1, r2, I2, ..., rn, In⟩ is a Pathin G}. Length(r◦) = n. ∀r ∈ R, r ∈ R◦ and Length(r) = 1.
Definition 4 A Conjunctive Property (Pconj) r+ in graph G is a set {r1, r2, ..., rn}
(written r1+r2+ ...+rn), where ∀i, ri ∈ R◦ and ∃I ′ s.t. ∀1 ≤ i ≤ n, ⟨I ′, ri, Ii⟩ ∈Inst(ri, G). Let R+ be all possible Pconjs. Size(r
+) =∑
ri∈r+ Length(ri).
A Composite Property is a sequence of edges on a Path. The subject andobject of a Pcomp are the first and last objects on the Paths consisting of thissequence of edges. Every property is a special case of Pcomp. A ConjunctiveProperty groups a set of Pcomps that have a common subject I ′. Note, eachoriginal r ∈ R is also r ∈ R◦ and each r◦ ∈ R◦ is also r◦ ∈ R+.
Definition 5 Given i ∈ I and r◦ ∈ R◦, V ◦(i, r◦) = {i′|∃⟨i, r◦, i′⟩ ∈ Inst(r◦, G)}.Given r+ ∈ R+, V +(i, r+) is a tuple ⟨V ◦(i, r1), ..., V
◦(i, r1)⟩ where ∀j, rj ∈ R+.
Given a Pcomp, value function V ◦ returns the objects connected with a subjectthrough Pcomp, and given a Pconj , the value function V + returns the set of objectsconnected with a subject through Pconj .
Definition 6 Given i, j ∈ I and r◦ ∈ R◦, Dependency Equality (DE) be-tween i and j on r◦ is: V (i, r◦)
.= V (j, r◦) ⇐⇒ (∀x ∈ V ◦(i, r◦) ⇐⇒
∃y ∈ V ◦(j, r◦), C(x) = C(y)), where C(x) is the dependency cluster of x (dis-cussed in Section 4). With a slight abuse of notation for DE, given r+ ∈ R+,V +(i, r+)
.= V +(j, r+) ⇐⇒ ∀rk ∈ r+, V ◦(i, rk)
.= V ◦(j, rk).
Definition 7 A value-clustered graph functional dependency (VGFD) s in graphG is X → Y , where X ∈ R+, Y ∈ R◦ and ∀i, j ∈ I, if V +(i,X)
.= V +(j,X)
then V ◦(i, Y ).= V ◦(j, Y ).
These definitions state that for all instances, if the values of the left-handside (LHS) Pcomp of a given VGFD satisfy Dependency Equality (DE), thenthere is a DE on the right-hand side (RHS) Pconj . Note, due to the union rule ofArmstrong’s axioms used to infer all the functional dependencies, if α → β andα → γ hold, then α → βγ holds. Therefore, it is enough to define the VGFDwhose right-hand side (RHS) is each single element of a set of properties. In thiswork, DE includes basic equality for both object and datatype property values,transitivity of the sameAs relation for instances and clustering for datatypevalues.
Shown in Algorithm 1, this section introduces the VGFD search (line 8-15) and the next section introduces value clustering (line 2-5) which is usedto detect dependencies. To efficiently discover a minimum set of VGFDs whichis a cover of the whole set of VGFDs, our approach essentially is computedlevel-wise. Each level Li consists of VGFDs with LHS of size i (Fig. 1 gives anexample). The computation of VGFDs with smaller sets of LHS properties can

6 Y. Yu, J. Heflin
Algorithm 1 Search V GFDs(G,α, β, γ), G = (I, L,R,E) is a graph; α is theconfidence threshold for a VGFD; β is the sampling size; γ is the threshold forpre-clustering.
1: S ← ∅, C ← ∅2: for each r ∈ R s.t. r is a datatype property do3: groups← Preclustering(Range(r), γ)4: Cr ← Optimal Kmeans(Range(r), groups)5: C ← C ∪ Cr
6: i = 07: Li ← ∅8: repeat9: i = i+ 110: Li ← Generate Level with Static Pruning(Li−1, E)11: for each s ∈ Li do12: if Runtime Pruning(s, α, β,E,C) = FALSE then13: if (M ← Compute V GFD(s, α,E,C)) = ∅ then14: S ← S ∪ (s,M) //M is the set of value mappings of s.15: until Li = ∅ or i >= DEPTH LIMIT16: return S
be used when computing children VGFDs that have a superset of those LHSproperties. A similar level-wise search was proposed for the Tane algorithm [9],but each node in Tane corresponds to a subset of our nodes whose LHS is basedon single properties instead of Pcomps. In contrast, our nodes are finer grainedwhich leads to more opportunities for pruning. Our algorithm starts with level0. On each new level, it first generates possible VGFDs on this level based onthe results of previous levels and it also eliminates many potential VGFDs fromfurther consideration based on some easily computed heuristics (Section 3.1).Then, a runtime pruning (Section 3.3) and a detailed computation (Section 3.2)are conducted on each candidate VGFD. The whole process can terminate ata specified level, or after all levels, although the latter is usually unnecessaryand unrealistic. The process returns each VGFD and its value mappings whichis used for detecting violations.
3.1 Heuristics for Static Pruning
We first define the discriminability for a property as the number of distinct valuesdivided by the sum of the property extension, and when it is compared betweenproperties, it is over the instances they have in common. Then, static pruningheuristics used to eliminate potential VGFDs from further consideration are:
1. insufficient subject overlap between the LHS and the RHS,2. the LHS or RHS has too high a discriminability,3. the discriminability of the LHS is less than that of the RHS.
The information for rule 1 can be acquired from an ontology (e.g. using do-main and range information) or a simple relational join on data. Here insufficient
Extending Functional Dependency to Detect Abnormal Data in RDF Graphs 7
overlap means too few common subjects, e.g. 20. For rule 2, if the discriminabil-ity is close to one, e.g. 0.95 which means 95%, the property functions like asuperkey in a database. Since such keys identify an individual, they are notuseful for detecting abnormal data. For rule 3, if there is a mapping betweentwo such properties, some values of the property with smaller discriminabilitymust be mapped to different values on the RHS which would not be a functionalmapping. In order to apply these heuristics, we make the additional observations:
1. The discriminability of a Pcomp (Pconj resp.) is generally no greater than (noless than resp.) that of each property involved.
2. A Pconj (Pcomp resp.) cannot be based on two properties that have fewcommon subjects (objects and subjects resp.).
3. All children of a true VGFD on the level-wise search graph are also trueVGFDs, but are not minimal.
For example, given a Pcomp A ◦ B, its values all come from the values of Band its extension is a subset of the Cartesian product between objects of A andsubjects of B, then its discriminability, i.e. the distinct values divided by theusages, should be no greater than that of each component. A similar explanationapplies for Pconj in observation 1. An extension of the observation 2 is that aPconj cannot be followed by other properties in a property chain, e.g. (A+B)◦C,since its values are tuples (e.g. the values of A+B) as opposed to the instancesand literals that are the subjects of another property (e.g. subjects of C).
A+C B A○C B A+D B A○D B A+B C A○B C A+D C A○D C A+B D A○B D A○C DA+C D
(A○B)+D C (A○B)○D C (A○D)+B C (A○D)+B C Level 3
Level 1
Level 2
Level 0
A B A C A D B A B C B D … …
… …
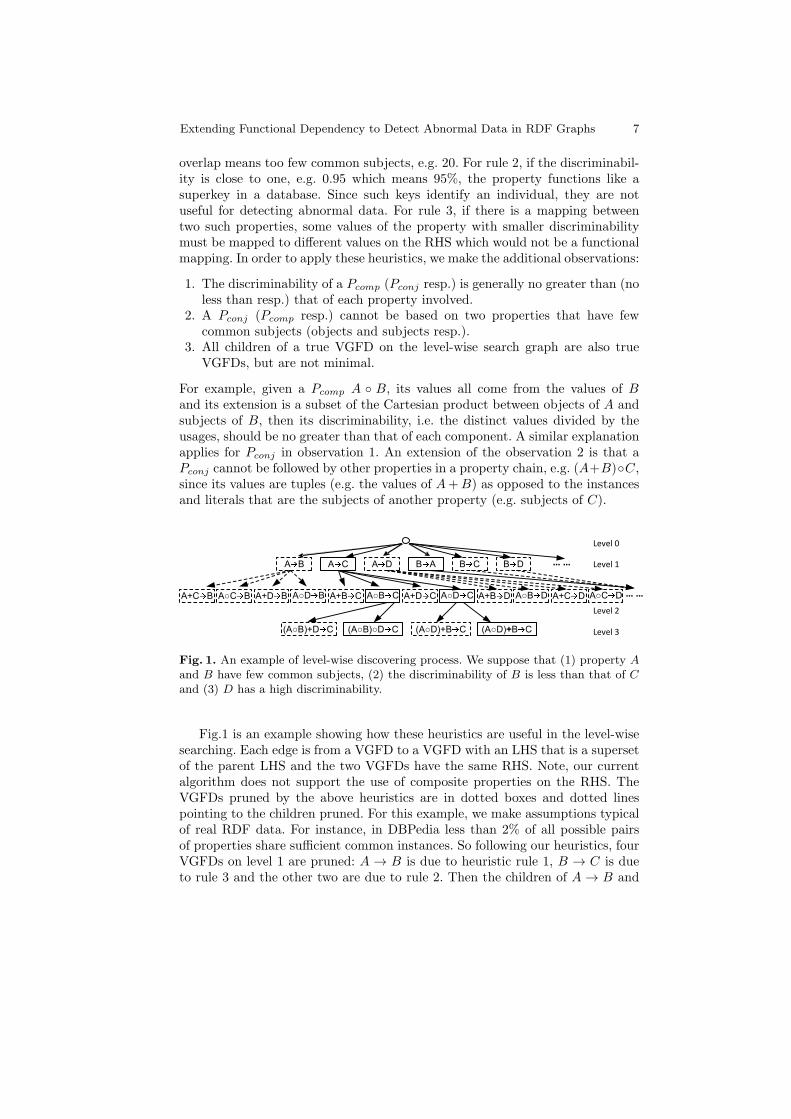
Fig. 1. An example of level-wise discovering process. We suppose that (1) property Aand B have few common subjects, (2) the discriminability of B is less than that of Cand (3) D has a high discriminability.
Fig.1 is an example showing how these heuristics are useful in the level-wisesearching. Each edge is from a VGFD to a VGFD with an LHS that is a supersetof the parent LHS and the two VGFDs have the same RHS. Note, our currentalgorithm does not support the use of composite properties on the RHS. TheVGFDs pruned by the above heuristics are in dotted boxes and dotted linespointing to the children pruned. For this example, we make assumptions typicalof real RDF data. For instance, in DBPedia less than 2% of all possible pairsof properties share sufficient common instances. So following our heuristics, fourVGFDs on level 1 are pruned: A → B is due to heuristic rule 1, B → C is dueto rule 3 and the other two are due to rule 2. Then the children of A → B and
8 Y. Yu, J. Heflin
A → D are pruned due to the same reason as their parents. A+B → C on level2 and (A ◦D) + B → C on level 3 are pruned due to the first assumption plusthe observation 2. Finally, A+D → C on level 2 and (A◦B)+D → C on level 3are pruned due to the observation 1 and heuristic rule 2. From this example, wecan see simple conditions can reduce the level-wise search space greatly basedon these heuristics.
3.2 Handling Multi-Valued Properties
The fundamental difference between VGFD and FD when computing VGFDis that we consider multi-valued properties. When finding FDs in databases,the multi-valued attributes either are not considered (if they are not in thesame relation), or the correlation of their values is given by having separatetuples for each value. RDF frequently has multi-valued properties without anyexplicit correlation of values, e.g. in DBPedia, more than 60% properties aremulti-valued. When computing a VGFD, we try to find a functional mapping
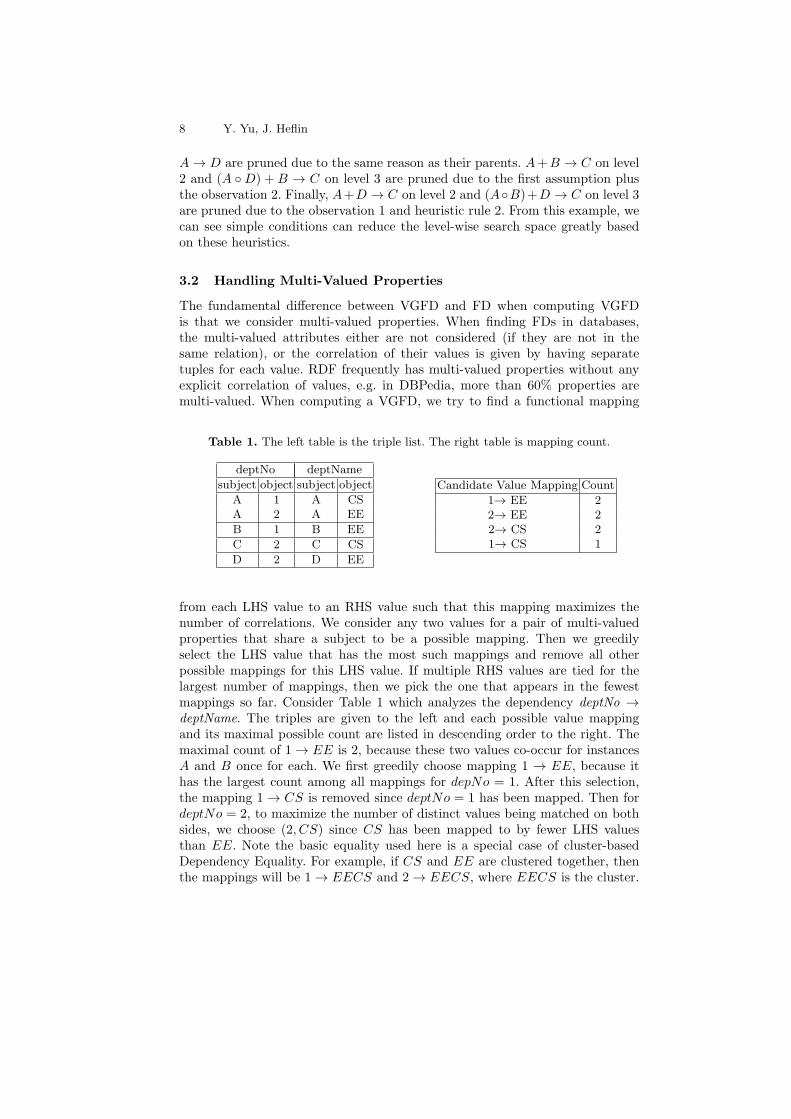
Table 1. The left table is the triple list. The right table is mapping count.
deptNo deptName
subject object subject object
A 1 A CSA 2 A EE
B 1 B EE
C 2 C CS
D 2 D EE
Candidate Value Mapping Count
1→ EE 22→ EE 22→ CS 21→ CS 1
from each LHS value to an RHS value such that this mapping maximizes thenumber of correlations. We consider any two values for a pair of multi-valuedproperties that share a subject to be a possible mapping. Then we greedilyselect the LHS value that has the most such mappings and remove all otherpossible mappings for this LHS value. If multiple RHS values are tied for thelargest number of mappings, then we pick the one that appears in the fewestmappings so far. Consider Table 1 which analyzes the dependency deptNo →deptName. The triples are given to the left and each possible value mappingand its maximal possible count are listed in descending order to the right. Themaximal count of 1 → EE is 2, because these two values co-occur for instancesA and B once for each. We first greedily choose mapping 1 → EE, because ithas the largest count among all mappings for depNo = 1. After this selection,the mapping 1 → CS is removed since deptNo = 1 has been mapped. Then fordeptNo = 2, to maximize the number of distinct values being matched on bothsides, we choose (2, CS) since CS has been mapped to by fewer LHS valuesthan EE. Note the basic equality used here is a special case of cluster-basedDependency Equality. For example, if CS and EE are clustered together, thenthe mappings will be 1 → EECS and 2 → EECS, where EECS is the cluster.
Extending Functional Dependency to Detect Abnormal Data in RDF Graphs 9
Our confidence in a VGFD depends on how often the data agree with it, i.e., thetotal matches divided by the sum of the LHS’s extension, e.g. the VGFD abovehas the confidence of 4/5 = 0.8. In this work, we set the confidence thresholdα = 0.9 to ensure that patterns are significant, while allowing for some variationdue to noise, input errors, and exceptions.
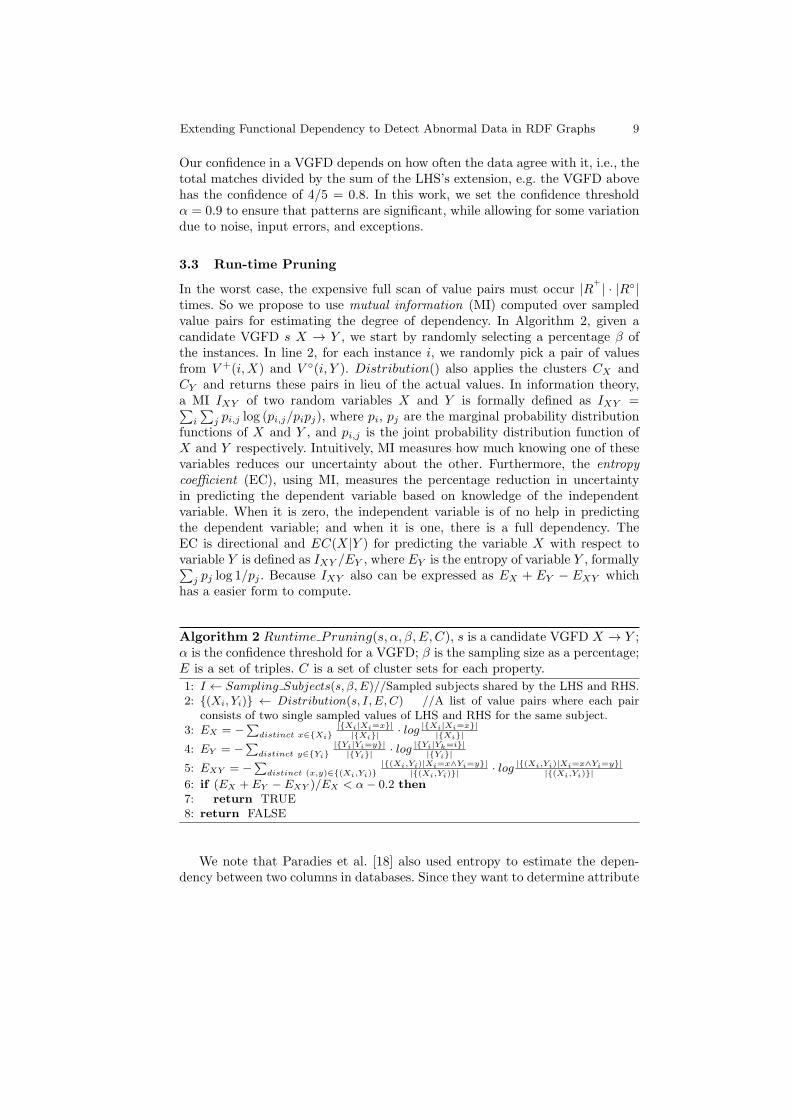
3.3 Run-time Pruning
In the worst case, the expensive full scan of value pairs must occur |R+ | · |R◦|times. So we propose to use mutual information (MI) computed over sampledvalue pairs for estimating the degree of dependency. In Algorithm 2, given acandidate VGFD s X → Y , we start by randomly selecting a percentage β ofthe instances. In line 2, for each instance i, we randomly pick a pair of valuesfrom V +(i,X) and V ◦(i, Y ). Distribution() also applies the clusters CX andCY and returns these pairs in lieu of the actual values. In information theory,a MI IXY of two random variables X and Y is formally defined as IXY =∑
i
∑j pi,j log (pi,j/pipj), where pi, pj are the marginal probability distribution
functions of X and Y , and pi,j is the joint probability distribution function ofX and Y respectively. Intuitively, MI measures how much knowing one of thesevariables reduces our uncertainty about the other. Furthermore, the entropycoefficient (EC), using MI, measures the percentage reduction in uncertaintyin predicting the dependent variable based on knowledge of the independentvariable. When it is zero, the independent variable is of no help in predictingthe dependent variable; and when it is one, there is a full dependency. TheEC is directional and EC(X|Y ) for predicting the variable X with respect tovariable Y is defined as IXY /EY , where EY is the entropy of variable Y , formally∑
j pj log 1/pj . Because IXY also can be expressed as EX + EY − EXY whichhas a easier form to compute.
Algorithm 2 Runtime Pruning(s, α, β,E,C), s is a candidate VGFD X → Y ;α is the confidence threshold for a VGFD; β is the sampling size as a percentage;E is a set of triples. C is a set of cluster sets for each property.
1: I ← Sampling Subjects(s, β, E)//Sampled subjects shared by the LHS and RHS.2: {(Xi, Yi)} ← Distribution(s, I, E,C) //A list of value pairs where each pair
consists of two single sampled values of LHS and RHS for the same subject.3: EX = −
∑distinct x∈{Xi}
|{Xi|Xi=x}||{Xi}|
· log |{Xi|Xi=x}||{Xi}|
4: EY = −∑
distinct y∈{Yi}|{Yi|Yi=y}|
|{Yi}|· log |{Yi|Yk=i}|
|{Yi}|
5: EXY = −∑
distinct (x,y)∈{(Xi,Yi)}|{(Xi,Yi)|Xi=x∧Yi=y}|
|{(Xi,Yi)}|· log |{(Xi,Yi)|Xi=x∧Yi=y}|
|{(Xi,Yi)}|6: if (EX + EY − EXY )/EX < α− 0.2 then7: return TRUE8: return FALSE
We note that Paradies et al. [18] also used entropy to estimate the depen-dency between two columns in databases. Since they want to determine attribute

10 Y. Yu, J. Heflin
pairs that can be estimated with high certainty, i.e. focusing on precision of thepositives, they need a complex statistical estimator. In contrast, our aim is a fastfilter that is good enough to remove most negatives, i.e. independent pairs, thusa statistical estimator is not necessary. We can avoid missing positives by settinga low enough threshold. In our experiments, the difference between EC for a 20%sample and EC of full data is less than 0.15 on average and the estimated valuestypically have higher ECs. For example, it is very rare that a VGFD estimatedlower than 0.7 has an actual value above 0.9. Therefore, a threshold of 0.2 lessthan α (line 6) is a reasonable lower bound for filtering out independent pairs.
4 Clustering Property Values
As introduced in Section 1, we must cluster property values in order to discoverdependencies that allow for rounding errors, measurement errors, and distri-butions of values. For object property values, clustering groups all identifiersthat stand for the same real world object by computing the transitive closure ofsameAs. The rest of this section discusses clustering the values for each datatypeproperty. This is used to determine Dependency Equality (Definition 6) betweentwo objects.
4.1 Pre-clustering
The pre-clustering process is a light-weight computation that provides two ben-efits for finer clustering later: the minimum number of clusters and reservesexpensive distance calculations for pairs of points within the same pre-cluster.Since the pre-clustering is used for VGFD discovery, there are three thoughts.First, the values to be clustered are from various properties and have very dif-ferent features. So the clustering process needs to be generic in two aspects:(1) a pair-wise distance metric that is suitable for different types of values andmultiple feature dimensions, and (2) suitable for the most common distributionin real world, i.e. the normal distribution. Second, we prefer a comparativelylarger number of clusters where elements are really close (if not, they may notbe clustered). The reason is that the clusters will be used as class types for de-tecting dependencies. Larger values of k generate finer-grained class types, whichin turn allow us to generate more precise VGFDs, albeit at the risk of bluringboundaries between classes and making it harder to discover some dependencies.This point also makes our approach different from many other pre-clustering ap-proaches, e.g. [19], because their results of pre-clustering can be overlapped andrigid clustering later could merge these groups into fewer clusters.
Based on the above thoughts, specifically, given a list of values, the processfirst selects a value that is closest to the center (we choose the mean for numericvalues and discuss strings in the next paragraph), and then moves it from the listto be the centroid of a new group. Second, for each value on the list, if the dis-tance to this centroid is within the threshold (we use the standard deviation), itwill be moved from the list to a new group. Finally, the above process is repeated

Extending Functional Dependency to Detect Abnormal Data in RDF Graphs 11
if the list is not empty. Thus the process generally finds the cluster around theoriginal center first, and then the clusters further away from the center. This ismuch better than random selection, because if an outlier is selected, then mostinstances remain on the list for clustering after this round of computation.
To compute the center and distance of string values, we compute the weightof each token in a string according to its frequency in values for the property.Then we pick the string that has the largest sum of weights divided by thenumber of tokens in it as the center and the distance between two strings is thesum of weights of the different tokens in them. The intuition is that by takingthese strings as a class, the most representative one is the one with the mostcommon words. For example, the property color in DBPedia has values “lightgreen”, “lime green”, etc. Then, the representative of these two strings is thecommon word “green”. For “light green”, the distance to ”lime green” will beless than that to “light red”, since ’‘red” and “green” are more common andhave larger weights.
4.2 Optimal k-Means Clustering
There are several popular clustering methods, e.g. k-Means, Greedy Agglomer-ative Clustering, etc. However most of them need a parameter for the numberof resulting clusters. To automatically find the most natural/best clusters, wedesigned the following unsupervised method of finding optimal clusters.
The approach is inspired by the gap statistic [20] which is used to clusternumeric values with a gradually increasingly number of clusters. The idea isthat when we increase k to above the optimum, e.g. adding a cluster center inthe middle of an already ideal cluster, the pooled within-cluster sum of squaresaround the cluster mean decreases more slowly than its expected rate. Thus thegap between the expectation and actual improvement over different k will be ina shape with an inflexion which indicates the best k. Our approach improvesupon this idea in three aspects: we start at the number of pre-clusters insteadof 1; in each round of k-Means, the initial centroids are selected according topre-clusters; and the distance computation is only made among points withinthe same pre-cluster.
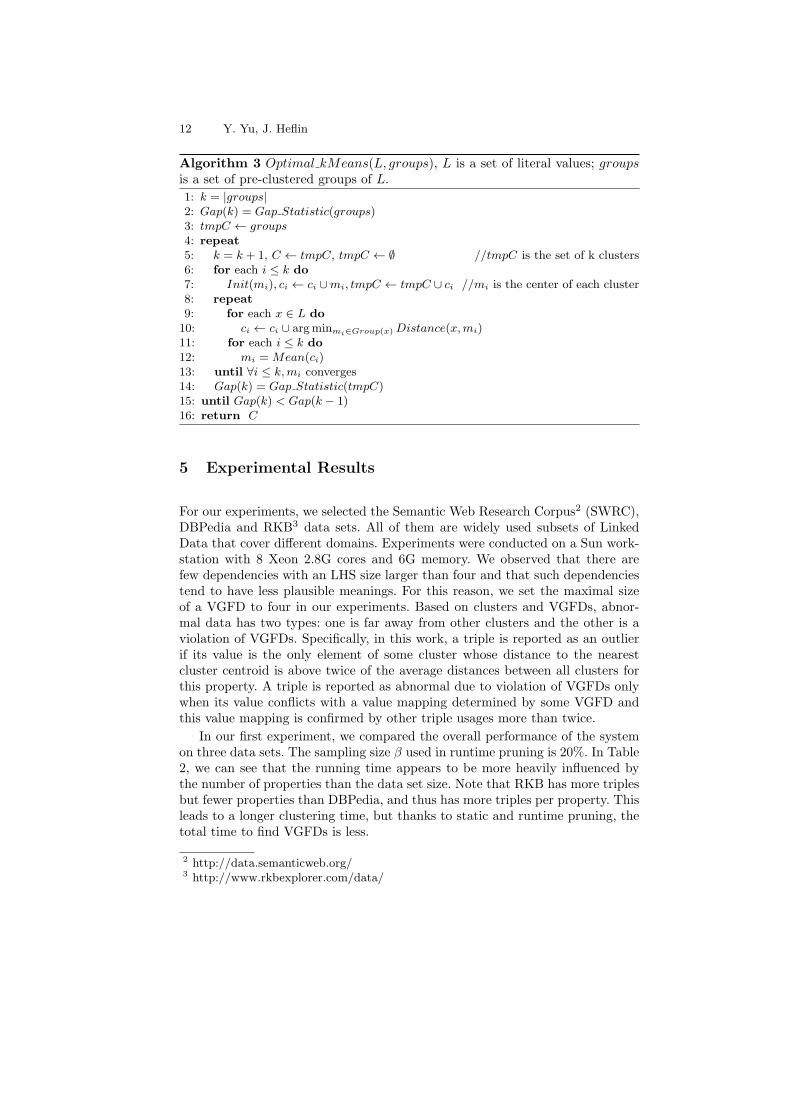
Our Optimal kMeans algorithm is presented as Algorithm 3. At first, k isset to the number of pre-clusters. At each iteration, we increment k and selectk random estimated centroids mi, each of which starts a new cluster ci. Init()selects the centroids from the pre-clusters in proportion to their sizes. In eachinner loop (line 8-13), every value is labeled as a member of the cluster whosecentroid has the shortest distance to this instance among all centroids that arewithin the same pre-cluster as that value (line 10). Then each centroid is recom-puted based on the cheap distance metric until the centroid does not change.After each round of modified k-Means clustering, we compute the difference onGap(k) and stop the process if it is an inflexion point. Since the clustering isused to detect abnormal data in which string values are expected to be causedby accidental input or data conversion, in this clustering, we use edit distanceas the distance metric for string values as opposed to the above pre-clustering.
12 Y. Yu, J. Heflin
Algorithm 3 Optimal kMeans(L, groups), L is a set of literal values; groupsis a set of pre-clustered groups of L.
1: k = |groups|2: Gap(k) = Gap Statistic(groups)3: tmpC ← groups4: repeat5: k = k + 1, C ← tmpC, tmpC ← ∅ //tmpC is the set of k clusters6: for each i ≤ k do7: Init(mi), ci ← ci ∪mi, tmpC ← tmpC ∪ ci //mi is the center of each cluster8: repeat9: for each x ∈ L do10: ci ← ci ∪ argminmi∈Group(x) Distance(x,mi)11: for each i ≤ k do12: mi = Mean(ci)13: until ∀i ≤ k,mi converges14: Gap(k) = Gap Statistic(tmpC)15: until Gap(k) < Gap(k − 1)16: return C
5 Experimental Results
For our experiments, we selected the Semantic Web Research Corpus2 (SWRC),DBPedia and RKB3 data sets. All of them are widely used subsets of LinkedData that cover different domains. Experiments were conducted on a Sun work-station with 8 Xeon 2.8G cores and 6G memory. We observed that there arefew dependencies with an LHS size larger than four and that such dependenciestend to have less plausible meanings. For this reason, we set the maximal sizeof a VGFD to four in our experiments. Based on clusters and VGFDs, abnor-mal data has two types: one is far away from other clusters and the other is aviolation of VGFDs. Specifically, in this work, a triple is reported as an outlierif its value is the only element of some cluster whose distance to the nearestcluster centroid is above twice of the average distances between all clusters forthis property. A triple is reported as abnormal due to violation of VGFDs onlywhen its value conflicts with a value mapping determined by some VGFD andthis value mapping is confirmed by other triple usages more than twice.
In our first experiment, we compared the overall performance of the systemon three data sets. The sampling size β used in runtime pruning is 20%. In Table2, we can see that the running time appears to be more heavily influenced bythe number of properties than the data set size. Note that RKB has more triplesbut fewer properties than DBPedia, and thus has more triples per property. Thisleads to a longer clustering time, but thanks to static and runtime pruning, thetotal time to find VGFDs is less.
2 http://data.semanticweb.org/3 http://www.rkbexplorer.com/data/

Extending Functional Dependency to Detect Abnormal Data in RDF Graphs 13
Table 2. System overall performance on SWRC, DBPedia and RKB data sets.
SWRC DBPedia RKB
Number of Triples (M) / Properties 0.07 / 112 10 / 1114 38 / 54
Discovered VGFDs on Level 1 12 228 6Discovered VGFDs on Level 2 37 304 3Discovered VGFDs on Level 3 2 126 0Discovered VGFDs on Level 4 0 53 0
Time for Clustering (s) 18 114 396Time for Level 1 (s) 11 172 67Time for Level 2 (s) 20 246 44Time for Level 3 (s) 4 108 0Time for Level 4 (s) 1 47 0
Total Time (s) / Discovered VGFDs 54 / 51 687 / 721 507 / 9Reported Abnormal Triples 75 2868 227
Table 3. Some VGFDs from the three data sets. The first and second group of VGFDsare of size 1 and 2. The third group is a set of VGFDs with clustered values.
VGFD Descriptiongenus→family Organisms in the same genus also have the same family.writer→genre A work’s writer determines the work’s genre.teamOwner→chairman The teams with the same owner also have the same chairman.composer→mediaType The works by the same composer have the same media type.militaryRank→title The people of the same military rank also have the same title.location→nearestCity The things on the same location have the same nearest city.topic→primaryTopic The papers with the same topic have the same primary topic.manufacturer+oilSystem The manufacturer and oil system determine the engine’s
→compressionRatio compression ratio.publisher ◦ country The publisher’s country determines the language of that
→language published work.article-of-journal+has-volume The volume number of a journal where an article is published
→has date determines the published date of this article.faculty→budget The size of the faculty determines the budget range.militaryRank→salary The military rank determines the range of salary.occupation→salary The occupation determines the range of salary.type→upperAge A school’s type determines the range of upper age.
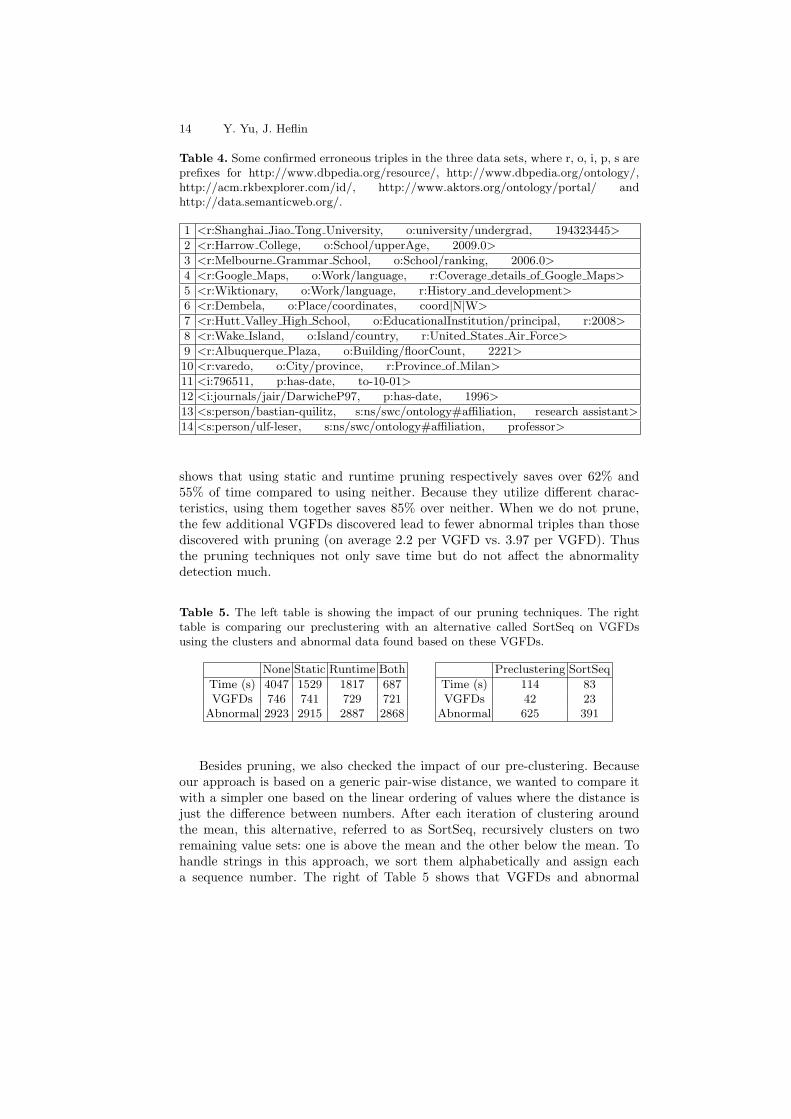
Table 3 gives some VGFDs from the three data sets and their short descrip-tions. In DBPedia, among 200 samples out of 2868 abnormal triples, 173 of them(86.5%) are confirmed to be true errors in the original data. The correctness of10 of the remaining triples was difficult to judge. SWRC and RKB have 51% and62% precision respectively. We believe the lower precision for SWRC is becauseit has a higher initial data quality and its properties have a much smaller set ofpossible values than those of DBPedia. We list a number of confirmed erroneoustriples in Table 4. For example, the first triple is reported as an outlier afterautomatic clustering. The second triple violates the VGFD that a school’s typedetermines the cluster of its upper age, because the triple’s subject is a certaintype of school while its value is not in the cluster of values for the same type ofschools.
Next, to check the impact of our pruning algorithms, we performed an ab-lation study using DBPedia that removes these steps. The left part of Table 5
14 Y. Yu, J. Heflin
Table 4. Some confirmed erroneous triples in the three data sets, where r, o, i, p, s areprefixes for http://www.dbpedia.org/resource/, http://www.dbpedia.org/ontology/,http://acm.rkbexplorer.com/id/, http://www.aktors.org/ontology/portal/ andhttp://data.semanticweb.org/.
1 <r:Shanghai Jiao Tong University, o:university/undergrad, 194323445>
2 <r:Harrow College, o:School/upperAge, 2009.0>
3 <r:Melbourne Grammar School, o:School/ranking, 2006.0>
4 <r:Google Maps, o:Work/language, r:Coverage details of Google Maps>
5 <r:Wiktionary, o:Work/language, r:History and development>
6 <r:Dembela, o:Place/coordinates, coord|N|W>
7 <r:Hutt Valley High School, o:EducationalInstitution/principal, r:2008>
8 <r:Wake Island, o:Island/country, r:United States Air Force>
9 <r:Albuquerque Plaza, o:Building/floorCount, 2221>
10 <r:varedo, o:City/province, r:Province of Milan>
11 <i:796511, p:has-date, to-10-01>
12 <i:journals/jair/DarwicheP97, p:has-date, 1996>
13 <s:person/bastian-quilitz, s:ns/swc/ontology#affiliation, research assistant>
14 <s:person/ulf-leser, s:ns/swc/ontology#affiliation, professor>
shows that using static and runtime pruning respectively saves over 62% and55% of time compared to using neither. Because they utilize different charac-teristics, using them together saves 85% over neither. When we do not prune,the few additional VGFDs discovered lead to fewer abnormal triples than thosediscovered with pruning (on average 2.2 per VGFD vs. 3.97 per VGFD). Thusthe pruning techniques not only save time but do not affect the abnormalitydetection much.
Table 5. The left table is showing the impact of our pruning techniques. The righttable is comparing our preclustering with an alternative called SortSeq on VGFDsusing the clusters and abnormal data found based on these VGFDs.
None Static Runtime Both
Time (s) 4047 1529 1817 687VGFDs 746 741 729 721
Abnormal 2923 2915 2887 2868
Preclustering SortSeq
Time (s) 114 83VGFDs 42 23
Abnormal 625 391
Besides pruning, we also checked the impact of our pre-clustering. Becauseour approach is based on a generic pair-wise distance, we wanted to compare itwith a simpler one based on the linear ordering of values where the distance isjust the difference between numbers. After each iteration of clustering aroundthe mean, this alternative, referred to as SortSeq, recursively clusters on tworemaining value sets: one is above the mean and the other below the mean. Tohandle strings in this approach, we sort them alphabetically and assign eacha sequence number. The right of Table 5 shows that VGFDs and abnormal
Extending Functional Dependency to Detect Abnormal Data in RDF Graphs 15
data that are based on the baseline clustering are both less than that of ourapproach. Among the VGFDs not found by the SortSeq, most are for stringvalues. SortSeq finds fewer VGFDs and less abnormal data, because it naivelyassumes that the more common leading characters two strings have, the moresimilar they are. Thus, our pre-clustering using cheap and generic computationcaptures the characteristics of different property values.
300
400
500
600
700
Ru
nn
ing
Tim
e (
sec) level 4
level 3
level 2
level 1
0
100
200
100 200 300 400 500 600 700 800 900 1000
Ru
nn
ing
Number of Properties
200
300
400
500
600
700
300
400
500
600
700
800
Ru
nn
ing
Tim
e (
sec)
Dis
cov
ere
d V
GF
Ds
Time
0
100
200
0
100
200
1% 5% 10%15%20%25%30%35%40%45%50%
Ru
nn
ing
Dis
cov
er
Sampling Size in Runtime Pruning
Time
VGFDs
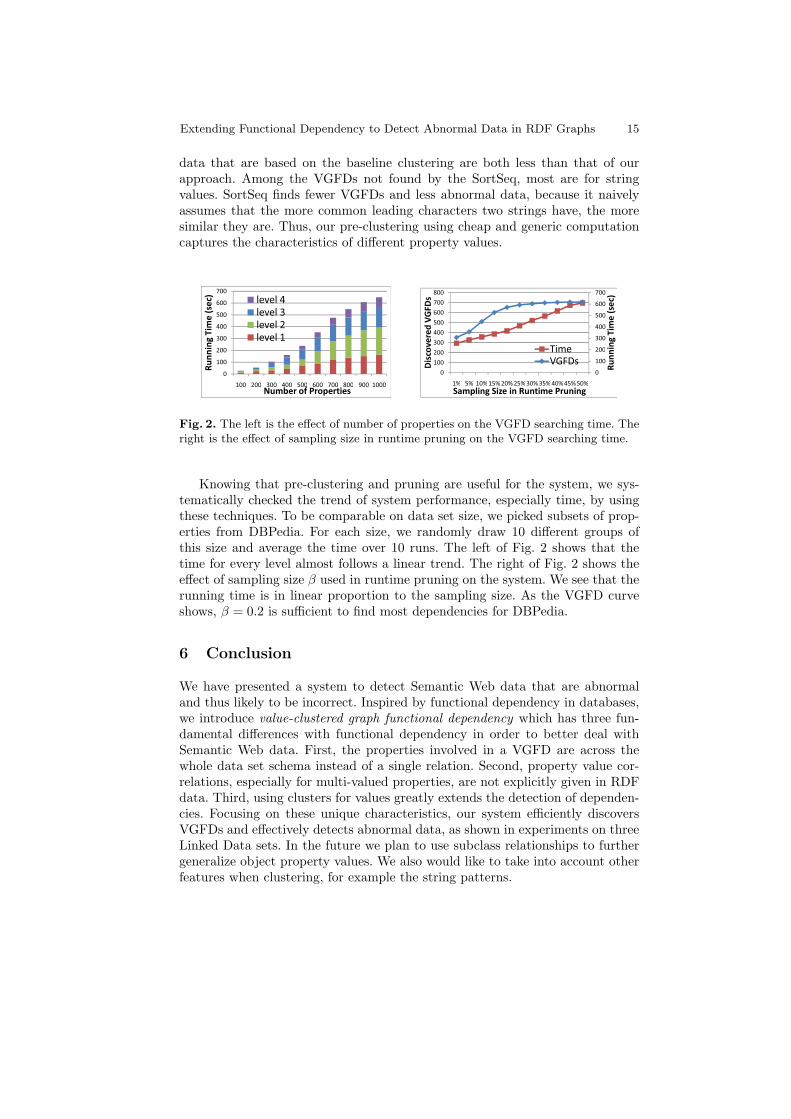
Fig. 2. The left is the effect of number of properties on the VGFD searching time. Theright is the effect of sampling size in runtime pruning on the VGFD searching time.
Knowing that pre-clustering and pruning are useful for the system, we sys-tematically checked the trend of system performance, especially time, by usingthese techniques. To be comparable on data set size, we picked subsets of prop-erties from DBPedia. For each size, we randomly draw 10 different groups ofthis size and average the time over 10 runs. The left of Fig. 2 shows that thetime for every level almost follows a linear trend. The right of Fig. 2 shows theeffect of sampling size β used in runtime pruning on the system. We see that therunning time is in linear proportion to the sampling size. As the VGFD curveshows, β = 0.2 is sufficient to find most dependencies for DBPedia.
6 Conclusion
We have presented a system to detect Semantic Web data that are abnormaland thus likely to be incorrect. Inspired by functional dependency in databases,we introduce value-clustered graph functional dependency which has three fun-damental differences with functional dependency in order to better deal withSemantic Web data. First, the properties involved in a VGFD are across thewhole data set schema instead of a single relation. Second, property value cor-relations, especially for multi-valued properties, are not explicitly given in RDFdata. Third, using clusters for values greatly extends the detection of dependen-cies. Focusing on these unique characteristics, our system efficiently discoversVGFDs and effectively detects abnormal data, as shown in experiments on threeLinked Data sets. In the future we plan to use subclass relationships to furthergeneralize object property values. We also would like to take into account otherfeatures when clustering, for example the string patterns.

16 Y. Yu, J. Heflin
References
1. Bohannon, P., Fan, W., Flaster, M., Rastogi, R.: A cost-based model and effectiveheuristic for repairing constraints by value modification. In: SIGMOD ’05, NewYork, NY, USA, ACM (2005) 143–154
2. Fan, W., Geerts, F., Jia, X., Kementsietsidis, A.: Conditional functional depen-dencies for capturing data inconsistencies. ACM Trans. Database Syst. 33 (June2008) 6:1–6:48
3. Cong, G., Fan, W., Geerts, F., Jia, X., Ma, S.: Improving data quality: consistencyand accuracy. In: VLDB ’07, VLDB Endowment (2007) 315–326
4. Sabou, M., Fernandez, M., Motta, E.: Evaluating semantic relations by exploringontologies on the Semantic Web. (2010) 269–280
5. Furber, C., Hepp, M.: Using SPARQL and SPIN for data quality management onthe semantic web. In: BIS., Springer (2010) 35–46
6. Tao, J., Sirin, E., Bao, J., McGuinness, D.L.: Integrity constraints in OWL. InFox, M., Poole, D., eds.: AAAI, AAAI Press (2010)
7. Codd, E.F.: Relational completeness of data base sublanguages. In: DatabaseSystems, Prentice-Hall (1972) 65–98
8. Mannila, H., Raiha, K.J.: Algorithms for inferring functional dependencies fromrelations. Data Knowl. Eng. 12(1) (1994) 83–99
9. Huhtala, Y., Krkkinen, J., Porkka, P., Toivonen, H.: Tane: An efficient algorithmfor discovering functional and approximate dependencies. The Computer Journal42(2) (1999) 100–111
10. Lopes, S., Petit, J.M., Lakhal, L.: Efficient discovery of functional dependenciesand armstrong relations. In: EDBT ’00, London, UK, (2000) 350–364
11. Beeri, C., Dowd, M., Fagin, R., Statman, R.: On the structure of armstrongrelations for functional dependencies. J. ACM 31 (January 1984) 30–46
12. Levene, M., Poulovanssilis, A.: An object-oriented data model formalised throughhypergraphs. Data Knowl. Eng. 6(3) (May 1991) 205–224
13. Weddell, G.E.: Reasoning about functional dependencies generalized for semanticdata models. ACM Trans. Database Syst. (1992) 32–64
14. Lee, M.L., Ling, T.W., Low, W.L.: Designing functional dependencies for XML.In: EDBT ’02, London, UK, Springer-Verlag (2002) 124–141
15. Hartmann, S., Link, S., Kirchberg, M.: A subgraph-based approach towards func-tional dependencies for XML. In: SCI ’2003, 200–211
16. Brown, P.G., Hass, P.J.: Bhunt: automatic discovery of fuzzy algebraic constraintsin relational data. In: VLDB ’2003, VLDB Endowment (2003) 668–679
17. Haas, P.J., Hueske, F., Markl, V.: Detecting attribute dependencies from queryfeedback. In: VLDB ’07, VLDB Endowment (2007) 830–841
18. Paradies, M., Lemke, C., Plattner, H., Lehner, W., Sattler, K.U., Zeier, A.,Krueger, J.: How to juggle columns: an entropy-based approach for table com-pression. In: IDEAS ’10, New York, USA, ACM (2010) 205–215
19. McCallum, A., Nigam, K., Ungar, L.H.: Efficient clustering of high-dimensionaldata sets with application to reference matching. In: KDD ’00, 169–178
20. Tibshirani, R., Walther, G., Hastie, T.: Estimating the number of clusters in a dataset via the gap statistic. J. of the Royal Statistical Society 63(2) (2001) 411–423